Embed Size (px)
Citation preview
CD Equisearch Pvt Ltd Oct 19, 2016
Equities Derivatives Commodities Distribution of Mutual Funds Distribution of Life Insurance
Fiem Industries Ltd.
No. of shares (m) 13.2
Mkt cap (Rs crs/$m) 1938/290.5
Current price (Rs/$) 1473/22.1
Price target (Rs/$) 1457/21.8
52 W H/L (Rs.) 1484/582
Book Value (Rs/$) 307/4.6
Beta 1.1
Daily volume (avg. monthly) 37470
P/BV (FY16e/17e) 4.3/3.6
EV/EBITDA (FY16e/17e) 13.0/10.9
P/E (FY16e/17e) 24.8/20.2
EPS growth (FY15/16e/17e) 34.6/23.8/22.9
OPM (FY15/16e/17e) 12.9/13.0/13.1
ROE (FY15/16e/17e) 22.9/20.5/19.5
ROCE(FY15/16e/17e) 18.1/17.9/18.3
D/E ratio (FY15/16e/17e) 0.5/0.2/0.1
BSE Code 532768
NSE Code FIEMIND
Bloomberg FIEM IN
Reuters FIIN.BO
Shareholding pattern %
Promoters 63.6
MFs / Banks / FIs 9.0
Foreign 16.0
Govt. Holding 0.0
Total Public & others 11.4
Total 100.0
As on Sept 30, 2016
Recommendation
HOLD
Phone: + 91 (33) 4488 0055
E- mail: [email protected]
Figures (Rs crs)
FY14
FY15
FY16
FY17e
FY18e
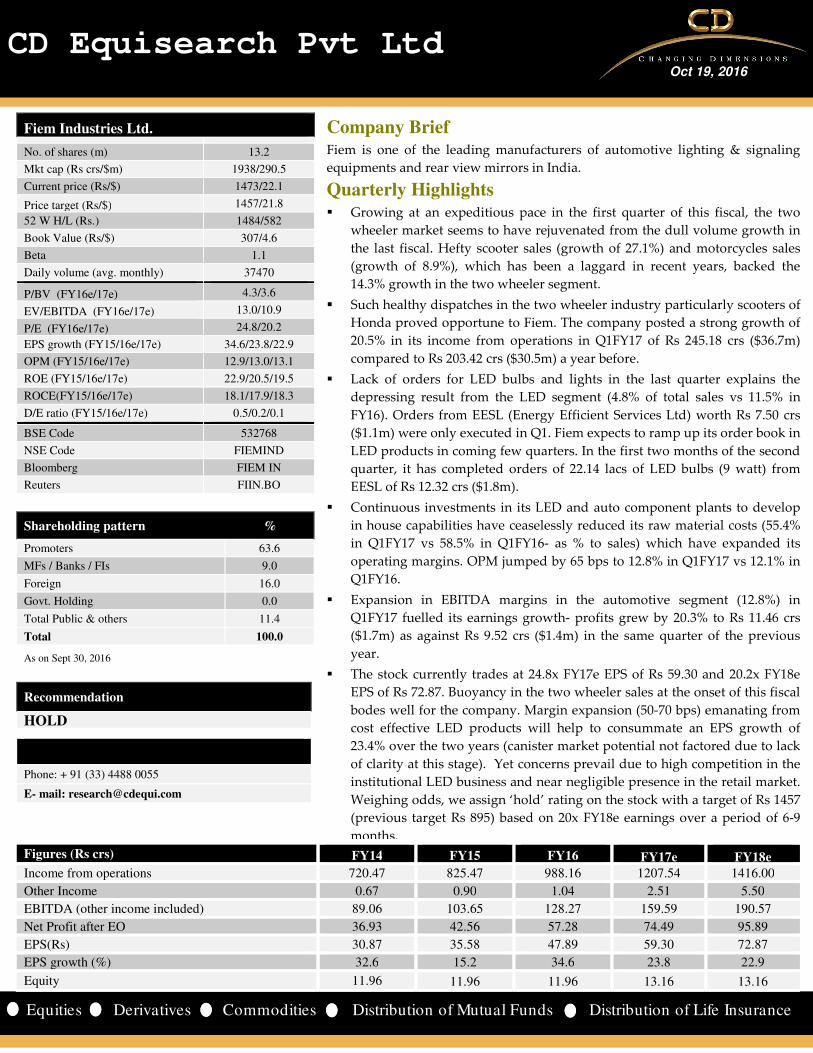
Income from operations 720.47 825.47 988.16 1207.54 1416.00
Other Income 0.67 0.90 1.04 2.51 5.50
EBITDA (other income included) 89.06 103.65 128.27 159.59 190.57
Net Profit after EO 36.93 42.56 57.28 74.49 95.89
EPS(Rs) 30.87 35.58 47.89 59.30 72.87
EPS growth (%) 32.6 15.2 34.6 23.8 22.9
Equity 11.96 11.96 11.96 13.16 13.16
Company Brief Fiem is one of the leading manufacturers of automotive lighting & signaling
equipments and rear view mirrors in India.
Quarterly Highlights
� Growing at an expeditious pace in the first quarter of this fiscal, the two
wheeler market seems to have rejuvenated from the dull volume growth in
the last fiscal. Hefty scooter sales (growth of 27.1%) and motorcycles sales
(growth of 8.9%), which has been a laggard in recent years, backed the
14.3% growth in the two wheeler segment.
� Such healthy dispatches in the two wheeler industry particularly scooters of
Honda proved opportune to Fiem. The company posted a strong growth of
20.5% in its income from operations in Q1FY17 of Rs 245.18 crs ($36.7m)
compared to Rs 203.42 crs ($30.5m) a year before.
� Lack of orders for LED bulbs and lights in the last quarter explains the
depressing result from the LED segment (4.8% of total sales vs 11.5% in
FY16). Orders from EESL (Energy Efficient Services Ltd) worth Rs 7.50 crs
($1.1m) were only executed in Q1. Fiem expects to ramp up its order book in
LED products in coming few quarters. In the first two months of the second
quarter, it has completed orders of 22.14 lacs of LED bulbs (9 watt) from
EESL of Rs 12.32 crs ($1.8m).
� Continuous investments in its LED and auto component plants to develop
in house capabilities have ceaselessly reduced its raw material costs (55.4%
in Q1FY17 vs 58.5% in Q1FY16- as % to sales) which have expanded its
operating margins. OPM jumped by 65 bps to 12.8% in Q1FY17 vs 12.1% in
Q1FY16.
� Expansion in EBITDA margins in the automotive segment (12.8%) in
Q1FY17 fuelled its earnings growth- profits grew by 20.3% to Rs 11.46 crs
($1.7m) as against Rs 9.52 crs ($1.4m) in the same quarter of the previous
year.
� The stock currently trades at 24.8x FY17e EPS of Rs 59.30 and 20.2x FY18e
EPS of Rs 72.87. Buoyancy in the two wheeler sales at the onset of this fiscal
bodes well for the company. Margin expansion (50-70 bps) emanating from
cost effective LED products will help to consummate an EPS growth of
23.4% over the two years (canister market potential not factored due to lack
of clarity at this stage). Yet concerns prevail due to high competition in the
institutional LED business and near negligible presence in the retail market.
Weighing odds, we assign ‘hold’ rating on the stock with a target of Rs 1457
(previous target Rs 895) based on 20x FY18e earnings over a period of 6-9
months.

2
2
CD Equisearch Pvt Ltd
Equities Derivatives Commodities Distribution of Mutual Funds Distribution of Life Insurance
[
Outlook & Recommendation
Industry Overview
Though India’s two wheeler industry saw a hitch in FY16 with a sales growth of just 3%, it is all set to record the fastest growth
in at least five years in FY17, boosted by adequate monsoon rains that invigorated the key rural market and higher consumer
spending in cities. The two-wheeler market have been off to a strong start with sales growth of 17.5% in the period April-
September 2016 over the same period a year ago. As expected, growth in the scooter segment continues to be the highest with
26.1%, shouldered by the ongoing strong demand for Honda’s Activa, whose volume jumped by 23.3% in the first five months of
this fiscal, undoubtedly making it the highest selling two-wheeler in India for the consecutive eighth month. The two wheeler
demand would draw support from the benefits of Seventh Pay Commission and also from the budgetary allocation towards
rural development which will help the two wheeler industry to grow more than 15% in FY17.
Source: HMSI, ACE Equity Source: SIAM, ACE Equity Source: TVS Motors, HMSI
The Indian auto component industry can be seen today as a significant player in the global automotive supply chain. The
industry has been observing robust growth, and its turnover is anticipated to reach US$ 115 billion by FY21 from US$ 39 billion
in FY16. The contribution to GDP is expected to rise to as much as 3.6% by 2020 from 2.1% in 2009 (Source: IBEF). With fortunes
of the Indian auto components industry directly linked to those of the OEM industry, prospects of the industry for FY17 looks
good, as accelerated vehicle demand would translate into increased revenues for the components industry.
Source: ACMA Source: ACMA Source: ELCOMA Vision 2020
India's exports of auto components increased at a CAGR of 18% in the period FY10-16, reaching to $10.8 billion in FY16. Europe
accounts for the largest share of Indian auto components exports (36%) followed by North America (25%) and Asia (25%). This
has been driven by the growth of global OEM sourcing from India and increased indigenization of OEMs which is turning the
country into a preferred designing and manufacturing base. Based on higher OEM demand, higher content per vehicle and rising
exports from India, the Indian auto component industry is expected to grow by 10-12% in FY17 (Source: ACMA).
Driven by the move from GSL lamps to CFLs and more recently to LEDs, the Indian lighting industry has seen a growth of 16.6%
CAGR in the period 2010-2015. The LED lighting industry stood at Rs 5092 crs ($763.1m) in 2015 vs Rs 3395 crs ($508.8m) in 2014
and is one of the most energy efficient and rapidly developing industry. Supported by ongoing Government initiatives to
promote LED lighting as well as changing consumer preferences, the LED market will grow to Rs 21,600 crs ($3237.1m) by 2020,
an exponential growth of 42.3% CAGR from 2013, making the LED market ~60% of the total lighting industry in 2020 from the
current 28% (Source: ELCOMA Vision document).

3
3
CD Equisearch Pvt Ltd
Equities Derivatives Commodities Distribution of Mutual Funds Distribution of Life Insurance
Financials & Valuation
Timely diversification of its product portfolio helped Fiem to ward off the sluggish growth in the two wheeler industry in
the last fiscal. Despite sloppy two wheeler market, which is the largest contributor to the company’s auto segment
revenues (94.5% of the total auto revenues), Fiem managed to notch a growth of 8.1% in its auto segment last fiscal- overall
growth of 19.7% buoyed by booming orders from EESL for LED lighting products. Healthy orders of LED bulbs and lights
from EESL (sales of ~Rs 120 crs) last fiscal helped the revenues to climb to Rs 988.16 crs ($148.1m) from Rs 825.47 crs
($123.7m) in FY15. Growing share of LED segment (11.5%) with sustainable margins of around 13-15% helped the overall
operating margins to expand by 41 bps to 12.9% in FY16 (12.5% in FY15).
Source: Fiem, CD Equisearch Source: Fiem Source: Fiem
The future growth potential of the LED segment is very bright on the back of government thrust on popularizing the
energy saving alternative of ambient lighting. As per UJALA dashboard, 16.95 crs LED bulbs have been distributed across
the country till date. Under the UJALA scheme, the government plans to distribute 9 watt LED bulbs in Delhi replacing the
7 watt LED bulbs which were distributed earlier. The scheme has been implemented in 87 circles in Delhi and under this
scheme, over 66 lakh LED bulbs have already been distributed nationally resulting in an annual energy saving of 86 crore
kWh. For Fiem, orders of ~Rs 42 crs have already been received for LED bulbs (9 watt) and partly executed in this fiscal
and we expect the remaining orders to be executed in the coming few quarters. By FY18, we expect LED segment to
contribute nearly 18% to its total business and help the total income from operations to grow at a CAGR of 19.7% to Rs
1207.54 crs ($181.0m) and Rs 1416.00 crs ($212.2m) in FY17 and FY18 respectively.
Source: Fiem, CD Equisearch Source: ESSL Source: Fiem, CD Equisearch
Continuous focus to gain the benefits of the growing two wheeler market has empowered Fiem to commence new
automotive manufacturing unit at Ahmedabad which will exclusively cater to HMSI who has set up a new plant there. It
has invested Rs 59 crs in the plant till Q1FY17 which will support its automotive division by increasing its supply to new
models of HMSI- its largest client with 44.5% share of revenue. To further augment the capacities in the LED segment, it
focuses on the expansion of the Tapukara plant where investments to the tune of 66 crs have been made till Q1FY17. It is
expanding its capacity to 2 lakhs bulbs per day from the existing capacity of 60000 bulbs and to more than 1000 street lights
per day.

4
4
CD Equisearch Pvt Ltd
Equities Derivatives Commodities Distribution of Mutual Funds Distribution of Life Insurance
Source: Fiem, CD Equisearch Source: Fiem, CD Equisearch Source: Fiem, CD Equisearch
The company attempts to beef up its presence in the retail market for the LED lighting products. It has in-house R&D and
manufacturing facilities for LED products and the proposal of a joint venture with Sukam Power Systems Ltd will help in
speedy rollout of its retail plan. To upscale its automotive segment, it has signed an MOU with Kyowa Co Ltd, Japan for
development of tooling and moulds which will cater to the Indian market. Fiem procured funds of Rs 120 crs through QIP in
Sept, 2016 which will be used to recapitalize its international JVs and expand its retail LED business. The interminable zeal to
avail the benefits of the positive momentum of the automotive industry pushed Fiem to further diversify its product line. It
has recently entered into agreement with Aisan Industry and Toyota Tsusho Corp. for manufacturing of canisters. Fiem hopes
to tap available market potential with this emission control product due to implementation of stricter emission norms (BS-IV)
for two & three wheelers from 1st April, 2017. It eyes a big opportunity on this product line, supplying it to all existing OEMs
customers and target new customers.
On the back of higher utilization of existing plant facility and its increasing capacities, higher EBITDA margins from LED
products, Fiem managed to keep up the pace of its earnings. In FY16, the profit after tax grew by robust 34.6% to Rs 57.28 crs
($8.6m) as against Rs 42.56 crs ($6.4m) reported in the previous year. Sturdy performance from both the automotive and the
LED segment in the last fiscal ensured a jump in the ROE to 22.9% (20.1% in FY15) and ROCE to 18.1% (15.4% in FY15).
Government’s incessant initiative to bring down the power demand though DELP programme and focus more on cost saving
LED products will support Fiem’s business in an immense way. Going ahead, we expect business to pick up in the next year
with more thrust on institutional orders, higher utilization from the facilities and introduction of new products in
collaboration with Japanese companies. Profits are expected to grow at a CAGR of 29.4% over the next two years- Rs 74.49 crs
($11.2m) in FY17 and Rs 95.89 crs ($14.4m) in FY18.
Source: Fiem, CD Equisearch Source: Fiem, CD Equisearch Source: Fiem, CD Equisearch
The stock currently trades at 24.8x FY17e EPS of Rs 59.30 and 20.2x FY18e EPS of Rs 72.87. Buoyancy in the two wheeler sales
at the onset of this fiscal bodes well for the company. Margin expansion (50-70 bps) emanating from cost effective LED
products will help to consummate an EPS growth of 23.4% over the two years (canister market potential not factored due to
lack of clarity at this stage). Yet concerns prevail due to high competition in the institutional LED business and near negligible
presence in the retail market. Weighing odds, we assign ‘hold’ rating on the stock with a target of Rs 1457 (previous target Rs
895) based on 20x FY18e earnings over a period of 6-9 months. For more info refer to our March report.

5
5
CD Equisearch Pvt Ltd
Equities Derivatives Commodities Distribution of Mutual Funds Distribution of Life Insurance
Risks & Concerns
Client concentration risk
Fiem derives a significant portion of its revenues from its two top clients namely HMSI and TVS Motors (almost 70%). Though
the company has a long standing relationship with its automotive segment customers, any adverse change in the demand or
their financial condition may be inimical for its business.
LED business-revenue visibility
In the LED luminaries segment, the company is heavily reliant on institutional orders of ESSL. There is no assurance that it can
successfully win major tenders.
Dependence on two wheeler market
Since 94.5% of the automotive segment revenues are derived from the two wheeler segment, any decrease in demand would
have a corresponding impact on the demand for the automotive segment products and may materially and adversely affect
business operations and growth.
Cross Sectional Analysis
Company Equity* CMP Mcap* Sales* Profit* OPM
(%)
NPM
(%)
Int
cov.
ROE
(%)
Mcap/
sales P/BV P/E
FIEM Ind 13.2 1473 1938 1029 59 13.0 5.7 5.5 22.7 1.9 4.8 29.8
Lumax Ind 9.3 841 786 1241 36 6.9 2.9 3.8 17.6 0.6 3.7 22.0
*figures in Rs. Crores; calculations on ttm basis
Source: Company, CD Equisearch Source: Company, CD Equisearch Source: Company, CD Equisearch
Source: Company, CD Equisearch Source: Company, CD Equisearch Source: Company, CD Equisearch
Note: All Dollar value figures expressed in the write up are translated at current exchange rate.

6
6
CD Equisearch Pvt Ltd
Equities Derivatives Commodities Distribution of Mutual Funds Distribution of Life Insurance
Financials
Standalone Quarterly Results Figures in Rs. crs.
Q1FY17 Q1FY16 % chg FY16 FY15 % chg
Income From Operations 245.18 203.42 20.5 986.98 824.77 19.7
Other Income 0.14 0.35 -59.3 0.97 0.90 7.6
Total Income 245.32 203.77 20.4 987.95 825.67 19.7
Total Expenditure 213.91 178.80 19.6 859.99 722.34 19.1
EBITDA (other income included) 31.41 24.97 25.8 127.96 103.33 23.8
Interest 5.47 3.11 75.8 15.77 12.04 31.0
Depreciation 9.39 7.82 20.0 33.03 30.63 7.8
PBT 16.55 14.03 18.0 79.16 60.66 30.5
Tax 5.09 4.51 13.0 21.97 18.40 19.4
PAT 11.46 9.52 20.3 57.18 42.26 35.3
Extraordinary Item - - - 0.05 -0.09 -155.9
Net Profit 11.46 9.52 20.3 57.14 42.35 34.9
EPS(Rs) 9.58 7.96 20.3 47.76 35.40 34.9
Equity 11.96 11.96 - 11.96 11.96 -
Consolidated Income Statement Figures in Rs. crs.
FY14 FY15 FY16 FY17e FY18e
Income From Operations 720.47 825.47 988.16 1207.54 1416.00
Growth (%) 18.8 14.6 19.7 22.2 17.3
Other Income 0.67 0.90 1.04 2.51 5.50
Total Income 721.13 826.37 989.20 1210.05 1421.50
Total Expenditure 632.08 722.72 860.93 1050.46 1230.93
EBITDA (other income included) 89.06 103.65 128.27 159.59 190.57
Interest 14.45 12.05 15.78 13.13 8.45
Depreciation 21.79 30.72 33.12 40.05 45.14
PBT 52.82 60.88 79.37 106.41 136.99
Tax 15.54 18.40 22.04 31.92 41.10
PAT 37.28 42.48 57.33 74.49 95.89
Extraordinary Item 0.35 -0.09 0.05 - -
Net Profit 36.93 42.56 57.28 74.49 95.89
EPS (Rs) 30.87 35.58 47.89 59.30* 72.87
Equity 11.96 11.96 11.96 13.16 13.16
*on weighted average equity

7
7
CD Equisearch Pvt Ltd
Equities Derivatives Commodities Distribution of Mutual Funds Distribution of Life Insurance
Consolidated Balance Sheet Figures in Rs. crs.
FY14 FY15 FY16 FY17e FY18e
Sources of Funds
Share Capital 11.96 11.96 11.96 13.16 13.16
Reserves 184.89 215.32 261.18 440.21 518.68
Total Shareholders’ Funds 196.85 227.28 273.14 453.37 531.84
Long Term Debt 57.96 51.47 90.85 50.00 40.00
Total Liabilities 254.81 278.75 363.99 503.37 571.84
Application of Funds
Gross Block 425.12 480.00 593.79 675.38 750.38
Less: Accumulated Depreciation 112.08 145.54 177.85 217.90 263.04
Net Block 313.04 334.46 415.94 457.48 487.34
Capital Work in Progress 0.03 4.63 11.59 5.00 5.00
Investments 0.02 0.02 0.03 0.03 0.03
Current Assets, Loans & Advances
Inventory 42.36 51.39 66.13 79.36 90.47
Trade Receivables 76.76 86.76 118.60 142.32 163.67
Cash and Bank 2.02 3.44 4.52 56.05 80.73
Short term loans 14.53 12.38 20.89 26.67 33.33
Other Assets 0.76 0.45 0.96 1.16 1.35
Total CA & LA 136.42 154.41 211.10 305.56 369.55
Current Liabilities 161.77 180.72 248.10 237.65 259.34
Provisions 9.85 12.23 8.31 9.28 11.96
Total Current Liabilities 171.62 192.95 256.41 246.93 271.30
Net Current Assets -35.20 -38.54 -45.30 58.63 98.26
Net Deferred Tax -27.51 -27.61 -29.65 -32.85 -36.96
Net long term assets 4.43 5.80 11.39 15.08 18.16
Total Assets 254.81 278.75 363.99 503.37 571.84

8
8
CD Equisearch Pvt Ltd
Equities Derivatives Commodities Distribution of Mutual Funds Distribution of Life Insurance
Cash Flow Statement Figures in Rs. crs.
FY14 FY15 FY16 FY17e FY18e
Net Income (a) 37.28 42.48 57.33 74.49 95.89
Adjustments for Non cash charges 24.91 32.35 36.20 43.73 50.28
Depreciation 21.79 30.72 33.12 40.05 45.14
Loss/(Profit) on sale of assets -0.49 0.12 -0.07 - -
Provision for bad debts 0.09 0.04 0.20 0.40 0.55
variation in excise 0.09 0.24 0.66 -0.16 0.18
bad debt written off 0.13 0.17 0.20 0.25 0.30
deferred tax asset 3.30 0.10 2.04 3.19 4.11
Others - 0.97 0.04 - - (Inc.)/Dec. in WC & others (c) 0.36 -4.85 13.75 -27.85 -20.65
Inventories 6.32 -9.03 -14.74 -13.23 -11.11
Trade receivables -7.64 -10.20 -32.25 -24.37 -22.20
Other assets -0.21 0.27 -9.07 -3.57 -2.28
Loans and advances 0.07 0.81 -10.42 -7.52 -9.23
Trade payables 2.77 10.38 62.55 15.08 16.59
Other liabilities & provisions -0.94 2.92 17.68 5.76 7.58 Operating Cash Flow (a+b+c) 62.54 69.98 107.28 90.37 125.52
Proceed from sale of assets 6.88 0.56 0.56 - -
Purchase of fixed assets -48.27 -58.77 -112.38 -75.00 -75.00
Net Investments - - -0.01 - -
Investing Cash flow (d) -41.39 -58.21 -111.83 -75.00 -75.00
Issue of shares - - - 120.00 -
Net Borrowings -15.14 -1.95 22.91 -70.03 -10.00
Dividend paid (incl. CDT) -5.60 -8.40 -17.28 -13.82 -15.84
Financing Cash flow (e) -20.73 -10.34 5.63 36.15 -25.84
Net change (a+b+c+d+e) 0.42 1.42 1.08 51.52 24.68
9
9
CD Equisearch Pvt Ltd
Equities Derivatives Commodities Distribution of Mutual Funds Distribution of Life Insurance
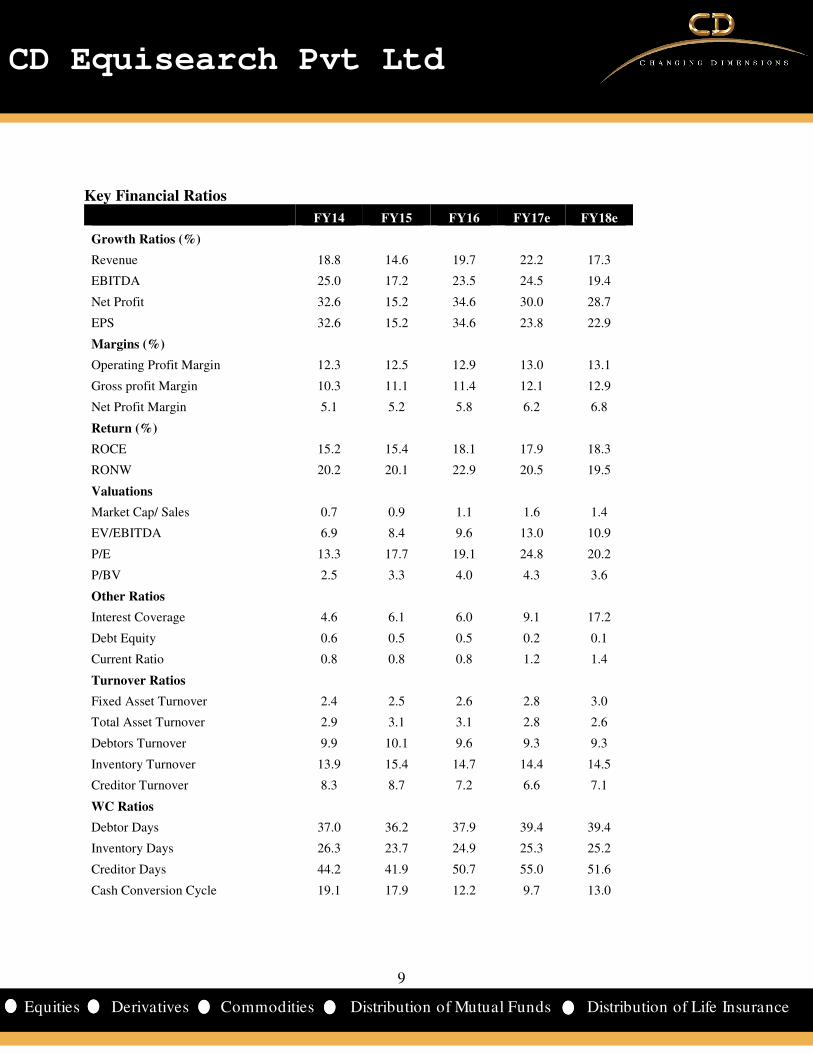
Key Financial Ratios
FY14 FY15 FY16 FY17e FY18e
Growth Ratios (%)
Revenue 18.8 14.6 19.7 22.2 17.3
EBITDA 25.0 17.2 23.5 24.5 19.4
Net Profit 32.6 15.2 34.6 30.0 28.7
EPS 32.6 15.2 34.6 23.8 22.9
Margins (%)
Operating Profit Margin 12.3 12.5 12.9 13.0 13.1
Gross profit Margin 10.3 11.1 11.4 12.1 12.9
Net Profit Margin 5.1 5.2 5.8 6.2 6.8
Return (%)
ROCE 15.2 15.4 18.1 17.9 18.3
RONW 20.2 20.1 22.9 20.5 19.5
Valuations
Market Cap/ Sales 0.7 0.9 1.1 1.6 1.4
EV/EBITDA 6.9 8.4 9.6 13.0 10.9
P/E 13.3 17.7 19.1 24.8 20.2
P/BV 2.5 3.3 4.0 4.3 3.6
Other Ratios
Interest Coverage 4.6 6.1 6.0 9.1 17.2
Debt Equity 0.6 0.5 0.5 0.2 0.1
Current Ratio 0.8 0.8 0.8 1.2 1.4
Turnover Ratios
Fixed Asset Turnover 2.4 2.5 2.6 2.8 3.0
Total Asset Turnover 2.9 3.1 3.1 2.8 2.6
Debtors Turnover 9.9 10.1 9.6 9.3 9.3
Inventory Turnover 13.9 15.4 14.7 14.4 14.5
Creditor Turnover 8.3 8.7 7.2 6.6 7.1
WC Ratios
Debtor Days 37.0 36.2 37.9 39.4 39.4
Inventory Days 26.3 23.7 24.9 25.3 25.2
Creditor Days 44.2 41.9 50.7 55.0 51.6
Cash Conversion Cycle 19.1 17.9 12.2 9.7 13.0

10
10
CD Equisearch Pvt Ltd
Equities Derivatives Commodities Distribution of Mutual Funds Distribution of Life Insurance
Cumulative Financial Data
Rs crs FY10-12 FY13-15 FY16-18e
Income from operations 1258 2152 3612
Operating Profit 154 262 469
EBIT 116 192 360
PBT 83 153 323
PAT 58 107 228
Dividends 11 24 43
OPM (%) 12.2 12.2 13.0
NPM (%) 4.6 5.0 6.3
Interest Coverage 3.5 4.9 9.6
ROE (%) 19.3 20.0
ROCE (%) 13.8 18.1
Debt-equity ratio 1.1 0.5 0.1
Fixed asset turnover 2.3 2.9
Debtors turnover 9.3 9.6
Inventory turnover 12.9 14.8
Creditors turnover 8.2 7.7
Debtor days 39.1 38.0
Inventory days 28.2 24.7
Creditors days 44.3 47.2
Cash conversion cycle 23.0 15.5
Dividend payout ratio (%) 26.0 22.4 19.0
FY10-12 implies three year period ending FY12. *as on terminal year
Banking on the large two wheeler market in India, Fiem has been able to grow its revenues at a CAGR of 22.3% in the
period FY10-16, demonstrating strong resilience. Marked slowdown in the two wheeler sales in FY13 (2.9%) triggered
the lowest sales growth of 13.3% in this period. Operating margins also slid by 106 bps to 11.6% in FY13 from 12.7% in
FY12. Thereon, it has been able to outpace the industry growth with ample margin. The adjusted profits grew at a
CAGR of 28.4% in the last six years, showing consistency in overall performance.
With government’s various initiatives backing LED adoption, the LED segment of the company is expected to boost its
total income from operations to Rs 3612 crs ($541.3m) in the period FY16-18e, nearly threefold increase from the period
FY10-12. Higher margins from the LED products (15.7% in Q1FY17) due to its in house R&D and manufacturing facility
and pickup of two wheeler demand will expand the operating margins to 13.0% in the period FY16-18e from the stable
margins of 12.2% prevalent in the previous three year periods. ROE is expected to increase to 20% while ROCE is
expected to move up to 18.1% in FY16-18e.

11
11
CD Equisearch Pvt Ltd
Equities Derivatives Commodities Distribution of Mutual Funds Distribution of Life Insurance
Financial Summary- US Dollar denominated
million $ FY14 FY15 FY16 FY17e FY18e
Equity capital 2.0 1.9 1.8 2.0 2.0
Shareholders’ funds 32.8 36.3 41.2 67.9 79.7
Total debt 19.8 18.7 21.1 10.5 9.0
Net fixed assets (including CWIP) 52.1 54.2 64.5 69.3 73.8
Investments 0.0 0.0 0.0 0.0 0.0
Net current assets -5.9 -6.2 -6.8 8.8 14.7
Total assets 42.4 44.5 54.9 75.4 85.7
Revenues 119.1 135.0 151.0 181.0 212.2
EBITDA 14.6 17.0 19.6 23.9 28.6
EBDT 12.3 15.0 17.2 21.9 27.3
PBT 8.6 10.0 12.1 15.9 20.5
PAT 6.1 7.0 8.8 11.2 14.4
EPS($) 0.51 0.58 0.73 0.89 1.09
Book value ($) 2.74 3.04 3.44 5.16 6.06
Operating Cash Flow 10.4 11.2 16.2 13.5 18.8
Investing Cash Flow -6.9 -9.3 -16.9 -11.2 -11.2
Financing Cash Flow -3.5 -1.7 0.8 5.4 -3.9 Income statement figures translated at average rates; balance sheet and cash flow at year end rates; projections at current rates All dollar denominated figures are adjusted for extraordinary items.

12
12
CD Equisearch Pvt Ltd
Equities Derivatives Commodities Distribution of Mutual Funds Distribution of Life Insurance
Disclosure& Disclaimer CD Equisearch Private Limited (hereinafter referred to as ‘CD Equi’) is a Member registered with National Stock Exchange of India Limited,
Bombay Stock Exchange Limited and Metropolitan Stock Exchange of India Limited (Formerly known as MCX Stock Exchange Limited). CD
Equi is also registered as Depository Participant with CDSL and AMFI registered Mutual Fund Advisor. The associates of CD Equi are
engaged in activities relating to NBFC-ND - Financing and Investment, Commodity Broking, Real Estate, etc.
CD Equi has applied for registration under SEBI (Research Analysts) Regulations, 2014. Further, CD Equi hereby declares that –
• No disciplinary action has been taken against CD Equi by any of the regulatory authorities.
• CD Equi/its associates/research analysts do not have any financial interest/beneficial interest of more than one percent/material
conflict of interest in the subject company(s).
• CD Equi/its associates/research analysts have not received any compensation from the subject company(s) during the past twelve
months.
• CD Equi/its research analysts has not served as an officer, director or employee of company covered by analysts and has not been
engaged in market making activity of the company covered by analysts.
This document is solely for the personal information of the recipient and must not be singularly used as the basis of any investment decision.
Nothing in this document should be construed as investment or financial advice. Each recipient of this document should make such
investigations as they deem necessary to arrive at an independent evaluation of an investment in the securities of the companies referred to in
this document (including the merits and risks involved) and should consult their own advisors to determine the merits and risks of such an
investment.
Reports based on technical and derivative analysis center on studying charts of a stock's price movement, outstanding positions and trading
volume, as opposed to focusing on a company's fundamentals and as such, may not match with a report on a company's fundamentals.
The information in this document has been printed on the basis of publicly available information, internal data and other reliable sources
believed to be true but we do not represent that it is accurate or complete and it should not be relied on as such, as this document is for general
guidance only. CD Equi or any of its affiliates/group companies shall not be in any way responsible for any loss or damage that may arise to
any person from any inadvertent error in the information contained in this report. CD Equi has not independently verified all the information
contained within this document. Accordingly, we cannot testify nor make any representation or warranty, express or implied, to the accuracy,
contents or data contained within this document.
While, CD Equi endeavors to update on a reasonable basis the information discussed in this material, there may be regulatory compliance or
other reasons that prevent us from doing so.
This document is being supplied to you solely for your information and its contents, information or data may not be reproduced, redistributed
or passed on, directly or indirectly. Neither, CD Equi nor its directors, employees or affiliates shall be liable for any loss or damage that may
arise from or in connection with the use of this information.
CD Equisearch Private Limited (CIN: U67120WB1995PTC071521)
Registered Office: 37, Shakespeare Sarani, 1st Floor, Kolkata – 700 017; Phone: +91(33) 4488 0000; Fax: +91(33) 2289 2557; Corporate Office: 10,
Vasawani Mansion, 2nd Floor, Dinshaw Wachha Road, Churchgate, Mumbai – 400 020; Phone: +91(22) 2283 0652/0653; Fax: +91(22) 2283, 2276
Website: www.cdequi.com; Email: [email protected]
buy: >20% accumulate: >10% to ≤20% hold: ≥-10% to ≤10% reduce: ≥-20% to <-10% sell: <-20%