Embed Size (px)
Citation preview
CD Equisearch Pvt Ltd Feb 14, 2018
Equities Derivatives Commodities Distribution of Mutual Funds Distribution of Life Insurance
.
Atul Ltd
No. of shares (m) 29.66
Mkt cap (Rs crs/$m) 8145/1267.1
Current price (Rs/$) 2746/42.7
Price target (Rs/$)
3234/50.3
52 W H/L (Rs.) 3084/1958
Book Value (Rs/$) 689/10.7 Beta 0.6
Daily volume NSE (avg. monthly) 23180
P/BV (FY18e/19e) 3.7/3.3
EV/EBITDA (FY18e/19e) 14.3/12.1
P/E (FY18e/19e) 28.4/23.8
EPS growth (FY17/18e/19e) 16.3/-10.6/19.6
OPM (FY17/18e/19e) 18.0/16.3/17.1
ROE (FY17/18e/19e) 18.4/14.0/14.6
ROCE(FY17/18e/19e) 16.8/13.2/14.0
D/E ratio (FY17/18e/19e) 0.1/0.0/0.0
BSE Code 500027
NSE Code ATUL
Bloomberg ATLP IN
Reuters ATLP.BO
Shareholding pattern %
Promoters 44.6
MFs / Banks / FIs 22.7
FPIs 4.7
Govt. Holding 0.6
Public & Others 27.4
Total 100.0
As on Dec 31, 2017
Recommendation
ACCUMULATE
Analyst
KISHAN GUPTA, CFA, FRM
Phone: + 91 (33) 4488 0043
E- mail: [email protected]
(Figures in Rs crs)
FY16
FY17 FY18e
FY19e
Income from operations 2594.59 2833.94 3231.65 3630.01
Other Income 34.40 52.55 12.20 16.13
EBITDA (other income included) 493.63 562.00 540.33 637.86
Adjusted PAT 275.51 320.37 286.44 342.60
EPS(Rs) 92.89 108.02 96.57 115.50
EPS growth (%) 21.9 16.3 -10.6 19.6
Company Brief
Atul Ltd manufactures value added chemicals by blending basic chemicals and
natural resources for diverse industries -agriculture, construction, textiles,
pharmaceuticals and automobiles - from its plants in Valsad, Bharuch
(Gujarat) and Thane (Maharashtra).
Quarterly Highlights
� Business recover could be rarely so perceptible if Atul's last two quarters
result card is anything to go by - its operating profit rebounded to Rs
124.86 crs ($19.4m) in Q2from a woeful Rs 76.18 crs ($11.8m) in Q1. Post tax
earnings in Q1 as a result nosedived to the lowest level in at least four
years, thus challenging its business model sustainability. Both life science
chemicals (LSC) and performance and other chemicals (POC) businesses
suffer with EBIT down 27.6% and 51.3% (y-o-y) respectively.
� Catapulted by its bulk intermediates and somewhat colors business its
POC made rapid strides in last two quarters as its EBIT jumped to Rs 80.37
crs ($12.4m) in Q3from just Rs 36.62 crs ($5.7m) in Q1; EBIT margins thus
surged to 13.6% in Q3 from 13% a year ago and 7.6% in Q1. Recovery in
LSC business has also been no less remarkable for its EBIT jumped to Rs
29.30 crs($4.5m) in Q3 (though lower than Rs 32.99 crs($5.1m) in Q2) from
Rs 21.14 crs ($3.3m) in Q1; LSC revenue recovery though has been modest.
� Not unnoticingly, Atul's has relentlessly fallen in last few quarters while
depreciation cost has all but flat lined. Wherefore PBT has held up well
despite not a precipitous recovery in throughput -a sore point given decent
demand growth in Indian speciality chemicals industry. Still operating
profit for 9MFY18 remain depressed (down 11.7% yoy) with OPMs down
over 400 bps.
� The stock currently trades at 28.4xFY18e EPS of Rs 96.57 and 23.8x FY19e
EPS of Rs 115.50. Growth in Atul's illustrious crop protection business
(volume growth: 22% last fiscal) would come from deepening market
penetration in Africa and South America and increasing its brand sales.
Ostensibly, turnaround in its colors business would also spur earnings next
fiscal (estimated to grow by 19.6%). MCA project with Akzo Nobel would
gradually start to unfold next fiscal. On balance we retain our accumulate
rating on the stock with target of Rs 3234 (previous target: Rs 3033) based
on 28x FY19e earnings (forward peg: 1.4; currently at ~28x FY18e earnings)
over a period of 6-9 months.
2
2
CD Equisearch Pvt Ltd
Equities Derivatives Commodities Distribution of Mutual Funds Distribution of Life Insurance
[
Outlook & Recommendation
Global Specialty Chemicals Update
According to a report by IHS Markit, volume consumption of specialty chemicals globally is estimated to annually grow by 3-
3.5% during 2016-2021, driven by strong growth in emerging markets, most strikingly in China, where growth is projected at
6-7% per year - though lower than historical 8-9%. Volumes in developed economies, comprising of countries in North
America, West Europe and Japan, would grow by a modest 2% annually in the forecast period.
Robust volumes in developing economies stems from the fact, as IHS Markit portends, that manufacturing activities, most
pertinently in automobile and electronic production - in developed economies continue to shift to nations with lower labor
costs and abundant raw material supplies. Besides, per capita consumption of specialty chemicals in developing regions is
much less when compared to that in developed economies. Most notably, IHS notes, the center of gravity of global chemical
industry is shifting towards Middle East, where cheap petrochemical feedstocks are available, and Asia where low labor costs
and high economic growth are attractions.
To tap unbridled opportunities available in developing regions, many North American, European and Japanese specialty
chemical producers have either established manufacturing outfits here or have increased outsourcing from India and China.
China has also seen a transformation of sorts for it has gradually shifted its focus from an exporter of low cost wares to large
domestic supplier of higher value downstream products.
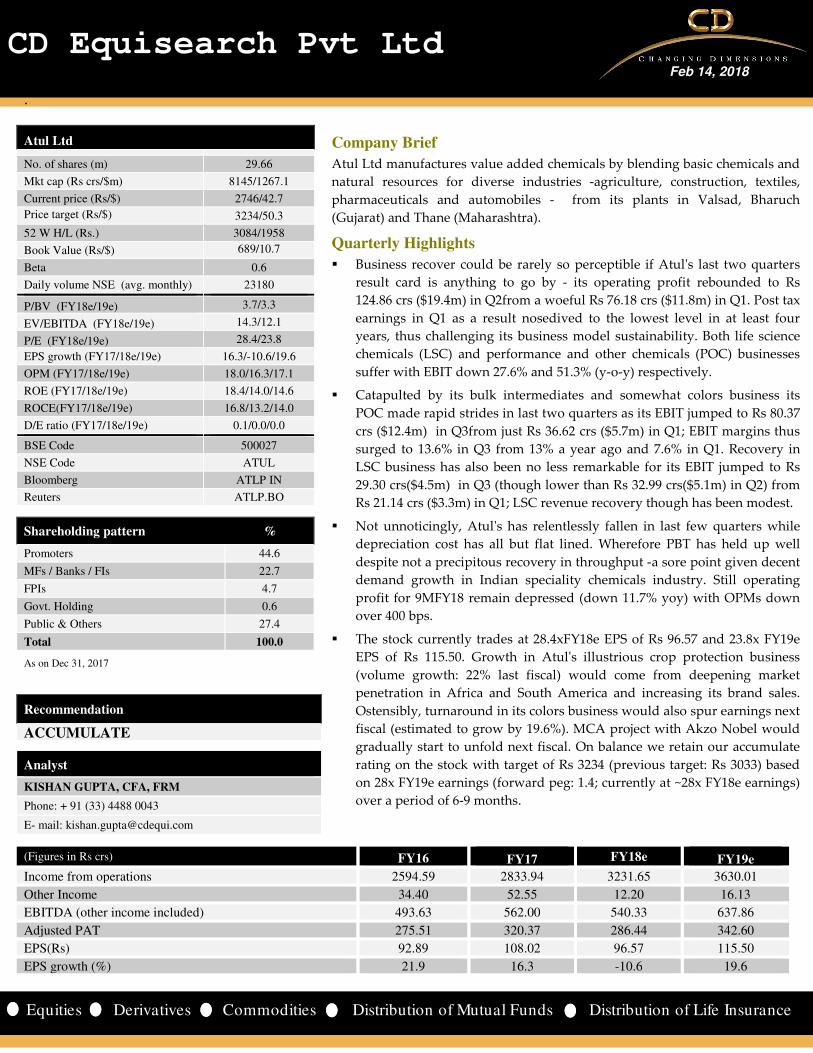
Penetration ratio of Indian specialty chemicals Per capita consumption of dyes
Source: IHS
Research and Markets, a research firm, notes that increased R&D activities and higher demand from Asia-Pacific region are
some of the factors fueling market growth for specialty chemicals. It posits that construction chemicals is estimated to post
highest growth during 2016-2022 not least due to growing construction sector in emerging economies of India, Brazil, China
and South Korea. Yet risks concerning environmental impact of chemical manufacture, usage and wastage could impact
market growth. Increasing government regulations in food processing and manufacturing industry restricting usage of
specialty chemicals could also hinder growth.
Higher disposable income in developing world coupled with resurrection in consumer spending in North America, West
Europe and Japan, as IHS Markit portends, would spur demand for certain segment of specialty chemicals most notably,
nutraceuticals, cosmetic chemicals, and flavors and fragrances, precipitating volume growth assessments of more than 3%
during 2016-2021.

3
3
CD Equisearch Pvt Ltd
Equities Derivatives Commodities Distribution of Mutual Funds Distribution of Life Insurance
Financials & Valuation
Grand View Research, Inc portends that the global cresol market would grow over 3% during 2016-24 driven by increasing
adoption of cresol derivatives as a precursor in production of anti-oxidants in personal care and chemical intermediates. As
per the report, p-cresol would maintain its dominance with nearly 40% revenue share; 39.1% in 2014.Largest market growth
for cresol would emanate from Asia Pacific which is estimated to grow by 4% in the forecast period. Buttressed by robust
overseas shipments, volume growth of Atul's aromatics business rose to the highest level in four years at 21%, propitiously
supporting overall volume growth of 16%.
If demand assessment of Research and Markets is anything to go by, then the global resorcinol market also provides an
opportunity worth latching on as it expects 8.8% growth during the decade ending 2025, prodded by its growing adoption
in wood-bonding adhesives, rising application in automobile industry and higher emerging countries demand in general.
Other industry reports also present a case of increasing use of resorcinol and its derivatives in UV absorbing functions -
which have boosted their application in coatings and paints. Further, demand would stem from increasing use of resorcinol
in manufacturing pharmaceutical products, flame retardants, fungicidal creams & lotions, and agriculture chemicals.
Much of the growth in its existing chemistries - be it for aromatics or bulk chemicals or colors or crop protection would
either exude from new products or addition of new capacities. Yet Atul has not cuddled aggressive asset lapping over the
last few years, freeing up cash flows for debt repayment. After struggling for much of FY16 and last fiscal (volume growth
just 7% in FY17; -18% in FY16 ), its colors business has turned a corner this fiscal. Though overall volumes remain subdued
as yet, demand remain vigorous in bulk chemicals and crop protection.. Galvanized by recent rise in crude oil prices, post
tax earnings would grow by ~20% next fiscal attended by puny increases in return on capital.
The stock currently trades at 28.4xFY18e EPS of Rs 96.57 and 23.8x FY19e EPS of Rs 115.50. Risks abound - be it higher
overseas competition in polymers (epoxy resins and hardeners); dearth of key raw materials; weather related uncertainty;
Chinese competition. Modest expansion plans has put off aggressive launch of new chemistries/products. Yet its competitive
advantage stems from mammoth overseas presence and covetous market share in some of its key products. Tie up with
Akzo Nobel for MCA production in India would help it tap vast domestic market potential, besides meeting its captive
demand. Higher product realizations coupled with impregnable benefits of operating leverage would buoy earnings next
fiscal. On balance, we retain our accumulate rating on the stock with target of Rs 3234 (previous target: Rs 3033) based on
28x FY19e earnings (forward peg: 1.4; currently at ~28x FY18 e earnings) over a period of 6-9 months. For more info refer to
our May report.
4
4
CD Equisearch Pvt Ltd
Equities Derivatives Commodities Distribution of Mutual Funds Distribution of Life Insurance
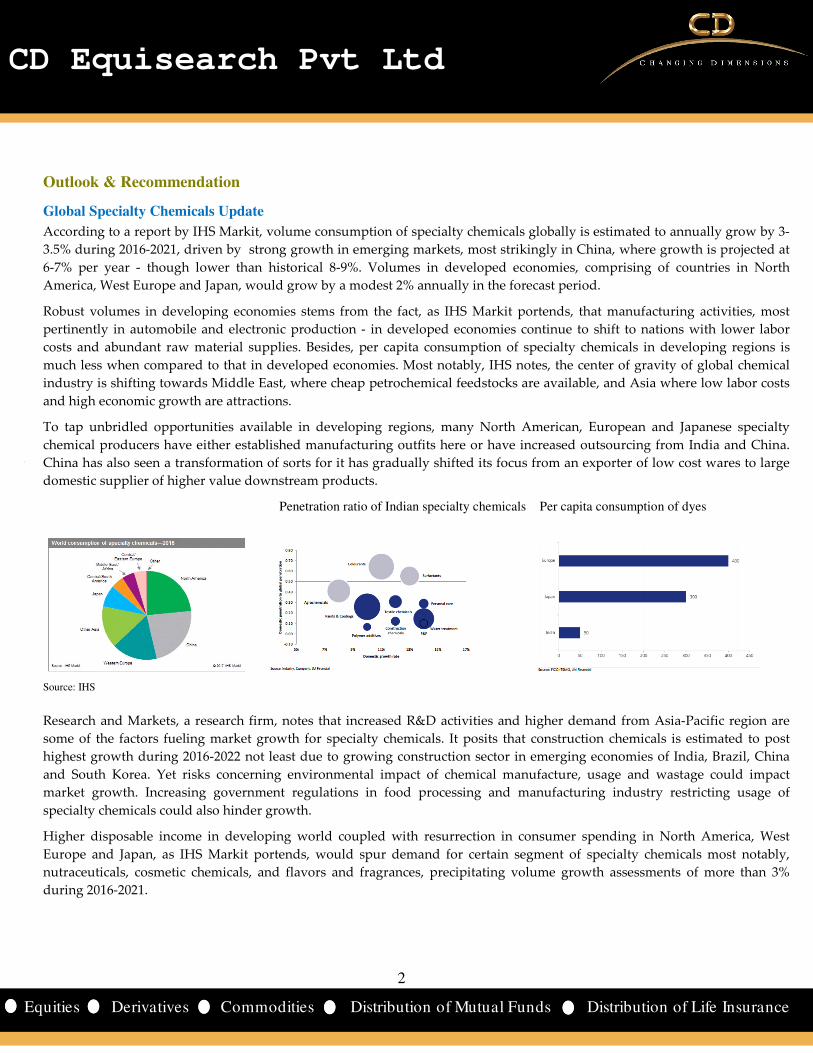
Risks
Despite its presence in several businesses, Atul still suffers from high vulnerability in earnings. Most notably, realizations in
its polymers and aromatics get impacted by volatility in raw material prices, mainly from derivatives of crude oil. For colors
business, volatility in prices of intermediates and lower demand for niche Vat dyes pose serious threats. Its crop protection
business not only gets plagued by vagaries of monsoon but also increased competition (read: entry of international generic
companies). One of the most resilient businesses, pharmaceuticals and intermediates, is also not left untouched from
external risks: ever-rising regulatory requirements in developed countries.
5
5
CD Equisearch Pvt Ltd
Equities Derivatives Commodities Distribution of Mutual Funds Distribution of Life Insurance
Cross Sectional Analysis
Company
Equity (Rs crs)
CMP (Rs crs)
Mcap (Rs crs)
Inc. from ops.
(Rs crs)
Profit (Rs crs)
OPM (%)
NPM (%)
Int. coverage
ROE (%)
Mcap / IO P/BV P/E
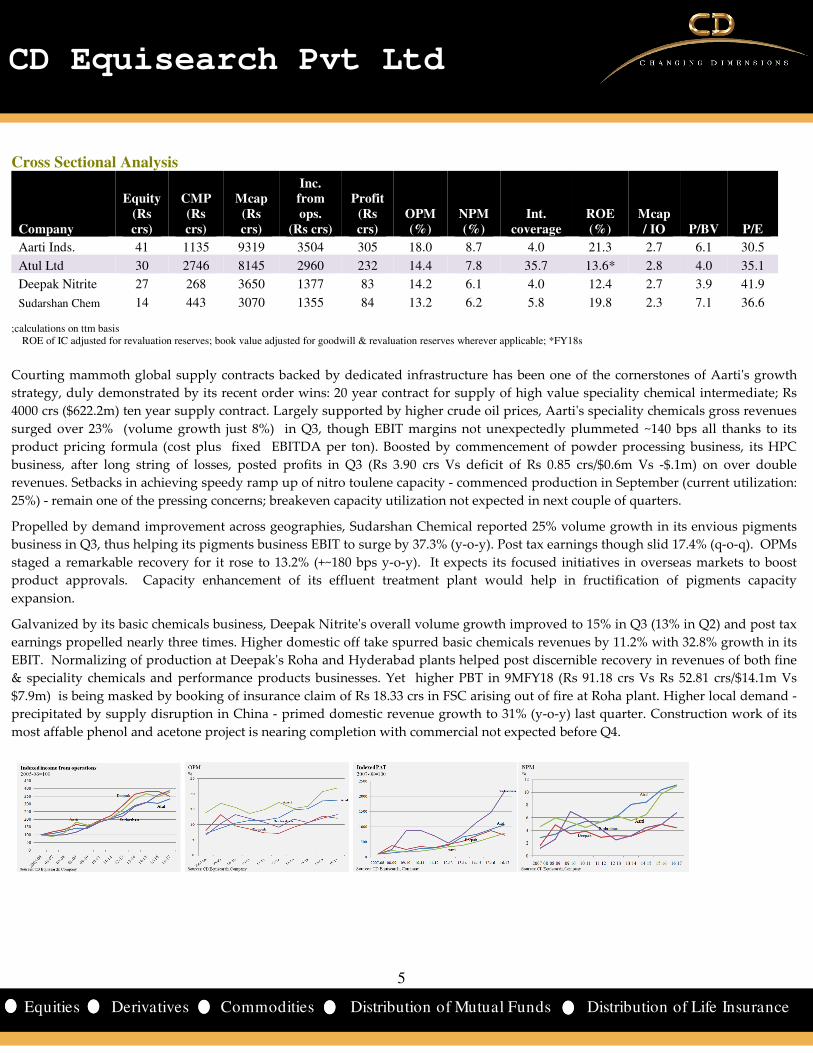
Aarti Inds. 41 1135 9319 3504 305 18.0 8.7 4.0 21.3 2.7 6.1 30.5
Atul Ltd 30 2746 8145 2960 232 14.4 7.8 35.7 13.6* 2.8 4.0 35.1
Deepak Nitrite 27 268 3650 1377 83 14.2 6.1 4.0 12.4 2.7 3.9 41.9
Sudarshan Chem 14 443 3070 1355 84 13.2 6.2 5.8 19.8 2.3 7.1 36.6 ;calculations on ttm basis ROE of IC adjusted for revaluation reserves; book value adjusted for goodwill & revaluation reserves wherever applicable; *FY18s
Courting mammoth global supply contracts backed by dedicated infrastructure has been one of the cornerstones of Aarti's growth
strategy, duly demonstrated by its recent order wins: 20 year contract for supply of high value speciality chemical intermediate; Rs
4000 crs ($622.2m) ten year supply contract. Largely supported by higher crude oil prices, Aarti's speciality chemicals gross revenues
surged over 23% (volume growth just 8%) in Q3, though EBIT margins not unexpectedly plummeted ~140 bps all thanks to its
product pricing formula (cost plus fixed EBITDA per ton). Boosted by commencement of powder processing business, its HPC
business, after long string of losses, posted profits in Q3 (Rs 3.90 crs Vs deficit of Rs 0.85 crs/$0.6m Vs -$.1m) on over double
revenues. Setbacks in achieving speedy ramp up of nitro toulene capacity - commenced production in September (current utilization:
25%) - remain one of the pressing concerns; breakeven capacity utilization not expected in next couple of quarters.
Propelled by demand improvement across geographies, Sudarshan Chemical reported 25% volume growth in its envious pigments
business in Q3, thus helping its pigments business EBIT to surge by 37.3% (y-o-y). Post tax earnings though slid 17.4% (q-o-q). OPMs
staged a remarkable recovery for it rose to 13.2% (+~180 bps y-o-y). It expects its focused initiatives in overseas markets to boost
product approvals. Capacity enhancement of its effluent treatment plant would help in fructification of pigments capacity
expansion.
Galvanized by its basic chemicals business, Deepak Nitrite's overall volume growth improved to 15% in Q3 (13% in Q2) and post tax
earnings propelled nearly three times. Higher domestic off take spurred basic chemicals revenues by 11.2% with 32.8% growth in its
EBIT. Normalizing of production at Deepak's Roha and Hyderabad plants helped post discernible recovery in revenues of both fine
& speciality chemicals and performance products businesses. Yet higher PBT in 9MFY18 (Rs 91.18 crs Vs Rs 52.81 crs/$14.1m Vs
$7.9m) is being masked by booking of insurance claim of Rs 18.33 crs in FSC arising out of fire at Roha plant. Higher local demand -
precipitated by supply disruption in China - primed domestic revenue growth to 31% (y-o-y) last quarter. Construction work of its
most affable phenol and acetone project is nearing completion with commercial not expected before Q4.
6
6
CD Equisearch Pvt Ltd
Equities Derivatives Commodities Distribution of Mutual Funds Distribution of Life Insurance
Financials
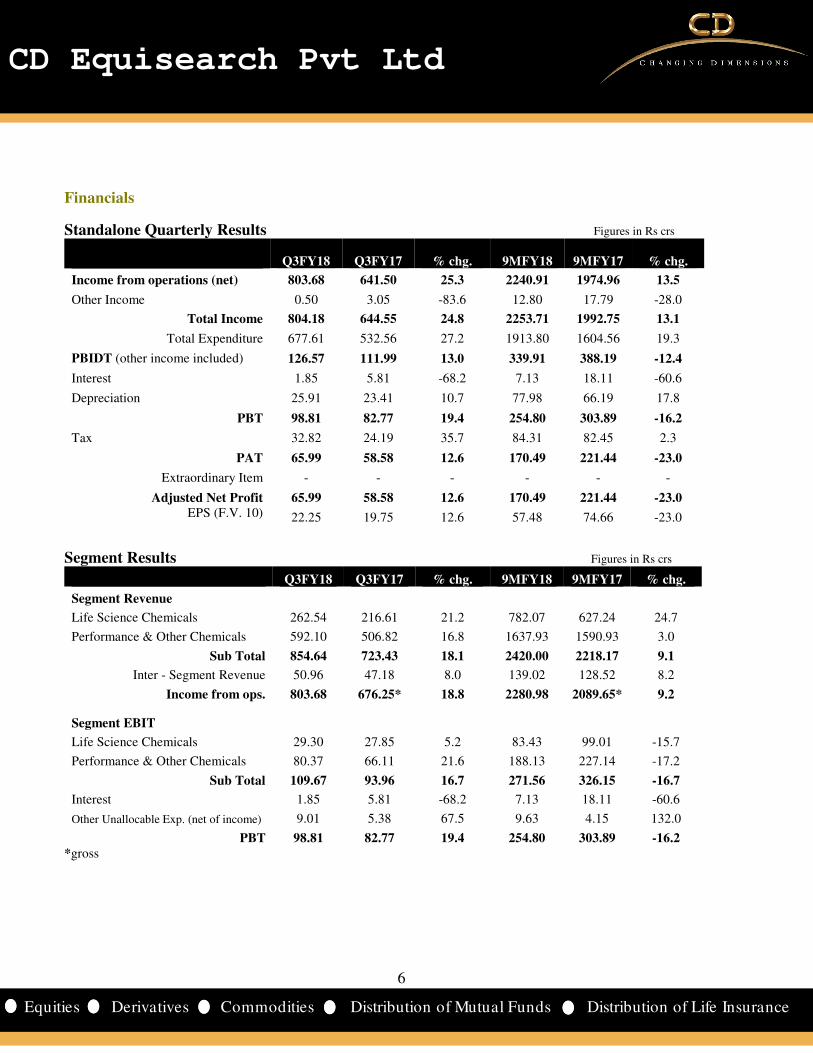
Standalone Quarterly Results Figures in Rs crs
Q3FY18 Q3FY17 % chg. 9MFY18 9MFY17 % chg.
Income from operations (net) 803.68 641.50 25.3 2240.91 1974.96 13.5
Other Income 0.50 3.05 -83.6 12.80 17.79 -28.0
Total Income 804.18 644.55 24.8 2253.71 1992.75 13.1
Total Expenditure 677.61 532.56 27.2 1913.80 1604.56 19.3
PBIDT (other income included) 126.57 111.99 13.0 339.91 388.19 -12.4
Interest 1.85 5.81 -68.2 7.13 18.11 -60.6
Depreciation 25.91 23.41 10.7 77.98 66.19 17.8
PBT 98.81 82.77 19.4 254.80 303.89 -16.2
Tax 32.82 24.19 35.7 84.31 82.45 2.3
PAT 65.99 58.58 12.6 170.49 221.44 -23.0
Extraordinary Item - - - - - -
Adjusted Net Profit 65.99 58.58 12.6 170.49 221.44 -23.0 EPS (F.V. 10) 22.25 19.75 12.6 57.48 74.66 -23.0
Segment Results Figures in Rs crs
Q3FY18 Q3FY17 % chg. 9MFY18 9MFY17 % chg.
Segment Revenue
Life Science Chemicals 262.54 216.61 21.2 782.07 627.24 24.7
Performance & Other Chemicals 592.10 506.82 16.8 1637.93 1590.93 3.0
Sub Total 854.64 723.43 18.1 2420.00 2218.17 9.1
Inter - Segment Revenue 50.96 47.18 8.0 139.02 128.52 8.2
Income from ops. 803.68 676.25* 18.8 2280.98 2089.65* 9.2
Segment EBIT
Life Science Chemicals 29.30 27.85 5.2 83.43 99.01 -15.7
Performance & Other Chemicals 80.37 66.11 21.6 188.13 227.14 -17.2
Sub Total 109.67 93.96 16.7 271.56 326.15 -16.7
Interest 1.85 5.81 -68.2 7.13 18.11 -60.6
Other Unallocable Exp. (net of income) 9.01 5.38 67.5 9.63 4.15 132.0
PBT 98.81 82.77 19.4 254.80 303.89 -16.2 *gross

7
7
CD Equisearch Pvt Ltd
Equities Derivatives Commodities Distribution of Mutual Funds Distribution of Life Insurance
Consolidated Income Statement Figures in Rs crs
FY16 FY17 FY18e FY19e
Income from operations 2594.59 2833.94 3231.65 3630.01
Growth (%) -2.3 9.2 14.0 12.3
Other Income 34.40 52.55 12.20 16.13
Total Income 2628.99 2886.49 3243.85 3646.14
Total Expenditure 2135.36 2324.49 2703.52 3008.28
EBITDA (other income included) 493.63 562.00 540.33 637.86
Interest 27.53 25.17 9.82 7.44
EBDT 466.10 536.83 530.51 630.43
Depreciation 66.07 95.44 110.24 127.11
Tax 130.22 122.71 138.69 166.09
Net profit 269.81 318.68 281.58 337.22
Profit/loss of associate & JV 4.46 4.67 5.24 5.76
MI 0.09 0.38 0.38 0.38
Net profit after MI 274.18 322.97 286.44 342.60
Extraordinary item -1.33 2.60 0.00 0.00
Adjusted Net Profit 275.51 320.37 286.44 342.60
EPS (Rs.) 92.89 108.02 96.57 115.50
Segment Results Figures in Rs crs
FY16 FY17 FY18e FY19e
Segment Revenue
Life Science Chemicals 893.32 924.82 1117.46 1299.13
Performance & Other Chemicals* 1858.22 2067.31 2110.07 2326.56
Others 3.47 3.92 4.12 4.32
Income from ops.** 2755.01 2996.05 3231.65 3630.01
Segment EBIT
Life Science Chemicals 171.91 154.43 136.89 175.38
Performance & Other Chemicals 248.48 303.42 274.31 314.09
Others 0.11 -0.92 -0.50 -0.50
Sub Total 420.50 456.93 410.70 488.97
Interest 27.53 25.17 9.82 7.44
Other Unallocable Exp. (net of income) -7.06 -9.63 -19.39 -21.78
PBT 400.03 441.39 420.27 503.31
*adjusted for inter-segment revenues
**gross for FY16/FY17; net of GST for rest
8
8
CD Equisearch Pvt Ltd
Equities Derivatives Commodities Distribution of Mutual Funds Distribution of Life Insurance
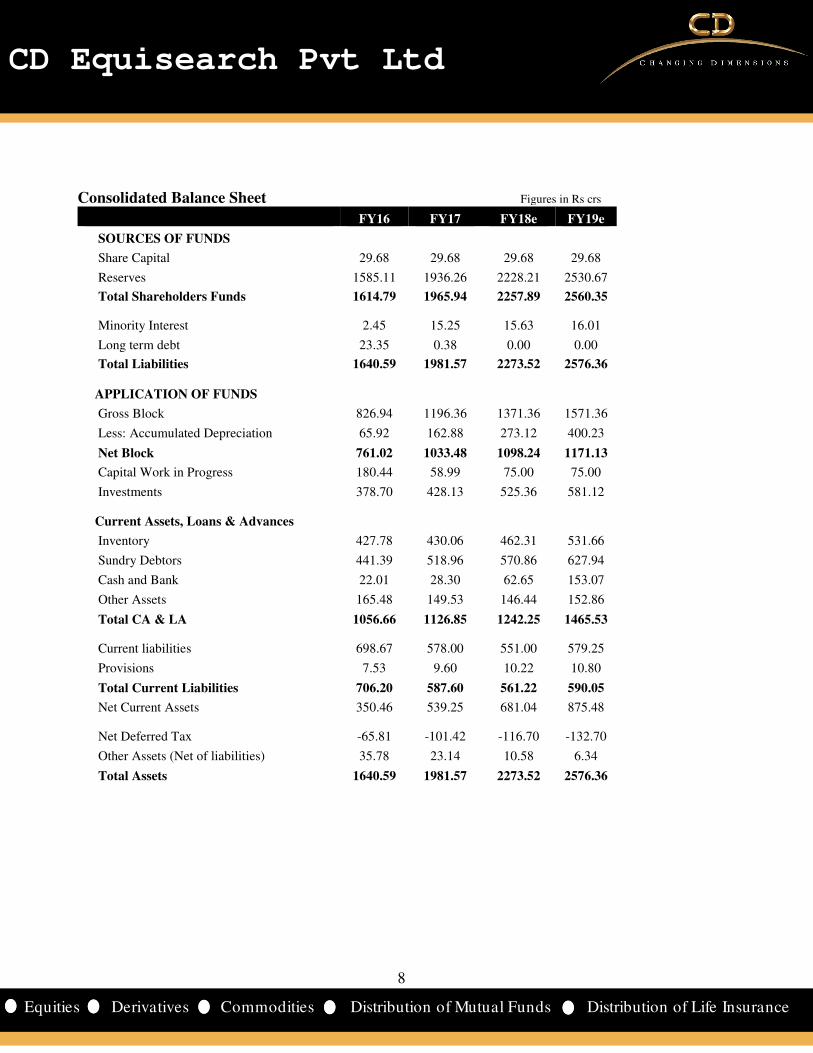
Consolidated Balance Sheet Figures in Rs crs
FY16 FY17 FY18e FY19e
SOURCES OF FUNDS
Share Capital 29.68 29.68 29.68 29.68
Reserves 1585.11 1936.26 2228.21 2530.67
Total Shareholders Funds 1614.79 1965.94 2257.89 2560.35
Minority Interest 2.45 15.25 15.63 16.01
Long term debt 23.35 0.38 0.00 0.00
Total Liabilities 1640.59 1981.57 2273.52 2576.36
APPLICATION OF FUNDS
Gross Block 826.94 1196.36 1371.36 1571.36
Less: Accumulated Depreciation 65.92 162.88 273.12 400.23
Net Block 761.02 1033.48 1098.24 1171.13
Capital Work in Progress 180.44 58.99 75.00 75.00
Investments 378.70 428.13 525.36 581.12
Current Assets, Loans & Advances
Inventory 427.78 430.06 462.31 531.66
Sundry Debtors 441.39 518.96 570.86 627.94
Cash and Bank 22.01 28.30 62.65 153.07
Other Assets 165.48 149.53 146.44 152.86
Total CA & LA 1056.66 1126.85 1242.25 1465.53
Current liabilities 698.67 578.00 551.00 579.25
Provisions 7.53 9.60 10.22 10.80
Total Current Liabilities 706.20 587.60 561.22 590.05
Net Current Assets 350.46 539.25 681.04 875.48
Net Deferred Tax -65.81 -101.42 -116.70 -132.70
Other Assets (Net of liabilities) 35.78 23.14 10.58 6.34
Total Assets 1640.59 1981.57 2273.52 2576.36
9
9
CD Equisearch Pvt Ltd
Equities Derivatives Commodities Distribution of Mutual Funds Distribution of Life Insurance
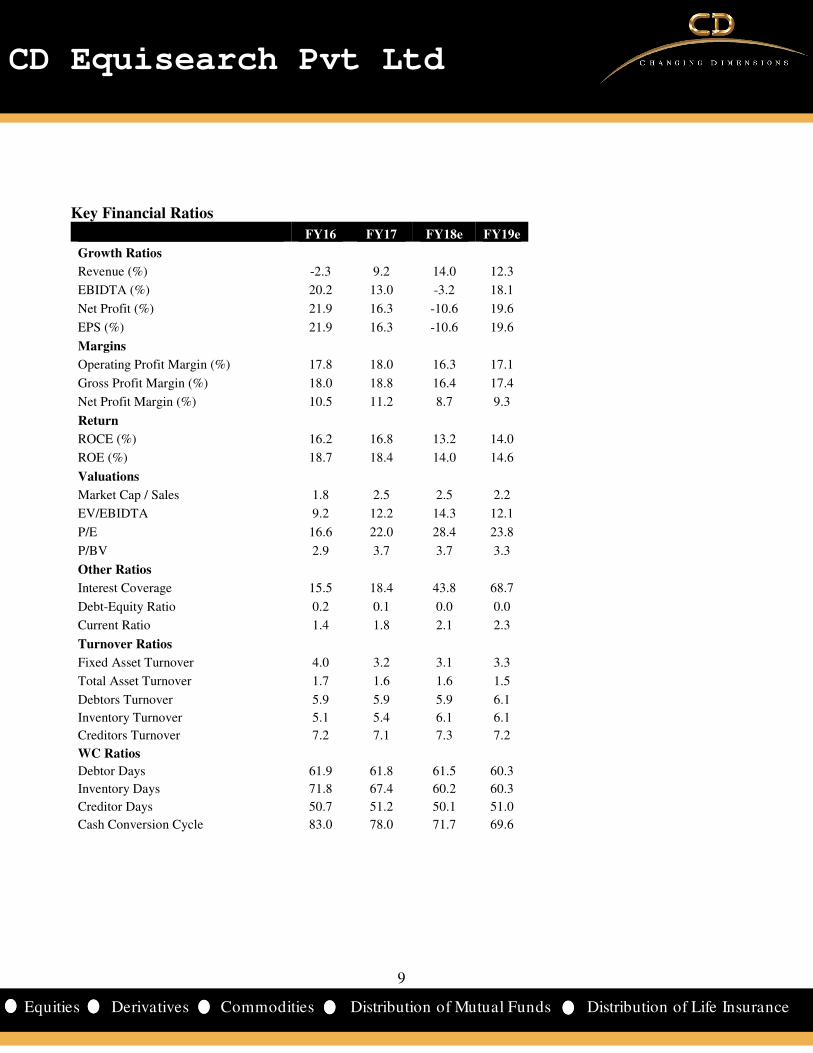
Key Financial Ratios
FY16 FY17 FY18e FY19e
Growth Ratios
Revenue (%) -2.3 9.2 14.0 12.3
EBIDTA (%) 20.2 13.0 -3.2 18.1
Net Profit (%) 21.9 16.3 -10.6 19.6
EPS (%) 21.9 16.3 -10.6 19.6
Margins
Operating Profit Margin (%) 17.8 18.0 16.3 17.1
Gross Profit Margin (%) 18.0 18.8 16.4 17.4
Net Profit Margin (%) 10.5 11.2 8.7 9.3
Return
ROCE (%) 16.2 16.8 13.2 14.0
ROE (%) 18.7 18.4 14.0 14.6
Valuations
Market Cap / Sales 1.8 2.5 2.5 2.2
EV/EBIDTA 9.2 12.2 14.3 12.1
P/E 16.6 22.0 28.4 23.8
P/BV 2.9 3.7 3.7 3.3
Other Ratios
Interest Coverage 15.5 18.4 43.8 68.7
Debt-Equity Ratio 0.2 0.1 0.0 0.0
Current Ratio 1.4 1.8 2.1 2.3
Turnover Ratios
Fixed Asset Turnover 4.0 3.2 3.1 3.3
Total Asset Turnover 1.7 1.6 1.6 1.5
Debtors Turnover 5.9 5.9 5.9 6.1
Inventory Turnover 5.1 5.4 6.1 6.1
Creditors Turnover 7.2 7.1 7.3 7.2
WC Ratios
Debtor Days 61.9 61.8 61.5 60.3
Inventory Days 71.8 67.4 60.2 60.3
Creditor Days 50.7 51.2 50.1 51.0
Cash Conversion Cycle 83.0 78.0 71.7 69.6
10
10
CD Equisearch Pvt Ltd
Equities Derivatives Commodities Distribution of Mutual Funds Distribution of Life Insurance
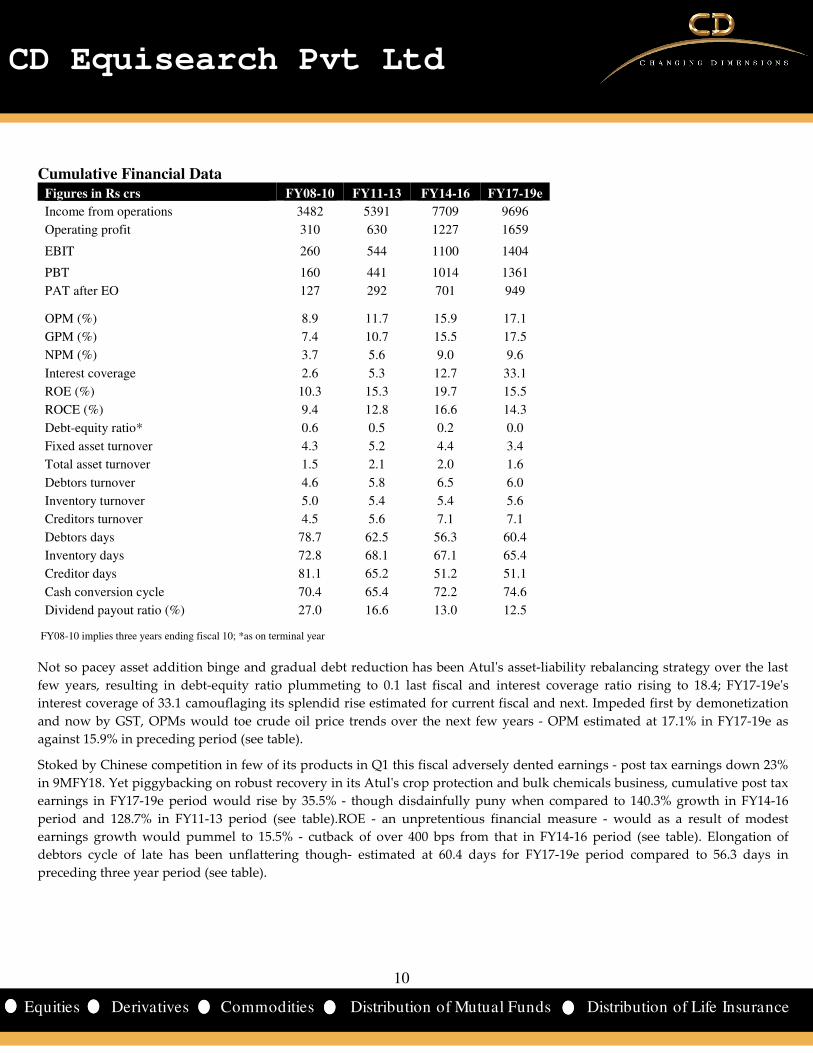
Cumulative Financial Data Figures in Rs crs FY08-10 FY11-13 FY14-16 FY17-19e
Income from operations 3482 5391 7709 9696
Operating profit 310 630 1227 1659
EBIT 260 544 1100 1404
PBT 160 441 1014 1361
PAT after EO 127 292 701 949
OPM (%) 8.9 11.7 15.9 17.1
GPM (%) 7.4 10.7 15.5 17.5
NPM (%) 3.7 5.6 9.0 9.6
Interest coverage 2.6 5.3 12.7 33.1
ROE (%) 10.3 15.3 19.7 15.5
ROCE (%) 9.4 12.8 16.6 14.3
Debt-equity ratio* 0.6 0.5 0.2 0.0
Fixed asset turnover 4.3 5.2 4.4 3.4
Total asset turnover 1.5 2.1 2.0 1.6
Debtors turnover 4.6 5.8 6.5 6.0
Inventory turnover 5.0 5.4 5.4 5.6
Creditors turnover 4.5 5.6 7.1 7.1
Debtors days 78.7 62.5 56.3 60.4
Inventory days 72.8 68.1 67.1 65.4
Creditor days 81.1 65.2 51.2 51.1
Cash conversion cycle 70.4 65.4 72.2 74.6
Dividend payout ratio (%) 27.0 16.6 13.0 12.5 FY08-10 implies three years ending fiscal 10; *as on terminal year
Not so pacey asset addition binge and gradual debt reduction has been Atul's asset-liability rebalancing strategy over the last
few years, resulting in debt-equity ratio plummeting to 0.1 last fiscal and interest coverage ratio rising to 18.4; FY17-19e's
interest coverage of 33.1 camouflaging its splendid rise estimated for current fiscal and next. Impeded first by demonetization
and now by GST, OPMs would toe crude oil price trends over the next few years - OPM estimated at 17.1% in FY17-19e as
against 15.9% in preceding period (see table).
Stoked by Chinese competition in few of its products in Q1 this fiscal adversely dented earnings - post tax earnings down 23%
in 9MFY18. Yet piggybacking on robust recovery in its Atul's crop protection and bulk chemicals business, cumulative post tax
earnings in FY17-19e period would rise by 35.5% - though disdainfully puny when compared to 140.3% growth in FY14-16
period and 128.7% in FY11-13 period (see table).ROE - an unpretentious financial measure - would as a result of modest
earnings growth would pummel to 15.5% - cutback of over 400 bps from that in FY14-16 period (see table). Elongation of
debtors cycle of late has been unflattering though- estimated at 60.4 days for FY17-19e period compared to 56.3 days in
preceding three year period (see table).
11
11
CD Equisearch Pvt Ltd
Equities Derivatives Commodities Distribution of Mutual Funds Distribution of Life Insurance
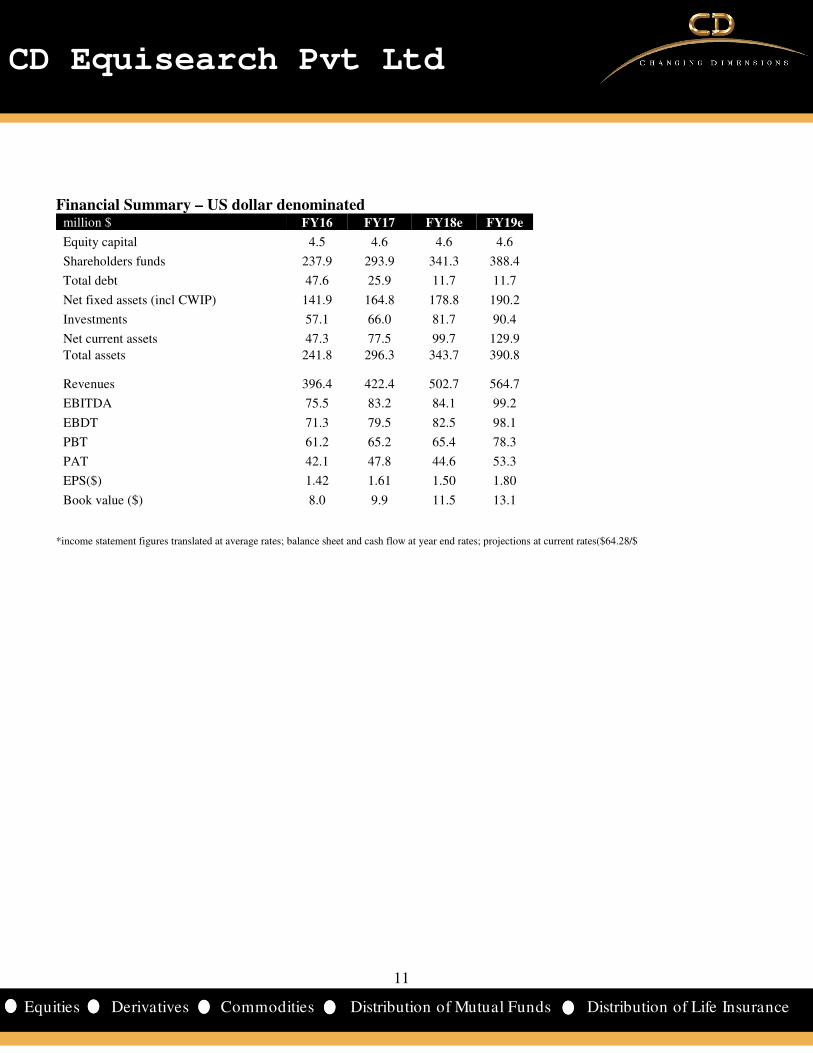
Financial Summary – US dollar denominated million $ FY16 FY17 FY18e FY19e
Equity capital 4.5 4.6 4.6 4.6
Shareholders funds 237.9 293.9 341.3 388.4
Total debt 47.6 25.9 11.7 11.7
Net fixed assets (incl CWIP) 141.9 164.8 178.8 190.2
Investments 57.1 66.0 81.7 90.4
Net current assets 47.3 77.5 99.7 129.9
Total assets 241.8 296.3 343.7 390.8
Revenues 396.4 422.4 502.7 564.7
EBITDA 75.5 83.2 84.1 99.2
EBDT 71.3 79.5 82.5 98.1
PBT 61.2 65.2 65.4 78.3
PAT 42.1 47.8 44.6 53.3
EPS($) 1.42 1.61 1.50 1.80
Book value ($) 8.0 9.9 11.5 13.1
*income statement figures translated at average rates; balance sheet and cash flow at year end rates; projections at current rates($64.28/$
12
12
CD Equisearch Pvt Ltd
Equities Derivatives Commodities Distribution of Mutual Funds Distribution of Life Insurance
Disclosure& Disclaimer CD Equisearch Private Limited (hereinafter referred to as ‘CD Equi’) is a Member registered with National Stock Exchange of India Limited,
Bombay Stock Exchange Limited and Metropolitan Stock Exchange of India Limited (Formerly known as MCX Stock Exchange Limited). CD
Equi is also registered as Depository Participant with CDSL and AMFI registered Mutual Fund Advisor. The associates of CD Equi are
engaged in activities relating to NBFC-ND - Financing and Investment, Commodity Broking, Real Estate, etc.
CD Equi is registered under SEBI (Research Analysts) Regulations, 2014 with SEBI Registration no INH300002274. Further, CD Equi hereby
declares that –
• No disciplinary action has been taken against CD Equi by any of the regulatory authorities.
• CD Equi/its associates/research analysts do not have any financial interest/beneficial interest of more than one percent/material
conflict of interest in the subject company(s) (kindly disclose if otherwise).
• CD Equi/its associates/research analysts have not received any compensation from the subject company(s) during the past twelve
months.
• CD Equi/its research analysts has not served as an officer, director or employee of company covered by analysts and has not been
engaged in market making activity of the company covered by analysts.
This document is solely for the personal information of the recipient and must not be singularly used as the basis of any investment decision.
Nothing in this document should be construed as investment or financial advice. Each recipient of this document should make such
investigations as they deem necessary to arrive at an independent evaluation of an investment in the securities of the companies referred to in
this document (including the merits and risks involved) and should consult their own advisors to determine the merits and risks of such an
investment.
Reports based on technical and derivative analysis center on studying charts of a stock's price movement, outstanding positions and trading
volume, as opposed to focusing on a company's fundamentals and as such, may not match with a report on a company's fundamentals.
The information in this document has been printed on the basis of publicly available information, internal data and other reliable sources
believed to be true but we do not represent that it is accurate or complete and it should not be relied on as such, as this document is for general
guidance only. CD Equi or any of its affiliates/group companies shall not be in any way responsible for any loss or damage that may arise to
any person from any inadvertent error in the information contained in this report. CD Equi has not independently verified all the information
contained within this document. Accordingly, we cannot testify nor make any representation or warranty, express or implied, to the accuracy,
contents or data contained within this document.
While, CD Equi endeavors to update on a reasonable basis the information discussed in this material, there may be regulatory compliance or
other reasons that prevent us from doing so.
This document is being supplied to you solely for your information and its contents, information or data may not be reproduced, redistributed
or passed on, directly or indirectly. Neither, CD Equi nor its directors, employees or affiliates shall be liable for any loss or damage that may
arise from or in connection with the use of this information.
CD Equisearch Private Limited (CIN: U67120WB1995PTC071521)
Registered Office: 37, Shakespeare Sarani, 3rd Floor, Kolkata – 700 017; Phone: +91(33) 4488 0000; Fax: +91(33) 2289 2557 Corporate Office: 10,
Vasawani Mansion, 5th Floor, Dinshaw Wachha Road, Churchgate, Mumbai – 400 020. Phone: +91(22) 2283 0652/0653; Fax: +91(22) 2283, 2276
Website: www.cdequi.com; Email: [email protected]
buy: >20% accumulate: >10% to ≤20% hold: ≥-10% to ≤10% reduce: ≥-20% to <-10% sell: <-20%
Exchange Rates Used- Indicative
Rs/$ FY14 FY15 FY16 FY17
Average 60.5 61.15 65.46 67.09
Year end 60.1 62.59 66.33 64.84
All $ values mentioned in the write-up translated at the average rate of the respective quarter/ year as applicable. Projections converted at
current exchange rate. Cumulative dollar figure is the sum of respective yearly dollar value.