Embed Size (px)
Citation preview
CD Equisearch Pvt Ltd
Equities Derivatives Commoditie
Talwalkars Better Value Fitness Ltd.
No. of shares (m) 29.7
Mkt cap (Rs crs/$m) 847/131.7
Current price (Rs/$) 285/4.4
Price target (Rs/$) 373/5.8
52 W H/L (Rs.) 303/207
Book Value (Rs/$) 163/2.5
Beta 1.3
Daily volume (avg. monthly) 123370
P/BV (FY18e/19e) 1.5/1.3
EV/EBITDA (FY18e/19e) 5.6/4.8
P/E (FY18e/19e) 10.6/8.4
EPS growth (FY17/18e/19e) 16.2/21.8/25.6
OPM (FY17/18e/19e) 59.8/62.3/63.5
ROE (FY17/18e/19e) 14.5/15.4/16.6
ROCE(FY17/18e/19e) 9.1/10.0/11.1
Net D/E ratio (FY17/18e/19e) 0.7/0.5/0.3
BSE Code 533200
NSE Code TALWALKARS
Bloomberg TALW IN
Reuters TALW.BO
Shareholding pattern %
Promoters 38.0
MFs / Banks / FIs 7.1
Foreign Portfolio Investors 13.3
Govt. Holding 0.0
Public & Others 41.6
Total 100.0
As on March 31, 2017
Recommendation
BUY
Phone: + 91 (33) 4488 0055
E- mail: [email protected]
Consolidated (Rs crs)
Income from operations
Other Income
EBITDA (other income included)
PAT after MI and EO EPS(Rs)
EPS growth (%)
Pvt Ltd
ities Distribution of Mutual Funds Dist
FY15
FY16
FY17
225.66 251.37 286.00
0.85 6.76 0.52
125.38 150.20 171.23
46.07 55.04 65.88
17.60 19.09 22.18
25.8 8.5 16.2
Quarterly Highlights • Talwalkars opened 10 PWG (power world gyms)
becoming one of the top players in the capital city. 10 new zorba centres
were opened in Q4, increasing the total number of zorba centres to 31 p
India. TBVF also announced opening of 20 PWG gyms in Bangalore with a
capacity of 800-1000 members in Q3 with an
capex model (Rs 1.75-2.25 crs vs Rs 3.7 crs for Talwalkars
and thereby enhance return on capital.
• Talwalkars has signed a MoU to acquire 50.01
Pvt Ltd. (SNAP; India’s third largest gym company and the exclusive
master franchise in India of ‘Snap Fitness Inc.’
addition of 60 SNAP gyms into an existing nationwide network of
Talwalkars (191 outlets) and access to a strong management
India with considerable experience in franchising.
• Talwalkars has managed to obtain sanction of Rs 100 crs
Axis Bank for expansion of gyms thanks to its st
(AA both from Care and Brickworks; AA
reduce debt by repaying at least Rs 100 crs ($15.5m)
through internal accruals and unlocking the value of properties s
further improve its rating and help it procure funds at lower
• Talwalkars also owns 20% stake in a location
health discovery platform, GrowFitter, which connects the gym
service providers with potential fitness enthusiasts and helps people make
choices regarding fitness centres in their c
TVBF’s presence online. During the year it provided 500+ free trials on a
monthly basis and converted ~ 20-25% into membership by offering best
deals online.
• The stock currently trades at 10.6x FY18e EPS of Rs 27.01
EPS of Rs 33.94. Renewed focus on capping annual capex
internal cash accruals) would contain debt accretion. Sturdy growth in
Indian wellness industry (CAGR of 12% till
buttress business growth. Improved profitability (
CAGR) would help spur return on capital
Talwalkars proposition to demerge into two companies
Lifestyle Co. should help it expand both organically and inorganically
retain our “buy” rating on the stock with revised target of Rs 373
target of Rs 338) based on 11x FY19e EPS of Rs
period of 9-12 months.
Pvt Ltd June 13, 2017
istribution of Life Insurance
FY18e FY19e
331.91 379.48
0.57 0.63
207.31 241.53
80.25 100.82
27.01 33.94
21.8 25.6
(power world gyms) in Delhi in Q4, thus
becoming one of the top players in the capital city. 10 new zorba centres
number of zorba centres to 31 pan
announced opening of 20 PWG gyms in Bangalore with a
000 members in Q3 with an aim to leverage on the low
vs Rs 3.7 crs for Talwalkars original format)
.01% stake in Force Fitness India
AP; India’s third largest gym company and the exclusive
master franchise in India of ‘Snap Fitness Inc.’, USA) which will lead to an
addition of 60 SNAP gyms into an existing nationwide network of
and access to a strong management team of SNAP
India with considerable experience in franchising.
has managed to obtain sanction of Rs 100 crs ($15.5m) from
for expansion of gyms thanks to its strong financials and ratings
; AA- from ICRA). Its intention to
($15.5m) over the next few years
through internal accruals and unlocking the value of properties should
and help it procure funds at lower cost.
stake in a location-based online fitness and
which connects the gym and fitness
service providers with potential fitness enthusiasts and helps people make
choices regarding fitness centres in their community, thus expanding
TVBF’s presence online. During the year it provided 500+ free trials on a
25% into membership by offering best
The stock currently trades at 10.6x FY18e EPS of Rs 27.01 and 8.4x FY19e
Renewed focus on capping annual capex (not excluding
would contain debt accretion. Sturdy growth in
Indian wellness industry (CAGR of 12% till 2020) would doubtlessly
business growth. Improved profitability (earning growth: ~24%
CAGR) would help spur return on capital and ebb financial leverage.
to demerge into two companies – Gym Co. and
organically and inorganically. We
ck with revised target of Rs 373 (previous
x FY19e EPS of Rs 33.94 (peg ratio 0.5), over a
CD Equisearch Pvt Ltd
Equities Derivatives Commoditie
Outlook & Recommendation
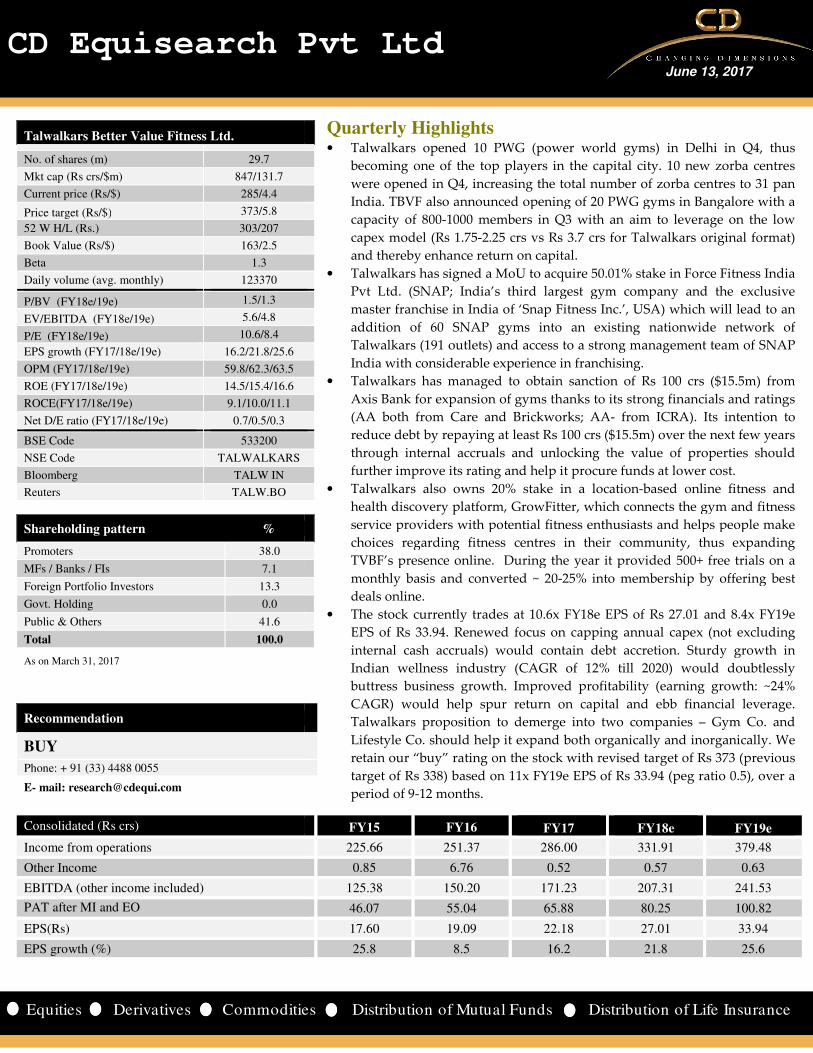
Indian Wellness Industry The Indian population today is moving towards fitness and overall well
work pressure, and combat unhealthy eating habits and sedentary lifestyles. With the profound changes in the lifestyle and
income levels of people, the wellness industry in India has become a sunrise sector;
in financial year 2014-15 and is expected to grow at a CA
trillion by FY20, according to a recent report by FICCI and EY.
India’s population today is relatively young which
yoga, zumba and diet programs. Unhealthy eating habits, growing disposable income, health characteri
burden of diseases, productive years lost, and cost of health care
emerging markets like India.
While the wellness and preventive health care sector as a whole is expected to nearly double by 2020, some sub
outperform others. While beauty care and nutritional care would retain their share, fitness and rejuvenation would
significantly increase their market share.
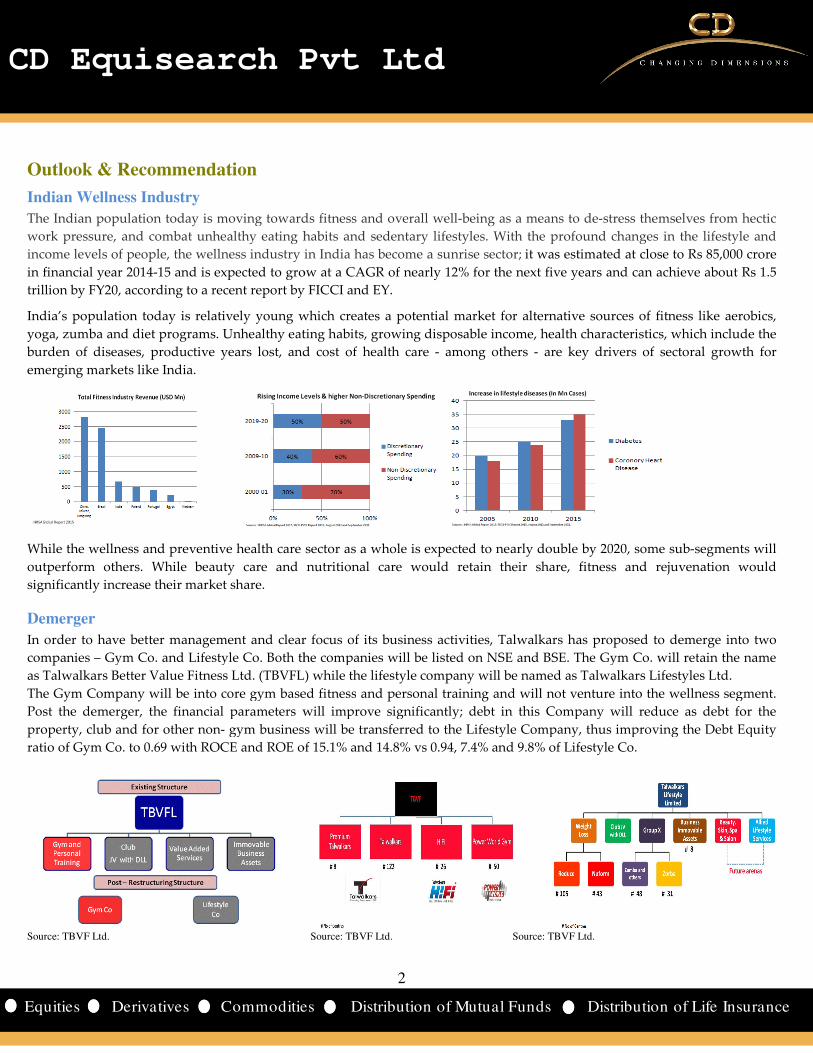
Demerger
In order to have better management and clear focus of its business activities, Talwalkars has proposed to demerge into two
companies – Gym Co. and Lifestyle Co. Both the companies will be listed
as Talwalkars Better Value Fitness Ltd. (TBVFL)
The Gym Company will be into core gym based fitness
Post the demerger, the financial parameters will improve significantly;
property, club and for other non- gym business will be transferred to the Lifestyle Company,
ratio of Gym Co. to 0.69 with ROCE and ROE of 15.1% and 14.8%
Source: TBVF Ltd.
2
Pvt Ltd
ities Distribution of Mutual Funds Dist
is moving towards fitness and overall well-being as a means to de-stress themselves from hectic
work pressure, and combat unhealthy eating habits and sedentary lifestyles. With the profound changes in the lifestyle and
industry in India has become a sunrise sector; it was estimated at close to Rs 85,000 crore
15 and is expected to grow at a CAGR of nearly 12% for the next five years and
ent report by FICCI and EY.
which creates a potential market for alternative sources of fitness like aerobics,
yoga, zumba and diet programs. Unhealthy eating habits, growing disposable income, health characteri
burden of diseases, productive years lost, and cost of health care - among others - are key drivers of
are sector as a whole is expected to nearly double by 2020, some sub
outperform others. While beauty care and nutritional care would retain their share, fitness and rejuvenation would
er to have better management and clear focus of its business activities, Talwalkars has proposed to demerge into two
Gym Co. and Lifestyle Co. Both the companies will be listed on NSE and BSE. The Gym Co. will ret
(TBVFL) while the lifestyle company will be named as Talwalkars Lifestyles Ltd
be into core gym based fitness and personal training and will not venture into the wellness segment.
l parameters will improve significantly; debt in this Company will reduce as debt for the
gym business will be transferred to the Lifestyle Company, thus improving the Debt Equity
of 15.1% and 14.8% vs 0.94, 7.4% and 9.8% of Lifestyle Co.
Source: TBVF Ltd. Source: TBVF Ltd.
2
Pvt Ltd
istribution of Life Insurance
stress themselves from hectic
work pressure, and combat unhealthy eating habits and sedentary lifestyles. With the profound changes in the lifestyle and
it was estimated at close to Rs 85,000 crore
years and can achieve about Rs 1.5
creates a potential market for alternative sources of fitness like aerobics,
yoga, zumba and diet programs. Unhealthy eating habits, growing disposable income, health characteristics, which include the
are key drivers of sectoral growth for
are sector as a whole is expected to nearly double by 2020, some sub-segments will
outperform others. While beauty care and nutritional care would retain their share, fitness and rejuvenation would
er to have better management and clear focus of its business activities, Talwalkars has proposed to demerge into two
SE and BSE. The Gym Co. will retain the name
as Talwalkars Lifestyles Ltd.
and will not venture into the wellness segment.
debt in this Company will reduce as debt for the
thus improving the Debt Equity
vs 0.94, 7.4% and 9.8% of Lifestyle Co.
CD Equisearch Pvt Ltd
Equities Derivatives Commoditie
[
Lifestyle Co. will be into the wellness sector and will cater to
Reduce, NuForm, Zumba, Group X activities, merchandising and others.
potential of the wellness industry and help Talwalkars be a pioneer in this sector. Demerger scheme will help in value
enhancement of both the resultant entities. The shareholders have approved the scheme with the requisite majority and
now the final approval by National Company Law Tribunal (NCLT) is awaited post which the company is committed
to complete the process of demerger in the shortest possible time.
Financials & Valuations
The optimistic growth of the Indian fitness industry shall enable Talwalkars to gro
profitable manner. Enhanced market presence,
well. A preventive approach to healthcare has accelerated demand for
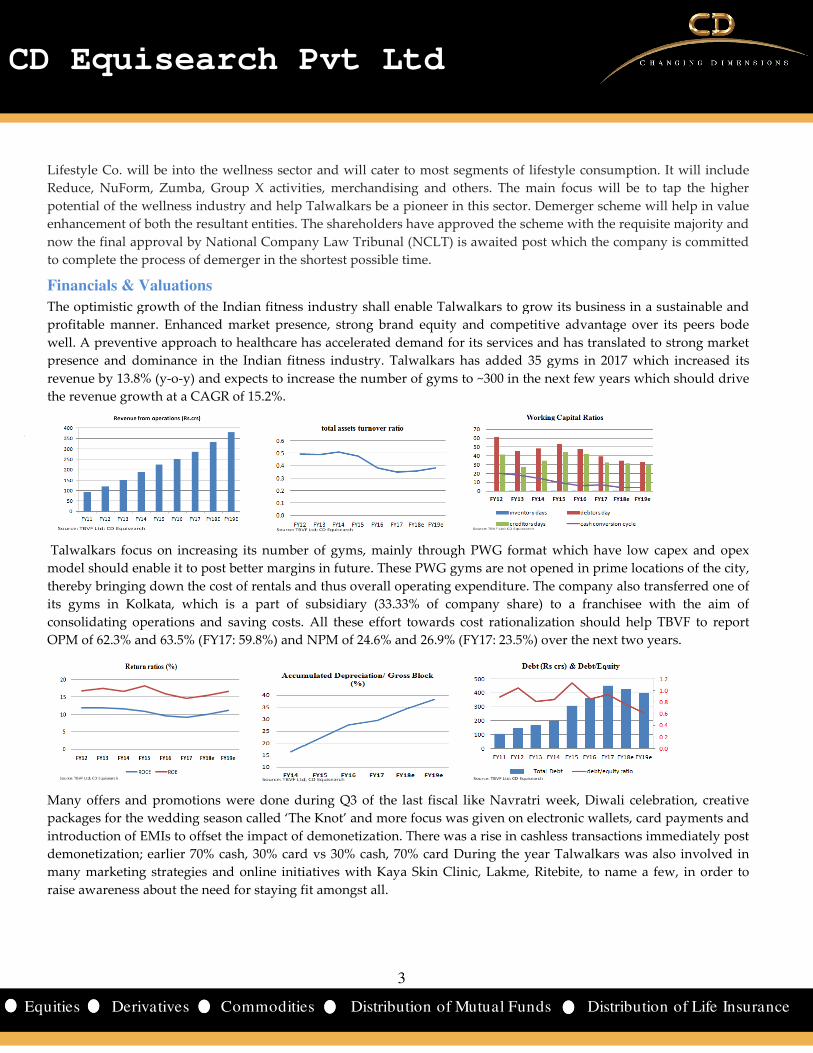
presence and dominance in the Indian fitness industry. Talwalkars has added 35 gyms in 2017 which increased its
revenue by 13.8% (y-o-y) and expects to increase the number
the revenue growth at a CAGR of 15.2%.
Talwalkars focus on increasing its number of gyms, mainly through PWG format which have
model should enable it to post better margins in future.
thereby bringing down the cost of rentals and
its gyms in Kolkata, which is a part of subsidiary (33.33% of company share) to a franchisee with the aim of
consolidating operations and saving costs. All these effort towards cost rationalization should help TBVF to repor
OPM of 62.3% and 63.5% (FY17: 59.8%) and NPM of 24.6% and 26.9%
Many offers and promotions were done during Q3 of the last fiscal like Navratri week, Diwali celebration, creative
packages for the wedding season called ‘The Knot’ and more focus was given on electronic wallets, card payments and
introduction of EMIs to offset the impact of demonetization. There was a rise in cashless transactions
demonetization; earlier 70% cash, 30% card vs 30% cash,
many marketing strategies and online initiatives with Kaya Skin Clinic, Lakme, Ritebite, to name a few, in order to
raise awareness about the need for staying fit amongst all
3
Pvt Ltd
ities Distribution of Mutual Funds Dist
Lifestyle Co. will be into the wellness sector and will cater to most segments of lifestyle consumption
Reduce, NuForm, Zumba, Group X activities, merchandising and others. The main focus will be to tap the higher
help Talwalkars be a pioneer in this sector. Demerger scheme will help in value
enhancement of both the resultant entities. The shareholders have approved the scheme with the requisite majority and
tional Company Law Tribunal (NCLT) is awaited post which the company is committed
to complete the process of demerger in the shortest possible time.
The optimistic growth of the Indian fitness industry shall enable Talwalkars to grow its business in a sustainable and
market presence, strong brand equity and competitive advantage over its peers bode
A preventive approach to healthcare has accelerated demand for its services and has translated to s
presence and dominance in the Indian fitness industry. Talwalkars has added 35 gyms in 2017 which increased its
y) and expects to increase the number of gyms to ~300 in the next few years which should drive
Talwalkars focus on increasing its number of gyms, mainly through PWG format which have
should enable it to post better margins in future. These PWG gyms are not opened in prime locations of the city,
thereby bringing down the cost of rentals and thus overall operating expenditure. The company also transferred one of
its gyms in Kolkata, which is a part of subsidiary (33.33% of company share) to a franchisee with the aim of
consolidating operations and saving costs. All these effort towards cost rationalization should help TBVF to repor
and NPM of 24.6% and 26.9% (FY17: 23.5%) over the next two years.
Many offers and promotions were done during Q3 of the last fiscal like Navratri week, Diwali celebration, creative
season called ‘The Knot’ and more focus was given on electronic wallets, card payments and
introduction of EMIs to offset the impact of demonetization. There was a rise in cashless transactions
earlier 70% cash, 30% card vs 30% cash, 70% card During the year Talwalkars
many marketing strategies and online initiatives with Kaya Skin Clinic, Lakme, Ritebite, to name a few, in order to
raise awareness about the need for staying fit amongst all.
3
Pvt Ltd
istribution of Life Insurance
s of lifestyle consumption. It will include
The main focus will be to tap the higher
help Talwalkars be a pioneer in this sector. Demerger scheme will help in value
enhancement of both the resultant entities. The shareholders have approved the scheme with the requisite majority and
tional Company Law Tribunal (NCLT) is awaited post which the company is committed
w its business in a sustainable and
and competitive advantage over its peers bode
services and has translated to strong market
presence and dominance in the Indian fitness industry. Talwalkars has added 35 gyms in 2017 which increased its
years which should drive
Talwalkars focus on increasing its number of gyms, mainly through PWG format which have low capex and opex
gyms are not opened in prime locations of the city,
company also transferred one of
its gyms in Kolkata, which is a part of subsidiary (33.33% of company share) to a franchisee with the aim of
consolidating operations and saving costs. All these effort towards cost rationalization should help TBVF to report
over the next two years.
Many offers and promotions were done during Q3 of the last fiscal like Navratri week, Diwali celebration, creative
season called ‘The Knot’ and more focus was given on electronic wallets, card payments and
introduction of EMIs to offset the impact of demonetization. There was a rise in cashless transactions immediately post
Talwalkars was also involved in
many marketing strategies and online initiatives with Kaya Skin Clinic, Lakme, Ritebite, to name a few, in order to
CD Equisearch Pvt Ltd
Equities Derivatives Commoditie
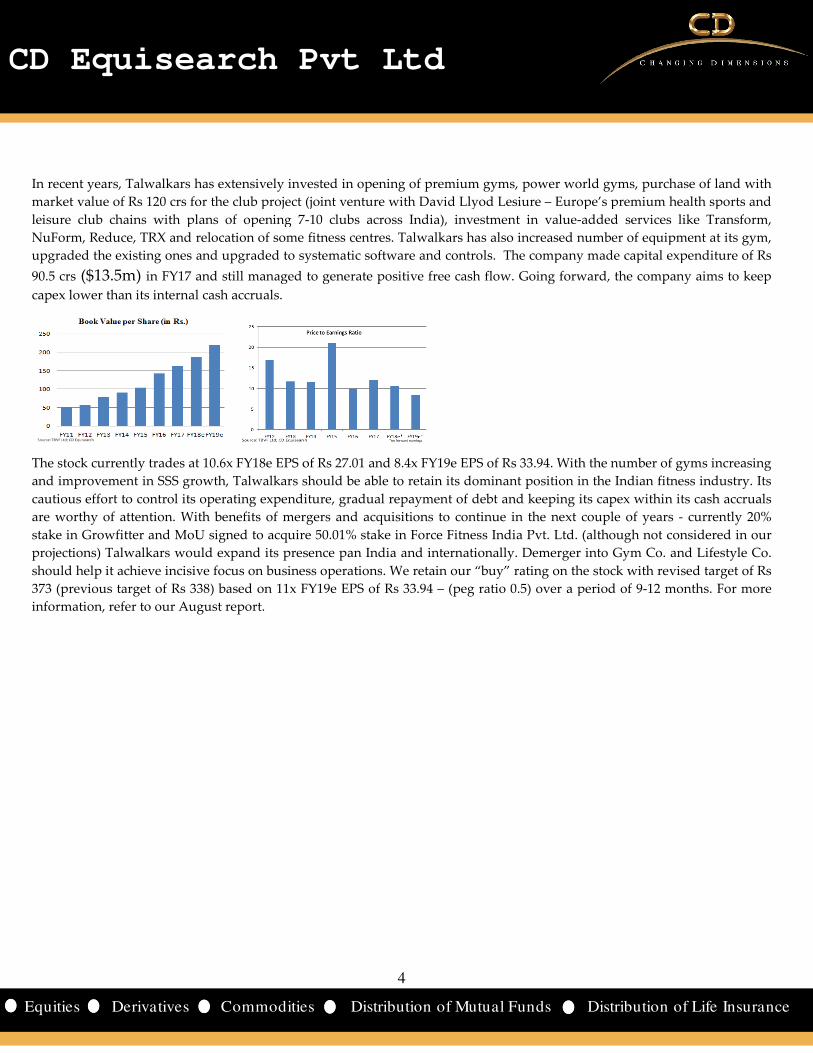
In recent years, Talwalkars has extensively invested in opening of premium gyms, power world gyms
market value of Rs 120 crs for the club project (joint venture with David Llyod Lesiure
leisure club chains with plans of opening 7
NuForm, Reduce, TRX and relocation of some fitness centres. Talwalkars
upgraded the existing ones and upgraded to systematic software and controls.
90.5 crs ($13.5m) in FY17 and still managed to generate positive free cash
capex lower than its internal cash accruals.
The stock currently trades at 10.6x FY18e EPS of Rs 27.01 and 8.4x FY19e EPS of Rs 33.94.
and improvement in SSS growth, Talwalkars should be able to retain its dominant position in the Indian fitness industry. Its
cautious effort to control its operating expenditure,
are worthy of attention. With benefits of mergers and acquisitions to continue in the next couple of years
stake in Growfitter and MoU signed to acquire 50.01% stake in Force Fitness India
projections) Talwalkars would expand its presence p
should help it achieve incisive focus on business operations
373 (previous target of Rs 338) based on 11x FY19e EPS of Rs 33.94
information, refer to our August report.
4
Pvt Ltd
ities Distribution of Mutual Funds Dist
years, Talwalkars has extensively invested in opening of premium gyms, power world gyms
market value of Rs 120 crs for the club project (joint venture with David Llyod Lesiure – Europe’s premium health sports and
with plans of opening 7-10 clubs across India), investment in value-added services like Transform,
on of some fitness centres. Talwalkars has also increased number of equipment
raded to systematic software and controls. The company made capital expenditure of Rs
in FY17 and still managed to generate positive free cash flow. Going forward, the company aims to keep
The stock currently trades at 10.6x FY18e EPS of Rs 27.01 and 8.4x FY19e EPS of Rs 33.94. With the number
Talwalkars should be able to retain its dominant position in the Indian fitness industry. Its
ous effort to control its operating expenditure, gradual repayment of debt and keeping its capex within its cash accruals
mergers and acquisitions to continue in the next couple of years
owfitter and MoU signed to acquire 50.01% stake in Force Fitness India Pvt. Ltd. (although not
Talwalkars would expand its presence pan India and internationally. Demerger into Gym Co. and Lifestyle
business operations. We retain our “buy” rating on the sto
x FY19e EPS of Rs 33.94 – (peg ratio 0.5) over a period of 9
4
Pvt Ltd
istribution of Life Insurance
years, Talwalkars has extensively invested in opening of premium gyms, power world gyms, purchase of land with
Europe’s premium health sports and
added services like Transform,
increased number of equipment at its gym,
The company made capital expenditure of Rs
Going forward, the company aims to keep
With the number of gyms increasing
Talwalkars should be able to retain its dominant position in the Indian fitness industry. Its
repayment of debt and keeping its capex within its cash accruals
mergers and acquisitions to continue in the next couple of years - currently 20%
Pvt. Ltd. (although not considered in our
an India and internationally. Demerger into Gym Co. and Lifestyle Co.
the stock with revised target of Rs
atio 0.5) over a period of 9-12 months. For more
CD Equisearch Pvt Ltd
Equities Derivatives Commoditie
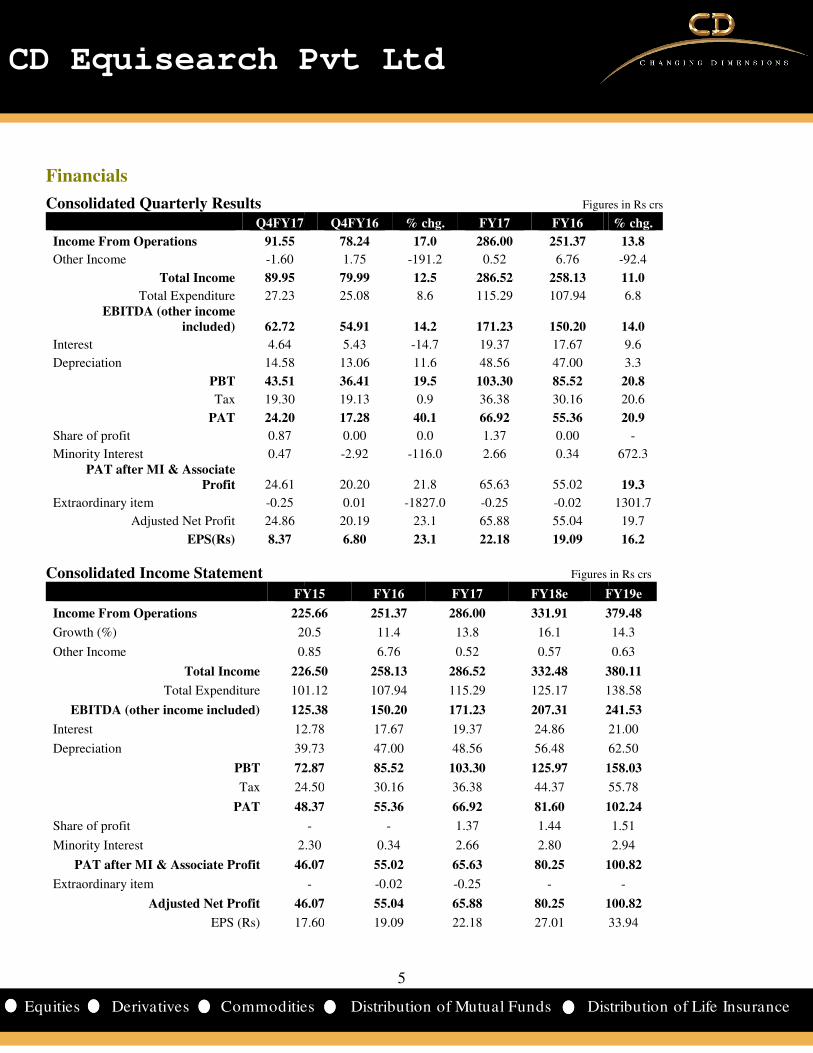
Financials
Consolidated Quarterly Results Q4FY17
Income From Operations 91.55
Other Income -1.60
Total Income 89.95
Total Expenditure 27.23 EBITDA (other income
included) 62.72
Interest 4.64
Depreciation 14.58
PBT 43.51
Tax 19.30
PAT 24.20
Share of profit 0.87
Minority Interest 0.47 PAT after MI & Associate
Profit 24.61
Extraordinary item -0.25
Adjusted Net Profit 24.86
EPS(Rs) 8.37
Consolidated Income Statement
FY15
Income From Operations 225.66
Growth (%) 20.5
Other Income 0.85
Total Income 226.50
Total Expenditure 101.12
EBITDA (other income included) 125.38
Interest 12.78
Depreciation 39.73
PBT 72.87
Tax 24.50
PAT 48.37
Share of profit
Minority Interest 2.30
PAT after MI & Associate Profit 46.07
Extraordinary item
Adjusted Net Profit 46.07
EPS (Rs) 17.60
5
Pvt Ltd
ities Distribution of Mutual Funds Dist
Consolidated Quarterly Results Figures in Rs crs
Q4FY16 % chg. FY17 FY16
78.24 17.0 286.00 251.37
1.75 -191.2 0.52 6.76
79.99 12.5 286.52 258.13
25.08 8.6 115.29 107.94
54.91 14.2 171.23 150.20
5.43 -14.7 19.37 17.67
13.06 11.6 48.56 47.00
36.41 19.5 103.30 85.52
19.13 0.9 36.38 30.16
17.28 40.1 66.92 55.36
0.00 0.0 1.37 0.00
-2.92 -116.0 2.66 0.34
20.20 21.8 65.63 55.02
0.01 -1827.0 -0.25 -0.02
20.19 23.1 65.88 55.04
6.80 23.1 22.18 19.09
Consolidated Income Statement Figures in Rs crs
FY15 FY16 FY17 FY18e FY19e
225.66 251.37 286.00 331.91 379.48
20.5 11.4 13.8 16.1
0.85 6.76 0.52 0.57
226.50 258.13 286.52 332.48 380.11
101.12 107.94 115.29 125.17 138.58
125.38 150.20 171.23 207.31 241.53
12.78 17.67 19.37 24.86
39.73 47.00 48.56 56.48
72.87 85.52 103.30 125.97 158.03
24.50 30.16 36.38 44.37
48.37 55.36 66.92 81.60 102.24
- - 1.37 1.44
2.30 0.34 2.66 2.80
46.07 55.02 65.63 80.25 100.82
- -0.02 -0.25 -
46.07 55.04 65.88 80.25 100.82
17.60 19.09 22.18 27.01
5
Pvt Ltd
istribution of Life Insurance
Figures in Rs crs
% chg.
13.8
-92.4
11.0
6.8
14.0
9.6
3.3
20.8
20.6
20.9
-
672.3
19.3
1301.7
19.7
16.2
Figures in Rs crs
FY19e
379.48
14.3
0.63
380.11
138.58
241.53
21.00
62.50
158.03
55.78
102.24
1.51
2.94
100.82
-
100.82
33.94
CD Equisearch Pvt Ltd
Equities Derivatives Commoditie
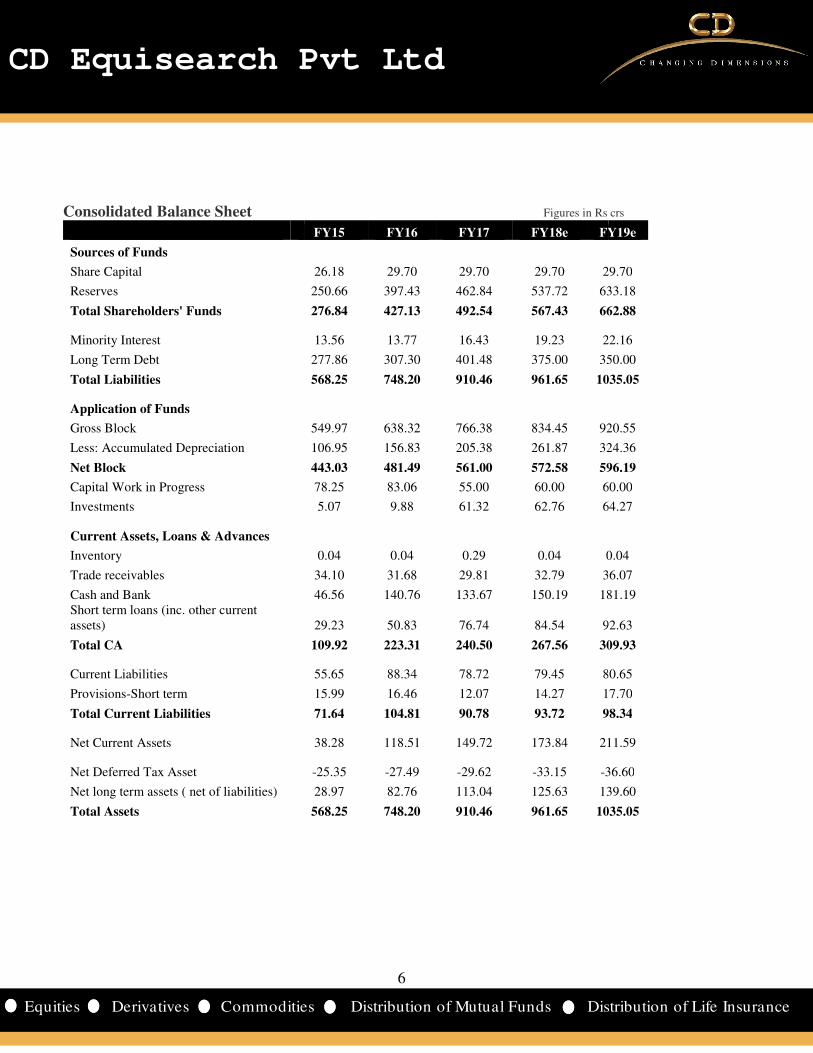
Consolidated Balance Sheet
Sources of Funds
Share Capital
Reserves
Total Shareholders' Funds
Minority Interest
Long Term Debt
Total Liabilities
Application of Funds
Gross Block
Less: Accumulated Depreciation
Net Block
Capital Work in Progress
Investments
Current Assets, Loans & Advances
Inventory
Trade receivables
Cash and Bank Short term loans (inc. other current assets)
Total CA
Current Liabilities
Provisions-Short term
Total Current Liabilities
Net Current Assets
Net Deferred Tax Asset
Net long term assets ( net of liabilities)
Total Assets
6
Pvt Ltd
ities Distribution of Mutual Funds Dist
Figures in Rs crs
FY15 FY16 FY17 FY18e FY19e
26.18 29.70 29.70 29.70 29.70
250.66 397.43 462.84 537.72 633.18
276.84 427.13 492.54 567.43 662.88
13.56 13.77 16.43 19.23 22.16
277.86 307.30 401.48 375.00 350.00
568.25 748.20 910.46 961.65 1035.05
549.97 638.32 766.38 834.45 920.55
106.95 156.83 205.38 261.87 324.36
443.03 481.49 561.00 572.58 596.19
78.25 83.06 55.00 60.00 60.00
5.07 9.88 61.32 62.76 64.27
0.04 0.04 0.29 0.04 0.04
34.10 31.68 29.81 32.79 36.07
46.56 140.76 133.67 150.19 181.19
29.23 50.83 76.74 84.54 92.63
109.92 223.31 240.50 267.56 309.93
55.65 88.34 78.72 79.45 80.65
15.99 16.46 12.07 14.27 17.70
71.64 104.81 90.78 93.72 98.34
38.28 118.51 149.72 173.84 211.59
-25.35 -27.49 -29.62 -33.15 -36.60
28.97 82.76 113.04 125.63 139.60
568.25 748.20 910.46 961.65 1035.05
6
Pvt Ltd
istribution of Life Insurance
Figures in Rs crs
FY19e
29.70
633.18
662.88
22.16
350.00
1035.05
920.55
324.36
596.19
60.00
64.27
0.04
36.07
181.19
92.63
309.93
80.65
17.70
98.34
211.59
36.60
139.60
1035.05
CD Equisearch Pvt Ltd
Equities Derivatives Commoditie
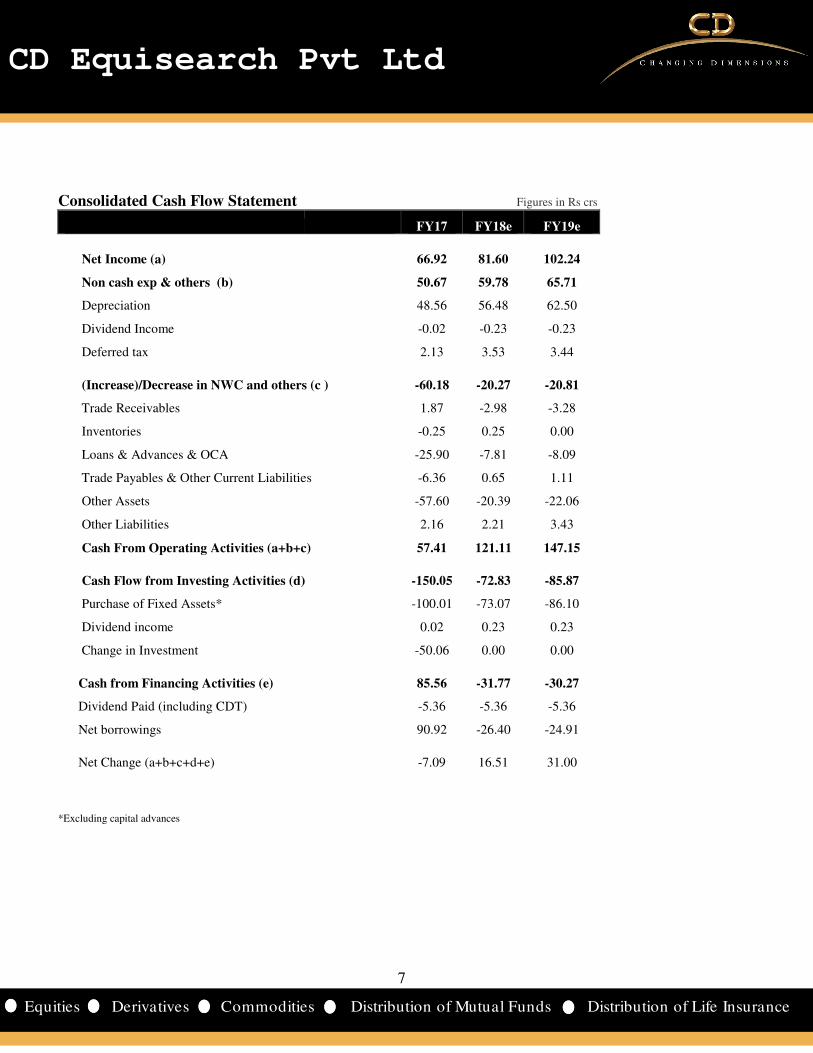
Consolidated Cash Flow Statement
Net Income (a)
Non cash exp & others (b)
Depreciation
Dividend Income
Deferred tax
(Increase)/Decrease in NWC and others (c )
Trade Receivables
Inventories
Loans & Advances & OCA
Trade Payables & Other Current Liabilities
Other Assets
Other Liabilities
Cash From Operating Activities (a+b+c)
Cash Flow from Investing Activities (d)
Purchase of Fixed Assets*
Dividend income
Change in Investment
Cash from Financing Activities (e)
Dividend Paid (including CDT)
Net borrowings
Net Change (a+b+c+d+e)
*Excluding capital advances
7
Pvt Ltd
ities Distribution of Mutual Funds Dist
Consolidated Cash Flow Statement Figures in Rs crs
FY17 FY18e FY19e
66.92 81.60 102.24
50.67 59.78 65.71
48.56 56.48 62.50
-0.02 -0.23 -0.23
2.13 3.53 3.44
(Increase)/Decrease in NWC and others (c ) -60.18 -20.27 -20.81
1.87 -2.98 -3.28
-0.25 0.25 0.00
-25.90 -7.81 -8.09
Trade Payables & Other Current Liabilities -6.36 0.65 1.11
-57.60 -20.39 -22.06
2.16 2.21 3.43
Cash From Operating Activities (a+b+c) 57.41 121.11 147.15
Cash Flow from Investing Activities (d) -150.05 -72.83 -85.87
-100.01 -73.07 -86.10
0.02 0.23 0.23
-50.06 0.00 0.00
85.56 -31.77 -30.27
-5.36 -5.36 -5.36
90.92 -26.40 -24.91
-7.09 16.51 31.00
7
Pvt Ltd
istribution of Life Insurance
CD Equisearch Pvt Ltd
Equities Derivatives Commoditie
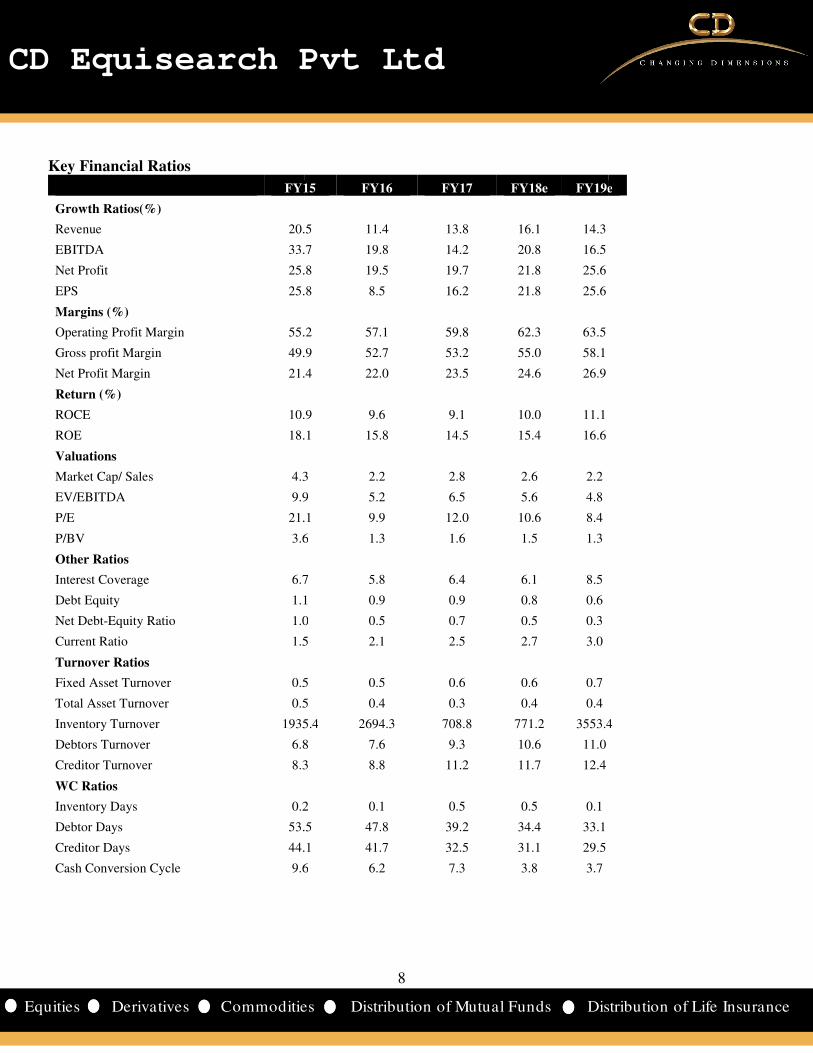
Key Financial Ratios
FY15
Growth Ratios(%)
Revenue 20.5
EBITDA 33.7
Net Profit 25.8
EPS 25.8
Margins (%)
Operating Profit Margin 55.2
Gross profit Margin 49.9
Net Profit Margin 21.4
Return (%)
ROCE 10.9
ROE 18.1
Valuations
Market Cap/ Sales 4.3
EV/EBITDA 9.9
P/E 21.1
P/BV 3.6
Other Ratios
Interest Coverage 6.7
Debt Equity 1.1
Net Debt-Equity Ratio 1.0
Current Ratio 1.5
Turnover Ratios
Fixed Asset Turnover 0.5
Total Asset Turnover 0.5
Inventory Turnover 1935.4
Debtors Turnover 6.8
Creditor Turnover 8.3
WC Ratios
Inventory Days 0.2
Debtor Days 53.5
Creditor Days 44.1
Cash Conversion Cycle 9.6
8
Pvt Ltd
ities Distribution of Mutual Funds Dist
FY15 FY16 FY17 FY18e FY19e
20.5 11.4 13.8 16.1 14.3
33.7 19.8 14.2 20.8 16.5
25.8 19.5 19.7 21.8 25.6
25.8 8.5 16.2 21.8 25.6
55.2 57.1 59.8 62.3 63.5
49.9 52.7 53.2 55.0 58.1
21.4 22.0 23.5 24.6 26.9
10.9 9.6 9.1 10.0 11.1
18.1 15.8 14.5 15.4 16.6
4.3 2.2 2.8 2.6 2.2
9.9 5.2 6.5 5.6 4.8
21.1 9.9 12.0 10.6 8.4
3.6 1.3 1.6 1.5 1.3
6.7 5.8 6.4 6.1 8.5
1.1 0.9 0.9 0.8 0.6
1.0 0.5 0.7 0.5 0.3
1.5 2.1 2.5 2.7 3.0
0.5 0.5 0.6 0.6 0.7
0.5 0.4 0.3 0.4 0.4
1935.4 2694.3 708.8 771.2 3553.4
6.8 7.6 9.3 10.6 11.0
8.3 8.8 11.2 11.7 12.4
0.2 0.1 0.5 0.5 0.1
53.5 47.8 39.2 34.4 33.1
44.1 41.7 32.5 31.1 29.5
9.6 6.2 7.3 3.8 3.7
8
Pvt Ltd
istribution of Life Insurance
FY19e
3553.4
CD Equisearch Pvt Ltd
Equities Derivatives Commoditie
Cumulative Financial Data
FY11
Income from operations
Operating profit
EBIT
PBT
PAT after MI
Dividends
OPM (%)
NPM (%)
Interest coverage
ROE (%)
ROCE (%)
Debt Equity
Fixed asset turnover
Debtors turnover
Inventory turnover
Creditors turnover
Debtor days
Inventory days
Creditor days
Cash conversion
Dividend payout ratio (%)
FY11-13 implies three year period ending fiscal 13
The Indian fitness industry is undergoing a revolution of sorts spiked by rise in disposable income
awareness regarding fitness which augurs well for Talwalkars
opening ~300 gyms from the present count of 211
income from operations by 50.2% in FY17
forward because of fall in debtor days from 40.7 days to 37.2 days. Company’s intention of repaying debt of atleast Rs 100
crs ($15.5m) in the next couple of years should improve its
Talwalkars is taking various measures to reduce operating cost like consolidation of gyms
and reduction in rentals which will boost
improvement in profitability, it would use
boost return on capital.
9
Pvt Ltd
ities Distribution of Mutual Funds Dist
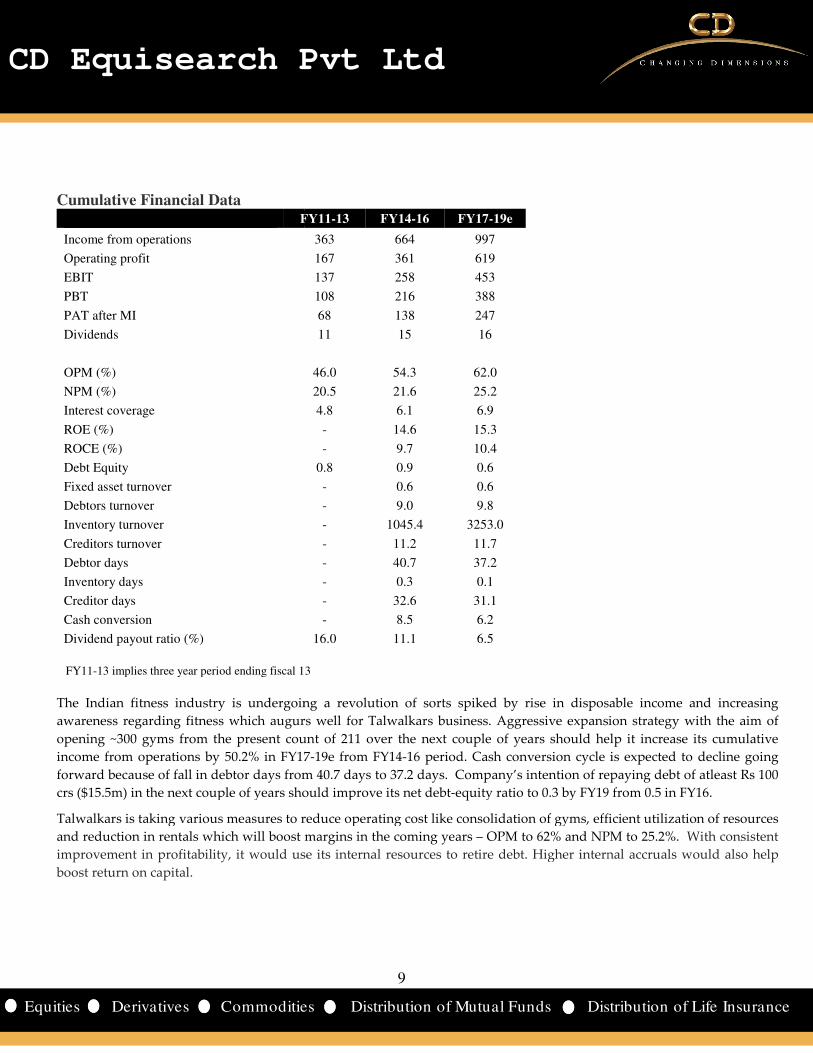
FY11-13 FY14-16 FY17-19e
363 664 997
167 361 619
137 258 453
108 216 388
68 138 247
11 15 16
46.0 54.3 62.0
20.5 21.6 25.2
4.8 6.1 6.9
- 14.6 15.3
- 9.7 10.4
0.8 0.9 0.6
- 0.6 0.6
- 9.0 9.8
- 1045.4 3253.0
- 11.2 11.7
- 40.7 37.2
- 0.3 0.1
- 32.6 31.1
- 8.5 6.2
16.0 11.1 6.5
13 implies three year period ending fiscal 13
The Indian fitness industry is undergoing a revolution of sorts spiked by rise in disposable income
augurs well for Talwalkars business. Aggressive expansion strategy with the aim of
opening ~300 gyms from the present count of 211 over the next couple of years should help
by 50.2% in FY17-19e from FY14-16 period. Cash conversion cycle is expected to
in debtor days from 40.7 days to 37.2 days. Company’s intention of repaying debt of atleast Rs 100
ext couple of years should improve its net debt-equity ratio to 0.3 by FY19 from 0.5 in FY16.
is taking various measures to reduce operating cost like consolidation of gyms, efficient utilization of resources
and reduction in rentals which will boost margins in the coming years – OPM to 62% and NPM to 25.2%
use its internal resources to retire debt. Higher internal accruals would
9
Pvt Ltd
istribution of Life Insurance
The Indian fitness industry is undergoing a revolution of sorts spiked by rise in disposable income and increasing
business. Aggressive expansion strategy with the aim of
should help it increase its cumulative
period. Cash conversion cycle is expected to decline going
in debtor days from 40.7 days to 37.2 days. Company’s intention of repaying debt of atleast Rs 100
uity ratio to 0.3 by FY19 from 0.5 in FY16.
, efficient utilization of resources
to 62% and NPM to 25.2%. With consistent
internal resources to retire debt. Higher internal accruals would also help
CD Equisearch Pvt Ltd
Equities Derivatives Commoditie
Financial Summary- US Dollar denominated million $ FY15
Share capital 4.2
Shareholders' funds 43.7
Total debt 49.4
Net fixed assets (incl. CWIP) 82.7
Investments 0.8
Net Current assets 6.1
Total Assets 90.2 Revenues 36.9
EBITDA 20.5
EBDT 18.4
PBT 11.9
PAT 7.5
EPS($) 0.29
Book value ($) 1.67
Income statement figures translated at average rates; balance sheet All dollar denominated figures are adjusted for extraordinary items.
10
Pvt Ltd
ities Distribution of Mutual Funds Dist
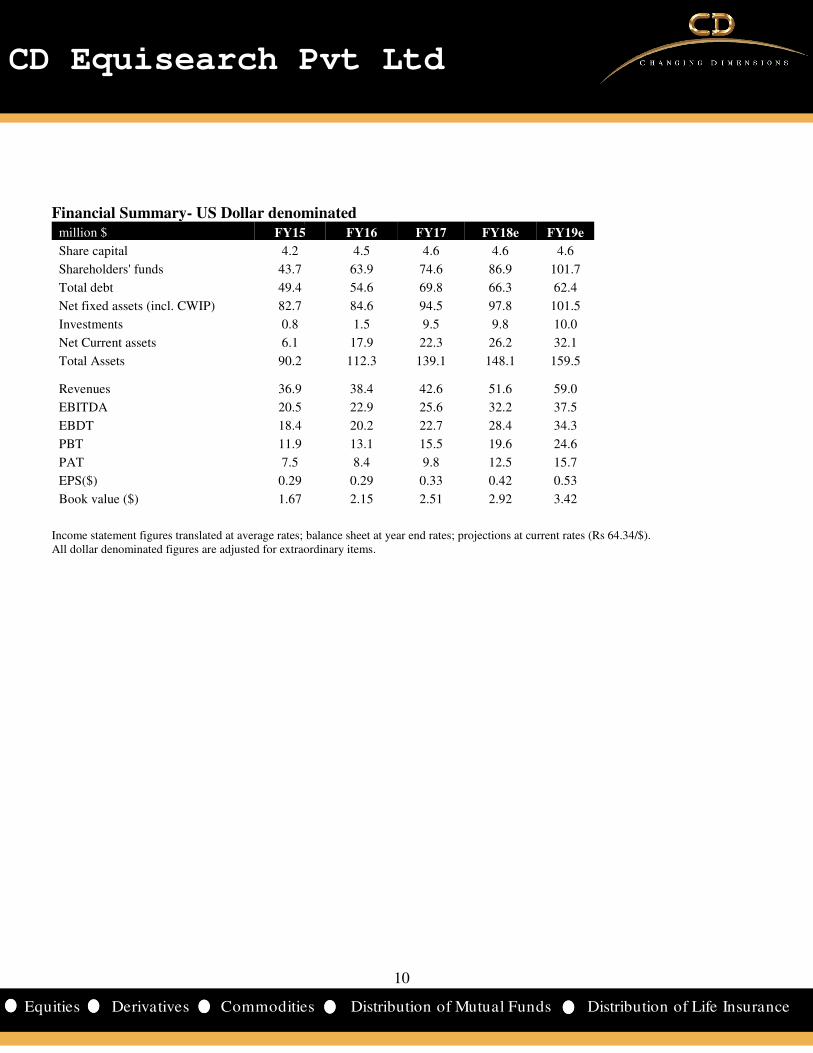
US Dollar denominated FY15 FY16 FY17 FY18e FY19e
4.5 4.6 4.6 4.6
63.9 74.6 86.9 101.7
54.6 69.8 66.3 62.4
84.6 94.5 97.8 101.5
1.5 9.5 9.8 10.0
17.9 22.3 26.2 32.1
112.3 139.1 148.1 159.5
38.4 42.6 51.6 59.0
22.9 25.6 32.2 37.5
20.2 22.7 28.4 34.3
13.1 15.5 19.6 24.6
8.4 9.8 12.5 15.7
0.29 0.33 0.42 0.53
2.15 2.51 2.92 3.42
tes; balance sheet at year end rates; projections at current rates (Rs 64.34/$).ed for extraordinary items.
10
Pvt Ltd
istribution of Life Insurance
; projections at current rates (Rs 64.34/$).
CD Equisearch Pvt Ltd
Equities Derivatives Commoditie
Disclosure & Disclaimer CD Equisearch Private Limited (hereinafter referred to as
Limited, Bombay Stock Exchange Limited and Metropolitan Stock Exchange
Limited). CD Equi is also registered as Depository Participant with CDSL and AMFI registered Mutual Fund Advisor. The associ
CD Equi are engaged in activities relating to NBFC
CD Equi is registered under SEBI (Research Analysts) Regulations, 2014 with SEBI Registration no INH300002274. Further, CD Eq
hereby declares that –
• No disciplinary action has been taken against CD Equ
• CD Equi/its associates/research analysts do not have any financial interest/beneficial interest of more than one percent/mate
conflict of interest in the subject company(s)
• CD Equi/its associates/research analysts have not received any compensation from the subject company(s) during the past
twelve months.
• CD Equi/its research analysts has not served as an officer, director or employee of company covered by analysts and has not
been engaged in market making activity of the company covered by analysts
This document is solely for the personal information of the recipient and must not be singularly used as the basis of any inv
decision. Nothing in this document should be cons
such investigations as they deem necessary to arrive at an independent evaluation of an investment in the securities of the c
referred to in this document (including the merits and risks involved) and should consult their own advisors to determine the merits and
risks of such an investment.
Reports based on technical and derivative analysis center on studying charts of a stock's price movement, outstanding positio
trading volume, as opposed to focusing on a company's fundamentals and as such, may not match with a report on a company's
fundamentals.
The information in this document has been printed on the basis of publicly available information, internal dat
believed to be true but we do not represent that it is accurate or complete and it should not be relied on as such, as this d
general guidance only. CD Equi or any of its affiliates/group companies shall not be in
may arise to any person from any inadvertent error in the information contained in this report. CD Equi has not independently
all the information contained within this document. Accordingly, we cann
implied, to the accuracy, contents or data contained within this document.
While, CD Equi endeavors to update on a reasonable basis the information discussed in this material, there may be re
compliance or other reasons that prevent us from doing so.
This document is being supplied to you solely for your information and its contents, information or data may not be reproduce
redistributed or passed on, directly or indirectly. Neither
damage that may arise from or in connection with the use of this information.
CD Equisearch Private Limited (CIN: U67120WB1995PTC071521)
Registered Office: 37, Shakespeare Sarani, 3rd Floor, Kolkata
10, Vasawani Mansion, 5th Floor, Dinshaw Wachha Road, Churchgate, Mumbai
2283, 2276 Website: www.cdequi.com; Email: [email protected]
buy: >20% accumulate: >10% to ≤20% hold:
Exchange Rates Used- Indicative
Rs/$ FY14 FY15
Average 60.5 61.15
Year end 60.1 62.59
All $ values mentioned in the write-up translated at the average rate of the respective quarter/ year as applicable. Projections converted
at current exchange rate. Cumulative dollar figure is the sum of respective yearly dollar value
11
Pvt Ltd
ities Distribution of Mutual Funds Dist
CD Equisearch Private Limited (hereinafter referred to as ‘CD Equi’) is a Member registered with National Stock Exchange of India
Limited, Bombay Stock Exchange Limited and Metropolitan Stock Exchange of India Limited (Formerly known as MCX Stock Exchange
Limited). CD Equi is also registered as Depository Participant with CDSL and AMFI registered Mutual Fund Advisor. The associ
CD Equi are engaged in activities relating to NBFC-ND - Financing and Investment, Commodity Broking, Real Estate, etc.
CD Equi is registered under SEBI (Research Analysts) Regulations, 2014 with SEBI Registration no INH300002274. Further, CD Eq
No disciplinary action has been taken against CD Equi by any of the regulatory authorities.
CD Equi/its associates/research analysts do not have any financial interest/beneficial interest of more than one percent/mate
conflict of interest in the subject company(s) (kindly disclose if otherwise).
ui/its associates/research analysts have not received any compensation from the subject company(s) during the past
CD Equi/its research analysts has not served as an officer, director or employee of company covered by analysts and has not
en engaged in market making activity of the company covered by analysts.
This document is solely for the personal information of the recipient and must not be singularly used as the basis of any inv
decision. Nothing in this document should be construed as investment or financial advice. Each recipient of this document should make
such investigations as they deem necessary to arrive at an independent evaluation of an investment in the securities of the c
ng the merits and risks involved) and should consult their own advisors to determine the merits and
Reports based on technical and derivative analysis center on studying charts of a stock's price movement, outstanding positio
trading volume, as opposed to focusing on a company's fundamentals and as such, may not match with a report on a company's
The information in this document has been printed on the basis of publicly available information, internal dat
believed to be true but we do not represent that it is accurate or complete and it should not be relied on as such, as this d
general guidance only. CD Equi or any of its affiliates/group companies shall not be in any way responsible for any loss or damage that
may arise to any person from any inadvertent error in the information contained in this report. CD Equi has not independently
all the information contained within this document. Accordingly, we cannot testify nor make any representation or warranty, express or
implied, to the accuracy, contents or data contained within this document.
While, CD Equi endeavors to update on a reasonable basis the information discussed in this material, there may be re
compliance or other reasons that prevent us from doing so.
This document is being supplied to you solely for your information and its contents, information or data may not be reproduce
redistributed or passed on, directly or indirectly. Neither, CD Equi nor its directors, employees or affiliates shall be liable for any loss or
damage that may arise from or in connection with the use of this information.
CD Equisearch Private Limited (CIN: U67120WB1995PTC071521)
Floor, Kolkata – 700 017; Phone: +91(33) 4488 0000; Fax: +91(33) 2289 2557 Corporate Office:
Floor, Dinshaw Wachha Road, Churchgate, Mumbai – 400 020. Phone: +91(22) 2283 0652/0653; Fax: +91(22)
w.cdequi.com; Email: [email protected]
hold: ≥-10% to ≤10% reduce: ≥-20% to <-10% sell:
FY16 FY17
65.46 67.09
66.33 64.84
ed at the average rate of the respective quarter/ year as applicable. Projections converted
at current exchange rate. Cumulative dollar figure is the sum of respective yearly dollar value.
11
Pvt Ltd
istribution of Life Insurance
) is a Member registered with National Stock Exchange of India
of India Limited (Formerly known as MCX Stock Exchange
Limited). CD Equi is also registered as Depository Participant with CDSL and AMFI registered Mutual Fund Advisor. The associates of
d Investment, Commodity Broking, Real Estate, etc.
CD Equi is registered under SEBI (Research Analysts) Regulations, 2014 with SEBI Registration no INH300002274. Further, CD Equi
CD Equi/its associates/research analysts do not have any financial interest/beneficial interest of more than one percent/material
ui/its associates/research analysts have not received any compensation from the subject company(s) during the past
CD Equi/its research analysts has not served as an officer, director or employee of company covered by analysts and has not
This document is solely for the personal information of the recipient and must not be singularly used as the basis of any investment
trued as investment or financial advice. Each recipient of this document should make
such investigations as they deem necessary to arrive at an independent evaluation of an investment in the securities of the companies
ng the merits and risks involved) and should consult their own advisors to determine the merits and
Reports based on technical and derivative analysis center on studying charts of a stock's price movement, outstanding positions and
trading volume, as opposed to focusing on a company's fundamentals and as such, may not match with a report on a company's
The information in this document has been printed on the basis of publicly available information, internal data and other reliable sources
believed to be true but we do not represent that it is accurate or complete and it should not be relied on as such, as this document is for
any way responsible for any loss or damage that
may arise to any person from any inadvertent error in the information contained in this report. CD Equi has not independently verified
ot testify nor make any representation or warranty, express or
While, CD Equi endeavors to update on a reasonable basis the information discussed in this material, there may be regulatory
This document is being supplied to you solely for your information and its contents, information or data may not be reproduced,
, CD Equi nor its directors, employees or affiliates shall be liable for any loss or
700 017; Phone: +91(33) 4488 0000; Fax: +91(33) 2289 2557 Corporate Office:
400 020. Phone: +91(22) 2283 0652/0653; Fax: +91(22)
sell: <-20%
ed at the average rate of the respective quarter/ year as applicable. Projections converted