Embed Size (px)
Citation preview

CD Equisearch Pvt Ltd Apr 13, 2017
Equities Derivatives Commodities Distribution of Mutual Funds Distribution of Life Insurance
.
Jamna Auto Industries Ltd
No. of shares (m) 79.68
Mkt cap (Rs crs/$m) 1742/269.3
Current price (Rs/$) 219/3.4
Price target (Rs/$) 275/4.3
52 W H/L (Rs.) 241/138
Book Value (Rs/$) 39/0.6
Beta 1.4
Daily volume (avg. monthly) 164550
P/BV (FY17e/18e) 5.6/4.5
EV/EBITDA (FY17e/18e) 8.8/7.5
P/E (FY17e/18e) 16.7/14.3
EPS growth (F17e/18e) 43.7/16.4
OPM (FY16/17e/18e) 12.6/14.1/15.2
ROE (FY16/17e/18e) 33.1/37.9/35.1
ROCE(FY16/17e/18e) 32.6/33.7/30.2
D/E ratio (FY16/17e/18e) 0.1/0.3/0.2
BSE Code 520051
NSE Code JAMNAAUTO
Bloomberg JMNA IN
Reuters JMNA.BO
Shareholding pattern %
Promoters 47.9
MFs / Banks / FIs 2.9
FPIs 5.4
Govt. Holding 0.0
Public & others 43.7
Total 100.0
As on Mar 31, 2017
Recommendation
BUY
Analyst
KISHAN GUPTA, CFA, FRM
Phone: + 91 (33) 4488 0043
E- mail: [email protected]
Consolidated (Rs crs)
FY14
FY15
FY16
FY17e
FY18e
Income from operations 833.30 1095.08 1255.80 1317.43 1481.64
Other Income 22.27* 2.01 8.35 21.71 19.72
EBITDA (other income included) 66.68 96.50 164.95 207.82 245.03
Profit after MI & EO items 1.12 30.25 72.56 104.49 121.98
EPS(Rs) 0.14 3.82 9.13 13.12 15.28
EPS growth (%) -96.0 2595.9 139.2 43.7 16.4
*includes Rs 20.25 crs profit on sale of investment in NHK Spring;
Company Brief
Jamna Auto manufactures auto suspension products -parabolic/ tapered leaf
spring, lift axle and air suspension- mainly for OEMs in the CV segment.
Quarterly Highlights
� Swaying fortunes of Indian CV industry, most prominently M&HCV sector,
have decidedly bewildered manufacturers and investors alike for a couple
of years of sturdy growth of M&HCV industry - ~30% in FY16 and 16% in
FY15- was followed by near naught growth last fiscal. After robustly
growing (+14.5%) in Q1, M&HCV industry went wayward in following
quarters, thus taking a toll on Jamna's revenue booking - a mere 3% growth
in revenues in 9MFY17.
� Yet margins have strikingly expanded for last many quarters (bar Q3FY17)
as benefits of cost control and productivity improvements come to fore.
Thence material margins have conspicuously increased from 37.4% in
9MFY16 to 40% now. No less stunning is its market share gains in the last
one year - 72% in Q3 from 66% a year back.
� Thanks to unrivalled growth in other income (Rs 16.63 crs Vs 6.58 crs/$2.5m
Vs $1.0m)) and hefty enlargement in margins, EBITDA rose by over a third
so far this fiscal. Favorable mix of lower interest expense and lower taxes
helped push profit growth to 58.9% in 9MFY17. Higher other income and
lower depreciation expense in last two quarters aided camouflaging near
flat lining / marginal growth in operating profits.
� Besides setting up an assembly plant in Lucknow for Tata Motors, plans are
afoot for a new plant in Indore for Eicher Motors; Jamna's export focused
Hosur plant will start commercial production in Q1. To expand its product
portfolio, it recently unveiled plans to manufacture stabilizer bars which are
used along with parabolic springs.
� The stock currently trades at 16.7x FY17e EPS of Rs 13.12 and 14.3x FY18e
EPS of Rs 15.28. Supported by resurgence in domestic CV industry, Jamna's
spring volumes would grow by sub 10% in FY18. Implementation of GST
would hasten its aftermarket progress. Despite hefty investments in its
Hosur facility, boosting direct exports remains a remote possibility in FY18.
Yet cost control measures coupled with streamlining /up gradation of
existing plants lends temperance to external exigencies. On balance we
retain our buy rating on the stock with revised target of Rs 275 (previous
target: Rs 265) based on 18x FY18e earnings (PEG ratio: ~1), over a period of
6-9 months.
2
2
CD Equisearch Pvt Ltd
Equities Derivatives Commodities Distribution of Mutual Funds Distribution of Life Insurance
Outlook & Recommendation
CV industry
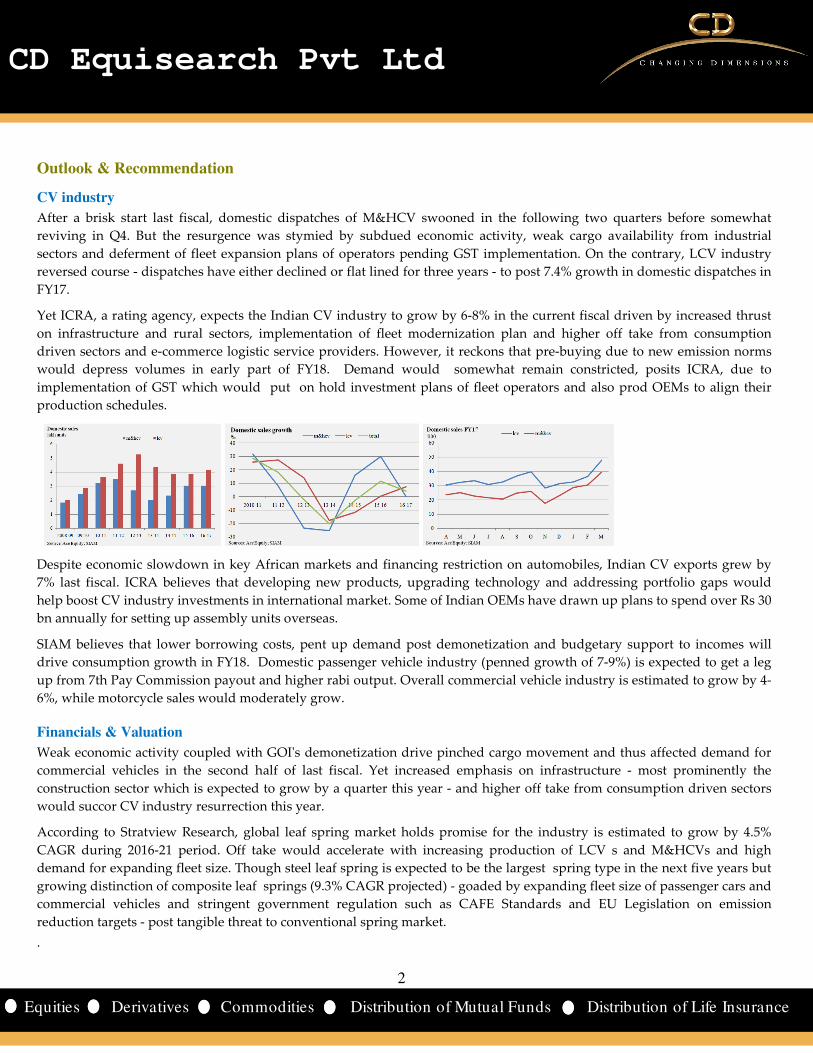
After a brisk start last fiscal, domestic dispatches of M&HCV swooned in the following two quarters before somewhat
reviving in Q4. But the resurgence was stymied by subdued economic activity, weak cargo availability from industrial
sectors and deferment of fleet expansion plans of operators pending GST implementation. On the contrary, LCV industry
reversed course - dispatches have either declined or flat lined for three years - to post 7.4% growth in domestic dispatches in
FY17.
Yet ICRA, a rating agency, expects the Indian CV industry to grow by 6-8% in the current fiscal driven by increased thrust
on infrastructure and rural sectors, implementation of fleet modernization plan and higher off take from consumption
driven sectors and e-commerce logistic service providers. However, it reckons that pre-buying due to new emission norms
would depress volumes in early part of FY18. Demand would somewhat remain constricted, posits ICRA, due to
implementation of GST which would put on hold investment plans of fleet operators and also prod OEMs to align their
production schedules.
Despite economic slowdown in key African markets and financing restriction on automobiles, Indian CV exports grew by
7% last fiscal. ICRA believes that developing new products, upgrading technology and addressing portfolio gaps would
help boost CV industry investments in international market. Some of Indian OEMs have drawn up plans to spend over Rs 30
bn annually for setting up assembly units overseas.
SIAM believes that lower borrowing costs, pent up demand post demonetization and budgetary support to incomes will
drive consumption growth in FY18. Domestic passenger vehicle industry (penned growth of 7-9%) is expected to get a leg
up from 7th Pay Commission payout and higher rabi output. Overall commercial vehicle industry is estimated to grow by 4-
6%, while motorcycle sales would moderately grow.
Financials & Valuation
Weak economic activity coupled with GOI's demonetization drive pinched cargo movement and thus affected demand for
commercial vehicles in the second half of last fiscal. Yet increased emphasis on infrastructure - most prominently the
construction sector which is expected to grow by a quarter this year - and higher off take from consumption driven sectors
would succor CV industry resurrection this year.
According to Stratview Research, global leaf spring market holds promise for the industry is estimated to grow by 4.5%
CAGR during 2016-21 period. Off take would accelerate with increasing production of LCV s and M&HCVs and high
demand for expanding fleet size. Though steel leaf spring is expected to be the largest spring type in the next five years but
growing distinction of composite leaf springs (9.3% CAGR projected) - goaded by expanding fleet size of passenger cars and
commercial vehicles and stringent government regulation such as CAFE Standards and EU Legislation on emission
reduction targets - post tangible threat to conventional spring market.
.

3
3
CD Equisearch Pvt Ltd
Equities Derivatives Commodities Distribution of Mutual Funds Distribution of Life Insurance
[
Jamna's aftermarket progress hit skids in last few quarters not least because of intense competition and India’s
demonetization of high currency notes .Yet roll out of GST this fiscal would undoubtedly underscore the resilience of the
organized market. Its recently announced capital investments would do anything but greatly increase capacities. The
Lucknow plant , for instance, is aimed at meeting Tata Motors demand for having component suppliers next door and the
same holds for the Indore plant (for Eicher Motors). Such tweaks enforced with R&D finesse not only breeds productivity
gains but cements OEM market share.
Remolding extant supplier financing set up - from LC backed to fund based vendor financing - evidently pushed up short
term debt in H1 and also recognition of cash discounts (reflected in other income). Ingrained focus on productivity
improvements, process refinements - refurbishing paint shops; line rebalancing - would help overcome torpidity in CV
cycle through margin enlargement. Still such gains are not limitless and material disengagement with the fortunes of CV
industry is hard to fathom - owing to tumult in domestic CV industry Jamna's volume growth virtually flat lined in 9M.
The stock currently trades at 16.7x FY17e EPS of Rs 13.12 and 14.3x FY18e EPS of Rs 15.28. Margin expansion and
recognition of prodigious cash discounts made up for poor volume growth in FY17 to induce marginal earning upgrades.
Scanty domestic demand for highly efficient parabolic springs and India's murky off take of air suspension products have
failed to cast spell on Jamna's value added product line. Yet working capital efficiencies and inexorable progress on capital
stock up gradation manifests themselves (non-linearly though) in increased market share and covetous return on capital
(ROE in excess of 35%). On balance we retain our buy rating on the stock with revised target of Rs 275 (previous target: Rs
265) based on 18x FY18e earnings (PEG ratio: ~1), over a period of 6-9 months. For more info refer to our Sep report.
4
4
CD Equisearch Pvt Ltd
Equities Derivatives Commodities Distribution of Mutual Funds Distribution of Life Insurance
[
Cross Sectional Analysis
Company Equity* CMP Mcap* Op. inc. Profit* OPM NPM
Int cov. ROE
Mcap / OI P/BV P/E EV/EBITDA
Auto. Axles 15 719 1086 1108 42 9.4 3.8 31.9 12.3 1.0 3.0 25.8 10.2
Jamna Auto 40 219 1742 1282 98 14.4 7.7 15.6 35.6 1.4 5.6 17.7 9.4
WABCO 10 6093 11556 2107 221 15.6 10.5 1515.4 19.8 5.5 9.5 52.4 30.4
*figures in crores; calculations on ttm basis
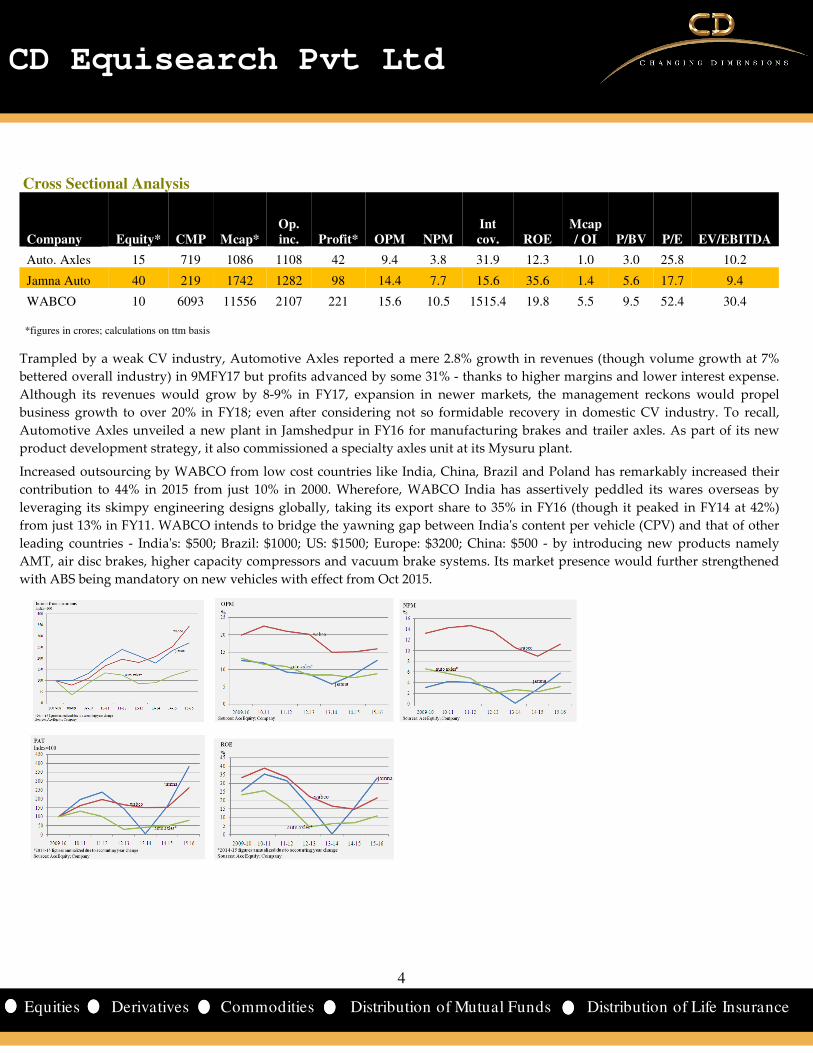
Trampled by a weak CV industry, Automotive Axles reported a mere 2.8% growth in revenues (though volume growth at 7%
bettered overall industry) in 9MFY17 but profits advanced by some 31% - thanks to higher margins and lower interest expense.
Although its revenues would grow by 8-9% in FY17, expansion in newer markets, the management reckons would propel
business growth to over 20% in FY18; even after considering not so formidable recovery in domestic CV industry. To recall,
Automotive Axles unveiled a new plant in Jamshedpur in FY16 for manufacturing brakes and trailer axles. As part of its new
product development strategy, it also commissioned a specialty axles unit at its Mysuru plant.
Increased outsourcing by WABCO from low cost countries like India, China, Brazil and Poland has remarkably increased their
contribution to 44% in 2015 from just 10% in 2000. Wherefore, WABCO India has assertively peddled its wares overseas by
leveraging its skimpy engineering designs globally, taking its export share to 35% in FY16 (though it peaked in FY14 at 42%)
from just 13% in FY11. WABCO intends to bridge the yawning gap between India's content per vehicle (CPV) and that of other
leading countries - India's: $500; Brazil: $1000; US: $1500; Europe: $3200; China: $500 - by introducing new products namely
AMT, air disc brakes, higher capacity compressors and vacuum brake systems. Its market presence would further strengthened
with ABS being mandatory on new vehicles with effect from Oct 2015.
5
5
CD Equisearch Pvt Ltd
Equities Derivatives Commodities Distribution of Mutual Funds Distribution of Life Insurance
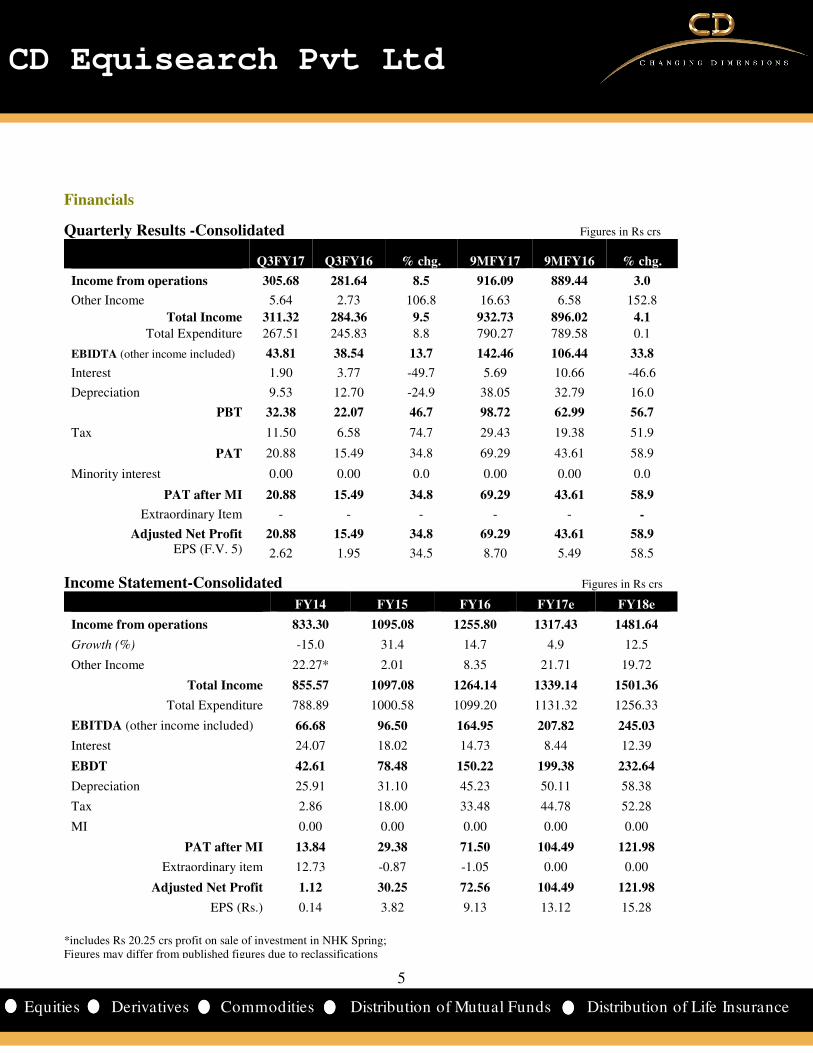
Financials
Quarterly Results -Consolidated Figures in Rs crs
Q3FY17 Q3FY16 % chg. 9MFY17 9MFY16 % chg.
Income from operations 305.68 281.64 8.5 916.09 889.44 3.0
Other Income 5.64 2.73 106.8 16.63 6.58 152.8
Total Income 311.32 284.36 9.5 932.73 896.02 4.1
Total Expenditure 267.51 245.83 8.8 790.27 789.58 0.1
EBIDTA (other income included) 43.81 38.54 13.7 142.46 106.44 33.8
Interest 1.90 3.77 -49.7 5.69 10.66 -46.6
Depreciation 9.53 12.70 -24.9 38.05 32.79 16.0
PBT 32.38 22.07 46.7 98.72 62.99 56.7
Tax 11.50 6.58 74.7 29.43 19.38 51.9
PAT 20.88 15.49 34.8 69.29 43.61 58.9
Minority interest 0.00 0.00 0.0 0.00 0.00 0.0
PAT after MI 20.88 15.49 34.8 69.29 43.61 58.9
Extraordinary Item - - - - - -
Adjusted Net Profit 20.88 15.49 34.8 69.29 43.61 58.9 EPS (F.V. 5) 2.62 1.95 34.5 8.70 5.49 58.5
Income Statement-Consolidated Figures in Rs crs
FY14 FY15 FY16 FY17e FY18e
Income from operations 833.30 1095.08 1255.80 1317.43 1481.64
Growth (%) -15.0 31.4 14.7 4.9 12.5
Other Income 22.27* 2.01 8.35 21.71 19.72
Total Income 855.57 1097.08 1264.14 1339.14 1501.36
Total Expenditure 788.89 1000.58 1099.20 1131.32 1256.33
EBITDA (other income included) 66.68 96.50 164.95 207.82 245.03
Interest 24.07 18.02 14.73 8.44 12.39
EBDT 42.61 78.48 150.22 199.38 232.64
Depreciation 25.91 31.10 45.23 50.11 58.38
Tax 2.86 18.00 33.48 44.78 52.28
MI 0.00 0.00 0.00 0.00 0.00
PAT after MI 13.84 29.38 71.50 104.49 121.98
Extraordinary item 12.73 -0.87 -1.05 0.00 0.00
Adjusted Net Profit 1.12 30.25 72.56 104.49 121.98
EPS (Rs.) 0.14 3.82 9.13 13.12 15.28
*includes Rs 20.25 crs profit on sale of investment in NHK Spring; Figures may differ from published figures due to reclassifications
6
6
CD Equisearch Pvt Ltd
Equities Derivatives Commodities Distribution of Mutual Funds Distribution of Life Insurance
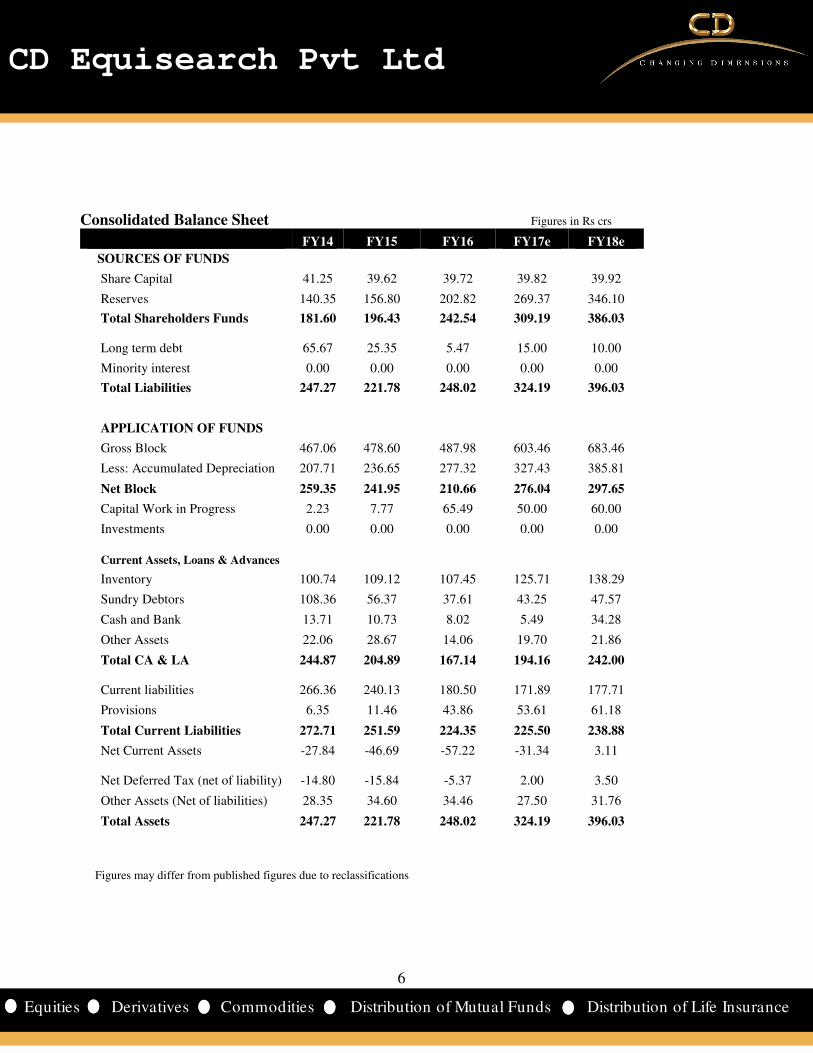
Consolidated Balance Sheet Figures in Rs crs
FY14 FY15 FY16 FY17e FY18e
SOURCES OF FUNDS
Share Capital 41.25 39.62 39.72 39.82 39.92
Reserves 140.35 156.80 202.82 269.37 346.10
Total Shareholders Funds 181.60 196.43 242.54 309.19 386.03
Long term debt 65.67 25.35 5.47 15.00 10.00
Minority interest 0.00 0.00 0.00 0.00 0.00
Total Liabilities 247.27 221.78 248.02 324.19 396.03
APPLICATION OF FUNDS
Gross Block 467.06 478.60 487.98 603.46 683.46
Less: Accumulated Depreciation 207.71 236.65 277.32 327.43 385.81
Net Block 259.35 241.95 210.66 276.04 297.65
Capital Work in Progress 2.23 7.77 65.49 50.00 60.00
Investments 0.00 0.00 0.00 0.00 0.00
Current Assets, Loans & Advances
Inventory 100.74 109.12 107.45 125.71 138.29
Sundry Debtors 108.36 56.37 37.61 43.25 47.57
Cash and Bank 13.71 10.73 8.02 5.49 34.28
Other Assets 22.06 28.67 14.06 19.70 21.86
Total CA & LA 244.87 204.89 167.14 194.16 242.00
Current liabilities 266.36 240.13 180.50 171.89 177.71
Provisions 6.35 11.46 43.86 53.61 61.18
Total Current Liabilities 272.71 251.59 224.35 225.50 238.88
Net Current Assets -27.84 -46.69 -57.22 -31.34 3.11
Net Deferred Tax (net of liability) -14.80 -15.84 -5.37 2.00 3.50
Other Assets (Net of liabilities) 28.35 34.60 34.46 27.50 31.76
Total Assets 247.27 221.78 248.02 324.19 396.03
Figures may differ from published figures due to reclassifications

7
7
CD Equisearch Pvt Ltd
Equities Derivatives Commodities Distribution of Mutual Funds Distribution of Life Insurance
Cash Flow Statement Figures in Rs crs
FY14 FY15 FY16 FY17e FY18e
Net Income (a) 13.84 29.38 71.50 104.49 121.98
Non cash exp. & others (b) 8.54 33.79 37.62 42.52 55.27
Depreciation 26.30 31.10 45.23 50.11 58.38
Interest income -0.60 -0.24 -0.39 -0.22 -1.62
Profit on sale of inv -20.25 0.00 0.00 0.00 0.00
Deferred tax 0.00 2.51 -10.47 -7.37 -1.50
Others 2.49 0.42 3.24 - -
(Inc.) / dec. in WC & others (c) 8.17 23.22 21.61 -95.18 -17.24
Inventory 30.91 -8.38 1.67 -18.27 -12.57
Debtors -3.22 51.59 18.59 -5.64 -4.32
Other assets (net of liabilities) -19.52 -19.99 1.35 -71.27 -0.35
Operating cash flow (a+b+c) 30.56 86.39 130.73 51.83 160.01
Capex -6.70 -23.15 -68.14 -100.01 -90.00
Investments 25.50 - - - -
Interest income 0.70 0.19 0.40 0.22 1.62
Others 5.41 1.08 -6.97 0.28 -26.38
Investing cash flow (d) 24.22 -22.08 -75.11 -99.73 -116.38
Net borrowings -40.91 -61.00 -48.51 71.24 -5.00
Dividends -9.59 -4.66 -10.70 -26.30 -38.34
Redemption of preference shares -1.75 -1.75 - - -
Proceeds from share issuance 0.02 0.66 0.91 0.49 0.50
Financing cash flow (e) -52.23 -66.76 -58.30 45.43 -42.84
Net change (a+b+c+d+e) 2.54 -2.45 -2.68 -2.47 0.79
Figures may differ from published figures due to reclassifications

8
8
CD Equisearch Pvt Ltd
Equities Derivatives Commodities Distribution of Mutual Funds Distribution of Life Insurance
Key Financial Ratios
FY14 FY15 FY16 FY17e FY18e
Growth Ratios
Revenue (%) -15.0 31.4 14.7 4.9 12.5
EBIDTA (%) -42.3 90.2 72.4 24.8 17.9
Net Profit (%) -96.0 2604.0 139.9 44.0 16.7
EPS (%) -96.0 2595.9 139.2 43.7 16.4
Margins
Operating Profit Margin (%) 5.9 8.6 12.6 14.1 15.2
Gross Profit Margin (%) 3.2 7.2 12.1 15.1 15.7
Net Profit Margin (%) 0.1 2.8 5.8 7.9 8.2
Return
ROCE (%) 6.1 14.9 32.6 33.7 30.2
RONW (%) 0.4 16.0 33.1 37.9 35.1
Valuations
Market Cap / OI 0.3 0.9 0.9 1.3 1.2
EV/EBIDTA 7.8 10.6 6.7 8.8 7.5
P/E 251.6 31.8 15.2 16.7 14.3
P/BV 1.6 4.9 4.5 5.6 4.5
Other Ratios
Interest Coverage 1.0 3.6 8.2 18.7 15.1
Debt-Equity Ratio 0.7 0.3 0.1 0.3 0.2
Current Ratio 0.9 0.8 0.7 0.9 1.0
Turnover Ratios
Fixed Asset Turnover 3.2 4.4 5.5 5.4 5.2
Total Asset Turnover 3.6 4.7 5.3 4.6 4.1
Debtors Turnover 7.7 13.3 26.7 32.6 32.6
Inventory Turnover 6.8 9.5 10.1 9.7 9.5
Creditors Turnover 3.8 5.4 6.5 9.2 13.6
WC Ratios
Debtor Days 47.1 27.5 13.7 11.2 11.2
Inventory Days 54.1 38.3 36.0 37.6 38.3
Creditor Days 95.2 68.2 56.4 39.7 26.9
Cash Conversion Cycle 6.0 -2.5 -6.7 9.1 22.7
Cash Flows (Rs crs)
Operating Cash Flow 30.6 86.4 130.7 51.8 160.0
FCFF 68.4 73.7 73.5 -42.1 80.3
FCFE 8.2 1.0 14.7 23.3 66.6

9
9
CD Equisearch Pvt Ltd
Equities Derivatives Commodities Distribution of Mutual Funds Distribution of Life Insurance
Cumulative Financial Data
Figures in Rs crs FY10-12 FY13-15 FY16-18e
Income from operations 2636 2909 4055
Operating profit 289 229 570
EBIT 201 149 466
PBT 135 80 430
PAT 102 59 299
Dividends 26 24 110
OPM (%) 10.9 7.9 14.0
NPM (%) 3.9 2.0 7.4
Interest coverage 3.0 2.2 13.1
ROE (%) 30.4 11.1 34.2
ROCE (%) 17.9 12.6 29.8
Debt-equity ratio* 1.2 0.3 0.2
Fixed asset turnover 6.2 4.5 5.0
Debtors turnover 9.3 10.5 26.0
Inventory turnover 7.8 7.3 9.4
Creditors turnover 4.5 4.2 8.4
Debtors days 39.1 34.9 14.0
Inventory days 46.9 50.2 38.9
Creditor days 80.8 86.1 43.6
Cash conversion cycle 5.1 -1.1 9.3
Dividend payout ratio (%) 27.6 34.8 37.0
FY10-12 implies three years ending fiscal 12; *as on terminal year;
Relentless focus on cost reduction and diversification of its product portfolio in last few years not only helped dodge
vicious cyclicality of the CV industry but also buttress margins. Productivity improvements helped too. After a dreadful
fall in margins in FY14 - precipitated by higher raw material costs and rationalization of obsolete inventory - margins
have phenomenally expanded. Wherefore cumulative operating profit in FY16-18e period is estimated to grow two and a
half times (see chart) and PAT over 5x - NPMs 7.4% in FY16-18 period Vs 2% in FY13-15.
Yet obscurely subverting dependence on CV industry would not be devoid of risks. Taking cue from terrible domestic
dispatches of commercial vehicles (down over 20% in FY14), revenues plunged by 15% that fiscal. Of late, visible signs of
stress in the CV industry have impacted Jamna's revenue booking - down 13.4% in Q2FY17. Still miraculous growth in
profits would reverse course of dramatic shriveling of return on capital - ROE to resuscitate to 34.2% in FY16-18 and
ROCE to nearly 30% (see table). Prodigious debt retirement in last few years has undoubtedly waxed interest coverage
ratios. Largely owing to faster repayment cycle, cash conversion cycle would marginally increase to 9.3 days (see table) in
ensuing years.

10
10
CD Equisearch Pvt Ltd
Equities Derivatives Commodities Distribution of Mutual Funds Distribution of Life Insurance
Financial Summary – US dollar denominated
million $ FY14 FY15 FY16 FY17e FY18e
Equity capital 6.6 6.3 6.0 6.1 6.2
Equity shareholders funds 29.9 31.4 36.6 47.7 59.7
Total debt 20.8 10.3 2.4 13.4 12.7
Net fixed assets (incl CWIP) 43.5 39.9 41.6 50.3 55.3
Investments 0.0 0.0 0.0 0.0 0.0
Net current assets -4.6 -7.5 -8.6 -4.8 0.5
Total assets 41.1 35.4 37.4 50.0 61.2 Revenues 137.7 179.1 191.8 196.4 229.0
EBITDA 8.4 15.8 25.4 31.0 37.9
EBDT 4.4 12.8 23.2 29.7 36.0
PBT 0.1 7.8 16.3 22.3 26.9
Profit after MI 0.2 4.9 11.1 15.6 18.9
EPS($) 0.00 0.06 0.14 0.20 0.24
Book value ($) 0.38 0.40 0.46 0.60 0.75
Operating cash flow 5.1 13.8 19.7 8.0 24.7
Investing cash flow 4.0 -3.5 -11.3 -15.4 -18.0
Financing cash flow -8.7 -10.7 -8.8 7.0 -6.6
income statement figures translated at average rates; balance sheet and cash flow at year end rates; projections at current rates(Rs 64.69/$). All dollar denominated figures are adjusted for extraordinary items.

11
11
CD Equisearch Pvt Ltd
Equities Derivatives Commodities Distribution of Mutual Funds Distribution of Life Insurance
Disclosure& Disclaimer CD Equisearch Private Limited (hereinafter referred to as ‘CD Equi’) is a Member registered with National Stock Exchange of India Limited,
Bombay Stock Exchange Limited and Metropolitan Stock Exchange of India Limited (Formerly known as MCX Stock Exchange Limited). CD
Equi is also registered as Depository Participant with CDSL and AMFI registered Mutual Fund Advisor. The associates of CD Equi are engaged
in activities relating to NBFC-ND - Financing and Investment, Commodity Broking, Real Estate, etc.
CD Equi is registered under SEBI (Research Analysts) Regulations, 2014 with SEBI Registration no INH300002274. Further, CD Equi hereby
declares that –
• No disciplinary action has been taken against CD Equi by any of the regulatory authorities.
• CD Equi/its associates/research analysts do not have any financial interest/beneficial interest of more than one percent/material conflict
of interest in the subject company(s) (kindly disclose if otherwise).
• CD Equi/its associates/research analysts have not received any compensation from the subject company(s) during the past twelve
months.
• CD Equi/its research analysts has not served as an officer, director or employee of company covered by analysts and has not been
engaged in market making activity of the company covered by analysts.
This document is solely for the personal information of the recipient and must not be singularly used as the basis of any investment decision.
Nothing in this document should be construed as investment or financial advice. Each recipient of this document should make such
investigations as they deem necessary to arrive at an independent evaluation of an investment in the securities of the companies referred to in
this document (including the merits and risks involved) and should consult their own advisors to determine the merits and risks of such an
investment.
Reports based on technical and derivative analysis center on studying charts of a stock's price movement, outstanding positions and trading
volume, as opposed to focusing on a company's fundamentals and as such, may not match with a report on a company's fundamentals.
The information in this document has been printed on the basis of publicly available information, internal data and other reliable sources
believed to be true but we do not represent that it is accurate or complete and it should not be relied on as such, as this document is for general
guidance only. CD Equi or any of its affiliates/group companies shall not be in any way responsible for any loss or damage that may arise to any
person from any inadvertent error in the information contained in this report. CD Equi has not independently verified all the information
contained within this document. Accordingly, we cannot testify nor make any representation or warranty, express or implied, to the accuracy,
contents or data contained within this document.
While, CD Equi endeavors to update on a reasonable basis the information discussed in this material, there may be regulatory compliance or
other reasons that prevent us from doing so.
This document is being supplied to you solely for your information and its contents, information or data may not be reproduced, redistributed or
passed on, directly or indirectly. Neither, CD Equi nor its directors, employees or affiliates shall be liable for any loss or damage that may arise
from or in connection with the use of this information.
CD Equisearch Private Limited (CIN: U67120WB1995PTC071521)
Registered Office: 37, Shakespeare Sarani, 3rd Floor, Kolkata – 700 017; Phone: +91(33) 4488 0000; Fax: +91(33) 2289 2557 Corporate Office: 10,
Vasawani Mansion, 5th Floor, Dinshaw Wachha Road, Churchgate, Mumbai – 400 020. Phone: +91(22) 2283 0652/0653; Fax: +91(22) 2283, 2276
Website: www.cdequi.com; Email: [email protected]
buy: >20% accumulate: >10% to ≤20% hold: ≥-10% to ≤10% reduce: ≥-20% to <-10% sell: <-20%
Exchange Rates Used- Indicative
Rs/$ FY14 FY15 FY16 FY17
Average 60.5 61.15 65.46 67.09
Year end 60.1 62.59 66.33 64.84
All $ values mentioned in the write-up translated at the average rate of the respective quarter/ year as applicable. Projections converted at current
exchange rate. Cumulative dollar figure is the sum of respective yearly dollar value.