Embed Size (px)
Citation preview
CDA: an interactive program for the comparative analysis of crystal structure coordinate data Michael Elder, Pella Machin and Stephen E Hull*
Daresbury Laboratory, Science and Engineering Research Council, Daresbury, Warrington, WA4 4AD, UK * Department of Chemistry, University of Manchester, Manchester, Ml3 OPL, UK
A new computer program, CDA (crystal data analyser), is described. It has been developed as a tool for the interactive comparison of sets of atomic coordinates from crystal structure analyses. The program is written in Fortran 77 and exploits the interactive graphics facilities offered by the PERQ single-user mini- computer. It takes sets of atomic coordinates from the Cambridge Structural Database and allows the user to match these against a specified query structure and to tabulate a wide range of geometrical parameters for comparative purposes. There are facilities provided which make it possible to augment the standard retrieval facilities available with the database by imposing struc- tural constraints which enable searches to be performed on the stereochemistry of molecules. Accuracy con- straints may also be imposed. The input database struc- tures may be displayed and manipulated as structural diagrams. The tables of parameters which are produced by matching database structures against the query struc- ture subject to the constraints may be analysed inter- actively and displayed as scatter plots so that structural trends may be investigated.
Keywords: Crystal Data Analyser, Fortran 77, data structure
received 27 December 1983, revised 8 May 1984
The value of the Cambridge Structural Database (CSD)’ as a source of structural and chemical informa- tion on organic molecules is well recognized2,3. This database contains over 30 000 sets of atomic coordi- nates for organo-carbon crystal structures together with bibliographic and chemical connectivity data which provide a basis for powerful procedures for searching the files and retrieving structures for analysis. The applications for which the database has been used are varied and are constantly growing. They include the calculation of average geometry for commonly occur- ring structures or fragments4 such as the production of standard coordinates for nucleic acid base residue$, studies of trends in molecular geometry6 leading to a conformational analysis of geometry changes as in the study of ,R-1’-aminofuranoside fragments7 and the analysis of structural variance8 exemplified by a recent study of monosubstituted benzene rings’.
CSD provides the raw material for these analyses in a convenient and computer-readable form that removes the necessity for elaborate literature searches and with the valuable additional security of the knowledge that the Cambridge Crystallographic Data Centre has per- formed comprehensive checking of the abstracted data. Two further tools are required: a flexible retrieval sys- tem for extracting desired subsets from the complete database and a geometry-analysing program with appropriate features for screening structures?. Retrieval systems pose no problem. The CSD is dis- patched to affiliated centres with search software which runs in batch mode’. Feldmann” developed a fully interactive system which is now the basis of the Chemi- cal Information System (CIS) in the USA and the crys- tal structure search retrieval (CSSR) component of the Chemical Databank System in the UK” and there are a number of other powerful retrieval systems available. Any one of these systems can be used to extract a par- ticular set of structures which exhibit some common structural feature from the full database using the CSD chemical connectivity information combined perhaps with searches on compound names and formulae. These searches can be augmented by screening on, for example, the year of publication or one of the accuracy or error flags. Finally, the 3D atom coordinates can be obtained for those structures for which full data are published.
The subsequent structure analysis step is less easy. Most crystallographic program packages have excellent facilities for calculating geometry for one structure but are difficult to adapt for studying a series of structures. The program GEOM78, which is part of the software supplied with CSD, is well suited to this problem and its use has been described by Murray-Rust and Mother- we11627. This program works in batch mode and has powerful facilities for the systematic correlation of geometrical data from a series of structures in a user- defined framework.
We believe that this sort of comparative analysis should be performed interactively if possible. As is the case with the search and retrieval programs, an inter- active mode of working allows the user to explore the limitations of the available data, whilst formulating a good strategy for testing hypotheses and producing dis- plays which best illustrate the conclusions which are to be drawn from the analysis. Interaction is particularly valuable when it is necessary to design screens to act on
70 0263-7855/84/030070-09 $03.00 @ 1984 Butterworth & Co (Publishers) Ltd Journal of Molecular Graphics
the stereochemistry of molecules in addition to prelimi- nary topological screens. The analysis of scatter plots will usually require the identification of outliers and a study of displays of the corresponding structures in a variety of orientations, probably followed by further screening on structural grounds, or on accuracy flags. Once again, an interactive program can greatly reduce the time spent on this and can provide a fittingly power- ful conclusion to a process which is so greatly facilitated by the availability of the CSD.
GENERAL DESCRIPTION
The program described in this paper has been designed as a tool to aid the structural chemist or crystallo- grapher in the comparative analysis of a set of crystal structure results. It is fully interactive and it is possible to use the program to produce a table or scatter plot of selected structural parameters from a range of crystal structures containing some common features in a few minutes. It follows therefore that the table or plot can be modified equally quickly, and the program contains facilities that allow structures to be screened on the basis of their structural details. The program can thus be used to calculate average geometries for molecular fragments and to investigate geometrical trends across a range of structures. Hypotheses about the correlation between parameters may be quickly tested.
The program is written for, and at the moment is specific to, the PERQ single-user minicomputer. Since this machine is fairly new, a brief description of its properties is appropriate. It is one of a number of new small computers which provide scientific work-station facilities in an office or desk-top environment. It has a 1 Mbyte main memory and a large 32-bit virtual address space. There is a 24 Mbyte Winchester disk and a high quality bit-mapped A4 paper size black-and- white phosphor screen with 768 x 1024 point resolu- tion. A tablet with a three-button puck provides interaction with the screen. The facilities provided by this computer make it well suited to this particular interactive application. It is straightforward to transfer datasets to the PERQ, via an RS232 interface, from the computer network which links with the DEC-10 com- puter holding the full CSD and the CSSR retrieval sys- tem. The screen provides a fast and flexible technique for presenting to the user a variety of diagrams and tables which, for efficient usage, often require simul- taneous display. The pad and puck allow rapid inter- action with the screen which means that the program- mer can escape from the need for a complex command input language and instead present the user with a simple menu-driven interface which takes maximum advantage of the ability to point at the screen via the puck.
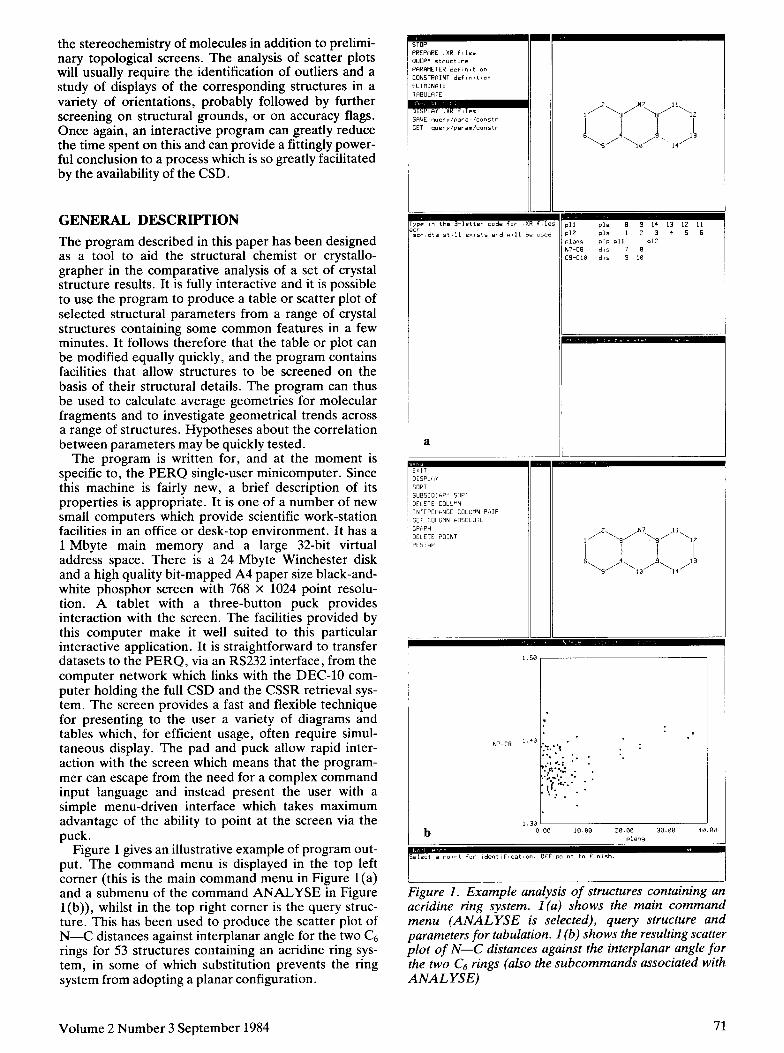
Figure 1 gives an illustrative example of program out- put. The command menu is displayed in the top left corner (this is the main command menu in Figure l(a) and a submenu of the command ANALYSE in Figure l(b)), whilst in the top right corner is the query struc- ture. This has been used to produce the scatter plot of N-C distances against interplanar angle for the two C6 rings for 53 structures containing an acridine ring sys- tem, in some of which substitution prevents the ring system from adopting a planar configuration.
Volume 2 Number 3 September 1984
a
N’-to 1.40 ._ . . . . . . . ! .-: . *. . . .
.- . *:-; 2.: _ . :.$I.. *.
. \I.*=*‘. : . * : .
iggure 1. Example analysis of structures containing an acridine ring system. 1 (a) shows the main command menu (ANALYSE is selected), query structure and parameters for tabulation. 1 (b) shows the resulting scatter plot of N-C distances against the interplanar angle for the two C6 rings (also the subcommands associated with ANALYSE)
71
In the sections which follow, the principal commands of the main menu are described in more detail. The commands which are not described are less important and are associated with the preparation of structure data files for analysis and with saving and restoring data which have been input by the user and are required for subsequent sessions.
QUERY STRUCTURE DEFINITION
The first step in communication between the user and the program is the specification by the user of a connec- tion table which represents the query structure: the molecule or molecular fragment which is the subject of the analysis. A connection table is simply a table with one line for each atom in the query structure specifying its atom type and the other atoms in the table to which this atom is connected. Tables such as these are stan- dard for software which manipulates chemical struc- tures”. It should be noted that whereas it is usual to label each connection between atoms with a bond type (single, double, aromatic, . . .) this is not appropriate here. In structures derived from diffraction experi- ments there is no explicit statement of bond type (or, indeed, of whether or not atoms are bonded) and thus there is no reason to specify bond type in the query structure which will be used to match against database structures.
Connection tables are convenient representations for computer manipulation but they are much less easily handled by the chemist than conventional structural diagrams. Thus the user must be supplied with a con- venient method for entering a connection table into the computer and for displaying it once it is there. The dis- play of a general connection table in conventional structural diagram form is not an easy problem. How- ever, it is algorithmically feasible to derive from a con- nection table a set of 20 coordinates that will produce an adequate structural representation when plotted on a screen. The program we use for this is REWARD, written by one of us’*, and examples of its output can be seen in the query structure windows in the top right of each of the figures. This program produces coordi- nates such that bonded atoms are all at similar distances from each other, non-bonded contacts are longer and the superposition of atoms and bonds is avoided where possible.
There are a number of techniques for the entry of connection tables into computers, most of them depen- dent to a certain extent on the hardware that is used. We have found it convenient to use the bit pad and the three button puck which come with the PERQ, com- bined with a menu-driven input technique. The connec- tion table is built up in a step-wise fashion as the user selects commands from the menu using the puck. There is no keyboard interaction. A structural diagram is plotted automatically after each step so that the user may easily monitor progress and correct any errors as they occur. The command menu is a modified version of the command language at present used in the CSSR program.
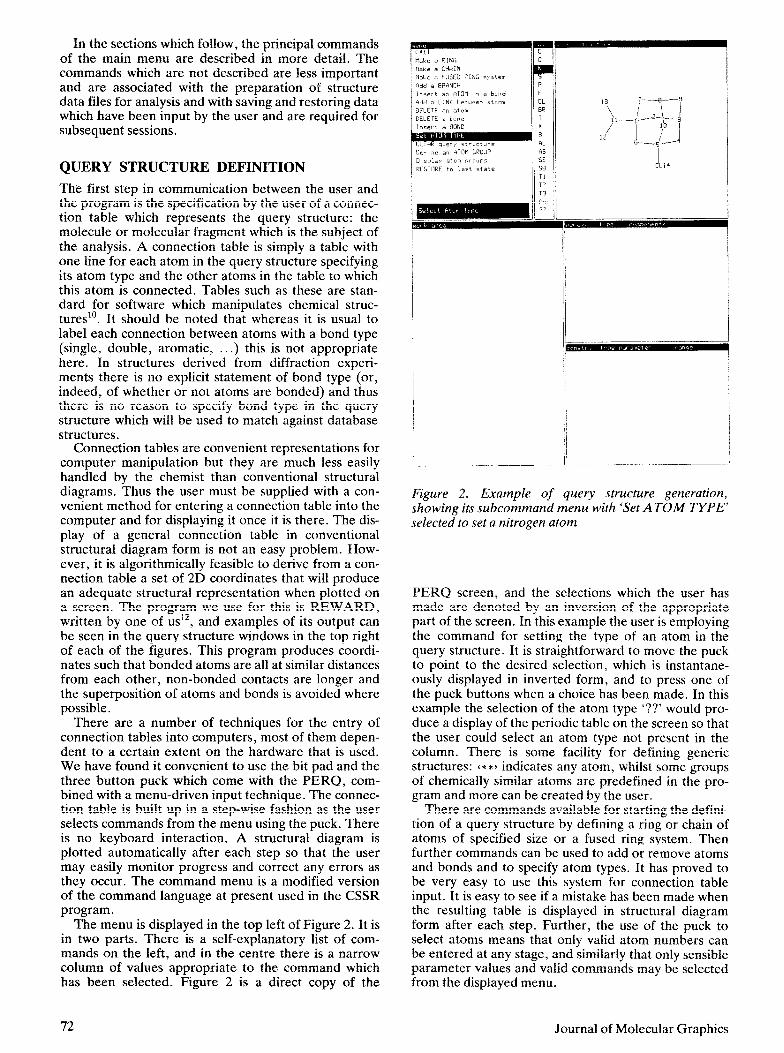
The menu is displayed in the top left of Figure 2. It is in two parts. There is a self-explanatory list of com- mands on the left, and in the centre there is a narrow column of values appropriate to the command which has been selected. Figure 2 is a direct copy of the
I __ _. ______. -. .._-. -.. -~
Figure 2. Example of query structure generation, showing its subcommand menu with ‘Set ATOM TYPE’ selected to set a nitrogen atom
PERQ screen, and the selections which the user has made are denoted by an inversion of the appropriate part of the screen. In this example the user is employing the command for setting the type of an atom in the query structure. It is straightforward to move the puck to point to the desired selection, which is instantane- ously displayed in inverted form, and to press one of the puck buttons when a choice has been made. In this example the selection of the atom type ‘??’ would pro- duce a display of the periodic table on the screen so that the user could select an atom type not present in the column. There is some facility for defining generic structures: i**) indicates any atom, whilst some groups of chemically similar atoms are predefined in the pro- gram and more can be created by the user.
There are commands available for starting the defini- tion of a query structure by defining a ring or chain of atoms of specified size or a fused ring system. Then further commands can be used to add or remove atoms and bonds and to specify atom types. It has proved to be very easy to use this system for connection table input. It is easy to see if a mistake has been made when the resulting table is displayed in structural diagram form after each step. Further, the use of the puck to select atoms means that only valid atom numbers can be entered at any stage, and similarly that only sensible parameter values and valid commands may be selected from the displayed menu.
72 Journal of Molecular Graphics
STRUCTURAL PARAMETERS
Structural parameters are defined with respect to the query structure atoms. Each parameter represents a function, such as bond distance, of the 30 coordinates of the database structures. Parameters are defined for two reasons: they define the structural features which the user desires to tabulate when a series of related structures is analysed; they provide the basis for the imposition of constraints upon geometry which can be used for screening purposes. Structural constraints are discussed in the next section. Implicit in the definition of structural parameters in terms of query structure atoms is the understanding that this query structure will subsequently be matched against a succession of database structures. Each successfuf match wit1 lead to a one-to-one relationship between query structure atoms and database structure atoms and hence allow the appropriate function of the 3D coordinates to be evaluated for the parameter.
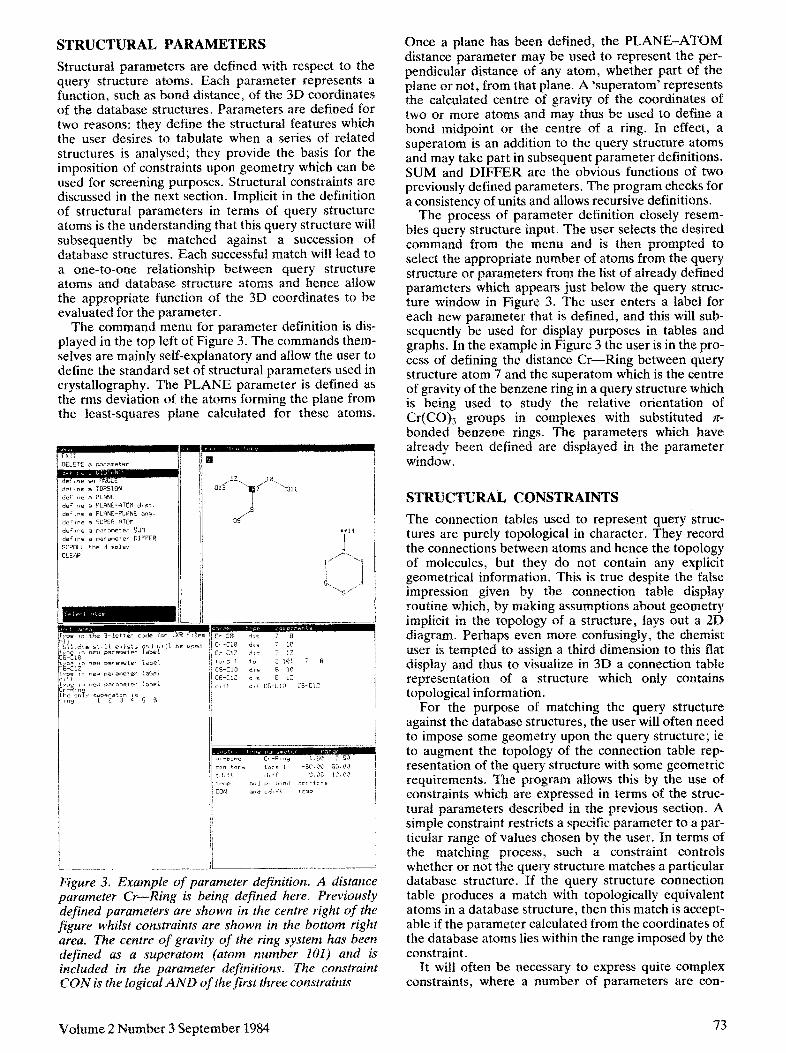
The command menu for parameter definition is dis- played in the top left of Figure 3. The commands them- selves are mainly self-explanatory and allow the user to define the standard set of structural parameters used in crystallography, The PLANE parameter is defined as the rms deviation of the atoms forming the plane from the least-squares plane calculated for these atoms.
i_- .____.._._jL~_._“_ ~.~~~..~~ Figure 3. Example of parameter definition. A distance parameter Cr-Ring is being defined here. Previously defined parameters are shown in the centre right of the figure whilst constraints are shown in the bottom right area. The centre of gravity of the ring system has been defined as a superatom (atom number 101) and is included in the parameter defkitions. The constraint CON is the logical ANI) of the first three constraints
Vohrme 2 Number 3 September 1984
Once a plane has been defined, the PLANE-ATOM distance parameter may be used to represent the per- pendicular distance of any atom, whether part of the plane or not, from that plane. A ‘superatom’ represents the calculated centre of gravity of the coordinates of two or more atoms and may thus be used to define a bond midpoint or the centre of a ring. In effect, a superatom is an addition to the query structure atoms and may take part in subsequent parameter definitions. SUM and DIFFER are the obvious functions of two previously defined parameters. The program checks for a consistency of units and allows recursive definitions.
The process of parameter definition closely resem- bles query structure input. The user selects the desired command from the menu and is then prompted to select the appropriate number of atoms from the query structure or parameters from the Iist of already defined parameters which appears just below the query struc- ture window in Figure 3. The user enters a label for each new parameter that is defined, and this will sub- sequently be used for display purposes in tables and graphs. In the example in Figure 3 the user is in the pro- cess of defining the distance Cr-Ring between query structure atom 7 and the superatom which is the centre of gravity of the benzene ring in a query structure which is being used to study the relative orientation of Cr(CO)s groups in complexes with substituted II: bonded benzene rings. The parameters which have already been defined are displayed in the parameter window.
STRUCTURAL CONSTRATNTS
The connection tables used to represent query struc- tures are purely topological in character. They record the connections between atoms and hence the topology of molecules, but they do not contain any explicit geometrical information. This is true despite the false impression given by the connection table display routine which, by making assumptions about geometry implicit in the topotogy of a structure, Iays out a 2R diagram. Perhaps even more confusingly, the chemist user is tempted to assign a third dimension to this flat display and thus to visuahze in 3D a connection table representation of a structure which only contains topological information.
For the purpose of matching the query structure against the database structures, the user will often need to impose some geometry upon the query structure; ie to augment the topology of the connection table rep- resentation of the query structure with some geometric requirements. The program aIlows this by the use of constraints which are expressed in terms of the struc- tural parameters described in the previous section. A simple constraint restricts a specific parameter to a par- ticutar range of values chosen by the user. In terms of the matching process, such a constraint cantrois whether or not the query structure matches a particular database structure. If the query structure connection table produces a match with topologically equivalent atoms in a database structure, then this match is accept- able if the parameter calculated from the coordinates of the database atoms lies within the range imposed by the constraint.
It will often be necessary to express quite complex constraints, where a number of parameters are con-
73
strained to lie within certain ranges and there is some logical relationship among these parameters. The con- straint definition section of the program allows such complex constraints to be built up in step-wise fashion. Seven types of constraint may be defined:
simple: a particular parameter is constrained to lie within a specific range of values logical AND: two previously defined constraints are required to be simultaneously true logical OR of two constraints logical NOT of a constraint coordination number: the number of bonds to non- hydrogen atoms for a particular atom is constrained to lie within a certain range R-factor constraint: the R-factor is required to lie within the specified range accuracy flag constraint: the C-C average standard deviation flag’” is required to lie within the specified range
With these building blocks, constraints of considerable complexity may be constructed. The mechanics of con- straint definition are appropriately simple. The appro- priate parameter, constraint or constraint pair is selected from the display of previously defined parameters and constraints; the constraint label and the range of values for a simple constraint are entered via the keyboard.
Figure 3 presents an illustrative example of structural parameter and constraint definition. Experience shows that quite complex statements about molecular geometry may be entered quickly and easily into the program by this combination of structural parameter and constraint definition. The interactive nature of the process is an aid to accuracy and allows mistakes to be corrected after they are made. The menu-driven specification procedure and the use of the puck to select items from previously defined valid sets make for ease of programming and for flexible yet simple use. At any stage the contents of the right-hand side of the screen (query structure, parameters and constraints) can be saved on disk for later use.
SCREENING DATABASE STRUCTURES
Before a particular set of database structures can be used for the purpose of comparing structure para- meters, it will often be necessary to screen out particu- lar subsets of the structures. Two commands are pro- vided in the main menu for this purpose. One, ELIMI- NATE, allows structures to be accepted or rejected on the basis of whether or not they satisfy a particular pre- defined constraint, and the other, DISPLAY, produces diagrammatic projections of the 3D coordinates and thus allows manual rejection of structures after visual inspection. There are a number of reasons why this pre- liminary screening process is necessary. The first, and most obvious reason, derives from the limitations of the preliminary retrieval program. The raw material for the CDA program is, for CSD, the full set of 30 000 coordi- nate datasets (some 10 000 of the 40 000 entries in the databank are in the nature of preliminary communica- tions with no coordinate data available - October 1983 figures). A necessary firs& step will have been to reduce this large set to a few tens of structures containing the
74
desired features. The retrieval programs such as CSSR which do this are extremely powerful and flexible and allow subsets of related structures to be isolated from the full databank in a few minutes of an interactive terminal session. However, such programs are usually limited to retrieval according to the bibliographic and chemical connectivity entries in the databank and are unable to resolve cases where the distribution between structures requires an analysis of the 3D coordinates.
To take a simple example: the chemical connectivity data alone will not distinguish between the 5a, and !@ configurations of fully saturated steroids, although a CSSR command such as RPROBE will provide a fast and efficient retrieval of all the saturated steroids with a particular ring topology. Retrieval from the biblio- graphic data, searching for a string such as ‘Alpha’ in the compound name field may go some way to distin- guishing the two cases but this is not a generally reliable method since the occurrence of any trivial names would make such a retrieval unreliable. The safest method is therefore to pass all the appropriate saturated steroid structures to CDA and there to screen them according to geometry.
Another reason for the need for a preliminary screening step in CDA concerns the limitations of the chemical connectivity records. The introduction of a specific connectivity record for each database entry in addition to that implied by the published crystal data has enormously enhanced the usefulness of the CSD. As well as providing structural formulae for all those compounds where crystal data are not available, the connectivity records present bond types, charges and hydrogen atom counts explicitly and in a much more readily available form than is implicit in the coordinate data file. Conversely, however, this explicit representa- tion will sometimes obscure the actual delocalization of double bonds and charges which is evident from an analysis of the coordinate data. Further, it is difficult to represent structures where, for example, dimerization or cyclization occur by a single connectivity record. In these cases retrieval in CSSR from the chemical con- nectivity data must be performed with caution and in the expectation of the need for some subsequent screening using the information present in the coordi- nate data.
A final reason for screening concerns the need to remove from the analysis such structures as are insuffi- ciently accurate to be included. The point has been well made in the literature, eg by Murray-Rust and Mother- wel16, that where there are a large number of candidate structures which will provide the basis for a comparison of structural properties it is almost essential to screen these on accuracy grounds whilst recording the details of the screening procedure that has been used.
Screening is achieved by successively matching the query structure against the database structures and rejecting those which do not satisfy a particular con- straint. Subsets of the database structures are thus created and can be used instead of the full set of struc- tures for subsequent tabulation purposes or for further screening. The steps involved in the matching process closely parallel those in the production of tables of structural parameters and are described in more detail in the following section. Accuracy screening does not require the substructure matching of the query and database connection tables, although it may be com-
Journal of Molecular Graphics
bined with a constraint which does require substructure matching, and simply involves a check on the R-factor or the C-C bond distance standard error class. This latter parameter is a particularly valuable feature uf the Cambridge file since it allows a direct comparison of the accuracy of structural determinatiorts, The R-factor alone will not, for heavy atom structures, be a reliable indicator for the accuracy of parameters involving light- atom coordinates4.
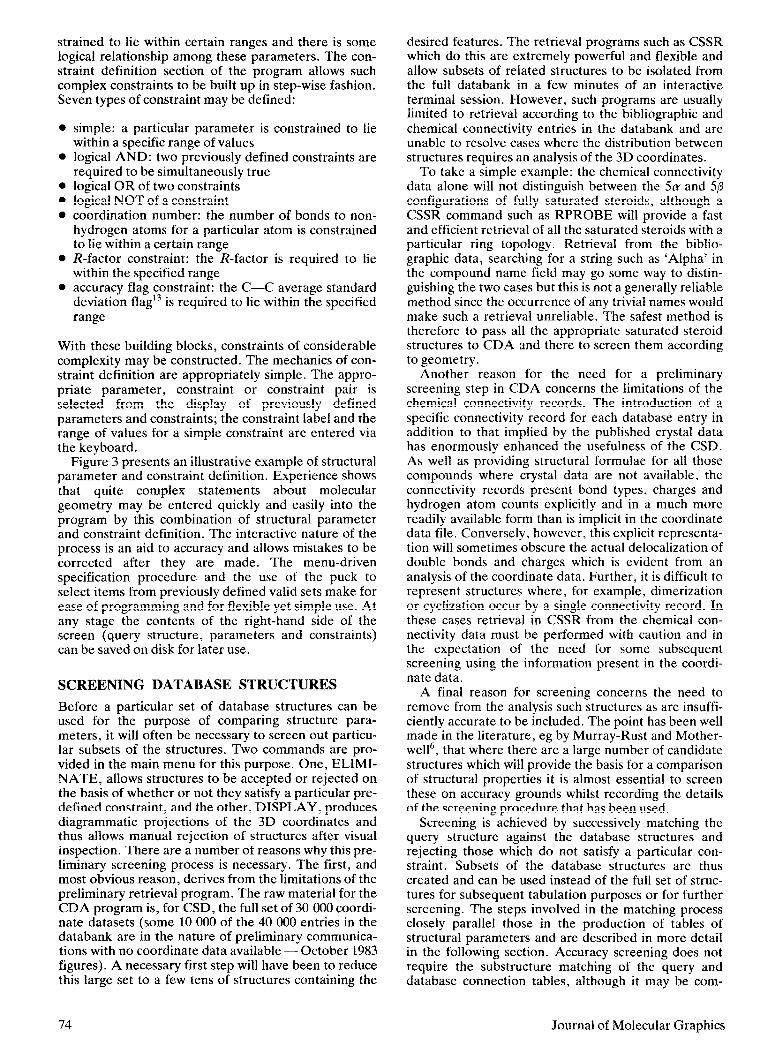
Figure 4 provides a general illustration of the types of constraint that can be used for structure screening. The constraint Iabelled ‘AIpha’ will, if required to be true for an elimjna~on ~mrnand~ produce a subset of the steroid structures containing only 5~ compounds, since the torsion angle about the C,---& bond is constrained to be near & 175” rather than the *70” usually associated with 5p steroids. Since the sign of the torsion angle will depend on the absolute eonfiguration of the structure, it has been necessary to combine the two pos- sible ranges with a logical OR constraint. It should be uated that the numbering scheme for the torsion angle parameter ‘6’345’ reflects the numbering in the query structure and that this is unlikely to resemble the stan- dard numbering scheme for a compound because of the method by which the query structure is input. The user is required to make the necessary men&I adjustment but is aided in this by the ~~nst~~t display on the PERQ screen of the query structure diagram and the para- meter table.
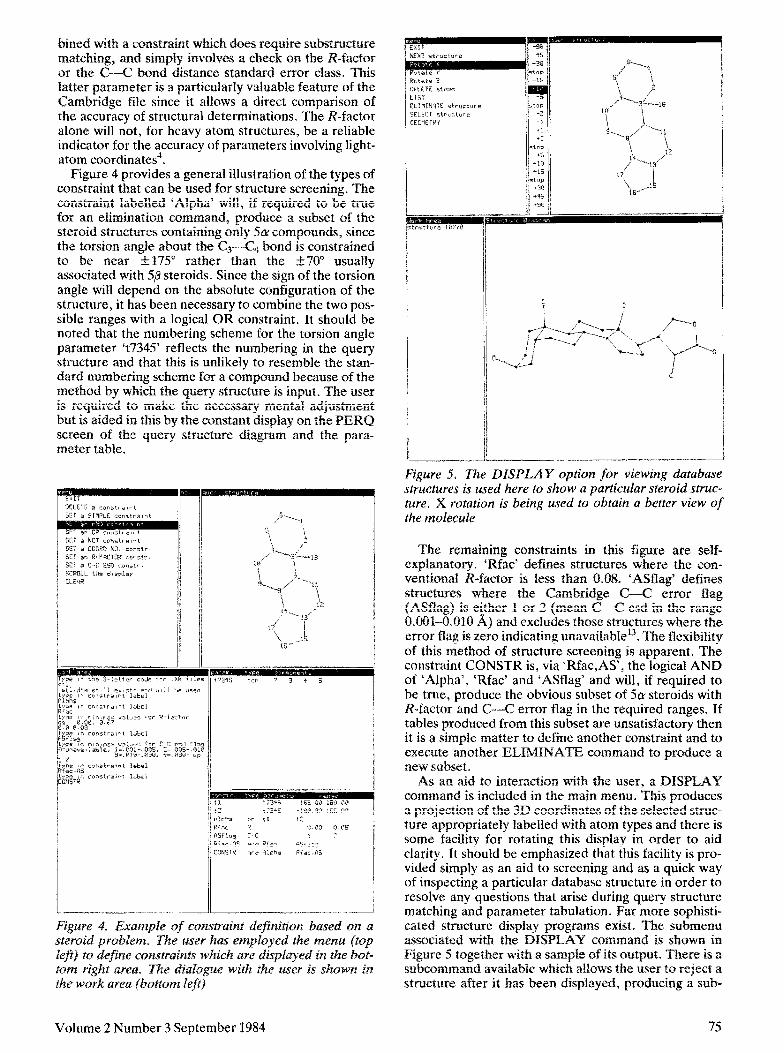
Figure 5. The DISPLAY option for viewing database structures is used here to show a particular steroid struc- ture. X rotation is being used to obtain a better view of the molecule
The remaining constraints in this figure are self- explanatory, ‘Rfac’ defines structures where the con- vention&l R-factor is less than 0.08. ‘ASfIag’ defines structures where the Cambridge C-C error flag (AS&& is either I or 2 (mean C-C esd in the rrmge ~~~l~.~~~ A> and excludes those structures where the error flag is zero indicating unavailable’-i. The flexibifity of this rrxethod of structure screening is apparent. The constraint CONSTR is, via ‘Rfac,AS’, the logical AND af ‘Alpha’, ‘Rfac’ and ‘ASflag’ and will, if required to be true, produce the obvious subset of 5n steroids with R-factor and C-C error flag in the required ranges. If tables produced from this subset are unsatisfactory then it is a simple matter to define another constraint and to execute another ELIMINATE command to produce a new subset.
As an aid to interaction with the user, a DISPLAY ~~rnrna~d is included in the main mt3nr.r. This produces a projection of the 3D coordinates of the selected struc- ture appropriately labelled with atom types and there is some facility for rotating this display in order to aid clarity. It should be emphasized that this facility is pro- vided simply as an aid to screening and as a quick way of inspecting a particular database structure in order to resolve any questions that arise during query structure matching and parameter tabulation. Far more sophisti- cated structure display programs exist. The submenu associated with the DISPLAY command is shown in Figure .5 together with a sampIe of its output. There is a sub~~rnrn~d a&lab&z which allows the user to reject a structure after it has been displayed, producing a sub-
Volume 2 Number 3 September 1984 75
file at the end of the sequence of displayed diagrams which will not contain structures so rejected.
PRODUCTION AND ANALYSIS OF TABLES
The steps involved in the production of a table of struc- tural parameters from a set of 3D structural coordinates are outlined below. The user will already have entered a query structure, defined some parameters and, optionally, specified some constraints on these parameters:
Ascertain from the user the parameters whose calcu- lated values will form the columns of the table. Let the user choose whether to search the full set of structures or a previously selected subset. Find out which constraint, if any, controls the match- ing process. Match, in turn the query structure connection table against the connection table for each database structure being searched. This will involve a system- atic placement of the query structure against all possible combinations of database structure atoms. For each match, evaluate any parameters required by the constraint, if present, and decide if the con- straint is true or false. For matches which pass step 4, evaluate and tabulate the parameters selected by the user from the 3D coordinates of the matched database structure atoms. Resolve the problems caused by redundant matches when the query structure exhibits symmetry.
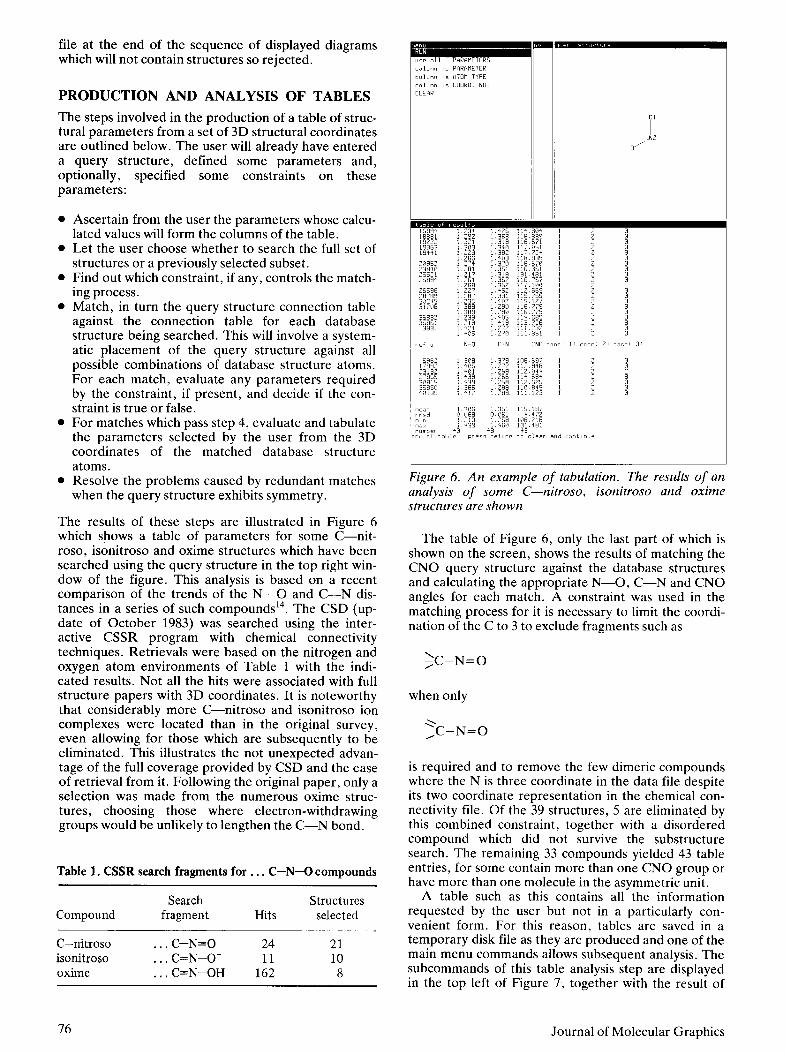
The results of these steps are illustrated in Figure 6 which shows a table of parameters for some C-nit- roso, isonitroso and oxime structures which have been searched using the query structure in the top right win- dow of the figure. This analysis is based on a recent comparison of the trends of the N-O and C-N dis- tances in a series of such compounds14. The CSD (up- date of October 1983) was searched using the inter- active CSSR program with chemical connectivity techniques. Retrievals were based on the nitrogen and oxygen atom environments of Table 1 with the indi- cated results. Not all the hits were associated with full structure papers with 3D coordinates. It is noteworthy that considerably more C-nitroso and isonitroso ion complexes were located than in the original survey, even allowing for those which are subsequently to be eliminated. This illustrates the not unexpected advan- tage of the full coverage provided by CSD and the ease of retrieval from it. Following the original paper, only a selection was made from the numerous oxime struc- tures , choosing those where electron-withdrawing groups would be unlikely to lengthen the C-N bond.
Table 1. CSSR search fragments for . . . C-N+ compounds
Compound Search
fragment Hits Structures
selected
C-nitroso isonitroso oxime
. . . C-N=0 24 21
. . . C=N-O- 11 10
. . . C=N-OH 162 8
Figure 6. An example of tabulation. The results of an analysis of some C-nitroso, isonitroso and oxime structures are shown
The table of Figure 6, only the last part of which is shown on the screen, shows the results of matching the CNO query structure against the database structures and calculating the appropriate N-O, C-N and CNO angles for each match. A constraint was used in the matching process for it is necessary to limit the coordi- nation of the C to 3 to exclude fragments such as
fC-N=O
when only
>C-N=O
is required and to remove the few dimeric compounds where the N is three coordinate in the data file despite its two coordinate representation in the chemical con- nectivity file. Of the 39 structures, 5 are eliminate-d by this combined constraint, together with a disordered compound which did not survive the substructure search. The remaining 33 compounds yielded 43 table entries, for some contain more than one CNO group or have more than one molecule in the asymmetric unit.
A table such as this contains all the information requested by the user but not in a particularly con- venient form. For this reason, tables are saved in a temporary disk file as they are produced and one of the main menu commands allows subsequent analysis. The subcommands of this table analysis step are displayed in the top left of Figure 7, together with the result of
76 Journal of Molecular Graphics
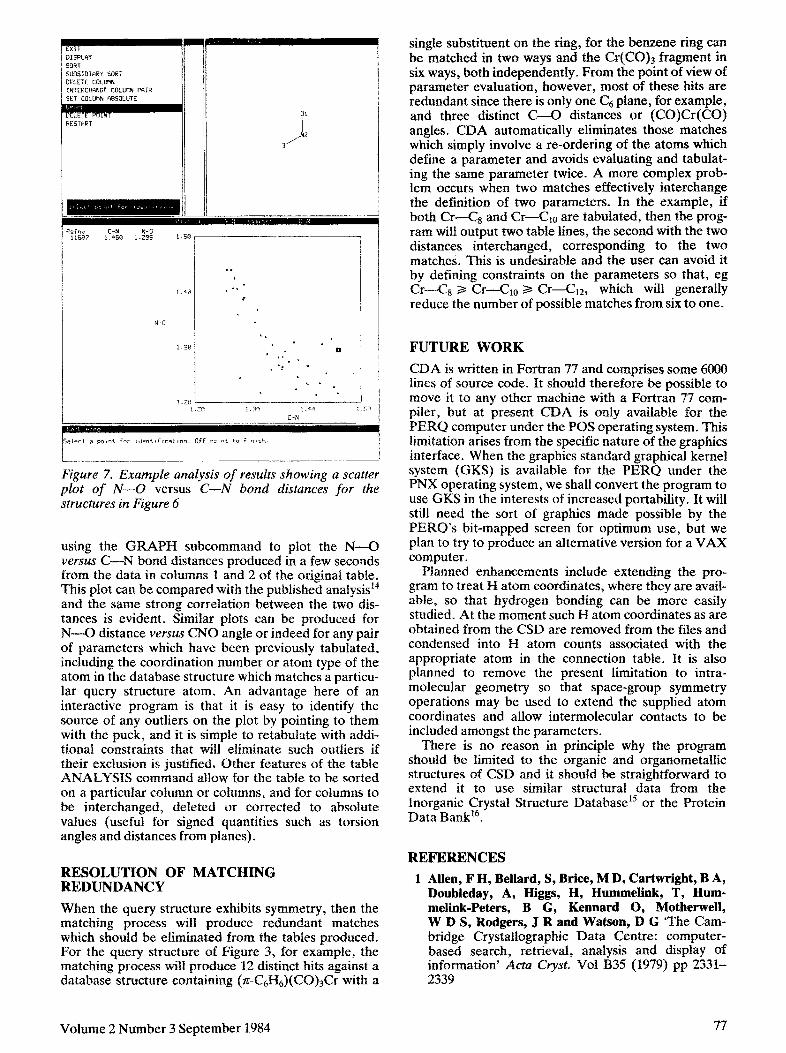
Figure 7. Example analysis of results showing a scatter plot of N-O versus C-N bored distances for the structures in Figure 6
using the GRAPH subcommand to plot the N-O verse C-N bond distances produced in a few seconds from the data in columns 1 and 2 of the original table. This plot can be compared with the published analysisI and the same strong correlation between the two dis- tances is evident. Similar plots can be produced for N-O distance versz&s CNQ angle or indeed for any pair of parameters which have been previously tabulated, including the coordination number or atom type of the atom in the database structure which matches a particu- lar query structure atom. An advantage here of an interactive program is that it is easy to identify the source of any outliers on the plot by pointing to them with the puck, and it is simple to retabulate with addi- tional constraints that will eliminate such outliers if their exclusion is justified, Other features of the table ANALYSIS command allow for the table to be sorted on a particular column or columns, and for columns to be interchanged, deleted or corrected to absolute values (useful for signed quantities such as torsion angles and distances from planes).
RESOLUTION OF MATCHING REDUNDANCY
When the query structure exhibits symmetry, then the matching process will produce redundant matches which should be eliminated from the tables produced. For the query structure of Figure 3, for example, the matching process will produce 12 distinct hits against a database structure containing (x-CGH&CO)sCr with a
Volume 2 Number 3 September 1984
single substituent on the ring, for the benzene ring can be matched in two ways and the Cr(CQ), fragment in six ways, both independently_ From the point of view of parameter evaluation, however, most of these hits are redundant since there is only one Ce plane, for example, and three distinct C-O distances or (CO)Cr(CO) angles. CDA automatically eliminates those matches which simply involve a re-ordering of the atoms which define a parameter and avoids evaluating and tabulat- ing the same parameter twice. A more complex prob- lem occurs when two matches effectively interchange the definition of two parameters. In the example, if both Cr-Cs and Cr-Cza are tabulated, then the prog- ram will output two table fines, the second with the two distances interchanged, corresponding to the two matches. This is undesirable and the user can avoid it by defining constraints on the parameters so that, eg Cr-Cs & Cr-Clo 2 Cr-Ci2, which wil1 generally reduce the number of possible matches from six to one.
FUTURE WORK
CDA is written in Fortran 77 and comprises some 6000 lines of source code. It should therefore be possible to move it to any other machine with a Fortran 77 com- piler, but at present CDA is only available for the PERQ computer under the PUS operating system. This limitation arises from the specific nature of the graphics interface. When the graphics standard graphical kernel system (GKS) is available for the PERQ under the PNX operating system, we shall convert the program to use GKS in the interests of increased portability. It will still need the sort of graphics made possible by the PERQ’s bit-mapped screen for optimum use, but we plan to try to produce an alternative version for a VAX computer.
Planned enhancements include extending the pro- gram to treat H atom coordinates, where they are avail- able, so that hydrogen bonding can be more easily studied. At the moment such H atom coordinates as are obtained from the CSD are removed from the files and condensed into H atom counts associated with the appropriate atom in the connection table. It is also planned to remove the present limitation to intra- molecular geometry so that space-group symmetry operations may be used to extend the supplied atom coordinates and allow intermolecular contacts to be included amongst the parameters.
There is no reason in principle why the program shoufd be limited to the organic and organometallic structures of CSD and it should be straigh~o~~d to extend it to use similar structural data from the Inorganic Crystal Structure Databasei or the Protein Data Bank16.
REFERENCES
1 Allen, F H, Bellard, S, Brice, M D, Cartwright, B A, Doubleday, A, Hiigs, H, Hummelhk, T, Hum- melink-Peters, B G, Kennard 0, Motherwell, W D S, Rodgers, J R and Watson, D G ‘The Cam- bridge C~stailograph~c Data Centre: computer- based search, retrieval, analysis and display of information’ Acfa Cr)sf. Vol B35 (1979) pp 233% 2339
77
2 Win, S R and Htiman, J C ‘Cambridge Data File in organic chemistry. Applications to transition state structure, conformation al analysis, and structure/activity studies’ J. Org. Chem. Vol 45 (1980) pp 560-566
3 Murray-Rust, P ‘Molecular interactions’ in Sutton, L E and Truter, M R (eds) h4oZeculur structure by diffraction metho& Vol 6, Chemical Society, London, UK (1978) pp 154-182
4 Taylor, R and Kennard, 0 ‘The estimation of average molecular dimensions from crystallographic data’ Actu Cryst. Vol B39 (1983) pp 517-525
5 Taylor, R and Kennard, 0 ‘Molecular structures of nucleosides and nucleotides. 2. Orthogonal coordi- nates for standard nucleic acid base residues’ J. Am. Chem. Sot. Vol104 (1982) pp 3209-3212
6 Murray-Rust, P and Motherwell, W D S ‘Computer retrieval and analysis of molecular geometry. I. General principles and methods’ Actu Cryst. Vol B34 (1978) pp 2518-2526
7 Murray-Rust, P and Motherwell, W D S ‘Computer retrieval and analysis of molecular geometry. III. Geometry of the p-l’-aminofuranoside fragment’ Actu Cryst. Vol B34 (1978) pp 2534-2546
8 Murray-Rust, P and Bland, R ‘Computer retrieval and analysis of molecular geometry. II. Variance and its interpretation’ Actu Cryst. Vol B34 (1978) ~~2527-2533
9 Domenicano, A, Murray-Rust, P and Vaciago, A ‘Molecular geometry of substituted benzene deriva-
tives. IV. Analysis of variance in monosubstituted benzene rings’ Actu. Cryst. Vol B39 (1983) pp 457- 468
10 Feldmann, R J in Wipke, W T, Heller, S R, Feldmann, R J and Hyde, E (eds) Computer repre- sentation and manipulation of chemical information John Wiley, NY, USA (1974) pp 55-81
11 Elder, M, Hull, S E, Machin, P A and Mills, 0 S Crystal structure search and retrieval, user manual SERC Daresbury Laboratory, Warrington, UK (1981)
12 Hull, S E ‘REWARD: a program for the display of structure diagrams from connection tables’ in preparation
13 Cambridge crystallographic database, user manual Cambridge Crystallographic Data Centre, Cam- bridge University, UK (1978)
14 Gilli, G, Bertolasi, V and Veronese, A C ‘An x-ray crystallographic study on the geometry of the C-N-O group and the [1,5] sigmatropic re- arrangement from C-nitroso compounds to oximes’ Acta Cryst. Vol B39 (1983) pp 450-456
15 Bergerhoff, G Institut fiir Anorganische Chemie der Universittit Bonn
16 Bernstein, F C, Koetzle, T F, Williams, G J B, Meyer, E F, Brice, M D, Rodgers, J R, Kennard, 0, Shimanouchi, T and Tasumi, M ‘The Protein Data Bank: a computer-based archival file for macro- molecular structures’ J. Mol. Biol. Vol 112 (1977) pp 535-542
78 Journal of Molecular Graphics