Embed Size (px)
DESCRIPTION
opis
Citation preview

1
CDMA Indoor Solutions
Chu Rui Chang
CDMA Technology Applications(Draft Version 0.0)

2
Table of Contents
• Introduction and Background Information
• Coverage of Indoor Systems
• Capacity of Indoor Systems
• Nortel’s Indoor Microcell Solutions
• Summary
• References

3
Introduction and BackgroundInformation
4
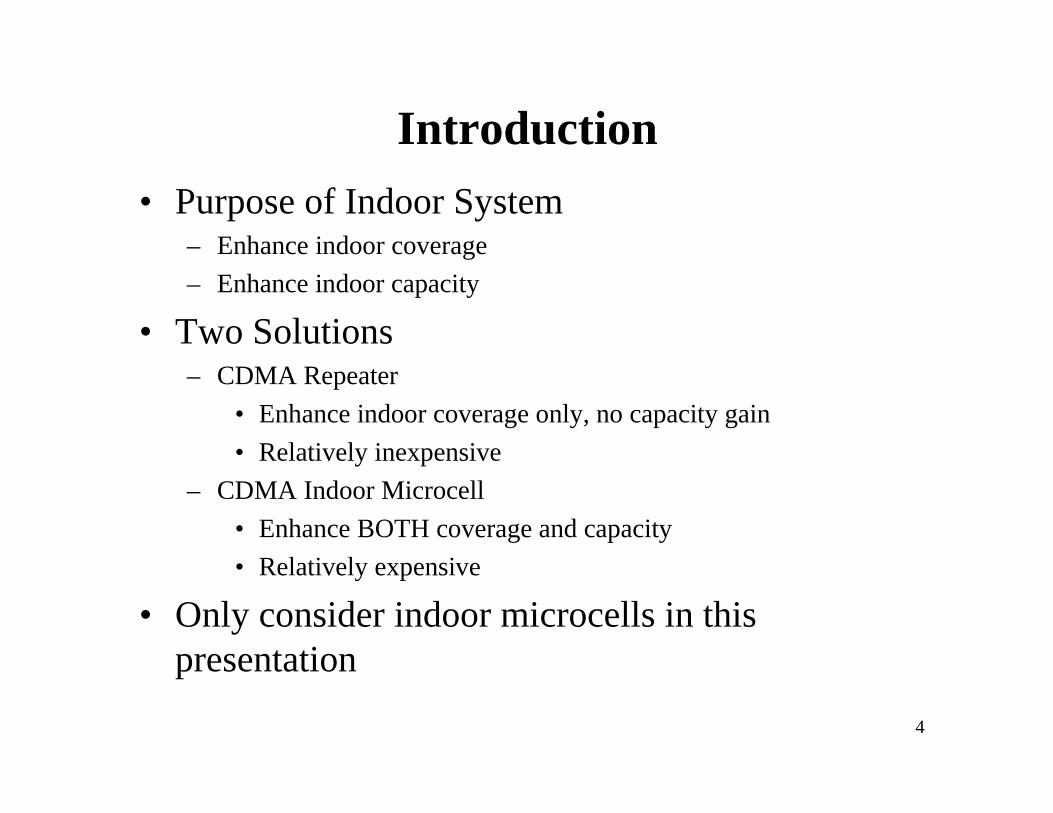
Introduction
• Purpose of Indoor System– Enhance indoor coverage
– Enhance indoor capacity
• Two Solutions– CDMA Repeater
• Enhance indoor coverage only, no capacity gain
• Relatively inexpensive
– CDMA Indoor Microcell
• Enhance BOTH coverage and capacity
• Relatively expensive
• Only consider indoor microcells in thispresentation
5
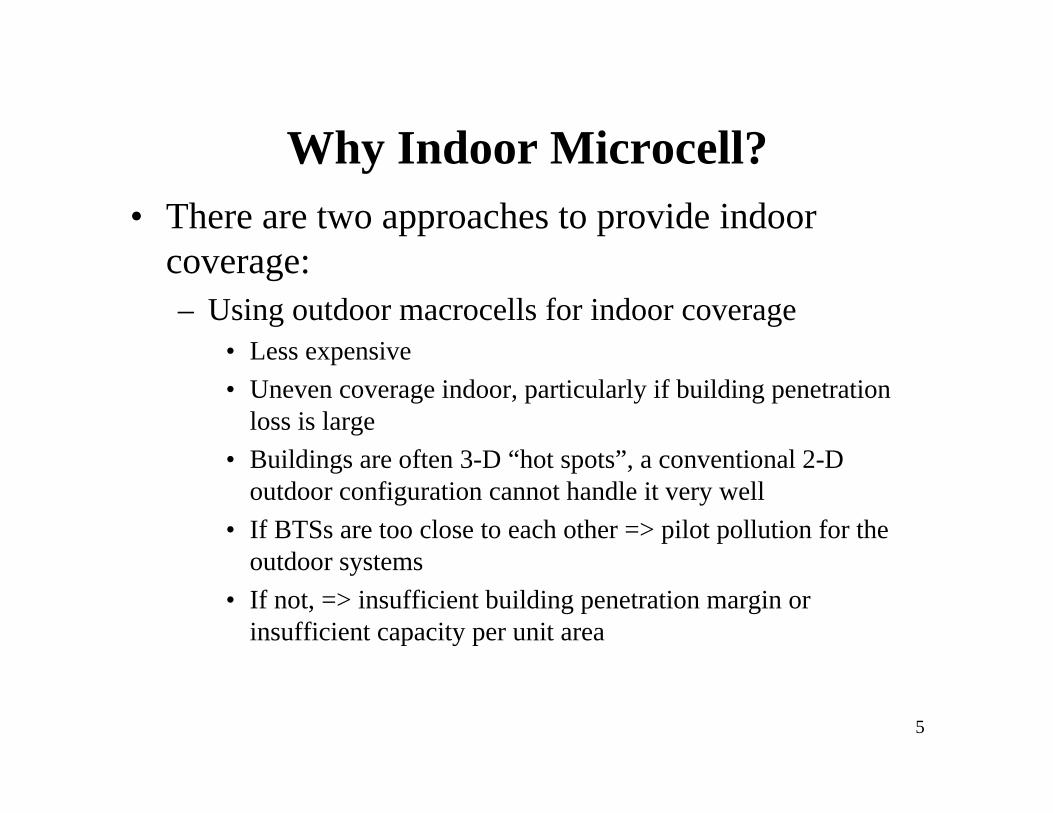
Why Indoor Microcell?• There are two approaches to provide indoor
coverage:– Using outdoor macrocells for indoor coverage
• Less expensive
• Uneven coverage indoor, particularly if building penetrationloss is large
• Buildings are often 3-D “hot spots”, a conventional 2-Doutdoor configuration cannot handle it very well
• If BTSs are too close to each other => pilot pollution for theoutdoor systems
• If not, => insufficient building penetration margin orinsufficient capacity per unit area

6
Why Indoor Microcell (Con’t)?
– Indoor microcell• Much more expensive
• Excellent indoor coverage, almost 100% if needed
• Much higher capacity, the higher the building penetration loss,the higher the capacity of the indoor microcells

7
Unique Features of IndoorEnvironment
• Much shorter propagation distance– Difference in multipath delays < 1 chip
– Rake fingers cannot distinguish the multipath => error in phasesynchronization
– Coherence bandwidth very wide (typically 10 to 50 MHz, >> 1.25MHz) => not much frequency diversity
– Difficult to do hard handoff between indoor and outdoor by usingRTD, because the uncertainties of RTD values often > entirebuilding dimension

8
Unique Features of IndoorEnvironment(Con’t)
• Much slower speed– Interleaving has little effect
– Head movement produces Raleigh fading
– If no multipath diversity, require much higher Eb/Nt, which couldmean less forward link capacity
• Capacity highly dependent on building penetrationloss– The higher the building penetration loss, the less the interference
from outside, the higher the capacity of the indoor system, and viceversa.
9
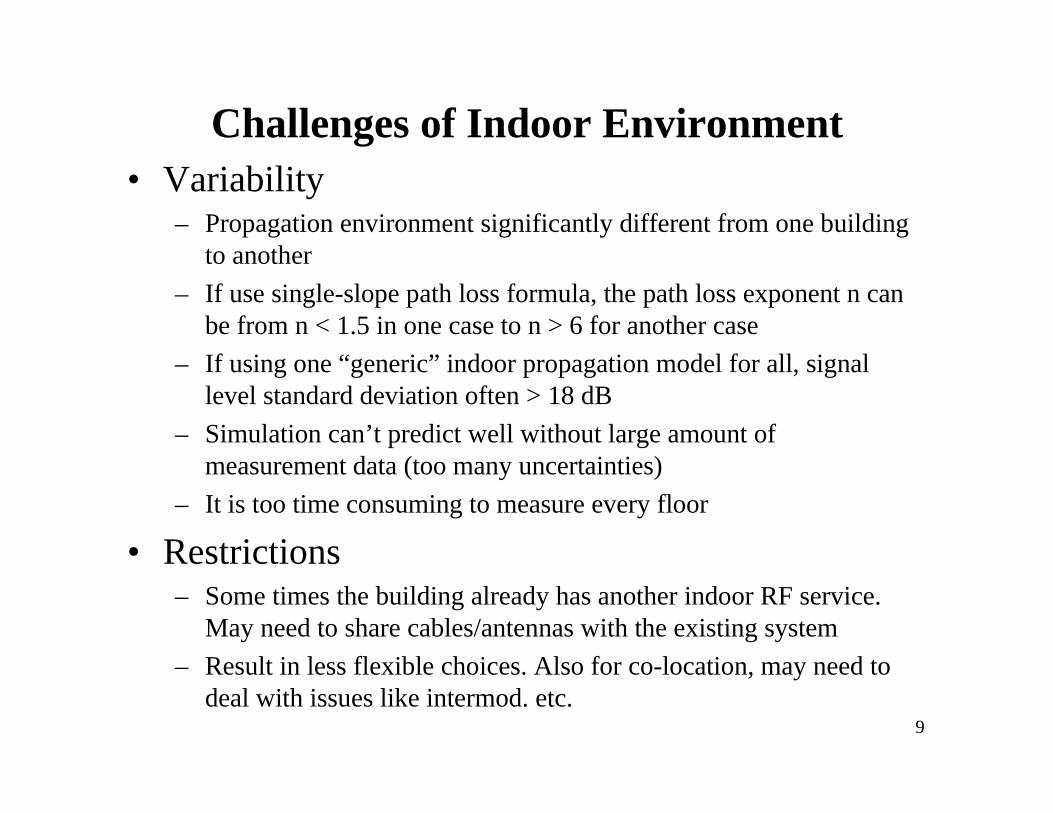
Challenges of Indoor Environment• Variability
– Propagation environment significantly different from one buildingto another
– If use single-slope path loss formula, the path loss exponent n canbe from n < 1.5 in one case to n > 6 for another case
– If using one “generic” indoor propagation model for all, signallevel standard deviation often > 18 dB
– Simulation can’t predict well without large amount ofmeasurement data (too many uncertainties)
– It is too time consuming to measure every floor
• Restrictions– Some times the building already has another indoor RF service.
May need to share cables/antennas with the existing system
– Result in less flexible choices. Also for co-location, may need todeal with issues like intermod. etc.
10
Coverage of Indoor System
11
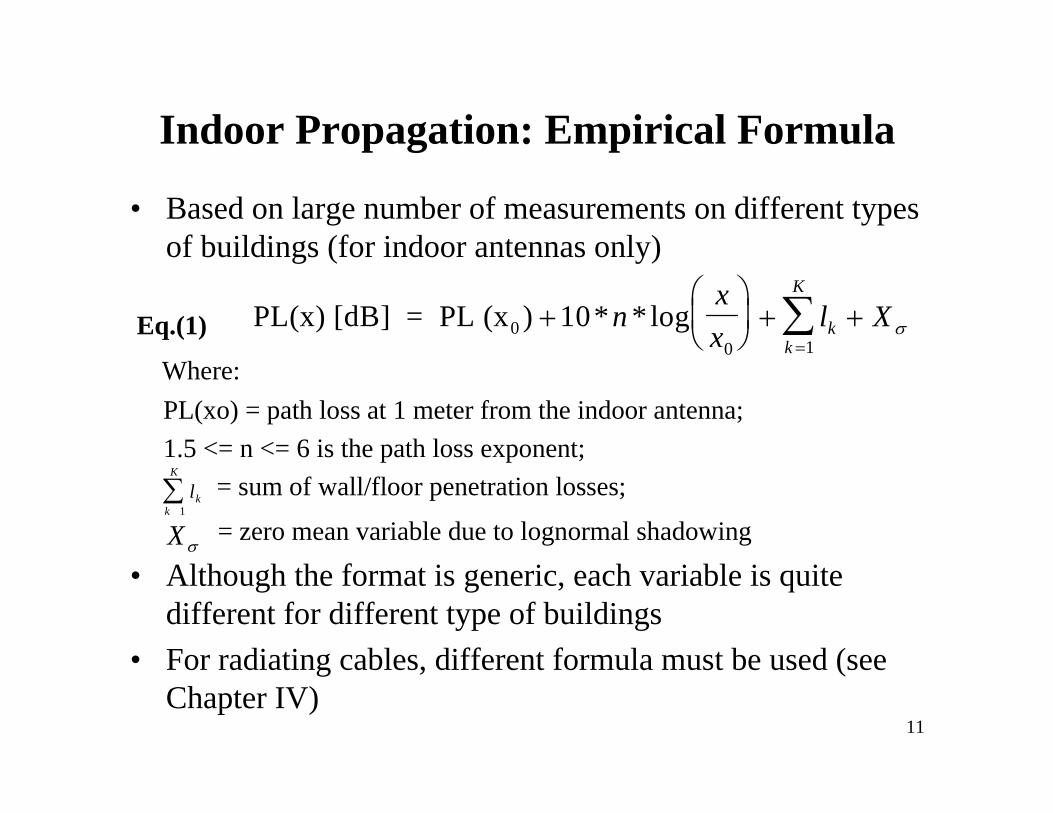
Indoor Propagation: Empirical Formula
• Based on large number of measurements on different typesof buildings (for indoor antennas only)
Eq.(1)
Where:
PL(xo) = path loss at 1 meter from the indoor antenna;
1.5 <= n <= 6 is the path loss exponent;
= sum of wall/floor penetration losses;
= zero mean variable due to lognormal shadowing
• Although the format is generic, each variable is quitedifferent for different type of buildings
• For radiating cables, different formula must be used (seeChapter IV)
PL(x) [dB] = PL (x0) * * log+æ
èç
ö
ø÷ + +
=å10
0 1
nx
xl Xk
k
K
s
l kk
K
=
å1
Xs

12
Indoor Antenna
Xo = 1 m
PL(xo) = 30 dB for 800 MHz system = 38 dB for 1.9 GHz system
0
0.05
0.1
0.15
0.2
0.25
0.3
0.35
0.4
-4 -3 -2 -1 0 1 2 3 4
x
Pro
babi
lity
Den
sity
Fun
ctio
nPL(Xo) = Path loss at 1 meter from the indoor antenna
Xs : Normal distributed variable due to shadowing
The standard deviation is very small for open halls, corridor…but may be very large (e.g., 18 dB)for complicated building structures
13
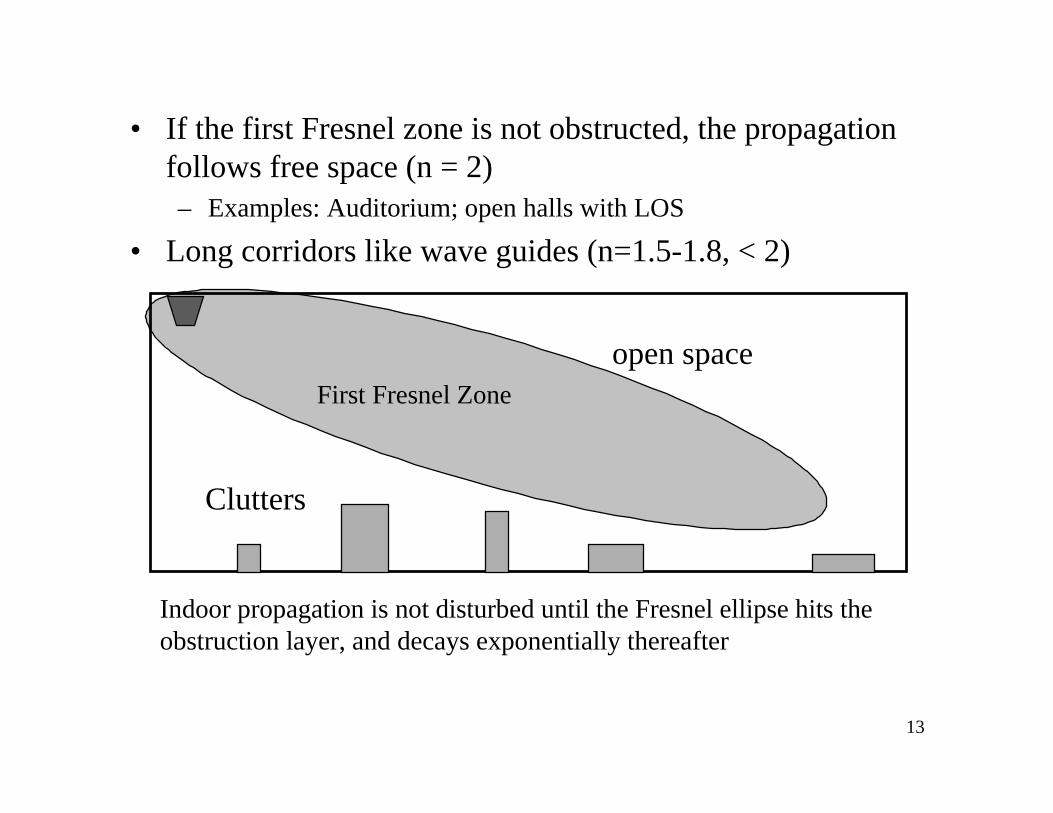
• If the first Fresnel zone is not obstructed, the propagationfollows free space (n = 2)– Examples: Auditorium; open halls with LOS
• Long corridors like wave guides (n=1.5-1.8, < 2)
First Fresnel Zone
open space
Clutters
Indoor propagation is not disturbed until the Fresnel ellipse hits theobstruction layer, and decays exponentially thereafter

14
• Modern office open space + partitions:– open area: free space path loss
– below partitions: knife-edge diffractions
First Fresness Zone
open spaceopen space
First Fresness Zone
Diffraction Zone
0 dB
6 dB
0
15 dB
Diffraction loss over a singleknife-edge:6 dB loss when there is a grazingincidence over the obstacle
Diffraction Loss

15
• Propagation within the same floor (general)
– large difference in wall penetration loss due to differences in wallmaterials (1 to 10 dB)
– More than 15 dB difference in wall penetration loss betweennormal and grazing incidence
– Up to 20 dB change in signal strength could be experienced whenturning a corner
– NLOS: Raleigh+Lognormal shadowing; n = 3 to 3.5
– LOS: Ricean+minor shadowing; n = 2 to 2.5
– : standard deviation of 3 to 12 dBXs
16
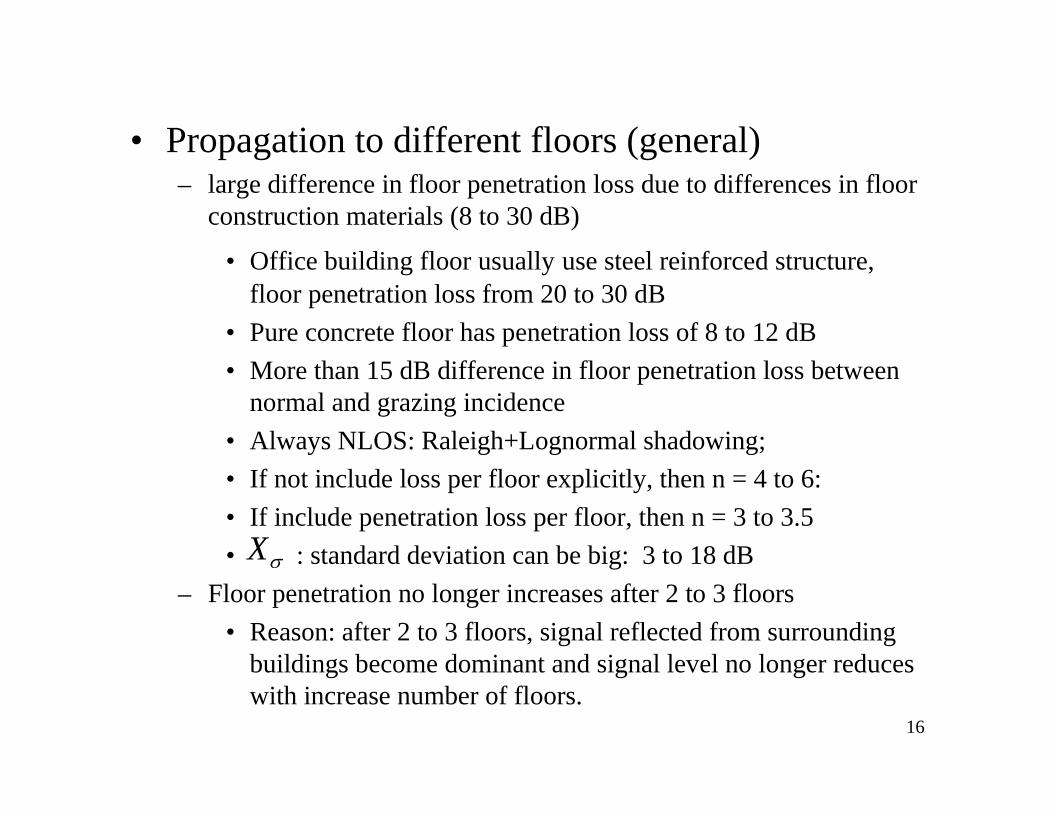
• Propagation to different floors (general)– large difference in floor penetration loss due to differences in floor
construction materials (8 to 30 dB)
• Office building floor usually use steel reinforced structure,floor penetration loss from 20 to 30 dB
• Pure concrete floor has penetration loss of 8 to 12 dB
• More than 15 dB difference in floor penetration loss betweennormal and grazing incidence
• Always NLOS: Raleigh+Lognormal shadowing;
• If not include loss per floor explicitly, then n = 4 to 6:
• If include penetration loss per floor, then n = 3 to 3.5
• : standard deviation can be big: 3 to 18 dB
– Floor penetration no longer increases after 2 to 3 floors
• Reason: after 2 to 3 floors, signal reflected from surroundingbuildings become dominant and signal level no longer reduceswith increase number of floors.
Xs
17
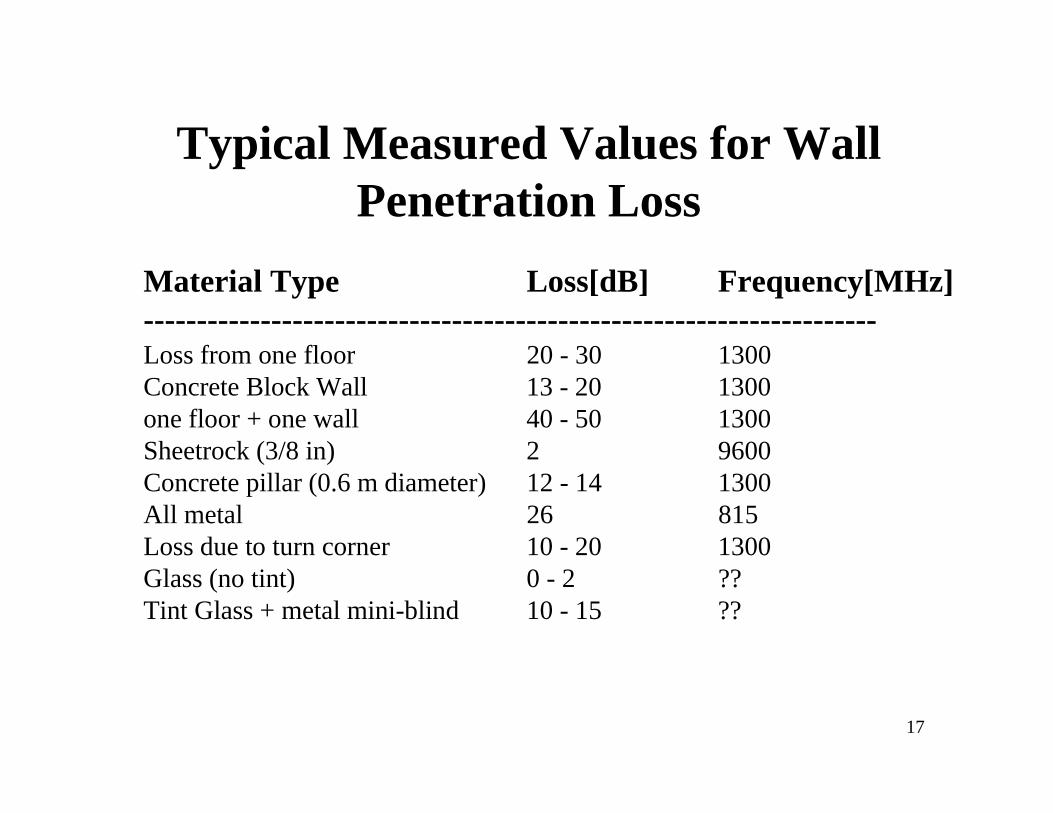
Typical Measured Values for WallPenetration Loss
Material Type Loss[dB] Frequency[MHz]---------------------------------------------------------------------Loss from one floor 20 - 30 1300Concrete Block Wall 13 - 20 1300one floor + one wall 40 - 50 1300Sheetrock (3/8 in) 2 9600Concrete pillar (0.6 m diameter) 12 - 14 1300All metal 26 815Loss due to turn corner 10 - 20 1300Glass (no tint) 0 - 2 ??Tint Glass + metal mini-blind 10 - 15 ??

18
Recommendations• For buildings with steel reinforced floors, it is best to have
antennas on each floor– If coverage is provided from antennas from a different floor,
sufficient measurements are needed to ensure coverage (e.g. > -90dBm every where)

19
Recommendations• Use multiple antennas per floor in a simulcast
fashion (distributed antennas)– For example, four 90o antennas installed at the four corners of the
building, main beam pointing toward the center
– Distributed antennas will create much more uniform coverage thanone centralized omni-antenna
• Multiple antennas provide macroscopic diversity and reducesshadowing effects
– Using directional antennas and point the main beams toward centerof the building (and point null toward outside) will
• Increase the signal level to/from inside of the building
• Reduce the interference to/from outside of the building (themobiles will Tx low power near the edge of the building)

20
Distributed antennas in a simulcast fashion will provide much more uniform coverage than a single antenna. It also provide macroscopicdiversity to combat lognormal shadowing

21
Signal Level[dBm]
Signal vs. distance from one single omni antenna
Composite signal vs. distance from multiple antennas
Distance
Composite SignalLevel
Signal from eachindividual antenna
Distance
SignalLevel

22
Recommendations
• Use delay element for each antenna to createartificial delays on each antenna’s signal– For example, a delay of 3*K chip per antenna, where K = 0, 1, 2…
for antenna number 1, 2, …, so each Tx signal will be 3 chips apart
– This creates artificial multipath and time diversity, so that mobile’srake finger can distinguish signals from each antenna, whichenhance the forward link capacity
– Remember, mobile’s Rake Receiver only has 3 fingers, so theoptimum number of distinct multipath is 3
– Use more than 4 antennas per floor only for very large floordimensions, or if all walls are very lossy.

23
delay=0 chip
delay=3 chip
delay=6 chip
delay=9 chip
A delay element is added to each antenna, so signals from each antennawill have more than 1 chips delay from each other. This creates time diversity.

24
If the delay between signals < 1 chip, the Rake fingers cannot distinguishthem and will result in phase error
Using artificial delays (> 1 chip), the 3 Rake fingers can lock on thethree strongest signals and produce time diversity.
Time [chips]
Ec/Io
Time [chips]
Ec/Io
25
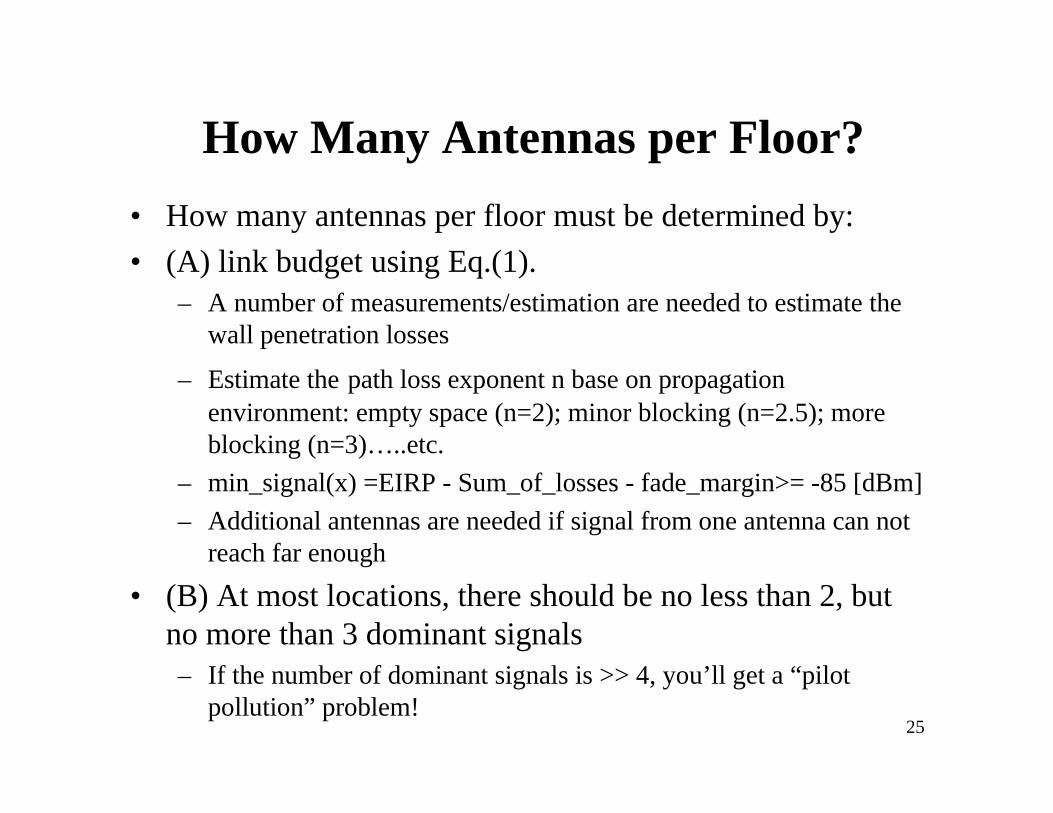
How Many Antennas per Floor?
• How many antennas per floor must be determined by:
• (A) link budget using Eq.(1).– A number of measurements/estimation are needed to estimate the
wall penetration losses
– Estimate the path loss exponent n base on propagationenvironment: empty space (n=2); minor blocking (n=2.5); moreblocking (n=3)…..etc.
– min_signal(x) =EIRP - Sum_of_losses - fade_margin>= -85 [dBm]
– Additional antennas are needed if signal from one antenna can notreach far enough
• (B) At most locations, there should be no less than 2, butno more than 3 dominant signals– If the number of dominant signals is >> 4, you’ll get a “pilot
pollution” problem!

26
phone
phone
phone
phone
phone
This example shows a sufficiently large floor with five antennas per floor.Most of phones will be served by 2 or 3 nearest antennas, unless it is extremely close to one antenna then it is served only by that one.
27
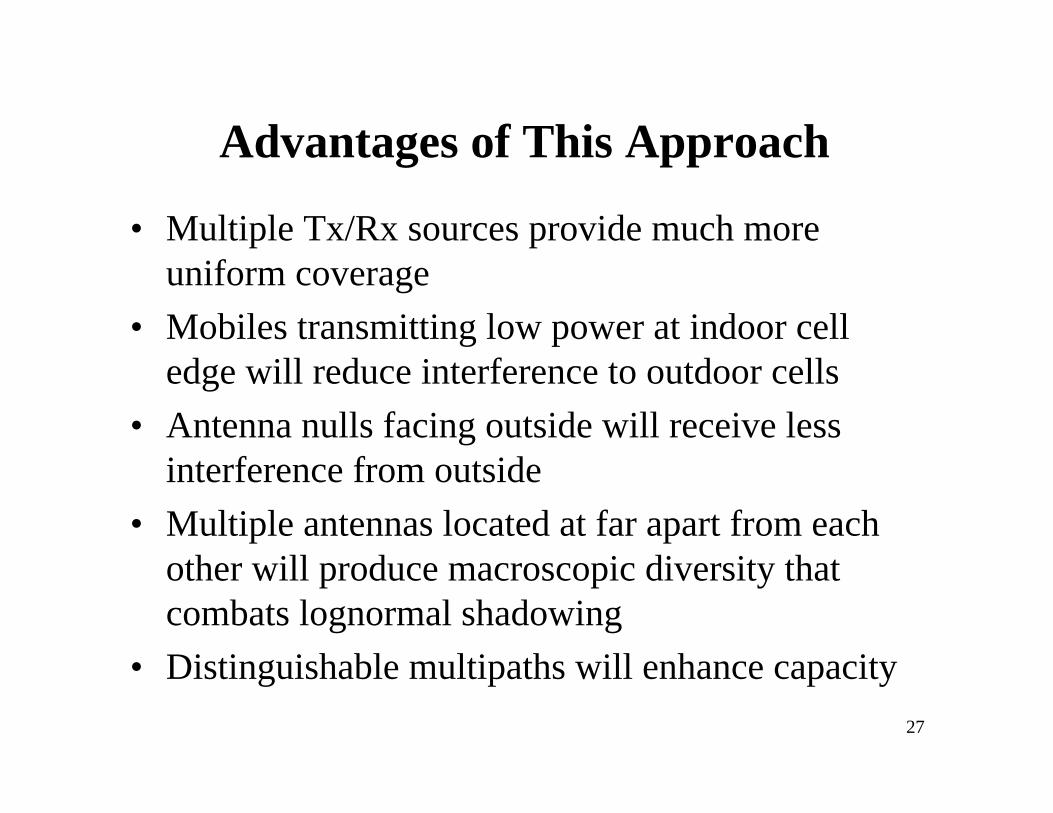
Advantages of This Approach
• Multiple Tx/Rx sources provide much moreuniform coverage
• Mobiles transmitting low power at indoor celledge will reduce interference to outdoor cells
• Antenna nulls facing outside will receive lessinterference from outside
• Multiple antennas located at far apart from eachother will produce macroscopic diversity thatcombats lognormal shadowing
• Distinguishable multipaths will enhance capacity
28
Capacity of Indoor Systems

29
Reverse Link Capacity• Reverse Link Capacity of an indoor system can be
estimated from that of an outdoor single cellcapacity:
For omni-cells outdoor system we have:
Eq.(2)
Where Processing_Gain, VAF (Voice Activity) and Eb/Norequirement are assumed to be the same for outdoor or indoor
system.
• The main thing different is the “frequency reuse”factor F=1/(1+f).
( )Pole_ C apacity
P rocessing_ G ain
V A F *E
Nb
0
»æèç ö
ø÷ +* 1 f
30
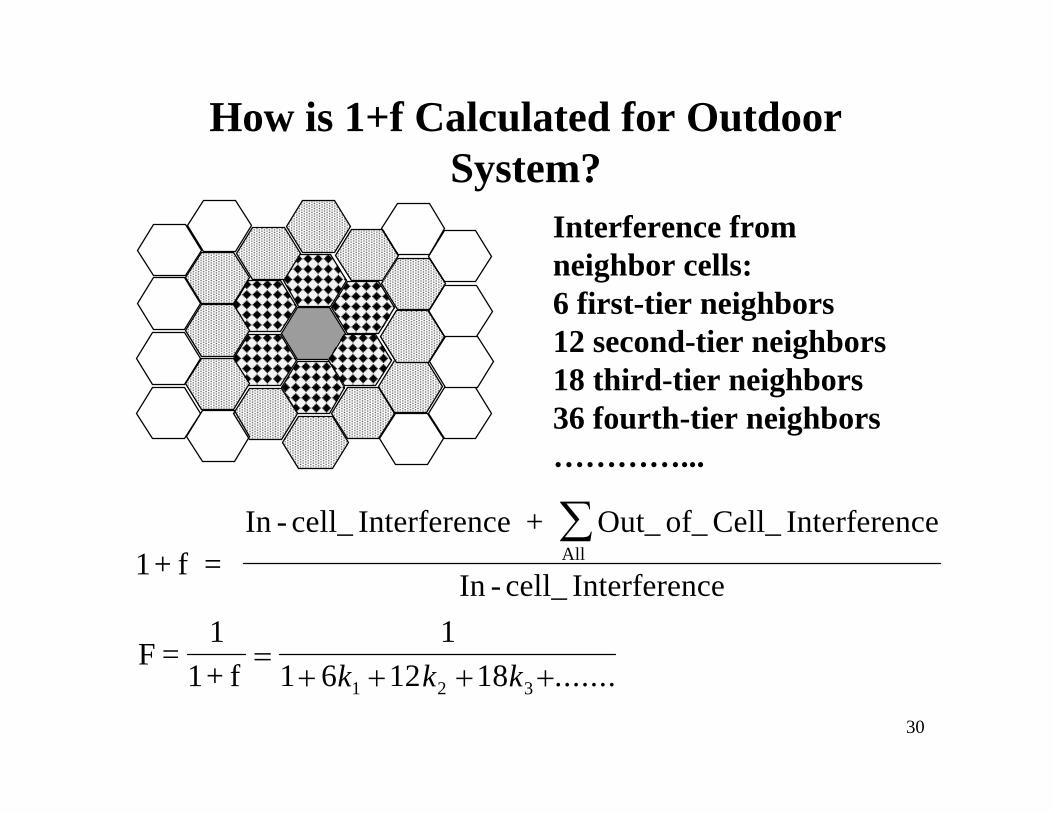
How is 1+f Calculated for OutdoorSystem?
1+ f = In - cell_ Interference + Out_ of_ Cell_ Interference
In - cell_ Interference
F =1
1+ f
All å
=+ + + +
1
1 6 12 181 2 3k k k .......
Interference from neighbor cells: 6 first-tier neighbors12 second-tier neighbors18 third-tier neighbors36 fourth-tier neighbors…………...

31
How is 1+f Calculated for Outdoor System(Con’t)?
• Assume all cells are of equally size and areequally loaded– If path loss exponent n = 4, then
• 1+f = 1.65, i.e., out-of-cell interference = 65% of in-cellinterference
• if no out-of-cell interference, then the capacity per cell will be1.65 times higher
– If path loss exponent n = 3, then• 1+f = 2, i.e., out-of-cell interference = 100% of in-cell
interference
• if no out-of-cell interference, then the capacity per cell will be2 times higher
32
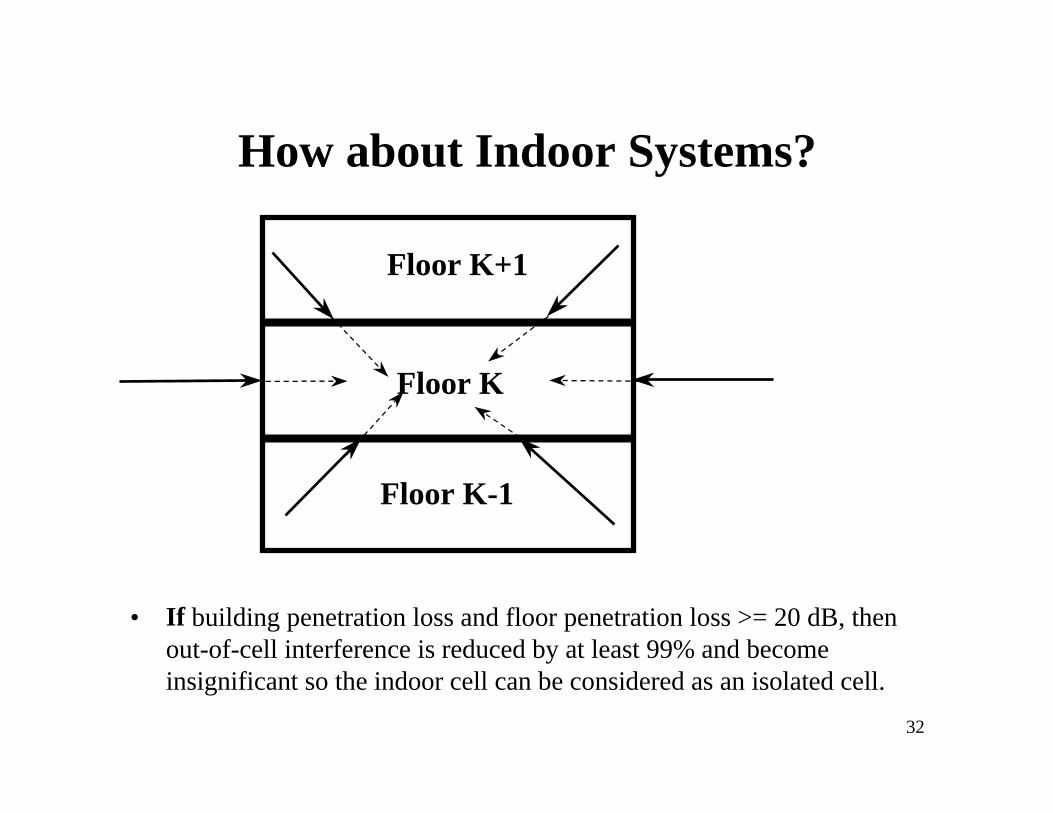
How about Indoor Systems?
• If building penetration loss and floor penetration loss >= 20 dB, thenout-of-cell interference is reduced by at least 99% and becomeinsignificant so the indoor cell can be considered as an isolated cell.
Floor K+1
Floor K
Floor K-1
33
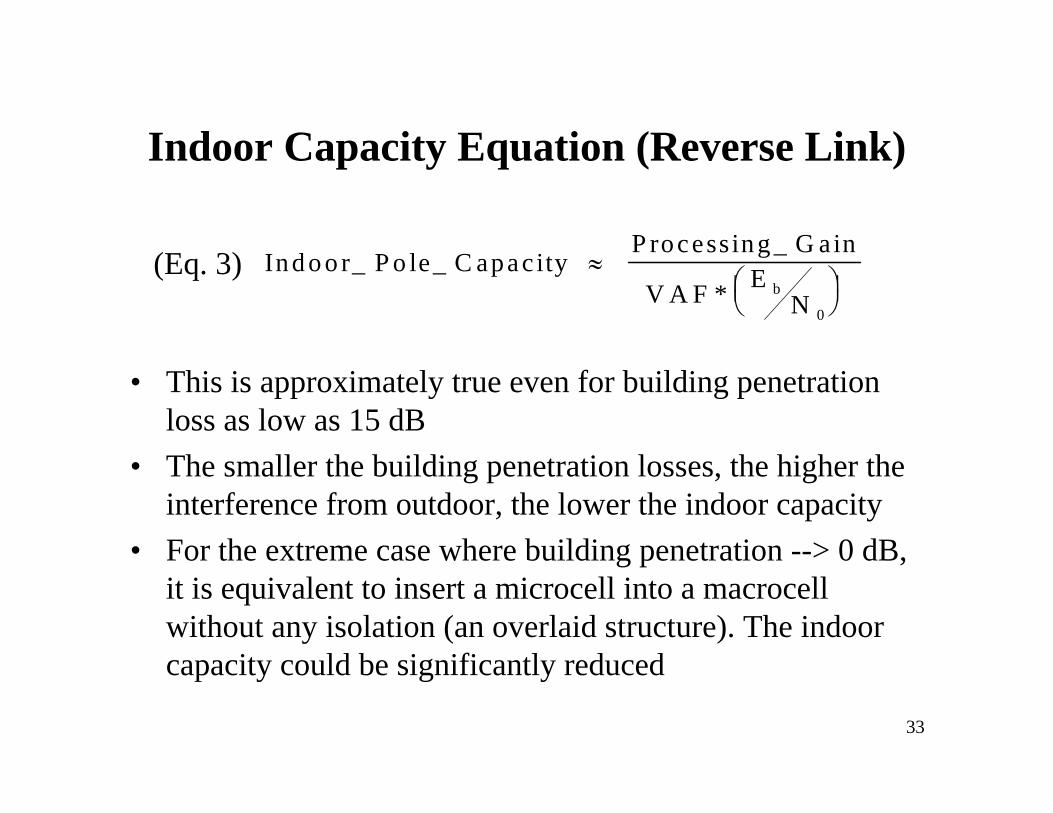
Indoor Capacity Equation (Reverse Link)
• This is approximately true even for building penetrationloss as low as 15 dB
• The smaller the building penetration losses, the higher theinterference from outdoor, the lower the indoor capacity
• For the extreme case where building penetration --> 0 dB,it is equivalent to insert a microcell into a macrocellwithout any isolation (an overlaid structure). The indoorcapacity could be significantly reduced
Indoor_ P o le_ C apacity P rocessing_ G ain
V A F *E
Nb
0
»æèç ö
ø÷
(Eq. 3)

34
Forward Link Capacity
• To estimate the forward link capacity for indoor system,first look at the forward capacity for outdoor system
Fwd_ Link_ Capacity =
Tot_ Traffic_ Channel_ Power
VAF*SHF*(Ave.Pwr_ per_ Mobile)
VAF = voice activitySHF = soft handoff reduction factor
Overhead Power
Total Powerfor TrafficChannels
TotalHPA’sPower
Ave. Pwr for one traffic channel
35
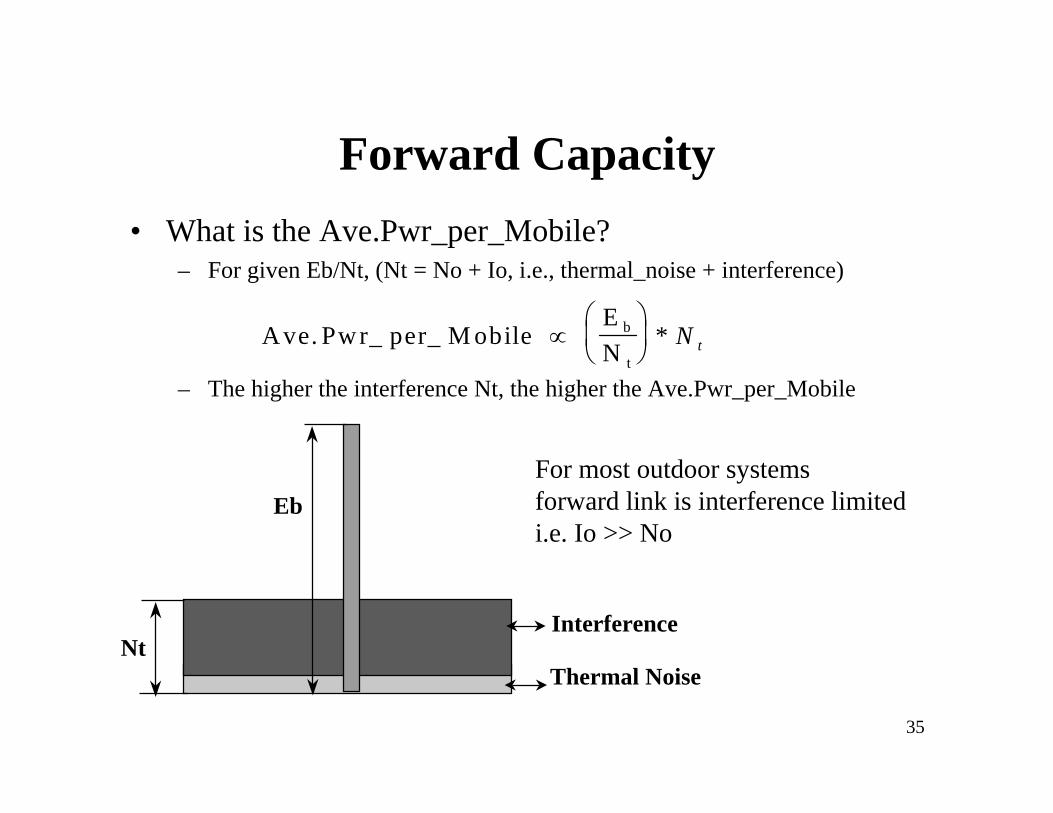
Forward Capacity
• What is the Ave.Pwr_per_Mobile?– For given Eb/Nt, (Nt = No + Io, i.e., thermal_noise + interference)
– The higher the interference Nt, the higher the Ave.Pwr_per_Mobile
Ave. Pwr_ per_ M obile E
Nb
t
µæ
èç
ö
ø÷ * N t
Nt
Eb
Interference
Thermal Noise
For most outdoor systemsforward link is interference limitedi.e. Io >> No
36
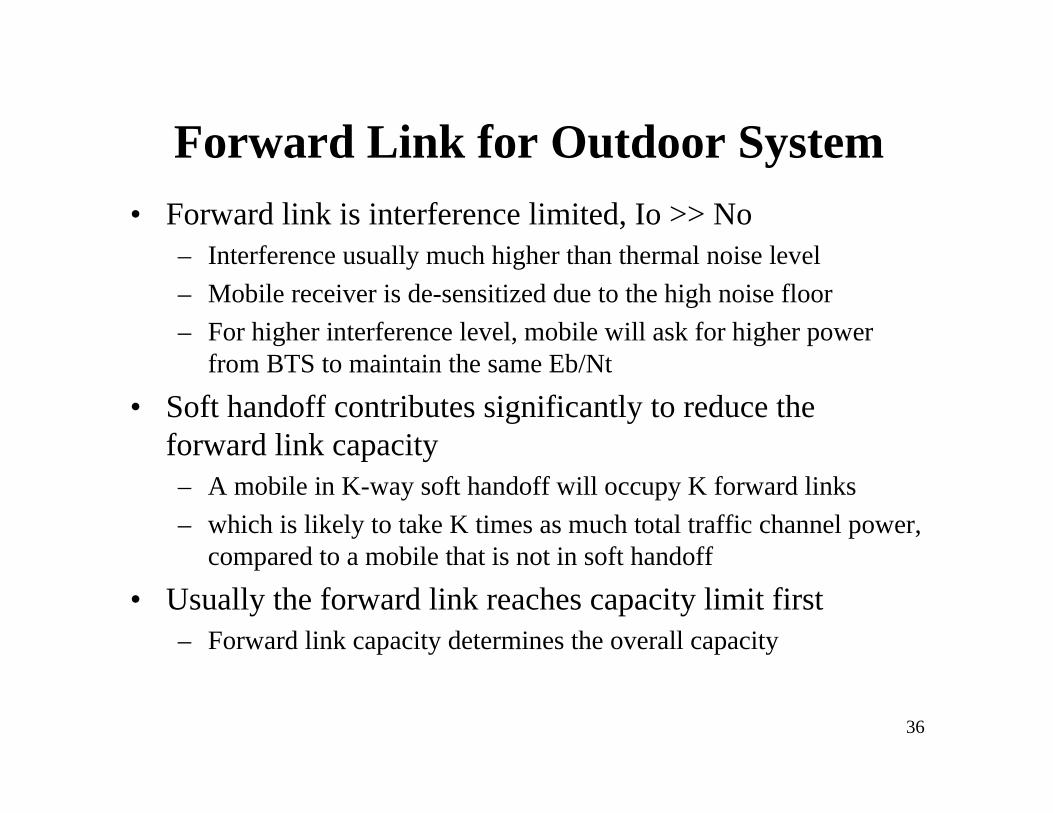
Forward Link for Outdoor System• Forward link is interference limited, Io >> No
– Interference usually much higher than thermal noise level
– Mobile receiver is de-sensitized due to the high noise floor
– For higher interference level, mobile will ask for higher powerfrom BTS to maintain the same Eb/Nt
• Soft handoff contributes significantly to reduce theforward link capacity– A mobile in K-way soft handoff will occupy K forward links
– which is likely to take K times as much total traffic channel power,compared to a mobile that is not in soft handoff
• Usually the forward link reaches capacity limit first– Forward link capacity determines the overall capacity
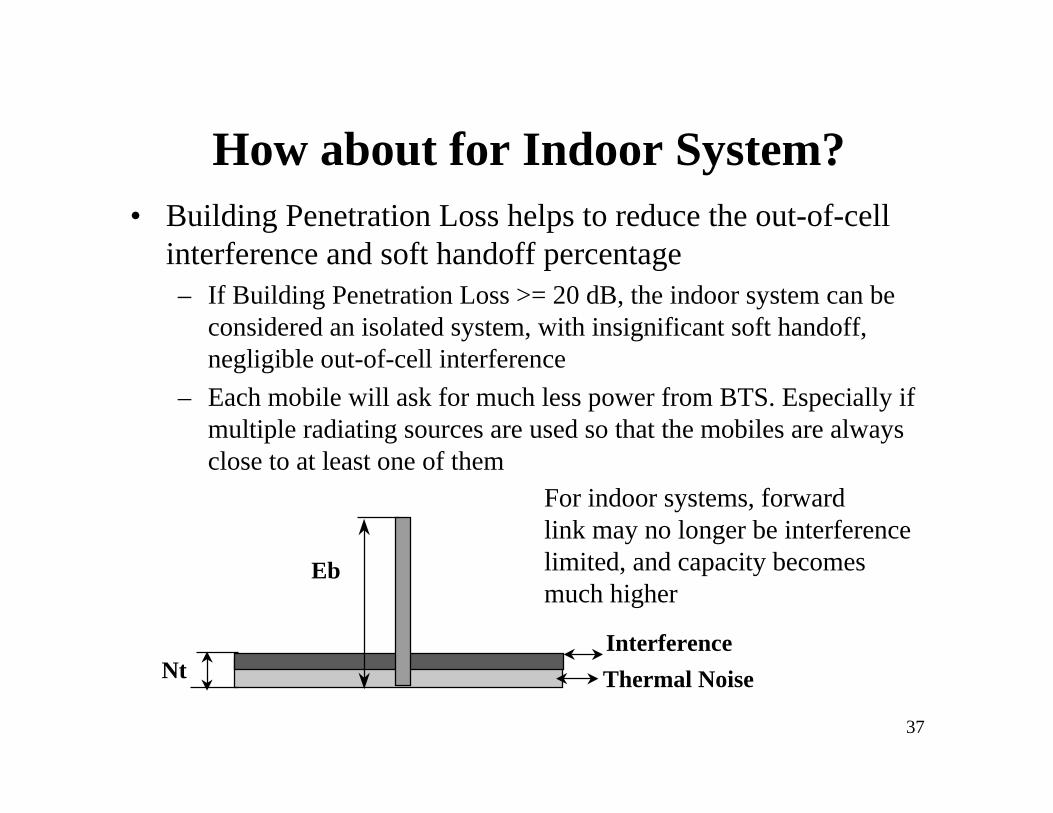
37
How about for Indoor System?• Building Penetration Loss helps to reduce the out-of-cell
interference and soft handoff percentage– If Building Penetration Loss >= 20 dB, the indoor system can be
considered an isolated system, with insignificant soft handoff,negligible out-of-cell interference
– Each mobile will ask for much less power from BTS. Especially ifmultiple radiating sources are used so that the mobiles are alwaysclose to at least one of them
Nt
Eb
Interference
Thermal Noise
For indoor systems, forward link may no longer be interferencelimited, and capacity becomes much higher

38
Indoor Capacity (Overall)
• Because the forward link capacity becomes much higher, the overallsystem’s capacity is limited by the reverse link capacity, given in Eq.(3)
• The upper bound of the indoor capacity per sector (Eq.3) is
• Here Eb/Nt = 7 dB, and Processing Gain = 19.3 dB are assumed
• For 50% of pole capacity, it is about 19 users/sector
• This number will be smaller for smaller building penetration loss
[ ]
P o l e _ C a p a c i t y P r o c e s s i n g _ G a i n
V A F *E
N
U s e r s
b
0
»æèç ö
ø÷
= »8 5 3 3
0 4 5 53 8
.
. *
39
When Not to deploy Indoor Microcells?
• From the capacity analysis it is clear that BuildingPenetration Loss plays an important rule for the capacity ofthe indoor microcells– At one extreme case where the Building Penetration Loss is
infinity, the indoor system is an isolated system, capacity (given inEq.3) is much higher than that of a conventional outdoor cell
– At the other extreme case where the Building Penetration Loss iszero, it is equivalent to insert a microcell into existing macrocell.Both system’s capacity could be degraded because of mutualinterference
40
When Not to deploy Indoor Microcells(con’t)?
• If both of the following situations are true, it is not a goodidea to deploy indoor microcell:– If the in-building coverage from the outdoor macrocell is already
very good (>= -80 dBm) in most of indoor locations
– If the Building Penetration Loss is too small (<< 10 dB, like someglass buildings)
• If indoor microcells are deployed, then– The entire building could become a big soft handoff zone, in that
case the loading from the outdoor BTS is not released
– If the microcell’s signal is strong enough, so that the mobiles arenot in SHO with outdoor system, them RF energy from outdoorsystem will be pure interference to indoor system

41
Wall Penetration Loss vsBuilding Penetration Loss
• Wall Penetration Loss (WPL)– Defined as the difference between the signal level measured
outside of the wall and that measured inside of the wall
– For the same building, WPL value is not a constant
– The difference in WPL > 10 dB, for locations near the window andlocations without window
– For normal and gazing incidence, the difference in WPL > 15 dB
• Building Penetration Loss (BPL)– Defined as the difference between the average signal level
measured inside the entire 1st floor and the average level measuredoutside at street level
– Each building’s BPL is much more consistent than the WPL
– It is BPL that determines the average “isolation” from indoor tooutdoor, thus determines the capacity of the indoor microcell

42
Wall Penetration Loss vsBuilding Penetration Loss (Con’t)
• A building with low WPL does not necessarilyhave low BPL– BPL is an average value, and the average values is affected by
many factors
– Outer walls, inner walls, ceilings, floors, size of the buildings, …all contributes to BPL
• A glass wall does not necessarily have low WPL– Un-tinted glass may only have WPL of 0 to 2 dB
– Tinted glass (with metal tinting materials) could have WPL > 10dB
– Tinted glass + aluminum mini-blinds can easily have > 15 dB ofWPL
43
Other Comments
• Currently we cannot deploy indoor BTS on a differentcarrier, or HHO won’t work– Our current HHO solution that uses RTD (error: 400 meters) will
not work for the indoor solution
– It may be too expensive to put a Pilot Beacon on every buildingentrance
• If some buildings with low BPL requires extremely highcapacity, the best solution is to add carriers to the outdoormacrocells to gain extra capacities for both outdoor andindoor
44
Nortel’s Indoor MicrocellSolutions
45
Various Hardware Options
• The current approach is using a full / partialmacrocell BTS and guide the RF energy into thebuildings– Use fiber + RF/optical converters (e.g., BriteCell from
AllenTelecom)
– Use cable + splitter and distributed antennasystems(DAS) or leaky cable systems
• With future Multi-Carrier BTS, one BTS maysupport 9 RFMs, which can be located 20 kmsapart from each other
46
Fiber Systems
• Pros:– Fibers usually with low loss
• with good installation, loss typically is about 0.4 dB / km
• BriteCell can handle maximum fiber loss of 3 dB, which isequivalent of 7.5 km
• Cons– Fibers-RF converters usually can handle only very low
power
– Typically the EIRP <= 10 dBm, some times < 2 dBm• Thus many antennas are needed for the same coverage, which
may increases installation cost
47
Configurations• Most fiber systems consists of three parts:
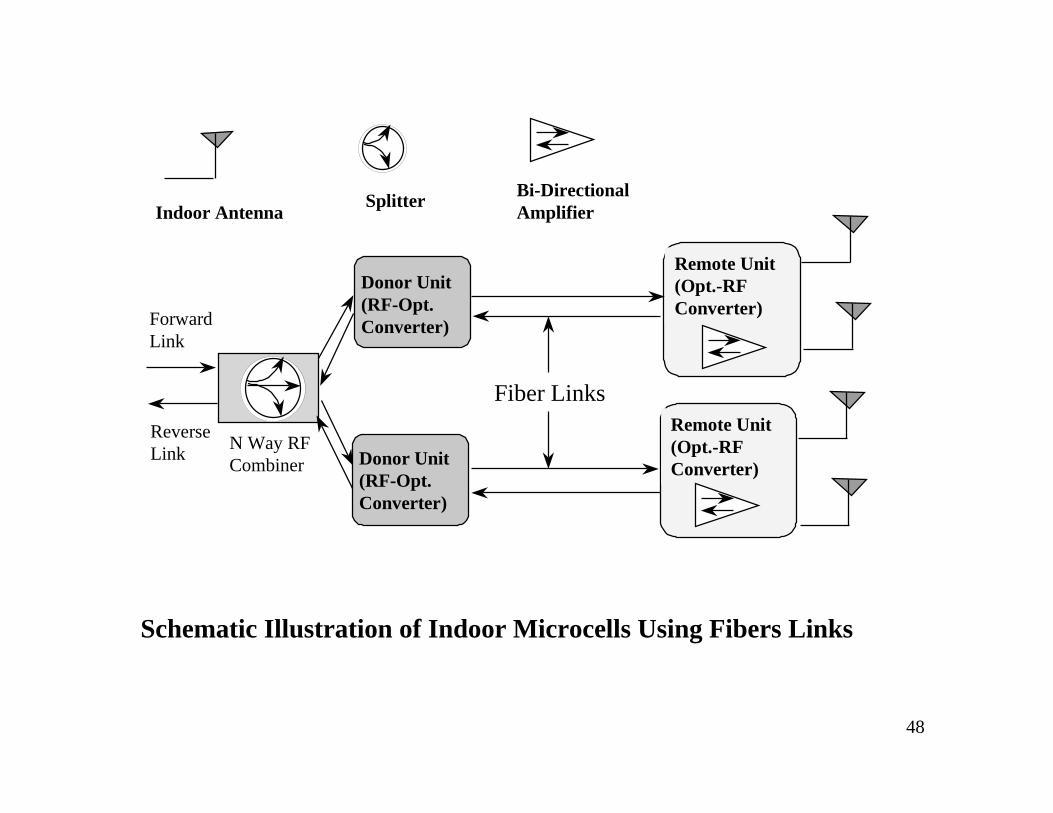
– RF-to-Optical converter (Donor Unit)
– Bi-directional optical transmission system (Fiber Unit)
– Optical-to-RF converter (Remote Unit)
– Remote unit usually contains bi-directional amplifiers for RFsignals in both directions
• Two configurations are possible:– After the HPA: attenuate the power level then send through the
fiber system
– Before the HPA: the HPA (RFFE) can be located remote from theBTS and close to the building. The RF signal is taken from theUpconverter and is converted back to RF for input of RFFE.
– The second option may need further development (interface etc.)
48
Remote Unit(Opt.-RFConverter)
N Way RFCombiner
ForwardLink
ReverseLink
Donor Unit(RF-Opt. Converter)
Donor Unit(RF-Opt. Converter)
Remote Unit(Opt.-RFConverter)
Bi-DirectionalAmplifierIndoor Antenna
Fiber Links
Schematic Illustration of Indoor Microcells Using Fibers Links
Splitter

49
RFFE
RFFE
RFFE
Nortel BTS
Build A Build C
Building B
Fiber Links
Fiber Links
Fiber Links
Building D
FiberLinks
Illustration of one BTS covering multiple buildings. BTS capacity is the main limitation of how many buildings one can serve. With low loss fibers, the building’s relative locations becomes less important.
50
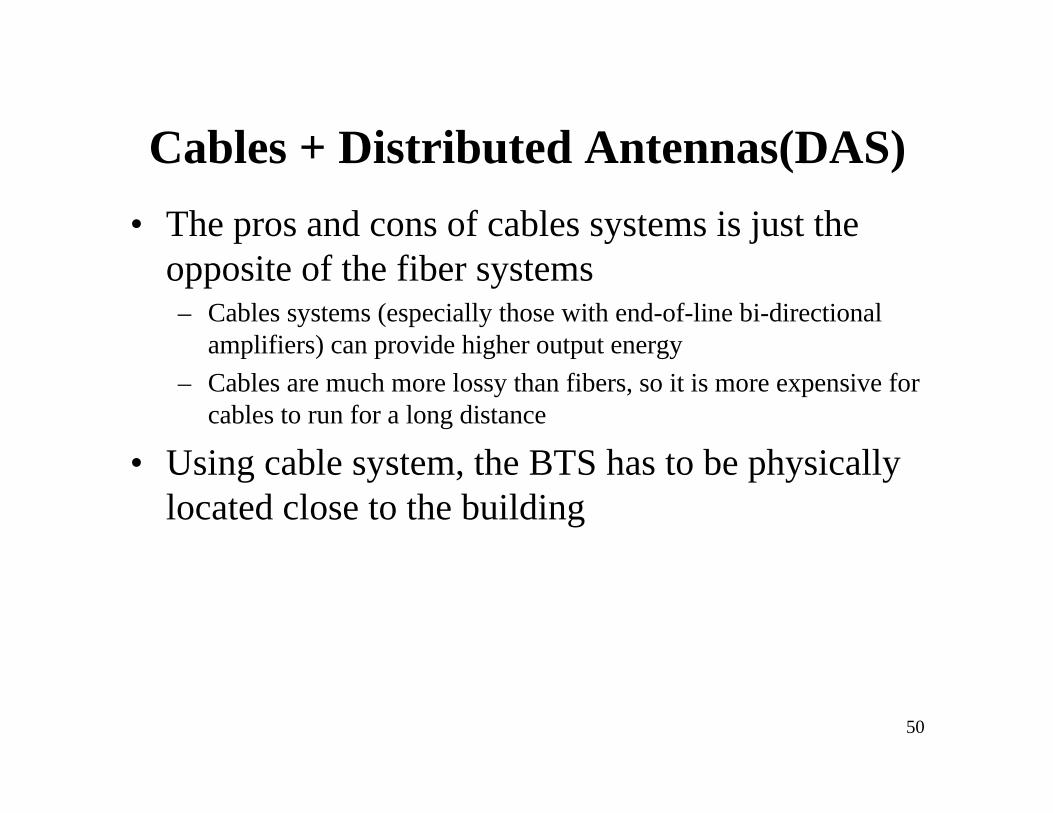
Cables + Distributed Antennas(DAS)
• The pros and cons of cables systems is just theopposite of the fiber systems– Cables systems (especially those with end-of-line bi-directional
amplifiers) can provide higher output energy
– Cables are much more lossy than fibers, so it is more expensive forcables to run for a long distance
• Using cable system, the BTS has to be physicallylocated close to the building

51
Schematic Illustration of Indoor Microcells Using Cables and DAS
RFFE (1900 MHz) ORBTS (800 MHz)
Attenuator
BEX Spliters
DAS: Distributed Antenna SystemsBEX: Base station ExtenterRFFE: RF Front End
Bi-DirectionalAmplifier Splitter
Indoor Antenna
52
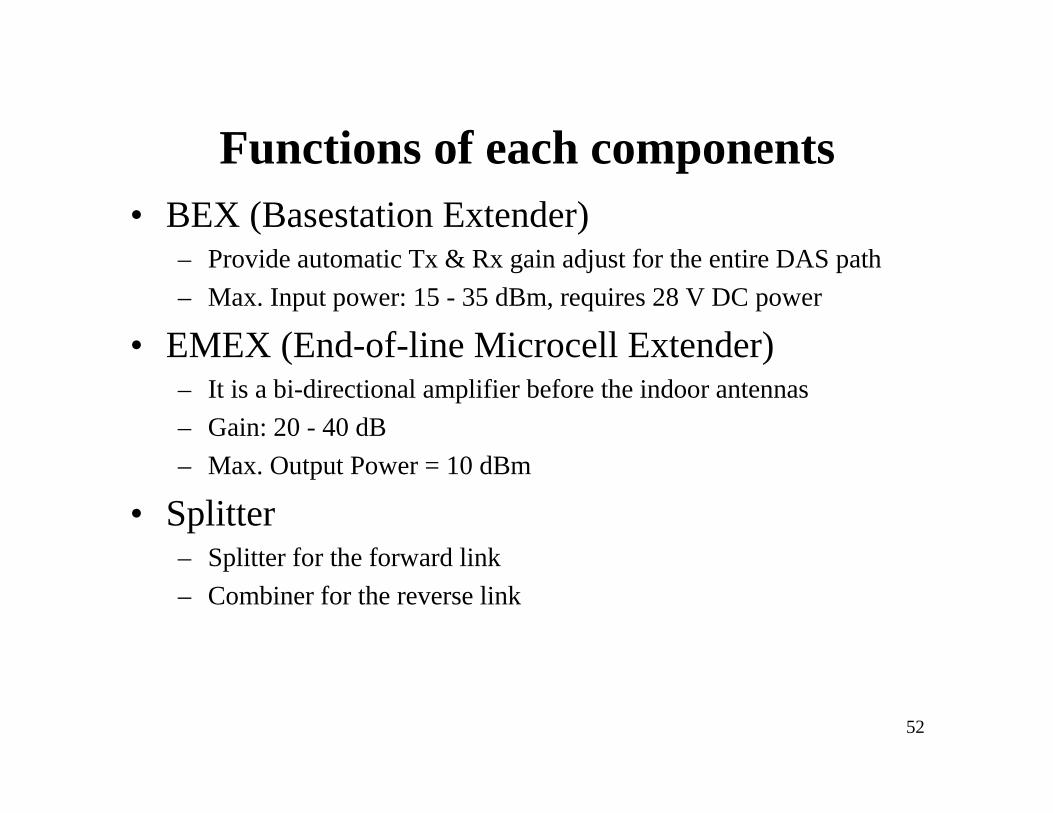
Functions of each components• BEX (Basestation Extender)
– Provide automatic Tx & Rx gain adjust for the entire DAS path
– Max. Input power: 15 - 35 dBm, requires 28 V DC power
• EMEX (End-of-line Microcell Extender)– It is a bi-directional amplifier before the indoor antennas
– Gain: 20 - 40 dB
– Max. Output Power = 10 dBm
• Splitter– Splitter for the forward link
– Combiner for the reverse link

53
Radiating Cable Systems• Pros:
– Provides most uniform coverage, better than any antenna systems
– Can reach any place cables can reach, can provide almost 100% ofindoor coverage
– Can handle any kinds of irregular geometry of the building,particularly suitable for curved tunnels
– Minimum interference to outdoor systems (because of lowradiating power)
– Cables are wideband, same cable can handle different frequencies
• Cons:– It is the most expensive solution of all
– Installation is also very costly
• Recommended if other solutions are unsatisfactory
54
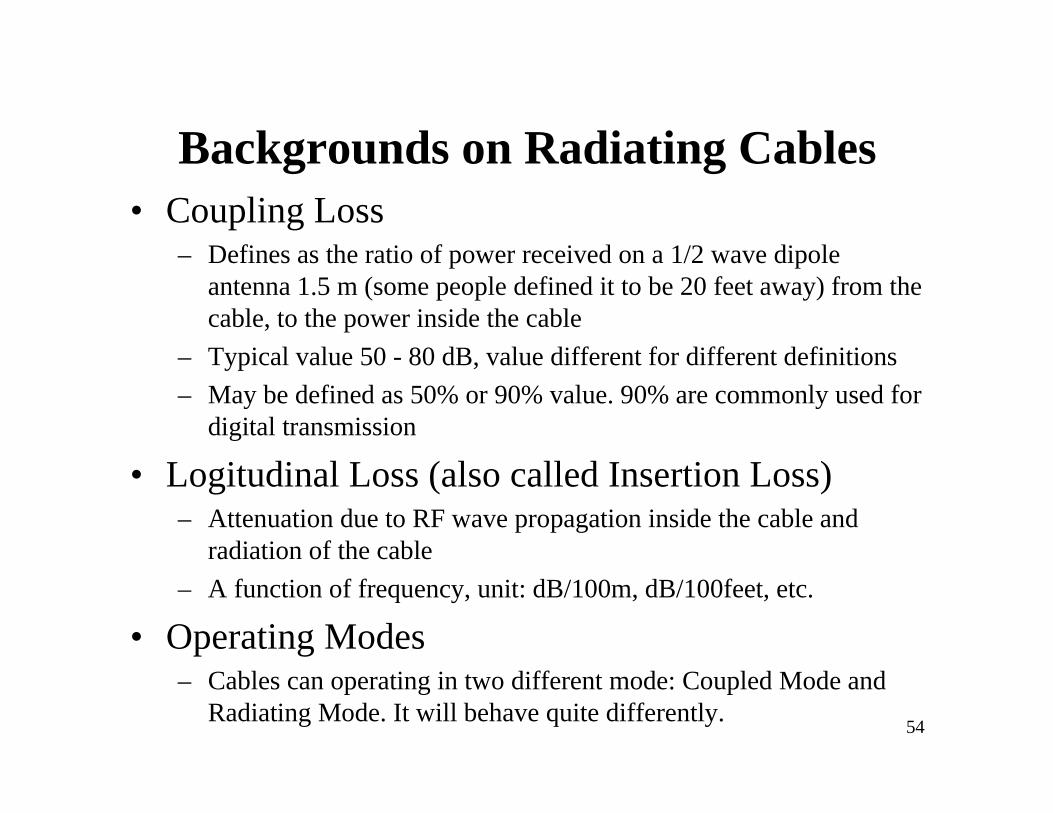
Backgrounds on Radiating Cables• Coupling Loss
– Defines as the ratio of power received on a 1/2 wave dipoleantenna 1.5 m (some people defined it to be 20 feet away) from thecable, to the power inside the cable
– Typical value 50 - 80 dB, value different for different definitions
– May be defined as 50% or 90% value. 90% are commonly used fordigital transmission
• Logitudinal Loss (also called Insertion Loss)– Attenuation due to RF wave propagation inside the cable and
radiation of the cable
– A function of frequency, unit: dB/100m, dB/100feet, etc.
• Operating Modes– Cables can operating in two different mode: Coupled Mode and
Radiating Mode. It will behave quite differently.

55
Backgrounds on Radiating Cables• Coupled Mode (leaky mode)
– If distance between slots < 10 cm, all cables are in coupled modes
– The random fluctuation of signal level is very big, any nearbyobstacles will strongly disturb the signal
– Signal attenuate very fast with distance, follows r-2 rule even forlong cables
• Radiating Mode– Produced by well defined, regular slots arrangement on the cable
– Much more efficient than coupled mode
– random fluctuation is much smaller, less affected by the nearbyobstacles
– Signal attenuates much slower with distance, follows r-1 rule forlong cables
56
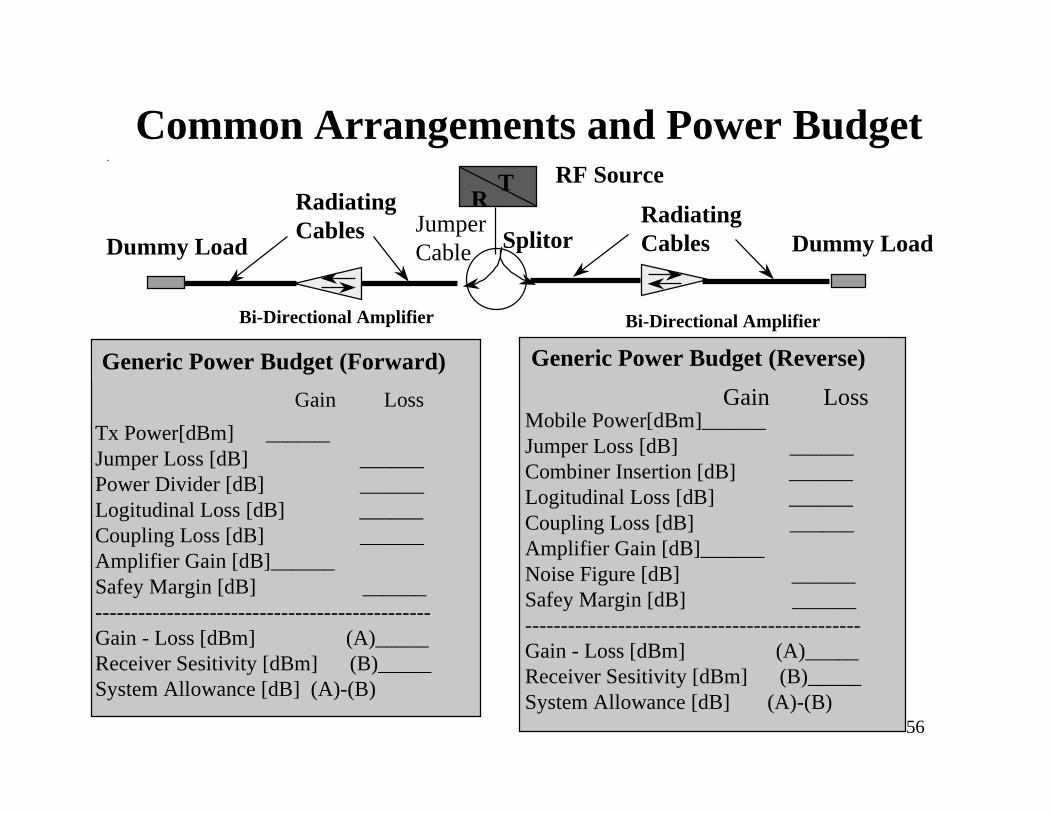
Common Arrangements and Power BudgetT
RRF Source
Splitor
Bi-Directional AmplifierBi-Directional Amplifier
Dummy Load Dummy Load
RadiatingCables
Generic Power Budget (Forward)
Tx Power[dBm] ______Jumper Loss [dB] ______Power Divider [dB] ______Logitudinal Loss [dB] ______Coupling Loss [dB] ______Amplifier Gain [dB]______Safey Margin [dB] ______-----------------------------------------------Gain - Loss [dBm] (A)_____Receiver Sesitivity [dBm] (B)_____System Allowance [dB] (A)-(B)
Gain Loss
Generic Power Budget (Reverse)
Mobile Power[dBm]______Jumper Loss [dB] ______Combiner Insertion [dB] ______Logitudinal Loss [dB] ______Coupling Loss [dB] ______Amplifier Gain [dB]______ Noise Figure [dB] ______Safey Margin [dB] ______ ----------------------------------------------- Gain - Loss [dBm] (A)_____Receiver Sesitivity [dBm] (B)_____System Allowance [dB] (A)-(B)
Gain Loss
JumperCable
RadiatingCables
57
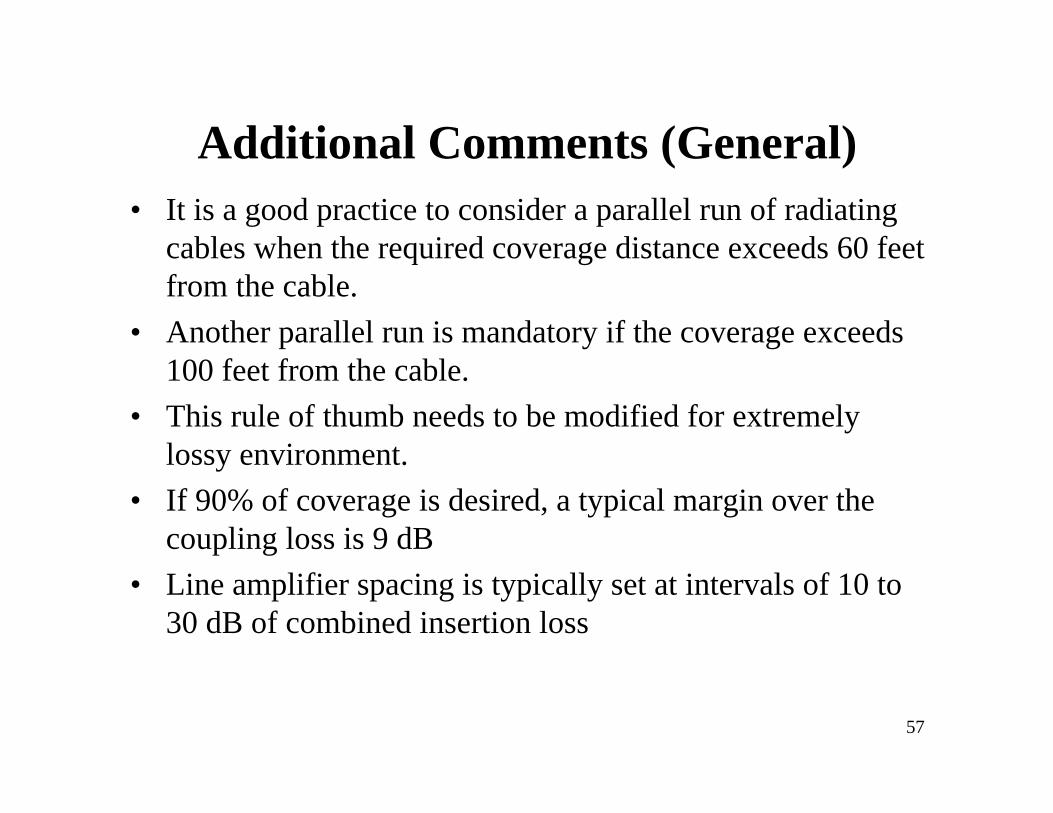
Additional Comments (General)• It is a good practice to consider a parallel run of radiating
cables when the required coverage distance exceeds 60 feetfrom the cable.
• Another parallel run is mandatory if the coverage exceeds100 feet from the cable.
• This rule of thumb needs to be modified for extremelylossy environment.
• If 90% of coverage is desired, a typical margin over thecoupling loss is 9 dB
• Line amplifier spacing is typically set at intervals of 10 to30 dB of combined insertion loss
58
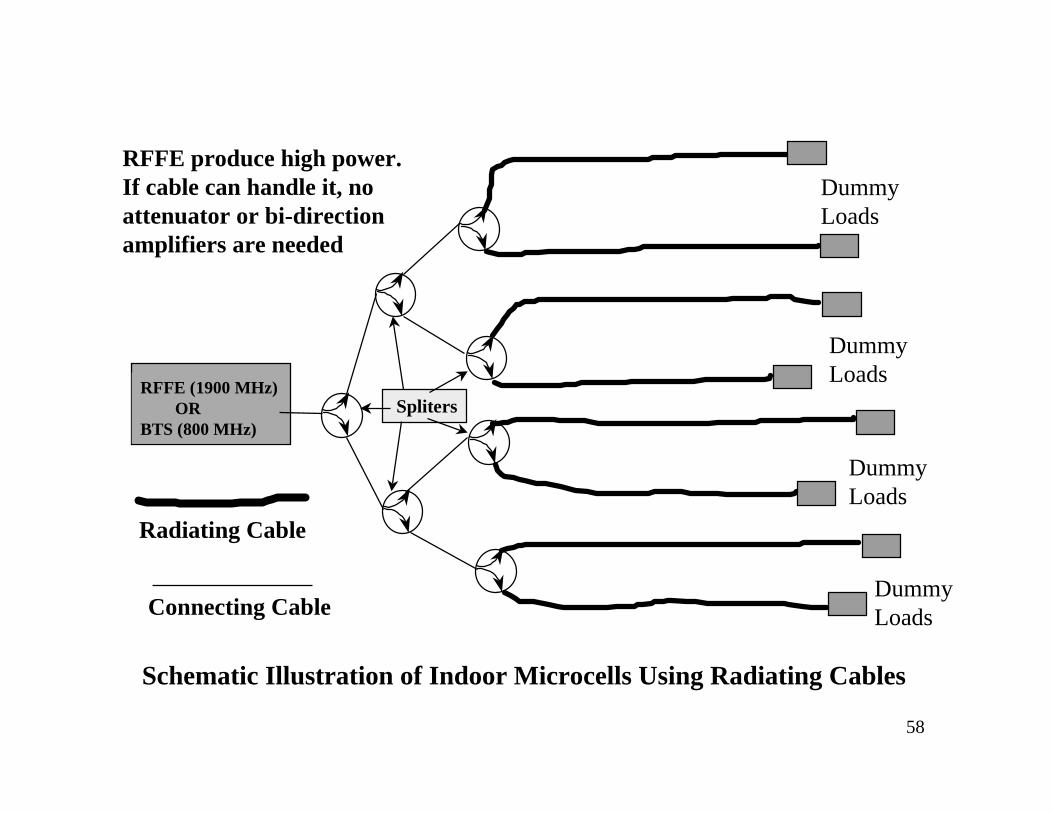
RFFE (1900 MHz) ORBTS (800 MHz)
Spliters
Schematic Illustration of Indoor Microcells Using Radiating Cables
DummyLoads
DummyLoads
DummyLoads
DummyLoads
RFFE produce high power. If cable can handle it, no attenuator or bi-direction amplifiers are needed
Radiating Cable
Connecting Cable

59
Future MCBTS
• Single Carrier BTS (Current)– RFFE simply contains bi-direction amplifiers (HPA + LNA) plus
bandpass filters (duplexer + Rx filters)
– BTS contains both digital (e.g., Channel Cards) and RF equipment(e.g., Upconverters and Receiver Cards)
– One BTS can support up to 3 RFFEs, at the same carrier frequency
• Multi-Carrier BTS (Future)– All RF components will be moved to standing alone units called
RF Module (RFM)
– BTS will only contain digital units
– One BTS can support up to 9 RFMs, either all in one frequency, orin 3 different frequencies, or other combinations
– Fiber connection between BTS and RFM can allow up to 20 kmremote RFMs (called Ultra Remote RFMs)
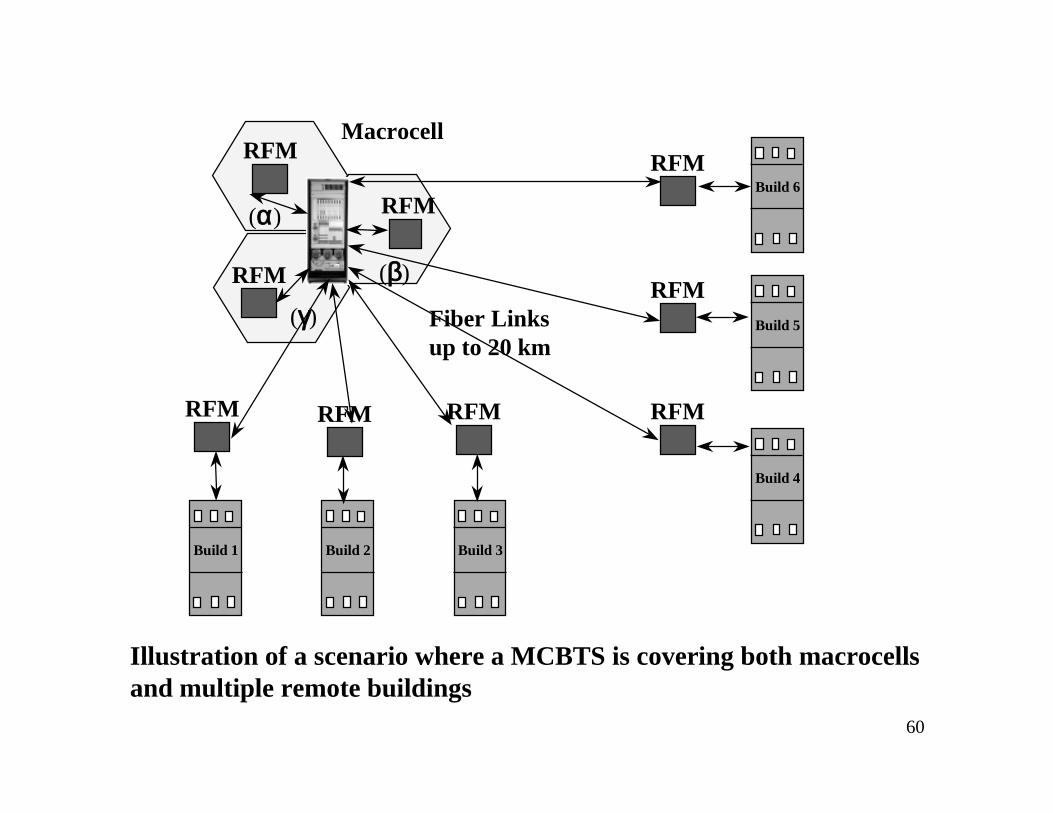
60
RFM
RFM
RFM
RFM RFM RFM RFM
RFM
RFM
Macrocell
(β)
(α)
(γ) Fiber Linksup to 20 km
Build 6
Build 5
Build 4
Build 3Build 2Build 1
Illustration of a scenario where a MCBTS is covering both macrocellsand multiple remote buildings
61
Summary
62
For Optimum Coverage• Different buildings will have very different propagation
characteristics– Divide buildings into different categories and apply different
empirical formula to different types of buildings
• If large floor penetration loss (> 20 dB) is expected, deploya set of antennas to each floor
• To provide uniform coverage to indoor systems– Use larger number of low power radiating source instead of
smaller number of high power radiating sources;
– e.g., use multiple, distributed antenna system in a simulcastfashion, each different antenna with a different delay
– alternatively, use radiating cables to create a uniform coveragewith low signal level
– This will also minimize interference to outdoor systems
63
For Optimum Capacity• Buildings act like “natural shield” and provides RF
isolation between the indoor and outdoor systems
– The higher the building penetration loss, the better the isolation,the higher the capacity of the indoor systems
– Don’t deploy indoor microcells if the building penetration loss istoo low
• Proper antennas types, locations and orientations will alsoreduce the mutual interference– Use directional, distributed antennas and point the main beams
toward inside, point the nulls toward outside.
– Leaky cables with low Tx power can provide similar effect
• The capacity upper bound of an indoor microcell is equalto that of a single, isolated CDMA cell.
64
Various Hardware Options
• Low Power Fiber:– CellExtender using fiber links (e.g., BriteCell)
– Can reach several kms of distance, but power level is usually low
• Low Power Fiber + High Power Amplifiers– Relative high power, bi-directional amplifiers are added at the end
of the fiber (near the building, remote to BTS)
– Examples are ultra remote RFM in the future MCBTS
• Cable + Splitter + (attenuator/amplifiers)– Can provide higher power than BriteCell, but BTS must be close to
the buildings
– Examples are systems used in Rideau Center in Canada

65
References

66
Reference Part I: Indoor Propagations and Coverage:
“Propagation Measurements and Models for Wireless Communications Channels”,J. Anderson, T. Rappaport and S. Yoshida, IEEE Communications Magazine, Nov.94.
“914 MHz path loss prediction models for indoor wireless communications inMulti-floored buildings”, S. Seidel, T. Rappaport, IEEE Trans. on Antennas andPropagations, Vol. 40, No. 2, pp. 207 - 217, Feb. 1992.
“Analysis of Composite Walls and Their Effects on Short-Path PropagationModeling”, IEEE Trans. on Vehicular Tech, Vol. 46, No. 3, Aug. 1997.
“Propagation into and withing Buildings at 900, 1800 and 2300 MHz”, A. Toledo,A. Turkmani, IEE Proceedings, Vol. 138, No.6, Dec. 1991.
“The impact of surrounding Buildings on Propagation for Wireless in-buildingPersonal Communications Systems Design”, S. Seidel, et. al, IEEE Trans. onVehicular Tech, pp. 814, may 1992.
67
Reference Part I: Indoor Propagation and Coverage (Con’t)
“The Indoor Radio Propagation Channel”, H. Hashemi, Proceedings of the IEEE, Vol. 81, No. 7, pp. 943-968, July, 1993.
“Review in Radio Propagation into and within buildings”, IEE Proceedings, Vol. 138, No.1, pp. 61-73, February 1991.
“Measurements of 800 MHz Radio Transmission into Buildings with Metallic Walls”,D. Cox, R. Murray and A. Norris, Bell Systems Technical Journal, Vol. 62, No. 9, pp. 2695 - 2717, Nov. 1983.
“Multi-frequency radio wave propagation measurements in the portable radio environment”, IEEE ICC, pp. 1334-1340, 1990.
“Time Delay Spread and Signal Level Measurement of 850 MHz Radio Waves in Building Environment”, IEEE Trans. on Antenna and Propagations, Vol. AP-34, No. 2, pp. 1300 - 1305, Nov. 1986.
“The Mobile Radio Propagation Channel”, D. Parsons, John Wiley &Sons, 1992.
68
Reference Part II: Forward and Reverse Link Capacity
“On the Capacity of a Cellular CDMA System”, K. Gilhousen et. al, IEEETrans.on Vehicular Technology, Vol. 40, No. 2, May 1991.
“CDMA System Engineering Handbook”, Vol.I&II, Qualcomm, 1994.
“Forward Link Capacity Test History”, Martin Kendall, Nortel Tech.Applications, Dec. 1997
“Forward Link Capacity”, Ahmad Jalali, BNR 2N Group.
“CDMA: Principles of Spread Spectrum Communication”, A. Viterbi, Addison-Wesley, 19995.
“Spread Spectrum Communications Handbook”, M. Simon et. al, McGraw-Hill,1994.
69
Reference Part III: Fiber CellExtender, Distributed Antennas and Leaky Cables
“BriteCell Technical Manual”, AllenTelecom, 1997.
“Radiating Cable Handbook”, Radio Frequency Systems, 1997.
“CDMA In-Building Microcell Test (Rideau Center), A. Morrison, et. al, Nortel, 1997.
“In-Building Tricks”, D. Burt, Communications, June 1994.
“Fiber Optic Microcellular Radio”, T. Chu et. al, IEEE Trans. on Vehicular Tech. Vol. 40, No. 3, Aug. 1991.
“Cordless Communications using Radio over Fiber Techniques for the Local LoopC. Harvey, et. al, pp. 1171 - 1175, ICC 1991.