Embed Size (px)
Citation preview
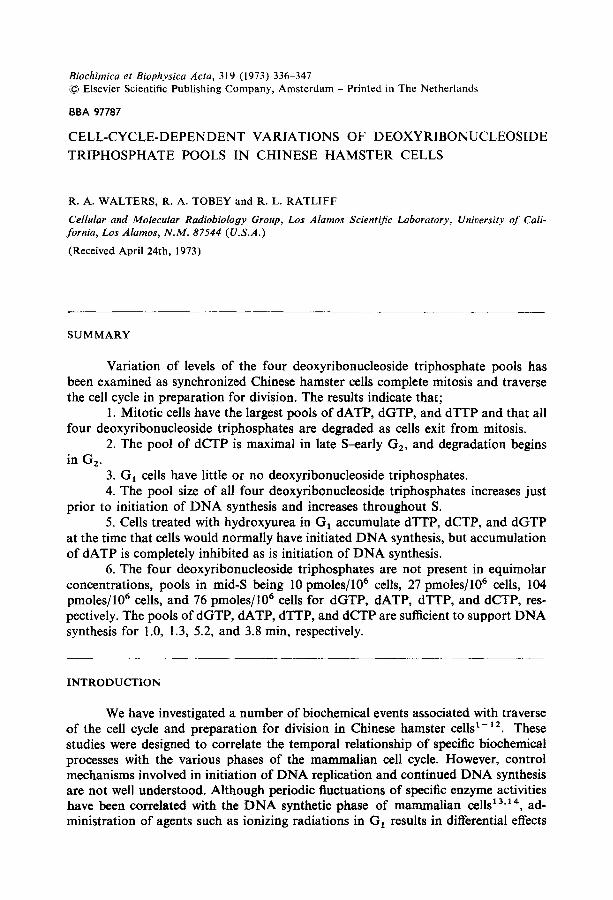
Biochimica et Biophysica Acta, 319 (1973) 336-347 © Elsevier Scientific Publishing Company, Amsterdam - Printed in The Netherlands
BBA 97787
CELL-CYCLE-DEPENDENT VARIATIONS OF DEOXYRIBONUCLEOSIDE TRIPHOSPHATE POOLS IN CHINESE HAMSTER CELLS
R. A. WALTERS, R. A. TOBEY and R. L. RATLIFF
Cellular and Molecular Radiobiology Group, Los Alamos Scientific Laboratory, University of Cali- fornia, Los Alamos, N.M. 87544 (U.S.A.)
(Received April 24th, 1973)
S U M M A R Y
Variation of levels of the four deoxyribonucleoside triphosphate pools has been examined as synchronized Chinese hamster cells complete mitosis and traverse the cell cycle in preparation for division. The results indicate that;
1. Mitotic cells have the largest pools of dATP, dGTP, and dTTP and that all four deoxyribonucleoside triphosphates are degraded as cells exit from mitosis.
2. The pool of dCTP is maximal in late S-early G2, and degradation begins in G2.
3. G1 cells have little or no deoxyribonucleoside triphosphates. 4. The pool size of all four deoxyribonucleoside triphosphates increases just
prior to initiation of DNA synthesis and increases throughout S. 5. Cells treated with hydroxyurea in G1 accumulate dTTP, dCTP, and dGTP
at the time that cells would normally have initiated DNA synthesis, but accumulation of dATP is completely inhibited as is initiation of DNA synthesis.
6. The four deoxyribonucleoside triphosphates are not present in equimolar concentrations, pools in mid-S being 10 pmoles/106 cells, 27 pmoles/106 cells, 104 pmoles/106 cells, and 76 pmoles/106 cells for dGTP, dATP, dTTP, and dCTP, res- pectively. The pools of dGTP, dATP, dTTP, and dCTP are sufficient to support DNA synthesis for 1.0, 1.3, 5.2, and 3.8 min, respectively.
I N T R O D U C T I O N
We have investigated a number of biochemical events associated with traverse of the cell cycle and preparation for division in Chinese hamster cells t-12. These studies were designed to correlate the temporal relationship of specific biochemical processes with the various phases of the mammalian cell cycle. However, control mechanisms involved in initiation of DNA replication and continued DNA synthesis are not well understood. Although periodic fluctuations of specific enzyme activities have been correlated with the DNA synthetic phase of mammalian cells la'~*, ad- ministration of agents such as ionizing radiations in G1 results in differential effects
DEOXYRIBONUCLEOS1DE TRIPHOSPHATE POOLS 337
on the appearance of certain of these enzyme activities 15'16. Since control of some of the enzymes involved in DNA synthesis is mediated by the deoxyribonucleoside triphospates 17'1s, the metabolism of deoxyribonucleoside triphosphates was exam- ined in highly synchronized Chinese hamster cells.
MATERIALS AND METHODS
Cell culture and synchronization Chinese hamster cells (line CHO) were maintained free of PPLO as suspension
cultures in F-10 medium supplemented with 10 ~o calf and 5 ~o fetal calf sera, penicillin, and streptomycin. Cells were synchronized by selectively detaching mitotic cells from monolayer cultures x9. The mitotic cells, cooled to 0 °C after collecting, were released by resuspending in medium at 37 °C. Measurements made with mitotic cells were performed within 10 min after collecting. Cells were resynchronized in late G1 by adding hydroxyurea (10- 3 M) at 2 h and removing the drug 10 h after mitotic syn- chronization 2°. The cell doubling time of exponentially growing cultures ranged from 16-18 h. Under these conditions, S and G2+M were 4 and 3.5 h, respectively. G 1 varied from approx. 9-11 h. Cell concentration was determined by an electronic particle counter.
Isolation of deoxyribonucleoside triphosphate pools The acid-soluble pools were isolated from cultures (1 • 106-3 • l 0 6 cells) by the
following protocol. Cell suspensions were cooled immediately to 3 °C, and thereafter all operations were performed at 3 °C. The cells were centrifuged at low speed (2800 rev./min) for 5 min, and the resulting pellet was suspended in 1 ml 0.5 M HCIO4 for 20 min. Following centrifugation, the supernatant was removed, made 0.05 M Tris by addition of 1 M Tris-HC1 buffer (pH 8.0), and neutralized with 5 M KOH to a final pH of 7.5-8.0. After neutralization, the samples were centrifuged to remove KC104, and the supernatant was used for determination of the four deoxyribonucleo- side triphosphates.
Deoxyribonucleoside triphosphates Nonlabeled deoxyribonucleoside triphosphates were purchased from Nutri-
tional Biochemicals Corp. and Schwarz/Mann Corp. Deoxyribonucleoside triphos- phates, ~-32p-labeled, were obtained from New England Nuclear Corp. and the International Chemical and Nuclear Corp. The purity of the compounds was deter- mined by paper chromatography in absolute ethanol-1 M ammonium acetate (pH 3.8)-0.1 M NaEDTA (pH 8.7) 22 (75 : 29 : 1, by vol.).
Micrococcus luteus DNA polymerase The enzyme was purified as described by Zimmerman 22. The hydroxylapatite
fraction (Fraction V) had a specific activity of 600 units/mg protein when assayed with poly [d(A-T) • d(A-T)] as template. A stock solution of the enzyme was stored at - 10 °C in 0.3 M Tris-HCl buffer (pH 8.0) and 30 ~ ethylene glycol.
Preparation of poly [d(A-T)" d(A-T)] and poly [d(I-C) . d(I-C)] Poly [d(A-T) • d(A-T)] was prepared according to the procedure of Schach-
338 R . A . WALTERS et al .
man et al . 23 and poiy [d(I-C) • d(I-C)] by the procedure of Grant et al . 24 using poly- [d(I-C) • d(I-C)] initially formed as a de novo product by the M. luteus DNA polym- erase using the procedure of Grant et aL 25. The amount of polymer is expressed in terms of equivalents of nucleotide phosphorus.
Standard conditions for determination of deoxyribonucleoside triphosphates The assay procedure for determination of dATP and dTTP was essentially
the same as that previously described 26, and measurements of dCTP and dGTP were performed as described by Skoog 27 except that M. luteus DNA polymerase was used instead of the Escherichia coli DNA polymerase.
A premix of each of the 0~-32p-labeled deoxyribonucleoside triphosphates was prepared and contained per ml: 50 mM Tris-HC1 buffer (pH 8.0 for the dATP and dTTP pools and pH 8.6 for the dCTP and dGTP pools), 5 mM MgC12, 1 mM 2- mercaptoethanol, 500 pmoles of the ~-32p-labeled deoxyribonucleoside triphosphate (spec. act. 9-21 Ci/mmole), 5 nmoles of the appropriate template (poly [d(A-T) • d- (A-T)] or poly [d(I-C) • d(I-C)]), and 18 units of the M. luteus DNA polymerase. For assay of the different deoxyribonucleoside triphosphates from cell extracts, 0.2 ml of the standard assay premix was added to each tube, and 10--50/d of the neutralized cell extract was then added; the mixture was incubated at 37 °C for 1 h. The reaction was terminated by spotting the complete sample on a Whatman GF/B glass-filter disc (2 inches in diameter), along with a water rinse of the reaction tube, and was placed in a mixture of 5 ~ trichloroacetic acid and 1 ~ sodium pyrophosphate. The glass-filter disc was washed three times with the 5 ~o trichloroacetic acid- 1 ~ sodium pyrophosphate and three times with 95 ~ ethanol, dried in an oven at 70 °C, and counted in a Packard liquid scintillation counter. A standard 'curve with known amounts of each limiting deoxyribonucleoside triphosphate was established each time the assay was used, as well as a zero time sample (e.#. minus cell extract for deter- mination of initial uptake of the ~-a2p-labeled deoxyribonucleoside triphosphate).
Each data point reported herein is the average of six separate determinations. The standard error of the mean was never greater than ± 7 ~o. The specificity of the M. luteus DNA polymerase reaction was determined by assaying radioactive incorpo- ration of the appropriate deoxyribonucleoside mono- and diphosphates. In no case was significant incorporation found. Similarly, no incorporation of ribonucleoside triphosphates could be measured.
Autoradiography and mitotic fraction Cells were pulse-labeled for 15min with 1 pCi/ml [Me-aH]thymidine (6
Ci/mmole, Schwarz/Mann), and autoradiographs were prepared as previously de- scribed 2. The mitotic fraction was determined as previously described 28.
RESULTS
Although the method of analysis of deoxyribonucleoside triphosphate content of acid-soluble cell extracts is a modification of the method of Lindberg and Skoog 26 and Skoog 27, DNA polymerase from M. luteus was used in place of E. coli polymerase. Thus, the time-course of reaction and nuclease activity was examined in out system. The data in Fig. 1 show the time-course of reaction when each of the four deoxy-
D E O X Y R I B O N U C L E O S I D E T R 1 P H O S P H A T E POOLS 339
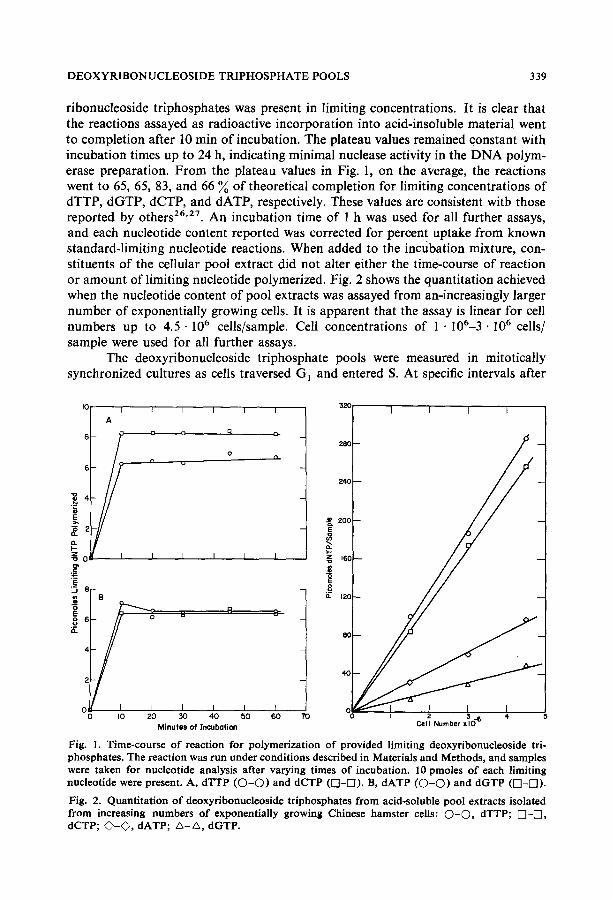
ribonucleoside triphosphates was present in limiting concentrations. It is clear that the reactions assayed as radioactive incorporation into acid-insoluble material went to completion after 10 min of incubation. The plateau values remained constant with incubation times up to 24 h, indicating minimal nuclease activity in the DNA polym- erase preparation. From the plateau values in Fig. 1, on the average, the reactions went to 65, 65, 83, and 66 ~ of theoretical completion for limiting concentrations of dTTP, dGTP, dCTP, and dATP, respectively. These values are consistent witb those reported by others 26'27. An incubation time of 1 h was used for all further assays, and each nucleotide content reported was corrected for percent uptake from known standard-limiting nucleotide reactions. When added to the incubation mixture, con- stituents of the cellular pool extract did not alter either the time-course of reaction or amount of limiting nucleotide polymerized. Fig. 2 shows the quantitation achieved when the nucleotide content of pool extracts was assayed from an-increasingly larger number of exponentially growing cells. It is apparent that the assay is linear for cell numbers up to 4.5-106 cells/sample. Cell concentrations of 1. 106-3 • l06 cells/ sample were used for all further assays.
The deoxyribonucleoside triphosphate pools were measured in mitotically synchronized cultures as cells traversed G t and entered S. At specific intervals after
I0 I A
6
I
4
2
Z 0d
(~ (3-,
n u
I I
I I
D D-
O N
I I
520 I
I 240
200
160 = "6
I I t
8 B ~
o e . P I I 0 10 20 30 40 50 60 70 0 2 3 .--6 4
Minutes of Incubation Cell Number xl0
Fig. ]. Time-course o f reaction fo r polymerizat ion o f provided l imit ing deoxyribonucleoside tri- phosphates. The reaction was run under condit ions described in Materials and Methods, and samples were taken fo r nucleotide analysis after varying times o f incubation. ]0 pmoles o f each l imit ing nucleotide were present, A, dTTP ( O - C ) ) and dCTP ( [ - F 1 ) . B, dATP (C)-C)) and dGTP ( [ ] - r - l ) .
Fig. 2. Quant i tat ion o f deoxyribonuc]eoside triphosphates f rom acid-soluble pool extracts isolated f rom increasing numbers o f exponential ly growing Chinese hamster cells: O -C) , dTTP; [ - [ , dCTP; ~ - ~ , dATP; z ~ - ~ , dGTP.
340 R. A. WALTER~ :~" '
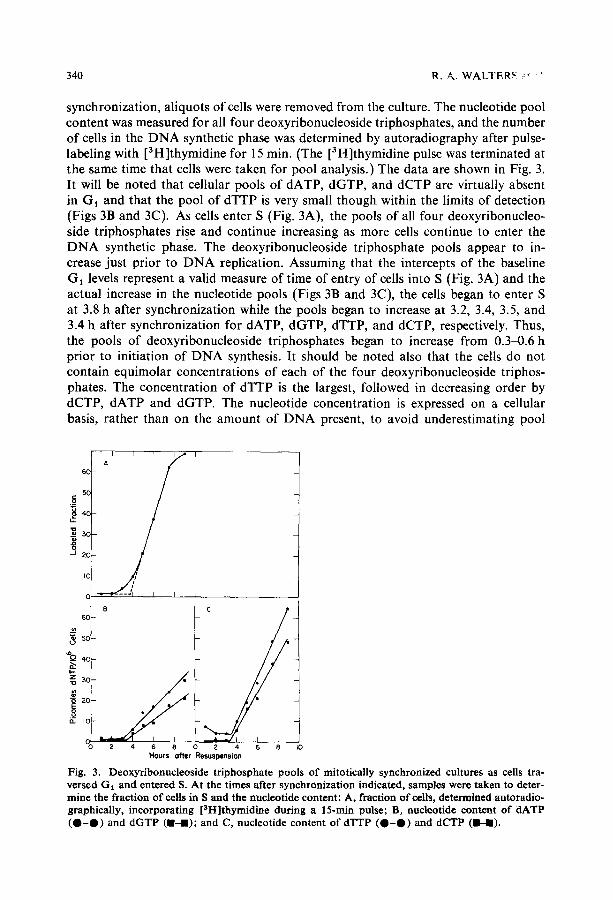
synchronization, aliquots of cells were removed from the culture. The nucleotide pool content was measured for all four deoxyribonucleoside triphosphates, and the number of cells in the DNA synthetic phase was determined by autoradiography after pulse- labeling with [3H]thymidine for 15 min. (The [3H]thymidine pulse was terminated at the same time that cells were taken for pool analysis.) The data are shown in Fig. 3. It will be noted that cellular pools of dATP, dGTP, and dCTP are virtually absent in G1 and that the pool of dTTP is very small though within the limits of detection (Figs 3B and 3C). As cells enter S (Fig. 3A), the pools of all four deoxyribonucleo- side triphosphates rise and continue increasing as more cells continue to enter the DNA synthetic phase. The deoxyribonucleoside triphosphate pools appear to in- crease just prior to DNA replication. Assuming that the intercepts of the baseline G1 levels represent a valid measure of time of entry of cells into S (Fig. 3A) and the actual increase in the nucleotide pools (Figs 3B and 3C), the cells began to enter S at 3.8 h after synchronization while the pools began to increase at 3.2, 3.4, 3.5, and 3.4 h after synchronization for dATP, dGTP, dTTP, and dCTP, respectively. Thus, the pools of deoxyribonucleoside triphosphates began to increase from 0.3~0.6 h prior to initiation of DNA synthesis. It should be noted also that the cells do not contain equimolar concentrations of each of the four deoxyribonucleoside triphos- phates. The concentration of dTTP is the largest, followed in decreasing order by dCTP, dATP and dGTP. The nucleotide concentration is expressed on a cellular basis, rather than on the amount of DNA present, to avoid underestimating pool
6C A I ~1 I I I
,--~ 5C
~ 4c m
J 2C
IC
B C 6C
"~ 5G
"_o 4c
Z~ 5C •
i 2C •
2 4 6 8 0 2 4 6 8 LO Hours offer Resuspension
Fig. 3. Deoxyribonucleoside triphosphate pools of mitotically synchronized cultures as cells tra- versed 131 and entered S. At the times after synchronization indicated, samples were taken to deter- mine the fraction of cells in S and the nucleotide content: A, fraction of cells, determined autoradio- graphically, incorporating [3H]thymidine during a 15-min pulse; B, nucleotide content of dATP ( 0 - 0 ) and dGTP ( 1 - 1 ) ; and C, nucleotide content of dTI'P ( 0 - 0 ) and dCTP ( I - I ) .
DEOXYRIBONUCLEOSIDE TRIPHOSPHATE POOLS 341
concentrations due to increasing DNA content as cells enter S. This is possible, since (1) cell number can be estimated to 4- 1 ~o, and (2) no cell division occurs until ap- prox. 10 h after synchronization. The deoxyribonucleoside triphosphate pools were measured also in Gl-arrested cells obtained by growth for 30 h in isoleucine-deficient medium 29. The pools, all very low, were the same as in Gl-traversing cells.
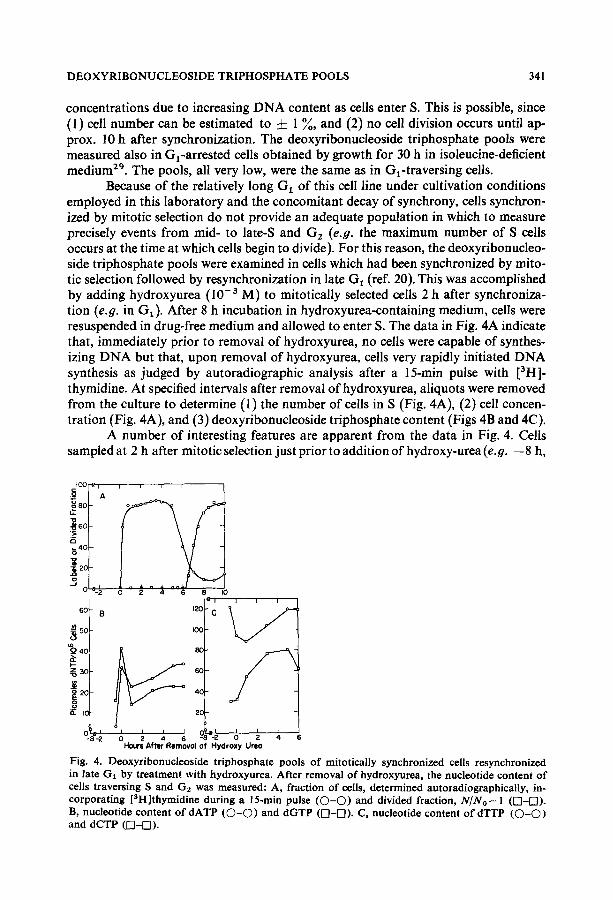
Because of the relatively long GI of this cell line under cultivation conditions employed in this laboratory and the concomitant decay of synchrony, cells synchron- ized by mitotic selection do not provide an adequate population in which to measure precisely events from mid- to late-S and G 2 (e.g. the maximum number of S cells occurs at the time at which cells begin to divide). For this reason, the deoxyribonucleo- side triphosphate pools were examined in cells which had been synchronized by mito- tic selection followed by resynchronization in late G1 (ref. 20). This was accomplished by adding hydroxyurea ( I0 - 3 M) to mitotically selected cells 2 h after synchroniza- tion (e.g. in GI). After 8 h incubation in hydroxyurea-containing medium, cells were resuspended in drug-free medium and allowed to enter S. The data in Fig. 4A indicate that, immediately prior to removal of hydroxyurea, no cells were capable of synthes- izing DNA but that, upon removal of hydroxyurea, cells very rapidly initiated DNA synthesis as judged by autoradiographic analysis after a 15-min pulse with [3H]- thymidine. At specified intervals after removal of hydroxyurea, aliquots were removed from the culture to determine (I) the number of cells in S (Fig. 4A), (2) cell concen- tration (Fig. 4A), and (3) deoxyribonucleoside triphosphate content (Figs 4B and 4C).
A number of interesting features are apparent from the data in Fig. 4. Cells sampled at 2 h after mitotic selection just prior to addition of hydroxy-urea (e.g. --8 h,
A a0
~4C
-~ 2C -5
8
~sc ~ 4c i---
a. Io
j ~
i i i i i
2 4 6
12(:
I (X
6oi
4 0
2O
I0
" C
Hours After Removol of Hydroxy Ureo
Fig. 4. Deoxyribonucleoside triphosphate pools of mitotically synchronized cells resynchronized in late GI by treatment with hydroxyurea. After removal of hydroxyurea, the nucleotide content of cells traversing S and G2 was measured: A, fraction of cells, determined autoradiographically, in- corporating [aHlthymidine during a 15-rain pulse (O-O) and divided fraction, N/No--1 (0-0) . B, nucleotide content of dATP (O-O) and dGTP ([[]-0). C, nucleotide content of dTTP (O-O) and dCTP (0-[[]).
342 R . A . W A L T E R S et al.
Figs 4B and 4C) had the expected G~ deoxyribonucleoside triphosphate concentra- tions (Figs 3B and 3C). However, the concentrations of dGTP, dCTP, and dTTP had increased during the period of incubation with hydroxyurea. When samples were taken 0.5 h prior to removal of hydroxyurea, the concentrations of dGTP, dCTP, and dTTP had increased by approx. 5, 10, and 13 times, respectively, in the absence of DNA synthesis. The concentration of dATP remained low during the entire time of incubation with hydroxyurea. Within 3 min of removal of hydroxyurea, (1) the levels of dATP and dGTP increased by approx. 9 and 2.6 times, respectively, indicating that hydroxyurea effects are readily reversible; (2) the level of dTTP felt to a value of approx. 78 ~o of the pre-release figure; and (3) the level of dCTP remained essenti- ally constant when compared to the nucleotide content observed 30 min prior to removal of hydroxyurea. By 1 h after removal of hydroxyurea, the levels of dATP, dGTP, and dTTP had fallen, with dGTP returning to the level observed prior to removal of hydroxyurea while the dCTP level began to rise. The levels of all four deoxyribonucleoside triphosphates continued to increase up to 5 h after removal of hydroxyurea (Figs 4B and 4C), during which time the number of cells in S was es- sentially constant (Fig. 4A). At 6 h after removal of hydroxyurea, approximately half of the S cells had entered G2. Since cells did not begin to divide until approx. 6.5 h, this represents the time after resynchronization that the maximum number of G2 cells can be obtained and is a factor of 2-3 more G2 cells than can be obtained by mitotic synchronization alone. It is clear that the dCTP pool level alone begins to drop as cells enter G2, presumably by degradation. Taking the pool size in mid-S (e.9. 3 h after hydroxyurea removal) and the requirement that each cell must syn- thesize approx. 6 • 10 -6 pg DNA during S (unpublished observations), it can be cal- culated that the pools of dGTP, dATP, dTTP, and dCTP are sufficient to support synthesis for 1.0, 1.3, 5.2, and 3.8 rain, respectively.
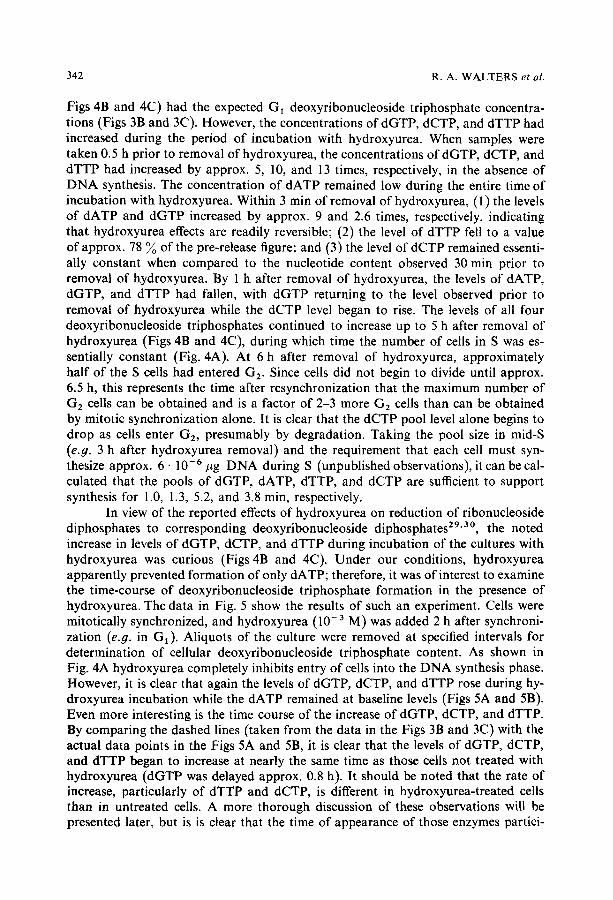
In view of the reported effects of hydroxyurea on reduction of ribonucleoside diphosphates to corresponding deoxyribonucleoside diphosphates 29'3°, the noted increase in levels of dGTP, dCTP, and dTTP during incubation of the cultures with hydroxyurea was curious (Figs 4B and 4C). Under our conditions, hydroxyurea apparently prevented formation of only dATP; therefore, it was of interest to examine the time-course of deoxyribonucleoside triphosphate formation in the presence of hydroxyurea. The data in Fig. 5 show the results of such an experiment. Cells were mitotically synchronized, and hydroxyurea (10-3 M) was added 2 h after synchroni- zation (e. 9. in G~). Aliquots of the culture were removed at specified intervals for determination of cellular deoxyribonucleoside triphosphate content. As shown in Fig. 4A hydroxyurea completely inhibits entry of cells into the DNA synthesis phase. However, it is clear that again the levels of dGTP, dCTP, and dTTP rose during hy- droxyurea incubation while the dATP remained at baseline levels (Figs 5A and 5B). Even more interesting is the time course of the increase of dGTP, dCTP, and dTTP. By comparing the dashed lines (taken from the data in the Figs 3B and 3C) with the actual data points in the Figs 5A and 5B, it is clear that the levels of dGTP, dCTP, and dTTP began to increase at nearly the same time as those cells not treated with hydroxyurea (dGTP was delayed approx. 0.8 h). It should be noted that the rate of increase, particularly of dTTP and dCTP, is different in hydroxyurea-treated cells than in untreated cells. A more thorough discussion of these observations will be presented later, but is is clear that the time of appearance of those enzymes partici-
D E O X Y R I B O N U C L E O S I D E T R I P H O S P H A T E POOLS 343
IIC
IOC
8C
~ 7c
~ 4c
LC
C
I i p i p i i i o
A 8
i I
I/' z o ]
/ / '
f / . / I 2:i.J j s .,~ I "/
2 ~ , - ° 2 4 6 8 I00 2 4 6 8 I0
Hours After Resuspension
Fig. 5. Deoxyribonucleoside t r iphosphate pools of mitotically synchronized cells treated 2 h after synchronizat ion with hydroxyurea. The appearance and accumulat ion o f nucleotides, in the absence o f D N A synthesis, was measured: A, dATP ( O - O ) and dGTP (F1-F-1). B, dTTP ( O - O ) and dCTP (73-[S]). Fo r ease of comparison, the nucleotide pools o f synchronized cells not treated with hydroxy- urea are also shown (curves taken from Fig. 3). A, dATP (- - -) and dGTP ( . . . . . ). B, dTTP (- - -) and dCTP ( . . . . . ).
pating in the synthesis of dGTP, dCTP, and dTTP is not appreciably altered by hydroxyurea. Inhibition of DNA synthesis of cells treated in G 1 with hydroxyurea apparently is due to the absence of dATP.
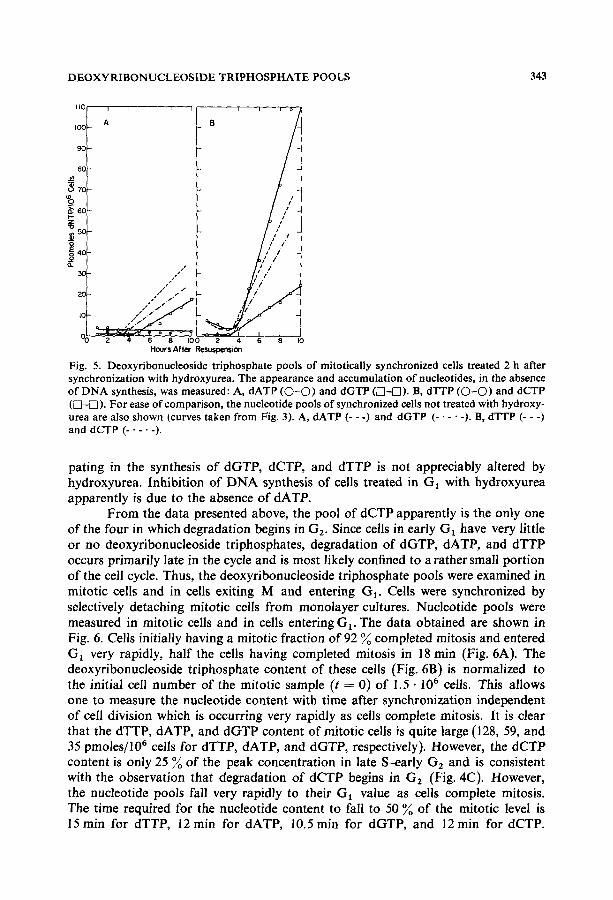
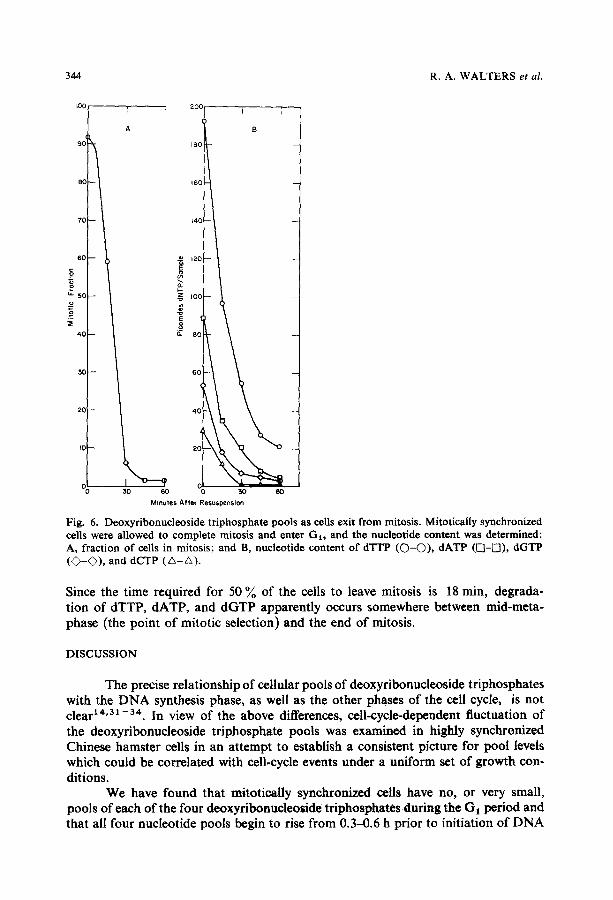
From the data presented above, the pool of dCTP apparently is the only one of the four in which degradation begins in G 2. Since cells in early G1 have very little or no deoxyribonucleoside triphosphates, degradation of dGTP, dATP, and dTTP occurs primarily late in the cycle and is most likely confined to a rather small portion of the cell cycle. Thus, the deoxyribonucleoside triphosphate pools were examined in mitotic cells and in cells exiting M and entering Gz. Cells were synchronized by selectively detaching mitotic cells from monolayer cultures. Nucleotide pools were measured in mitotic cells and in cells entering G~. The data obtained are shown in Fig. 6. Cells initially having a mitotic fraction of 92 % completed mitosis and entered G~ very rapidly, half the cells having completed mitosis in 18 min (Fig. 6A). The deoxyribonucleoside triphosphate content of these cells (Fig. 6B) is normalized to the initial cell number of the mitotic sample (t = 0) of 1.5 • 106 cells. This allows one to measure the nucleotide content with time after synchronization independent of cell division which is occurring very rapidly as cells complete mitosis. It is clear that the dTTP, dATP, and dGTP content of mitotic cells is quite large (128, 59, and 35 pmoles/106 ceils for dTTP, dATP, and dGTP, respectively). However, the dCTP content is only 25 % of the peak concentration in late S--early G 2 and is consistent with the observation that degradation of dCTP begins in G2 (Fig. 4C). However, the nucleotide pools fall very rapidly to their G~ value as cells complete mitosis. The time required for the nucleotide content to fall to 50 % of the mitotic level is 15 min for dTTP, 12 min for dATP, 10.5 min for dGTP, and 12 min for dCTP.
344 R.A. WALTERS et al.
A
1 z ° ° I t I
B R
18001 160
L4
t20 g~
~ IO0 - -
E 80
60 ) ---
2
0 5O 6O Minutes After Resuspension
Fig. 6. Deoxyribonucleoside triphosphate pools as cells exit from mitosis. Mitotically synchronized cells were allowed to complete mitosis and enter GI, and the nucleotide content was determined: A, fraction of cells in mitosis; and B, nucleotide content of dTTP (O-O), dATP ([]-FI), dGTP (~-<~), and dCTP (A_z~).
Since the time required for 50 % of the cells to leave mitosis is 18 min, degrada- tion of dTTP, dATP, and dGTP apparently occurs somewhere between mid-meta- phase (the point of mitotic selection) and the end of mitosis.
DISCUSSION
The precise relationship of cellular pools of deoxyribonucleoside triphosphates with the DNA synthesis phase, as well as the other phases of the cell cycle, is not clear t 4,31-34. In view of the above differences, cell-cycle-dependent fluctuation of the deoxyribonucleoside triphosphate pools was examined in highly synchronized Chinese hamster cells in an attempt to establish a consistent picture for pool levels which could be correlated with cell-cycle events under a uniform set of growth con- ditions.
We have found that mitotically synchronized cells have no, or very small, pools of each of the four deoxyribonucleoside triphosphates during the GI period and that all four nucleotide pools begin to rise from 0.3--0.6 h prior to initiation of DNA
DEOXYRIBONUCLEOSIDE TRIPHOSPHATE POOLS 345
synthesis (Fig. 3), In contrast to HeLa 34 and L929 cells 3z, the time of initial rise in nucleotide pools of Chinese hamster cells is similar for each of the four deoxyribo- nucleoside triphosphates, and the pools continue to rise as more cells enter the DNA synthetic period (Fig. 3). In no instances were the pools of deoxyribonucleoside triphosphates present in equimolar concentrations. For all but mitotic cells the dTTP was largest, followed in decreasing order by dCTP, dATP, and dGTP. Thus, the rela- tive size of the individual pools does not appear to be one of those parameters rigor- ously controlled between different cell types in culture. It is more likely that relative pool sizes reflect different growth conditions. In this context, the high level of dTTP in Chinese hamster cells reported here may be a reflection of the fact that F-10 medi- um, in which the cells were grown, contains 3 • 10 -6 M thymidine as a regular con- stituent, although we do not know what proportions of dTTP are contributed by de
novo synthesis. However, it is interesting that Chinese hamster cells, with the noted exception of high dTTP levels, have rather large pools of dCTP when compared to the dGTP pool (the smallest pool). This is similar to the case for secondary mouse embryo cells 3a and baby hamster kidney cells 31 but is quite different from that ob- served in L929 cells 32.
From the results obtained with mitotically synchronized cells which were resynchronized in late G1 by treatment with hydroxyurea, all four deoxyribonucleo- side triphosphate pool levels apparently increased continuously across S (Fig. 4). There was no indication that pyrimidine pools remained constant throughout S, as in HeLa cells ~4. It is possible, of course, that residual effects remained after treatment with hydroxyurea; however, the hydroxyurea treatment occurred when all cells were in G 1, and the high degree of synchronization of the subsequent S period and division wave (Fig. 4A) indicates that the cell population retained all capabilities required for cell-cycle traverse and division. In addition, deoxyribonucleoside triphosphate levels obtained from mitotic cells (Fig. 6B) which had never been treated with hy- droxyurea are also consistent with results obtained from cultures resynchronized with hydroxyurea (e.g. large pools of dTTP, dGTP, and dATP and a reduced pool of dCTP late in the cell cycle, Fig. 4). Taken together, all data indicate that the maxi- mum pool levels of all four deoxyribonucleoside triphosphates occur after DNA syn- thesis is completed. The levels of dTTP, dGTP, and dATP were highest in mitotic cells, particularly dGTP and dATP. If, in the absence of utilization for DNA synthesis, pool levels are determined by an equilibrium between synthesis and degradation, then the large pools of dTTP, dGTP, and dATP as cells entered mitosis might arise either by inhibition of degradation or a continuation of synthesis. Although the data presented here do not allow us to distinguish between the two possibilities, it is at- tractive to postulate that degradation of deoxyribonucleoside triphosphates is a phenomenon associated with specific times in the cell cycle. This would be consistent with the observed reduction of the dCTP pool beginning in G 2 (Fig. 4C) and degra- dation of dTTP, dATP, and dGTP occurring just prior to or coincident with the end of mitosis (Fig. 6). The pool level of dCTP in Chinese hamster cells apparently cor- relates more nearly with DNA synthesis 31'33, in contrast to findings for HeLa 34 and L929 cells 32. In any case, we have demonstrated that the disappearance of de- oxyribonucleoside triphosphates occurs at very specific times in the cell cycle. Further, degradation of deoxyribonucleoside triphosphates does not appear to be simply a result of diffusion to the cytoplasm and subsequent phosphatase activity, since the
346 R.A. WALTERS et al.
nuclear membrane disappears in prophase while the pools of dTTP, dATP, and dGTP are degraded either just prior to or coincident with the end of mitosis.
The effect of treating G1 cells with hydroxyurea is a very interesting one, and the results obtained here indicate that the in vivo mechanism of action of hydroxyurea may not be simply a complete and indiscriminate inhibition of reduction of ribonu- cleoside diphosphates to the corresponding deoxyribonucleoside diphosphates 3 o.32,33 When added to synchronized G t cells in concentrations sufficient to block initiation of DNA synthesis, hydroxyurea completely inhibited the synthesis of only dATP (Fig. 5). Not only did hydroxyurea fail to inhibit the synthesis of dTTP, dCTP, and dGTP but, in the absence of DNA synthesis, the three nucleotides appeared at nearly the same time (dGTP was delayed approx. 0.8 h) as in untreated cultures (Fig. 5). Since there apparently is little reductase activity in G1 cells 14'as, the observed rise in levels of dTTP, dCTP, and dGTP at the appropriate time in hydroxyurea indicates initiation of functional reductase activity. It can be seen also (Fig. 5) that, while the rate of accumulation of dGTP is not greatly changed, the rate of accumulation of dTTP is stimulated in hydroxyurea-treated cells with a concurrent reduction in rate of accumulation of dCTP. This is consistent with the known inhibitory effect of dTTP on reductive conversion of cytidine diphosphate to deoxy cytidine diphosphate 17. Thus, hydroxyurea in vivo appears to have differential effects on formation of each of the four deoxyribonucleoside triphosphates, and inhibition of DNA synthesis apparently results from preferential inhibition of dATP formation. It is difficult to compare these results with those obtained by Skoog and Nordenskj61d 33, since they used cultures in which approx. 50 ~o of the cells were already in S phase at time of addition of hydroxyurea. Although Adams et al. 32 reported that, 20 h after release from stationary phase, L929 cells treated with hydroxyurea had increased pools of dTTP and dCTP, no information was given concerning the time and rate of accumulation, nor did they detect any dGTP as we have shown here. Further, the increased levels of dGTP found in Chinese hamster cells during incuba- tion with hydroxyurea suggest that, under similar conditions, the absence of purine deoxyribonucleoside triphosphates in L929 cells need not simply be a result of diffu- sion from the cell nucleus and subsequent degradation 32.
ADDENDUM
After submission of this paper for publication, a paper by Skoog et al. 36 ap- peared. Many of the conclusions presented here regarding deoxyribonucleoside tri- phosphate pool fluctuations during the cell cycle of Chinese hamster cells are in ac- cord with the paper cited above, including pool expansion as cells enter S, nonuni- form pool sizes, and apparent lack of correlation of deoxyribonucleoside triphosphate pools with termination of DNA replication with the exception of the dCTP pool. A significant difference between the two sets of experiments exists in the nucleotide pool levels of G 1 cells. Skoog et al. a6 find rather large G1 pools when compared to the very small or no pools reported here. Whether this difference represents differing cell culture conditions and/or other cell manipulation techniques remains to be deter- mined.
DEOXYRIBONUCLEOSIDE TRIPHOSPHATE POOLS 347
ACKNOWLEDGMENTS
T h e a u t h o r s wish to t h a n k P. C. Sande r s fo r c apab l e ass is tance t h r o u g h o u t
this work . Th i s w o r k was p e r f o r m e d u n d e r the ausp ices o f the U. S. A t o m i c E n e r g y
C o m m i s s i o n .
REFERENCES
8 Gurley, L. 9 Gurley, L.
10 Gurley, L. 11 Gurley, L. 12 Gurley, L.
744-750
1 Tobey, R. A., Petersen, D. F. and Anderson, E. C. (1966) Proc. NatL Acad. Sci. U.S. 56, 1520- 1527
2 Waiters, R. A. and Petersen, D. F. (1968) Biophys. J. 8, 1487-1504 3 Waiters, R. A. and Tobey, R. A. (1970) Biophys. J. 10, 556-562 4 Gurley, L. R. and Hardin, J. M. (1968) Arch. Biochem. Biophys. 128, 285-292 5 Enger, M. D., Tobey, R. A. and Saponara, A. G. (1968) J. Cell BioL 36, 583-593 6 Enger, M. D. and Tobey, R. A. (1969) J. CellBioL 42, 308-315 7 Gurley, L. R. and Hardin, J. M. (1969) Arch. Biochem. Biophys. 130, 1-6
R. and Waiters, R. A. (1971) Biochemistry 10, 1588-1593 R. and Waiters, R. A. (1972) Arch. Biochem. Biophys. 153, 304--311 R., Walters, R. A. and Tobey, R. A. (1972) Arch. Biochem. Biophys. 148, 633-641 R., Waiters, R. A. and Tobey, R. A. (1973) Arch. Biochem. Biophys. 154, 212-218 R., Walters, R. A. and Tobey, R. A. (1973) Biochem. Biophys. Res. Commun. 50,
13 Lieberman, I., Abrams, R., Hunt, N. and Ove, P. (1963) J. Biol. Chem. 238, 3955-3962 14 Nordenskjold, B. A., Skoog, L., Brown, N. C. and Reichard, P. (1970) J. Biol. Chem. 245, 5360--
5368 15 Bollum, F. J., Anderegg, J. W., McElya, A. B. and Potter, V. R. (1960) Cancer Res. 20, 138-143 16 Gelbard, A. S., Perez, A. G., Kim, J. H. and Djordjevic, B. (1971) Radiat. Res. 46, 334--342 17 Moore, E. C. and Hurlbert, R. B. (1966) J. BioL Chem. 241, 4802-4809 18 Reichard, P. (1968) Eur. J. Biochem. 3,259-266 19 Tobey, R. A., Anderson, E. C. and Petersen, D. F. (1967) J. Cell. Physiol. 70, 63-68 20 Tobey, R. A. and Crissman, H. A. (1972) Exp. Cell Res. 75, 460-464 21 Vanderheiden, B. S. (1968) AnaL Biochem. 22, 231-237 22 Zimmerman, B. K. (1966) J. BioL Chem. 241, 2035-2041 23 Schachman, H. K., Adler, J., Radding, C. M., Lehman, I. R. and Kornberg, A. (1960) J. BioL
Chem. 235, 3242-3249 24 Grant, R. C., Masahiko, K. and Wells, R. D. (1972) Biochemistry 11,805-815 25 Grant, R. C., Harwood, S. J. and Wells, R. D. (1968) J. Am. Chem. Soc. 90, 4474-4476 26 Lindberg, M. V. and Skoog, K. L. (1970) Anal. Biochem. 34, 152-160 27 Skoog, L. (1970) Eur. J. Biochem. 17, 202-208 28 Tobey, R. A., Petersen, D. F., Anderson, E. C. and Puck, T. T. (1966) Biophys. J. 6, 567-581 29 Tobey, R. A. and Ley, K. D. (1970) Cancer Res. 31, 46--51 30 Moore, E. C. (1969) Cancer Res. 29, 291-295 31 Bjursell, K. G., Reichard, P. A. and Skoog, K. L. (1972) Fur. J. Biochem. 29, 348-352 32 Adams, R. L. P., Berryman, S. and Thomson, A. (1971) Biochim. Biophys. Acta 240, 455-462 33 Skoog, L. and NordenskjOld, B. (1971) Eur. J. Biochem. 19, 81-89 34 Bray, G. and Brent, T. P. (1972) Biochim. Biophys. Acta 269, 184--191 35 Turner, M. K., Abrams, R. and Lieberman, I. (1968) J. BioL Chem. 243, 3725-3728 36 Skoog, L., Nordenskj61d, B. A. and Bjursell, K. G. (1973) Fur. J. Biochem. 33,428-432