Embed Size (px)
Citation preview

*For correspondence:
Competing interests: The
authors declare that no
competing interests exist.
Funding: See page 32
Received: 23 April 2017
Accepted: 09 August 2017
Published: 12 September 2017
Reviewing editor: Michael S
Gilmore, Harvard Medical
School, United States
Copyright Garcıa-Betancur et
al. This article is distributed under
the terms of the Creative
Commons Attribution License,
which permits unrestricted use
and redistribution provided that
the original author and source are
credited.
Cell differentiation defines acute andchronic infection cell types inStaphylococcus aureusJuan-Carlos Garcıa-Betancur1,2, Angel Goni-Moreno3, Thomas Horger4,Melanie Schott5, Malvika Sharan1, Julian Eikmeier1,2, Barbara Wohlmuth4,Alma Zernecke5, Knut Ohlsen1, Christina Kuttler4, Daniel Lopez1,2,6*
1Institute for Molecular Infection Biology, University of Wurzburg, Wurzburg,Germany; 2Research Center for Infectious Diseases, University of Wurzburg,Wurzburg, Germany; 3School of Computing Science, Newcastle University,Newcastle, United Kingdom; 4Department of Mathematics, Technical University ofMunich, Garching, Germany; 5Institute of Clinical Biochemistry andPathobiochemistry, University Hospital Wurzburg, Wurzburg, Germany; 6NationalCenter for Biotechnology, Madrid, Spain
Abstract A central question to biology is how pathogenic bacteria initiate acute or chronic
infections. Here we describe a genetic program for cell-fate decision in the opportunistic human
pathogen Staphylococcus aureus, which generates the phenotypic bifurcation of the cells into two
genetically identical but different cell types during the course of an infection. Whereas one cell type
promotes the formation of biofilms that contribute to chronic infections, the second type is
planktonic and produces the toxins that contribute to acute bacteremia. We identified a bimodal
switch in the agr quorum sensing system that antagonistically regulates the differentiation of these
two physiologically distinct cell types. We found that extracellular signals affect the behavior of the
agr bimodal switch and modify the size of the specialized subpopulations in specific colonization
niches. For instance, magnesium-enriched colonization niches causes magnesium binding to S.
aureusteichoic acids and increases bacterial cell wall rigidity. This signal triggers a genetic program
that ultimately downregulates the agr bimodal switch. Colonization niches with different
magnesium concentrations influence the bimodal system activity, which defines a distinct ratio
between these subpopulations; this in turn leads to distinct infection outcomes in vitro and in an in
vivo murine infection model. Cell differentiation generates physiological heterogeneity in clonal
bacterial infections and helps to determine the distinct infection types.
DOI: https://doi.org/10.7554/eLife.28023.001
IntroductionNosocomial pathogens often cause a broad range of diseases using diverse virulence factors, such
as production of tissue-damaging toxins or production of adhesins during biofilm formation
(Bush et al., 2011). Staphylococcus aureus is one such pathogen that is able to cause different types
of life-threatening infections in hospital settings, from acute bacteremia to endocarditis, pneumonia
and chronic biofilm-associated infections in prosthetic devices (Otto, 2012). The underlying cellular
processes that enable S. aureus to provoke these disparate types of infections is likely driven by
host-microbe interactions (Casadevall et al., 2011), in which specific, yet-to-be-described extracellu-
lar signals play a role to generate distinct, locally defined types of infections (Veening et al., 2008;
Lopez and Kolter, 2010). Determining the cellular processes and the nature of the extracellular
Garcıa-Betancur et al. eLife 2017;6:e28023. DOI: https://doi.org/10.7554/eLife.28023 1 of 39
RESEARCH ARTICLE
signals that define the different infection outcomes is crucial for understanding how difficult-to-treat
bacterial infections develop and for improving strategies to overcome antimicrobial resistance.
In S. aureus, infection outcome is controlled by the agr quorum sensing program, which is autoac-
tivated in response to the self-produced extracellular signal AIP (autoinducing peptide)
(Recsei et al., 1986). AIP binds to the AgrC histidine kinase membrane receptor and activates its
cognate regulator AgrA via phosphorylation (Figure 1A). AgrA~P induces changes in cellular gene
expression that results in rapid bacterial dispersion in the host and acute bacteremia
(Thoendel et al., 2011). Dispersion of S. aureus requires upregulation of surfactant phenol-soluble
modulins (psma and psmb), which are amphipathic small peptides that contribute to bacteria
detachment (Li et al., 2009a; Peschel and Otto, 2013) and destabilize cell membranes, rendering
them cytotoxic to host cells. Modulins are usually expressed during acute infections, as well as
hemolytic toxins (hla, hlb, hlg) that facilitate tissue disruption during septicemia (Recsei et al.,
1986). In contrast, agr activation indirectly downregulates the icaADBC operon genes needed to
synthesize the extracellular polysaccharide matrix that protects cells within a biofilm (PNAG or PIA),
as well as several adhesion proteins (SpA and other MSCRAMM proteins) responsible for cell aggre-
gation/attachment during biofilm formation (Recsei et al., 1986; Boles and Horswill, 2008;
Peng et al., 1988). Biofilms, which are associated with untreatable chronic infections, protect bacte-
ria from antibiotics and host defenses (Lewis, 2008; Lopez et al., 2010; Nadell et al., 2009;
Parsek and Singh, 2003). The S. aureus agr quorum sensing system antagonistically regulates the
activation of planktonic and biofilm-associated lifestyles (Recsei et al., 1986; Boles and Horswill,
2008; Peng et al., 1988), which contribute to the development of acute and chronic infection out-
comes, respectively. A large number of positive and negative regulators controls agr expression.
Among those, the agr system is inhibited by the sB sigma factor (Bischoff et al., 2001). Activation
of sB occurs during early stationary phase (Senn et al., 2005) in response to distinct types of cellular
stresses (Geiger et al., 2014; Geiger and Wolz, 2014; Kastle et al., 2015). sB triggers a general
eLife digest While in hospital, patients can be unwittingly exposed to bacteria that can cause
disease. These hospital-associated bacteria can lead to potentially life-threatening infections that
may also complicate the treatment of the patients’ existing medical conditions. Staphylococcus
aureus is one such bacterium, and it can cause several types of infection including pneumonia, blood
infections and long-term infections of prosthetic devices.
It is thought that S. aureus is able to cause so many different types of infection because it is
capable of colonizing distinct tissues and organs in various parts of the body. Understanding the
biological processes that drive the different infections is crucial to improving how these infections
are treated.
S. aureus lives either as an independent, free-swimming cell or as part of a community known as a
biofilm. These different lifestyles dictate the type of infection the bacterium can cause, with free-
swimming cells producing toxins that contribute to intense, usually short-lived, infections and
biofilms promoting longer-term infections that are difficult to eradicate. However, it is not clear how
a population of S. aureus cells chooses to adopt a particular lifestyle and whether there are any
environmental signals that influence this decision.
Here, Garcia-Betancur et al. found that S. aureus populations contain small groups of cells that
have already specialized into a particular lifestyle. These groups of cells collectively influence the
choice made by other cells in the population. While both lifestyles will be represented in the
population, environmental factors influence the numbers of cells that initially adopt each type of
lifestyle, which ultimately affects the choice made by the rest of the population. For example, if the
bacteria colonize a tissue or organ that contains high levels of magnesium ions, the population is
more likely to form biofilms.
In the future, the findings of Garcia-Betancur et al. may help us to predict how an infection may
develop in a particular patient, which may help to diagnose the infection more quickly and allow it
to be treated more effectively.
DOI: https://doi.org/10.7554/eLife.28023.002
Garcıa-Betancur et al. eLife 2017;6:e28023. DOI: https://doi.org/10.7554/eLife.28023 2 of 39
Research article Microbiology and Infectious Disease

stress response that affects expression of a number of virulence and stress-response genes and indi-
rectly represses agr (Thoendel et al., 2011). Thus, sB antagonizes the influence of the agr system on
virulence factor expression (Senn et al., 2005; Pane-Farre et al., 2006) and biofilm formation
(Bischoff et al., 2001; Kullik et al., 1998).
This understanding of agr-mediated antagonistic regulation of chronic and acute S. aureus infec-
tion outcomes was built on comparative analyses of clinical isolates and characterization of infection
B
C
Pspa-yfp Pica-mars
3.68 69.0164.34
Ppsmβ-yfp Ppsmα-mars
51.51 45.96 61.11
24 h 72 h 120 h
Ppsmα-yfp Pica-mars
8.78 3.37 6.22
Pspa-yfp Ppsmα-mars
1.31 1.10 2.53
BRcells DRcellsC
ell c
ou
nt
-1 0 1 10 102
-1 0 1 10 102
-1 0 1 10 102
-1 0 1 10 102
Pica-yfp Pspa-yfp
Ppsmα-yfp Ppsmβ-yfp
-1 0 1 10 102
PdnaA-yfp
unlabeled
24 h
72 h
120 h
Fluorescence (AU)
Control promoter
BRcells x DRcells DRcells x BRcells
Agr~P
SigB
AIP
Agr
P RNAIII
SpA
PNAG
Biofilm
formation
Cell dipersion &
toxin secretion
Hla
A
Overlapping cells (%) Overlapping cells (%)
PSMα
Hlb
PSMβ
unlabeled
24 h
72 h
120 h
24 h 72 h 120 h
Figure 1. Staphylococcus aureus aggregates contain specialized cell types. (A) Scheme of the agr signaling cascade in S. aureus. AIP binds to the AgrC
histidine kinase membrane receptor and activates its cognate regulator AgrA via phosphorylation (AgrA~P). AgrA~P upregulates toxin-coding genes
that are also responsible for cell dispersion (hla, hlb, psma and psmb) and it downregulates genes involved in biofilm formation (ica and spa). (B)
Quantitative analysis of fluorescence microscopy images of agr-related promoters. The control promoter is the agr-independent dnaA, which has a
monomodal expression pattern. We counted 700 random cells from each of three independent microscopic fields from independent experiments (2100
cells total for each strain). (C) Fluorescence microscopy images of double-labeled cells at various times during aggregate formation (24, 72 and 120 hr).
Percentages of cells quantified in the fields with positive overlapping signal. Cells were counted as in (A). A signal is considered to overlap when signals
are detected in a 3:1-1:3 range, the range in which green and red signals merge to yellow. Top row, double-labeled strains with Pica-yfp, Pspa-yfp
(BRcells) and Ppsma-yfp, Ppsmb-yfp (DRcells) promoters. Bottom row, double-labeled strains with antagonistic promoters. Bar = 2 mm.
DOI: https://doi.org/10.7554/eLife.28023.003
The following figure supplement is available for figure 1:
Figure supplement 1. Staphylococcus aureus multicellular aggregates contain distinct cell types.
DOI: https://doi.org/10.7554/eLife.28023.004
Garcıa-Betancur et al. eLife 2017;6:e28023. DOI: https://doi.org/10.7554/eLife.28023 3 of 39
Research article Microbiology and Infectious Disease
related mutants. Through this approach, agr-defective isolates are frequently identified from chronic
infections as these mutants usually show reduced hemolytic activity and develop robust biofilms
(Fischer et al., 2014; Goerke and Wolz, 2010; Grundmeier et al., 2010; Hirschhausen et al.,
2013; Savage et al., 2013). In addition, agr dysfunction is frequently correlated with chronic persis-
tent S. aureus infections (Fowler et al., 2004) such as small colony variants (SCV). SCV have excep-
tionally low agr expression levels (Kahl et al., 2016) and high expression of biofilm-related genes
(Tuchscherr et al., 2010). High sB expression is important for SCV phenotype acquisition
(Mitchell et al., 2013), because sigB mutants do not generate SCV (Tuchscherr and Loffler, 2016;
Tuchscherr et al., 2015). However, whether the capacity of nosocomial pathogens, such as S.
aureus, to cause distinct types of infections is restricted to the emergence of genetic variants is still
unclear. Staphylococcus aureus cells are exposed to a variety of local environmental signals during
the course of an infection that can influence bacterial gene expression and thus, their infective
potential in a given infection niche. These signals include, but are not limited to, changes in nutrient
availability, temperature, pH, osmolarity or, oxygen concentration. Staphylococcus aureus might be
able to respond collectively to these extracellular cues to adapt its behavior in a fluctuating environ-
ment (Munzenmayer et al., 2016), allowing staphylococcal communities to generate distinct, locally
defined infection types without modification of the bacterial genome (Veening et al., 2008;
Lopez and Kolter, 2010).
It has been hypothesized that changes in bacterial virulence potential are a response to local con-
centrations of tissue-specific signals, which have an important role in determining infection outcome
(Cheung et al., 2004). Yet how bacteria prepare for such unpredictable environmental changes is a
question that remains unanswered. A fundamental feature of microbial cells is their ability to adapt
to diverse environmental conditions by differentiating into specialized cell types (Arnoldini et al.,
2014; Lopez et al., 2009; Veening et al., 2005). In most cases, the extracellular cues are responsi-
ble for defining coexisting cell fates in bacterial populations. Cell fates are genetically identical and
phenotypically distinct bacterial subpopulations that express heterogeneously different sets of genes
and have distinct functions within the microbial community (George et al., 2015). A classical exam-
ple of this is the bacterial response to antibiotics. Antibiotics kill most S. aureus cells, but it is fre-
quent to observe a small subpopulation of genetically identical but antibiotic-persister cells that can
cause recurrent infections in a post-antibiotic period (Bigger, 1944; Lewis and cells, 2007).
The relative simplicity of agr-mediated antagonistic regulation of planktonic and biofilm-associ-
ated lifestyles provides a natural model to analyze how S. aureus cells collectively establish acute or
chronic infection lifestyles and to identify extracellular factors that influence activation of the cellular
program that leads to prevalence of one infection program over the other. Here, we report a
bimodal behavior in the agr quorum sensing system that antagonistically regulates the differentiation
of two genetically identical but physiologically distinct specialized cell types in S. aureus communi-
ties. One cell type contributes to the formation of biofilms responsible for chronic infections,
whereas a second was constituted by dispersed cells that produced the toxins that contribute to an
acute bacteremia. These subpopulations were present in S. aureus communities at different ratios
depending on growth conditions, which contributed to determining the outcome of infection. We
found that colonization niches with higher Mg2+ concentrations, which is inherent in tissues colo-
nized preferentially by S. aureus (Gunther, 2011; Jahnen-Dechent and Ketteler, 2012), influenced
the bimodal switch and increased the size of the subpopulation of cells specialized in biofilm forma-
tion, as Mg2+ binding to teichoic acids increases cell wall rigidity and triggered a sB stress-induced
genetic cascade that downregulates agr. In a mouse model, bacterial cell differentiation occurred
during in vivo infections and the Mg2+ concentration in infected organs influenced collective bacte-
rial behavior in simultaneous progress to a biofilm-associated chronic infection or a disperse bacter-
emia. This study shows that cell differentiation in S. aureus helps to diversify the types of infections
that arise simultaneously from an infection caused by a clonal population of bacteria.
Results
Staphylococcus aureus multicellular aggregates differentiate cell typesWe explored the role of agr-mediated antagonistic regulation of planktonic and biofilm-associated
lifestyles in S. aureus aggregates growing on Mg2+-enriched TSB medium (TSBMg), in which most S.
Garcıa-Betancur et al. eLife 2017;6:e28023. DOI: https://doi.org/10.7554/eLife.28023 4 of 39
Research article Microbiology and Infectious Disease

aureus clinical isolates develop robust multicellular aggregates (Koch et al., 2014). To study biofilm
gene expression, we introduced transcriptional fusions of biofilm-associated ica/spa genes. The ica
operon is responsible for production of the exopolysaccharide polymeric matrix (PNAG or PIA) that
lends consistency to the biofilm. The spa gene encodes a cell wall-anchored adhesion protein, adhe-
sin that is responsible for S. aureus cell aggregation and attachment to surfaces during biofilm for-
mation (Recsei et al., 1986; Boles and Horswill, 2008; Peng et al., 1988). To monitor planktonic
gene expression, we generated transcriptional fusions of psma and psmb genes. These genes code
for small peptides, the phenol-soluble modulins, whose expression depends directly on agr. Due to
their surfactant properties, PSMa and PSMb act as cytolytic toxins that contribute to bacterial dis-
persion and play an important role in acute staphylococcal infections (Li et al., 2009a; Peschel and
Otto, 2013) (Figure 1A). These reporters were introduced into neutral loci in the S. aureus chromo-
some to ensure expression of a single reporter copy in each cell (Yepes et al., 2014); we monitored
their expression at the single-cell level in S. aureus aggregates using quantitative analysis of fluores-
cence microscopy images (Figure 1B and Figure 1—figure supplement 1A–B). All reporters
showed bimodal expression and indicated the bifurcation of two cell subpopulations in S. aureus
aggregates, one with lower and another with higher fluorescence levels. This bimodal expression
pattern differed from the unimodal expression of the housekeeping and agr-independent gene
dnaA, used as control reporter (Figure 1B and Figure 1—figure supplement 1A). Cultures of differ-
ent S. aureus isolates showed bimodal expression of these reporters (Figure 1B and Figure 1—fig-
ure supplement 1C), which suggests that cell differentiation is a general phenomenon in S. aureus.
Monitoring the temporal dynamics of the subpopulations that bifurcated during the development
of the microbial aggregates from an initial inoculum in TSBMg revealed larger subpopulations of ica-
and spa-expressing cells in early developmental stages (~72 hr; Figure 1B), compared to the size of
these subpopulation at later growth stages (~120 hr). In contrast, the size of the subpopulations of
psma/b-expressing cells increased concomitantly with time, consistent with the reported antagonis-
tic regulation of ica/spa and psma/b by agr (Recsei et al., 1986; Boles and Horswill, 2008;
Peng et al., 1988). We generated strains labeled with different pairwise combinations of these
reporters, which were both introduced into neutral loci in the S. aureus chromosome; this allowed
quantitative analysis of fluorescence microscopy images to examine simultaneous expression in S.
aureus microbial communities (Figure 1C and Figure 1—figure supplement 1D). This approach
indicated coexpression of ica with spa and of psma with psmb in two distinct cell subpopulations,
showing the bifurcation of two distinct subpopulation of cells specialized in expressing ica, spa and
other biofilm-related genes (BRcells) and cells expressing psma/b dispersion-related genes (DRcells).
Differential AgrA ~P affinity to P2 and P3 promoters generates the agrpositive feedback loop that differentiates BRcells and DRcellsThe differential expression of agr-related genes in the distinct cell types led us to analyze the molec-
ular mechanism of agr-mediated cell differentiation. The agr system is autoactivated once the extra-
cellular AIP concentration reaches a given threshold (10–14 mM) (MDowell et al., 2001) and is
inhibited by sB induction (Bischoff et al., 2001). Following agr activation, AgrA~P directly upregu-
lates psma/b expression (Queck et al., 2008) and binds to the two adjacent divergent promoters P2
and P3, which trigger expression of RNAII and RNAIII transcripts, respectively (Koenig et al., 2004).
RNAII upregulates the agrBDCA operon, which encodes the agr signal transduction cascade, includ-
ing the AIP signal, the AgrC sensor kinase and its AgrA cognate regulator. Therefore, AgrA~P bind-
ing to the P2 promoter constitutes a positive feedback loop in which AgrA~P regulator induces
expression of the agrBDCA operon, which encodes the entire agr signal transduction cascade
(Thoendel et al., 2011; Queck et al., 2008). Bimodal gene expression in microbial populations is
usually triggered by a positive feedback loop in which a gene product induces its own expression.
We hypothesize that, once a certain AgrA~P threshold is reached in a cell, AgrA~P induces its own
expression and these cells maintain high AgrA~P levels. Thus, AgrA~P and AgrA-controlled genes
will thus be activated in that cell, including upregulation of RNAIII via activation of the P3 promoter.
RNAIII positively regulates a pool of agr-dependent genes that encode the cytotoxic toxins and viru-
lence factors responsible for acute infection (Koenig et al., 2004). Activation of the P3 promoter
leads DRcells to specialize in dispersion and virulence. In contrast, cells that do not achieve the
AgrA~P expression threshold needed to induce the positive feedback mechanism will not induce P3
promoter expression. In these cells, genes normally repressed by AgrA~P will be upregulated,
Garcıa-Betancur et al. eLife 2017;6:e28023. DOI: https://doi.org/10.7554/eLife.28023 5 of 39
Research article Microbiology and Infectious Disease

including biofilm-related genes, which licenses cells to differentiate as biofilm-producing BRcell
types.
To determine whether activation of the agr positive feedback loop is sufficient to generate bimo-
dality in a bacterial population, we genetically engineered an orthogonal agr system in B. subtilis in
which the agr positive feedback loop was isolated from its native complex regulatory network
(Audretsch et al., 2013) and thus exempt from interference from additional staphylococcal regula-
tory inputs. In this orthogonal system, B. subtilis harbored Ppsma-yfp or Ppsmb-yfp reporters and
expressed the membrane kinase AgrC and its cognate regulator AgrA under the control of the
AgrA-inducible P2 promoter (Figure 2A). The orthogonal system does not express staphylococcal
sB, and sB from B. subtilis did not interfere with the agr system, since we detected similar reporter
expression in wild type (WT) and DsigB strains (Figure 2—figure supplement 1A), ensuring the
absence of the agr inhibitory input signal. We used this orthogonal system to identify the minimal
components necessary for bimodal expression of agr-related genes, using psma/b expression as
readout for agr activity (Figure 2B) (Zhang et al., 2015). Activation of the agr positive feedback
loop in the orthogonal system requires addition of purified AIP (10 mM) to B. subtilis cultures (AIP
contains a thiolactone ring thus it cannot be synthetically produced). AIP addition activates AgrC
sensor kinase, which phosphorylates the AgrA regulator. The AgrA~P active form binds the P2 pro-
moter to express high AgrA~P levels and activate the positive feedback loop; this resulted in
bimodal expression of chromosomally integrated Ppsma-yfp or Ppsmb-yfp reporters, with a cell sub-
population in which reporter expression increased during a transition in which cells switched from
off to on. In contrast, chromosomally integrated Pica-yfp and Pspa-yfp reporters, which are not con-
trolled directly by the AgrA~P, did not activate in response to added AIP. In a similar manner, we
did not detect fluorescence in control experiments with strains lacking the AgrC-AgrA system, or
when no AIP was added (Figure 2B and Figure 2—figure supplement 1A), demonstrating that sto-
chastic expression of these reporter genes does not account for bifurcation of the cell populations.
These results indicate that the minimal agr genetic program harbored in the orthogonal system acts
as an autonomous program for cell differentiation in bacterial populations.
Identification of the molecular mechanism that leads agr to act as an autonomous program to
define cell fate bifurcation in S. aureus required analysis of the agr-signaling cascade in the presence
of AIP. We therefore generated two additional orthogonal systems to monitor P2 (PRNAII-yfp) and P3
(PRNAIII-yfp) activation independently (Figure 2C). In response to exogenous AIP (10 mM), these sys-
tems showed a transition period during which P2 and P3 cells switched on after which subpopulation
sizes remained constant. The P2-expressing cell subpopulation differentiated earlier, however, and
showed a more intense fluorescence signal in a larger cell subpopulation over time compared to the
orthogonal system that differentiated P3-expressing cells. This result suggests that P2 promoter is
more sensitive than P3 to agr activation, a characteristic feature of positive feedback loops in
bimodal systems (Siebring et al., 2012). Based on these results, we hypothesized that the bimodal
behavior of agr and thus, cell differentiation in S. aureus, relies on the differential affinity of AgrA~P
for P2 and P3 promoters. P2 thus activates the feedback loop at lower AgrA~P concentrations and
only in a subpopulation of cells. These cells contain high AgrA~P levels, which licenses them to trig-
ger the less-sensitive P3 promoter and induce the agr regulon, leading the cells to specialize in dis-
persion and virulence and become DRcells. Cells that express P2 below the threshold cannot
activate the agr feedback loop and are thus unable to induce P3 promoter expression. In this sub-
population, agr-repressed genes are upregulated, including genes involved in biofilm formation,
which licenses them to differentiate as BRcells.
We tested this hypothesis by first analyzing the dynamics of the agr positive feedback loop using
mathematical modeling coupled to computational simulations (Figure 2—figure supplement 1B–E)
(Chong et al., 2014; Golding et al., 2005). The full network dynamics remained constant, since the
orthogonal system was similar for all promoters tested. We optimized the promoter-specific rates;
Kon (association) and Koff (dissociation) denote interaction with AgrA~P and Kt denotes reporter tran-
scription (Figure 2—figure supplement 1B) (Goni-Moreno et al., 2016). The correct combination of
these promoter rates sufficed to explain bimodal fluorescence distribution. Although the simulations
considered AgrA~P saturation, we consistently detected bimodal reporter expression, with on and
off cell subpopulations always present. Simulations favored a model in which P2-activated positive
feedback loop induces P3-driven bimodal expression in response to AIP concentration or
Garcıa-Betancur et al. eLife 2017;6:e28023. DOI: https://doi.org/10.7554/eLife.28023 6 of 39
Research article Microbiology and Infectious Disease

A
Exogenous AIP
PFL
AgrC
AgrA
AgrA~P
P2 agrC agrA Ppsm yfp
P
P
1
2
3 4 P
P
Bacillus subtilis ΔsigB
B
Cel
l co
un
t
Ppsmα-yfp Ppsmβ-yfp
-1 10110
3 -1 10110
3-1 101
103 -1 101
103
0 h
4 h
8 h
12 h
2 h
6 h
10 h
unlabeled
OrthogonalControl
Orthogonal
-1 10110
3
Pica-yfp
-1 10110
3-1 101
10
Pspa-yfp
-1 10110
3 3
0 h
4 h
8 h
12 h
2 h
6 h
10 h
unlabeled
Fluorescence (AU)
DRcells
BRcells
No AgrCAControl
No AgrCA
B. subtilis ΔsigB
C
Cel
l co
un
t
PRNAII (P2)-yfp
PRNAIII (P3)-yfp
PRNAIIPRNAII 3'5' PRNAII (P2) yfp
Fluorescence (AU)
-1 10 1 103
-1 10 1 103
0 h
4 h
8 h
12 h
2 h
6 h
10 h
unlabeled
D
PRNAIIPRNAII 3'5' PRNAIII (P3) yfpPRNAII PRNAIIPRNAII (P2)cfp
P2 - cfp
Only
P2 ON
Only
P3 ON
Both
P2 and P3 ON
OFF
cells
P3
- yf
p
0
-103
103
104
0-103 103 10 4
0
-103
103
104
0
-103
103
104
0-103 103 10 4 0-103 103 10 4
0-103 103 10 4 0-103 103 10 4 0-103 103 10 4
0
-103
103
104
0
-103
103
104
0
-103
103
104
PR
NA
III (
P3)
-yfp
PRNAII (P2)-cfp
0 h 4 h 6 h
8 h 10 h 12 hPRNAIIPRNAII 3'5' PRNAIII (P3) yfp
Cel
l co
un
t
0 h
4 h
8 h
12 h
2 h
6 h
10 h
unlabeled
Figure 2. The agr QS system is an autonomous program for cell fate decision-making. (A) Scheme showing the orthogonal system generated in Bacillus
subtilis. In this system, the membrane kinase AgrC and its cognate regulator AgrA were expressed under the control of their own P2 promoter. This
strain also harbors a Ppsma-yfp or a Ppsmb-yfp reporter, which allows monitoring agr activation. Addition of purified AIP to B. subtilis cultures as input
signal activated the agr system and led to bimodal expression of chromosomally integrated Ppsma- or Ppsmb-yfp reporters. (B) Flow cytometry profiles
of the orthogonal agr system in B. subtilis showing bimodal expression of the agr-dependent psma/b reporters at different times after AIP induction.
Control panels show no expression of these reporters without the AgrCA chimera. The ica/spa promoters were not activated, as they are not regulated
directly by AgrA~P (Recsei et al., 1986; Boles and Horswill, 2008; Peng et al., 1988). Cultures were grown in liquid LB medium and incubated (37˚C,12 hr, 200 rpm agitation). (C) Flow cytometry showed bimodal expression of P2 (up) and P3 (down) promoters after AIP induction. Cultures were grown
in liquid LB medium and incubated (37˚C, 12 hr, 200 rpm agitation). (D) Flow cytometry monitoring simultaneous expression of PRNAII or P2 (y-axis) and
PRNAIII or P3 (x-axis) in a population of P2-cfp P3-yfp double-labeled cells cultured with AIP (10 mM). Samples were collected at various times and
represented in a 2D graph (x axis, CFP signal; y axis, YFP signal). Dual system at various times after AIP induction. Isolines in the graph represent cell
populations. The subpopulation that initially expressed the P2-cfp reporter was the same as that which later expressed the P3-yfp reporter.
DOI: https://doi.org/10.7554/eLife.28023.005
The following figure supplement is available for figure 2:
Figure supplement 1. Mathematical simulations of the agr orthologous system.
Figure 2 continued on next page
Garcıa-Betancur et al. eLife 2017;6:e28023. DOI: https://doi.org/10.7554/eLife.28023 7 of 39
Research article Microbiology and Infectious Disease

autoactivation time (Figure 2—figure supplement 1C–E), suggesting that DRcells resulted from
sequential P2 and P3 promoter activation.
We tested this model experimentally in a dual orthogonal system harboring P2 (PRNAII-cfp) and P3
(PRNAIII-yfp) reporters expressed as two adjacent transcriptional units transcribed in opposite direc-
tions, similar to the chromosomal organization in the S. aureus genome (Figure 2D and Figure 2—
figure supplement 1F). We used flow cytometry analysis with simultaneous detection of CFP and
YFP signals to determine quantitatively whether the P2-expressing subpopulation becomes P3-
expressing cells over time after AIP addition (10 mM). At 4 hr post-AIP induction, we detected a cell
subpopulation that expressed P2; a fraction of this subpopulation activated P3 at later times (6 hr).
The subpopulation of P3-expressing cells increased over time until it expressed P2 and P3 promoters
uniformly. Cells that expressed only the P3 promoter were not detected. This is consistent with our
hypothesis that P2-mediated activation of the agr positive feedback loop is necessary to increase
AgrA~P levels, which in turn induces expression of the less-sensitive P3 promoter in these cells. The
molecular mechanism for bimodal gene expression thus relies on the differential AgrA~P affinity for
P2 and P3 promoters. P2 is very sensitive and triggers the agr positive feedback loop, whereas P3
induces expression of virulence genes and is necessary for DRcell specialization. In the following sec-
tion, we used this information to demonstrate that the self-regulatory activity of AgrA~P via binding
to the P2 promoter is essential for triggering S. aureus cell differentiation while other additional cues
that feed into the agr switch only modulate the activity of the system.
Increase in cell wall rigidity activates sB, repressing the agr positive
feedback loopOnce the agr switch responsible for BRcell and DRcell differentiation is activated, distinct extracellu-
lar cues can arise from the niche to feed into the agr bimodal switch and modulate its activity. For
instance, BRcell and DRcell subpopulations are detected at different ratios in TSB and TSBMg cul-
tures. We hypothesized that variations in extracellular input signals would affect agr bimodal behav-
ior and produce distinct outcomes in the bimodal system. This would define a distinct DRcell:BRcell
ratio, which could have important clinical implications for the definition of infection outcomes. As
the difference between TSB and TSBMg media resides in Mg2+ supplementation, we tested the
effect of extracellular Mg2+ on the response of the agr-repressor sB, which is activated by environ-
mental stresses. In TSBMg medium, qRT-PCR analysis showed increased expression of the sB-depen-
dent stress gene asp23 (alkaline shock protein) (Gertz et al., 2000) (Figure 3A) and of
staphyloxanthin, the pigment that gives S. aureus its typical yellow color and whose expression is
regulated directly by sB (Gertz et al., 2000; Giachino et al., 2001) (Figure 3—figure supplement
1A). TSBMg medium also induced biofilm formation (Figure 3B). Biofilm formation likely occurred
via agr inhibition because the DsigB strain did not form biofilm and the biofilm formation phenotype
was partially recovered in a DsigBDagr double mutant (Figure 3C). Thus, the Mg2+ signaling cascade
acts on agr downregulation via sB activation to increase BRcell subpopulation size. This is consistent
with the fact that biofilm-associated S. aureus colonization generally occurs in Mg2+-enriched niches
such as bone and kidney, in which chronic staphylococcal infections often develop (Gunther, 2011;
Jahnen-Dechent and Ketteler, 2012; Elin, 2010). By contrast, tissues unintentionally depleted of
Mg2+ are prone to acute staphylococcal infections, as Mg2+ sequestration from tissues due to tam-
pon use was associated with an outbreak of staphylococcal toxic shock syndrome in women in the
USA (Parsonnet et al., 1996; Schlievert, 1985).
We were prompted to analyze the molecular mechanism whereby extracellular Mg2+ regulates
the agr bimodal switch and increases the BRcell subpopulation. Biofilms occur in TSB supplemented
with Mg2+ but not with other cations (Koch et al., 2014), which suggested that Mg2+ is a specific
extracellular trigger for BRcell differentiation. Mg2+ has a function in stabilizing the Gram-positive
bacterial cell wall, which is decorated with phosphate-rich teichoic acids (TA) that contribute to
membrane integrity (Heptinstall et al., 1970). To alleviate electrostatic repulsive interactions
between neighboring phosphates, TA preferentially bind Mg2+ cations, to form a consolidated
Figure 2 continued
DOI: https://doi.org/10.7554/eLife.28023.006
Garcıa-Betancur et al. eLife 2017;6:e28023. DOI: https://doi.org/10.7554/eLife.28023 8 of 39
Research article Microbiology and Infectious Disease

network that strengthens cell envelope rigidity (Heckels et al., 1977; Lambert et al., 1975a;
Swoboda et al., 2010). We therefore hypothesized that Mg2+ in TSBMg stabilizes S. aureus TA and
increases cell wall rigidity, which cues sB activation. We tested this hypothesis using atomic force
microscopy (AFM) to monitor S. aureus cell wall structural rigidity in vivo, comparing single cells
grown in TSB and TSBMg media (Figure 3D) (Saar-Dover et al., 2012; Touhami et al., 2004). AFM
BR
ela
tive
asp
23
ge
ne
exp
ress
ion
(fo
ld in
cre
ase
)
1E+01
1E+03
1E+05
1E+07
WT sigB low-tagBdltA high-tagB
TSB
TSBMg
ns
***
***
ns
ns
D
1000
3000
5000
WT
WT
TSBMg TSB
dltAdltA
Cel
l wal
l rig
idity
(K
Pa)
ns ** ***
ns
E
WT
low-tagB
WT
low-tagB
0.25
0.75
1.25
1.75B
iofil
m fo
rmat
ion
Ab
s 5
95
nm
/ O
D 6
00
nm
TSBMg TSB
***
ns
0.2
0.6
1.0
1.4
Bio
film
form
atio
nA
bs
59
5 n
m /
OD
60
0 n
m
WT sigB
sigBagr
TSBMg
*** ***
0.2
0.6
1.0
1.4
Bio
film
form
atio
n
Ab
s 5
95
nm
/ O
D 6
00
nm
TSB
***
TSBMg
CA
***
0.6
1.8
3.0
WT
high-tagB
WT
high-tagB
TSBTSBMg
Bio
film
form
atio
nA
bs
59
5 n
m / O
D 6
00
nm ***
F
Figure 3. Extracellular Mg2+increases cell wall rigidity in S. aureus. (A) qRT-PCR assay to monitor sB activation using relative asp23 expression as
readout (expression of this gene is dependent on sB activity) in TSB and TSBMg cultures of S. aureus strains of different genetic backgrounds. The
DdltA mutant was used as control strain to show reduced asp23 expression in TSB and increased expression in TSBMg. (B) Biofilm formation
quantification in S. aureus strain Newman wild type strain using the traditional microtiter assay (O’Toole and Kolter, 1998b) in liquid TSBMg and TSB.
(C) Biofilm formation quantification in different S. aureus genetic backgrounds using the traditional microtiter assay (O’Toole and Kolter, 1998b) in
liquid TSBMg and TSB. The DsigB strain did not form biofilm in TSBMg and the biofilm formation phenotype was partially recovered in a DsigBDagr
double mutant. (D) Atomic force microscopy quantification of S. aureus cell surface rigidity (in KPa). Mean surface rigidity was measured using force-
indentation curves and Young’s modulus. Best fits were produced with a modified Hertz model, assuming conical punch probe geometry. The DdltA
mutant serves as positive control, as described (Saar-Dover et al., 2012). In this mutant, D-alanine esterification of TA is absent (Perego et al., 1995).
D-alanylation of TA introduces positively charged amines and prevents repulsive interactions between neighboring ribitol phosphates, which increases
cell wall rigidity, similar to the effect of Mg2+ incorporation to the cell wall. Cell wall rigidity was therefore compromised in the Ddlt mutant when grown
in TSB medium. (E, F) Quantification of biofilm formation in liquid TSBMg and TSB of S. aureus WT, low-tagB (E) and high-tagB strains (F). All
experiments show the mean ±SD for three independent experiments (n = 3). Statistical significance was measured using unpaired Student’s t-test for
panel (A); for remaining panels, we used one-way ANOVA with Tukey’s test for multiple comparisons. *p<0.05, **p<0.01, ***p<0.001; ns, no significant
differences.
DOI: https://doi.org/10.7554/eLife.28023.007
The following figure supplement is available for figure 3:
Figure supplement 1. Extracellular Mg2+ activates sB stress regulon in S. auresus.
DOI: https://doi.org/10.7554/eLife.28023.008
Garcıa-Betancur et al. eLife 2017;6:e28023. DOI: https://doi.org/10.7554/eLife.28023 9 of 39
Research article Microbiology and Infectious Disease

detects forces acting between a sharp nanoscale cantilever and the bacterial cell wall; after pressure,
the cantilever deflects and force can be quantified (Dufrene, 2014; Formosa-Dague et al., 2016).
We detected greater rigidity in cells grown in TSBMg medium than those grown in TSB medium.
The DdltA mutant was used as control, since the DltA-E machinery is responsible for D-alanylation of
TA, which introduces positively charged amines and thus prevents repulsive interactions between
neighboring TA (Perego et al., 1995), similar to the effect of Mg2+ incorporation in the cell wall.
AFM confirmed that the absence of positive charges reduces cell wall rigidity in the DdltA control in
regular TSB, as reported (Saar-Dover et al., 2012). In Mg2+-enriched growth conditions, extracellu-
lar Mg2+ binding complemented the cell wall rigidity defect in this mutant, as TA-coordinated Mg2+
provided cell wall rigidity in the absence of the Dlt machinery. Our AFM measurements showed
greater cell wall rigidity in Mg2+-enriched growth conditions in the DdltA mutant (Figure 3D), com-
parable to the wild type strain. These experiments indicate that extracellular Mg2+ is incorporated to
cell wall TA to increase cell wall rigidity.
Staphylococcus aureus cell wall TA are essential for a response to extracellular Mg2+, which
increases BRcell subpopulation size and thus induces biofilm formation in TSBMg. In these condi-
tions, cells treated with sublethal doses of tunicamycin, which inhibits TarO and thus teichoic acid
synthesis at low concentrations (Swoboda et al., 2010; Campbell et al., 2011; Nunomura et al.,
2010; Swoboda et al., 2009), did not respond to Mg2+ and biofilm formation was inhibited (Fig-
ure 3—figure supplement 1B). Based on these findings, we genetically engineered S. aureus strains
that down- and upregulate genes related to TA biosynthesis, such as tagB (Figure 3—figure supple-
ment 1), verified tagB down- and upregulation in these strains by qRT-PCR (Figure 3—figure sup-
plement 1C), confirmed that these strains show no significant defects in growth or peptidoglycan
synthesis (Figure 3—figure supplement 1D,E) and tested their ability to form biofilms in TSBMg
(Figure 3—figure supplement 1F). Strains with reduced tagB expression did not respond to Mg2+
and thus did not develop biofilms (low-tagB strain) (Figure 3E). In contrast, strains with upregulated
tagB became hypersensitive to extracellular Mg2+ and produced more robust biofilms (high-tagB)
even with Mg2+ traces that are present in regular TSB medium (Figure 3F). We next tested whether
the TA-mediated increase in cell wall rigidity downregulates agr bimodal behavior via sB activation.
To study this, we used qRT-PCR analysis to quantify the relative expression of the sB target-gene
asp23 and staphyloxanthin quantification to determine sB activation in low- and high-tagB strains
(Figure 3A and Figure 3—figure supplement 1G). The low-tagB strain responded more weakly to
extracellular Mg2+ than the high-tagB strain, with limited sB activation in both TSB and TSBMg con-
ditions. In contrast, the high-tagB strain was hypersensitive to extracellular Mg2+, with higher sB acti-
vation than the other strains in TSB.
These results are consistent with our hypothesis that extracellular Mg2+ stabilizes TA, increases
cell wall rigidity and triggers the sB inhibitory signal responsible for downregulating the agr bimodal
switch. Once the agr switch is activated, variations in the concentration of these types of input sig-
nals affect switch activity and modulate the size of the two subpopulations. For instance, Mg2+ in the
colonization niche acts as a downregulatory signal, as it induces sB; activation of the agr switch
becomes more difficult in these conditions and DRcell subpopulation size is reduced (Figure 4A).
However, since this cue neither generates nor abolishes the agr positive feedback loop, but only
modulates its activity, its effect would be restricted to varying the BRcell:DRcell ratio.
To substantiate this concept, we used quantitative analysis of fluorescence microscopy images
and flow cytometry to monitor S. aureus cell differentiation in the presence of extracellular cues that
influence the bimodal switch behavior (AIP excess and sB activation). Purified AIP was added to
Ppsma-yfp or Ppsmb-yfp reporter strain cultures at various concentrations above threshold concentra-
tion of ~10 mM usually found in cultures, which caused differentiation of a DRcell subpopulation that
increased in parallel with AIP concentration but cell heterogeneity nonetheless remained detectable
in cultures (Figure 4B). When we analyzed downregulation of the bimodal switch, WT cultures in
Mg2+-enriched growth conditions had a smaller DRcell subpopulation (Figure 4A), whereas the
DsigB mutant in TSB and TSBMg media differentiated a larger DRcell subpopulation than the WT
strain (Figure 4C). Nevertheless, in both cases BRcell and DRcell differentiation was detected in the
DsigB mutant. Similarly, the low- and high-tagB strains, which are hypo- and hypersensitive to extra-
cellular Mg2+, showed larger and smaller DRcell subpopulations, respectively, in TSBMg (Figure 4D)
although both subpopulations were detected.
Garcıa-Betancur et al. eLife 2017;6:e28023. DOI: https://doi.org/10.7554/eLife.28023 10 of 39
Research article Microbiology and Infectious Disease

According to the information we obtained using the agr orthogonal system and to confirm that
the only means by which to lead the system into unimodal gene expression is by disrupting the agr
positive feedback loop, we monitored DRcell differentiation in the Dagr strain. In this strain, expres-
sion of Ppsma-yfp or Ppsmb-yfp labeled reporters was not detected thus cell differentiation was inhib-
ited in both TSB and TSBMg media (Figure 4E). Results from our orthogonal system pointed that
the feedback loop activation mechanism relies on AgrA~P binding to the P2 promoter to turn on
positive self-regulation of the agr operon, thus we monitored cell differentiation in a S. aureus strain
in which P2 was replaced with a constitutive promoter (Figure 4F). This strain does not have an
Cel
l co
un
t
-1 0 1 10 102
Ppsm -yfp
Fluorescence (AU)
S. aureus WT
-1 0 1 10 102
P -yfpTSBMgTSB
A Ppsm -yfp
Cel
l co
un
t
-1 0 1 10 102
P -yfp
-1 0 1 10 102
Fluorescence (AU)
S. aureus sigB
TSBMgTSB
CB
Cel
l co
un
t
-1 0 1 10 102
Ppsm -yfp P -yfp
-1 0 1 10 102
Fluorescence (AU)
S. aureus agr
TSBMgTSB
Ppsm -yfp
Cel
l co
un
t
-1 0 1 10 102
-1 0 1 10 102
P -yfp
-1 0 1 10 102
P -yfp Ppsm -yfp
Cel
l co
un
t
-1 0 1 10 102
Fluorescence (AU)
S. aureus low-tagB (TSBMg)
Fluorescence (AU)
S. aureus high-tagB (TSBMg)
WTlow-tagB
WThigh-tagB
D E
Ppsm -yfp
Cel
l co
un
t
-1 0 1 10 102
-1 0 1 10 102
P -yfp
Fluorescence (AU)
S. aureus WT + extra AIP
TSBMgTSBMg+AIP
unlabeledAIP cultureextra AIP 0.02X
extra AIP 0.1Xextra AIP 1X
Cel
l co
un
t
-1 0 1 10 102
S. aureus P -yfp (TSBMg)
-1 0 1 10 102
Fluorescence (AU)
-1 0 1 10 102
-1 0 1 10 102
S. aureus Ppsm -yfp (TSBMg)
unlabeled
24 h
72 h
Fluorescence (AU)
Cel
l co
un
t
WTagrconst
WTagrconst
F
Figure 4. AIP and Mg2+modulate the BRcell:DRcell ratio in S. aureus communities. (A) Quantitative analysis of fluorescence microscopy images of agr-
related promoters (Ppsma and Ppsmb) in TSBMg and TSB. We counted ~700 random cells from each of three independent microscopic fields from
independent experiments (~2100 cells total for each strain). In the absence of extracellular Mg2+, the proportion of DRcells increases in the
staphylococcal community, in accordance with the role of Mg2+ in repression of agr via sB. (B) Quantitative analyses of fluorescence microscopy images
(n = 2100) of agr-related promoters in TSBMg with different concentrations of exogenous AIP1 (0.02x to 1x). Increasing AIP1 concentrations above
threshold upregulates the agr bimodal switch and increases DRcell subpopulation size, although both on and off subpopulations are always detected
(‘AIP culture’=no exogenous AIP, equivalent to the 10 mM threshold concentration). (C) Quantitative analyses of fluorescence microscopy images
(n = 2100) of agr-related promoters of S. aureusDsigB mutant in TSBMg and TSB. The DsigB mutant shows upregulation of the agr bimodal switch and
differentiates a larger DRcell subpopulation. (D) Quantitative analysis of fluorescence microscopy images (n = 2100) of agr-related promoters in TSBMg
and TSB, using engineered S. aureus strains that produce different TA levels (low-tagB and high-tagB). The differential sensitivity of these strains to
extracellular Mg2+ alters the proportion of DRcells within S. aureus aggregates. (E) Quantitative analyses of fluorescence microscopy images (n = 2100)
of agr-related promoters of S. aureusDagr mutant in TSBMg and TSB. The Dagr mutant lacks the bimodal switch that triggers cell differentiation. (F)
Quantitative analysis of fluorescence microscopy images (n = 2100) of agr-related promoters in TSBMg, of S. aureus WT and a strain engineered to
express the agrBDCA operon under the control of a constitutive promoter (agrconst); this disrupted the positive feedback loop, as the promoter that
activates agr expression is no longer self-inducible. In the absence of a functional agr positive feedback loop, cell differentiation was not detected and
Ppsma and Ppsmb reporter expression was homogeneous throughout the bacterial population.
DOI: https://doi.org/10.7554/eLife.28023.009
Garcıa-Betancur et al. eLife 2017;6:e28023. DOI: https://doi.org/10.7554/eLife.28023 11 of 39
Research article Microbiology and Infectious Disease

active positive feedback loop, as the promoter that activates agr expression is no longer self-induc-
ible. We monitored DRcell differentiation using Ppsma-yfp or Ppsmb-yfp reporter strains. In the
absence of a functional agr feedback loop, we detected no cell differentiation and reporter expres-
sion was homogenous throughout the bacterial population. These results show that the agr positive
feedback loop must be active to trigger cell differentiation, and that its activity is regulated by addi-
tional input cues that change the ratio of the specialized subpopulations.
BRcells and DRcells organize spatially and are physiologically distinctcell typesGiven that local Mg2+ and AIP concentrations modulate agr switch activity, we explored spatial orga-
nization of cell types during colony development, as reported for other bacteria (Yarwood et al.,
2007). We developed a mathematical model that considers these factors in the context of nutrient
availability and bacterial growth, and delineates growth of multicellular aggregates as a non-linear
reaction-diffusion equation system (Figure 5A and Figure 5—figure supplement 1A) (Hense et al.,
2012). Based on the morphological traits of the multicellular aggregates in different genetic back-
grounds (Figure 5—figure supplement 1B–G), the model predicted that as an aggregate grows
and expands, nutrients become limited in the older, central biofilm region, which has higher AIP lev-
els and slow-dividing cells, which increases representation of the DRcell subpopulation. We sec-
tioned mature aggregates into concentric, morphologically distinct regions and analyzed DRcell and
BRcell subpopulation size by flow cytometry (Figure 5B and Figure 5—figure supplement 2A). In
accordance with the mathematical predictions, the most peripheral region had a larger proportion
of BRcells and a smaller proportion of DRcells. DRcells were enriched in the aggregate center. We
combined cryosectioning and confocal microscopy to determine subpopulation size and location
within the inner zones of thick biofilms (Figure 5C and Figure 5—figure supplement 2B). BRcells
were highly represented in regions near the aggregate outer edge, where nutrient concentration is
high (Cramton et al., 2001), whereas DRcell representation was more prominent in the biofilm inner
region, further from the nutrient source. These experiments showed enrichment of BRcells in newer
and of DRcells in older biofilm regions, suggesting that the staphylococcal cells respond differently
to local input signal concentrations, and differentiate distinct DRcell:BRcell ratios in different biofilm
regions.
To study the potential physiological specialization of BRcell and DRcell types beyond the differen-
tial expression of agr-regulated reporters, we determined their transcriptional profiles using Illumina
RNA-sequencing after enrichment by fluorescence-activated cell sorting (Figure 6 and Figure 6—
figure supplement 1). We grew separate mature aggregates of the strains labeled with the Ppsma-
yfp and Pica-yfp reporter fusions to identify the DRcell and BRcell subpopulations, respectively. Fluo-
rescent cells from mature aggregates were sorted from the rest of the cell population; both fluores-
cent cells (enriched) and whole cell community (non-enriched) were collected simultaneously in
separate samples. Genome-wide analysis showed similar genetic landscapes for DRcell and BRcell
subpopulations, indicating that cell differentiation is not the result of accumulated mutations (Fig-
ure 6—source data 1). RNA was purified from each sample prior to Illumina Hi-seq RNA sequenc-
ing. The total number of reads allowed mapping of ~96% to the S. aureus genome (Figure 6—
figure supplement 2A–B). Comparison of the normalized gene expression profiles (Figure 6A, Fig-
ure 6—figure supplement 2C and Figure 6—source datas 2–4) and qRT-PCR validation (Figure 6—
figure supplement 2D–E) showed marked differences between the enriched subpopulation and its
non-enriched counterpart, which suggested that a specific physiological state could be attributed to
each particular cell type.
BRcells had a large number of upregulated genes, including sigB sigma factor, and of many bio-
film-related genes as well as genes related to peptidoglycan turnover, cell division and DNA replica-
tion. In addition, 49 tRNAs were upregulated, which indicates the higher metabolic activity of
BRcells and their physiological predisposition to proliferation (Figure 6B and Figure 6—figure sup-
plement 2D). DRcells showed a smaller number of upregulated genes, which we attributed to lower
gene expression activity potentially due to the lower physiological activity of this cell type. Among
the few upregulated genes detected, we found a notable number related to toxin secretion and
host invasion, such as the type-VII secretion system (Burts et al., 2005), as well as genes related to
protecting bacterial cells from the immune system, such as the hssRS-htrAB hemin detoxification sys-
tem (Stauff et al., 2007). We also detected upregulation of multi-drug efflux pumps that confer
Garcıa-Betancur et al. eLife 2017;6:e28023. DOI: https://doi.org/10.7554/eLife.28023 12 of 39
Research article Microbiology and Infectious Disease
C
O W P
A
Nutrients Replicative cellsQS molecule Non-replicative cells Total cells
60
-60
0
30
-30
-60 -30 0 30 60
60
30
0
-30
-60
14
7
0-60 -30 0 30 60
60
30
0
-30
-60
60
30
0
-30
-60-60 -30 0 30 60 -60 -30 0 30 60 -60 -30 0 30 60
60
30
0
-30
-60
5
3
0
8
4
0
0.1
0
0.05
8
4
0
60
-60
0
30
-30
-60 -30 0 30 60
60
30
0
-30
-60
14
7
0-60 -30 0 30 60
60
30
0
-30
-60
60
30
0
-30
-60-60 -30 0 30 60 -60 -30 0 30 60 -60 -30 0 30 60
60
30
0
-30
-60
5
3
0
8
4
0
0.1
0
0.05
8
4
0
B
Cel
ls w
ith h
ighe
r flu
ores
cenc
e (%
)
BRcells
10
30
50 ***
ns10
30
50
DRcells
O W P O W P
P W O
BRcells DRcells Unlabeled control
O W P O W P O W P
10
30
50
P W O
Are
a w
ith h
igh
fluor
esce
nce
(%)
10
30
50
P W O
Are
a w
ith h
igh
fluor
esce
nce
(%)****
BRcells DRcells
**** ns
***
*
********
WT
ica spa
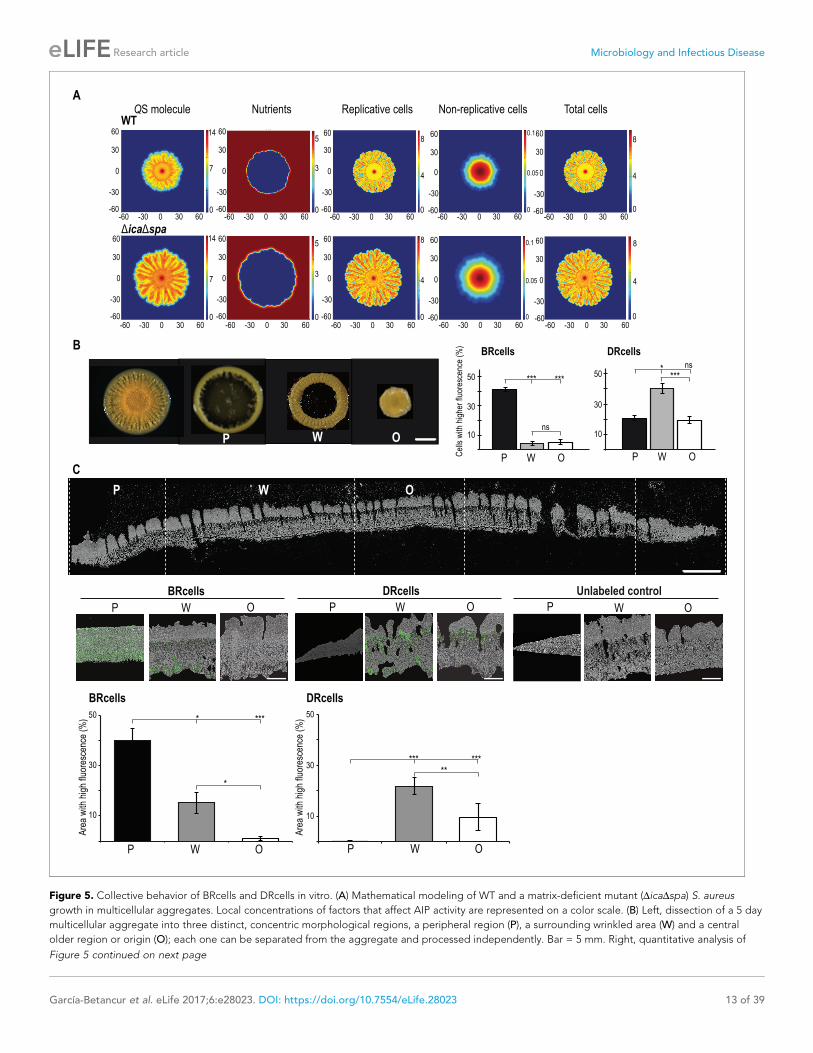
Figure 5. Collective behavior of BRcells and DRcells in vitro. (A) Mathematical modeling of WT and a matrix-deficient mutant (DicaDspa) S. aureus
growth in multicellular aggregates. Local concentrations of factors that affect AIP activity are represented on a color scale. (B) Left, dissection of a 5 day
multicellular aggregate into three distinct, concentric morphological regions, a peripheral region (P), a surrounding wrinkled area (W) and a central
older region or origin (O); each one can be separated from the aggregate and processed independently. Bar = 5 mm. Right, quantitative analysis of
Figure 5 continued on next page
Garcıa-Betancur et al. eLife 2017;6:e28023. DOI: https://doi.org/10.7554/eLife.28023 13 of 39
Research article Microbiology and Infectious Disease

resistance to diverse antimicrobials, and of regulators such as graR and arsR, which positively control
gene-related cell-wall antibiotic resistance and metal ion stress (Figure 6B and Figure 6—figure
supplement 2E). In contrast, the expression of selected housekeeping genes in aggregates growing
in TSBMg and TSB showed no differences (Figure 6—figure supplement 2F), suggesting that extra-
cellular Mg2+ specifically influences the agr bimodal switch pathway rather than causing a global
deregulation of gene expression. These results suggest that the DRcell subpopulation has lower
metabolic activity than BRcell and is predisposed to resist different types of antimicrobials.
BR and DR cell fates arise during in vivo infectionsAn important question arises from the physiological differences detected between BRcells and
DRcells in vitro, concerning the role and impact of these cell types during progression of S. aureus
infections. We found that extracellular Mg2+ is an input signal that regulates agr activity and modu-
lates the sizes of specialized cell subpopulations in vitro, and hypothesized that a similar correlation
could be found in vivo, that is, that different tissue Mg2+ concentrations would lead to distinct sub-
population ratios and distinct infection outcomes. To address this question, we developed an infec-
tion model (Koch et al., 2014) in which mice were intravenously infected with 107colony forming
units (CFU) of cells labeled with Pica-yfp (BRcells) or Ppsma-yfp (DRcells) reporters. Infections were
allowed to progress for four days, after which mice were sacrificed and the infected organs collected
(Figure 7 and Figure 7—figure supplement 1).
The in vitro results correlated with the in vivo experiments; bacteria proliferated more efficiently
in Mg2+-rich organs such as kidney. Infected kidneys showed a bacterial load of 1010 CFU/g of tissue
(Figure 7—figure supplement 1A), and histological preparations of these organs showed large bac-
terial aggregates surrounded by immune cell infiltrates (Figure 7A, Figure 7—figure supplement
1B and Figure 7—figure supplement 3), indicative of long-term colonization during septicemia
(Prabhakara et al., 2011). Confocal microscopy analyses showed approximately three-fold more
BRcells than DRcells in kidney aggregates (Figure 7C Figure 7—figure supplement 2), similar to
levels detected in in vitro experiments; this was consistent with reports that kidneys are Mg2+ reser-
voirs in the body (Gunther, 2011; Jahnen-Dechent and Ketteler, 2012), and that 82% of patients
with urinary catheterization develop long-term S. aureus infections (Muder et al., 2006).
On the other hand, infected hearts showed a bacterial load of 107 CFU/g of tissue (Figure 7—fig-
ure supplement 1A), which suggested that S. aureus cells that colonized heart tissues proliferated
less actively than those in kidney. Infected hearts had a larger DRcell subpopulation, consistent with
the lower metabolic activity, the lower proliferation rate of these cells in vitro and the lower Mg2+
concentration typically found in heart tissue (Gunther, 2011; Jahnen-Dechent and Ketteler, 2012).
Histological preparations of infected hearts revealed deposits of disperse cells with no immune cell
infiltrates (Figure 7B, Figure 7—figure supplement 2 and Figure 7—figure supplement 3), which
is indicative of acute bacteremia (McAdow et al., 2011). Confocal microscopy analysis showed that
as much as 60% of the total heart tissue-colonizing bacterial population consists of DRcells
(Figure 7D and Figure 7—figure supplement 2), as observed in in vitro experiments.
Figure 5 continued
flow cytometry data for BRcells and DRcells in concentric regions of a mature aggregate (n = 50,000). (C) Top, longitudinal-transverse cryosection of a
mature S. aureus aggregate. Bar = 500 mm. Center, spatial distribution of BRcells and DRcells within the aggregate. Bar = 100 mm. Bottom, quantitative
estimate of BRcells (ica and spa reporters) and DRcells (Ppsma and Ppsmbreporters) fluorescent area over the total thin section aggregate area in
representative images (see Material and methods for quantification details). Statistical significance was measured using one-way ANOVA and Tukey’s
test for multiple comparisons. *p<0.05, **p<0.01, ***p<0.001; ns, no significant differences. Data shown as mean ±SD of three independent
experiments (n = 3).
DOI: https://doi.org/10.7554/eLife.28023.010
The following figure supplements are available for figure 5:
Figure supplement 1. Staphylococcus aureus develops architecturally complex multicellular aggregates in Magnesium-supplemented TSB medium
(TSBMg).
DOI: https://doi.org/10.7554/eLife.28023.011
Figure supplement 2. Spatial distribution of BRcells and DRcells in vitro.
DOI: https://doi.org/10.7554/eLife.28023.012
Garcıa-Betancur et al. eLife 2017;6:e28023. DOI: https://doi.org/10.7554/eLife.28023 14 of 39
Research article Microbiology and Infectious Disease

A
DRcells BRcells
55
35
15
15
35
55
0
55
35
15
15
35
55
0
55
35
15
15
35
55
0
36
16 1219
10 9 516
12 1119
30
8 51
21
13 12 10
53
138
3
23
33
8
25
13 1611
3
21
55
12
35
1928
13 8
39
2 5 9
35
3 5 1
15B
Rc
ell
sD
Rc
ell
sD
Rcells
BR
cells
B
Up
Dow
nU
pD
own
Up
Up
-4 0 4
Log Expression
DIV
AA
PROT
VIR
REG
PUR
LIP
MET
0
75
150
DR+ vs. DR- BR+ vs. BR-
Clustering regulated genes by
their expression fold change (log scale)
Figure 6. BRcell and DRcell subpopulations have different gene expression profiles. (A) Unsupervised hierarchical clustering of commonly expressed
genes differentially regulated in at least one of the libraries shows a specific, divergent expression profile for BRcells and DRcells. Color scales
represent log2 fold-changes for differential expression. Clustering was carried out on the regulated genes (minimum fold-change 2) with Ward
hierarchical biclustering using the heatmap.2 command in the ggplots package of the R programming language on Euclidean distances. This approach
successfully grouped the common genes, which are upregulated (orange) in both sets of libraries, and far from the cluster of downregulated genes
(blue). The third set of genes was identified based on this clustering (in the center of the heatmap), which showed library-specific phenotypes
(upregulated in one library and downregulated in the other. (B) Classification of the differentially expressed genes using TIGRfam, SEED and Gene
Ontology (GO) functional categories, followed by manual curation. For each category, solid and dashed columns represent the number of regulated
genes from DESeq analysis using the raw read threshold of >8 and >25, respectively. DIV, DNA replication, cell envelope and cell division; AA, amino
acid synthesis; PROT, protein synthesis and processing; MET, energy and intermediary metabolism; VIR, virulence, binding and transport; REG,
regulation, transcription and signal transduction; PUR, purines, pyrimidines, nucleotides and nucleosides; LIP, lipid metabolism.
DOI: https://doi.org/10.7554/eLife.28023.013
The following source data and figure supplements are available for figure 6:
Source data 1. Genome-wide analysis of DRcell and BRcell sorted subpopulations.
DOI: https://doi.org/10.7554/eLife.28023.016
Source data 2. Gene quantification and differential expression analysis of BRcells and DRcells.
DOI: https://doi.org/10.7554/eLife.28023.017
Source data 3. Functional classification of annotated genes.
DOI: https://doi.org/10.7554/eLife.28023.018
Figure 6 continued on next page
Garcıa-Betancur et al. eLife 2017;6:e28023. DOI: https://doi.org/10.7554/eLife.28023 15 of 39
Research article Microbiology and Infectious Disease

To further correlate the presence of extracellular Mg2+ with infection outcome, we performed
infection studies using the suite of low- and high-tagB strains (Figure 8A). Kidneys showed a reduc-
tion in bacterial load when infected with the Mg2+-hyposensitive low-tagB strain, although this strain
colonized heart tissues more efficiently than S. aureus WT. qRT-PCR analyses verified that these dif-
ferences were associated with upregulation of key genes whose expression is restricted to DRcells
(agrA, agrB and psma/b), which suggests that infections with a low-tagB strain had marked repre-
sentation of DRcells (Figure 8B–C). In contrast, the Mg2+-hypersensitive high-tagB strain was able to
infect kidneys more efficiently than the WT strain, concomitant with a reduced infection of heart tis-
sues. qRT-PCR analyses showed higher expression of genes related to BRcells (icaA, icaB and spa),
which suggested that the high-tagB strain differentiated a larger subpopulation of BRcells. We gen-
erated a new strain derived from the high-tagB strain that also lacks sB. Higher TA content in this
strain increases cell wall rigidity in response to Mg2+, but the lack of sB should prevent activation of
biofilm formation via downregulation of agr. The infection pattern of this DsigB high-tagB strain
resembled the low-tagB pattern in all the organs analyzed. Kidneys infected with this strain thus
showed a reduction in bacterial load, while heart tissues were colonized more efficiently. qPCR anal-
yses demonstrated higher expression of genes related to DRcells in infected kidneys and heart tis-
sues, pointing to a larger number of DRcells in the infection of these strains. In addition, infected
livers, which had a moderate of Mg2+ concentration (Gunther, 2011; Jahnen-Dechent and Ketteler,
2012), also showed comparable bacterial loads between low-tagB, high-tagB and DsigB high-tagB
strains.
DiscussionThe bimodal behavior of the agr system results in the differentiation of two genetically identical, cell
types that specialize in biofilm- or dispersal-associated lifestyles in S. aureus communities. These cell
types were detected in in vitro cultures and during in vivo infections. The expression of specific
markers by BRcells and DRcells is due to activation of the agr bimodal switch, which requires the
production of the activating signal AIP above a certain threshold, similar to other quorum sensing
systems, such as the heterogeneous expression of natural competence in cultures of B. subtilis in
response ComX signal (Maamar and Dubnau, 2005; Smits et al., 2005) or quorum sensing activa-
tion of bioluminescence in a subpopulation of cells in Vibrio harveyi (Anetzberger et al., 2009). A
growing number of bimodal switches are being found in QS pathways, and cell differentiation in
response to a QS signal is becoming an established concept in microbiology.
The molecular mechanism of agr bimodal behavior is based on a sequential activation of the two
adjacent divergent promoters P2 and P3. The P2 promoter triggers positive self-regulation of the
agr operon (by activating the agr positive feedback loop) and the P3 promoter induces the agr regu-
lon responsible for activation of virulence genes (P3 promoter activation is necessary for DRcell spe-
cialization). The differential affinity of AgrA~P for P2 and P3 promoters is crucial for the sequential
promoter activation and thus for agr bimodal switch activation. AgrA~P binds P2 with greater affinity
than the P3 promoter. The P2 promoter thus activates and triggers the feedback loop at lower
AgrA~P concentrations and only in a given subpopulation (agr-on cells). Activation of this feedback
loop produces high AgrA~P levels in this subpopulation, which licenses them to trigger the less-sen-
sitive P3 promoter and induce the agr regulon, leading the agr-on cells to specialize in dispersion
and virulence and become DRcells. In contrast, the cell subpopulation that expresses P2 below the
Figure 6 continued
Source data 4. Hypergeometric analysis for library comparison comprising the log2fold values for differentially expressed genes that were shown to be
expressed by DESeq analysis comparison of DRcells+ against BRcells+ sample sets.
DOI: https://doi.org/10.7554/eLife.28023.019
Figure supplement 1. Experimental workflow to sort BRcells and DRcells using Fluorescence Activated Cell Sorting (FACS) to analyze and compare
their transcriptomic profile.
DOI: https://doi.org/10.7554/eLife.28023.014
Figure supplement 2. Read alignment statistics, transcriptomic profile of BRcells and DRcells and differential distribution of cell types in distinct
infected organs.
DOI: https://doi.org/10.7554/eLife.28023.015
Garcıa-Betancur et al. eLife 2017;6:e28023. DOI: https://doi.org/10.7554/eLife.28023 16 of 39
Research article Microbiology and Infectious Disease

A
40X
100X
100X
BRcells DRcells
Are
a w
ith h
igh
fluor
esce
nce
(%
)
10
30
50
70
BRcells DRcells
*
KidneysB
BRcells DRcellsHeart
100X
100X
40X
10
30
50
70 ***
Are
a w
ith h
igh
fluor
esce
nce
(%
)
BRcells DRcells
C D
Figure 7. BRcells are more represented in infected kidneys and DRcells are more represented in infected hearts. Histological preparations of infected
kidneys (A) or hearts (B) stained with Giemsa solution and visualized using light microscopy. Upper row, 40X magnification of the preparation. Bar = 50
mm. The area delineated in red corresponds to the immune cell infiltrates that surround bacterial aggregates in infected kidneys. The area delineated in
yellow corresponds to the bacterial aggregates surrounded by immune cell infiltrates in infected kidneys or, to dispersed S. aureus cells in the case of
infected hearts. This area is magnified at 100X in central row. Central row, compact aggregates of S. aureus cells can be seen in dark blue. Bar = 20 mm.
Bottom row, confocal fluorescence microscopy images of the bacterial populations imaged in row 3. Right, monitoring of BRcell subpopulation using a
Pica-yfp S. aureus labeled strain. Left, monitoring of DRcell subpopulation using a Ppsma-yfp S. aureus labeled strain. Magnification, 100X. The
fluorescence signal is shown in green. Bar = 20 mm. (C and D) Quantitative estimate of the relative fluorescent signal is shown as a percentage of the
Figure 7 continued on next page
Garcıa-Betancur et al. eLife 2017;6:e28023. DOI: https://doi.org/10.7554/eLife.28023 17 of 39
Research article Microbiology and Infectious Disease

threshold cannot activate the agr positive feedback loop (agr-off cells), and thus do not produce suf-
ficient AgrA~P to induce P3 promoter expression. In these cells, genes normally repressed by
Figure 7 continued
fluorescent area over the total bacterial aggregate area in the images. Statistical significance was measured by an unpaired, two-tailed Student’s t-test.
*p<0.05. Data shown as mean ± SD of three independent measurements (n = 3) each one obtained from different infected organs.
DOI: https://doi.org/10.7554/eLife.28023.020
The following figure supplements are available for figure 7:
Figure supplement 1. Bacterial loads in Mg2+-enriched and Mg2+-depleted organs.
DOI: https://doi.org/10.7554/eLife.28023.021
Figure supplement 2. BRcells are more represented in infected kidneys and DRcells are more represented in infected hearts.
DOI: https://doi.org/10.7554/eLife.28023.022
Figure supplement 3. BRcells are more represented in infected kidneys and DRcells are more represented in infected hearts.
DOI: https://doi.org/10.7554/eLife.28023.023
A
Heart
Kidneys
Bac
teria
l loa
d
(Log
10 C
FU
/g o
f org
an)
Liver
AgrA
AgrB
psmA
psmB
icaA icaB spa
5
15
25
35
B
BR-related genes
Kidneys
DR-related genes
5
15
25
35
Heart
0
2
4
6
8
10
0
2
4
6
8
10
Liver
C
Kidneys
Heart
Liver
1
3
2
0
100
300
500
*
*
**
*
**
*****
*
**
**
*
**
*
*
**
***
Rel
ativ
e ex
pres
sion
(fol
d in
crea
se)
**
* *
*
*
*
Rel
ativ
e ex
pres
sion
(fol
d in
crea
se)
WT low-tagB high-tagB sigB high-tagB0
4
8
12
0
4
8
12
0
4
8
12
*
ns
ns
ns
**
*
** **ns
1
3
2
* ***
*
*
WT low-tagB high-tagB sigB high-tagB
WT low-tagB high-tagB sigB high-tagB
WT low-tagB high-tagB sigB high-tagB
WT low-tagB high-tagB sigB high-tagB
WT low-tagB high-tagB sigB high-tagB
WT low-tagB high-tagB sigB high-tagB
WT low-tagB high-tagB sigB high-tagB
WT low-tagB high-tagB sigB high-tagB
Figure 8. Low- and high-tagB strains display different infection patterns. (A) Bacterial loads on different genetic backgrounds in kidney, heart and liver
of infected mice. (B, C) qRT-PCR analysis of BRcell- (B) and DRcell- (C) related genes in kidney, heart and liver of mice infected with S. aureus strains of
different genetic backgrounds. Data shown as mean ± SD of five independent animals (n = 5) (A) and three independent experiments (n = 3) (B, C).
Statistical significance was measured by multiple comparison analysis using the Mann-Whitney test (A) and unpaired two-tailed Student’s t-test (B, C).
*p<0.05, **p<0.01, ***p<0.001; ns, not significant differences.
DOI: https://doi.org/10.7554/eLife.28023.024
Garcıa-Betancur et al. eLife 2017;6:e28023. DOI: https://doi.org/10.7554/eLife.28023 18 of 39
Research article Microbiology and Infectious Disease

AgrA~P are upregulated, including biofilm-related genes, which licenses them to differentiate as bio-
film-producing cells thus to become BRcells.
Once the agr bimodal switch is activated and BRcells and DRcells differentiate, subpopulation
size is modulated by other extracellular cues that affect bimodal switch activity. We report that extra-
cellular Mg2+ is incorporated into the bacterial cell wall by binding teichoic acids and increases cell
wall rigidity, provoking activation of sigB expression. As sB downregulates the agr bimodal switch,
its activation above the threshold becomes more difficult, leading to differentiation of a smaller
DRcell and a larger BRcell subpopulation, which in turn facilitates biofilm formation. In contrast,
increasing AIP above the threshold concentration facilitates activation of the agr bimodal switch,
leading to differentiation of a larger DRcell and a smaller BRcell subpopulation, which in turn facili-
tates dispersion and acute infection.
The activity of these agr input cues neither generates nor abolishes the agr positive feedback
loop; agr bimodal switch activity is only modulated, which regulates the size of the two subpopula-
tions. DRcell and BRcell subpopulations can therefore be detected in the presence of input cues; in
our in vitro and in vivo assays, only their ratio differed in the overall bacterial community, thus vary-
ing infection outcome in distinct scenarios. In mouse models, we found that in vivo infections devel-
oped a larger DRcell subpopulation in tissues with low Mg2+ levels (cardiac tissue), in which the
microbial population became dispersed. In contrast, BRcells were more prevalent in tissues with high
Mg2+ concentrations (bone, kidney) and bacteria organized in microbial aggregates characteristic of
biofilm-associated infections. The results recapitulate clinical studies in which a marked number of
biofilm-associated persistent infections develop in urinary tract and bone, usually following surgery
or catheterization (Muder et al., 2006; Brady et al., 2008; Flores-Mireles et al., 2015;
Idelevich et al., 2016). These data help to understand how nosocomial pathogens such as S. aureus
can simultaneously cause dissimilar types of infections in distinct organs, and show that cell differen-
tiation in nosocomial pathogens is particularly relevant for adaptation to different host tissues.
The molecular mechanism whereby extracellular Mg2+ downregulates the agr bimodal switch
relies on the capacity of magnesium to bind TA to increase cell wall rigidity (Heptinstall et al.,
1970; Hughes et al., 1971), in turn causing agr downregulation via activation of the repressor sB.
Staphylococcus aureus cells with reduced cell wall TA adhere poorly, have poor biofilm formation
ability (Vergara-Irigaray et al., 2008), and do not colonize nasal (Weidenmaier et al., 2004) or kid-
ney-derived endothelial tissues (Weidenmaier et al., 2005a). An effect similar to that of Mg2+ incor-
poration into the cell wall is caused by D-alanine esterification of TA (Lambert et al., 1975a;
Lambert et al., 1975b). The Dlt protein machinery decorates TA with D-alanine esters to reduce
repulsive interactions between TA negative charges, which also increases cell wall rigidity
(Perego et al., 1995). Previous reports showed that Dlt activity is important for biofilm formation in
S. aureus (Gross et al., 2001) and for developing biofilm-associated infections in vivo in animal mod-
els (Weidenmaier et al., 2005b). Our results are consistent with these findings and suggest that,
given the intricacy of agr bimodal switch regulatory control, many extracellular cues probably con-
tribute to the outcome of S. aureus infections. Extracellular Mg2+ and hence, increased cell wall
rigidity are probably important cues for triggering biofilm-associated infections.
Here we show that infections generated by clonal populations of bacteria can bifurcate into dis-
tinct, specialized cell types that localize physically in different colonization tissues in the course of an
infection. The prevalence of physiologically distinct bacterial cells in different organs could offers
bacteria an adaptive strategy that increases their chance of evading the immune system evasion dur-
ing infection, or provides a bet-hedging strategy that increases the possibility of survival during anti-
microbial therapy (Beaumont et al., 2009). Understanding cell differentiation in bacteria is central to
designing new anti-infective strategies that target specific cell subpopulations, particularly to patho-
gens like Staphylococcus aureus, considered endemic in hospitals and which has an approximately
20% mortality rate (Klevens et al., 2007).
Materials and methods
Strains, media and culture conditionsA complete list of strains used in this study is shown in Supplementary file 1. The laboratory S.
aureus strain RN4220 (Kornblum et al., 1990) was used for cloning purposes. The strain Escherichia
Garcıa-Betancur et al. eLife 2017;6:e28023. DOI: https://doi.org/10.7554/eLife.28023 19 of 39
Research article Microbiology and Infectious Disease

coli DH5a was used for propagating plasmids and genetic constructs in laboratory conditions. B.
subtilis and E. coli strains were regularly grown in LB medium. When required, selective media were
prepared in LB agar using antibiotics at the following final concentrations: ampicillin 100 mg/ml,
kanamycin 10 mg/ml, chloramphenicol 5 mg/ml, tetracycline 10 mg/ml, and erythromycin 2 mg/ml. S.
aureus strains were routinely propagated in liquid TSB medium incubated with shaking (220 rpm) at
37˚C for 16 hr. When required, selective media were prepared in TSB using antibiotics at the follow-
ing final concentrations: kanamycin 10 mg/ml, chloramphenicol 10 mg/ml, tetracycline 10 mg/ml,
erythromycin 2 mg/ml, neomycin at 75 mg/ml, Spectinomycin at 300 mg/ml and Lincomycin at 25 mg/
ml.
For S. aureus aggregates in TSBMg, 4 ml of an overnight liquid culture was spotted in TSBMg
(TSB medium supplemented with MgCl2100 mM) (Koch et al., 2014) and dried in a sterile culture
cabin. Plates were allowed to grow for five days at 37˚C (Koch et al., 2014). For S. aureus traditional
biofilms in liquid TSBMg and TSB, we followed the protocol proposed by O’Toole and Kolter
(O’Toole and Kolter, 1998a). Briefly, an overnight liquid culture was inoculated 1:100 in fresh TSB
media and after 6 hr at 37˚C with shaking at 220 rpm, the OD600 nm was measured and normalized
to a final OD600 0.05. From the normalized cultures, 5 ml was inoculated in 995 ml of TSB or TSBMg
in a 24-well microtiter plate (Thermo) (RRID:SCR_008452) and incubated for 24 or 48 hr at 37˚C with-
out shaking. Biofilm formation was measured as follows: media was discarded by aspiration; wells
were washed twice with PBS and allowed to dry for 45 min at 65˚C. Then, 500 ml of a solution of
Crystal Violet at 0.1% was added and to stain the organic material associated with the well for 5
min. After staining, wells were washed three times with deionized water. For quantitative analyses,
Crystal Violet was solubilized using 500 ml of acetic acid at 33%. The solubilized dye was diluted
1:100 in deionized water and transferred to 96-well microtiter plates (Thermo). The absorbance was
determined at 595 nm using an InfiniteF200 Pro microtiter plate reader (Tecan). Background was
corrected by subtracting the absorbance values of non-bacteria inoculated wells. Specific growth
conditions are presented in figure legends.
For the experiments using the synthetic orthogonal agr model generated in B. subtilis wild type
and DsigB mutant, cells were incubated in LB medium at 220 rpm at 37˚C until cultures reached an
OD600nm = 0.5. After incubation, 50 ml of the culture was added to 50 ml of chemically-defined
MSgg growing medium (Branda et al., 2001) and allowed to grow for 4 hr at 37˚C at 220 rpm. After
incubation, 50 ml of culture was used to inoculate 50 ml of fresh LB and allowed to grow for 12 hr at
37˚C with constant shaking. Addition of AIP to the culture defined the initiation of the experiment
(time = 0 hr). Samples were taken at 0 hr, 2 hr, 4 hr, 6 hr, 8 hr, 10 and 12 hr.
Strain generationTo generate the S. aureus strain Newman Dica, Dpsma, Dpsmb and DdltA-E mutants, 500 bp flanking
each gene and the respective antibiotic cassettes were PCR amplified and the fragments were sub-
sequently joined together using a long-flanking homology PCR (LFH-PCR). The resulting fragments
were cloned into pMAD plasmid (Arnaud et al., 2004) and transformed into the laboratory strain S.
aureus RN4220. To transfer the mutations from RN4220 to Newman and to generate the double
mutant strains, j11 phage lysates were generated from RN4220 mutants to infect Newman, NewHG
and USA300 LAC* (Rudin et al., 1974). Clones resistant to the respective antibiotic were further ver-
ified to carry the mutation using PCR. Positive clones were validated to carry the mutation using
Sanger sequencing.
To generate the S. aureus strains single-labeled with Pica-yfp, Pspa-yfp, Ppsma-yfp, Ppsma-mars,
Ppsmb-yfp, PdnaA-yfp and double-labeled with Pspa-yfp Pica-mars, Ppsmb-yfp Ppsma-mars, Ppsma-yfp Pica-
mars, Pspa-yfp Ppsma-mars, Pica-yfp PclfA-mars, Pica-yfp PisdA-mars, Pspa-yfp PclfA-mars and Pspa-yfp
PisdA-mars transcriptional fusions, the respective promoter region comprising 200 to 500 bp
upstream of the start codon was fused to the yfp reporter-gene using the plasmid pKM003 or to the
rfp (mars) reporter-gene using the plasmid pKMmars. These fusions were subcloned into the plas-
mids pAmy and pLac (Yepes et al., 2014). The plasmids were integrated into the neutral amy and
lac loci of S. aureus chromosome to ensure a uniform and chromosome-equivalent copy number of
the reporters in all the cells within the microbial community. The integration of reporters in amy and
lac neutral loci occurs in a two-step recombination process, as described in (Yepes et al., 2014).
Briefly, integration of the plasmid into the chromosome of S. aureus occurs via a single recombina-
tion event. This first recombination occurs by growing the plasmid-carrying strain overnight at 30˚C,
Garcıa-Betancur et al. eLife 2017;6:e28023. DOI: https://doi.org/10.7554/eLife.28023 20 of 39
Research article Microbiology and Infectious Disease
plating serial dilutions onto selective media (erythromycin 2 mg/ml and X-Gal 100 mg/ml) and incu-
bating the plates at 44˚C. This is a temperature-sensitive plasmid, which does not allow plasmid rep-
lication at higher temperatures (Arnaud et al., 2004). Therefore, incubation at 44˚C allows only the
strains that incorporate the plasmid into the chromosome to grow. The genetic constructs obtained
from the first recombination process in the strain RN4220 were transferred to strain Newman by j11
phage transduction (Rudin et al., 1974). Once the constructs were transferred to the recipient strain
(Newman and USA300 LAC* strains), we forced a second recombination process to leave only the
reporter in the integration locus. To do this, a culture of a light-blue colony was incubated overnight
at 30˚C in the absence of erythromycin, plating serial dilutions onto selective (erythromycin and
X-Gal) media and then incubating the plates at 44˚C. After 48 hr of incubation at 44˚C, the light-blue
colonies still carrying the plasmid in the chromosome were discarded. A four-step process of screen-
ing, including fluorescence, antibiotic susceptibility, PCR and Sanger sequencing, was designed to
validate whether the white colonies carried the corresponding insertion in the neutral loci. The S.
aureus strains tagB-lower (NWMN_0187), tagG-lower (NWMN_1763) and tagH-lower (NWMN_1763)
were obtained by phage transduction using as donor strain the respective mutants deposited in the
transposon-mapped mutant collection (Bae et al., 2004). Clones were verified using PCR and
Sanger sequencing. The S. aureus strain that overexpresses the tagB gene (tagB-higher)
(NWMN_0187) or the agrBCDA operon (NWMN_1943 to NWMN_1946) were obtained by cloning
the complete ORF into the replicative plasmid pJL74 (Klijn et al., 2006). The sarA P1 promoter and
the RBS of sodA guarantee high expression and translation levels in S. aureus.
To construct the agr synthetic orthologous model in B. subtilis DsigB, the two genes agrC and
agrA, which are adjacent in the operon agrBDCA, were cloned as a chimeric version agrCA. The
gene agrC encodes the histidine kinase and the gene agrA encodes the cognate regulator
(Recsei et al., 1986; Boles and Horswill, 2008; Peng et al., 1988). The resultant construct was inte-
grated into the amyE neutral chromosomal locus of B. subtilis DsigB (strain 168). Moreover, the Pica-
yfp, Pspa-yfp, Ppsma-yfp, Ppsmb-yfp, PRNAII-yfp and PRNAIII-yfp transcriptional fusions were cloned into
plasmid pDR183 and integrated into the neutral locus lacA. For transformation via double heterolo-
gous recombination, all plasmids were linearized and added to competence-induced liquid cultures
of B. subtilis DsigB strain 168 (Hardwood and Cutting, 1990). Resultant colonies were verified that
contained the reporter using Sanger sequencing. The synthetic model that recreates the divergent
P2 and P3 promoters of S. aureus contains a DNA fragment of the construct of RNAII and RNAIII
joined to the cfp and yfp genes divergently transcribed by the P2 (RNAII) and P3 (RNAIII) promoter,
respectively. This fragment was cloned into the plasmid pDR183 and integrated into the neutral
locus lacA. The integration of the fragment occurs by double heterologous recombination. The plas-
mids were linearized and added to competence-induced liquid cultures of B. subtilis DsigB strain
168. The resultant colonies were verified to contain the construct using Sanger sequencing.
Staphyloxanthin extraction and quantificationFor staphyloxanthin extraction, we used a protocol adapted from Pelz et al. (2005). After 72 hr of
growth, cells were harvested, washed once and resuspended in PBS buffer. The cell densities at
OD600 nm were measured and the samples normalized. One ml of cells was centrifuged and the pel-
let resuspended in 200 ml of methanol and heated at 55˚C for 3 min. Samples were centrifuged to
eliminate debris. Then, 200 ml of the supernatant was taken and the methanol extraction repeated.
A volume of 180 ml was recovered and added to 820 ml of methanol. Absorption spectra of the
methanol extracts were measured using a spectrophotometer at a peak of 465 nm, normalized and
reported as relative absorbance to express the total amount of staphyloxanthin pigment.
Atomic force microscopy indentationMechanical indentation via atomic force microscopy (AFM) was applied according to previous publi-
cations (Dufrene, 2014; Formosa-Dague et al., 2016). Overnight cultures were diluted into fresh
TSB or TSBMg liquid media to a final OD600 of 0.05. Cells were grown overnight at 37˚C and 220
rpm. One (1) ml of the culture was washed with sterile PBS or PBS supplemented with MgCl2 final
concentration 100 mM (PBSMg), depending on culture conditions and were normalized to a final
OD600 of 0.5 in PBS or PBSMg. Cells were fixed with 4% p-formaldehyde for 6 min and washed twice
with 500 ml of PBS. One series of mild sonication was applied to produce a homogenous sample of
Garcıa-Betancur et al. eLife 2017;6:e28023. DOI: https://doi.org/10.7554/eLife.28023 21 of 39
Research article Microbiology and Infectious Disease

single cells. Finally, 40 ml of a dilution of 1:5 in deionized water was immobilized on poly-lysine
coated microscopy slides. Samples were washed twice with Milli-Q water and allowed to dry. Sam-
ples were processed immediately after immobilization, in air and at room temperature, using a CFM
conical probe AFM (Nanotec, Spain) with nominal spring constant 3 N/m and resonant frequency 75
kHz. Optical lever calibration and sensitivity was obtained by tapping the probe cantilever onto the
glass surface of the slide and measuring the force response to z-piezo extension (z is vertical to the
glass surface). For cell indentation, the AFM probe was placed above a cell and repeatedly pressed
down onto the surface (and retracted) at 50 nm/s over distances of 100 nm, several times at several
positions of the cell surface. Z position and speed of the AFM probe were controlled by a piezoelec-
tric translator. The force response of the cell membrane was measured at three different positions
for three individual cells. Young’s modulus was obtained by fitting the resulting force-indentation
curves for forces <10 nN, resulting in indentations <~20 nm. Best fits were produced with a modified
Hertz model assuming a conical punch probe geometry.
Purification of AIPFor purification of AIP1 from S. aureus strain Newman, we used a protocol that is adapted from
(MDowell et al., 2001). To obtain an enriched fraction of AIP, a 500 ml culture of each strain was
grown for 24 hr in TSB and, after the removal of bacterial cells by centrifugation, the supernatant
was filtered through a 0.22 mm membrane filter and mixed 1:1 volumes with binding buffer (2%
CH3CN and 1% trifluoroacetic acid). The filtered supernatant was loaded into a C18 Sep-Pak car-
tridge (Waters) previously stabilized with binding buffer. Elution of AIP was achieved with a 60% con-
centration range of CH3CN and subsequently concentrated using a SpeedVac system. Fresh AIP
fractions were used in each experiment due to the instability of the preparation.
Extraction and quantification of cell wall peptidoglycanPeptidoglycan from S. aureus was purified using a protocol adapted from (Bera et al., 2005;
Peterson et al., 1978). Cells were grown in 2 L of TSB medium and incubated overnight at 37˚Cwith vigorous shaking. Bacteria were harvested by centrifugation (5000 � g, 4˚C, 10 min), washed
with cold buffer 1 (20 mM ammonium acetate, pH 4.8) and resuspended in 30 ml of buffer 1. Cell
suspension was transferred to a falcon tube, centrifuged and determined the weight of the pellet.
Cell pellet was resuspended in 2 ml of buffer and cells were disrupted with a bead beater (Genog-
rinder, SPEXsamplePrep, USA). After centrifugation, the interphase between glass beads and the
foam at the top of the tube was collected and treated with 40 U of DNase, 80 U of RNase and 5 mM
of MgSO4 and were incubated 5 hr at 37˚C. Cell walls were resuspended in 2% SDS in buffer 1 and
incubated 1 hr at 65˚C. The material was washed twice with distilled water and resuspended in 30 ml
of buffer 1. 5% trichloroacetic acid was added to remove WTA from peptidoglycan and incubated 4
hr at 60˚C. PG was then washed four to six times with cold Milli-Q water, lyophilized, and weighed.
Before use, PG was resuspended in PBS buffer and sonicated on ice.
Quantification of peptidoglycan was performed using a protocol adapted from (Nocadello et al.,
2016; Zhou et al., 1988). PG pellets were resuspended in 5 ml of cold buffer 1 and diluted 1:50 in a
final volume of 2 ml. PG was labeled with Remazol Brilliant Blue (RBB) by incubating the samples
with 20 mM RBB in 0.25 M NaOH ON at 37˚C with constant shaking. The labeled samples were neu-
tralized with HCl and pelleted by centrifugation at 14000 rpm for 20 min at room temperature. We
performed intense washing using distilled water to eliminate the remaining RBB. After washing, the
RBB-PG complexes were diluted 1:50 and the OD 595 nm was determined. OD 595 nm values were
normalized to wet weight of each PG-isolated sample.
Stereomicroscopy and fluorescence microscopyDigital images of the development of S. aureus multicellular aggregates were captured with an Axio-
CAm-HR digital camera (Carl Zeiss) using AxioVision AC Release 4.3 software (Carl Zeiss) (RRID:
SCR_002677). For fluorescence microscopy, cells from the multicellular communities or from the liq-
uid cultures were washed in PBS and resuspended in 0.5 ml of 4% paraformaldehyde solution and
incubated at room temperature for 6 min. After two washing steps with PBS buffer, samples were
resuspended in 0.5 ml of PBS buffer and mildly sonicated to guarantee samples of dispersed single
cells. Microscopy images were taken on a Leica DMI6000B microscope equipped with a Leica
Garcıa-Betancur et al. eLife 2017;6:e28023. DOI: https://doi.org/10.7554/eLife.28023 22 of 39
Research article Microbiology and Infectious Disease

CRT6000 illumination system (Leica). The microscope was equipped with a HCX PL APO oil immer-
sion objective with 100 � 1.47 magnification and a color camera Leica DFC630FX. Linear image
processing was done using Leica Application Suite Advance Fluorescence Software (RRID:SCR_
013673). The YFP fluorescence signal was detected using an excitation filter 489 nm and an emission
filter 508 nm (excitation filter BP 470/40 and suppression filter BP 525/20). The RFP-mars fluores-
cence signal was detected using an excitation filter 558 nm and an emission filter 582 nm (excitation
filter BP 546/12 and suppression filter BP 605/75). Excitation times were 567 and 875 msec, respec-
tively. Transmitted light images were taken with 21 msec of excitation time.
To quantitatively measure cell fluorescence from microscopy images, we adapted an image pro-
tocol originally published by McCloy RA et al., using ImageJ64 v1.48s (NIH, USA) (RRID:SCR_
003070) (McCloy et al., 2014). Briefly, to quantify the number of fluorescent cells and determine
their fluorescence level within a microscopy field, the overlapping image of the bright field and fluo-
rescent channels was converted to RGB and inverted it to highlight fluorescent cells. An automati-
cally adjusted threshold generated an image in which only fluorescent cells were represented (image
A). Using the same procedure without the inversion step generated an additional image in which
only non-fluorescent cells were represented (Image B). The sum between fluorescent and non-fluo-
rescent cells from Images A and B, respectively, represented the total number of cells in the field.
Quantification of fluorescence at the single cell level in the microscopy field was determined using
the same software using the following commands: from the analyze menu, we selected set measure-
ments, making sure that Area, Min and Max gray values and Mean gray value were selected. Then,
we selected analyze particles and set: size in pixel unit from 20 to 200 pixels, circularity from 0.1 to
1.00 and show overlay outlines, making sure that the options display results, summarize and in situ
show were selected. It is recommended to run a configuration test to set the analyze particles
parameters that correctly cover all cells in the microscopy image. Analysis results were transferred to
a Microsoft Excel sheet and to calculate the Total Cell Fluorescent (TCF) as TCF = Area of selected
cell X Mean fluorescence. Results were used to generate a histogram that represents the number of
particles for each mean fluorescence value. At least three independent images were analyzed for
each experiment and the mean values were plotted. In average, each microscopy field comprised
500–765 cells. For analysis of overlapping signals using fluorescence microscopy, we considered sig-
nals to overlap when both signals were detected in a 3:1–1:3 range. This is the range in which green
and red signals merge to yellow signal in microscopy and thus define green/red fluorescence
overlap.
For thin cryosectioning of S. aureus multicellular communities, bright field and fluorescence
images were acquired using a TCS SP5 II confocal microscope (Leica). The hardware settings
included: Argon laser power at 25% and 496 nm laser intensity at 15%. Bright field images were col-
lected using the PMT-1 Trans scan channel at 512 V with a gain offset of �0.15%. Fluorescent
images were collected using the HyD-2 channel with a gain of 10 and an emission bandwidth of 500
nm for excitation and 550 nm for emission (excitation filter BP 470/40 and suppression filter BP 525/
20). The acquisition mode included a xyz scan mode, with z-stacks in the z-wide mode from 4 to 8
mm. To determine the structural features of the thin sections and localize the fluorescence, a series
of horizontal optical sections were collected using a z-step size of 0.3 mm. Width and height format
in X and Y was set to 1024 � 1024 pixels at a scan speed of 200 Hz. Air 1 pinhole was set to auto-
matic detection. A HCX PL APO CS 40.0 � 1.30 OIL UV objective was used for image acquisition.
Digital images were captured using the Leica AF 6000 system software that is provided with the con-
focal microscope. All parameters were kept identical for the unlabeled control and the different
labeled samples. To quantitatively measure fluorescence area from each thin cryosection image, we
used ImageJ64 v1.48s and we adapted an image protocol as in (McCloy et al., 2014; Gavet and
Pines, 2010; Potapova et al., 2011). Using this software, we quantified the bacterial aggregate
area from each image of infected tissue. We quantify the proportion of fluorescent area from the
total area occupied by S. aureus cells and referred it in percentage as relative fluorescence signal.
We quantified fluorescence of three different thin cryosection samples obtained from three indepen-
dent multicellular aggregates.
The infected mice organs were aseptically extracted and immersed in a solution 1:1 of PBS and
paraformaldehyde 4% and left at 4˚C overnight. 4 mm-thick sections were obtained using a CM 3050
s cryostat set to �20˚C (Leica). These histological sections were placed on SuperFrost plus poly
lysine-coated slides (Thermo) and immediately rinsed twice with PBS buffer precooled at 4˚C. Then,
Garcıa-Betancur et al. eLife 2017;6:e28023. DOI: https://doi.org/10.7554/eLife.28023 23 of 39
Research article Microbiology and Infectious Disease

fixed-samples where stained with Giemsa staining solution (Sigma) including a dehydration step
before the staining and a rehydration step after staining using Xylol and ethanol at 96%, 70% and
50% (Thammavongsa et al., 2009). Slides were immediately mounted with coverslips and processed
by confocal microscopy. Histological digital images were obtained using the Diskus software
(Hilgers). For fluorescence imaging, a Leica TCS SP5 II confocal microscope equipped with A HCX PL
APO CS 100 � 1.47 OIL objective was used. The hardware settings included: Argon laser power at
25% and 496 nm laser intensity at 10%. Bright field images were collected using the PMT-1 Trans
scan channel at 512 V. Fluorescent images were collected using the HyD-2 channel with a gain of 5
and an emission bandwidth of 500 nm for excitation and 550 nm for emission (excitation filter BP
470/40 and suppression filter BP 525/20). The acquisition mode included a xyz scan mode, with
z-stacks in the z-wide mode from 4 to 8 mm. To localize fluorescence, a series of horizontal optical
sections were collected using a z-step size of 0.2 mm and with an optimized system. Width and
height format in X and Y was set to 1024 � 1024 pixels at a scan speed of 200 Hz. Air one pinhole
was set to automatic detection. Digital images were captured using the Leica AF 6000 system soft-
ware provided with the confocal microscope. All parameters remained constant during the examina-
tion of the different labeled samples. To measure fluorescence signal in infected organs, we used
ImageJ64 v1.48s and we adapted an image protocol from (McCloy et al., 2014; Gavet and Pines,
2010; Potapova et al., 2011). Using this software, we quantified the bacterial aggregate area that
exists in each one of the infected tissue images. From the area that is occupied by S. aureus cells,
we used the same software to quantify the proportion of fluorescent area and referred in percentage
relative to the total bacterial aggregate area. We quantified fluorescence of three different histologi-
cal sections obtained from independent organs from three different infected mice.
Flow cytometryFor flow cytometry analysis, cells from the multicellular communities were fixed with a treatment of
4% paraformaldehyde as mentioned above, washed and resuspended in PBS buffer. After fixation, a
sonication treatment was required to separate single cells in the sample. In this case, samples were
subjected to series of 25 pulses (power output 70% and cycle 0.7 s) and kept on ice. Dilution of sam-
ples 1:500 was necessary prior flow cytometry analyses. For YFP fluorescence, a laser excitation of
488 nm coupled with 530/30 and 505LP sequential filter was used. The photomultiplier voltage was
set at 777 V.
Fluorescence-activated cell sortingTo obtain samples enriched in BRcells or DRcells, we used single-labeled Staphylococcus aureus mul-
ticellular communities between day 4 and 5 of development. These strains were labeled to differenti-
ate cells expressing the extracellular matrix-production reporter (Pica-yfp) or the detachment/
virulence reporter (Ppsma-yfp). Multicellular communities were scraped from the TSBMg plates and
immediately resuspended in RNAlater (Qiagen) in 1.5 ml RNAse-free Eppendorf tubes, in order to
fix the cell fluorescence and at the same time preserve the RNA within the cells. Previous reports
(Rosenberg et al., 2003) and fluorescence microscopy experiments performed in our laboratory
(data not shown) showed that the fixing procedure of these multicellular communities in RNAlater
had no effect in the conservation of the fluorescence when compared to cells fixed using 4% parafor-
maldehyde. Multicellular communities were disrupted in the RNAlater by extensive pipetting, fol-
lowed by one series of mild sonication as mentioned above, and previously treating the sonicator
with RNaseZap RNase Decontamination Solution (Life Technologies) (RRID:SCR_008817). All proce-
dures were performed on ice. After sonication, samples were immediately processed using FACS.
Cell fixation and subsequent mild sonication allowed cell separation without affecting cell integrity.
For the sorting procedure, 50 ml of the cell suspension was resuspended in 10 ml of filtered and
autoclaved PBS buffer prepared in DEPC-treated water. This cell suspension was sonicated, chang-
ing cycles from 70% to continuous (100%) and performing 1 round of 20 s. Immediately, cells were
FACS-sorted based on their fluorescence intensity in a FACS Aria III (Becton Dickinson) (RRID:SCR_
008418) using the following parameters: Nozzle size of 70 microns, FITC/Alexa Fluor 488 nm laser, a
530/30 nm filter for data collection and a 502 LP mirror. Flow cytometry parameters were set as:
SSC 341 V with a threshold of 500, FSC 308 V with a threshold of 500, FITC 769 V and a variable
Flow Rate to guarantee that the number of events per second never exceeded 1500; hence, the
Garcıa-Betancur et al. eLife 2017;6:e28023. DOI: https://doi.org/10.7554/eLife.28023 24 of 39
Research article Microbiology and Infectious Disease

Sorting Efficiency never dropped from 97%. These data were analyzed using the BDIS FACS Diva
software version 7.0 provided with the FACS Aria III. Sorting was performed in the Precision Mode
set to ‘Single Cell’ in a first round, followed by a second sorting round set to ‘Purity’. Using the sort-
ing Precision Mode, we recovered approx. 25 million cells of each subpopulation (fluorescent cells)
and their respective non-fluorescent counterparts, based on manually established Target Gates P1
for highly fluorescent cells and P2 for non-fluorescence cells. Once sorted (approximately 5 million
cells per 15 ml tube), cells were immediately quick-frozen by immersing the tubes in liquid nitrogen
prior to ultra-freezing until sorting was completed.
RNA isolationFor the FACS-sorted bacterial cells, the ultra-frozen samples were thawed using a 37˚C water bath.
The volume was poured in a vacuum filter system provided with a 47 mm filter diameter and 0.45
mm pore-size. The equipment was previously sterilized using 75% ethanol in DEPC-treated water, fol-
lowed by two DEPC-treated water rinses and finally UV light for 180 s and then precooled at �20˚C.Filters containing each of the sorted samples were individually ground using liquid Nitrogen in an
RNAse-free, sterile precooled mortar. The powder was carefully scraped out from the mortar and
placed in a 2 ml RNAse-free Eppendorf tube and the RNA isolated as described below.
To isolate RNA from S. aureus infected organs, 450 ml of the homogenized organs were incu-
bated for 15 min on ice with 50 ml of RNAlater and 5 ml of Triton X100 briefly vortexing every 5 min
to lyse the murine cells. After lysis, RNA was isolated as described below. To isolate RNA from S.
aureus infected organs, 450 ml of the homogenized organs were incubated for 15 min on ice with 50
ml of RNAlater and 5 ml of Triton X100 briefly vortexing every 5 min to lyse the murine cells. After
lysis, RNA was isolated as described below.
One volume of TE lysis buffer (Tris 20 mM pH 7.5, EDTA 10 mM) prepared in DEPC-prepared
water and 25 ml of Lysostaphin (1 mg/ml) were added and taken to a hybridization oven (with rota-
tion), pre-warmed at 37˚C. Samples were incubated for 30 min at 37˚C prior to transferring the
whole material to a new tube for mechanical lysis. This was performed using FastPrep Lysing Matrix
glass beads in a Fast Prep Shaker (MP Biomedicals) (RRID:SCR_013308) set at 6500 rpm for 50 s.
Samples were lysed using 2 cycles of 50 s. The lysate was transferred to a new 2 ml RNAse-free
Eppendorf tube and centrifuged for 10 min at 14000 rpm and 4˚C to remove the filter and beads.
The supernatant (700 ml) was recovered and used for RNA isolation using the standard hot phenol
methodology with some modifications. The sample recovered from was mixed with 60 ml of 10%
SDS and incubated at 64˚C for 2 min. 66 ml of sodium acetate 3 M pH 5.2 and 750 ml of phenol Roti-
Aqua (Carl Roth) were added and the mixture was incubated at 64˚C for 6 min with mixing every 30
s. The sample was centrifuged for 10 min at 13000 rpm and 4˚C and the upper aqueous layer was
transferred to a 2 ml Phase Lock Gel Heavy (PLGH) tube (5Prime). Then, 750 ml of Chloroform was
added and the sample was centrifuged for 12 min at 13000 and 15˚C. The aqueous layer was trans-
ferred to a new tube and mixed with 2 volumes of a 30:1 ethanol and sodium acetate 3 M pH 6.5
mix. Additionally, 0.5 ml of GlycoBlue co-precipitant (15 mg/ml) (Life Technologies) was added. This
mix was left at �20˚C overnight. The following day, the sample was removed from storage at
�20˚C, centrifuged for 30 min at 13000 rpm and 4˚C and the pellet was washed with 300 ml of pre-
cooled 75% ethanol. After washing, the total RNA was resuspended in 42 ml of RNAse-free water
(Qiagen) were added and the sample was incubated at 65˚C at 1000 rpm for 5 min prior storage in
ice. To remove any DNA traces, the isolated RNA was treated (one to three times, depending on
the sample) with 4 Units of RNase-free DNase I (Thermo), 10 Units of SUPERase In RNase Inhibitor
(Life Technologies) and incubated for 45 min at 37˚C. To remove the DNase I, 50 ml of RNAse-free
water and 100 ml of Roti-Aqua-P/C/I (Phenol, Chloroform, Isoamyl alcohol 25:24:1 pH 4.5–5) (Carl
Roth) were added to the reaction tube, mixed, transferred to a 2 mL PLGH tube and centrifuged for
12 min at 13000 rpm and 15˚C. The sample was mixed with 2.5 volumes of the 30:1 ethanol and
sodium acetate with 0.5 ml of GlycoBlueTM, which led to RNA precipitation when stored at �20˚Covernight. On the following day, samples were centrifuged for 30 min at 13000 rpm and 4˚C,washed with 200 ml of 75% ethanol and the pellets were dried and resuspended in 50 ml of DEPC-
water. To remove phenol residues, 50 ml of RNAse-free water and 100 ml of Chloroform (Carl Roth)
were added to the reaction tube, mixed by inversion for 1 min, transferred to a 2 mL PLGH tube and
centrifuged for 12 min at 13000 rpm and 15˚C. The sample was mixed with 2.5 volumes of the 30:1
Garcıa-Betancur et al. eLife 2017;6:e28023. DOI: https://doi.org/10.7554/eLife.28023 25 of 39
Research article Microbiology and Infectious Disease

ethanol and sodium acetate with 0.5 ml of GlycoBlueTM, which led to RNA precipitation when stored
at �20˚C overnight. On the following day, samples were centrifuged for 1 hr at 13000 rpm and 4˚C,washed with 200 ml of 75% ethanol and the pellets were dried. This RNA was resuspended in 22 to
44 ml of RNAse-free water and then incubated at 65˚C at 1000 rpm for 5 min. To assess the concen-
tration and purity of the total RNA, OD260 was measured using a Nanodrop (Thermo) and the
OD260/OD280 ratio and the OD260/OD230 ratio determined.
RNA-Seq library construction, sequencing and quantitative-PCR analysisThe cDNA prepared was strictly strand-specific, allowing transcriptome sequencing and expression
profiling in both the forward and reverse strands. The combined-length of the flanking sequences
was 100 bases. The cDNA is generated and size fractionated by preparative gel electrophoresis or
by using the LabChip XT fractionation system from Caliper/PerkinElmer in order to obtain cDNA
fractions, optimally suited for the different NGS systems. For this, the RNA samples were poly (A)-
tailed using a poly(A) polymerase. The 5’-PPP were removed using tobacco acid pyrophosphatase
(TAP) followed by the ligation of the RNA adapter to the 5’-monophosphate of the RNA. First-strand
cDNA synthesis was performed with an oligo (dT)-adapter primer and the M-MLV reverse transcrip-
tase. The resulting cDNA was PCR-amplified to reach a concentration of 20–30 ng/ml using a high
fidelity DNA polymerase. The cDNA was purified using the Agencourt AMPure XP kit (Beckman)
(RRID:SCR_008940) and was analyzed by capillary electrophoresis. The primers used for PCR amplifi-
cation were designed for TruSeq sequencing according to the instructions of Illumina. The following
adapter sequences flank the cDNA inserts: TruSeq_Sense: 5’-AATGATACGGCGACCACCGAGATC
TACACTCTTTCCCTACACGACGCTCTTCCGAT-T-3’ TruSeq-Antisense NNNNNN (NNNNNN = B
arcode) 5’-CAAGCAGAAGACGGCAT ACGAGATNNNNNNGTGACTGG-AGTTCAGACGTGTGCTC
TTCC-GATC(dT25)�3’.
For quantification of gene expression, total RNA was reverse-transcribed using hexameric random
primers followed by quantitative real-time PCR (qRT–PCR) using the SsoAdvanced SYBR Green
Supermix (Bio-Rad) (RRID:SCR_013553), following manufacturer’s instructions. Primer pairs used are
described in the Supplementary file 2. Gene expression was normalized to gyrA/gapA expression
and expression fold changes were calculated using the 2�DDCt method. These qRT-PCR experiments
were performed following the standard MIQE guidelines for publication of qRT-PCR experiments
(Bustin et al., 2009).
Bioinformatics analysisThe pooled sequence reads were de-multiplexed and the adapter sequences were removed. After
that, the reads in Fastq format were quality trimmed using fastq_quality_trimmer (from the FastX
suite version 0.0.13) (RRID:SCR_005534) with a cut-off Phred score of 20 and converted to Fasta for-
mat using Fastq_to_Fasta (also from the FastX suite). The reads were processed, which included
poly(A) removal, size filtering (minimum read length of 12 nucleotides after clipping), statistics gen-
eration, coverage calculation and normalization, which were performed with the RNA-analysis pipe-
line READemption version 0.3.3. READemption uses segemehl version 0.1.7 for the read alignment
to the reference and DESeq 1.18.0 (Anders and Huber, 2010) (RRID:SCR_000154) for the differen-
tial gene expression analysis. The reference genome NC_009641 was taken from the NCBI database
for the purpose of alignment and gene-quantification. DESeq calculates statistically significant
expression fold change and their log2 values by computing the ratio of normalized read counts of
each gene in two libraries. The genes with log2fold value higher than 1.5 and lower than �1.5 were
selected as up- and down-regulated gene-sets, respectively. Scatter plots for the visualization of
sample correlation were generated using matplotlib 1.4.2. 2. Datasets used for gene ontology for
functional classification of genes differentially expressed, hierarchical clustering and the calculation
of the hypergeometric probability for genes differentially expressed are presented in Figure 6—
source data 2 to 4.
Genome-wide analyses to compare BRcells and DRcellsWe estimated the difference between the reference genome and the sequences from the libraries
(total number of reads in the libraries range from ~6–11 million with an average of 100 nucleotides
per read). Libraries were analyzed using SAMtools (mpileup command) and variant calling by
Garcıa-Betancur et al. eLife 2017;6:e28023. DOI: https://doi.org/10.7554/eLife.28023 26 of 39
Research article Microbiology and Infectious Disease

BCFtools (RRID:SCR_005227). The variants were quantified for the reads mapped to the coding
regions of the reference genome using the standard quality score >40 (base call accuracy 99.99%).
SAM (Sequence Alignment/Map) tools enables quality checking of reads, and automatic identifica-
tion of genomic variants (Li et al., 2009b). A high quality score means higher number of sequences
showing a particular kind of variation. Quality score is proportional to the number of reads mapped
to a gene that account for the variation. The BCFtools were used for the variance calling to identify
general variances in each library and compared with each other to determine the existence of
library-specific variations (Li, 2011). Using this approach, we detected a minimum of 99.999934%
genome similarities at the nucleotide level between distinct cell types.
Statistical analysisAll statistical analyses were performed using the software Prism 6 (version 6.0 f, GraphPad) (RRID:
SCR_002798). Graphs represent data from at least three independent experiments with at least
three independent technical replicates for experiment. Error bars represent standard deviation
(mean ±SD). For the analysis of experiments with two groups, the parametric unpaired two-tailed
Student’s t-test with Welch’s correction was done and, the non-parametric unpaired Mann-Whitney
test were done. For the analysis of experiments with three or more groups, the parametric one-way
ANOVA test was done. Post hoc analysis included multiple comparisons Tukey’s test, Dunnett’s test
or Dunn’s tests, depending on the data set. Differences were considered significant when p value
was smaller than 0.05. Statistical significance: ns = not statistically significant, *p<0.05, **p<0.01,
***p<0.001.
Mouse infection studiesAll animal studies were approved by the local government of Lower Franconia, Germany (license
number 55.2-DMS-2532-2-57 and were performed in strict accordance with the guidelines for animal
care and animal experimentation of the German animal protection law and directive 2010/63/EU of
the European parliament on the protection of animals used for scientific purposes. Female BALB/c
mice (16 to 19 g) were purchased from Charles River (Charles River Laboratories, Erkrath, Germany)
(RRID:SCR_003792), housed in polypropylene cages and supplied with food and water ad libitum.
The different S. aureus strains used were cultured for 18 hr at 37˚C on BHI medium. Subsequently,
cells were collected and washed three times with PBS and diluted to reach an OD600 nm = 0.05. Via-
ble cell counts were determined by plating dilutions of the inoculum on TSB agar plates. To compare
the representation of each cell type of S. aureus in the bacterial communities that colonize the dis-
tinct organs, three cohorts of 3 mice for the unlabeled strain and six mice for each labeled strains
(Pica-yfp and Ppsma-yfp) were infected with 150 ml of cultures of S. aureus, containing 1 � 107 cells via
tail vein injection. Each strain was used to infect one cohort of mice. Infections were allowed to prog-
ress until severe infection signs occurred or to the endpoints of 24 hr, 48 hr, 72 hr and 96 hr after
mice challenging. Animals were sacrificed when they met the following criteria: 1) loss of at least
20% of body weight; 2) loss of at least 15% of body weight and ruffled fur; 3) loss of at least 10% of
body weight and hunched posture; or 4) 24 hr, 48 hr, 72 hr and 96 hr time points after infection.
Infected kidneys and hearts were aseptically harvested and processed for thin sectioning, histology
and confocal microscopy, as described above. Organs were also used to calculate bacterial burden
calculated as CFU/g of organ, as proposed by Marincola et al. (2012). For this purpose, kidneys
and hearts were homogenized in 2 ml of sterile PBS using GentleMACSTM M Tubes (Miltenyi Biotec)
(RRID:SCR_008984) and serial dilutions from 10�2 to 10�8 of the organ homogenates were immedi-
ately plated on TSB plates and incubated at 37˚C for 24 hr, To compare the representation of the S.
aureus low-tagB and high-tagB strains colonizing the kidneys, heart and liver, four cohorts of 5 mice
each, were infected with 150 ml of cultures of S. aureus and organs were processed as described
above. Three days after bacterial challenge all mice were euthanized, organs were aseptically har-
vested and processed as described above, CFU determined and RNA isolated.
Mathematical modeling of agr bimodal behaviorTo study the dynamic processes of the synthetic network, we mathematically described the reactions
of the genetic circuitry of the orthologous system. In this circuit, the phosphorylation state is only
reached inside the cell after the concentration of AIP is above the threshold. The complex AgrA~P is
Garcıa-Betancur et al. eLife 2017;6:e28023. DOI: https://doi.org/10.7554/eLife.28023 27 of 39
Research article Microbiology and Infectious Disease

the transcription factor that upregulates the expression of P2 promoter (also called PRNAII) responsi-
ble for activation of the positive feedback loop. Moreover, AgrA~P upregulates the expression of
the rest of the promoters that were used in this work; P3 (Also called PRNAIII), Ppsma, Ppsmb. Pica and
Pspa promoters are not directly regulated by AgrA~P and were therefore used as negative controls.
The reactions that define the former genetic network are the following:
Activation=deactivation : AgrA PþPagrA
k1
*)
k�1
PaagrA (1)
Fast transcription : PaagrA !
k2PaagrA þmAgrA (2)
Slow transcription : PagrA !k3PagrAþmAgrA (3)
Translation : mAgrA!k4mAgrAþAgrA (4)
Complex formation : AgrA þP!k5AgrA P (5)
CreationðappearanceÞ : f!k6
P (6)
Activation=deactivation : AgrA PþPx
k7
*)
k�7
Pax (7)
Fast transcription : Pax !
k8Pax þmYFP (8)
Slow transcription : Px !k9Px þmYFP (9)
Translation : mYFP!k10
mYFPþYFP (10)
Degradation ðdisappearanceÞ : mAgrA!k11
f (11)
Degradation ðdisappearanceÞ : AgrA!k12
f (12)
Degradation ðdisappearanceÞ : AgrAP!k13
f (13)
Degradation ðdisappearanceÞ : P!k14
f (14)
Degradation ðdisappearanceÞ : mYFP!k15
f (15)
Degradation ðdisappearanceÞ : YFP!k16
f (16)
where k1 and k-1 are the binding and unbinding rates of AgrA~P to P2, k2 is the transcription rate of
P2 once AgrA~P binds the promoter, k3 is the basal transcription rate of P2, k2 and k3 produce the
mRNA of agrA, k4 is the translation rate of AgrA protein, k5 is the phosphorylation rate of AgrA, k6is the availability rate of phosphate in the system, k7 and k-7 are the binding and unbinding rates of
Garcıa-Betancur et al. eLife 2017;6:e28023. DOI: https://doi.org/10.7554/eLife.28023 28 of 39
Research article Microbiology and Infectious Disease

AgrA~P to the different promoters (Px), k8 is the transcription rate of Px once AgrA~P binds to the
promoter (Pax), k9 is the basal transcription rate of Px, k10 is the translation rate of the YFP protein
and k11 to k16 are the degradation rates of mRNAs and proteins involved in this system.
Deterministic modeling using differential equations pointed to a quasi-steady state assumption
(Murray, 2002), which we used to identify the elements responsible for the behavior of the system.
The resulting equations are:
dAgrA P
dt¼
k6 �AgrA
AgrAþ d� k13 � AgrAP (17)
dAgrA
dt¼
a1 þ b1 � AgrAP
g1 þ AgrAP�
k6 �AgrA
AgrAþ d� k12 �AgrA (18)
dYFP
dt¼
a2 þ b2 � AgrAP
g2 þ AgrAP� k16 �YFP (19)
where a1 = k3k-1k4PtagrA/k1k11, b1 = k2k4PtagrA/k11, g1 = k-1/k1, d = k14/k5, a2 = k9k-7k10Ptx/k7k15, b2 =
k8k10Ptx/k15, g2 = k-7/k7 and Pti = Pi + Pai with i = [agrA, x].
The following values are used to run the Gillespie algorithm of the full model (reactions 1–16). We
focused our first set of simulations on the dynamics that affect YFP directly, to further study the
behavior of the system when considering variations in AgrA and AgrA~P. The first set of simulations
allowed us to find parameters that show a fixed value among all of the experiments independently
on the promoter that is under consideration. These parameters are shown here:
Parameter Meaning Value
k1 Binding rate 0.01 molecules/h
k-1 Unbinding rate 2/h
k2 Transcription rates 500/h
k3 Basal transcription rate 50/h
k9 Basal transcription rate 90/h
k4, k10 Translation rates 50/min
k5 Phosphorylation rate 0.05/molecules/hour
k6 Entry rate 40/molecules/hour
k11, k15 Degradation rates 10/hour
k12 Degradation rate 0.05/hour
k13 Degradation rate 0.1/hour
k14, k16 Degradation rates 1/hour
Consequently, the values of these parameters did not change through the rest of the simulations
that aimed to characterize the kinetics of each particular promoter. Initial simulations assumed the
high stability of AgrA~P to test the response of the system to saturated levels of AgrA~P. The fol-
lowing simulations assumed unstable AgrA~P. The specific rates to simulate each promoter were
defined as follows:
Parameter Meaning (rate) PRNAIII Ppsma PRNAII Ppsmb PRNAIII-dual PRNAII-dual
k8 Transcription 300 300 450 470 300 450/hour
k7 Binding 3 6.5 10 20 12 40 � 10�4*
k-7 Unbinding 0.08 0.08 0.1 0.1 0.08 0.1/hour
*molecules�1 hour�1
The simulations that involved an unstable AgrA~P established values of k5 = 0.2 � 10�4 and
k6 = 5. Using these values, we resolved a 3-mode decision-making model. Further simulations that
Garcıa-Betancur et al. eLife 2017;6:e28023. DOI: https://doi.org/10.7554/eLife.28023 29 of 39
Research article Microbiology and Infectious Disease

involved changeable values of k6 (phosphate availability) revealed that the activation rate of P2 and
P3 occurs within a range of 0 and a maximum value of saturation of 40. The values for the rest of the
parameters were selected from standard numbers obtained from previously reported studies
(Andersen et al., 1998; Balagadde et al., 2008; Ben-Tabou de-Leon and Davidson, 2009;
Dublanche et al., 2006; Goni-Moreno and Amos, 2012).
Mathematical modeling of multicellular communities developmentWe used a so-called reaction diffusion system, which not only describes the changes of concentra-
tions and density in time to any type of reaction but also their spread in space. In our case, we used
a model with two spatial dimensions. Our system consisted of four equations, describing how the
concentrations of nutrients, AIP and the density of replicative and non-replicative bacteria evolved in
time. In the following, n x; tð Þdenotes the nutrient concentration, b x; tð Þthe density of replicative bac-
teria, s x; tð Þthe density of non-replicative bacteria and q x; tð Þthe concentration of AIP. We assumed
that nutrients and AIP underlie diffusion. Diffusion parameters are denoted by dn anddq, respectively.
In the case of the replicative bacteria, the diffusion coefficient depends on nutrient concentration
and the density of replicative bacteria. It is of the form db ¼ snbwhere salso contains a stochastic
fluctuation of random movement. This form for the diffusion of active bacteria cells was chosen
according to the model developed by Kawasaki et al. (1997). We assumed that non-replicative bac-
teria are not able to diffuse on their own and their diffusion is driven by movement of the replicative
cells. The diffusion of non-replicative bacteria depends on the density of replicative bacteria. If there
are more replicative bacteria, the non-replicative cells will be pushed in a type of diffusion. This
effect is limited. The diffusion coefficient for the non-replicative bacteria is assumed to be of the
form:
ds ¼ tb
bsþ b
where bs and tare constant. The replicative bacteria proliferate by consuming nutrients. In our sys-
tem of equations, the consumption rate of the nutrients was given by G1f n; bð Þ and the bacterial
growth was described by the term G2 f n;bð Þ where G2=G1 was the conversion rate of consumed
nutrients to bacterial growth. We assumed f n; bð Þto be of the form:
f n; bð Þ ¼bn
1þgn1þ
1
qmþ dq
� �
Here, we chose a Monod growth term (Monod, 1949) to describe the increase in the concentra-
tion of replicative bacteria in relation to nutrient consumption. It reproduces the fact that a high
nutrient concentration will cause a faster increase in the concentration of replicative bacteria but
that these bacteria cannot reproduce infinitely fast. An additional factor accounts for the effect of
the quorum sensing signal. If the concentration of active bacteria is already high, a high concentra-
tion of AIP slows down the conversion process. We furthermore assumed that there is only a transi-
tion from replicative to non-replicative cells. This process is described by a term of the form:
"a b;nð Þ ¼ "b
1þ ba1
� �
1þ na2
� �
This choice is in agreement with (Matsushita et al., 1999). The equation number four described
the concentration of AIP. We considered that the diffusion and the increase in the concentration of
AIP are related with the concentration of replicative bacteria but we also considered that there is
degradation process of AIP. The degradation of AIP is described byq, whereas the production of AIP
typically has two levels in a Hill type function (Gustafsson et al., 2004) with Hill coefficient 2 to
reflect bistability. This is caused by a positive feedback including nonlinearity in the underlying regu-
lation system. The low production rate of AIP is denoted by p1while the increased production rate is
denoted byp2. The threshold between the low and the increased production is denoted byqthr. For
more details see (Muller et al., 2006). With the above-mentioned terms we achieved the following
system of equations, which are able to represent the growth dynamics of S. aureus multicellular
aggregates:
Garcıa-Betancur et al. eLife 2017;6:e28023. DOI: https://doi.org/10.7554/eLife.28023 30 of 39
Research article Microbiology and Infectious Disease
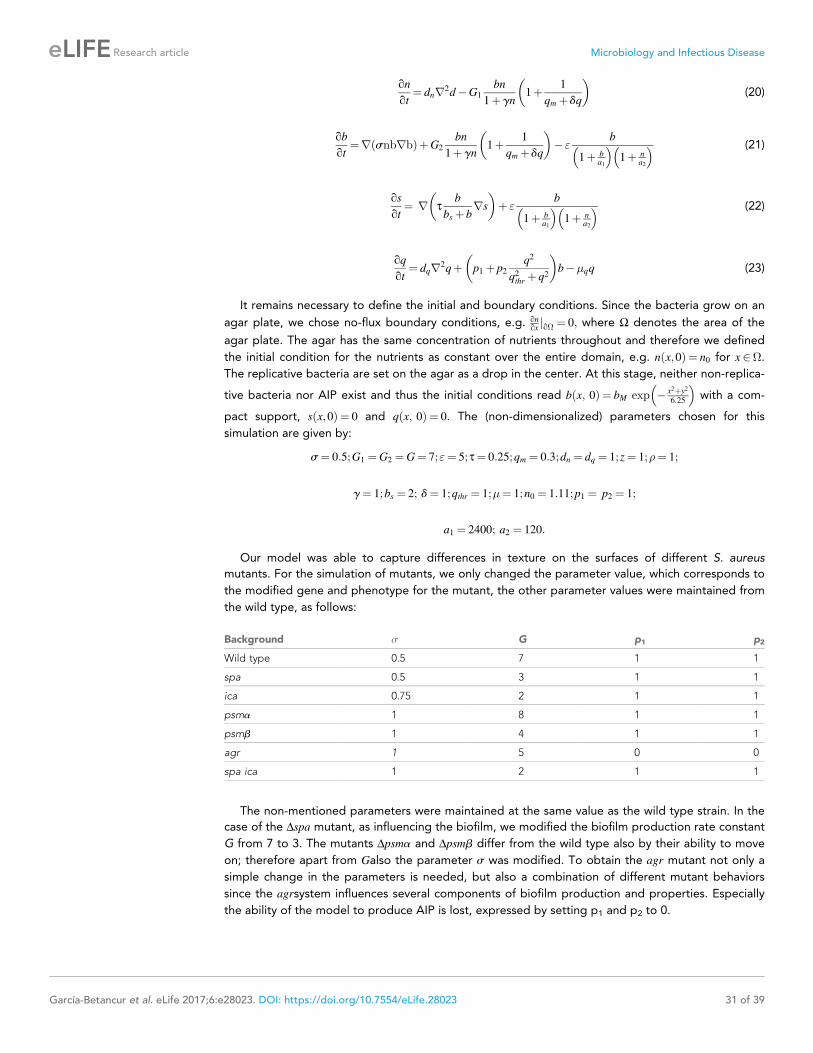
qn
qt¼ dnr
2d�G1
bn
1þgn1þ
1
qmþ dq
� �
(20)
qb
qt¼r snbrbð ÞþG2
bn
1þgn1þ
1
qmþ dq
� �
� "b
1þ ba1
� �
1þ na2
� � (21)
qs
qt¼ r t
b
bsþ brs
� �
þ "b
1þ ba1
� �
1þ na2
� � (22)
qt¼ dqr
2qþ p1 þ p2q2
q2thr þ q2
� �
b��qq (23)
It remains necessary to define the initial and boundary conditions. Since the bacteria grow on an
agar plate, we chose no-flux boundary conditions, e.g. qnqxjq ¼ 0; where W denotes the area of the
agar plate. The agar has the same concentration of nutrients throughout and therefore we defined
the initial condition for the nutrients as constant over the entire domain, e.g. n x;0ð Þ ¼ n0 for x2.
The replicative bacteria are set on the agar as a drop in the center. At this stage, neither non-replica-
tive bacteria nor AIP exist and thus the initial conditions read b x; 0ð Þ ¼ bM exp � x2þy2
6:25
� �
with a com-
pact support, s x;0ð Þ ¼ 0 and q x; 0ð Þ ¼ 0. The (non-dimensionalized) parameters chosen for this
simulation are given by:
s¼ 0:5;G1 ¼G2 ¼G¼ 7;"¼ 5;t¼ 0:25;qm ¼ 0:3;dn ¼ dq ¼ 1; z¼ 1;�¼ 1;
g¼ 1;bs ¼ 2; d¼ 1;qthr ¼ 1;�¼ 1;n0 ¼ 1:11;p1 ¼ p2 ¼ 1;
a1 ¼ 2400; a2 ¼ 120:
Our model was able to capture differences in texture on the surfaces of different S. aureus
mutants. For the simulation of mutants, we only changed the parameter value, which corresponds to
the modified gene and phenotype for the mutant, the other parameter values were maintained from
the wild type, as follows:
Background s G p1 p2
Wild type 0.5 7 1 1
spa 0.5 3 1 1
ica 0.75 2 1 1
psma 1 8 1 1
psmb 1 4 1 1
agr 1 5 0 0
spa ica 1 2 1 1
The non-mentioned parameters were maintained at the same value as the wild type strain. In the
case of the Dspa mutant, as influencing the biofilm, we modified the biofilm production rate constant
G from 7 to 3. The mutants Dpsma and Dpsmb differ from the wild type also by their ability to move
on; therefore apart from Galso the parameter s was modified. To obtain the agr mutant not only a
simple change in the parameters is needed, but also a combination of different mutant behaviors
since the agrsystem influences several components of biofilm production and properties. Especially
the ability of the model to produce AIP is lost, expressed by setting p1 and p2 to 0.
Garcıa-Betancur et al. eLife 2017;6:e28023. DOI: https://doi.org/10.7554/eLife.28023 31 of 39
Research article Microbiology and Infectious Disease

AcknowledgementsWe thank M Luna (CSIC, Spain) for assistance with atomic force microscopy and C Mark (CSIC,
Spain) for editorial assistance. JCGB was supported by GSLS from the University of Wurzburg.
Sequencing files have been deposited in the NCBI GEO Series (accession number GSE69835).
Additional information
Funding
Funder Grant reference number Author
H2020 European ResearchCouncil
335568 Daniel Lopez
Deutsche Forschungsge-meinschaft
Lo1804-2/2 Daniel Lopez
Ministerio de Economıa yCompetitividad
BFU2014-55601-P Daniel Lopez
The funders had no role in study design, data collection and interpretation, or the
decision to submit the work for publication.
Author contributions
Juan-Carlos Garcıa-Betancur, Angel Goni-Moreno, Thomas Horger, Melanie Schott, Julian Eikmeier,
Investigation, Methodology; Malvika Sharan, Software, Formal analysis; Barbara Wohlmuth, Soft-
ware, Formal analysis, Supervision; Alma Zernecke, Conceptualization, Formal analysis; Knut Ohlsen,
Conceptualization, Data curation; Christina Kuttler, Conceptualization, Software, Formal analysis;
Daniel Lopez, Conceptualization, Supervision, Funding acquisition, Investigation, Writing—original
draft, Project administration, Writing—review and editing
Author ORCIDs
Juan-Carlos Garcıa-Betancur http://orcid.org/0000-0003-3371-3384
Julian Eikmeier http://orcid.org/0000-0002-1576-1174
Daniel Lopez http://orcid.org/0000-0002-8627-3813
Ethics
Animal experimentation: All animal studies were approved by the local government of Lower Fran-
conia, Germany (license number 55.2-DMS-2532-2-57 and were performed in strict accordance with
the guidelines for animal care and animal experimentation of the German animal protection law and
directive 2010/63/EU of the European parliament on the protection of animals used for scientific
purposes.
Decision letter and Author response
Decision letter https://doi.org/10.7554/eLife.28023.031
Author response https://doi.org/10.7554/eLife.28023.032
Additional filesSupplementary files. Supplementary file 1. List of strains used in this study.
DOI: https://doi.org/10.7554/eLife.28023.025
. Supplementary file 2. List of plasmids and plasmids used in this study.
DOI: https://doi.org/10.7554/eLife.28023.026
. Transparent reporting form
DOI: https://doi.org/10.7554/eLife.28023.027
Garcıa-Betancur et al. eLife 2017;6:e28023. DOI: https://doi.org/10.7554/eLife.28023 32 of 39
Research article Microbiology and Infectious Disease

Major datasets
The following dataset was generated:
Author(s) Year Dataset title Dataset URL
Database, license,and accessibilityinformation
Garcia-Betancur JC,Goni- Moreno A,Horger T, Schott M,Sharan M, EikmeirJ, Wohlmuth B,Zernecke A, OhlsenK, Kuttler C andLopez D
2017 Cell Differentiation Defines Acuteand Chronic Infection Cell Types inStaphylococcus aureus
https://www.ncbi.nlm.nih.gov/geo/query/acc.cgi?acc=GSE69835
Publicly available atthe NCBI GeneExpression Omnibus(accession no.GSE69835)
ReferencesAnders S, Huber W. 2010. Differential expression analysis for sequence count data. Genome Biology 11:R106.DOI: https://doi.org/10.1186/gb-2010-11-10-r106, PMID: 20979621
Andersen JB, Sternberg C, Poulsen LK, Bjorn SP, Givskov M, Molin S. 1998. New unstable variants of greenfluorescent protein for studies of transient gene expression in bacteria. Applied and environmentalmicrobiology 64:2240–2246. PMID: 9603842
Anetzberger C, Pirch T, Jung K. 2009. Heterogeneity in quorum sensing-regulated bioluminescence of Vibrioharveyi. Molecular Microbiology 73:267–277. DOI: https://doi.org/10.1111/j.1365-2958.2009.06768.x, PMID: 19555459
Arnaud M, Chastanet A, Debarbouille M. 2004. New vector for efficient allelic replacement in naturallynontransformable, low-GC-content, gram-positive bacteria. Applied and Environmental Microbiology 70:6887–6891. DOI: https://doi.org/10.1128/AEM.70.11.6887-6891.2004, PMID: 15528558
Arnoldini M, Vizcarra IA, Pena-Miller R, Stocker N, Diard M, Vogel V, Beardmore RE, Hardt WD, Ackermann M.2014. Bistable expression of virulence genes in salmonella leads to the formation of an antibiotic-tolerantsubpopulation. PLoS Biology 12:e1001928. DOI: https://doi.org/10.1371/journal.pbio.1001928, PMID: 25136970
Audretsch C, Lopez D, Srivastava M, Wolz C, Dandekar T. 2013. A semi-quantitative model of Quorum-Sensingin Staphylococcus aureus, approved by microarray meta-analyses and tested by mutation studies. MolecularBioSystems 9:2665–2680. DOI: https://doi.org/10.1039/c3mb70117d, PMID: 23959234
Bae T, Banger AK, Wallace A, Glass EM, Aslund F, Schneewind O, Missiakas DM. 2004. Staphylococcus aureusvirulence genes identified by bursa aurealis mutagenesis and nematode killing. PNAS 101:12312–12317.DOI: https://doi.org/10.1073/pnas.0404728101, PMID: 15304642
Balagadde FK, Song H, Ozaki J, Collins CH, Barnet M, Arnold FH, Quake SR, You L. 2008. A syntheticEscherichia coli predator-prey ecosystem. Molecular Systems Biology 4:187. DOI: https://doi.org/10.1038/msb.2008.24, PMID: 18414488
Beaumont HJ, Gallie J, Kost C, Ferguson GC, Rainey PB. 2009. Experimental evolution of bet hedging. Nature462:90–93. DOI: https://doi.org/10.1038/nature08504, PMID: 19890329
Ben-Tabou de-Leon S, Davidson EH. 2009. Modeling the dynamics of transcriptional gene regulatory networksfor animal development. Developmental Biology 325:317–328. DOI: https://doi.org/10.1016/j.ydbio.2008.10.043, PMID: 19028486
Bera A, Herbert S, Jakob A, Vollmer W, Gotz F. 2005. Why are pathogenic staphylococci so lysozyme resistant?The peptidoglycan O-acetyltransferase OatA is the major determinant for lysozyme resistance ofStaphylococcus aureus. Molecular Microbiology 55:778–787. DOI: https://doi.org/10.1111/j.1365-2958.2004.04446.x, PMID: 15661003
Bigger J. 1944. Treatment of staphylococcal infections with penicillin by intermittent sterilisation. The Lancet244:497–500. DOI: https://doi.org/10.1016/S0140-6736(00)74210-3
Bischoff M, Entenza JM, Giachino P. 2001. Influence of a functional sigB operon on the global regulators sar andagr in Staphylococcus aureus. Journal of Bacteriology 183:5171–5179. DOI: https://doi.org/10.1128/JB.183.17.5171-5179.2001, PMID: 11489871
Blomberg P, Wagner EG, Nordstrom K. 1990. Control of replication of plasmid R1: the duplex between theantisense RNA, CopA, and its target, CopT, is processed specifically in vivo and in vitro by RNase III. TheEMBO journal 9:2331–2340. PMID: 1694128
Boles BR, Horswill AR. 2008. Agr-mediated dispersal of Staphylococcus aureus biofilms. PLoS Pathogens 4:e1000052. DOI: https://doi.org/10.1371/journal.ppat.1000052, PMID: 18437240
Brady RA, Leid JG, Calhoun JH, Costerton JW, Shirtliff ME. 2008. Osteomyelitis and the role of biofilms inchronic infection. FEMS Immunology & Medical Microbiology 52:13–22. DOI: https://doi.org/10.1111/j.1574-695X.2007.00357.x, PMID: 18081847
Branda SS, Gonzalez-Pastor JE, Ben-Yehuda S, Losick R, Kolter R. 2001. Fruiting body formation by Bacillussubtilis. PNAS 98:11621–11626. DOI: https://doi.org/10.1073/pnas.191384198, PMID: 11572999
Garcıa-Betancur et al. eLife 2017;6:e28023. DOI: https://doi.org/10.7554/eLife.28023 33 of 39
Research article Microbiology and Infectious Disease
Bubeck Wardenburg J, Williams WA, Missiakas D. 2006. Host defenses against Staphylococcus aureus infectionrequire recognition of bacterial lipoproteins. PNAS 103:13831–13836. DOI: https://doi.org/10.1073/pnas.0603072103, PMID: 16954184
Burts ML, Williams WA, DeBord K, Missiakas DM. 2005. EsxA and EsxB are secreted by an ESAT-6-like systemthat is required for the pathogenesis of Staphylococcus aureus infections. PNAS 102:1169–1174. DOI: https://doi.org/10.1073/pnas.0405620102, PMID: 15657139
Bush K, Courvalin P, Dantas G, Davies J, Eisenstein B, Huovinen P, Jacoby GA, Kishony R, Kreiswirth BN, KutterE, Lerner SA, Levy S, Lewis K, Lomovskaya O, Miller JH, Mobashery S, Piddock LJ, Projan S, Thomas CM,Tomasz A, et al. 2011. Tackling antibiotic resistance. Nature Reviews Microbiology 9:894–896. DOI: https://doi.org/10.1038/nrmicro2693, PMID: 22048738
Bustin SA, Benes V, Garson JA, Hellemans J, Huggett J, Kubista M, Mueller R, Nolan T, Pfaffl MW, Shipley GL,Vandesompele J, Wittwer CT. 2009. The MIQE guidelines: minimum information for publication of quantitativereal-time PCR experiments. Clinical Chemistry 55:611–622. DOI: https://doi.org/10.1373/clinchem.2008.112797, PMID: 19246619
Campbell J, Singh AK, Santa Maria JP, Kim Y, Brown S, Swoboda JG, Mylonakis E, Wilkinson BJ, Walker S. 2011.Synthetic lethal compound combinations reveal a fundamental connection between wall teichoic acid andpeptidoglycan biosyntheses in Staphylococcus aureus. ACS Chemical Biology 6:106–116. DOI: https://doi.org/10.1021/cb100269f, PMID: 20961110
Casadevall A, Fang FC, Pirofski LA. 2011. Microbial virulence as an emergent property: consequences andopportunities. PLoS Pathogens 7:e1002136. DOI: https://doi.org/10.1371/journal.ppat.1002136, PMID: 21814511
Cheung AL, Chien YT, Bayer AS. 1999. Hyperproduction of alpha-hemolysin in a sigB mutant is associated withelevated SarA expression in Staphylococcus aureus. Infection and immunity 67:1331–1337. PMID: 10024579
Cheung AL, Bayer AS, Zhang G, Gresham H, Xiong YQ. 2004. Regulation of virulence determinants in vitro andin vivo in Staphylococcus aureus. FEMS Immunology & Medical Microbiology 40:1–9. DOI: https://doi.org/10.1016/S0928-8244(03)00309-2, PMID: 14734180
Chong S, Chen C, Ge H, Xie XS. 2014. Mechanism of transcriptional bursting in bacteria. Cell 158:314–326.DOI: https://doi.org/10.1016/j.cell.2014.05.038, PMID: 25036631
Cramton SE, Ulrich M, Gotz F, Doring G. 2001. Anaerobic conditions induce expression of polysaccharideintercellular adhesin in Staphylococcus aureus and Staphylococcus epidermidis. Infection and Immunity 69:4079–4085. DOI: https://doi.org/10.1128/IAI.69.6.4079-4085.2001, PMID: 11349079
Cue D, Junecko JM, Lei MG, Blevins JS, Smeltzer MS, Lee CY. 2015. SaeRS-dependent inhibition of biofilmformation in Staphylococcus aureus Newman. PLoS One 10:e0123027. DOI: https://doi.org/10.1371/journal.pone.0123027, PMID: 25853849
Darwin C. 1859. The Origin of the Species. London: John Murray.Dublanche Y, Michalodimitrakis K, Kummerer N, Foglierini M, Serrano L. 2006. Noise in transcription negativefeedback loops: simulation and experimental analysis. Molecular Systems Biology 2:41. DOI: https://doi.org/10.1038/msb4100081, PMID: 16883354
Dufrene YF. 2014. Atomic force microscopy in microbiology: new structural and functional insights into themicrobial cell surface. mBio 5:e01363-14. DOI: https://doi.org/10.1128/mBio.01363-14, PMID: 25053785
Duthie ES, Lorenz LL. 1952. Staphylococcal coagulase; mode of action and antigenicity. Microbiology 6:95–107.DOI: https://doi.org/10.1099/00221287-6-1-2-95, PMID: 14927856
Elin RJ. 2010. Assessment of magnesium status for diagnosis and therapy. Magnesium research 23:S194–198.DOI: https://doi.org/10.1684/mrh.2010.0213, PMID: 20736141
Fischer J, Lee JC, Peters G, Kahl BC. 2014. Acapsular clinical Staphylococcus aureus isolates lack agr function.Clinical Microbiology and Infection 20:O414–O417. DOI: https://doi.org/10.1111/1469-0691.12429,PMID: 24224619
Flores-Mireles AL, Walker JN, Caparon M, Hultgren SJ. 2015. Urinary tract infections: epidemiology,mechanisms of infection and treatment options. Nature Reviews Microbiology 13:269–284. DOI: https://doi.org/10.1038/nrmicro3432, PMID: 25853778
Formosa-Dague C, Speziale P, Foster TJ, Geoghegan JA, Dufrene YF. 2016. Zinc-dependent mechanicalproperties of Staphylococcus aureus biofilm-forming surface protein SasG. PNAS 113:410–415. DOI: https://doi.org/10.1073/pnas.1519265113, PMID: 26715750
Fowler VG, Sakoulas G, McIntyre LM, Meka VG, Arbeit RD, Cabell CH, Stryjewski ME, Eliopoulos GM, Reller LB,Corey GR, Jones T, Lucindo N, Yeaman MR, Bayer AS. 2004. Persistent bacteremia due to methicillin-resistantStaphylococcus aureus infection is associated with agr dysfunction and low-level in vitro resistance to thrombin-induced platelet microbicidal protein. The Journal of Infectious Diseases 190:1140–1149. DOI: https://doi.org/10.1086/423145, PMID: 15319865
Gavet O, Pines J. 2010. Progressive activation of CyclinB1-Cdk1 coordinates entry to mitosis. DevelopmentalCell 18:533–543. DOI: https://doi.org/10.1016/j.devcel.2010.02.013, PMID: 20412769
Geiger T, Kastle B, Gratani FL, Goerke C, Wolz C. 2014. Two small (p)ppGpp synthases in Staphylococcus aureusmediate tolerance against cell envelope stress conditions. Journal of Bacteriology 196:894–902. DOI: https://doi.org/10.1128/JB.01201-13, PMID: 24336937
Geiger T, Wolz C. 2014. Intersection of the stringent response and the CodY regulon in low GC Gram-positivebacteria. International Journal of Medical Microbiology 304:150–155. DOI: https://doi.org/10.1016/j.ijmm.2013.11.013, PMID: 24462007
Garcıa-Betancur et al. eLife 2017;6:e28023. DOI: https://doi.org/10.7554/eLife.28023 34 of 39
Research article Microbiology and Infectious Disease

George SE, Nguyen T, Geiger T, Weidenmaier C, Lee JC, Liese J, Wolz C. 2015. Phenotypic heterogeneity andtemporal expression of the capsular polysaccharide in Staphylococcus aureus. Molecular Microbiology 98:1073–1088. DOI: https://doi.org/10.1111/mmi.13174, PMID: 26303846
Gertz S, Engelmann S, Schmid R, Ziebandt AK, Tischer K, Scharf C, Hacker J, Hecker M. 2000. Characterizationof the sigma(B) regulon in Staphylococcus aureus. Journal of Bacteriology 182:6983–6991. DOI: https://doi.org/10.1128/JB.182.24.6983-6991.2000, PMID: 11092859
Giachino P, Engelmann S, Bischoff M, . 2001. Sigma(B) activity depends on RsbU in Staphylococcus aureus.Journal of Bacteriology 183:1843–1852. DOI: https://doi.org/10.1128/JB.183.6.1843-1852.2001, PMID: 11222581
Goerke C, Wolz C. 2010. Adaptation of Staphylococcus aureus to the cystic fibrosis lung. International Journal ofMedical Microbiology 300:520–525. DOI: https://doi.org/10.1016/j.ijmm.2010.08.003, PMID: 20843740
Golding I, Paulsson J, Zawilski SM, Cox EC. 2005. Real-time kinetics of gene activity in individual bacteria. Cell123:1025–1036. DOI: https://doi.org/10.1016/j.cell.2005.09.031, PMID: 16360033
Goni-Moreno A, Amos M. 2012. Continuous computation in engineered gene circuits. Biosystems 109:52–56.DOI: https://doi.org/10.1016/j.biosystems.2012.02.001, PMID: 22387968
Goni-Moreno A, Carcajona M, Kim J, Martınez-Garcıa E, Amos M, de Lorenzo V. 2016. An implementation-focused bio/algorithmic workflow for synthetic biology. ACS Synthetic Biology 5:1127–1135. DOI: https://doi.org/10.1021/acssynbio.6b00029, PMID: 27454551
Gross M, Cramton SE, Gotz F, Peschel A. 2001. Key role of teichoic acid net charge in Staphylococcus aureuscolonization of artificial surfaces. Infection and Immunity 69:3423–3426. DOI: https://doi.org/10.1128/IAI.69.5.3423-3426.2001, PMID: 11292767
Grundmeier M, Tuchscherr L, Bruck M, Viemann D, Roth J, Willscher E, Becker K, Peters G, Loffler B. 2010.Staphylococcal strains vary greatly in their ability to induce an inflammatory response in endothelial cells. TheJournal of Infectious Diseases 201:871–880. DOI: https://doi.org/10.1086/651023, PMID: 20132035
Gustafsson E, Nilsson P, Karlsson S, Arvidson S. 2004. Characterizing the dynamics of the quorum-sensingsystem in Staphylococcus aureus. Journal of Molecular Microbiology and Biotechnology 8:232–242.DOI: https://doi.org/10.1159/000086704, PMID: 16179800
Gunther T. 2011. Magnesium in bone and the magnesium load test. Magnesium Research 24:223–224.DOI: https://doi.org/10.1684/mrh.2011.0297, PMID: 22192898
Hardwood CR, Cutting SM. 1990. Molecular Biological Methods for Bacillus. New York: Wiley.Heckels JE, Lambert PA, Baddiley J. 1977. Binding of magnesium ions to cell walls of Bacillus subtilis W23containing teichoic acid or teichuronic acid. Biochemical Journal 16265:359–365. DOI: https://doi.org/10.1042/bj1620359, PMID: 15560
Hense BA, Muller J, Kuttler C, Hartmann A. 2012. Spatial heterogeneity of autoinducer regulation systems.Sensors 12:4156–4171. DOI: https://doi.org/10.3390/s120404156, PMID: 22666024
Heptinstall S, Archibald AR, Baddiley J. 1970. Teichoic acids and membrane function in bacteria. Nature 225:519–521. DOI: https://doi.org/10.1038/225519a0, PMID: 5411858
Hirschhausen N, Block D, Bianconi I, Bragonzi A, Birtel J, Lee JC, Dubbers A, Kuster P, Kahl J, Peters G, Kahl BC.2013. Extended Staphylococcus aureus persistence in cystic fibrosis is associated with bacterial adaptation.International Journal of Medical Microbiology 303:685–692. DOI: https://doi.org/10.1016/j.ijmm.2013.09.012,PMID: 24183484
Hughes AH, Stow M, Hancock IC, Baddiley J. 1971. Function of teichoic acids and effect of novobiocin oncontrol of Mg2+ at the bacterial membrane. Nature New Biology 229:53–55. DOI: https://doi.org/10.1038/newbio229053a0, PMID: 5276074
Idelevich EA, Kreis C, Loffler B, Peters G. 2016. Staphylococcus aureus-Associated Musculoskeletal Infections.Current topics in microbiology and immunology. DOI: https://doi.org/10.1007/82_2016_19, PMID: 27380269
Jahnen-Dechent W, Ketteler M. 2012. Magnesium basics. Clinical Kidney Journal 5:i3–i14. DOI: https://doi.org/10.1093/ndtplus/sfr163, PMID: 26069819
Kahl BC, Becker K, Loffler B. 2016. Clinical significance and pathogenesis of staphylococcal small colony variantsin persistent infections. Clinical Microbiology Reviews 29:401–427. DOI: https://doi.org/10.1128/CMR.00069-15, PMID: 26960941
Kawasaki K, Mochizuki A, Matsushita M, Umeda T, Shigesada N. 1997. Modeling spatio-temporal patternsgenerated by Bacillus subtilis. Journal of Theoretical Biology 188:177–185. DOI: https://doi.org/10.1006/jtbi.1997.0462, PMID: 9379672
Klevens RM, Morrison MA, Nadle J, Petit S, Gershman K, Ray S, Harrison LH, Lynfield R, Dumyati G, Townes JM,Craig AS, Zell ER, Fosheim GE, McDougal LK, Carey RB, Fridkin SK, Active Bacterial Core surveillance (ABCs)MRSA Investigators. 2007. Invasive methicillin-resistant Staphylococcus aureus infections in the United States.JAMA 298:1763–1771. DOI: https://doi.org/10.1001/jama.298.15.1763, PMID: 17940231
Klijn A, Moine D, Delley M, Mercenier A, Arigoni F, Pridmore RD. 2006. Construction of a reporter vector for theanalysis of Bifidobacterium longum promoters. Applied and Environmental Microbiology 72:7401–7405.DOI: https://doi.org/10.1128/AEM.01611-06, PMID: 16997985
Koch G, Yepes A, Forstner KU, Wermser C, Stengel ST, Modamio J, Ohlsen K, Foster KR, Lopez D. 2014.Evolution of resistance to a last-resort antibiotic in Staphylococcus aureus via bacterial competition. Cell 158:1060–1071. DOI: https://doi.org/10.1016/j.cell.2014.06.046, PMID: 25171407
Koenig RL, Ray JL, Maleki SJ, Smeltzer MS, Hurlburt BK. 2004. Staphylococcus aureus AgrA binding to theRNAIII-agr regulatory region. Journal of Bacteriology 186:7549–7555. DOI: https://doi.org/10.1128/JB.186.22.7549-7555.2004, PMID: 15516566
Garcıa-Betancur et al. eLife 2017;6:e28023. DOI: https://doi.org/10.7554/eLife.28023 35 of 39
Research article Microbiology and Infectious Disease

Kornblum J, Kreiswirth B, Projan SJ, Ross H, Novick RP. 1990. Agr: a polycistronic locus regulating exoproteinsynthesis in Staphylococcus aureus. In: Novick R. P (Ed). Molecular Biology of the Staphylococci. New York:VCH Publishers.
Kullik I, Giachino P, Fuchs T. 1998. Deletion of the alternative sigma factor sigmaB in Staphylococcus aureusreveals its function as a global regulator of virulence genes. Journal of bacteriology 180:4814–4820. PMID:9733682
Kastle B, Geiger T, Gratani FL, Reisinger R, Goerke C, Borisova M, Mayer C, Wolz C. 2015. rRNA regulationduring growth and under stringent conditions in Staphylococcus aureus. Environmental Microbiology 17:4394–4405. DOI: https://doi.org/10.1111/1462-2920.12867, PMID: 25845735
Lambert PA, Hancock IC, Baddiley J. 1975a. The interaction of magnesium ions with teichoic acid. BiochemicalJournal 149:519–524. DOI: https://doi.org/10.1042/bj1490519, PMID: 994
Lambert PA, Hancock IC, Baddiley J. 1975b. Influence of alanyl ester residues on the binding of magnesium ionsto teichoic acids. Biochemical Journal 151:671–676. DOI: https://doi.org/10.1042/bj1510671, PMID: 1218094
Lewis K, cells P. 2007. dormancy and infectious disease. Nature reviews. Microbiology 5:48–56.Lewis K. 2008. Multidrug tolerance of biofilms and persister cells. Current topics in microbiology andimmunology 322:107–131. PMID: 18453274
Li M, Diep BA, Villaruz AE, Braughton KR, Jiang X, DeLeo FR, Chambers HF, Lu Y, Otto M. 2009a. Evolution ofvirulence in epidemic community-associated methicillin-resistant Staphylococcus aureus. PNAS 106:5883–5888.DOI: https://doi.org/10.1073/pnas.0900743106, PMID: 19293374
Li H, Handsaker B, Wysoker A, Fennell T, Ruan J, Homer N, Marth G, Abecasis G, Durbin R, 1000 GenomeProject Data Processing Subgroup. 2009b. The Sequence Alignment/Map format and SAMtools. Bioinformatics25:2078–2079. DOI: https://doi.org/10.1093/bioinformatics/btp352, PMID: 19505943
Li H. 2011. A statistical framework for SNP calling, mutation discovery, association mapping and populationgenetical parameter estimation from sequencing data. Bioinformatics 27:2987–2993. DOI: https://doi.org/10.1093/bioinformatics/btr509, PMID: 21903627
Lopez D, Vlamakis H, Biofilms KR. 2010. Cold Spring Harbor perspectives in biology 2:a000398.Lopez D, Fischbach MA, Chu F, Losick R, Kolter R. 2009. Structurally diverse natural products that causepotassium leakage trigger multicellularity in Bacillus subtilis. PNAS 106:280–285. DOI: https://doi.org/10.1073/pnas.0810940106, PMID: 19114652
Lopez D, Kolter R. 2010. Extracellular signals that define distinct and coexisting cell fates in Bacillus subtilis. FEMSMicrobiology Reviews 34:134–149. DOI: https://doi.org/10.1111/j.1574-6976.2009.00199.x, PMID: 20030732
MDowell P, Affas Z, Reynolds C, Holden MT, Wood SJ, Saint S, Cockayne A, Hill PJ, Dodd CE, Bycroft BW, ChanWC, Williams P. 2001. Structure, activity and evolution of the group I thiolactone peptide quorum-sensingsystem of Staphylococcus aureus. Molecular microbiology 41:503–512. PMID: 11489134
Maamar H, Dubnau D. 2005. Bistability in the Bacillus subtilis K-state (competence) system requires a positivefeedback loop. Molecular Microbiology 56:615–624. DOI: https://doi.org/10.1111/j.1365-2958.2005.04592.x,PMID: 15819619
Marincola G, Schafer T, Behler J, Bernhardt J, Ohlsen K, Goerke C, Wolz C. 2012. RNase Y of Staphylococcusaureus and its role in the activation of virulence genes. Molecular Microbiology 85:817–832. DOI: https://doi.org/10.1111/j.1365-2958.2012.08144.x, PMID: 22780584
Matsushita M, Wakita J, Itoh H, Watanabe K, Arai T, Matsuyama T, Sakaguchi H, Mimura M. 1999. Formation ofcolony patterns by a bacterial cell population. Physica A: Statistical Mechanics and its Applications 274:190–199. DOI: https://doi.org/10.1016/S0378-4371(99)00328-3
McAdow M, Kim HK, Dedent AC, Hendrickx AP, Schneewind O, Missiakas DM. 2011. Preventing Staphylococcusaureus sepsis through the inhibition of its agglutination in blood. PLoS Pathogens 7:e1002307. DOI: https://doi.org/10.1371/journal.ppat.1002307, PMID: 22028651
McCloy RA, Rogers S, Caldon CE, Lorca T, Castro A, Burgess A. 2014. Partial inhibition of Cdk1 in G 2 phaseoverrides the SAC and decouples mitotic events. Cell Cycle 13:1400–1412. DOI: https://doi.org/10.4161/cc.28401, PMID: 24626186
Mitchell G, Fugere A, Pepin Gaudreau K, Brouillette E, Frost EH, Cantin AM, Malouin F. 2013. SigB is a dominantregulator of virulence in Staphylococcus aureus small-colony variants. PLoS One 8:e65018. DOI: https://doi.org/10.1371/journal.pone.0065018, PMID: 23705029
Monod J. 1949. The growth of bacterial cultures. Annual Review of Microbiology 3:371–394. DOI: https://doi.org/10.1146/annurev.mi.03.100149.002103
Morikawa K, Maruyama A, Inose Y, Higashide M, Hayashi H, Ohta T. 2001. Overexpression of sigma factor,sigma(B), urges Staphylococcus aureus to thicken the cell wall and to resist beta-lactams. Biochemical andBiophysical Research Communications 288:385–389. DOI: https://doi.org/10.1006/bbrc.2001.5774,PMID: 11606054
Moxon ER, Rainey PB, Nowak MA, Lenski RE. 1994. Adaptive evolution of highly mutable loci in pathogenicbacteria. Current Biology 4:24–33. DOI: https://doi.org/10.1016/S0960-9822(00)00005-1, PMID: 7922307
Muder RR, Brennen C, Rihs JD, Wagener MM, Obman A, Stout JE, Yu VL. 2006. Isolation of Staphylococcusaureus from the urinary tract: association of isolation with symptomatic urinary tract infection and subsequentstaphylococcal bacteremia. Clinical Infectious Diseases 42:46–50. DOI: https://doi.org/10.1086/498518,PMID: 16323090
Murray JD. 2002. Mathematical Biology, an introduction. In: Interdisciplinary Applied Mathematics. Vol. 17 3rdEdn. Springer.
Garcıa-Betancur et al. eLife 2017;6:e28023. DOI: https://doi.org/10.7554/eLife.28023 36 of 39
Research article Microbiology and Infectious Disease

Muller J, Kuttler C, Hense BA, Rothballer M, Hartmann A. 2006. Cell-cell communication by quorum sensing anddimension-reduction. Journal of Mathematical Biology 53:672–702. DOI: https://doi.org/10.1007/s00285-006-0024-z, PMID: 16897015
Munzenmayer L, Geiger T, Daiber E, Schulte B, Autenrieth SE, Fraunholz M, Wolz C. 2016. Influence of Sae-regulated and Agr-regulated factors on the escape of Staphylococcus aureus from human macrophages.Cellular Microbiology 18:1172–1183. DOI: https://doi.org/10.1111/cmi.12577, PMID: 26895738
Nadell CD, Xavier JB, Foster KR. 2009. The sociobiology of biofilms. FEMS Microbiology Reviews 33:206–224.DOI: https://doi.org/10.1111/j.1574-6976.2008.00150.x, PMID: 19067751
Nocadello S, Minasov G, Shuvalova LS, Dubrovska I, Sabini E, Anderson WF. 2016. Crystal Structures of theSpoIID Lytic Transglycosylases Essential for Bacterial Sporulation. Journal of Biological Chemistry 291:14915–14926. DOI: https://doi.org/10.1074/jbc.M116.729749, PMID: 27226615
Nunomura S, Gon Y, Yoshimaru T, Kashiwakura J, Kawakami T, Ra C. 2010. FcepsilonRI beta-chain ITAMamplifies PI3K-signaling to ensure synergistic degranulation response via FcepsilonRI and adenosine receptors.European Journal of Immunology 40:1205–1217. DOI: https://doi.org/10.1002/eji.200939651, PMID: 20101614
O’Toole GA, Kolter R. 1998a. Initiation of biofilm formation in Pseudomonas fluorescens WCS365 proceeds viamultiple, convergent signalling pathways: a genetic analysis. Molecular Microbiology 28:449–461. DOI: https://doi.org/10.1046/j.1365-2958.1998.00797.x, PMID: 9632250
O’Toole GA, Kolter R. 1998b. Flagellar and twitching motility are necessary for Pseudomonas aeruginosa biofilmdevelopment. Molecular Microbiology 30:295–304. DOI: https://doi.org/10.1046/j.1365-2958.1998.01062.x,PMID: 9791175
Otto M. 2012. MRSA virulence and spread. Cellular Microbiology 14:1513–1521. DOI: https://doi.org/10.1111/j.1462-5822.2012.01832.x, PMID: 22747834
Pane-Farre J, Jonas B, Forstner K, Engelmann S, Hecker M. 2006. The sigmaB regulon in Staphylococcus aureusand its regulation. International Journal of Medical Microbiology 296:237–258. DOI: https://doi.org/10.1016/j.ijmm.2005.11.011, PMID: 16644280
Parsek MR, Singh PK. 2003. Bacterial biofilms: an emerging link to disease pathogenesis. Annual Review ofMicrobiology 57:677–701. DOI: https://doi.org/10.1146/annurev.micro.57.030502.090720, PMID: 14527295
Parsonnet J, Modern PA, Giacobbe KD. 1996. Effect of tampon composition on production of toxic shocksyndrome toxin-1 by Staphylococcus aureus in vitro. The Journal of Infectious Diseases 173:98–103.DOI: https://doi.org/10.1093/infdis/173.1.98, PMID: 8537689
Pelz A, Wieland KP, Putzbach K, Hentschel P, Albert K, Gotz F. 2005. Structure and biosynthesis ofstaphyloxanthin from Staphylococcus aureus. Journal of Biological Chemistry 280:32493–32498. DOI: https://doi.org/10.1074/jbc.M505070200, PMID: 16020541
Peng HL, Novick RP, Kreiswirth B, Kornblum J, Schlievert P, Cloning SP. 1988. Cloning, characterization, andsequencing of an accessory gene regulator (agr) in Staphylococcus aureus. Journal of Bacteriology 170:4365–4372. DOI: https://doi.org/10.1128/jb.170.9.4365-4372.1988, PMID: 2457579
Perego M, Glaser P, Minutello A, Strauch MA, Leopold K, Fischer W. 1995. Incorporation of D-alanine intolipoteichoic acid and wall teichoic acid in Bacillus subtilis. Identification of genes and regulation. The Journal ofbiological chemistry 270:15598–15606. PMID: 7797557
Peschel A, Otto M. 2013. Phenol-soluble modulins and staphylococcal infection. Nature Reviews Microbiology11:667–673. DOI: https://doi.org/10.1038/nrmicro3110, PMID: 24018382
Peterson PK, Wilkinson BJ, Kim Y, Schmeling D, Douglas SD, Quie PG, Verhoef J. 1978. The key role ofpeptidoglycan in the opsonization of Staphylococcus aureus. Journal of Clinical Investigation 61:597–609.DOI: https://doi.org/10.1172/JCI108971, PMID: 641141
Potapova TA, Sivakumar S, Flynn JN, Li R, Gorbsky GJ. 2011. Mitotic progression becomes irreversible inprometaphase and collapses when Wee1 and Cdc25 are inhibited. Molecular Biology of the Cell 22:1191–1206.DOI: https://doi.org/10.1091/mbc.E10-07-0599, PMID: 21325631
Prabhakara R, Harro JM, Leid JG, Harris M, Shirtliff ME. 2011. Murine immune response to a chronicStaphylococcus aureus biofilm infection. Infection and Immunity 79:1789–1796. DOI: https://doi.org/10.1128/IAI.01386-10, PMID: 21282411
Queck SY, Jameson-Lee M, Villaruz AE, Bach TH, Khan BA, Sturdevant DE, Ricklefs SM, Li M, Otto M. 2008.RNAIII-independent target gene control by the agr quorum-sensing system: insight into the evolution ofvirulence regulation in Staphylococcus aureus. Molecular Cell 32:150–158. DOI: https://doi.org/10.1016/j.molcel.2008.08.005, PMID: 18851841
Recsei P, Kreiswirth B, O’Reilly M, Schlievert P, Gruss A, Novick RP. 1986. Regulation of exoprotein geneexpression in Staphylococcus aureus by agar. MGG Molecular & General Genetics 202:58–61. DOI: https://doi.org/10.1007/BF00330517, PMID: 3007938
Rosenberg E, Holmes M, Tenenholz T, Khalil AA, Valerie K. 2003. Preservation of fluorescent protein activity intumor tissue. BioTechniques 34:476–478. PMID: 12661154
Rudin L, Sjostrom JE, Lindberg M, Philipson L. 1974. Factors affecting competence for transformation inStaphylococcus aureus. Journal of bacteriology 118:155–164. PMID: 4274456
Saar-Dover R, Bitler A, Nezer R, Shmuel-Galia L, Firon A, Shimoni E, Trieu-Cuot P, Shai Y. 2012. D-alanylation oflipoteichoic acids confers resistance to cationic peptides in group B streptococcus by increasing the cell walldensity. PLoS Pathogens 8:e1002891. DOI: https://doi.org/10.1371/journal.ppat.1002891, PMID: 22969424
Savage VJ, Chopra I, O’Neill AJ. 2013. Population diversification in Staphylococcus aureus biofilms may promotedissemination and persistence. PLoS One 8:e62513. DOI: https://doi.org/10.1371/journal.pone.0062513,PMID: 23646129
Garcıa-Betancur et al. eLife 2017;6:e28023. DOI: https://doi.org/10.7554/eLife.28023 37 of 39
Research article Microbiology and Infectious Disease

Schlievert PM. 1985. Effect of magnesium on production of toxic-shock-syndrome toxin-1 by Staphylococcusaureus. Journal of Infectious Diseases 152:618–620. DOI: https://doi.org/10.1093/infdis/152.3.618,PMID: 4031559
Senn MM, Giachino P, Homerova D, Steinhuber A, Strassner J, Kormanec J, Fluckiger U, Berger-Bachi B, BischoffM. 2005. Molecular analysis and organization of the sigmaB operon in Staphylococcus aureus. Journal ofBacteriology 187:8006–8019. DOI: https://doi.org/10.1128/JB.187.23.8006-8019.2005, PMID: 16291674
Siebring J, Sorg R, Herber M, Kuipers O. 2012. 1 ed. Take it of leave it: Mechanisms underlying bacterial bistableregulatory networks. Caister Academic Press.
Sihto HM, Tasara T, Stephan R, Johler S. 2014. Validation of reference genes for normalization of qPCR mRNAexpression levels in Staphylococcus aureus exposed to osmotic and lactic acid stress conditions encounteredduring food production and preservation. FEMS Microbiology Letters 356:134–140. DOI: https://doi.org/10.1111/1574-6968.12491, PMID: 24893820
Smits WK, Eschevins CC, Susanna KA, Bron S, Kuipers OP, Hamoen LW. 2005. Stripping Bacillus: ComK auto-stimulation is responsible for the bistable response in competence development. Molecular Microbiology 56:604–614. DOI: https://doi.org/10.1111/j.1365-2958.2005.04488.x, PMID: 15819618
Stauff DL, Torres VJ, Skaar EP. 2007. Signaling and DNA-binding activities of the Staphylococcus aureus HssR-HssS two-component system required for heme sensing. Journal of Biological Chemistry 282:26111–26121.DOI: https://doi.org/10.1074/jbc.M703797200, PMID: 17635909
Swoboda JG, Meredith TC, Campbell J, Brown S, Suzuki T, Bollenbach T, Malhowski AJ, Kishony R, Gilmore MS,Walker S. 2009. Discovery of a small molecule that blocks wall teichoic acid biosynthesis in Staphylococcusaureus. ACS Chemical Biology 4:875–883. DOI: https://doi.org/10.1021/cb900151k, PMID: 19689117
Swoboda JG, Campbell J, Meredith TC, Walker S. 2010. Wall teichoic acid function, biosynthesis, and inhibition.ChemBioChem 11:35–45. DOI: https://doi.org/10.1002/cbic.200900557, PMID: 19899094
Thammavongsa V, Kern JW, Missiakas DM, Schneewind O. 2009. Staphylococcus aureus synthesizes adenosineto escape host immune responses. The Journal of Experimental Medicine 206:2417–2427. DOI: https://doi.org/10.1084/jem.20090097, PMID: 19808256
Thoendel M, Kavanaugh JS, Flack CE, Horswill AR. 2011. Peptide signaling in the staphylococci. ChemicalReviews 111:117–151. DOI: https://doi.org/10.1021/cr100370n, PMID: 21174435
Touhami A, Jericho MH, Beveridge TJ. 2004. Atomic force microscopy of cell growth and division inStaphylococcus aureus. Journal of Bacteriology 186:3286–3295. DOI: https://doi.org/10.1128/JB.186.11.3286-3295.2004, PMID: 15150213
Tuchscherr L, Heitmann V, Hussain M, Viemann D, Roth J, von Eiff C, Peters G, Becker K, Loffler B. 2010.Staphylococcus aureus small-colony variants are adapted phenotypes for intracellular persistence. The Journalof Infectious Diseases 202:1031–1040. DOI: https://doi.org/10.1086/656047, PMID: 20715929
Tuchscherr L, Bischoff M, Lattar SM, Noto Llana M, Pfortner H, Niemann S, Geraci J, Van de Vyver H, FraunholzMJ, Cheung AL, Herrmann M, Volker U, Sordelli DO, Peters G, Loffler B. 2015. Sigma Factor SigB Is Crucial toMediate Staphylococcus aureus Adaptation during Chronic Infections. PLOS Pathogens 11:e1004870.DOI: https://doi.org/10.1371/journal.ppat.1004870, PMID: 25923704
Tuchscherr L, Loffler B. 2016. Staphylococcus aureus dynamically adapts global regulators and virulence factorexpression in the course from acute to chronic infection. Current Genetics 62:15–17. DOI: https://doi.org/10.1007/s00294-015-0503-0, PMID: 26123224
Veening JW, Hamoen LW, Kuipers OP. 2005. Phosphatases modulate the bistable sporulation gene expressionpattern in Bacillus subtilis. Molecular Microbiology 56:1481–1494. DOI: https://doi.org/10.1111/j.1365-2958.2005.04659.x, PMID: 15916600
Veening JW, Stewart EJ, Berngruber TW, Taddei F, Kuipers OP, Hamoen LW. 2008. Bet-hedging and epigeneticinheritance in bacterial cell development. PNAS 105:4393–4398. DOI: https://doi.org/10.1073/pnas.0700463105, PMID: 18326026
Vergara-Irigaray M, Maira-Litran T, Merino N, Pier GB, Penades JR, Lasa I. 2008. Wall teichoic acids aredispensable for anchoring the PNAG exopolysaccharide to the Staphylococcus aureus cell surface.Microbiology 154:865–877. DOI: https://doi.org/10.1099/mic.0.2007/013292-0, PMID: 18310032
Weidenmaier C, Kokai-Kun JF, Kristian SA, Chanturiya T, Kalbacher H, Gross M, Nicholson G, Neumeister B,Mond JJ, Peschel A. 2004. Role of teichoic acids in Staphylococcus aureus nasal colonization, a major risk factorin nosocomial infections. Nature Medicine 10:243–245. DOI: https://doi.org/10.1038/nm991, PMID: 14758355
Weidenmaier C, Peschel A, Xiong YQ, Kristian SA, Dietz K, Yeaman MR, Bayer AS. 2005a. Lack of wall teichoicacids in Staphylococcus aureus leads to reduced interactions with endothelial cells and to attenuated virulencein a rabbit model of endocarditis. The Journal of Infectious Diseases 191:1771–1777. DOI: https://doi.org/10.1086/429692, PMID: 15838806
Weidenmaier C, Peschel A, Kempf VA, Lucindo N, Yeaman MR, Bayer AS. 2005b. DltABCD- and MprF-mediatedcell envelope modifications of Staphylococcus aureus confer resistance to platelet microbicidal proteins andcontribute to virulence in a rabbit endocarditis model. Infection and Immunity 73:8033–8038. DOI: https://doi.org/10.1128/IAI.73.12.8033-8038.2005, PMID: 16299297
Yarwood JM, Paquette KM, Tikh IB, Volper EM, Greenberg EP. 2007. Generation of virulence factor variants inStaphylococcus aureus biofilms. Journal of Bacteriology 189:7961–7967. DOI: https://doi.org/10.1128/JB.00789-07, PMID: 17675387
Yepes A, Koch G, Waldvogel A, Garcia-Betancur JC, Lopez D. 2014. Reconstruction of mreB expression inStaphylococcus aureus via a collection of new integrative plasmids. Applied and Environmental Microbiology80:3868–3878. DOI: https://doi.org/10.1128/AEM.00759-14, PMID: 24747904
Garcıa-Betancur et al. eLife 2017;6:e28023. DOI: https://doi.org/10.7554/eLife.28023 38 of 39
Research article Microbiology and Infectious Disease

Zhang F, Kwan A, Xu A, Suel GM. 2015. A Synthetic Quorum Sensing System Reveals a Potential Private Benefitfor Public Good Production in a Biofilm. PLoS One 10:e0132948. DOI: https://doi.org/10.1371/journal.pone.0132948, PMID: 26196509
Zhou R, Chen S, Recsei P. 1988. A dye release assay for determination of lysostaphin activity. AnalyticalBiochemistry 171:141–144. DOI: https://doi.org/10.1016/0003-2697(88)90134-0, PMID: 3407910
Garcıa-Betancur et al. eLife 2017;6:e28023. DOI: https://doi.org/10.7554/eLife.28023 39 of 39
Research article Microbiology and Infectious Disease