Embed Size (px)
Citation preview
Cell Metabolism
Resource
Circadian Clocks and Feeding Time Regulate theOscillations and Levels of Hepatic TriglyceridesYaarit Adamovich,1 Liat Rousso-Noori,1 Ziv Zwighaft,1 Adi Neufeld-Cohen,1 Marina Golik,1 Judith Kraut-Cohen,1
Miao Wang,2 Xianlin Han,2 and Gad Asher1,*1Department of Biological Chemistry, Weizmann Institute of Science, Rehovot 76100, Israel2Diabetes and Obesity Research Center, Sanford-Burnham Medical Research Institute, Orlando, FL 32827, USA*Correspondence: [email protected]
http://dx.doi.org/10.1016/j.cmet.2013.12.016
SUMMARY
Circadian clocks play a major role in orchestratingdaily physiology, and their disruption can evokemetabolic diseases such as fatty liver and obesity.To study the role of circadian clocks in lipid homeo-stasis, we performed an extensive lipidomic analysisof liver tissues from wild-type and clock-disruptedmice either fed ad libitum or night fed. To our sur-prise, a similar fraction of lipids (�17%) oscillatedin both mouse strains, most notably triglycerides,but with completely different phases. Moreover,several master lipid regulators (e.g., PPARa) and en-zymes involved in triglyceride metabolism retainedtheir circadian expression in clock-disrupted mice.Nighttime restricted feeding shifted the phase of tri-glyceride accumulation and resulted in �50%decrease in hepatic triglyceride levels in wild-typemice. Our findings suggest that circadian clocksand feeding time dictate the phase and levels of he-patic triglyceride accumulation; however, oscilla-tions in triglycerides can persist in the absence of afunctional clock.
INTRODUCTION
Circadian clocks play a principal role in coordinating our daily
physiology and metabolism. Animal studies and epidemiological
evidence suggest that disturbance of circadian rhythms through
environmental and genetic effects can lead to metabolic dis-
eases such as hyperlipidemia, fatty liver, and obesity (Asher
and Schibler, 2011; Bass, 2012; Froy, 2010; Green et al.,
2008). These observations highlight the central role of circadian
regulation in lipid homeostasis. Dyslipidemia and obesity are
associated with high morbidity and mortality rates, hence eluci-
dating the mechanisms involved in temporal regulation of lipids
is of great interest.
The mammalian circadian clock is comprised of a master
pacemaker, located in the brain, that synchronizes subsidiary
peripheral oscillators, present in virtually all cells of the body.
The master clock is entrained by daily light/dark cycles,
whereas feeding time appears to be the dominant timing
cue (Zeitgeber) for peripheral clocks. Both the master and
Cell M
peripheral clocks tick in a self-sustained and cell-autonomous
fashion. The currently held molecular model for the generation
of circadian rhythms is based on interlocked negative tran-
scription feedback loops that drive daily oscillations of core
clock and clock-controlled genes (Brown et al., 2012; Dibner
et al., 2010; Feng and Lazar, 2012). Briefly, BMAL1/CLOCK
drives the expression of Period (i.e., Per1, Per2, and Per3)
and Cryptochrome (i.e., Cry1 and Cry2) genes. In turn, PER
and CRY proteins accumulate and repress the transcrip-
tion of their own genes. An additional essential feedback
loop involves the orphan nuclear receptors of the REV-ERB
and ROR families. BMAL1 activates Rev-erb transcription,
which in turn suppresses Bmal1 expression (Bugge
et al., 2012; Cho et al., 2012; Preitner et al., 2002; Solt et al.,
2012).
Extensive transcriptome profiling performed throughout the
day in liver and additional peripheral organs has demonstrated
the pervasive circadian control of physiology and metabolism
(Akhtar et al., 2002; McCarthy et al., 2007; Panda et al., 2002;
Storch et al., 2002; Vollmers et al., 2009). These studies have
revealed that a substantial fraction (�10%) of all liver mRNAs
are expressed in a rhythmic fashion; many of them play a role
in metabolic processes, including cholesterol and lipid meta-
bolism. Several enzymes participating in lipid biosynthesis and
catabolism are expressed in a daily manner (e.g., cytochrome
P450s, HMGCoA reductase, and lipin) (Panda et al., 2002).
Additional studies have shown diurnal regulation of triglyceride
and cholesterol levels in plasma (Hussain and Pan, 2009).
Consequently, various genetic mouse models for disrupted
clock exhibit impaired lipid metabolism. Clock mutant and
Bmal1 knockout mice develop hyperlipidemia and hepatic stea-
tosis (Shimba et al., 2011; Turek et al., 2005). PER2-deficient
mice display altered lipid metabolism (Grimaldi et al., 2010),
and ablation of REV-ERBs can lead to hepatic steatosis (Bugge
et al., 2012).
Hitherto, circadian research in mammals has largely been
focused on dissecting transcription expression profiles of
core clock and output genes including genes involved in meta-
bolism and cellular homeostasis. Though these gene expres-
sion profiles have hinted that many metabolic pathways and
their products are oscillating during the day, direct measure-
ments of metabolites throughout the day are still in their
infancy. Ueda and colleagues have quantified the spectra of
hundreds of metabolites throughout the day, both in mouse
and human plasma samples (Kasukawa et al., 2012; Minami
et al., 2009). They successfully established a metabolite
etabolism 19, 319–330, February 4, 2014 ª2014 Elsevier Inc. 319
A C D
EB
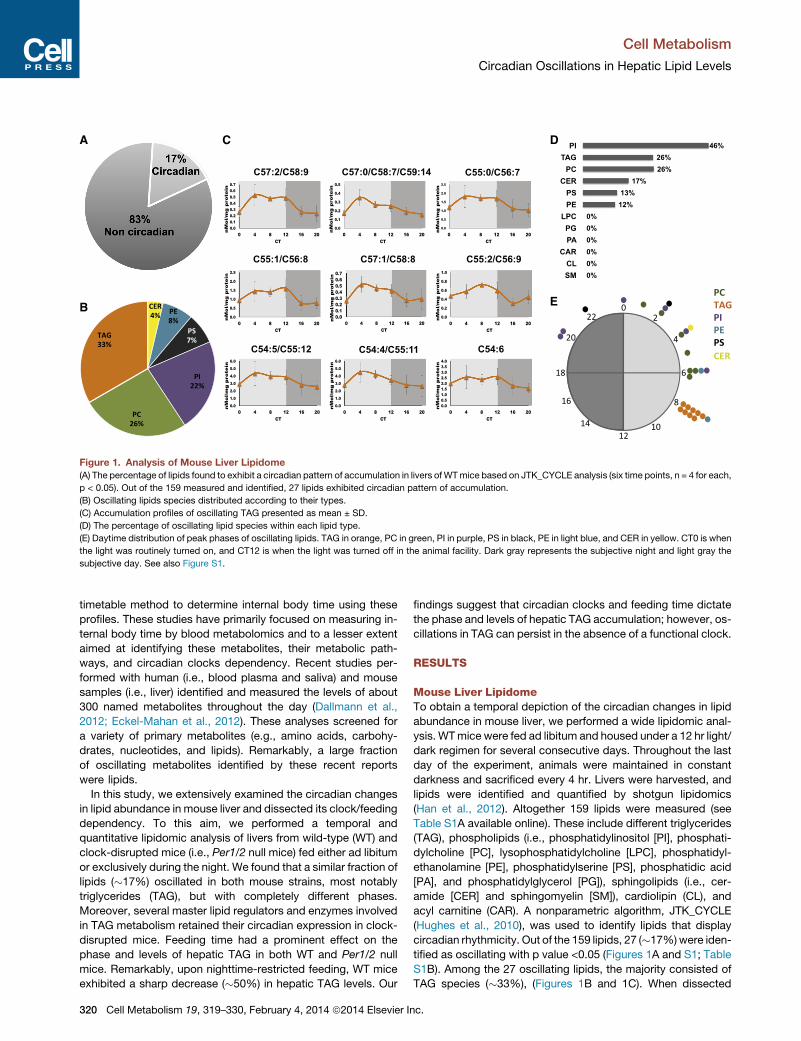
Figure 1. Analysis of Mouse Liver Lipidome
(A) The percentage of lipids found to exhibit a circadian pattern of accumulation in livers ofWTmice based on JTK_CYCLE analysis (six time points, n = 4 for each,
p < 0.05). Out of the 159 measured and identified, 27 lipids exhibited circadian pattern of accumulation.
(B) Oscillating lipids species distributed according to their types.
(C) Accumulation profiles of oscillating TAG presented as mean ± SD.
(D) The percentage of oscillating lipid species within each lipid type.
(E) Daytime distribution of peak phases of oscillating lipids. TAG in orange, PC in green, PI in purple, PS in black, PE in light blue, and CER in yellow. CT0 is when
the light was routinely turned on, and CT12 is when the light was turned off in the animal facility. Dark gray represents the subjective night and light gray the
subjective day. See also Figure S1.
Cell Metabolism
Circadian Oscillations in Hepatic Lipid Levels
timetable method to determine internal body time using these
profiles. These studies have primarily focused on measuring in-
ternal body time by blood metabolomics and to a lesser extent
aimed at identifying these metabolites, their metabolic path-
ways, and circadian clocks dependency. Recent studies per-
formed with human (i.e., blood plasma and saliva) and mouse
samples (i.e., liver) identified and measured the levels of about
300 named metabolites throughout the day (Dallmann et al.,
2012; Eckel-Mahan et al., 2012). These analyses screened for
a variety of primary metabolites (e.g., amino acids, carbohy-
drates, nucleotides, and lipids). Remarkably, a large fraction
of oscillating metabolites identified by these recent reports
were lipids.
In this study, we extensively examined the circadian changes
in lipid abundance in mouse liver and dissected its clock/feeding
dependency. To this aim, we performed a temporal and
quantitative lipidomic analysis of livers from wild-type (WT) and
clock-disrupted mice (i.e., Per1/2 null mice) fed either ad libitum
or exclusively during the night. We found that a similar fraction of
lipids (�17%) oscillated in both mouse strains, most notably
triglycerides (TAG), but with completely different phases.
Moreover, several master lipid regulators and enzymes involved
in TAG metabolism retained their circadian expression in clock-
disrupted mice. Feeding time had a prominent effect on the
phase and levels of hepatic TAG in both WT and Per1/2 null
mice. Remarkably, upon nighttime-restricted feeding, WT mice
exhibited a sharp decrease (�50%) in hepatic TAG levels. Our
320 Cell Metabolism 19, 319–330, February 4, 2014 ª2014 Elsevier In
findings suggest that circadian clocks and feeding time dictate
the phase and levels of hepatic TAG accumulation; however, os-
cillations in TAG can persist in the absence of a functional clock.
RESULTS
Mouse Liver LipidomeTo obtain a temporal depiction of the circadian changes in lipid
abundance in mouse liver, we performed a wide lipidomic anal-
ysis. WTmice were fed ad libitum and housed under a 12 hr light/
dark regimen for several consecutive days. Throughout the last
day of the experiment, animals were maintained in constant
darkness and sacrificed every 4 hr. Livers were harvested, and
lipids were identified and quantified by shotgun lipidomics
(Han et al., 2012). Altogether 159 lipids were measured (see
Table S1A available online). These include different triglycerides
(TAG), phospholipids (i.e., phosphatidylinositol [PI], phosphati-
dylcholine [PC], lysophosphatidylcholine [LPC], phosphatidyl-
ethanolamine [PE], phosphatidylserine [PS], phosphatidic acid
[PA], and phosphatidylglycerol [PG]), sphingolipids (i.e., cer-
amide [CER] and sphingomyelin [SM]), cardiolipin (CL), and
acyl carnitine (CAR). A nonparametric algorithm, JTK_CYCLE
(Hughes et al., 2010), was used to identify lipids that display
circadian rhythmicity. Out of the 159 lipids, 27 (�17%)were iden-
tified as oscillating with p value <0.05 (Figures 1A and S1; Table
S1B). Among the 27 oscillating lipids, the majority consisted of
TAG species (�33%), (Figures 1B and 1C). When dissected
c.
Cell Metabolism
Circadian Oscillations in Hepatic Lipid Levels
based on their types, it appeared that oscillating lipid species
were highly abundant among PI (46%) and enriched among
TAG (26%) and PC (26%) (Figure 1D). Analysis of the phase dis-
tribution of the different oscillating lipids revealed that the vast
majority of them peaked during the subjective light phase.
Namely, 23 out of the 27 reached their zenith levels between
circadian time (CT) 1 and CT8 (Figure 1E). Hence, we concluded
that oscillating lipids mostly consist of TAG species and are pre-
dominantly temporally gated to reach their zenith levels during
the subjective light phase.
Circadian Expression of Enzymes Participating inHepatic TAG MetabolismHepatocytes harbor the ability to synthesize, store, and catabo-
lize TAG. A prominent fraction (i.e., 33%) of oscillating lipids con-
sisted of TAG species (Figure 1B). Strikingly, all oscillating TAG
peaked around CT8 and dipped around CT20 with amplitude
of about 2-fold (Figures 1C and 1E), suggesting that their accu-
mulation in the liver is temporally controlled. To corroborate
these findings, we examined the circadian expression profile of
multiple enzymes that participate in TAG metabolism in WT
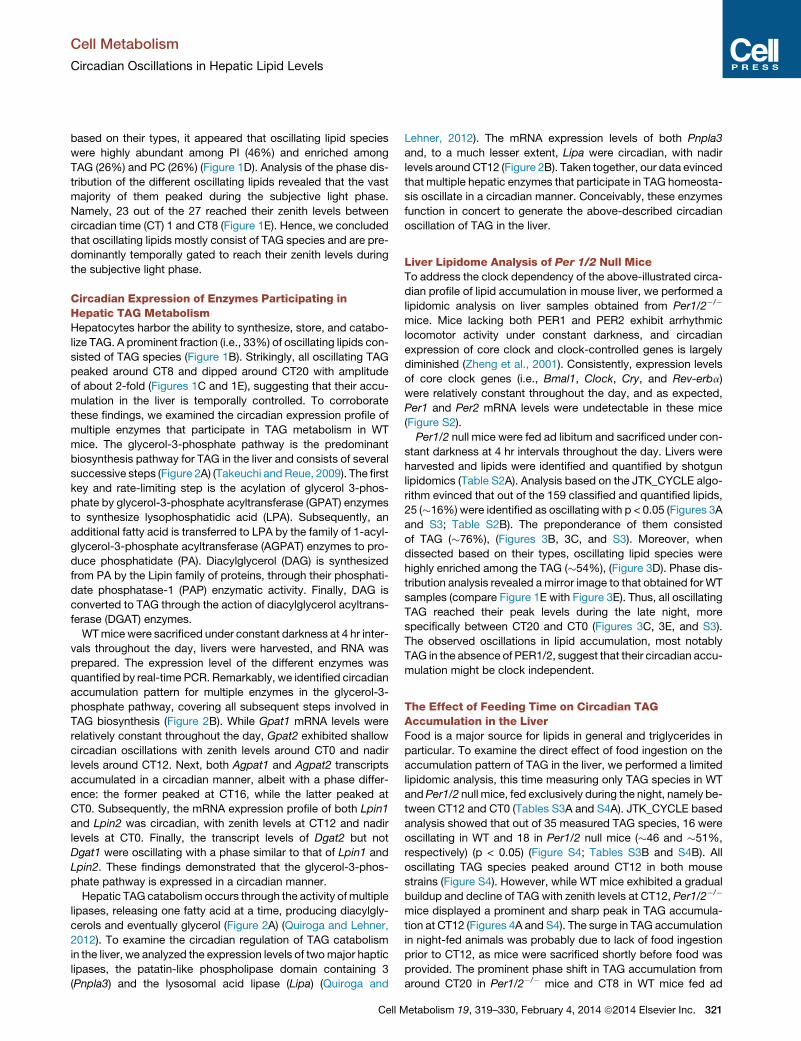
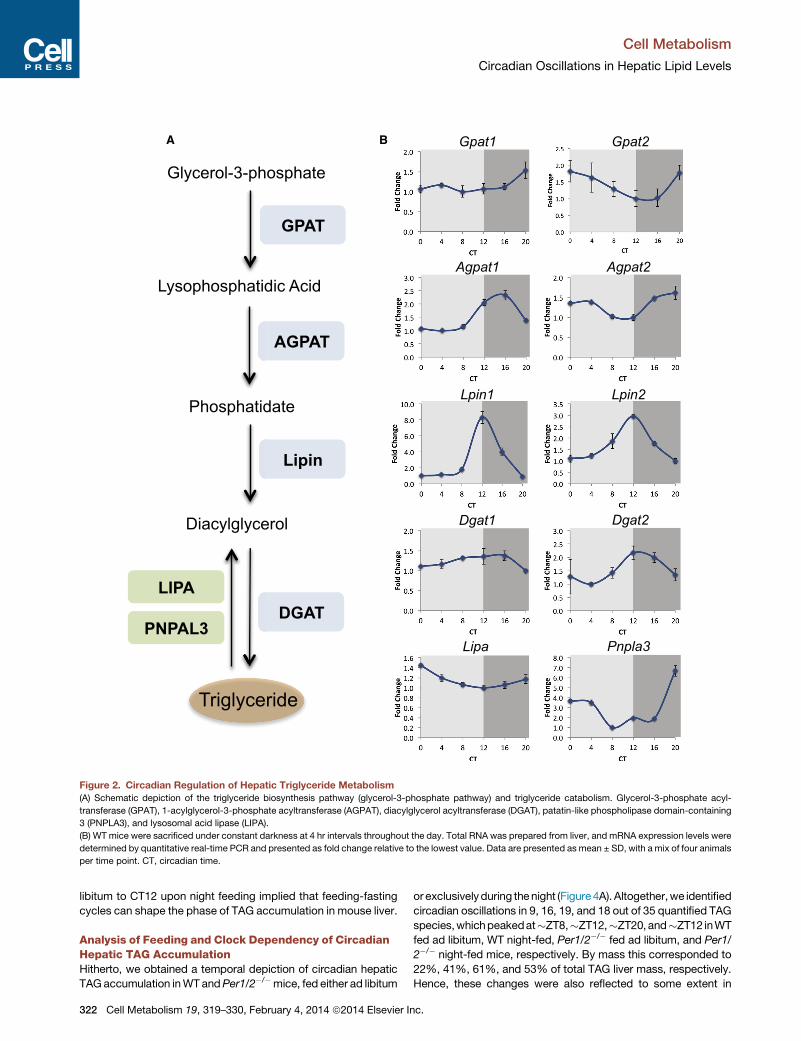
mice. The glycerol-3-phosphate pathway is the predominant
biosynthesis pathway for TAG in the liver and consists of several
successive steps (Figure 2A) (Takeuchi and Reue, 2009). The first
key and rate-limiting step is the acylation of glycerol 3-phos-
phate by glycerol-3-phosphate acyltransferase (GPAT) enzymes
to synthesize lysophosphatidic acid (LPA). Subsequently, an
additional fatty acid is transferred to LPA by the family of 1-acyl-
glycerol-3-phosphate acyltransferase (AGPAT) enzymes to pro-
duce phosphatidate (PA). Diacylglycerol (DAG) is synthesized
from PA by the Lipin family of proteins, through their phosphati-
date phosphatase-1 (PAP) enzymatic activity. Finally, DAG is
converted to TAG through the action of diacylglycerol acyltrans-
ferase (DGAT) enzymes.
WTmice were sacrificed under constant darkness at 4 hr inter-
vals throughout the day, livers were harvested, and RNA was
prepared. The expression level of the different enzymes was
quantified by real-time PCR. Remarkably, we identified circadian
accumulation pattern for multiple enzymes in the glycerol-3-
phosphate pathway, covering all subsequent steps involved in
TAG biosynthesis (Figure 2B). While Gpat1 mRNA levels were
relatively constant throughout the day, Gpat2 exhibited shallow
circadian oscillations with zenith levels around CT0 and nadir
levels around CT12. Next, both Agpat1 and Agpat2 transcripts
accumulated in a circadian manner, albeit with a phase differ-
ence: the former peaked at CT16, while the latter peaked at
CT0. Subsequently, the mRNA expression profile of both Lpin1
and Lpin2 was circadian, with zenith levels at CT12 and nadir
levels at CT0. Finally, the transcript levels of Dgat2 but not
Dgat1 were oscillating with a phase similar to that of Lpin1 and
Lpin2. These findings demonstrated that the glycerol-3-phos-
phate pathway is expressed in a circadian manner.
Hepatic TAG catabolism occurs through the activity of multiple
lipases, releasing one fatty acid at a time, producing diacylgly-
cerols and eventually glycerol (Figure 2A) (Quiroga and Lehner,
2012). To examine the circadian regulation of TAG catabolism
in the liver, we analyzed the expression levels of twomajor haptic
lipases, the patatin-like phospholipase domain containing 3
(Pnpla3) and the lysosomal acid lipase (Lipa) (Quiroga and
Cell M
Lehner, 2012). The mRNA expression levels of both Pnpla3
and, to a much lesser extent, Lipa were circadian, with nadir
levels aroundCT12 (Figure 2B). Taken together, our data evinced
that multiple hepatic enzymes that participate in TAG homeosta-
sis oscillate in a circadian manner. Conceivably, these enzymes
function in concert to generate the above-described circadian
oscillation of TAG in the liver.
Liver Lipidome Analysis of Per 1/2 Null MiceTo address the clock dependency of the above-illustrated circa-
dian profile of lipid accumulation in mouse liver, we performed a
lipidomic analysis on liver samples obtained from Per1/2�/�
mice. Mice lacking both PER1 and PER2 exhibit arrhythmic
locomotor activity under constant darkness, and circadian
expression of core clock and clock-controlled genes is largely
diminished (Zheng et al., 2001). Consistently, expression levels
of core clock genes (i.e., Bmal1, Clock, Cry, and Rev-erba)
were relatively constant throughout the day, and as expected,
Per1 and Per2 mRNA levels were undetectable in these mice
(Figure S2).
Per1/2 null mice were fed ad libitum and sacrificed under con-
stant darkness at 4 hr intervals throughout the day. Livers were
harvested and lipids were identified and quantified by shotgun
lipidomics (Table S2A). Analysis based on the JTK_CYCLE algo-
rithm evinced that out of the 159 classified and quantified lipids,
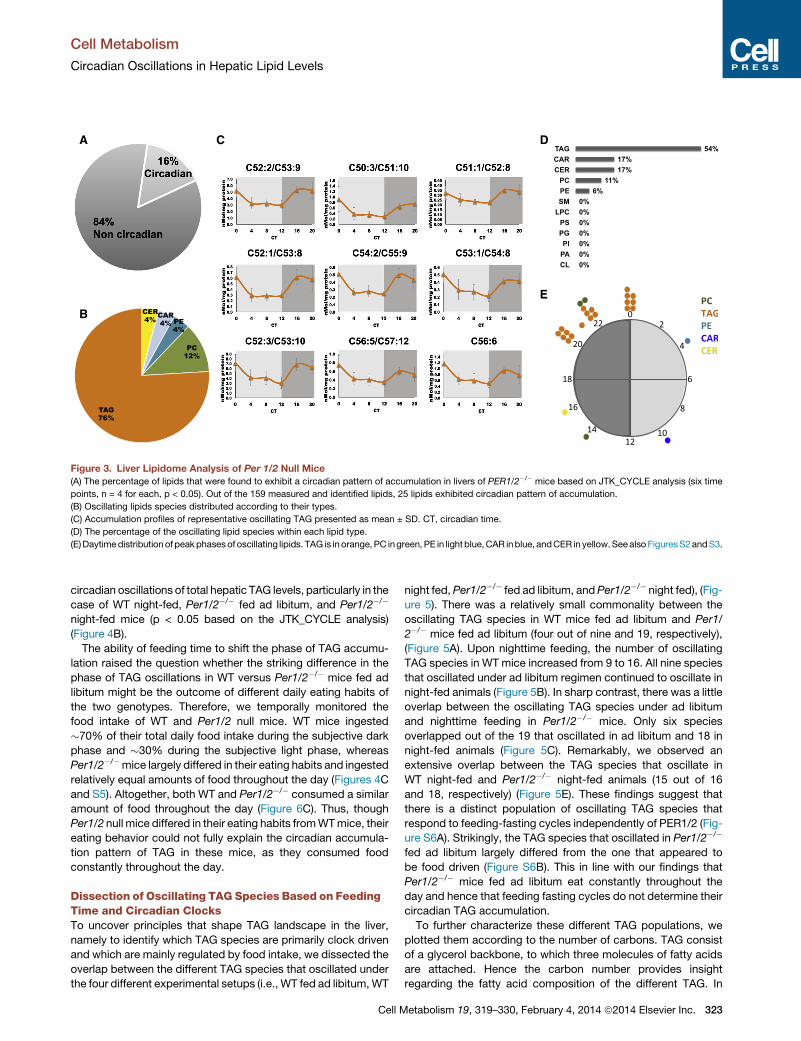
25 (�16%) were identified as oscillating with p < 0.05 (Figures 3A
and S3; Table S2B). The preponderance of them consisted
of TAG (�76%), (Figures 3B, 3C, and S3). Moreover, when
dissected based on their types, oscillating lipid species were
highly enriched among the TAG (�54%), (Figure 3D). Phase dis-
tribution analysis revealed a mirror image to that obtained for WT
samples (compare Figure 1E with Figure 3E). Thus, all oscillating
TAG reached their peak levels during the late night, more
specifically between CT20 and CT0 (Figures 3C, 3E, and S3).
The observed oscillations in lipid accumulation, most notably
TAG in the absence of PER1/2, suggest that their circadian accu-
mulation might be clock independent.
The Effect of Feeding Time on Circadian TAGAccumulation in the LiverFood is a major source for lipids in general and triglycerides in
particular. To examine the direct effect of food ingestion on the
accumulation pattern of TAG in the liver, we performed a limited
lipidomic analysis, this time measuring only TAG species in WT
andPer1/2 null mice, fed exclusively during the night, namely be-
tween CT12 and CT0 (Tables S3A and S4A). JTK_CYCLE based
analysis showed that out of 35 measured TAG species, 16 were
oscillating in WT and 18 in Per1/2 null mice (�46 and �51%,
respectively) (p < 0.05) (Figure S4; Tables S3B and S4B). All
oscillating TAG species peaked around CT12 in both mouse
strains (Figure S4). However, while WT mice exhibited a gradual
buildup and decline of TAG with zenith levels at CT12, Per1/2�/�
mice displayed a prominent and sharp peak in TAG accumula-
tion at CT12 (Figures 4A and S4). The surge in TAG accumulation
in night-fed animals was probably due to lack of food ingestion
prior to CT12, as mice were sacrificed shortly before food was
provided. The prominent phase shift in TAG accumulation from
around CT20 in Per1/2�/� mice and CT8 in WT mice fed ad
etabolism 19, 319–330, February 4, 2014 ª2014 Elsevier Inc. 321
A B
Figure 2. Circadian Regulation of Hepatic Triglyceride Metabolism
(A) Schematic depiction of the triglyceride biosynthesis pathway (glycerol-3-phosphate pathway) and triglyceride catabolism. Glycerol-3-phosphate acyl-
transferase (GPAT), 1-acylglycerol-3-phosphate acyltransferase (AGPAT), diacylglycerol acyltransferase (DGAT), patatin-like phospholipase domain-containing
3 (PNPLA3), and lysosomal acid lipase (LIPA).
(B) WT mice were sacrificed under constant darkness at 4 hr intervals throughout the day. Total RNA was prepared from liver, and mRNA expression levels were
determined by quantitative real-time PCR and presented as fold change relative to the lowest value. Data are presented as mean ± SD, with a mix of four animals
per time point. CT, circadian time.
Cell Metabolism
Circadian Oscillations in Hepatic Lipid Levels
libitum to CT12 upon night feeding implied that feeding-fasting
cycles can shape the phase of TAG accumulation in mouse liver.
Analysis of Feeding and Clock Dependency of CircadianHepatic TAG AccumulationHitherto, we obtained a temporal depiction of circadian hepatic
TAGaccumulation inWTandPer1/2�/�mice, fed either ad libitum
322 Cell Metabolism 19, 319–330, February 4, 2014 ª2014 Elsevier In
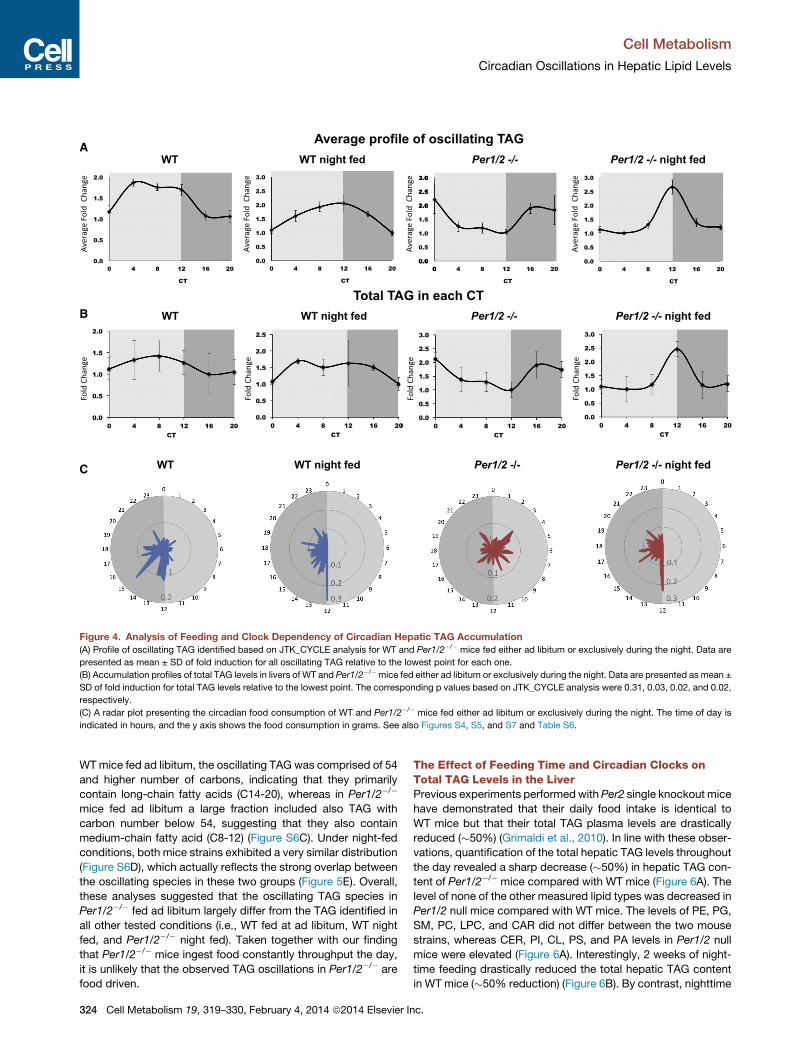
orexclusivelyduring thenight (Figure4A). Altogether,we identified
circadian oscillations in 9, 16, 19, and 18 out of 35 quantified TAG
species,whichpeakedat�ZT8,�ZT12,�ZT20, and�ZT12 inWT
fed ad libitum, WT night-fed, Per1/2�/� fed ad libitum, and Per1/
2�/� night-fed mice, respectively. By mass this corresponded to
22%, 41%, 61%, and 53% of total TAG liver mass, respectively.
Hence, these changes were also reflected to some extent in
c.
A C D
E
B
Figure 3. Liver Lipidome Analysis of Per 1/2 Null Mice
(A) The percentage of lipids that were found to exhibit a circadian pattern of accumulation in livers of PER1/2�/� mice based on JTK_CYCLE analysis (six time
points, n = 4 for each, p < 0.05). Out of the 159 measured and identified lipids, 25 lipids exhibited circadian pattern of accumulation.
(B) Oscillating lipids species distributed according to their types.
(C) Accumulation profiles of representative oscillating TAG presented as mean ± SD. CT, circadian time.
(D) The percentage of the oscillating lipid species within each lipid type.
(E)Daytimedistribution of peakphasesof oscillating lipids. TAG is in orange,PC ingreen, PE in light blue,CAR inblue, andCER in yellow.SeealsoFiguresS2andS3.
Cell Metabolism
Circadian Oscillations in Hepatic Lipid Levels
circadian oscillations of total hepatic TAG levels, particularly in the
case of WT night-fed, Per1/2�/� fed ad libitum, and Per1/2�/�
night-fed mice (p < 0.05 based on the JTK_CYCLE analysis)
(Figure 4B).
The ability of feeding time to shift the phase of TAG accumu-
lation raised the question whether the striking difference in the
phase of TAG oscillations in WT versus Per1/2�/� mice fed ad
libitum might be the outcome of different daily eating habits of
the two genotypes. Therefore, we temporally monitored the
food intake of WT and Per1/2 null mice. WT mice ingested
�70% of their total daily food intake during the subjective dark
phase and �30% during the subjective light phase, whereas
Per1/2�/�mice largely differed in their eating habits and ingested
relatively equal amounts of food throughout the day (Figures 4C
and S5). Altogether, both WT and Per1/2�/� consumed a similar
amount of food throughout the day (Figure 6C). Thus, though
Per1/2 null mice differed in their eating habits fromWTmice, their
eating behavior could not fully explain the circadian accumula-
tion pattern of TAG in these mice, as they consumed food
constantly throughout the day.
Dissection of Oscillating TAG Species Based on FeedingTime and Circadian ClocksTo uncover principles that shape TAG landscape in the liver,
namely to identify which TAG species are primarily clock driven
and which are mainly regulated by food intake, we dissected the
overlap between the different TAG species that oscillated under
the four different experimental setups (i.e., WT fed ad libitum,WT
Cell M
night fed, Per1/2�/� fed ad libitum, andPer1/2�/� night fed), (Fig-
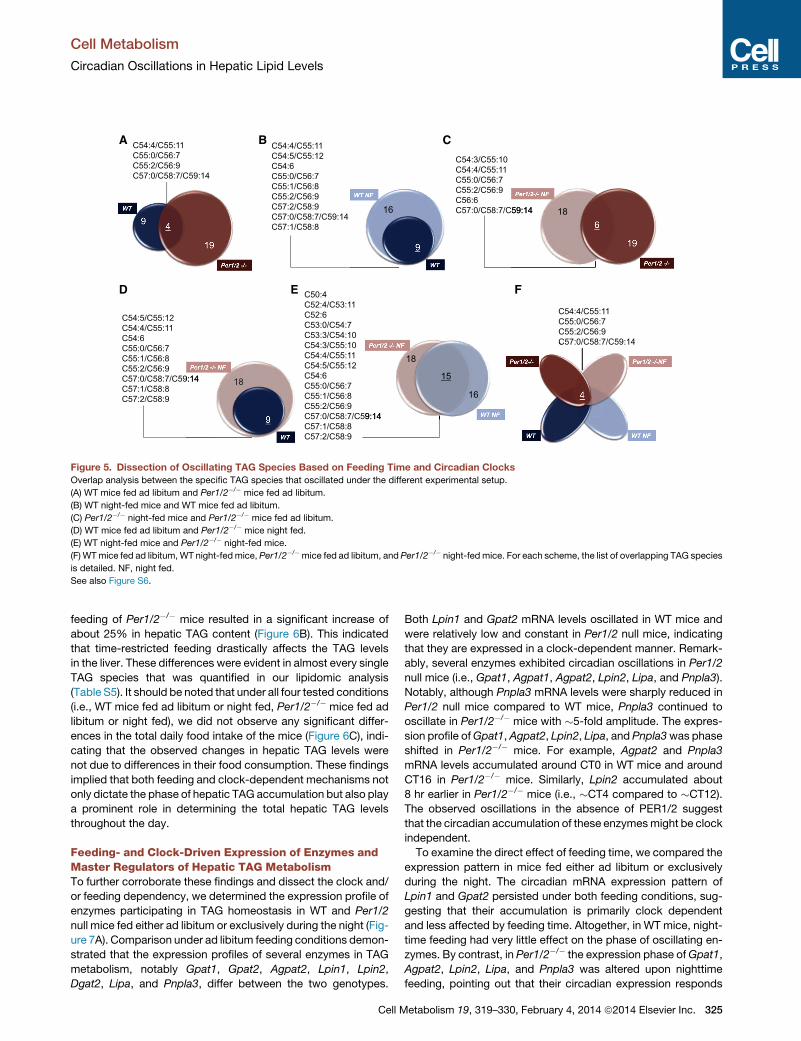
ure 5). There was a relatively small commonality between the
oscillating TAG species in WT mice fed ad libitum and Per1/
2�/� mice fed ad libitum (four out of nine and 19, respectively),
(Figure 5A). Upon nighttime feeding, the number of oscillating
TAG species in WT mice increased from 9 to 16. All nine species
that oscillated under ad libitum regimen continued to oscillate in
night-fed animals (Figure 5B). In sharp contrast, there was a little
overlap between the oscillating TAG species under ad libitum
and nighttime feeding in Per1/2�/� mice. Only six species
overlapped out of the 19 that oscillated in ad libitum and 18 in
night-fed animals (Figure 5C). Remarkably, we observed an
extensive overlap between the TAG species that oscillate in
WT night-fed and Per1/2�/� night-fed animals (15 out of 16
and 18, respectively) (Figure 5E). These findings suggest that
there is a distinct population of oscillating TAG species that
respond to feeding-fasting cycles independently of PER1/2 (Fig-
ure S6A). Strikingly, the TAG species that oscillated in Per1/2�/�
fed ad libitum largely differed from the one that appeared to
be food driven (Figure S6B). This in line with our findings that
Per1/2�/� mice fed ad libitum eat constantly throughout the
day and hence that feeding fasting cycles do not determine their
circadian TAG accumulation.
To further characterize these different TAG populations, we
plotted them according to the number of carbons. TAG consist
of a glycerol backbone, to which three molecules of fatty acids
are attached. Hence the carbon number provides insight
regarding the fatty acid composition of the different TAG. In
etabolism 19, 319–330, February 4, 2014 ª2014 Elsevier Inc. 323
A
B
C
Figure 4. Analysis of Feeding and Clock Dependency of Circadian Hepatic TAG Accumulation
(A) Profile of oscillating TAG identified based on JTK_CYCLE analysis for WT and Per1/2�/� mice fed either ad libitum or exclusively during the night. Data are
presented as mean ± SD of fold induction for all oscillating TAG relative to the lowest point for each one.
(B) Accumulation profiles of total TAG levels in livers of WT and Per1/2�/�mice fed either ad libitum or exclusively during the night. Data are presented as mean ±
SD of fold induction for total TAG levels relative to the lowest point. The corresponding p values based on JTK_CYCLE analysis were 0.31, 0.03, 0.02, and 0.02,
respectively.
(C) A radar plot presenting the circadian food consumption of WT and Per1/2�/� mice fed either ad libitum or exclusively during the night. The time of day is
indicated in hours, and the y axis shows the food consumption in grams. See also Figures S4, S5, and S7 and Table S6.
Cell Metabolism
Circadian Oscillations in Hepatic Lipid Levels
WTmice fed ad libitum, the oscillating TAG was comprised of 54
and higher number of carbons, indicating that they primarily
contain long-chain fatty acids (C14-20), whereas in Per1/2�/�
mice fed ad libitum a large fraction included also TAG with
carbon number below 54, suggesting that they also contain
medium-chain fatty acid (C8-12) (Figure S6C). Under night-fed
conditions, both mice strains exhibited a very similar distribution
(Figure S6D), which actually reflects the strong overlap between
the oscillating species in these two groups (Figure 5E). Overall,
these analyses suggested that the oscillating TAG species in
Per1/2�/� fed ad libitum largely differ from the TAG identified in
all other tested conditions (i.e., WT fed at ad libitum, WT night
fed, and Per1/2�/� night fed). Taken together with our finding
that Per1/2�/� mice ingest food constantly throughput the day,
it is unlikely that the observed TAG oscillations in Per1/2�/� are
food driven.
324 Cell Metabolism 19, 319–330, February 4, 2014 ª2014 Elsevier In
The Effect of Feeding Time and Circadian Clocks onTotal TAG Levels in the LiverPrevious experiments performed with Per2 single knockout mice
have demonstrated that their daily food intake is identical to
WT mice but that their total TAG plasma levels are drastically
reduced (�50%) (Grimaldi et al., 2010). In line with these obser-
vations, quantification of the total hepatic TAG levels throughout
the day revealed a sharp decrease (�50%) in hepatic TAG con-
tent of Per1/2�/� mice compared with WT mice (Figure 6A). The
level of none of the other measured lipid types was decreased in
Per1/2 null mice compared with WT mice. The levels of PE, PG,
SM, PC, LPC, and CAR did not differ between the two mouse
strains, whereas CER, PI, CL, PS, and PA levels in Per1/2 null
mice were elevated (Figure 6A). Interestingly, 2 weeks of night-
time feeding drastically reduced the total hepatic TAG content
in WT mice (�50% reduction) (Figure 6B). By contrast, nighttime
c.
A B C
D E F
Figure 5. Dissection of Oscillating TAG Species Based on Feeding Time and Circadian Clocks
Overlap analysis between the specific TAG species that oscillated under the different experimental setup.
(A) WT mice fed ad libitum and Per1/2�/� mice fed ad libitum.
(B) WT night-fed mice and WT mice fed ad libitum.
(C) Per1/2�/� night-fed mice and Per1/2�/� mice fed ad libitum.
(D) WT mice fed ad libitum and Per1/2�/� mice night fed.
(E) WT night-fed mice and Per1/2�/� night-fed mice.
(F) WTmice fed ad libitum, WT night-fedmice, Per1/2�/�mice fed ad libitum, and Per1/2�/� night-fed mice. For each scheme, the list of overlapping TAG species
is detailed. NF, night fed.
See also Figure S6.
Cell Metabolism
Circadian Oscillations in Hepatic Lipid Levels
feeding of Per1/2�/� mice resulted in a significant increase of
about 25% in hepatic TAG content (Figure 6B). This indicated
that time-restricted feeding drastically affects the TAG levels
in the liver. These differences were evident in almost every single
TAG species that was quantified in our lipidomic analysis
(Table S5). It should be noted that under all four tested conditions
(i.e., WT mice fed ad libitum or night fed, Per1/2�/� mice fed ad
libitum or night fed), we did not observe any significant differ-
ences in the total daily food intake of the mice (Figure 6C), indi-
cating that the observed changes in hepatic TAG levels were
not due to differences in their food consumption. These findings
implied that both feeding and clock-dependent mechanisms not
only dictate the phase of hepatic TAG accumulation but also play
a prominent role in determining the total hepatic TAG levels
throughout the day.
Feeding- and Clock-Driven Expression of Enzymes andMaster Regulators of Hepatic TAG MetabolismTo further corroborate these findings and dissect the clock and/
or feeding dependency, we determined the expression profile of
enzymes participating in TAG homeostasis in WT and Per1/2
null mice fed either ad libitum or exclusively during the night (Fig-
ure 7A). Comparison under ad libitum feeding conditions demon-
strated that the expression profiles of several enzymes in TAG
metabolism, notably Gpat1, Gpat2, Agpat2, Lpin1, Lpin2,
Dgat2, Lipa, and Pnpla3, differ between the two genotypes.
Cell M
Both Lpin1 and Gpat2 mRNA levels oscillated in WT mice and
were relatively low and constant in Per1/2 null mice, indicating
that they are expressed in a clock-dependent manner. Remark-
ably, several enzymes exhibited circadian oscillations in Per1/2
null mice (i.e., Gpat1, Agpat1, Agpat2, Lpin2, Lipa, and Pnpla3).
Notably, although Pnpla3 mRNA levels were sharply reduced in
Per1/2 null mice compared to WT mice, Pnpla3 continued to
oscillate in Per1/2�/� mice with �5-fold amplitude. The expres-
sion profile ofGpat1, Agpat2, Lpin2, Lipa, and Pnpla3was phase
shifted in Per1/2�/� mice. For example, Agpat2 and Pnpla3
mRNA levels accumulated around CT0 in WT mice and around
CT16 in Per1/2�/� mice. Similarly, Lpin2 accumulated about
8 hr earlier in Per1/2�/� mice (i.e., �CT4 compared to �CT12).
The observed oscillations in the absence of PER1/2 suggest
that the circadian accumulation of these enzymesmight be clock
independent.
To examine the direct effect of feeding time, we compared the
expression pattern in mice fed either ad libitum or exclusively
during the night. The circadian mRNA expression pattern of
Lpin1 and Gpat2 persisted under both feeding conditions, sug-
gesting that their accumulation is primarily clock dependent
and less affected by feeding time. Altogether, in WT mice, night-
time feeding had very little effect on the phase of oscillating en-
zymes. By contrast, in Per1/2�/� the expression phase ofGpat1,
Agpat2, Lpin2, Lipa, and Pnpla3 was altered upon nighttime
feeding, pointing out that their circadian expression responds
etabolism 19, 319–330, February 4, 2014 ª2014 Elsevier Inc. 325
A B
C
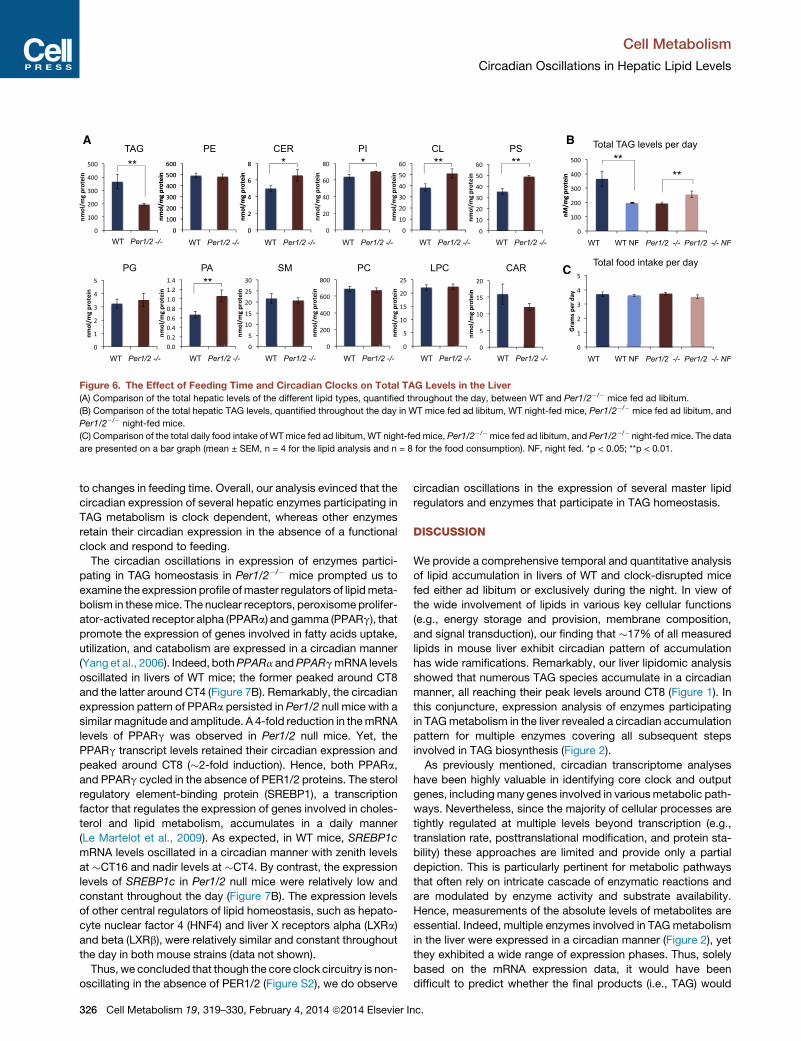
Figure 6. The Effect of Feeding Time and Circadian Clocks on Total TAG Levels in the Liver
(A) Comparison of the total hepatic levels of the different lipid types, quantified throughout the day, between WT and Per1/2�/� mice fed ad libitum.
(B) Comparison of the total hepatic TAG levels, quantified throughout the day in WT mice fed ad libitum, WT night-fed mice, Per1/2�/� mice fed ad libitum, and
Per1/2�/� night-fed mice.
(C) Comparison of the total daily food intake of WTmice fed ad libitum, WT night-fed mice, Per1/2�/�mice fed ad libitum, and Per1/2�/� night-fed mice. The data
are presented on a bar graph (mean ± SEM, n = 4 for the lipid analysis and n = 8 for the food consumption). NF, night fed. *p < 0.05; **p < 0.01.
Cell Metabolism
Circadian Oscillations in Hepatic Lipid Levels
to changes in feeding time. Overall, our analysis evinced that the
circadian expression of several hepatic enzymes participating in
TAG metabolism is clock dependent, whereas other enzymes
retain their circadian expression in the absence of a functional
clock and respond to feeding.
The circadian oscillations in expression of enzymes partici-
pating in TAG homeostasis in Per1/2�/� mice prompted us to
examine the expression profile ofmaster regulators of lipidmeta-
bolism in thesemice. The nuclear receptors, peroxisomeprolifer-
ator-activated receptor alpha (PPARa) and gamma (PPARg), that
promote the expression of genes involved in fatty acids uptake,
utilization, and catabolism are expressed in a circadian manner
(Yang et al., 2006). Indeed, bothPPARa andPPARgmRNA levels
oscillated in livers of WT mice; the former peaked around CT8
and the latter around CT4 (Figure 7B). Remarkably, the circadian
expression pattern of PPARa persisted in Per1/2 null mice with a
similar magnitude and amplitude. A 4-fold reduction in themRNA
levels of PPARg was observed in Per1/2 null mice. Yet, the
PPARg transcript levels retained their circadian expression and
peaked around CT8 (�2-fold induction). Hence, both PPARa,
and PPARg cycled in the absence of PER1/2 proteins. The sterol
regulatory element-binding protein (SREBP1), a transcription
factor that regulates the expression of genes involved in choles-
terol and lipid metabolism, accumulates in a daily manner
(Le Martelot et al., 2009). As expected, in WT mice, SREBP1c
mRNA levels oscillated in a circadian manner with zenith levels
at �CT16 and nadir levels at �CT4. By contrast, the expression
levels of SREBP1c in Per1/2 null mice were relatively low and
constant throughout the day (Figure 7B). The expression levels
of other central regulators of lipid homeostasis, such as hepato-
cyte nuclear factor 4 (HNF4) and liver X receptors alpha (LXRa)
and beta (LXRb), were relatively similar and constant throughout
the day in both mouse strains (data not shown).
Thus, we concluded that though the core clock circuitry is non-
oscillating in the absence of PER1/2 (Figure S2), we do observe
326 Cell Metabolism 19, 319–330, February 4, 2014 ª2014 Elsevier In
circadian oscillations in the expression of several master lipid
regulators and enzymes that participate in TAG homeostasis.
DISCUSSION
We provide a comprehensive temporal and quantitative analysis
of lipid accumulation in livers of WT and clock-disrupted mice
fed either ad libitum or exclusively during the night. In view of
the wide involvement of lipids in various key cellular functions
(e.g., energy storage and provision, membrane composition,
and signal transduction), our finding that �17% of all measured
lipids in mouse liver exhibit circadian pattern of accumulation
has wide ramifications. Remarkably, our liver lipidomic analysis
showed that numerous TAG species accumulate in a circadian
manner, all reaching their peak levels around CT8 (Figure 1). In
this conjuncture, expression analysis of enzymes participating
in TAGmetabolism in the liver revealed a circadian accumulation
pattern for multiple enzymes covering all subsequent steps
involved in TAG biosynthesis (Figure 2).
As previously mentioned, circadian transcriptome analyses
have been highly valuable in identifying core clock and output
genes, including many genes involved in variousmetabolic path-
ways. Nevertheless, since the majority of cellular processes are
tightly regulated at multiple levels beyond transcription (e.g.,
translation rate, posttranslational modification, and protein sta-
bility) these approaches are limited and provide only a partial
depiction. This is particularly pertinent for metabolic pathways
that often rely on intricate cascade of enzymatic reactions and
are modulated by enzyme activity and substrate availability.
Hence, measurements of the absolute levels of metabolites are
essential. Indeed, multiple enzymes involved in TAGmetabolism
in the liver were expressed in a circadian manner (Figure 2), yet
they exhibited a wide range of expression phases. Thus, solely
based on the mRNA expression data, it would have been
difficult to predict whether the final products (i.e., TAG) would
c.
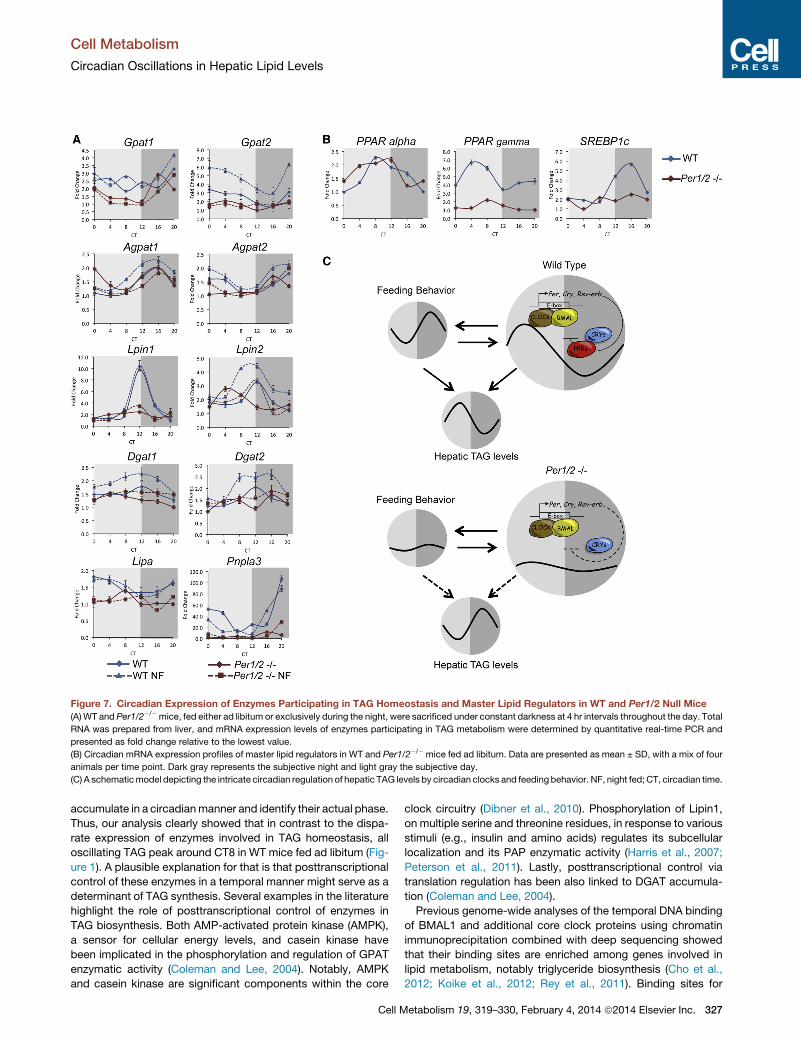
Figure 7. Circadian Expression of Enzymes Participating in TAG Homeostasis and Master Lipid Regulators in WT and Per1/2 Null Mice
(A) WT and Per1/2�/�mice, fed either ad libitum or exclusively during the night, were sacrificed under constant darkness at 4 hr intervals throughout the day. Total
RNA was prepared from liver, and mRNA expression levels of enzymes participating in TAG metabolism were determined by quantitative real-time PCR and
presented as fold change relative to the lowest value.
(B) Circadian mRNA expression profiles of master lipid regulators in WT and Per1/2�/� mice fed ad libitum. Data are presented as mean ± SD, with a mix of four
animals per time point. Dark gray represents the subjective night and light gray the subjective day.
(C) A schematicmodel depicting the intricate circadian regulation of hepatic TAG levels by circadian clocks and feeding behavior. NF, night fed; CT, circadian time.
Cell Metabolism
Circadian Oscillations in Hepatic Lipid Levels
accumulate in a circadianmanner and identify their actual phase.
Thus, our analysis clearly showed that in contrast to the dispa-
rate expression of enzymes involved in TAG homeostasis, all
oscillating TAG peak around CT8 in WT mice fed ad libitum (Fig-
ure 1). A plausible explanation for that is that posttranscriptional
control of these enzymes in a temporal manner might serve as a
determinant of TAG synthesis. Several examples in the literature
highlight the role of posttranscriptional control of enzymes in
TAG biosynthesis. Both AMP-activated protein kinase (AMPK),
a sensor for cellular energy levels, and casein kinase have
been implicated in the phosphorylation and regulation of GPAT
enzymatic activity (Coleman and Lee, 2004). Notably, AMPK
and casein kinase are significant components within the core
Cell M
clock circuitry (Dibner et al., 2010). Phosphorylation of Lipin1,
on multiple serine and threonine residues, in response to various
stimuli (e.g., insulin and amino acids) regulates its subcellular
localization and its PAP enzymatic activity (Harris et al., 2007;
Peterson et al., 2011). Lastly, posttranscriptional control via
translation regulation has been also linked to DGAT accumula-
tion (Coleman and Lee, 2004).
Previous genome-wide analyses of the temporal DNA binding
of BMAL1 and additional core clock proteins using chromatin
immunoprecipitation combined with deep sequencing showed
that their binding sites are enriched among genes involved in
lipid metabolism, notably triglyceride biosynthesis (Cho et al.,
2012; Koike et al., 2012; Rey et al., 2011). Binding sites for
etabolism 19, 319–330, February 4, 2014 ª2014 Elsevier Inc. 327
Cell Metabolism
Circadian Oscillations in Hepatic Lipid Levels
BMAL1, CLOCK, PER1/2, and CRY1/2 were identified for multi-
ple enzymes in the glycerol-3-phosphate pathway. Specifically,
BMAL1, CLOCK, PER1, and CRY1/2 were found to bind the
same intergenic loci, upstream to the Lpin1 transcription-starting
site, albeit with a different phase. Similarly, BMAL1, CLOCK,
PER1/2, and CRY1/2 were present on the same DNA region, up-
stream to the Gpat2 transcription-starting site, though during
different times of the day (�ZT4 for BMAL/CLOCK and �ZT16
for PER/CRY). Hence, it is conceivable that both Lpin1 and
Gpat2 are direct targets of BMAL/CLOCK, PER/CRY transcrip-
tional regulation, as the prominent mRNA circadian expression
of both Lpin1 and Gpat2 was strongly dampened in clock-dis-
rupted mice (Figure 7).
Interestingly, we found that a similar fraction of lipids (�17%)
were oscillating in both WT and Per1/2 null mice fed ad libitum,
most notably TAG. However, they largely differed in their accu-
mulation phase and composition. These observations are
intriguing, as mice lacking both PER1 and PER2 are arrhythmic
under constant darkness and their circadian expression of
core clock genes is largely abolished (Figure S2) (Zheng et al.,
2001). This raises the question of what the molecular mecha-
nisms are that drive the circadian oscillations in TAG accumula-
tion in the absence of a functional clock. We do show that
feeding-fasting cycles can strongly shape the phase of TAG
accumulation in mouse liver and that Per1/2�/� mice differ in
their eating habits compared toWTmice. However, their feeding
behavior cannot fully explain the oscillations of TAG in these
mice, as they consume equal amounts of food throughout the
day, and hence food ingestion cannot serve as a timing cue.
Moreover, overlap analyses of the oscillating TAG species, iden-
tified in WT and Per1/2�/� mice fed ad libitum or exclusively dur-
ing the night, point out that the TAG species that oscillated in
Per1/2�/�mice fed ad libitum largely differed from the oscillating
TAG species found in night-fed Per1/2�/� mice and WT mice
(Figure 5). Conceivably, the TAG species that oscillated in
Per1/2�/� mice fed ad libitum are comprised of a distinct popu-
lation that is not driven by feeding-fasting cycles.
Further studies are required to identify the molecular mecha-
nisms that drive the circadian accumulation of TAG in the
absence of a functional clock. It should be noted that while the
expression of core clock genes is relatively constant throughout
the day in Per1/2 null mice (Figure S2), and these mice exhibit
arrhythmic locomotor activity and feeding behavior under con-
stant darkness (Figure 4C) (Zheng et al., 2001), our analyses do
demonstrate the persistence of circadian oscillation in mRNA
expression of enzymes that participate in TAG metabolism and
master lipid regulators such as PPARs (Figure 7). Hence, this
suggests that different circadian outputs (e.g., locomotor activ-
ity, feeding behavior, TAG accumulation, mRNA expression)
are selectively affected in the absence of PER1/2; some do
persist, while others dampen.
Recently, it has been shown that time-restricted feeding for
more than 3 months can prevent obesity, hepatic steatosis,
and metabolic syndrome in mice fed a high-fat diet (Hatori
et al., 2012; Sherman et al., 2012). Time-restricted feeding
primarily protected mice from the adverse effects of a high-fat
diet, but several metabolic parameters were also significantly
improved upon time-restricted feeding of standard diet, among
them hepatic steatosis (Hatori et al., 2012; Sherman et al.,
328 Cell Metabolism 19, 319–330, February 4, 2014 ª2014 Elsevier In
2012). In this conjuncture, our analysis evinced that time-
restricted feeding of regular chow diet in WT mice for a time
period as short as 2 weeks results in a dramatic decrease
(�50%) in total TAG levels in the liver, whereas the total food
intake was unchanged. Elevated plasma and hepatic TAG levels
are associated with hepatic steatosis and liver malfunction. The
striking effect of nighttime feeding on hepatic TAG levels is of
obvious clinical importance, as current pharmacological inter-
ventions are less efficient and often associated with various
adverse side effects (McKenney and Sica, 2007).
In summary, our study evinces that both circadian clocks and
feeding-fasting cycles play a prominent role in the regulation of
circadian TAG accumulation and total TAG levels in the liver.
Nevertheless, in the absence of a functional clock (i.e., Per1/
2�/� mice) and thus lack of feeding rhythms, circadian oscilla-
tions in hepatic TAG levels do persist, albeit with a complete
different phase. This suggests that additional mechanisms play
a role in their circadian accumulation (Figure 7C).
EXPERIMENTAL PROCEDURES
Animals
All animal experiments and procedures were conducted in conformity with the
Institutional Animal Care and Use Committee (IACUC) guidelines. For liver
lipids and mRNA profiling, we analyzed 3-month-old males that were obtained
fromWT and Per1/2�/�mouse colonies derived from the previously described
original background (Zheng et al., 2001). Mice were kept under 12 hr light/dark
regimen for 2 weeks and fed either ad libitum or exclusively during the dark
phase. Throughout the last day, mice were kept under constant darkness
and were sacrificed at 4 hr intervals around the clock. Livers were harvested,
rinsed in PBS, and rapidly frozen in liquid nitrogen. CT0 corresponded to the
time light was turned on and CT12 to the time light was turned off in the animal
facility.
Shotgun Lipidomic Analysis
Mice were sacrificed by cervical dislocation; livers were harvested and
rinsed with PBS. A ventro lateral section, which corresponds to the right
lobe, was cut and instantly frozen in liquid nitrogen. Liver wafers were pulver-
ized into a fine powder by a stainless steel Bio-pulverizer (12 wells, capacity
10–100 mg per well, BioSpec Products) at the temperature of liquid nitrogen.
Tissue-fine powders (�15 mg) were weighed from each liver sample and
homogenized in PBS by using 2.0 ml cryogenic vials (Corning Life Sciences).
Protein levels in the homogenates were quantified using a bicinchoninic
acid protein assay kit (Thermo Scientific) with bovine serum albumin as
standards. All determined lipid levels were normalized to the protein content
of individual samples.
Individual homogenate of the liver samples was accurately transferred into a
disposable glass culture test tube. An internal standard mixture for quantita-
tion of all reported lipid classeswas added prior to lipid extraction (see Supple-
mental Experimental Procedures). Lipids were extracted by methyl-tert-butyl
ether (Matyash et al., 2008). Each lipid extract was re suspended in a volume
of 100 ml of CHCl3/MeOH (1:1, v/v) per milligram of protein, flushed with N2,
capped, and stored at �20�C. The whole process of the lipid extraction was
performed in a lab with an ambient temperature of 22.7�C ± 0.2�C and con-
ducted in parallel with the controls.
For ESI direct infusion analysis, lipid extract was further diluted to a final
concentration of �500 fmol/mL by CHCl3/MeOH/isopropanol (1/2/4, v/v/v)
with or without 0.02% (v/v) LiOH-saturated MeOH solution, and the mass
spectrometric analysis was performed on a QqQ mass spectrometer (Thermo
TSQ VANTAGE) equipped with an automated nano spray device (TriVersa
NanoMate, Advion Bioscience Ltd.) and operated with Xcalibur software
(Han et al., 2008). Identification and quantification of the different lipid
molecular species were performed using an automated software program
(Yang et al., 2009).
c.
Cell Metabolism
Circadian Oscillations in Hepatic Lipid Levels
RNA Analysis by Real-Time Quantitative PCR
RNA extraction and transcript quantification by real-time PCR technology
were performed as previously described (Asher et al., 2010). Normalizationwas
performed relative to geometrical mean of three housekeeping genes: Tbp,
Hprt, and Gapdh. Primers and probes are listed in the Supplemental Experi-
mental Procedures.
Statistics
Data represent mean ± SEM of four animals per time point. Rhythmicity of
lipids was assessed with the nonparametric test, JTK_CYCLE, previously
described for the analysis of rhythmic transcripts and metabolites (Hughes
et al., 2010). A window of 24 hr was used for the determination of circadian
periodicity, and p < 0.05 was considered statistically significant. Lipid profiles
were crosschecked by visual inspection and false positives excluded.
Measurements of Mice Daily Food Consumption
The daily food consumption of mice was monitored using the Phenomaster
metabolic cages (TSE Systems). Measurements of food intake were per-
formed at 15 min resolution throughout the day.
SUPPLEMENTAL INFORMATION
Supplemental Information includes seven figures, six tables, and Supple-
mental Experimental Procedures and can be found with this article at http://
dx.doi.org/10.1016/j.cmet.2013.12.016.
ACKNOWLEDGMENTS
We thank U. Albrecht for the Per1/2 double knockout mice, S. Anpilov for his
help with the JTK_CYCLE analysis, and A. Auerbach for his technical assis-
tance with the mouse feeders. The work performed in the laboratory of G.A.
was supported by the Israel Science Foundation (ISF), the Abish-Frenkel Foun-
dation, the HFSP Career Development Award (HFSP CDA00014/2012), and
the European Research Council (ERC-2011 METACYCLES 310320). The
work conducted in the laboratory of X.H. was supported by National Institute
on Aging grant R01 AG31675 and by intramural institutional research funds.
L.R.-N. and A.N.-C. received a postdoctoral fellowship from the Feinberg
Graduate School, Weizmann Institute of Science.
Received: July 27, 2013
Revised: November 12, 2013
Accepted: December 16, 2013
Published: February 4, 2014
REFERENCES
Akhtar, R.A., Reddy, A.B., Maywood, E.S., Clayton, J.D., King, V.M., Smith,
A.G., Gant, T.W., Hastings, M.H., and Kyriacou, C.P. (2002). Circadian cycling
of the mouse liver transcriptome, as revealed by cDNAmicroarray, is driven by
the suprachiasmatic nucleus. Curr. Biol. 12, 540–550.
Asher, G., and Schibler, U. (2011). Crosstalk between components of circadian
and metabolic cycles in mammals. Cell Metab. 13, 125–137.
Asher, G., Reinke, H., Altmeyer, M., Gutierrez-Arcelus, M., Hottiger, M.O., and
Schibler, U. (2010). Poly(ADP-ribose) polymerase 1 participates in the phase
entrainment of circadian clocks to feeding. Cell 142, 943–953.
Bass, J. (2012). Circadian topology of metabolism. Nature 491, 348–356.
Brown, S.A., Kowalska, E., and Dallmann, R. (2012). (Re)inventing the circa-
dian feedback loop. Dev. Cell 22, 477–487.
Bugge, A., Feng, D., Everett, L.J., Briggs, E.R., Mullican, S.E., Wang, F.,
Jager, J., and Lazar, M.A. (2012). Rev-erba and Rev-erbb coordinately
protect the circadian clock and normal metabolic function. Genes Dev.
26, 657–667.
Cho, H., Zhao, X., Hatori, M., Yu, R.T., Barish, G.D., Lam, M.T., Chong, L.W.,
DiTacchio, L., Atkins, A.R., Glass, C.K., et al. (2012). Regulation of circadian
behaviour and metabolism by REV-ERB-a and REV-ERB-b. Nature 485,
123–127.
Cell M
Coleman, R.A., and Lee, D.P. (2004). Enzymes of triacylglycerol synthesis and
their regulation. Prog. Lipid Res. 43, 134–176.
Dallmann, R., Viola, A.U., Tarokh, L., Cajochen, C., andBrown, S.A. (2012). The
human circadian metabolome. Proc. Natl. Acad. Sci. USA 109, 2625–2629.
Dibner, C., Schibler, U., and Albrecht, U. (2010). The mammalian circadian
timing system: organization and coordination of central and peripheral clocks.
Annu. Rev. Physiol. 72, 517–549.
Eckel-Mahan, K.L., Patel, V.R., Mohney, R.P., Vignola, K.S., Baldi, P., and
Sassone-Corsi, P. (2012). Coordination of the transcriptome and metabolome
by the circadian clock. Proc. Natl. Acad. Sci. USA 109, 5541–5546.
Feng, D., and Lazar, M.A. (2012). Clocks, metabolism, and the epigenome.
Mol. Cell 47, 158–167.
Froy, O. (2010). Metabolism and circadian rhythms—implications for obesity.
Endocr. Rev. 31, 1–24.
Green, C.B., Takahashi, J.S., and Bass, J. (2008). The meter of metabolism.
Cell 134, 728–742.
Grimaldi, B., Bellet, M.M., Katada, S., Astarita, G., Hirayama, J., Amin, R.H.,
Granneman, J.G., Piomelli, D., Leff, T., and Sassone-Corsi, P. (2010). PER2
controls lipid metabolism by direct regulation of PPARg. Cell Metab. 12,
509–520.
Han, X., Yang, K., and Gross, R.W. (2008). Microfluidics-based electrospray
ionization enhances the intrasource separation of lipid classes and extends
identification of individual molecular species through multi-dimensional
mass spectrometry: development of an automated high-throughput platform
for shotgun lipidomics. Rapid Commun. Mass Spectrom. 22, 2115–2124.
Han, X., Yang, K., and Gross, R.W. (2012). Multi-dimensional mass spectrom-
etry-based shotgun lipidomics and novel strategies for lipidomic analyses.
Mass Spectrom. Rev. 31, 134–178.
Harris, T.E., Huffman, T.A., Chi, A., Shabanowitz, J., Hunt, D.F., Kumar, A., and
Lawrence, J.C., Jr. (2007). Insulin controls subcellular localization andmultisite
phosphorylation of the phosphatidic acid phosphatase, lipin 1. J. Biol. Chem.
282, 277–286.
Hatori, M., Vollmers, C., Zarrinpar, A., DiTacchio, L., Bushong, E.A., Gill, S.,
Leblanc, M., Chaix, A., Joens, M., Fitzpatrick, J.A., et al. (2012). Time-
restricted feeding without reducing caloric intake prevents metabolic diseases
in mice fed a high-fat diet. Cell Metab. 15, 848–860.
Hughes, M.E., Hogenesch, J.B., and Kornacker, K. (2010). JTK_CYCLE: an
efficient nonparametric algorithm for detecting rhythmic components in
genome-scale data sets. J. Biol. Rhythms 25, 372–380.
Hussain, M.M., and Pan, X. (2009). Clock genes, intestinal transport and
plasma lipid homeostasis. Trends Endocrinol. Metab. 20, 177–185.
Kasukawa, T., Sugimoto, M., Hida, A., Minami, Y., Mori, M., Honma, S.,
Honma, K., Mishima, K., Soga, T., and Ueda, H.R. (2012). Human blood
metabolite timetable indicates internal body time. Proc. Natl. Acad. Sci. USA
109, 15036–15041.
Koike, N., Yoo, S.H., Huang, H.C., Kumar, V., Lee, C., Kim, T.K., and
Takahashi, J.S. (2012). Transcriptional architecture and chromatin landscape
of the core circadian clock in mammals. Science 338, 349–354.
Le Martelot, G., Claudel, T., Gatfield, D., Schaad, O., Kornmann, B., Lo Sasso,
G., Moschetta, A., and Schibler, U. (2009). REV-ERBalpha participates in
circadian SREBP signaling and bile acid homeostasis. PLoS Biol. 7, e1000181.
Matyash, V., Liebisch, G., Kurzchalia, T.V., Shevchenko, A., and Schwudke, D.
(2008). Lipid extraction by methyl-tert-butyl ether for high-throughput lipido-
mics. J. Lipid Res. 49, 1137–1146.
McCarthy, J.J., Andrews, J.L., McDearmon, E.L., Campbell, K.S., Barber,
B.K., Miller, B.H., Walker, J.R., Hogenesch, J.B., Takahashi, J.S., and Esser,
K.A. (2007). Identification of the circadian transcriptome in adult mouse
skeletal muscle. Physiol. Genomics 31, 86–95.
McKenney, J.M., and Sica, D. (2007). Role of prescription omega-3 fatty acids
in the treatment of hypertriglyceridemia. Pharmacotherapy 27, 715–728.
Minami, Y., Kasukawa, T., Kakazu, Y., Iigo, M., Sugimoto, M., Ikeda, S., Yasui,
A., van der Horst, G.T., Soga, T., and Ueda, H.R. (2009). Measurement of
internal body time by blood metabolomics. Proc. Natl. Acad. Sci. USA 106,
9890–9895.
etabolism 19, 319–330, February 4, 2014 ª2014 Elsevier Inc. 329
Cell Metabolism
Circadian Oscillations in Hepatic Lipid Levels
Panda, S., Antoch, M.P., Miller, B.H., Su, A.I., Schook, A.B., Straume, M.,
Schultz, P.G., Kay, S.A., Takahashi, J.S., and Hogenesch, J.B. (2002).
Coordinated transcription of key pathways in the mouse by the circadian
clock. Cell 109, 307–320.
Peterson, T.R., Sengupta, S.S., Harris, T.E., Carmack, A.E., Kang, S.A.,
Balderas, E., Guertin, D.A., Madden, K.L., Carpenter, A.E., Finck, B.N., and
Sabatini, D.M. (2011). mTOR complex 1 regulates lipin 1 localization to control
the SREBP pathway. Cell 146, 408–420.
Preitner, N., Damiola, F., Lopez-Molina, L., Zakany, J., Duboule, D., Albrecht,
U., and Schibler, U. (2002). The orphan nuclear receptor REV-ERBalpha con-
trols circadian transcription within the positive limb of the mammalian circa-
dian oscillator. Cell 110, 251–260.
Quiroga, A.D., and Lehner, R. (2012). Liver triacylglycerol lipases. Biochim.
Biophys. Acta 1821, 762–769.
Rey, G., Cesbron, F., Rougemont, J., Reinke, H., Brunner, M., and Naef, F.
(2011). Genome-wide and phase-specific DNA-binding rhythms of BMAL1
control circadian output functions in mouse liver. PLoS Biol. 9, e1000595.
Sherman, H., Genzer, Y., Cohen, R., Chapnik, N., Madar, Z., and Froy, O.
(2012). Timed high-fat diet resets circadian metabolism and prevents obesity.
FASEB J. 26, 3493–3502.
Shimba, S., Ogawa, T., Hitosugi, S., Ichihashi, Y., Nakadaira, Y., Kobayashi,
M., Tezuka, M., Kosuge, Y., Ishige, K., Ito, Y., et al. (2011). Deficient of a clock
gene, brain and muscle Arnt-like protein-1 (BMAL1), induces dyslipidemia and
ectopic fat formation. PLoS ONE 6, e25231.
Solt, L.A., Wang, Y., Banerjee, S., Hughes, T., Kojetin, D.J., Lundasen, T., Shin,
Y., Liu, J., Cameron, M.D., Noel, R., et al. (2012). Regulation of circadian
330 Cell Metabolism 19, 319–330, February 4, 2014 ª2014 Elsevier In
behaviour and metabolism by synthetic REV-ERB agonists. Nature 485,
62–68.
Storch, K.F., Lipan, O., Leykin, I., Viswanathan, N., Davis, F.C., Wong, W.H.,
and Weitz, C.J. (2002). Extensive and divergent circadian gene expression in
liver and heart. Nature 417, 78–83.
Takeuchi, K., and Reue, K. (2009). Biochemistry, physiology, and genetics of
GPAT, AGPAT, and lipin enzymes in triglyceride synthesis. Am. J. Physiol.
Endocrinol. Metab. 296, E1195–E1209.
Turek, F.W., Joshu, C., Kohsaka, A., Lin, E., Ivanova, G., McDearmon, E.,
Laposky, A., Losee-Olson, S., Easton, A., Jensen, D.R., et al. (2005). Obesity
and metabolic syndrome in circadian Clock mutant mice. Science 308,
1043–1045.
Vollmers, C., Gill, S., DiTacchio, L., Pulivarthy, S.R., Le, H.D., and Panda, S.
(2009). Time of feeding and the intrinsic circadian clock drive rhythms in hepat-
ic gene expression. Proc. Natl. Acad. Sci. USA 106, 21453–21458.
Yang, X., Downes, M., Yu, R.T., Bookout, A.L., He, W., Straume, M.,
Mangelsdorf, D.J., and Evans, R.M. (2006). Nuclear receptor expression links
the circadian clock to metabolism. Cell 126, 801–810.
Yang, K., Cheng, H., Gross, R.W., and Han, X. (2009). Automated lipid identi-
fication and quantification by multidimensional mass spectrometry-based
shotgun lipidomics. Anal. Chem. 81, 4356–4368.
Zheng, B., Albrecht, U., Kaasik, K., Sage, M., Lu, W., Vaishnav, S., Li, Q., Sun,
Z.S., Eichele, G., Bradley, A., and Lee, C.C. (2001). Nonredundant roles of the
mPer1 andmPer2 genes in the mammalian circadian clock. Cell 105, 683–694.
c.