Embed Size (px)
Citation preview

Cellular heterogeneity in the DNA damage response is determined by cell cycle specific
p21 degradation
Dissertation
zur Erlangung des akademischen Grades
Doctor rerum naturalium (Dr. rer. nat.)
eingereicht an der
Lebenswissenschaftlichen Fakultät
der Humboldt-Universität zu Berlin
von
M.Sc., Caibin Sheng
Präsidentin der Humboldt-Universität zu Berlin
Prof. Dr.-Ing. Dr. Sabine Kunst
Dekan der Lebenswissenschaftlichen Fakultät
Prof. Dr. Bernhard Grimm
Gutachter/innen: 1. Prof. Dr. Alexander Lower
2. Prof. Dr. Andreas Herrmann
3. Dr. Jana Wolf
Tag der mundlichen Prufung: 19. 12. 2017

Table of Contents
ABSTRACT / ZUSAMMENFASSUNG .................................................................................. 1 ABSTRACT .......................................................................................................................... 1 ZUSAMMENFASSUNG ........................................................................................................... 3
1 INTRODUCTION ........................................................................................................... 5 1.1 P53 IS A KEY NODE IN THE CELLULAR STRESS-RESPONSE NETWORK ............................ 5
1.1.1 p53’s history and functions ................................................................................. 5 1.1.2 Heterogeneous p53 dynamics in single cells ...................................................... 8 1.1.3 p53 dynamics control cell fate ............................................................................ 9
1.2 P21 IS A MAIN EFFECTOR OF P53 IN THE DNA DAMAGE RESPONSE ............................ 12 1.2.1 p21 function and cell cycle ............................................................................... 12 1.2.2 Multiple mechanisms mediate p21 degradation ................................................ 13
1.3 METHODOLOGY ..................................................................................................... 15 1.3.1 Technical limitations on measuring endogenous dynamics .............................. 15 1.3.2 CRISPR/Cas9 technology ................................................................................ 16
1.4 AIMS OF THIS THESIS .............................................................................................. 17
2 RESULTS .................................................................................................................... 20 2.1 ESTABLISHMENT OF CRISPR/CAS9 BASED TECHNOLOGY TO GENERATE ENDOGENOUS
FLUORESCENT REPORTERS ................................................................................................ 20 2.1.1 Technical concept of CRISPR-Cas9-based knockin ......................................... 20 2.1.2 CRISPR-Cas9 enables genome editing ........................................................... 21 2.1.3 Insertion frequency is increased by optimizing cleavage efficiency................... 24 2.1.4 Length of homology regions in repair template determines the insertion efficiency ......................................................................................................................... 27 2.1.5 Off-target effects are not detected .................................................................... 28
2.2 ESTABLISHING A COMBINED REPORTER TO MONITOR P53 AND P21 DYNAMICS ............ 29 2.2.1 Tagging a single allele is sufficient to monitor p53 dynamics ............................ 29 2.2.2 Fluorescent reporter faithfully reflects endogenous p53 level ........................... 31 2.2.3 Reporter cells show unaltered p53 responses to DNA damage ........................ 32 2.2.4 Reporter cells show no differences in cell fates after damage .......................... 33 2.2.5 Establishment of a combined reporter to simultaneously monitor p53 and p21 34
2.3 CELL SPECIFIC DEGRADATION LEADS TO CELLULAR HETEROGENEITY IN THE DNA
DAMAGE RESPONSE ........................................................................................................... 36 2.3.1 Cells exhibit heterogeneity in response to DNA damage .................................. 36 2.3.2 X-ray irradiation induces homogeneous p53 dynamics but heterogeneous p21 dynamics ..................................................................................................................... 39 2.3.3 A shape-based distance allows quantifying similarities of dynamics between cells ......................................................................................................................... 42 2.3.4 Two subgroups of distinct responses are identified .......................................... 47 2.3.5 p21 responses depend on cell cycle phase at the time of damage ................... 49 2.3.6 Deep clustering reveals more refined p21 responses ....................................... 51 2.3.7 Combination of EdU labelling and semi-supervised classification allows endpoint cell cycle analysis ........................................................................................................ 54 2.3.8 Cells with different p21 dynamics tend to end up with divergent cell cycle phases ......................................................................................................................... 57 2.3.9 p21 dynamics are related to cell fate decisions ................................................ 58 2.3.10 PCNA-mediated degradation leads to the majority of cell-to-cell variations .. 64
3 DISCUSSION .............................................................................................................. 68 3.1 CRISPR/CAS9 BASED GENOME ENGINEERING IS A ROBUST TOOL TO FAITHFULLY TAG
AND EFFICIENTLY MODIFY ENDOGENOUS PROTEINS ............................................................. 68 3.2 SHAPE-BASED CLUSTERING CAN EFFICIENTLY CLASSIFY CELLULAR DYNAMICS ........... 71 3.3 ENDPOINT ASSAY ENSURES LINKING DYNAMICS TO CELL FATE DECISIONS FOR
INDIVIDUAL CELLS .............................................................................................................. 72

3.4 REGROUPING CELLS UPON BOTH DYNAMICS AND CELL FATE DECISIONS HIGHLIGHTS
CELL CYCLE SPECIFIC HETEROGENEITY ............................................................................... 74 3.5 INSIGHTS AND CHALLENGES IN INVESTIGATION OF CELLULAR HETEROGENEITY ........... 78
4 METHODS AND MATERIALS .................................................................................... 80 4.1 CELL CULTURE ...................................................................................................... 80 4.2 PLASMIDS AND CLONING ......................................................................................... 80 4.3 T7 ENDONUCLEASE I ASSAY ................................................................................... 82 4.4 ENDOGENOUS TAGGING IN MCF10A ....................................................................... 83 4.5 TIME-LAPSE MICROSCOPY ...................................................................................... 83 4.6 IMAGE ANALYSIS .................................................................................................... 84 4.7 SHAPE-BASED CLUSTERING .................................................................................... 84 4.8 CELL CYCLE ANALYSIS ........................................................................................... 85 4.9 IMMUNOFLUORESCENCE......................................................................................... 86 4.10 IMMUNOBLOTTING .................................................................................................. 87
5 REFERENCES ............................................................................................................ 88
6 APPENDIX .................................................................................................................. 96 6.1 LIST OF ABBREVIATIONS ......................................................................................... 96 6.2 LIST OF PRIMERS ................................................................................................... 98 6.3 LIST OF SGRNA TARGETS .................................................................................... 101 6.4 SEQUENCES OF CONSTRUCTS .............................................................................. 103 6.5 SINGLE CELL TRAJECTORIES ................................................................................. 109
ACKNOWLEDGEMENTS ................................................................................................. 111
SELBSTSTANDIGKEITSERKLARUNG ........................................................................... 112

1
Abstract / Zusammenfassung
Abstract
The cellular response to a given stimulus is not only governed by the stimulus itself, but
also depends on the state of the cells. Cell cycle phase, protein levels or microenvironment
delineate a unique state for each individual cell. This results in heterogeneous behavior of
genetically identical cells. Understanding cell-to-cell variability requires linking different
cellular responses to defined cellular states. In this thesis, I established a framework to
study how the cellular response to DNA damage is affected by varying cell states and to
identify the underlying molecular mechanisms.
To this end, I established a CRISPR/Cas9 based technique to generate fluorescent
reporters for endogenous signaling proteins in non-transformed breast epithelial cells
(MCF10A) and applied it to simultaneously measure the dynamics of the tumor
suppressor p53 and one of its target genes, the cell cycle inhibitor p21 by time-lapse
microscopy. Using this approach, I observed highly heterogeneous p21 responses to DNA
damage in individual cells. To reveal hidden information from the observed phenotypes, I
developed a shape-based clustering approach and identified four distinct subpopulations
of characteristic p21 dynamics. To examine the source of cell-to-cell variability, I analyzed
cell divisions prior to irradiation to estimate initial cell cycle states, followed by EdU
labeling and a semi-supervised classification to determine the cellular state 24h post
damage. This allowed me to demonstrate how initial cell cycle phase and cell cycle
progression shape p21 dynamics by regulating protein stability and how this determines
the cellular response to damage. Furthermore, to identify molecular mechanisms shaping
the p21 response, interaction between the cell cycle inhibitor and proliferating cellular
nuclear antigen (PCNA), a cell cycle dependent factor, was blocked by introducing
mutation in the binding domain of p21 using CRISPR-Cas9 based genome engineering.
This led to relatively homogenous p21 dynamics in response to damage, independent of
cell cycle phase.
Overall, my project provides a pipeline to study at the single cell level how cellular
response is affected by cell states. Considering that cellular heterogeneity leads to

Abstract / Zusammenfassung
2
fractional killing in tumor therapies, this approach also suggests future application on
studying drug-resistance in cancer therapy.

Abstract / Zusammenfassung
3
Zusammenfassung
Die zellulare Antwort auf einen spezifischen Stimulus wird nicht nur durch den Stimulus
selbst, sondern insbesondere auch von dem gegebenen Zustand der Zelle bestimmt. Die
jeweilige Zellzyklusphase, die Konzentration der relevanten Proteine sowie die
Mikroumgebung bestimmen einen einzigartigen Zustand fur jede individuelle Zelle.
Daraus resultiert ein heterogenes Verhalten von genetisch identischen Zellen. Um ein
tieferes Verstandnis fur die große Variabilitat in einer Zellpopulation gewinnen zu konnen,
ist es notwendig, die verschiedenen zellularen Antworten mit definierten zellularen
Zustanden in Verbindung zu bringen. In dieser Arbeit wurde ein System etabliert, welches
es zum einen ermoglicht, die zellulare Antwort auf DNA-Schaden und den Einfluss
unterschiedlicher zellularer Zustande zu studieren und zum anderen die zu Grunde
liegenden molekularen Mechanismen zu identifizieren.
Im Zuge dessen wurde eine auf CRISPR/Cas9 basierende Methode entwickelt, mit Hilfe
derer Fluoreszenzreporter fur endogene Signalproteine in nicht transformierten
Brustepithelzellen (MCF10A) generiert wurden. Anhand dieses Reportersystems konnte
durch time-lapse Mikroskopie die Dynamik des Tumorsuppressors p53 und gleichzeitig
eines seiner Zielgene, des Zellzyklusinhibitors p21, verfolgt werden. Dabei wurde deutlich,
dass die p21 Antwort der individuellen Zellen auf DNA-Schaden sehr heterogen ausfallt.
Um mehr Informationen zu den verschiedenen Phanotypen zu gewinnen, wurde eine
Form-basierte Gruppierungsmethode entwickelt und vier verschiedene Subpopulationen
mit charakteristischen p21 Dynamiken identifiziert. Um den Einfluss der Zellzyklusphase
zu untersuchen, wurde die Zellteilung vor Bestrahlung analysiert und so Ruckschlusse auf
die initiale Zellzyklusphase gezogen. 24h nach Bestrahlung wurde ein EdU labeling
durchgefuhrt und der Zellzyklus mittels semi-supervised Klassifizierung bestimmt. Mit
Hilfe dieser Technik konnte demonstriert werden, wie der Zellzyklus durch Regulation
der Proteinstabilitat die p21 Dynamiken formt und auf diese Weise die Schadensantwort
der Zelle bestimmt. Weiterhin wurden molekulare Mechanismen identifiziert, welche die
p21 Antwort beeinflussen. Hierfur wurde die Interaktion zwischen p21 und dem
proliferating cellular nuclear antigen (PCNA), einem Zellzyklus-abhangigen Faktor,
verhindert, indem eine Mutation in der Bindedomane von p21 durch CRISPR-Cas9
basiertes Genome Editing eingefuhrt wurde. Dies fuhrte zu einer relative homogenen p21
Dynamik als Antwort auf Schaden, unabhangig von der Zellzyklusphase.

Abstract / Zusammenfassung
4
Alles in allem bietet mein Projekt eine Pipeline, um auf Einzelzellebene zu erforschen, wie
zellulare Antworten durch den Zellzyklus beeinflusst werden. Dieser Ansatz konnte
zukunftig Anwendung in der Erforschung von Medikamentenresistenz finden,
insbesondere da zellulare Heterogenitat in der Tumortherapie zu fractional killing fuhrt.

5
1 Introduction
1.1 p53 is a key node in the cellular stress-response network
1.1.1 p53’s history and functions
p53 (encoded by Tp53 in human and by Trp53 in murine animals) was first discovered in
1970s (Linzer & Levine 1979; Lane & Crawford 1979), during which period cancer-
causing viruses were a hot topic in cancer research (Levine & Oren 2009; Kastenhuber &
Lowe 2017). Many oncoproteins were identified by examining proteins overexpressed in
cancer virus-induced tumors. These oncoproteins included viral proteins and cellular
proteins that may be induced indirectly by viral proteins. A 53 kDa host protein was found
to form complexes with simian virus 40 (SV40) large T antigen in transformed cells
(Linzer & Levine 1979; Lane & Crawford 1979). Subsequent research reported that the
same protein was also detected in non-virus transformed cancer cells but not in normal
cells (DeLeo et al. 1979; Rotter 1983). Naturally this protein was presupposed as an
oncoprotein and named p53 as an identical nomenclature in a conference seeing that
independent laboratories used different names causing confusions (Levine & Oren 2009).
p53 cDNA was further cloned and overexpression of it caused tumorigenesis in normal
tissue (Eliyahu et al. 1984; Jenkins et al. 1984), supporting a role as an oncoprotein.
Surprisingly, some scientists observed tumor suppressor properties of p53. For example,
Ben David and his colleagues found that p53 was inactivated in murine erythroleukemic
cell lines induced by Friend leukemia virus (Ben David et al. 1988). Rotter and his
colleagues also observed that p53 was deleted in HL-60 cells, which are derived from
human leukemia (Wolf & Rotter 1985). More convincingly, when comparing sequences of
p53 cDNA from different resources, several laboratories found that most of the published
p53 cDNA which were often generated from tumor cells carried mutations in coding
sequence and wild type p53 from normal tissue failed to exhibit oncogenic activity
(Eliyahu et al. 1988; Finlay et al. 1989; Halevy et al. 1991). Since then, p53 was widely
accepted as a tumor suppressor and regarded as ‘the guardian of the genome’ because of
its irreplaceable role in maintaining genome stability (Efeyan & Serrano 2007).
How does p53 work as ‘the guardian’? The p53 network responds to various stress signals,
including DNA damage, hypoxia, spindle damage and replication stress induced by
dysregulated oncogenes (Figure 1) (Riley et al. 2008). These stresses can activate p53 by
distinct mechanisms. For example, DNA damage activates upstream kinases, such as ATM
Introduction
6
(ataxia-telangiectasia mutated kinase) and ATR (ataxia telangiectasia and Rad3-related
protein), which then trigger the p53 pathway by phosphorylating p53 protein and
inhibiting its negative regulator Mouse double minute 2 homolog (Mdm2) (Shieh et al.
1997), whereas oncogenic signals inhibit Mdm2 by ARF tumor suppressor (Zhang et al.
1998). After further modifications, such as acetylation, p53 can bind to specific DNA
sequences, so called p53 response element (p53 RE). Together with other cofactors, such
as CBP and p300, p53 drives the transcription of target genes to counteract tumorigenesis.
For example, p53-mediated induction of cyclin-dependent kinase inhibitor 1A (CDKN1A,
encoding p21) halts cell cycle to permit the repair of undesired DNA damage (El-Deiry et
al. 1993). Besides, BCL2-binding component-3 (BBC3), another p53 target gene, promotes
apoptosis in response to p53 activation in cancer cells (Nakano & Vousden 2001; Yu et al.
2001). Although promoting cell cycle arrest and apoptosis are the best-studied functions
of p53, many researches suggest that p53 is also involved in other ‘non-canonical’
programs (Kastenhuber & Lowe 2017). For instance, p53 can regulate autophagy (Maiuri
et al. 2010), govern metabolic pathways (Kruiswijk et al. 2015) and suppress pluripotency
(Lin & Lin 2017). p53 governs these alternative programs by controlling the expression of
different sets of target genes (Kastenhuber & Lowe 2017). Benefiting from the
development of high throughput ‘-omics’, specifically transcriptomics, thousands of p53
targets were identified although a recent effort revealed that probably only about 60
targets were found consistently among 16 genome-wide datasets (Fischer 2017).
Nevertheless, it is widely accepted that p53 is crucial for keeping cellular ‘health’ and its
responses can vary in different cell types depending on specific stimuli and distinct
cellular states (Kastenhuber & Lowe 2017).

Introduction
7
Figure 1 Mechanisms of p53 activation and regulation of cellular outcomes (Riley et al. 2008)

Introduction
8
1.1.2 Heterogeneous p53 dynamics in single cells
New technologies are usually the key to answering open questions. The emergence of live-
cell imaging (Figure 2) facilitated the understanding of how p53 responds to stress and
how cells determine outcomes by intricate p53 dynamics. This technology and
subsequent computational analysis shed light on single cell behaviors and revealed that
the p53 dynamics of each cell are different (Lahav et al. 2004; Loewer et al. 2010; Loewer
& Lahav 2011).
Figure 2 Measuring cellular dynamics using fluorescent reporters and time-lapse microscopy Proteins of interests can be fluorescently tagged and measured with an interval of seconds to minutes. This generates large datasets of time-series images. By processing these images using automated segmentation and tracking algorithms, each cell can be isolated and followed over time, resulting in measurements of protein dynamics for thousands of individual cells from a single experiment.
Under normal conditions, transient DNA damage in cells trigger spontaneous p53 pulses.
Averaging spontaneous p53 pulses in a population of cells gives the impression of stable
steady-state levels. (Figure 3). In response to double strand DNA breaks (DSBs) induced
by -irradiation, cells show repeated p53 pulses and the pulse frequency is heterogeneous
in single cells although the pulse features (such as the amplitudes and durations) are
usually constant (Lahav et al. 2004; Loewer et al. 2010; Loewer & Lahav 2011). This gives
the appearance of damped p53 oscillations at the average level (Figure 3), which are
usually observed in population level studies, such as western blot. These fascinating
observations highlighted the importance of single cell investigations and led to further

Introduction
9
questions why cells behave differently and how heterogeneity affects the cellular outcome
to a given stress.
Figure 3 Single cell studies revealed heterogeneous p53 dynamics (Loewer & Lahav 2011)
1.1.3 p53 dynamics control cell fate
Besides the aforementioned two types of p53 dynamical patterns, cells can also show
sustained p53 dynamics after UV-irradiation (Batchelor et al. 2011). More interestingly, it
seems that these differential dynamics associate with cellular outcomes. As shown in
Figure 4, cells showing spontaneous p53 pulse are able to proliferate afterwards (Loewer
et al. 2010); DSBs induced by -irradiation trigger a series of p53 pulses, most likely
followed by transient cell cycle arrest and recovery (Loewer et al. 2010; Purvis et al. 2012),
whereas UV-irradiation causes sustained p53 accumulation, sending cells to apoptosis
(Batchelor et al. 2011; Purvis et al. 2012). However, these different types of dynamics are
generated under different conditions, making it difficult to prove that there is a causal link
from p53 dynamics to cell fate decisions (Purvis & Lahav 2013) due to the fact that
different stimuli might influence the cellular outcomes by affecting other networks. In this
context, Jeremy E. Purvis and co-workers artificially altered pulsing p53 to sustained p53
in -irradiation-damaged cells by using timed doses of the small molecule Nutlin-3, which
stabilizes p53 by inhibiting the interaction between p53 and its negative regulator Mdm2,
and observed cell senescence instead of cell cycle arrest (Purvis et al. 2012). This
observation supported the hypothesis that different p53 dynamics are correlated to
different cellular outcomes.

Introduction
10
Why does p53 show distinct dynamics in response to -irradiation and UV-irradiation?
This can be explained by the difference in p53 feedback loops (Figure 4). Both stimuli can
activate p53 and its negative feedback loops, Mdm2 and p53-induced Phosphatase 1
(Wip1). However, -irradiation induced ATM can be dephosphorylated by Wip1
(Shreeram et al. 2006) and thereby further downregulate p53 (Lu et al. 2007). The Wip1
loop is responsible for generating oscillating p53 in response to -irradiation as was
shown by the knockdown of Wip1, which generates UV-like p53 dynamics (Batchelor et
al. 2008).
Figure 4 p53 dynamics control cellular outcomes in response to different stimuli
The next question that arises when deciphering p53 dynamics is how they influence
cellular outcomes. In a previously discussed report, expression of senescence genes
increased after pulsed p53 accumulation was switched to sustained p53 accumulation
(Purvis et al. 2012). This suggests that different dynamics might lead to the expression of
different sets of genes. However, how p53 dynamics affect the expression of its targets is
still unclear. A recent report suggests that the mRNA decay rate determines the dynamics
of p53’s target genes (Porter et al. 2016). In response to pulsed p53, slow-decaying
mRNAs would sustainably accumulate whereas fast-decaying mRNAs might not be able to
accumulate once the production rate is slower than decay rate. Sustained p53 increases

Introduction
11
the production rate so that the fast-decaying mRNAs can accumulate to an extent that
allows them to elicit the corresponding cellular effect. This might provide some clues on
how cells choose target genes in response to different p53 dynamics. The protein level of
p53’s targets, however, is also influenced by other factors, in particular post-translational
modifications (PTMs). Provided the complexity of signaling networks, one can assume
that some, if not all, of these modifications might be p53-independent and cell state
specific. In addition, even for a given stimulus, p53 dynamics are heterogeneous in
individual cells. The number of p53 pulses, for example, is varying from cell to cell in
response to -irradiation (Lahav et al. 2004; Loewer et al. 2010; Loewer & Lahav 2011).
How exactly do cells integrate p53 dynamics and cellular state to make proper decisions
in response to a fixed stimulus?

Introduction
12
1.2 p21 is a main effector of p53 in the DNA damage response
1.2.1 p21 function and cell cycle
Cyclin-dependent kinase inhibitor 1A (CDKN1A, encoding p21), was identified as one of
downstream genes of p53 (El-Deiry et al. 1993). The best-understood function of p21 is
to regulate cell cycle progression. Loss of control of cell cycle in mammalian cells can cause
onset of tumorigenesis. Thus, cells have evolved multiple checkpoints to govern cell cycle
progression. On the molecular level, cell cycle transition from G1 phase to S phase and G2
phase to mitosis is regulated by activation and inactivation of cyclin-dependent kinase
(CDK) family of proteins, which are activated by binding to cyclins(Vermeulen,K.,Van
Bockstaele,D.R.,Berneman et al. 2003). As a CDK inhibitor, p21 is one of the checkpoint
regulators in cell cycle control. Induction of p21 by p53 upon DNA damage inhibits cyclin
E and CDK2 complex and thereby prevents G1-S transition (Figure 5) (Di Leonardo et al.
1994; Neganova et al. 2011). p21 can also potentially inhibit cyclin B1 and CDK1 complex
and lead to G2 arrest (Figure 5) (Charrier-Savournin et al. 2004; Bunz 1998). On the
contrary, a study in mouse embryonic fibroblasts suggested that p21 can promote
proliferation (Warfel & El-Deiry 2013). When increasing p21 by mitogen stimulation to a
level that is not sufficient to lead to cell cycle arrest, p21 was found to promote the
assembly of cyclin D-CDK4 complexes (Cheng 1999). These together suggest that p21
might have dual roles of either inhibiting cell growth or promoting proliferation
depending on its concentration in the nucleus.
In addition, p21 can bind to proliferating cell nuclear antigen (PCNA) through the PCNA-
interacting peptide box (PIP box) in p21 C-terminus (Havens & Walter 2009). Since p21
competes for binding to PCNA with other components, such as DNA polymerase- and -,
which are involved in DNA synthesis, it indirectly inhibit DNA replication (Karimian et al.
2016; Romanov & Rudolph 2016). Many other proteins having the PIP box structure are
probably affected by this competition and therefore cellular activities might also be
altered indirectly by expression of p21. For example, interference of PCNA-DNMT1 by p21
cause DNA repair inhibition (Mortusewicz et al. 2005).
Paradoxically, p21 is also involved in apoptosis. On one hand, p21 can inhibit apoptosis by
several potential mechanisms. For example, it binds and inhibits JNK1/SAPK kinase and
MAPK-kinase-kinase ASK1/MEKK5 and thereby suppress apoptosis (Huang et al. 2003).

Introduction
13
On the other hand, p21 was reported to promote apoptosis. It was shown to induce the
expression of genes that initiate apoptosis in human ovarian cancer cells in a p53-
independent manner (Wu et al. 2002). Other research showed that p21 can be cleaved by
caspase-3 and this leads to apoptosis of cancer cells (Zhang et al. 1999).
Figure 5 p21 has multiple functions
In summary, p21 can inhibit the activities of cyclin/CDK complex to cause cell cycle arrest.
Besides, p21 was also reported to inhibit DNA synthesis and DNA repair and to promote
apoptosis. However, these functions are still in debate and some of them are even contrary.
Considering the linking between dynamical features of p53 and various cellular outcomes,
it is logical to ask whether p21 dynamics control its complicated functions.
1.2.2 Multiple mechanisms mediate p21 degradation
Since p21 has multiple functions, its level in cells should be accurately regulated to
activate proper cellular responses. To achieve this, cells have developed multiple
mechanisms to degrade p21.
The first one is SCFSkp2, which can degrade p21 to promote cell cycle transitions. SCF
complexes are a subfamily of the cullin-RING ubiquitin ligase (CRL) superfamily (Petroski
& Deshaies 2005). SCFSkp2 is believed to be a major regulator of p21 (Starostina & Kipreos
2012). This complex can decrease p21 levels in late G1 phase and early S phase, which
upregulates cyclin/CDK activity to promote S phase entry (Li & Jin 2010). To accomplish
this, cells upregulate Skp2 levels in late G1 and early S phase by inactivation of APCCdh1 or
/ and disassociation of Skp2 and APCCdh1 through cyclin / CDK2 complexes which become

Introduction
14
active in late G1 phase (Bashir et al. 2004; Lukas & Bartek 2004; Rodier et al. 2008;
Guardavaccaro & Pagano 2006).
In addition to SCFSkp2, another member of CRL family, CRL4Cdt2 can mediate p21
degradation in S phase. A cell cycle specific factor, PCNA is involved in this process. During
S phase, PCNA forms foci on chromatin and this form of PCNA can bind to PIP box in p21
so that this complex is able to recruit CRL4Cdt2 to promote the ubiquitin-dependent
degradation of the complex (Abbas & Dutta 2011; Havens & Walter 2009).
APC/CCdc20, which is also an E3 ubiquitin ligase, can degrade proteins, including p21,
during mitosis to permit progression through mitosis. APC/CCdc20 becomes active during
mitosis and degrades p21 during prometaphase (Amador et al. 2007), which allows
activation of cyclin/CDK1 during mitosis ensuring subsequent mitosis (Starostina &
Kipreos 2012).
Mdm2 and MdmX can mediate ubiquitin-independent degradation of p21. Mdm2/MdmX
promote the degradation of p21 in G1 and early S phase by binding and bringing both p21
and the proteasome together (Jin et al. 2008). The 14-3-3 and C8 subunit of the 20S
proteasome are involved in Mdm2-mediated degradation (Wang et al. 2010), and this
degradation was reported to promote G1-S transition (Starostina & Kipreos 2012).
Besides, there are also other degradation mechanisms that are less well defined. An
interesting mechanism among them is p53-inducible RING-finger protein (p53RFP),
which can be induced by p53 and target p21 degradation in response to DNA damage (Ng
et al. 2003). But it is worth stressing that p53RFP only has a relatively modest effect on
p21 (Ng et al. 2003). Nevertheless, its activation by DNA damage was shown to decrease
the number of G1 arrested cells and promote apoptosis (Ng et al. 2003). However, p53RFP-
mediated degradation is still not well characterized and needs further investigation. The
E3 Makorin RING Finger Protein 1 (MKRN1) is another potential factor to mediate p21
degradation. In response to DNA damage, MKRN1 was shown to promote apoptosis by
decreasing p21 (Lee et al. 2009).
In DNA damage response, p53 is one of the most important key nodes and p21 is the key
effector of p53. After DNA damage, p53 is activated but its transcriptional activity is
determined by other factors, such as post-translational modifications and the cofactors

Introduction
15
required for transcription (Figure 1 and Figure 5), and these factors might be varying in
single cells, leading to different expression of p21 mRNA. Moreover, the protein level of
p21 is also controlled by multiple degradation mechanisms, some of which are dependent
of cell cycle phase. SCFSkp2 and Mdm2, for example, mediate p21 degradation in late G1
phase and early S phase whereas APC/CCdc20 drives the degradation of p21 during mitosis
(Starostina & Kipreos 2012). These together address the question how p21 responds to
DNA damage in single cells and whether it is affected by cellular state.
1.3 Methodology
1.3.1 Technical limitations on measuring endogenous dynamics
To measure p53 and p21 dynamics in live cells, I first need to create faithful fluorescent
reporters. The reliability of results is determined by the quality of fluorescent reporters.
Over recent years, transgenic reporters, which are usually created by randomly inserting
an artificially created construct in the genome of cell, were widely used to follow signals
of selected signaling proteins (Lahav et al. 2004; Tay et al. 2010; Cohen-Saidon et al. 2009).
However, severe limitations exist when using this technique (Figure 6). In detail, these
constructs may cause perturbation of the signaling network of interest because another
copy of a gene was introduced in the cells. The constructs may also miss important
elements, such as key regions of the promoter, untranslated regions and introns, makes it
difficult to capture the complex regulation of the selected protein. In addition, establishing
a stable transgenic reporter is also time-consuming due to the need for extensive
validation. The solution to these issues is to create endogenous reporters (Figure 6).

Introduction
16
Figure 6 Labelling endogenous genes in principle permits more accurate measurements
1.3.2 CRISPR/Cas9 technology
Tagging endogenous genes requires precisely cutting the target genomic loci to insert
exogenous DNA sequences. In recent years, a number of genome editing technologies have
emerged, including zinc-finger nucleases (ZFNs) (Miller et al. 2007), transcription
activator-like effector nucleases (TALENs) (Wood et al. 2011) and the RNA-guided
clustered regularly interspaced short palindromic repeats (CRISPR) / CRISPR associated
9 (Cas9) system (Mali, Aach, et al. 2013; Cong et al. 2013; Jinek et al. 2012; Jinek et al.
2013). The first two employ a strategy of coupling endonucleases with DNA-binding
proteins to induce DSBs at desired genomic loci. There are several potential
disadvantages, such as limited target sites, high off-target effects and costly construction
of DNA binding domains (Gupta & Musunuru 2014). By contrast, CRISPR/Cas9 system is
composed of a small single-guide RNA (sgRNA) and Cas9 endonuclease. The sgRNA
contains a constant trans-activating CRISPR RNA (tracrRNA) part which can bind to Cas9
and a CRISPR RNA (crRNA) part with ~20 nucleotides which can form heteroduplex with
target DNA through Watson-Crick base pairing (Figure 7A) (Jinek et al. 2013; Nishimasu
et al. 2014; Anders et al. 2014). Cas9 endonuclease recognizes protospacer adjacent motif
(PAM, 5’- NGG-3’ or 5’- NAG-3’)-proximal region on genomic DNA and tracrRNA part of
sgRNAs to form Cas9-sgRNA complex. This complex further recognizes target DNA
complementary to crRNA part of sgRNA and introduces double strand cleavage
(Nishimasu et al. 2014; Anders et al. 2014). Since sgRNAs have a small size and high
affinity to the DNA, this system has low cost and high efficiency (Sander & Joung 2014).
Cleavage of DNA will trigger two main DNA repair pathways, including nonhomologous
end joining (NHEJ) or homology-directed repair (HDR) (Ciccia & Elledge 2010). The
former is an error prone pathway, likely causing gene knockout by insertion or deletion
base pairs (Figure 7B). The HDR pathway will allow precise repair in presence of a repair
template (Figure 7B). Taking advantage of HDR, one can precisely edit genomic DNA by
combining a well-designed repair template with CRISPR/Cas9. Therefore, I first proposed
to adapt this technique to establish a platform for creating endogenous reporters.

Introduction
17
Figure 7 CRISPR/Cas9 based genome editing (F Ann Ran et al. 2013) Figure A is slightly modified, crRNA
is colored blue and green; tracrRNA is colored red.
1.4 Aims of this thesis
Cellular and molecular behaviors are observed heterogeneous in genetically identical cells
(Loewer & Lahav 2011; Spencer et al. 2009; Pelkmans 2012; Snijder & Pelkmans 2011).
Cellular state (such as cell cycle phase), microenvironment and stochastic fluctuations are
the main origins leading to cell-to-cell variations (Loewer & Lahav 2011). To characterize
the influence of these factors and to study the molecular mechanisms behind will improve
the understanding of signaling network and allow us to predict cellular behaviors. In my
thesis, I aimed to study how cellular state influences cell responses to DNA damage. To

Introduction
18
reduce the complexity, all live-cell imaging experiments were performed in a single cell
line, human mammary epithelial cell MCF10A and upon a single stimulus, -irradiation-
induced double strand DNA damage. During DNA damage response, p53-mediated p21
induction plays an important role in cell cycle regulation and protein level of p21 can be
regulated by multiple factors, some of which are cell cycle related (Figure 5 and Figure 8).
To fully understand how and at what states complexities of factors control p21 level, a
quantitative measurement of endogenous levels is required. CRISPR/Cas9 technology
provides the possibility to endogenously label both p53 and p21 and thereby could allow
quantifying their dynamics in combination with time-lapse microscopy. In summary, to
approach the aim of my thesis, three specific questions were addressed:
1) Do fluorescent reporters generated by CRISPR/Cas9 faithfully reflect the endogenous
protein levels?
2) How do endogenous p53 and p21 respond to DNA damage in single cells?
3) Do cellular states influence p53-p21 dynamics?
Figure 8 How does cellular state influence p53-p21 dynamics and cellular outcomes in response to
DSBs? During DNA damage response, p53 is activated and induces the expression of CDK1NA, which

Introduction
19
encodes p21 to mediate cell cycle arrest and other cellular outcomes. p21 levels are controlled by many
factors, such as the transcription regulations and post-translational regulations, which might depend on
cellular state.

20
2 Results
2.1 Establishment of CRISPR/Cas9 based technology to generate endogenous
fluorescent reporters
2.1.1 Technical concept of CRISPR-Cas9-based knockin
As a start, I first developed a strategy to create fluorescent reporters using CRISPR/Cas9
technology. As shown in Figure 9 for a given target of interest, the stop codon-containing
exon will be targeted to create C-terminal fusion proteins. Guide RNA then will be
designed to cut at or around stop codon together with Cas9. This will create double strand
DNA breaks and trigger DNA repair pathways including non-homologous end joining
(NHEJ) and homology directed repair (HDR), the latter of which will allow precise genetic
modification in presence of a donor DNA. Design of donor DNA will be a key to achieve
functional reporter. The exogenous fragment has to be in front of endogenous stop codon,
ensuring that it is part of the open reading frame of the target. This can be achieved by
flanking the insertion fragments with two homologous arms (HAL and HAR), which are
separately identical to genomic sequences in front of and after stop codon (include stop
codon). The coding sequence of a fluorescent protein is present right after the left
homologous arm (HAL), followed by a selection element consisting of two Loxp
sequences, a self-cleavage peptide (P2A) and neomycin resistance gene. After G418
selection, only precisely-engineered cells survive because the random insertions unlikely
have the resistance due to the low chance of being inserted after a functional promoter.
The selection marker then turns to be a redundancy and may influence mRNA activity, so
Cre-recombinase will be delivered into cells to remove it, leaving a fluorescent gene and a
remaining loxp sequence (34 bps) in front of stop codon. The whole protocol allows
inserting necessary and minimal sequences in order to fluorescently tag endogenous
genes.

Results
21
Figure 9 Conceptual framework of CRISPR-Cas9-mediated knockin Blue boxes represent the exons, between which are introns. Stop codon is indicated by a narrow box in black.
HAL: the left homologous arm; HAR: the right homologous arm; FP: the gene encoding fluorescent protein;
P2A: a self-cleavage peptide; Neo: neomycin resistance gene; 3’UTR: 3-untranslated region.
2.1.2 CRISPR-Cas9 enables genome editing
To test the strategy developed above, I chose the p53 locus to conduct proof-of-concept
experiments. First, three sgRNAs were designed to target human p53 (Figure 10A). There
were three approaches to deliver Cas9 and sgRNAs reported in the beginning (F Ann Ran
et al. 2013; F. Ann Ran et al. 2013). First, sgRNA and Cas9 were transfected in separate
plasmids, named two vector system (2-Vec.); second, Cas9 was delivered in plasmid and
sgRNA was delivered as a PCR product, named PCR system (PCR); third, Cas9 and sgRNA
was integrated into a single vector, called one-vector system (1-Vec.). I experimentally
tested all three approaches on a same target (p53-T5) in HEK293 and quantified the
cleavage efficiency by T7 endonuclease I assay (Figure 10B) (White et al. 1997). The
results showed that the two-vector system had equal efficiency to one-vector system (both
induced about 50% indel formation) and PCR system was significantly inefficient (Figure
10C). Considering that two-vector system had more flexibility to adapt other versions of
Cas9, I chose this system as a standard to deliver CRISPR/Cas9 constructs in all further
experiments.

Results
22
Usually, a target region can have several potential target sites such T5, T8 and T14 at the
p53 locus (Figure 10A). As these sequences may provide different affinities for
corresponding sgRNAs, they could potential results in varying efficiencies of DNA
cleavage. To test this, I separately transfected three sgRNAs together with Cas9 in HEK293
and observed that sgRNA_p53-T5 induced most mutations, and the other two showed
significantly lower efficiency (Figure 10D). In addition, Cas9 was replaced with a nickase
version (Cas9n) of Cas9, which can generate sticky DNA breaks when coupling with a pair
of sgRNAs, such as T5 & T8 and T5 & T14 (double nicking, Figure 11A). Cas9n showed low
level of indel formation (insertions or deletions) (Figure 10D). Together, these results
suggested that cleavage efficiency is guide-specific and double nicking performance is
determined by the sgRNA of low efficiency.
To determine if the efficiency of sgRNAs is cell line specific, I performed the T7
endonuclease I assay in MCF10A cells, but no clear mutation was observed. This could be
due to the highly inefficient transfection in MCF10A (40% at highest comparing to 100%
in HEK293), which resulted in much less expression of both sgRNAs and Cas9. I thus
turned to evaluating the efficiency by examining colony formation (Figure 10E). In brief,
constructs including donor DNA and CRISPR/Cas9 were co-transfected in MCF10A. About
two weeks after selection with G418, cell colonies emerged and colony number was
counted as the indication of insertion efficiency. The sgRNA_p53-T5 generated about 200
colonies with Cas9 while sgRNA_p53-T14 generated only about 30 colonies (Figure 10F).
Additionally, Cas9n with a pair of sgRNAs (T5 & T14) showed low efficiency of about 50
colonies. These agreed with the measures of cleavage efficiency in HEK293, suggesting
that sgRNA efficiency may be cell line independent. Moreover, increasing the number of
sgRNAs transfected appeared to increase the insertion efficiency (up to 250 colonies when
using T5 & T14 and up to about 300 colonies when using all three sgRNAs).
Taken together, I showed that CRISPR/Cas9 induced DNA cleavage at the p53 locus in
HEK293 using T7 endonuclease I assay. Efficiency tests of sgRNAs suggested that the
cleavage frequency was sequence-specific. I further showed that CRISPR/Cas9 was able
to initiate HDR-mediated insertion of fluorescent protein coding sequences in MCF10A
cells. However, the success rate of targeted insertions needs to be investigated further.

Results
23
Figure 10 CRISPR/Cas9 was able to precisely edit genome DNA (A) Schematic demonstration of three sgRNAs targeting human p53 around stop codon. Red and blue lines
indicate the PAM regions and guide sequences respectively. (B) T7 endonuclease I assay is able to detect DNA mutations created by CRISPR/Cas9. Given a population of
mutated (MU) and wild type (WT) cells, genomic DNA amplification yields a mix of PCR products.
Denaturing and re-annealing this mixture lead to mismatched double strand DNA. The sites of mismatches
are recognized and cut by T7 endonuclease I, resulting in two shorter DNA strands, which are visible on
DNA gel. More mutations lead to higher frequency of mismatching so that more DNA will be cut by T7
endonuclease I. Therefore, the cleavage efficiency could be quantified by measuring the intensities of bands
(F Ann Ran et al. 2013).

Results
24
(C) Cleavage efficiency of three ways to deliver CRISPR-Cas9 construct were tested in HEK293. First, sgRNA
and Cas9 were delivered in separate plasmids, named two vector system (2-Vec.); second, Cas9 plasmid and
sgRNA which was amplified by PCR instead were co-transfected, named PCR system (PCR); third, Cas9 and
sgRNA was integrated into a single vector, called one-vector system (1-Vec.). As controls, non-transfected
HEK293 cells (Con) and Cas9/sgRNA_AL (empty vector without guide sequences) co-transfected HEK293
cells (Cas9) were included. After three days, cells were harvested and T7 endonuclease I assay was
performed to quantify the cleavage efficiency. Three technical replicates were performed for each condition,
except for Cas9 group.
(D) Different guide sequences showed different cleavage efficiency. HEK293 cells were transfected with
indicated combinations of plasmids and harvested after three days. Then T7 endonuclease I assay was
performed to quantify the cleavage efficiency.
(E) Integration efficiency was examined in MCF10A cells by measuring colony formation. CRISPR/Cas9
plasmids were co-transfected together with p53 donor DNA harboring neomycin resistance gene in MCF10A
cells. After three-day incubation, cells were selected in G418 containing medium. After another 14 days,
colonies of engineered cells emerged. The colony number indicates the integration efficiency.
(F) Statistical results of the colony counts. w/o donor: Cas9/sgRNA_p53-T5; w/o sgRNA: donor
DNA/Cas9/sgRNA_AL; WT5: donor DNA/Cas9/sgRNA_p53-T5; WT14: donor DNA/Cas9/sgRNA_p53-T14;
DN5-14: donor DNA/Cas9n/sgRNA_p53-T5/ sgRNA_p53-T14; WT5-14: donor DNA/Cas9/sgRNA_p53-T5/
sgRNA_p53-T14; WT5-8-14: donor DNA/Cas9/sgRNA_p53-T5/sgRNA_p53-T8/sgRNA_p53-T14.
2.1.3 Insertion frequency is increased by optimizing cleavage efficiency
In the previous section, genome editing in MCF10A resulted in significantly different
colony numbers depending on the strategy (Figure 10F), including Cas9 with a single
sgRNA (WT5), a nickase version of Cas9 (Cas9n) with a pair of sgRNAs (DN5-14) and Cas9
with multiple sgRNAs (WT5-14) (Figure 11A). To determine the genotypes of the resulting
colonies, two genomic PCRs were performed for each single cell-derived clone (Figure
11B). First, a pair of primers binding upstream of left arm and fluorescent gene was used
to screen for insertions at the targeted locus (PCR1). To determine insertion copies
(heterozygous or homozygous), second round PCR (PCR2) was performed using primers
binding to genomic regions outside of homologous arms. The PCR results showed that
colonies from WT5-14 all had correct insertions, and about 20% of them were
homozygotes (Figure 11C). DN5-14 showed the lowest efficiency, with 20% of colonies
being negative and the rest being heterozygous (Figure 11C). Efficiency of WT5 was
between these two. These results suggested that the rate of positive insertions correlated
to the insertion efficiency evaluated by colony number.
During screening, lower bands in PCR2 were not always of identical size, for example in
clone 8 and clone 9 in Figure 11B. This indicated that the non-tagged alleles might have
been altered. Sanger sequencing of these bands confirmed that mutations frequently
happened on the non-tagged allele of heterozygotes (Figure 11D and E). 90% of the

Results
25
heterozygotes generated by WT5 had mutations on the non-tagged allele. Interestingly,
the most efficient strategy, WT5-14, showed the lowest mutation frequency. And no
mutations in heterozygotes were detected using the double nicking strategy DN5-14.
In summary, multiple sgRNAs (WT5-14) were able to improve insertion efficiency and
reduce the mutation frequency in heterozygotes, but the off-target sites were also
increased. Double nicking strategy (DN5-14) in principle is able to minimize the off-target
effect, but insertion efficiency is also lowered. Nonetheless, this strategy is ideal for
establishing heterozygous knockins, since the mutations on the non-tagged allele
happened much less frequently than others.

Results
26
Figure 11 Three different strategies were tested (A) Schematic demonstration of three strategies. WT5, uses wild type Cas9 and a single sgRNA (sgNRA_p53-
T5) to cut DNA and induce blunt DNA breaks; DN5-14, called Double Nicking strategy, combines a mutated
"nickase" version of the Cas9 and a pair of sgRNAs (sgNRA_p53-T5 and sgNRA_p53-T14). This strategy could
theoretically decrease the potential off-target effects. WT5-14, uses wild type Cas9 and multiple sgRNAs
(sgNRA_p53-T5 and sgNRA_p53-T14) to increase the cleavage chance. (B) Two genomic PCRs were performed to screen the genotypes of clones. Three primers, 1, 2 and 3 were
designed to bind in upstream of the left homologous arm, downstream of the right homologous arm and
fluorescent gene. The gel pictures here are examples from an experiment (WT5). Integration of exogenous
fragments can be identified by PCR1 using primer 1 and primer 3. Homozygous knockins show a single band
of bigger size from PCR2 using primer 1 and primer 2 (pink arrow), while heterozygous knockins show two
bands (blue arrow). (C) Insertion efficiency was different among these three strategies. Cells were transfected and clones from
each strategy were examined using genomic PCRs. (D) Mutations happened frequently in the non-tagged alleles in heterozygous knockins. The lower band in

Results
27
PCR2, which is the second allele in heterozygotes, was sent for Sanger sequencing. Normal sequence
represents the un-mutated p53 locus. Red arrow pointed the cut site of sgRNA_p53-T5. Cut site of
sgRNA_p53-T14 is about 60 bps downstream of stop codon. Red dot means deleted bps, the blue and red
letters represent the incorrect repair. Number of corresponding genotypes was listed on the rightest
column.
(E) Quantification of mutations in non-tagged alleles. Normal alleles represent the wild type p53 sequence;
mutated alleles comprise all undesired alterations in the second allele in heterozygous knockins.
2.1.4 Length of homology regions in repair template determines the insertion
efficiency
After cleavage, cells repair DNA breaks using the exogenous donor as a template in the
HDR pathway. Therefore, the design of donor DNA may also have impact on the insertion
efficiency. Especially, the length of homologous arms may be a key factor. Theoretically,
longer homologous arms are more advantageous for insertions. However, it also means
more difficulty for cloning donor DNA. To identify the optimal length, I examined colony
formations using donor DNA with homology arm lengths ranging from 70 bps to 1300
bps. As expected, insertion efficiency increased with the lengths of the homology (Figure
12). 70-bp homologous arms were sufficient to lead to 50% positive colonies. The
efficiency increased to about 100% with homologous arms as long as 1300 bps. In
addition, homozygous insertions started to emerge with 410-bp homologies.
Figure 12 Lengths of homologous arms in the donor DNA influence the insertion efficiency
Donor DNA with various arm lengths was amplified by PCR. In details, I used the aforementioned plasmid
(~1300 bp in the figure) as a PCR template and designed primers binding on different regions in
homologous arms to get a list of donor DNA of different arm lengths. Then I separately co-transfected these
donor DNA with CRISPR/Cas9 and sgRNA_p53-T5 in MCF10A. After selection, clones formed and were
examined by genomic PCR (Figure 11B). Blue bars represent heterozygous knockins and yellow bars
represent homozygous knockins. Together they indicate the positive rate in the examined clones.

Results
28
2.1.5 Off-target effects are not detected
Cas9 tolerates non-perfect matches between genomic DNA and guide sequence of sgRNA,
resulting in cleavage on unwanted sites. This off-target effect was reported in a number of
publications (Lin et al. 2014; Cho et al. 2014; Fu et al. 2013). It has potential influence on
the p53 signaling pathway or cellular activities. To examine off-target risk, I randomly
selected 11 clones and checked the four most-likely off-target sites by Sanger sequencing.
Wild type Cas9 and sgRNA_p53-T5 were used in this test and off-target sites were
identified using CRISPR Design tool (http://crispr.mit.edu). The first four sites of highest
off-target score were chosen (Figure 13A). I amplified the corresponding regions by PCR
and sequenced the product. Once mutations happened, the readouts of Sanger sequencing
from a single clone will be a mixture of two different sequences with overlapping peaks in
the chromatogram. However, each examined off-target site showed only one sequence of
high quality in 11 clones (Figure 13B), indicating that off-target frequencies were below
9.1%.
Figure 13 Off-target effects were not observed among 11 clones (A) Four off-target sites of high risk were examined. sgRNA_p53-T5 was chosen to test the off-target effects.
Off-target 1 has two mismatches to the target site (p53-T5), and the other have three mismatches. (B) Sanger sequencing results among 11 single cell-derived clones. For each off-targets, the Sanger
sequencing results were overlapped, which clearly showed that no a single mutation was detected for four
off-targets among 11 clones.
Results
29
2.2 Establishing a combined reporter to monitor p53 and p21 dynamics
In the previous chapter, I showed that CRISPR/Cas9 technology is a robust tool to create
endogenous fluorescent reporters. Technically, the fluorescent intensity only reflects the
level of fluorescently tagged protein. Can the measured signals faithfully indicate the
endogenous level of target protein? Moreover, does this engineering perturb the p53
signaling network? To answer these questions, I performed western blot and
immunofluorescent staining in order to examine p53 level and its activity. In addition, I
also conducted flow cytometry-based cell cycle assay to investigate if cell fate decisions
are altered after damage in engineered cells.
2.2.1 Tagging a single allele is sufficient to monitor p53 dynamics
I first created a cell line expressing cbx5-mCerulean (cbx5-C/-C), previously described as a
nuclear maker for tracking cells in live-cell imaging (Cohen-Saidon et al. 2009). CBX5 gene
encodes chromobox protein homolog 5 (cbx5 or HP1) as non-histone protein part of the
heterochromatin family (Ye & Worman 1996). During cloning p53-mVenus reporter cells,
a number of clones were obtained, including heterozygous clones and homozygous clones
(Figure 11B). In principle, all copies of p53 were tagged in the homozygotes, ensuring that
the fluorescent intensity was a precise meter of p53 level. However, if the exogenous
fluorescent protein has an effect on p53 function, homozygous cells would lose
corresponding cellular activities, while these activities would be at least partially retained
in heterozygotes. However, the heterozygous reporters also have some potential
problems. Especially, the fidelity was unclear since p53 expression from each allele may
be unequal. To address these questions, I established two reporters, p53-Y/-R / cbx5-C/-C
and p53-Y/-null / cbx5-C/-C. The former one had both p53 alleles tagged with either mCherry
or mVenus (Figure 14A),and the other one had a single allele tagged with mVenus
(Figure 14B). In response to DNA damage, the double-tagged cells showed very similar
RFP and YFP signals over time comparing to the single-tagged cells (Figure 14C and D),
and both signals were highly correlated (Pearson correlation coefficient larger than 0.89)
in hundreds of cells at different time points (Figure 14E). This provided strong evidence
that p53 expression was not allele specific in MCF10A cells. So to tag a single allele is
sufficient to monitor protein dynamics. In further experiments, I found that growth of
double-tagged cells was slower and the efficiency of further genome engineering dropped
down in a p53 homozygous cell line (two to fifty colonies in p53 heterozygous cells),

Results
30
indicating that some undetected factors had been altered in homozygotes. Considering
these, heterozygous reporters were preferred in the next experiments.
Figure 14 Tagging a single allele is sufficient to monitor p53 dynamics (A) Schematic demonstration of p53-Y/-R / cbx5-C/-C cells. Both alleles of p53 were tagged with mVenus (YFP)
and mCherry (RFP) to visualize allele-specific p53. 5’UTR and 3’UTR represent the untranslated regions on
5- and 3-end. YFP, RFP and CFP indicate mVenus, mCherry and Cerulean, respectively. CBX5 encodes
Chromobox Protein Homolog 5, regarded as a nuclear marker in my project. (B) Schematic demonstration of p53-Y/-null / cbx5-C/-C cells. Only a single allele of p53 was tagged with
mVenus. ‘-null’ represents the unmodified p53 allele and underlines no indel formation on it. (C) Time-resolved analysis of p53 levels in a single p53-Y/-R / cbx5-C/-C cell upon damage induction. p53
network was activated using 10 Gy -irradiation. Allele-specific p53 was monitored with two channels. The resulting dynamics were highly correlated between two alleles. (D) Time-resolved analysis of p53 levels in a single p53-Y/-null / cbx5-C/-C cell upon damage induction. Only
tagged allele showed p53 oscillation after -irradiation (10 Gy). An empty background was recorded in other
channel as control. (E) Signals from both alleles were quantified in single cells at selected time points. Each dot represents a
cell. p53-mVenus represents the signals measured from YFP channel and p53-mCherry represents the
signals from RFP channel.

Results
31
2.2.2 Fluorescent reporter faithfully reflects endogenous p53 level
The fusion protein, p53-mVenus, is a combination of p53 and fluorescent protein of about
27 kDa, which may influence normal activities of p53, such as production, degradation
and movement. To test this experimentally, I examined by immunofluorescent staining
whether the levels of the fusion protein and wild type p53 were comparable. Both p53-Y/-
null / cbx5-C/-C cells (clone 21, indicated as PC21) and wild type MCF10A cells were treated
with neocarcinostatin (NCS, 400 ng/ml), a radiomimetic drug which can damage DNA and
activate p53. At several time points, p53-mVenus was compared to the total p53 in cells
(including wild type p53 and p53-mVenus), which was evaluated by immunofluorescence.
5 hours after DNA damage, p53-Y/-null / cbx5-C/-C cells showed varying p53 levels in nuclei,
which were observed from both fusion protein and antibody staining (Figure 15A top
panel). Most importantly, signal intensities from both were highly correlated in single
cells. Also, wild type cells did not show any signals from YFP channel (Figure 15A bottom
panel), proving that measurement of the fusion protein is independent to
immunofluorescence. Next, I quantified the intensities of each cell and evaluated the
correlation using Pearson correlation coefficient in order to statistically investigate the
fidelity of the fluorescent reporter. Five thousand cells were sampled for both cell lines at
each time point. The fusion protein showed high correlation (Pearson correlation
coefficients were all larger than 0.83 ) to total p53 levels at all time (Figure 15B),
suggesting that the fusion protein faithfully reflects endogenous p53 level.

Results
32
Figure 15 Endogenous fluorescent reporter faithfully reflects p53 level (A) Representative images of p53 signals obtained by immunofluorescent staining and reporter protein.
Wild type MCF10A and p53-mVenus cells were treated with NCS (400 ng/ml). At selected time points, cells
were fixed and stained with anti-p53 primary antibody followed by Alexa Fluor 594 conjugated secondary
antibody. Nuclei were stained by Hoechst. (B) Single cell quantification of p53 signals at selected time points. The intensity of signals captured from
two channels (Cy5 and YFP) were quantified. p53 represents the signals obtained by antibody conjugation, and p53-mVenus represents the signals from mVenus tagged p53. 5000 cells were randomly sampled at
each time point and Pearson correlation coefficients were calculated.
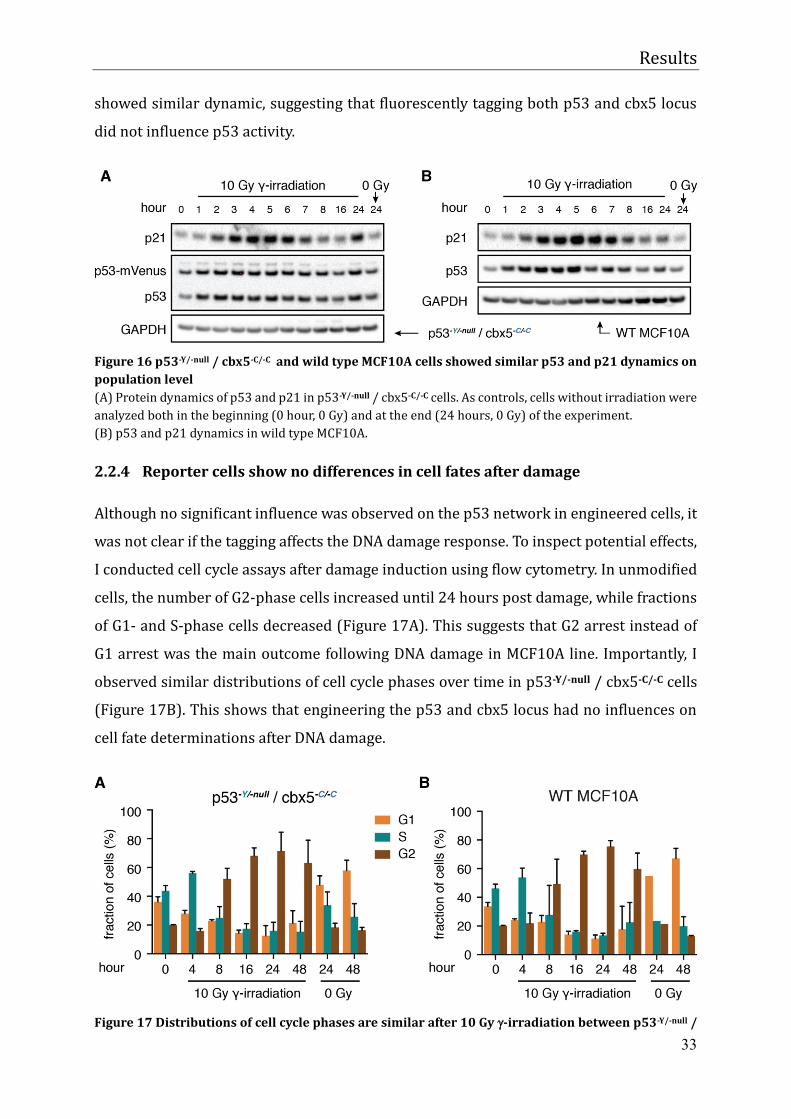
2.2.3 Reporter cells show unaltered p53 responses to DNA damage
To examine if the fusion protein influenced the p53 network, I exposed cells to 10 Gy -irradiation and measured protein levels of p53 and p21 over time by western blot. As
shown in Figure 16B, p53 increased immediately after damage, reached the peak level at
5 hours and went down to basal level after 16 hours in wild type MCF10A. To assess its
activity, its target gene p21 was measured as well. The response faithfully followed p53
dynamics with 1~2 hours’ delay as expected (Loewer et al. 2010). In p53-Y/-null / cbx5-C/-C
cells, wild type p53 and p53-mVenus were both detected and showed nearly equal protein
levels. They together showed similar dynamic to wild type MCF10A. Importantly, p21
Results
33
showed similar dynamic, suggesting that fluorescently tagging both p53 and cbx5 locus
did not influence p53 activity.
Figure 16 p53-Y/-null / cbx5-C/-C and wild type MCF10A cells showed similar p53 and p21 dynamics on
population level (A) Protein dynamics of p53 and p21 in p53-Y/-null / cbx5-C/-C cells. As controls, cells without irradiation were
analyzed both in the beginning (0 hour, 0 Gy) and at the end (24 hours, 0 Gy) of the experiment. (B) p53 and p21 dynamics in wild type MCF10A.
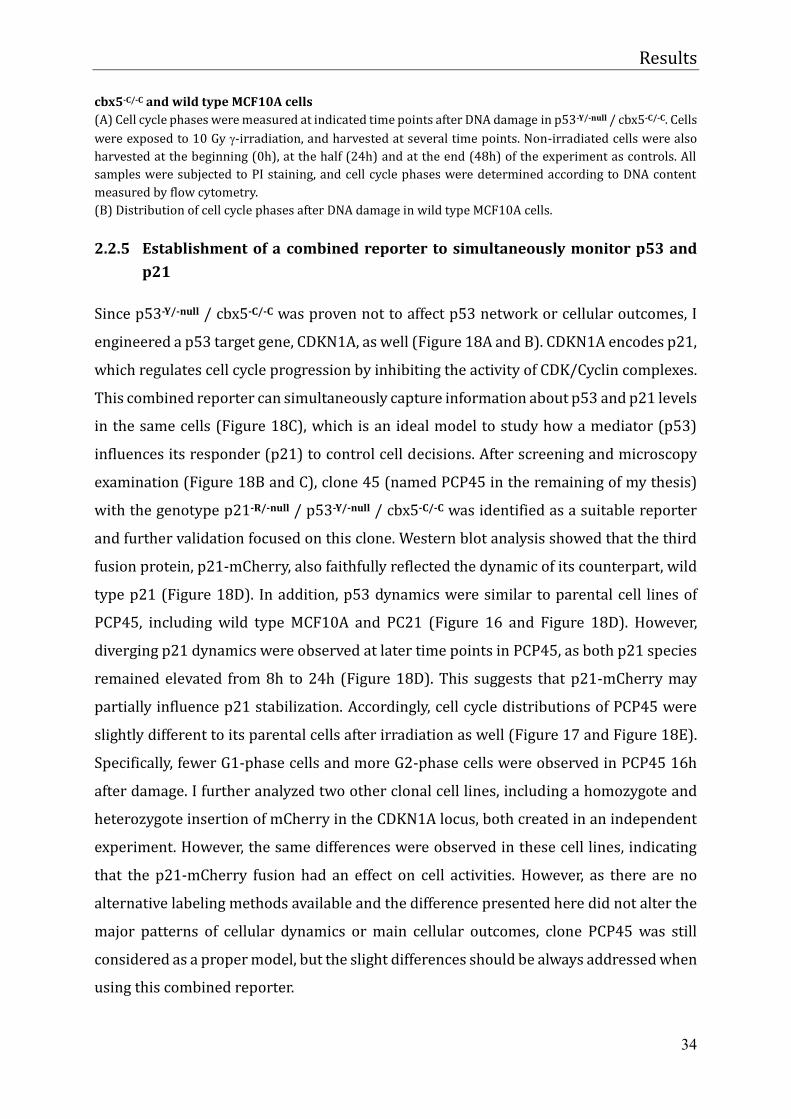
2.2.4 Reporter cells show no differences in cell fates after damage
Although no significant influence was observed on the p53 network in engineered cells, it
was not clear if the tagging affects the DNA damage response. To inspect potential effects,
I conducted cell cycle assays after damage induction using flow cytometry. In unmodified
cells, the number of G2-phase cells increased until 24 hours post damage, while fractions
of G1- and S-phase cells decreased (Figure 17A). This suggests that G2 arrest instead of
G1 arrest was the main outcome following DNA damage in MCF10A line. Importantly, I
observed similar distributions of cell cycle phases over time in p53-Y/-null / cbx5-C/-C cells
(Figure 17B). This shows that engineering the p53 and cbx5 locus had no influences on
cell fate determinations after DNA damage.
Figure 17 Distributions of cell cycle phases are similar after 10 Gy -irradiation between p53-Y/-null /
Results
34
cbx5-C/-C and wild type MCF10A cells
(A) Cell cycle phases were measured at indicated time points after DNA damage in p53-Y/-null / cbx5-C/-C. Cells
were exposed to 10 Gy -irradiation, and harvested at several time points. Non-irradiated cells were also
harvested at the beginning (0h), at the half (24h) and at the end (48h) of the experiment as controls. All
samples were subjected to PI staining, and cell cycle phases were determined according to DNA content
measured by flow cytometry.
(B) Distribution of cell cycle phases after DNA damage in wild type MCF10A cells.
2.2.5 Establishment of a combined reporter to simultaneously monitor p53 and
p21
Since p53-Y/-null / cbx5-C/-C was proven not to affect p53 network or cellular outcomes, I
engineered a p53 target gene, CDKN1A, as well (Figure 18A and B). CDKN1A encodes p21,
which regulates cell cycle progression by inhibiting the activity of CDK/Cyclin complexes.
This combined reporter can simultaneously capture information about p53 and p21 levels
in the same cells (Figure 18C), which is an ideal model to study how a mediator (p53)
influences its responder (p21) to control cell decisions. After screening and microscopy
examination (Figure 18B and C), clone 45 (named PCP45 in the remaining of my thesis)
with the genotype p21-R/-null / p53-Y/-null / cbx5-C/-C was identified as a suitable reporter
and further validation focused on this clone. Western blot analysis showed that the third
fusion protein, p21-mCherry, also faithfully reflected the dynamic of its counterpart, wild
type p21 (Figure 18D). In addition, p53 dynamics were similar to parental cell lines of
PCP45, including wild type MCF10A and PC21 (Figure 16 and Figure 18D). However,
diverging p21 dynamics were observed at later time points in PCP45, as both p21 species
remained elevated from 8h to 24h (Figure 18D). This suggests that p21-mCherry may
partially influence p21 stabilization. Accordingly, cell cycle distributions of PCP45 were
slightly different to its parental cells after irradiation as well (Figure 17 and Figure 18E).
Specifically, fewer G1-phase cells and more G2-phase cells were observed in PCP45 16h
after damage. I further analyzed two other clonal cell lines, including a homozygote and
heterozygote insertion of mCherry in the CDKN1A locus, both created in an independent
experiment. However, the same differences were observed in these cell lines, indicating
that the p21-mCherry fusion had an effect on cell activities. However, as there are no
alternative labeling methods available and the difference presented here did not alter the
major patterns of cellular dynamics or main cellular outcomes, clone PCP45 was still
considered as a proper model, but the slight differences should be always addressed when
using this combined reporter.

Results
35
Figure 18 Establish p21-R/-null / p53-Y/-null / cbx5-C/-C reporter cells (A) Schematic illustration of p21-R/-null / p53-Y/-null / cbx5-C/-C reporter cells. ‘-null’ represents un-changed
alleles in heterozygous knockins. 5’UTR and 3’UTR represent the untranslated regions on 5- and 3-end. YFP,
RFP and CFP respectively indicate mVenus, mCherry and Cerulean. CBX5 encodes Chromobox Protein
Homolog 5, regarded as a nuclear marker in my project. (B) Validation of genotype by genomic PCR. WT, PC21 and PCP45 indicate parental MCF10A (wild type),
p53-Y/-null / cbx5-C/-C (clone 21), and p21-R/-null / p53-Y/-null / cbx5-C/-C (clone 45). RFP indicates the PCR
product amplified using primer 1 and primer 3 for p21 locus (Figure 11B). Fragments representing p21-
mCherry and wild type p21 are indicated. (C) Fluorescent signals of three fusion proteins. PCP45 cells were irradiated with 5 Gy X-ray and expression
of the fusion proteins was examined by microscopy. (D) Population levels of p53 and p21 were examined after irradiation in PCP45 cells by western blot. The
fusion protein, p21-mCherry had comparable level to p21, which was produced from the other allele.
Comparing to p53-Y/-null / cbx5-C/-C and wild type MCF10A cells, PCP45 cells showed similar p53 and p21
dynamics (Figure 16). (E) Cell cycle phases were measured after DNA damage in PCP45 cells. Experiment was performed together
with p53-Y/-null / cbx5-C/-C and wild type MCF10A cells (Figure 17).

Results
36
2.3 Cell specific degradation leads to cellular heterogeneity in the DNA damage
response
In the previous chapter, I observed heterogeneous cellular responses to DNA damage:
while most cells arrested in G2 phase of the cell cycle, some cells remained in G1 and S-
phase even after high amounts of DSBs (Figure 17). On the molecular level, DNA damage
triggers the p53 network to induce the transactivation of p21 causing cell cycle arrest in
G1 and G2. This has been well defined in many studies (Besson et al. 2008). However,
population analyses employed in these studies usually emphasized the predominant
phenotypes, such as G2 arrest, but neglected diverging responses of small sub-
populations. Consequently, very little is known about heterogeneous cellular responses to
DNA damage. In this chapter, I combined time-lapse microscopy and computational
analysis to investigate at single cell level how p21 dynamics are shaped under p53
regulation and how they modulate cellular outcomes.
2.3.1 Cells exhibit heterogeneity in response to DNA damage
To examine the dynamical behavior of endogenous p53 and p21 in response to DNA
damage, p21-R/-null / p53-Y/-null / cbx5-C/-C (PCP45) cells were first imaged under normal
condition for about 20 hours to determine the basal state. Then they were subject to X-ray
irradiation of a series of doses, ranging from 0 Gy to 10 Gy. Immediately following was
time-lapse imaging for another 24 hours. This experimental setting allowed not only
monitoring of basal state of p53 and p21 before damage but also tracking of p53 and p21
responses after DNA damage.
Under basal conditions, cell showed highly non-uniform behavior. Some cells accumulated
both p53 and p21 in nuclei. Other cells showed only p53 signals. In addition, there were
also many cells without detectable p53 and p21 (Figure 19A). Upon DNA damage induced
by 5 Gy X-ray irradiation, p53 levels immediately started to rise and reached the peak
levels at about 4 hours post-irradiation, followed by further repeated p53 pulses.
Interestingly, p21 responses appeared to be more heterogeneous than p53. After
activation of p53, some cells accumulated p21 immediately, while others showed a clear
delay of p21 upregulation (Figure 19A).

Results
37
The question arises whether the diverse responses are determined by intrinsic properties
of the cells or related to threshold effects which would lead to cell-to-cell variability when
the stimulus is weaker than maximal activation level of the signaling pathways (Jeschke
et al. 2013). To test it, cells were imaged after exposure to X-ray of various doses, including
0 Gy, 1 Gy - a low dose, 5Gy - a high dose and 10 Gy - an excessive dose. Median protein
levels of all conditions were analyzed to identify dose-independent phenomena (Figure
19B). I observed that p53 was activated immediately after damage, and population level
of p21 also increased in a few hours after p53 activation. Peak levels of p53 and p21 both
increased with doses. p53 levels were distributed in a narrow range which agrees with
previous observations on transgenic reporters (Finzel et al. 2016). More interestingly, the
distributions of p21 were highly varying in a dose independent manner (Figure 19B). To
quantify the diversity, the standard deviations of p53 and p21 levels were computed at all
time points and it confirmed that p21 levels were highly diverse and p53 levels were
relatively homogeneous after high irradiation doses (Figure 19C). These results suggested
that the cell-to-cell variability is not caused by diversity of stimulus levels or signaling
sensitivity. To better control input/damage levels, I used 5 Gy irradiation as standard
stimulus for the following experiments. As expected, median levels observed in time-lapse
microscopy were in line with western blotting results shown in the previous chapter
(Figure 16 and Figure 18D).
Finally, to check the reproducibility, I performed three independent experiments and
investigated the variability of p21 level for each. All experiments consistently showed
heterogeneous p21 responses and homogeneous p53 levels (Figure 19D). Therefore, I
draw the conclusion that upon DNA damage, the population level of p21 increased
following p53 activation and that the p21 response appeared to be more heterogeneous
than the p53 response across individual cells.

Results
38
Figure 19 Cells show heterogeneous responses following DNA damage (A) Example images from live-cell microscopy at selected time points. Cells were imaged under unstressed
conditions for about 20 hours, exposed to 5 Gy and monitored for additional 24h. Two colored arrows
indicate cells with heterogeneous p21 responses. (B) p53 and p21 responses to varying irradiation doses. Protein levels of p53 and p21 in a population of
cells are represented by colored ribbons. The upper and lower edges of the ribbons represent 75th and 25th
percentiles, respectively. Bold lines represent median levels. p53 and p21 are indicated by the green and
purple. Protein levels correspond to calibrated fluorescent intensities. The indicated number of cells were
tracked and analyzed for conditions. Blue vertical lines indicate time of irradiation. (C) High irradiation doses generate highly diverse p21 responses. As a measure of dispersion, standard
deviations of p53 and p21 levels at all time points are shown. SD: standard deviation. (D) Standard deviations of p53 and p21 levels from three biological replicates.
Results
39
2.3.2 X-ray irradiation induces homogeneous p53 dynamics but heterogeneous
p21 dynamics
In order to further understand how individual cell behaves, the single cell trajectories
were extracted and examined. Under non-stressed condition, p53 showed spontaneous
pulses in most of the cells, while just a few cells accumulated p21 to the p53 fluctuation
(Figure 20A). This is in line with previous publications (Loewer et al. 2010), which has
reported that the transient p53 fluctuation is not able to induce expression of its targets
in absence of DNA damage. This may be because modifications on p53 are missing in spite
of sufficiently high p53 level (Tang et al. 2008; Loewer et al. 2010). Then what will happen
if p53 is induced by DNA damage? Does p21 faithfully follow p53 pulses?
To answer these questions, I exposed the cells to 5 Gy irradiation to activate p53 network
so that p53 pulses were synchronized in all cells right after damage (Figure 19A and
Figure 20A). As its target, p21 level increased a few hours after p53 activation in some
cells. But surprisingly, there were a number of cells which did not immediately follow the
first p53 pluses but answered to p53 signals at a later time (Figure 19A and Figure 20A).
When looking into the single cells, I observed more distinct trajectories. Some cells
showed immediate p21 arising and fast falling, other cells showed rapid increasing but
slow falling, and there were also cells with delayed p21 appearance (Figure 20B). To
characterize the dynamical behavior, I defined several features to quantify these divergent
trajectories (Figure 20C). For example, the steady-state level measured during non-
stressed period is determined as basal level. Once the protein level increases to as high as
1.3x basal level, a peak is considered to form. This filter allows capturing the main patterns
but leaving out the noise. To indicate the extent to which the level has increased, I
normalized the signal intensity at all time points to basal level and termed the
transformed signal as fold-change. The time when cells start to react often provides
important information. But to precisely determine it is of much difficulty because the
dynamics are usually very noisy and arising rates at the beginning are usually not
significant enough to quantify. The time at which cell reaches 15 percentiles of the
difference between peak and basal level is often more representative, therefore I define it
as reacting time. Last but not least, area between trajectories and basal level line is
calculated. This measure reflects the accumulative protein level over time, which
integrates information on both protein production and degradation. In addition, as cell

Results
40
division event is an important indication of cell cycle states, an intensity-based algorithm
is performed on nuclear marker level to determine the division times (Figure 20D).
With these measures, I was able to quantify how frequently cells were pulsing and also
when they tended to reach the peak (Figure 20E and F). As the top panels in Figure 20E
showed, p53 was likely to show less than two pulses during 44 hours in non-stressed cells.
In response to 5 Gy irradiation, up to 95.3% cells reacted rapidly and reached p53 peak
level during the first 400 minutes (Figure 20E bottom panels). Following the first pulse,
p53 turned to pulse more asynchronously (Figure 20E bottom panels). In consequence,
damaged cells showed much larger number of p53 pulses comparing to non-stressed cells
(Figure 20E left panels). p21 rarely responded to p53 fluctuation in non-stressed cells,
according to the analysis of pulse frequency and peak time (Figure 20F top panels). After
damage, about 50% of cells started to accumulate p21 right after p53 activation (Figure
20F bottom right panel) and the majority of them showed only one pulse (Figure 20F
bottom left panel), suggesting that in these reacting cells, p21 just responded to the first
p53 pulses and showed no further pulses despite of the repeated p53 pulses. The other
cells did not show prompt responses, but p21 frequently increased slowly at later times
among them (Figure 20A and B). Taken together, observations from single cells strongly
indicated that cells responded heterogeneously to DNA damage. Specifically, about a half
cells showed p53 dependent upregulation of p21. And the other half cells showed
unexpectedly delayed p21 accumulation.
Why is a single stimulus able to produce such diverse cellular responses? Why do not p53
pulses lead to p21 accumulation in some cells? To answer these questions, I first need to
gather cells of similar responses for analyzing the common features.

Results
41
Figure 20 p21 dynamics are highly diverse in spite of relatively homogeneous p53 pulses after
damage (A) 30 cells from 2644 samples are randomly selected to demonstrate the single cell behavior. The top and
bottom panels show p53 and p21 trajectories respectively. Each color represents a single cell. (B) Four illustrative examples show diverse dynamics from cell to cell. The unique cell IDs are used to mark
each individual cell. (C) Demonstration of quantitative features of single cell trajectories. The steady-state level is termed as
basal level. Once the protein level goes as high as 1.3 times of basal level, a pulse is then identified. The local
maximum is literally defined as peak level and the time at which it is reached is termed as peak time. The

Results
42
ratio of signals to the basal level is defined as fold-change. The area between the real dynamics and artificial
basal level line is measured and phrased as integral.
(D) When cells undergo mitosis, nuclear content divides into two sister cells. Integrated level of nuclear
marker, cbx5-mCerulean, then drop rapidly down to a half. By detecting this pattern, cell division events can
be determined.
(E) p53 dynamics are characterized using the defined features in non-stressed and damaged cells. Top
panels including a and b show that cells experienced spontaneous and transient pulses under normal
condition. The bottom panels including c and d show that 5 Gy irradiation triggered synchronized cellular
responses. p53 immediately increased in all cells and reached the peak level in 400 minutes. Following the
first pulses, cells maintained frequent but less asynchronous pulsing.
(F) p21 dynamics are characterized using the defined features on normal and stressed conditions. As top
panels (a and b) showed, a few cells showed spontaneous pulses under normal condition. Just about 7.1%
cells had pulsed during a period as long as 10 hours. While after damage, about a half of cells showed pulses
in 10 hours, as bottom right panel tells. And most of reacting cells just exhibited a single pulse till the end
(bottom panels).
2.3.3 A shape-based distance allows quantifying similarities of dynamics between
cells
Clustering algorithms are often used to classify high complexity data in order to expose
hidden information in mixed populations. Given the extreme complexity of biologic
systems, clustering analysis is widely used in life science (Zhao and Karypis 2005),
especially in the field of ‘omics’, such as genomics (Eisen et al. 1998) and proteomics
(Harris et al. 2002). Most applications are based on snapshot data, which usually use static
observations, for example, the levels of proteins, to determine the similarity among
subjects. However, time-series data have features on both amplitude- and time-scale,
therefore, the definition of similarity highly depends on the particular subjects and
questions to answer. In this section, I will discuss possible measures and determine the
method most suitable for grouping single cell trajectories.
From thousands of single cell trajectories, I observed that the main differences largely lay
in the shapes of trajectories. The other patterns, for example, maximum levels and
maximum fold-change, were less varying from cell to cell (Figure 20A and Figure 21A).
Therefore, a measure, which is able to quantify the shapes of trajectories is required to
distinguish different responses. Euclidean distance (ED) is the most commonly used
approach to quantify the similarity between two sequences. Given five examples of p21
dynamics (Figure 21A), it sums up square of straight-line distance between a pair of
trajectories at each time points, then takes the square root as readout of dissimilarity
(Figure 21B).

Results
43
ED is cost-efficient to handle low dimensional data set. However, it has limitations on
processing high dimensional sequences. Both amplitude and phase distortions have great
influence on Euclidean distance. Take first three cells in Figure 21A as examples:
comparing to cell c, cell b was intuitively more similar to cell a. However, ED between cell
a and b was high due to the phase-shift between them (Figure 21B and C), and cell a and
c had smaller Euclidean distances since their amplitudes were similar despite they
showed clearly different dynamics (Figure 21B and C). Other examples were cell c, cell d
and cell e. Cell c and cell d showed both fast accumulation and complete downregulation
of p21, whereas cell e maintained high p21 at the end point. The decay rate in dynamics
may reflect some regulation mechanisms (Davis & Purvis 2015), so it is reasonable to
consider that cell c and cell d might have similar responses of signaling networks.
However, the Euclidean distance clearly showed that cell d and cell e were more similar
because their amplitudes were closer (Figure 21C). Taken together, Euclidean distance
was not able to measure the similarities of single cell trajectories. Its accuracy was mainly
restricted by the phase- and amplitude- distortion.
Figure 21 Euclidean distance cannot properly gather the cells of similar responses
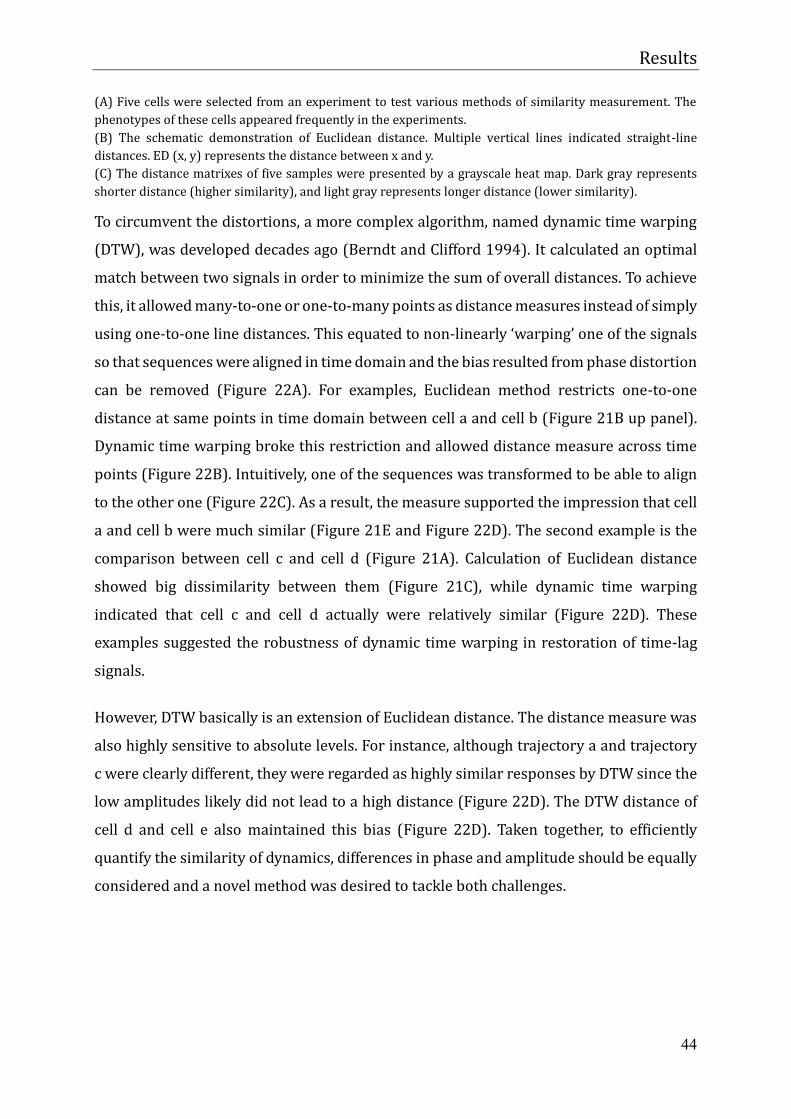
Results
44
(A) Five cells were selected from an experiment to test various methods of similarity measurement. The
phenotypes of these cells appeared frequently in the experiments.
(B) The schematic demonstration of Euclidean distance. Multiple vertical lines indicated straight-line
distances. ED (x, y) represents the distance between x and y.
(C) The distance matrixes of five samples were presented by a grayscale heat map. Dark gray represents
shorter distance (higher similarity), and light gray represents longer distance (lower similarity).
To circumvent the distortions, a more complex algorithm, named dynamic time warping
(DTW), was developed decades ago (Berndt and Clifford 1994). It calculated an optimal
match between two signals in order to minimize the sum of overall distances. To achieve
this, it allowed many-to-one or one-to-many points as distance measures instead of simply
using one-to-one line distances. This equated to non-linearly ‘warping’ one of the signals
so that sequences were aligned in time domain and the bias resulted from phase distortion
can be removed (Figure 22A). For examples, Euclidean method restricts one-to-one
distance at same points in time domain between cell a and cell b (Figure 21B up panel).
Dynamic time warping broke this restriction and allowed distance measure across time
points (Figure 22B). Intuitively, one of the sequences was transformed to be able to align
to the other one (Figure 22C). As a result, the measure supported the impression that cell
a and cell b were much similar (Figure 21E and Figure 22D). The second example is the
comparison between cell c and cell d (Figure 21A). Calculation of Euclidean distance
showed big dissimilarity between them (Figure 21C), while dynamic time warping
indicated that cell c and cell d actually were relatively similar (Figure 22D). These
examples suggested the robustness of dynamic time warping in restoration of time-lag
signals.
However, DTW basically is an extension of Euclidean distance. The distance measure was
also highly sensitive to absolute levels. For instance, although trajectory a and trajectory
c were clearly different, they were regarded as highly similar responses by DTW since the
low amplitudes likely did not lead to a high distance (Figure 22D). The DTW distance of
cell d and cell e also maintained this bias (Figure 22D). Taken together, to efficiently
quantify the similarity of dynamics, differences in phase and amplitude should be equally
considered and a novel method was desired to tackle both challenges.

Results
45
Figure 22 Dynamic time warping (DTW) improves the performance on alignment of shifted
trajectories (A) Illustration of sequence alignment by DTW. The black and brown line represent two artificial sequences.
Lines between them represent the optimal matches. (B) The schematic demonstration of DTW distance between cell a and cell b. DTW uses elastic distances
(many-to-one or one-to-many) to determine an optimal match. It equates to warping one of the signals
(here, cell a) in time domain (C). (D) DTW distance matrix of the five samples. Two pairs, cell a/cell b and cell c/cell d, are recognized as
similar responses by DTW.
Seeing that time-series analysis is widely applied in many fields, many computer scientists
have put much effort on developing novel algorithms. Among them, John Paparrizos and
Luis Gravano have recently introduced an advanced method, named shape-based distance
(SBD), to assess the similarity of time-series signals based on their shapes (Paparrizos &
Gravano 2015). They used electrocardiography records as examples to demonstrate that
this novel algorithm outperformed other approaches in most cases, including Euclidean
distance and dynamic time warping. However, given that the complexity of single cell
trajectories here is different from electrocardiography records used in the report, the
effectiveness of this method on analysis of single cell data needs to be further tested.
I used the same five examples to evaluate the performance of this shape-based distance
measure. As discussed above, although cell c and cell d have similar shapes, the large
differences in scaling and phase led to readouts of low similarity when using Euclidean
distance or DTW (Figure 21E and Figure 22E). According to this algorithm, sequences

Results
46
were first Z-normalized to counteract the influence from amplitudes, so that their levels
were scaled into a uniform scope, ranging from lowest level of about -1 to maximum of
about 3 unit (Figure 23B), while the original data exhibited large differences on the peak
levels, which were about 400 and 900 unit respectively (Figure 23A). Next question was
how to align the signals of different phases. Cross-correlation, an extension of correlation,
was used to specially measure the similarity for time-lagged sequences. The same report
has proven that cross-correlation with coefficient normalization is the most accurate one
among other formats of cross-correlation methods (Paparrizos & Gravano 2015).
Therefore, I utilized this method to compute the similarity of the transformed sequences.
The results suggested high similarity between cell c and cell d and large difference
between cell a and cell c (Figure 23D), the latter of which was not observed with Euclidean
distance and DTW (Figure 21C and Figure 22D). Other examples were cell c, cell d and cell
e. Both Euclidean distance and DTW exaggerated the similarity between cell d and cell e
but underestimated the similarity between cell c and cell d, as discussed above (Figure
21C and Figure 22D). Excitingly, SBD showed that cell e was slightly less similar to cell d
compared to cell c (Figure 23D).
To conclude, in order to precisely measure the similarity of trajectories for further
clustering, three methods of distance measure were compared using five cells from an
experiment, including Euclidean distance, dynamic time warping and shape-based
distance. The results of tests showed that the last one was a powerful approach to analyze
single cell trajectories of phase- or/and amplitude variants.

Results
47
Figure 23 Shape-based distance measure improves distinction of phase- or/and amplitude distorted
trajectories (A-B) The original signals were Z-normalized to two rescaled sequences, which still maintained the shapes
of original sequences. (C) Cross-correlation with coefficient normalization was applied to estimate the distance between
transformed sequences. The algorithm determined the time lag by shifting one of the trajectories until
optimal correlation was found. The dash line here represents artificially appended Zero which basically
reflects the shifted units. (D) Distance matrix by shape-based measure.
2.3.4 Two subgroups of distinct responses are identified
I calculated pair-wise shape-based distances for all single cell trajectories to obtain a
corresponding distance matrix. Next, I combined K-centroid and binary tree algorithms to
cluster the cells based on the distance matrix, and two groups are significantly
discriminated (Figure 24A). Remarkable differences in p21 responses were visible
between the resulting subgroups (Figure 24B). The first one showed an immediate
accumulation of p21 following p53 activation after irradiation. Although activation of p53
in the second one was similar to the first subgroup, p21 responses were largely different,

Results
48
being obviously delayed compared to the first subgroup. These two subgroups were
named ‘immediate’ and ‘delayed’ responses, respectively. As expected, the distribution of
single cell dynamics turned to be narrow in each subgroup, especially in the first few hours
(Figure 24C), comparing to the wide distribution of the whole population (Figure 19B).
Figure 24 Two subgroups are initially identified by shape-based clustering (A) The distances of all possible pairs from whole cell population were measured. Based on distance matrix,
K-centroid clustering was implemented and two clusters of different p21 responses were identified. The
colorbar represents the distance, which equates to dissimilarity. Each pixel indicates the distance between
two cells. Many pixels then form a vertical or horizontal line showing the distances between a cell to every

Results
49
other cell. Cell number is marked on the left side and bottom of matrix.
(B) The resulting subgroups show distinct p21 dynamics but relatively similar p53 responses. The most left
panel illustrates two subgroups of ‘immediate’ response and ‘delayed’ response. The middle and right panels
represent p21 and p53 separately. To visualize all cells in a uniform scale, fold-changes were first Z-
normalized and plotted in subgroups. Each line represents fold-change of a single cell with the level encoded
by color. From low to high, the indicating colors changes from blue to yellow.
(C) Population level from two defined subgroups are visualized separately. 1080 among 2644 cells showed
‘immediate’ response. The rest showed a ‘delayed’ accumulation of p21. Cell behaviors within each
subgroup were highly homogeneous in first a few hours after irradiation.
2.3.5 p21 responses depend on cell cycle phase at the time of damage
Next, I ask a question what leads to the decisions of ‘immediate’ or ‘delayed’ responses.
Several factors, such as cellular states, microenvironment and stochastic fluctuations, may
influence cellular behaviors and lead to heterogeneous phenotypes (Loewer & Lahav
2011). Among them, cellular states (such as cell cycle phase) were responsible for most
cell-to-cell variability (Gut et al. 2015).
To examine the cellular states, I analyzed cell division time prior to irradiation since cell
cycle phase is related to the duration between last division events and irradiation (Figure
25B) (Toettcher et al. 2009). In detail, G2-phase cells at the time of damage experienced
most of a cell cycle, therefore, cell division should happen a long period before damage
(Figure 25B top panel). G1-phase cells just started a new cycle, so cell division tended to
occur a few hours before irradiation (Figure 25B bottom panel). S-phase cells should have
divided at a time between (Figure 25B middle panel). This analysis showed clear
difference in cell division time between subpopulations (Figure 25A). The ‘delayed’ cells
had frequently divided during a period from -15 hour to -5 hour, which implies that the
‘delayed’ cells might be in S phase. By contrast, the ‘immediate’ cells tended to have
divided during a period of either -22 ~ -15 hour or -5 ~0 h (Figure 25A). Therefore, they
were likely to be in G1 or G2 phase at the time of damage. To validate computational
analysis, I performed a Bromodeoxyuridine (BrdU)-labeling experiment. BrdU, an analog
of thymidine, can be incorporated into DNA during S-phase replication thus it is widely
used to mark S-phase in live cells. Cells were incubated with BrdU 30 mins prior to
irradiation, washed, irradiated, imaged for an additional ~24h and stained for BrdU
antibody at the end point to determine the original S phase at the time of damage (Figure
25B). The ‘delayed’ cells showed significantly high BrdU signals and the ‘immediate’ cells
rarely incorporated BrdU (Figure 25C). This suggested that ‘delayed’ cells were in S phase

Results
50
and ‘immediate’ cells were in G1 or G2-phase cells at the time of damage, fully agreeing
with computational results (Figure 25A and D).
Figure 25 p21 responses to irradiation induced-DNA damage are cell cycle dependent (A) Cell division times varied between ‘immediate’ and ‘delayed’ groups. The bottom panel represents cell

Results
51
division times before and after 5 Gy irradiation. Control experiment is shown in top panel.
(B) Demonstration of cell cycle analysis by computational analysis or BrdU labelling.
(C) BrdU signals between ‘delayed’ and ‘immediate’ subgroup. Round dots represent single cells. Blue box
body presents interquartile range (25th percentile to 75th percentile), with red line indicating the median
level. Two horizontal bars represent upper and lower extreme, respectively.
(D) The summary of p21 dynamics and cell cycle states between two subgroups.
2.3.6 Deep clustering reveals more refined p21 responses
Cells showed relatively similar p21 responses in each subgroup, ‘immediate’ or ‘delayed’
groups. Specifically, the behaviors in first about 10 hours post irradiation were largely
homogeneous. However, there were still subsidiary differences from cell-to-cell, such as
the late dynamics. For instance, some ‘immediate’ cells rapidly accumulated p21 and also
removed it quickly to the basal level (Figure 20B cell ID: 1730), while others from the same
group maintained high p21 for longer times (Figure 20B cell ID: 2155). In addition,
‘delayed’ cells also showed differences in reacting time (Figure 20B cell ID: 1965 and cell
ID: 1629). Therefore, I pushed the clustering to deeper level to identify if more refined
phenotypes emerge. Indeed, two further phenotypes could be discerned in both
‘immediate’ and ‘delayed’ groups. Together all cells were organized in a two-level
hierarchical structure with in total four clusters based on their p21 dynamics (Figure
26A).
With the common features of immediate p21 accumulation, ‘immediate 1’ cells and
‘immediate 2’ cells also showed distinct behaviors with respect to the late p21 responses.
p21 in ‘immediate 1’ dropped down relatively fast to the basal level, resulting in a basal-
high-basal type of dynamics. While ‘immediate 2’ cells tended to remove p21 level more
slowly, which led to a basal-high-low type of curve (Figure 26A and Figure 26B). For future
demonstration, I used short number sequences to code these dynamics. 0, 1 and 2 were
used to indicate basal, low and high levels of p21. Thus, the two types of dynamics were
also called 0-2-0 and 0-2-1 in next text. Interestingly, p53 dynamics also showed slight
differences between these subgroups although p53 dynamics were not involved in
clustering computation. Comparing to ‘immediate 1’, ‘immediate 2’ cells showed higher
p53 peak levels in first 8 hours and lower subsequent level after 15 hours post-irradiation
(Figure 26A and Figure 26B). This implies a direct or indirect correlation between p53
and p21 dynamics, which needs further investigation.
Further clustering in ‘delayed’ cells also revealed two subpopulations of responses,

Results
52
‘delayed 1’ and ‘delayed 2’ (Figure 26A and Figure 26B). Overall, ‘delayed 1’ cells showed
slow increasing of p21 during the early period and constant p21 during the late time,
forming 0-0-1 like dynamics. While p21 in ‘delayed 2’ cells started to rise at late time and
maintained increasing till the end. This led to a clear 0-0-1 type of dynamics. The
difference between these subpopulations was that responses of ‘delayed 2’ cells tended to
be delayed longer.
In the previous section, the analysis of cell divisions proved that cell cycle phases exerted
influence on cellular responses to DNA damage. Both G1 and G2-phase cells showed
‘immediate’ responses. And here, two subpopulations were seen in ‘immediate’ cells. I
simply asked if the difference of responses was related to an exact cell cycle phase, G1 or
G2 phase. However, the analysis of division times did not provide significant evidences of
the correlation. But it suggested that ‘immediate 2’ subgroups showed decent numbers of
estimated G1 and G2-phase cells, and at least majority of the first subgroup may be in G1
phase (Figure 26C).
As cell cycle progression is a continuous process. Expression of many proteins is also
dynamical in cycling cells. This defines unique reaction condition at a certain time for each
cell, which may shape different cellular responses. I asked whether this kind of trivial state
resulted in these explicitly distinct p21 responses. To test it, division time was considered
as an indicator to specify the exact cellular states, such as, early G1, middle S or late G2
(Figure 26C). The results showed that the division times varied considerably between
‘delayed 1’ and ‘delayed 2’ cells. The ‘delayed 1’ cells tended to have divided earlier than
‘delayed 2’ (Figure 26C). Considering that the ‘delayed’ cells should be in S phase, it is
reasonable to conclude that ‘delayed 1’ cells are probably in late S phase and ‘delayed 2’
cells are probably in early S phase at the time of damage. Considering the different
accumulation time between two ‘delayed’ populations, late S-phase cells tended to
respond faster than early S-phase cells. Going one step further, this implies that the
reacting time in S-phase cells may be correlated to cell cycle progression.

Results
53
Figure 26 Four subgroups of p21 responses are totally identified by further clustering (A) The deep clustering results in four subgroups at level 2 in the binary tree. The ‘immediate’ and ‘delayed’
subgroups were considered as two independent groups to perform clustering. Fold-change of p21 and p53
in single cells are visualized within these subgroups. Each line represents a single cell. Colorbar indicates
the Z-normalized fold-change. (B) The measured level of p53 and p21 are plotted. It shows uniformed intragroup responses and
heterogeneous dynamics among groups. (C) Cell divisions were examined in order to check if the intergroup differences were associated with cell
cycle states.

Results
54
2.3.7 Combination of EdU labelling and semi-supervised classification allows
endpoint cell cycle analysis
In the previous section, four distinct subgroups of p21 responses are identified and cell
division analysis shows that cells at different states may have comparable reactions, which
suggests that the variability is not completely caused by initial cell cycle phases. In
addition, snapshot measure of cell cycle phases has shown that cells stay at different cell
cycle phase 24 hours after irradiation (Figure 17 and Figure 18E). Altogether, this led to
the hypothesis that the heterogeneous responses may be also related to final cell fate
determinations. It is well known that irradiation-induced DNA damage mainly triggers
cell cycle arrest in G1 or G2 phase rather than apoptosis. Therefore, final cell cycle phases
should be measured to determine the cell decisions, such as G1 arrest, G2 arrest or
another phenotype.
To achieve this, I developed a protocol, called endpoint cell cycle for time-lapse imaging,
which is able to monitor dynamics and measure final cell cycle states in the exactly same
cells. As sketched in Figure 27A, reporter cells are first imaged by time-lapse microscopy
for about 44 hours in order to follow p53 and p21 dynamics before and after irradiation.
All cells are incubated in EdU 30 mins before the end and fixed immediately after imaging.
Then DNA content is measured by Hoechst staining and EdU intensity is quantified to
identify S-phase cells. To automatically output cell cycle phases, I developed a semi-
supervised classification algorithm. First, an edge detection algorithm is performed on
EdU intensity to determine S phase (EdU positive cells) (Figure 27B). As experimental
variability exists, in particular, the EdU readout may be varying across experiments, the
threshold for determining edge should be under supervision in order to achieve accurate
results. EdU negative cells are either in G1 or G2-phase. Theoretically, G2-phase cells
should contain double DNA and have bigger nuclear sizes since they completed genome
replication. In reality, a single measure of DNA content or nuclear sizes does not enable
clear separation of G1 or G2-phase cells. Specifically, determination of cells that have
intermediate DNA content or nuclear sizes is problematic (Figure 27C and D). To handle
this, I used both DNA content and nuclear sizes as inputs and apply K-means clustering to
push these cells into two groups (Figure 27E). In this way, cells were distinguishably
stratified in a low-content/small-size domain or a high-content/big-size domain,
respectively, which represent G1 phase and G2 phase (Figure 27E). By this approach, I

Results
55
observed that the majority of cells were arrested in G2 phase, and much fewer cells were
in G1 phase with only a small portion of cells being in S phase (Figure 27E), which is in
line with previous flow cytometry measurements (Figure 18E).
A last technical difficulty is how to identify the same cells between the live-cell images and
fixed images, the latter of which are often shifted since staining protocol was performed
outside of microscopy chamber. To overcome it, I developed an image registration tool to
automatically align these images so that the tracking algorithms can successfully track the
cells from the first time point to the ‘last’ time point (fixed images). This tool allows me to
link cell cycle phases to the dynamics in the same cells.

Results
56
Figure 27 Determination of final cell cycle phases following time-lapse imaging by EdU labeling and
a semi-supervised classification (A) The demonstration of endpoint cell cycle for time-lapse imaging. In details, before subjected to 5Gy
irradiation, cells were imaged for about 20 hours to determine the initial states. Then another 24-hour
imaging was performed to investigate cellular dynamics. Before the end, cells were cultured in EdU for half
an hour for labelling S-phase cells. To determine G1 and G2 phases, nuclear size and DNA content were
quantified by Hoechst staining. In order to automatically identify the phases for thousands of cells, a
supervised edge detection was performed for determining S-phase cells and an unsupervised K-means
clustering was applied to specify G1 or G2-phase cells. Jointly, a semi-classification was developed to assess
cellular states automatically.

Results
57
(B-D) An edge detection algorithm is able to efficiently separate S phase from G1 and G2-phase cells. In
details, all cells were sorted by increasing EdU levels. To remove noise, a line was fitted along X axis. The
edge was then determined by setting a threshold of rising rate. The blue line represents the edge, above
which dots are estimated as S-phase cells. No bifurcation of either DNA content (C) or nuclear size (D) is
observed among the non-S-phase subpopulation, which resulted in difficulty of determination cell cycle
phases. The gray bars represent G1 and G2-phase cells and brown bars indicate S-phase cells defined
previously. (E) The combination of nuclear size and DNA content succeeds to separation of G1 and G2-phase cells.
Together with EdU labelled S-phase cells, this approach is able to discern cell cycle phases from populations.
2.3.8 Cells with different p21 dynamics tend to end up with divergent cell cycle
phases
The endpoint cell cycle measure allowed me to collect three-dimensional data for each
cell, including initial states, cellular dynamics and final cell cycle phases. The first question
came up was whether cell decisions differed among the four defined subgroups. Indeed, I
observed clear differences in final cycle distributions among the groups (Figure 28). For
example, ‘immediate 1’ subgroup contained all S-phase cells. Except for S-phase cells,
‘immediate 1’ group comprised similar numbers of both G1 and G2-phase cells as
‘immediate 2’ group. The ‘delayed 1’ and ‘delayed 2’ groups both showed much similar
endpoint cellular states, with a prominent number of G2-phase cells (Figure 28). The
results evidenced that there is a correlation between p21 dynamics and cell cycle state
post-damage.
However, there were still unclear questions. Which states do these cells start with? What
information do cellular dynamics incorporate about cell cycle progression? To address
these questions, connections between p21 dynamics and cell decisions need to be
investigated in individual cells case by case.
Figure 28 cell cycle distributions vary among defined subgroups Cells of different responses were
identified by clustering. Endpoint cell cycle assay was then implemented and cell number of different phases

Results
58
was counted within four subgroups. Final S-phase cells were in ‘immediate 1’ group. Majority of G2-phase
cells were in ‘delayed 2’ and ‘delayed 1’ groups, although there were some from ‘immediate 1’ and
‘immediate 2’ groups. G1-phase cells distributed among four subgroups.
2.3.9 p21 dynamics are related to cell fate decisions
In previous section, I have shown that cells within ‘immediate 1’ subgroup showed
relatively homogeneous responses, but slight differences in dynamics still existed within
this subgroup (Figure 26A). For example, following p21 degradation to the basal level,
some cells kept the basal state till the end, while other cells showed slight upregulation at
late time. The endpoint analysis showed that ‘immediate 1’ cells had variant final cellular
states, including G1 phases, S phases and G2 phases (Figure 28). I hereby addressed a
question if cell decisions connected to these versatile p21 dynamics. To examine it, cells
were highlighted and analyzed according to their final cycle phases (Figure 29A).
First, I observed that all final S-phase cells had experienced p21 rise and decline and
finally maintained it at basal level till 24h post irradiation (Figure 29B). For clear
demonstration, this kind of dynamics is named as 0-2-0 type. Trajectories of these cells
were distributed in a very narrow region, which implies that they might derive from a
same situation and undergo same progression to end in S phase. The analysis of cell
divisions provided two lines of evidences to confirm that all cells should derive from G1
phase (Figure 29B). The first one was that the cells tended to have divided short period
prior to damage. Previous evidences indicated that all ‘immediate’ cells were in G1 or G2
phase at the time of damage, which drives the two possibilities of cell progression here:
G1-S or G2-G1-S. The difference between these progressions lay in that cells must divide
once to complete G2-G1-S. But almost no divisions were observed for these cells after
damage (Figure 29B), so they should have been in G1 phase at the time of damage and
transited to S phase afterwards. These cells accounted for about 11.5% of the whole
population (Figure 29E).
Another subpopulation also had similar features to 0-2-0 dynamics from beginning to 18
hours after irradiation. But p21 was re-elevated during the last 6 hours, resulting in a 0-
2-0-1 type dynamics. These cells all entered G2 phase at the end of observation (Figure
29D). Combining the division analysis (Figure 29D) and G1-S cells discussed above, this
0-2-0-1 type of p21 dynamics pointed to a correlation with G1-S-G2 progression (Figure
29E). Taken together, cells showing a kind of 0-2-0 dynamics could have two possible cell
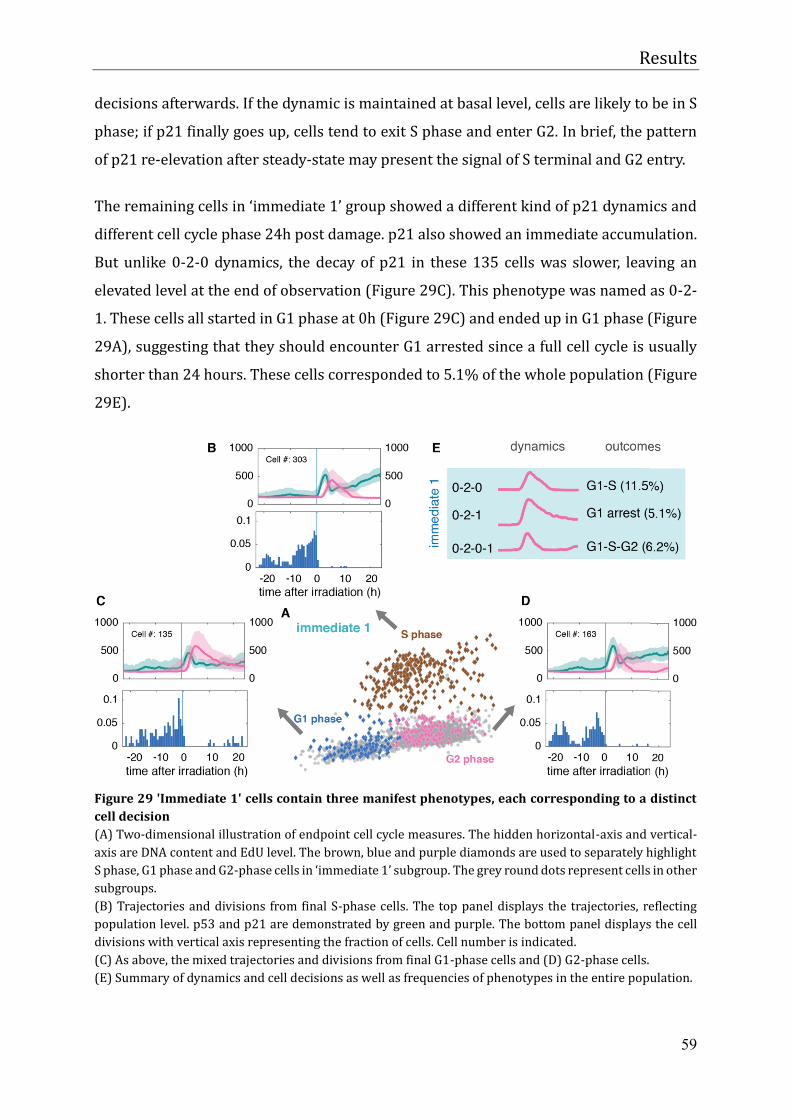
Results
59
decisions afterwards. If the dynamic is maintained at basal level, cells are likely to be in S
phase; if p21 finally goes up, cells tend to exit S phase and enter G2. In brief, the pattern
of p21 re-elevation after steady-state may present the signal of S terminal and G2 entry.
The remaining cells in ‘immediate 1’ group showed a different kind of p21 dynamics and
different cell cycle phase 24h post damage. p21 also showed an immediate accumulation.
But unlike 0-2-0 dynamics, the decay of p21 in these 135 cells was slower, leaving an
elevated level at the end of observation (Figure 29C). This phenotype was named as 0-2-
1. These cells all started in G1 phase at 0h (Figure 29C) and ended up in G1 phase (Figure
29A), suggesting that they should encounter G1 arrested since a full cell cycle is usually
shorter than 24 hours. These cells corresponded to 5.1% of the whole population (Figure
29E).
Figure 29 'Immediate 1' cells contain three manifest phenotypes, each corresponding to a distinct
cell decision (A) Two-dimensional illustration of endpoint cell cycle measures. The hidden horizontal-axis and vertical-
axis are DNA content and EdU level. The brown, blue and purple diamonds are used to separately highlight
S phase, G1 phase and G2-phase cells in ‘immediate 1’ subgroup. The grey round dots represent cells in other
subgroups. (B) Trajectories and divisions from final S-phase cells. The top panel displays the trajectories, reflecting
population level. p53 and p21 are demonstrated by green and purple. The bottom panel displays the cell
divisions with vertical axis representing the fraction of cells. Cell number is indicated. (C) As above, the mixed trajectories and divisions from final G1-phase cells and (D) G2-phase cells. (E) Summary of dynamics and cell decisions as well as frequencies of phenotypes in the entire population.

Results
60
I next focused on final G1 and G2-phase cells in the remaining subgroups as few S-phase
cells were observed among these subgroups (Figure 28 and Figure 30A). Figure 30A
highlights the identified G1 phase and G2-phase cells which together formed 0-2-2
dynamics (Figure 26B). The shape of dynamics was also similar to 0-2-1 described above,
but the degradation here was even slower and endpoint level was higher than 0-2-1
(Figure 29C and Figure 30B,C), so I used 0-2-2 to indicate this kind of dynamics in order
to distinguish it from 0-2-1 dynamics. Final G1 and G2-phase cells showed highly similar
p21 dynamics but had significantly different division times (Figure 30B and C). The final
G1-phase cells tended to have divided briefly before irradiation and rarely divided again
in the following 24 hours (Figure 30B), suggesting that they were arrested at G1 phase. In
contrast, final G2-phase cells had divided about 20 hours before damage and never
divided after irradiation as well (Figure 30C), suggesting that they arrested in G2 phase.
Both classes altogether explained about 17.6% of cells (Figure 30D).
Figure 30 'Immediate 2' cells showed heterogeneous behaviors, but were arrested at two different
phases (A) The highlighted cells with different colors represent G1 or G2-phase cells in ‘immediate 2’ subgroup.
The gray points also represent cells from other subgroups. (B) and (C) illustrate the mixed trajectories and divisions of final G1 and final G2-phase cells. Dynamics were
similar but division times were of significantly difference in both. (D) 0-2-2 type dynamics was extracted from this subgroup and linked to G1 or G2 arrest.
Overall, ‘delayed 1’ showed a sustained p21 dynamics after irradiation (Figure 26B).

Results
61
Endpoint cell cycle analysis revealed two different subpopulations of cell cycle states,
consisting of 364 final G2-phase cells and 132 final G1-phase cells (Figure 31A, B and C).
As top panel of Figure 31C shows, final G2-phase cells exhibited a slightly delayed
upregulation of p21. And unlike the dynamics in ‘immediate’ groups, p21 in G2-phase cells
here did not reach the peak level immediately. Instead, it started accumulation at about 8
hours after irradiation and sustainably increased with a low rate, which altogether
resulted in a 0-0-1 type dynamic. This sort of dynamics stood for about 13.8% cellular
behaviors.
Unexpectedly, the final G1-phase cells not only showed a sustained accumulation but also
responded immediately to damage (Figure 31B). This 0-1-1 type of p21 responses was
also much similar to 0-2-2 dynamics described in the previous section. In combination to
the previous point that p21 did not accumulate during S phase, I came to the speculation
that these cells were misclassified by the automated clustering algorithm and should be
assigned in ‘immediate 2’ group instead.
Figure 31 Delayed responses displays correlation to G2 arrest in ‘delayed 1’ cells and misclassified
cells were re-assigned (A) As described above, the highlighted cells underwent different cell decisions, being arrested at G1 or G2
phase. (B) Final G1-phase cells showed a prompt accumulation and the reacting time of p21 is highly correlated to
p53 accumulation, suggesting higher similarity to final G1-phase cells in ‘immediate 2’ group. (C) A delayed upregulation of p21 was linked to G2 arrest. Top panel showed that p21 and p53 accumulation
was out-of-steps. Bottom panel suggested that these cells started from S phase, transited to G2 and stopped
dividing since damage. (D) The schematic connections of 0-0-1 dynamics to G2 arrest and 0-1-1 to G1 arrest.

Results
62
In ‘delayed 2’ group, about 900 cells, which was the biggest number among all subgroups,
were seen staying at G2 and the other 157 cells stayed at G1 (Figure 32A). p21 level in the
biggest population did not change in more than 10 hours after irradiation. Then slow
upregulation of p21 was initiated and maintained till the end (Figure 32C). The dynamical
features were highly similar to the 0-0-1 type defined above (Figure 31C). The difference
was that retention time was even longer. Therefore, their p21 dynamics were also
categorized as 0-0-1 type. In addition, the cells tended to have divided during -15h to -5h
(Figure 32C), confirming that they initiated from S phase and stopped in G2 phase.
Beside 0-0-1 dynamics, I also observed 0-0-1 like dynamics in ‘delayed 2’ cells. And they
were in G1 phase at the end (Figure 32B). The majority of ‘delayed’ cells were considered
as S-phase cells, but the division analysis showed no clear clue about initiate cellular states
for these cells. They could be in G1, S or G2 phase when damage occurred (Figure 32B). In
contrast to others, they also experienced mitosis after irradiation (Figure 32B).
Figure 32 Intensely delayed responses displayed correlation to G2 arrest in ‘delayed 2’ cells (A) The highlighted cells had two populations, majority of which was G2 phase cell and the rest was G1
phase cell. (B) Final G1-phase cells showed 0-1-1 like dynamics and experienced mitosis in last about 10 hours (C) Final G2-phase cells showed 0-0-1 type of dynamics. p21 maintained unchanged before time 10 and
started to rise during time 10 to time 20. This population predominantly divided during -17 hour to -7 hour
before damage. (D) The schematic linking between 0-0-1 dynamics and cell decisions in ‘delayed 2’ group. Most ‘delayed 2’
cells exerted 0-0-1 type dynamics, resulted in S-G2 arrest. Also, there were a few 0-0-1 cells undergoing

Results
63
mitosis afterwards.
In summary, three subtypes of dynamics could connect to G1 arrest, such as 0-2-1 from
‘immediate 1’, 0-2-2 from ‘immediate 2’ and 0-1-1 from ‘delayed 1’. Two features were
found to be common in them. First, p21 increased immediately in first 10 hours after
damage. Second, the degradation of p21 was slow and p21 levels remained high at the late
phase. These cells together formed a bigger subgroup with basal-high-high/low dynamics
(hereafter referred to as p210-1-1). In total, 51% G1-phase cells showed p210-1-1 and
arrested in G1 phase (Figure 33A). The remaining G1-phase cells were all from ‘immediate
1’ subgroup, with 0-2-0 or 0-2-0-1 kind of dynamics (referred to as p210-1-0) (Figure 29B,D
and E). p21 first showed fast accumulation, but had rapidly dropped down to basal level
(Figure 33A). Depending on final p21 level, cells were at S phase or G2 phase. Overall,
these 466 cells had p210-1-0 dynamics and had progressed from G1 to S, with some cells
finally succeeding to G2. These two populations (G1 arrest and G1-S) had comparable p21
maximum level (Figure 33B) and p21 integral level (Figure 33C) but different decay rate
(Figure 33D) and p21 endpoint level (Figure 33E).
S-phase cells all showed ‘delayed’ responses with 0-0-1 type of p21 dynamics (referred to
as p210-0-1) and mainly ended up in G2 phase (Figure 31C and Figure 32C). They were
further grouped into ‘delayed 1’ and ‘delayed 2’, depending on the reacting time (Figure
26B and C and Figure 33F). Other difference in division time was also observed between
these two subgroups (Figure 33G). These cells also showed higher endpoint p21 level
(Figure 33H), implying that basal p21 might only occur during S phase.
G2-phase cells were more homogeneous, all showing 0-2-2 type of p21 dynamics (p210-1-
0, Figure 33I) and being arrested at G2 (Figure 30C). Interestingly, dynamical patterns
were highly similar in G2 and G1 arrested cells, including p21 maximum (Figure 33J), p21
integral (Figure 33K), decay rate (Figure 33L) and p21 endpoint level (Figure 33M).

Results
64
Figure 33 Grouping p21 dynamics by initial cell cycle phases (A) G1-phase cells show bifurcation of both p21 dynamics and cellular decisions. The patterns of single cell traces were quantified and compared between G1 arrested and G1-S cells, including p21 maximum level after irradiation (B), p21 integral (C), the decay rate of p21 (D) and p21 fold-change during the late period (E). (F) S-phase cells show delayed responses. (G) Division time is slightly different between ‘delayed 1’ and ‘delayed 2’ S-phase cells. (H) Final S-phase cells show significantly lower p21 level than G2-phase cells transited from S phase. (I) G2-phase cells show relatively homogenous p21 dynamics and resulted in G2 arrest. The single cell
patterns are comparable between G2 arrest cells and G1 arrest cells, such as p21 maximum level after
irradiation (J), p21 integral (K), the decay rate of p21 (L) and p21 fold-change during the late period (M).
2.3.10 PCNA-mediated degradation leads to the majority of cell-to-cell variations
S-phase cells exhibited basal p21 in the first 10 hours, additionally, G1-S cells showed
basal p21 in the last ~10 hours (Figure 33). The remaining cells all had p210-1-1. This led
to the hypothesis whether an S phase specific factor(s) predominantly causes the
heterogeneity. Among the multiple degradation mechanisms, PCNA can mediate
ubiquitin-dependent degradation of p21 during S phase (Havens & Walter 2009; Barr et
al. 2017). Mechanistically, it can bind proteins containing a domain named PCNA
interacting peptide box (PIP box) and recruit CRL4CDT2 , an E3 ubiquitin ligase (Havens &
Walter 2009) (Figure 34A). Modified proteins are subsequently degraded by the
proteasome. As p21 contains a highly active PIP box (Stivala et al. 2012; Coleman et al.

Results
65
2015), it is conceivable that PCNA-mediated degradation might play an important role in
p21 kinetics in S-phase cells.
To test this, I aimed to prevent the PCNA-p21 interaction. Since PCNA is essential for DNA
replication (Moldovan et al. 2007), silencing it prevents cell cycle progression. Previously,
exogenously expressed p21 with PIP box mutations was used to investigate the
interaction between p21 and PCNA (Galanos et al. 2016). However, this might affect the
p21 signaling due to overexpression of the substrate. A more elegant approach would be
to introduce mutations in endogenous p21 to disrupt the interaction while preventing
negative effects on cell cycle progression. To this end, I developed a CRISPR-Cas9 mediated
genome engineering strategy to mutate three amino acids that mediate the p21 - PCNA
interaction (Figure 34A). However, based on the knowledge obtained so far, this mutation
may have server influence on cellular activity. To avoid interference of stabilized p21 with
cell cycle progression, I incorporated a cassette named small molecule–assisted shutoff
(SMASh) right after mCherry-tagged mutant p21 (Chung et al. 2015) (Figure 34B). This
cassette was reported to be safe for cells and can be switched on or off by the protease
inhibitor asunaprevir (ASV). In absence of ASV, a protease in the cassette can cleavage
SMASh fragment off from the fusion protein, mCherry-mutant p21 (p21PIPmut) (Figure
34B). Addition of ASV can inhibit the protease activity and allow the rapid degradation of
entire fragment, including the mutant p21 (Figure 34B). This design allowed me to keep
mutant p21 under control so that cell cycle activities were not affected before experiments.
Both p21PIPmut and PCP45 cell lines were subjected to 5 Gy irradiation. Interestingly,
p21PIPmut reacted immediately and maintained homogeneous p21 dynamics in entire
population (Figure 34C and Figure 34D top panel). Moreover, S-phase cells labelled with
EdU exhibited p210-1-1 dynamics in p21PIPmut in contrast to p210-0-1 dynamics in PCP45
cells (Figure 34D bottom panels). This provides strong evidence that PCNA-mediated
degradation determines the specific p21 dynamics during S phase in agreement with
previous publications (Havens & Walter 2009).
I next asked if PCNA-p21 interaction also contributes to the fast degradation of p21 in G1-
S cells, based on the observation that these cells all showed p210-1-0 dynamics (Figure 33A)
and the previous report in which PCNA kinetics was investigated and it showed dramatic
elevation in late G1 phase (Kurki et al. 1986). To test this, I classified the cells in three

Results
66
subgroups by performing shape-based k-centroid clustering (k=3). As expected, PCP45
cells resulted in three groups of distinct dynamics. About 36.5% of cells showed p210-1-0
dynamics, about 13.1% cells had p210-1-1 dynamics and the remaining cells exhibited p210-
0-1 dynamics (Figure 34E top panels). p21PIPmut cells were also separated into three groups
by clustering (k=3) (Figure 34E bottom panels). The first subgroup contained about 51.1%
of cells, exhibiting p210-1-0 dynamics (Figure 34E bottom left panel). It suggested that fast
degradation of p21 in G1-S cells probably was not mediated by PCNA. The other two both
showed immediate p21 accumulation and sustained p21 afterwards (Figure 34E). The
slight difference between these two was that one had slightly higher endpoint p21 levels.
According to the definition discussed above, both corresponded to p210-1-1 dynamics.
Notably, these similar responses emerged as two subpopulations only due to the
parameters of the k-shape clustering algorithm (k=3). Most importantly, no cell
populations with p210-0-1 dynamics were observed in p21PIPmut cells. This validated that
PCNA-mediated degradation leads to the delayed p21 response in S-phase cells.

Results
67
Figure 34 Disruption of PCNA-p21 interaction leads to more homogeneous response (A) Schematic demonstration of PCNA-p21 interaction. To interfere with the PCNA-P21 interaction, three
crucial amino acids in PIP box of p21 were mutated by CRISPR/Cas9 based genome engineering. p21PIPmut
represents the heterogeneous mutant cell line, validated by Sanger sequencing. (B) Schematic illustration of SMASh. Addition of ASV induced the degradation of mutated p21, permitting
normal growth of cell clones. 20 hours prior to experiments, ASV was removed to visualize mutated p21. (C) Representative images of p21PIPmut and PCP45 cells. p21 level were examined under microscopy 5 hours
after irradiation. The top panels represent mCherry signals, including mutant p21 from p21PIPmut and wild
type p21 from PCP45. The bottom panels indicate the nuclei. (D) Population level of the entire population and S-phase cells from both cell lines. (E) Cells were classified by kshape clustering (K=3). Colored bars indicate the fractions of different
dynamics.

68
3 Discussion
Cell-to-cell variability is a universal property observed not only in multicellular organisms
but also in cultured cells which may even derived from a single clone (Yuan et al. 2017).
Several sources may lead to cellular heterogeneity, among which cellular state is believed
to be responsible for more than half of cell-to-cell variations observed in genetically
identical cells. This is because the state of cells is dynamic and constantly changing.
Therefore, it requires a dynamical perspective to study cell-to-cell variability. In this
thesis, I presented a pipeline to systematically study how cellular states influence p21
dynamics in response to DNA damage in thousands of cells using endogenous reporter
and time-lapse microscopy. In order to efficiently label endogenous p53 and p21, I
established a CRISPR/Cas9-based platform and improved the insertion efficiency up to
about 40%-80%. Combining this technology and time-lapse microscopy, I observed that
p21 responses to DNA damage were highly heterogeneous in individual cells. A shape-
based clustering approach was developed to classify the varied dynamics, and
subpopulations of p21 responses were identified. Interestingly, these heterogeneous p21
responses were found to be correlated to cell cycle states: immediate accumulation of p21
was cell cycle dependent and long-term dynamical features of p21 provided information
about cell cycle progression during the DNA damage response. At last, PCNA-mediated
p21 degradation was shown to be responsible for delayed accumulation of p21.
3.1 CRISPR/Cas9 based genome engineering is a robust tool to faithfully tag and
efficiently modify endogenous proteins
I first established a platform for creating endogenously-tagged reporters. To achieve this
goal, I tested sgRNA efficiency and different strategies to get better understanding of this
technology, and optimized technical procedures to maximize the final insertion efficiency,
such as transfection efficiency, ratio of constructs and format of template. Taken together,
I established an effective protocol to create knock-ins (Figure 35). The achieved efficiency
is very high and stable, with an about 10% chance to get homozygotes and 40%-80%
chance to obtain heterozygous with non-tagged allele unchanged (Figure 11C and E).

Discussion
69
Figure 35 Technical platform of CRISPR-Cas9 based knockin in MCF10A
As a start, at least three sgRNAs are required for a given target, as the cleavage efficiency
was highly related to the guide sequence (Figure 10D and F). This is in line with previous
publications (T. Wang et al. 2014; Doench et al. 2014). In addition, multiple sgRNAs in
combination with wild type Cas9 increased knock-in efficiencies (Figure 10F and Figure
11C). More specifically, sgRNA efficacy may be related to the nucleotides at defined
positions, concluded from genome-scale screening using pooled sgRNA library (T. Wang
et al. 2014; Doench et al. 2014). For example, sgRNAs with four Thymidine (T) close to
PAM region led to less frequent cleavage, which was also observed in this thesis (Figure
10A and D). However, the model of sgRNA activity established on a library screening
tolerates many exceptions and thereby cannot precisely predict the activity for a given
sgRNA. To determine the efficiency of a few particular sgRNAs, T7 endonuclease I assay
needs to be performed in HEK293 cells. This would ensure efficient cleavage for further
editing in desired cell lines.
The design of the repair template also influences the efficiency of homology-directed
repair. First, the length of homologies largely determines repair rates. Many publications
suggested PCR-amplified products or synthesized oligonucleotides as repair templates
Discussion
70
(Bottcher et al. 2014; Stewart-Ornstein & Lahav 2016). However, our data showed that
homology of primer-scale usually is suboptimal and a length of about 1000 bps allows
more efficient knock-ins (Figure 12). Interestingly, the format of template also plays a role
in colony formation. Comparing to circular template (plasmids), linearized template
seems to induce fewer negative colonies (17 by linearized vs 57 by circular), likely due to
its higher stability and longer persistence after transfection. Last but not least, the
selection cassette on donor DNA is also important. In principal, promoter-free systems
including internal ribosomal entry site (IRES) (Rago et al. 2007) and self-cleaving peptide
(2A peptide) (Kim et al. 2011), are able to reduce background due to random integration
in the genome (Rago et al. 2007). However, it is worthy pointing out that both promoter-
free techniques highly depend on the activities of the endogenous promoter. Engineering
the genes of low expression might not be successful due to the low expression of
resistance gene.
In addition to sgRNAs and donor DNA, the type of Cas9 enzymes also determines the
efficiency. Wild type Cas9 allows efficient knock-ins and produced a remarkable number
of heterozygotes, which are faithful and favored to reflect endogenous proteins (Figure
14). However, most of the heterozygotes hold indel mutations in the non-tagged alleles
(Figure 11E). This reduced the final chance of obtaining functional heterozygote reporters
down to 7%. Interestingly, the nickase version of Cas9 (Cas9n) showed few mutations in
the non-tagged alleles (Figure 11E) and the insertion efficiency was still considerably
high. Functional heterozygotes turned out to account for 80% of the resulting colonies.
Another advantage is that Cas9n minimizes off-target effects (Hsu et al. 2013; Cho et al.
2014). Collectively, Cas9n appears to be more efficient and specific to create heterozygous
knock-ins. On the other hand, homozygous knock-ins are preferable in other cases, such
as nucleotide mutations and HDR-based gene knockdown. It is more reasonable to use
wild type Cas9 in these cases, since it allows more efficient homozygous knock-in (Figure
11C) and shows limited off-target mutations (Figure 13).
In summary, CRISPR/Cas9 technology is a highly efficient tool to faithfully monitor and
also precisely alter endogenous proteins (Figure 34A). However, there is also a challenge
in monitoring low expressing proteins using fluorescent reporters. During the course of
my thesis, I have successfully tagged additional five genes (Mdm2, Wip1, RRM2B, SESN1
and BBC3). But no significant fluorescent signals were detected under regular microscopy

Discussion
71
conditions (data not shown). To overcome this issue, further efforts need to be made to
improve signal intensity. Synthetic biology approaches that amplify the signal such as the
SunTag system may be feasible (Tanenbaum et al. 2014).
3.2 Shape-based clustering can efficiently classify cellular dynamics
In non-stressed cells, p53 showed spontaneous pulses in most of cells (Figure 20A, B and
E). After DNA damage, p53 was synchronized immediately and frequently oscillated until
the end of the observation period. These agree with previous description of p53 dynamics
obtained using transgenic reporters (Loewer et al. 2010; Finzel et al. 2016). The damage-
induced p53 pulses rather than spontaneous ones are transcriptionally active and able to
induce expression of its targets due to differences in acetylation status (Loewer et al.
2010). For example, treatment of neocarzinostatin (NCS) activates p53, leading to
expression of p21 mRNA. Unexpectedly, I observed that p21 protein levels were not always
increased immediately following the activation of p53 in single cells (Figure 19A). This
phenomenon was not dose dependent (Figure 19B and C), suggesting that the
heterogeneity is driven by intrinsic mechanisms rather than extrinsic stress. Further
quantitative investigation showed that p53 dynamics were all synchronous following DNA
damage while p21 responses were highly diverse from cell to cell (Figure 20). Similar
phenomenon was also observed in MCF7 cells in a recent publication (Stewart-Ornstein
& Lahav 2016).
To expose the hidden dynamical features, I applied unsupervised classification to cluster
the cellular dynamics. A difficulty for time-series analysis is the determination of
similarity among trajectories. Both Euclidean distance and an improved approach,
dynamic time warping (DTW), showed limitations on processing these time-shift and
amplitude varying data (Figure 21 and Figure 22). A novel shape-based distance (SBD)
was recently reported and showed robustness in resolving phase- and amplitude- variants
in time-series analysis (Figure 23) (Paparrizos & Gravano 2015; Paparrizos & Gravano
2017). This method was rapidly applied in the field of single cell dynamics. For example,
it was used to successfully classify NF-B signals in single cells for mRNA profiling of
subpopulations (Lane et al. 2017). By combining SBD and hierarchical clustering (K-
centroid based, two-level binary tree), two big subpopulations of significant differences
were identified, named ‘immediate’ and ‘delayed’ group dependent on their response time
(Figure 24). Deep clustering revealed two refined subpopulations of these p21 responses

Discussion
72
(Figure 26). Difference in p21 degradation emerged in two refined subpopulations in the
‘immediate’ groups. Cells in ‘immediate 1’ subgroup appear to remove p21 faster than in
‘immediate 2’ subgroup (Figure 26B, Figure 29 and Figure 30). As for ‘delayed’ cells, the
deep clustering resulted in two subgroups with a main difference in the reacting time of
p21. p21 response in the second subgroup was delayed 5 hours more than in the first
subgroup (Figure 26B, Figure 31 and Figure 32). And a small subpopulation in ‘delayed 1’
(Figure 31B) showed more similar dynamics to G1 arrested cells so that it was considered
as misclassification. This could be caused by the flexible shifting and aligning of signals
when calculating SBD. But it does not mean the performance of shape-based clustering is
overestimated. Indeed, each clustering approach has its own advantages and limitations,
so imperfect accuracy is often tolerable. Nevertheless, optimization should be further
considered. Overall, it is worth underlining that the novel distance measure (SBD) unveils
unknown phenotypes of p21 response, which were not previously described both in
population and single cell studies.
3.3 Endpoint assay ensures linking dynamics to cell fate decisions for individual
cells
Cell cycle state is a main source of cellular heterogeneity (Loewer & Lahav 2011; Snijder
& Pelkmans 2011; Gut et al. 2015). This underlines the importance of measuring cell cycle
phase in addition of p53-p21 dynamics. Several approaches can be applied to measure the
cell cycle phase at single cell level, such as flow cytometry based assay, fluorescent
reporter based approach and in silico synchronization. However, the applications of these
approaches were restricted. Cells need to be destructed when using flow cytometry,
conflicting with the requirement that p53 and p21 dynamics needed be measured in living
cells. The FUCCI and its updated version FUCCI4 reporter system were used to determine
the cycle phases in live cells (Sakaue-Sawano et al. 2008; Bajar et al. 2016). Both required
three to four different fluorescent proteins to label the cell cycle markers, making it
impossible to simultaneously monitor p53 or p21 kinetics. A suboptimal approach is to
analyze each phase by using a single marker at a time (Cappell et al. 2016). However, this
does not allow systematical analysis of all phases and it requires the generation of
multiple cell lines. In silico synchronization, a reporter-free approach, has been used in
live cell imaging (Sigal et al. 2006). First, cell division times were automatically detected
by the dynamical features of nuclear marker. Then, cells differing in cell cycle timing can

Discussion
73
be synchronized in silico by aligning the dynamics of nuclear marker between two division
events. The fraction of cell cycle that had elapsed was used to indicate cell cycle phases in
particular cell. However, since DNA damage changed the normal cell cycle duration, in
silico synchronization, then cannot be simply applied here.
To overcome the limitations, I employed another reporter-free system (Figure 36) which
combined labelling experiments and computational analysis to determine both initial
cellular state and final cell cycle phase. Briefly, cell division events prior to damage were
analyzed to indicate cycle phase at the time of damage (Figure 25B). After irradiation, cell
cycle progression was disturbed and most cells stopped dividing. Therefore, other method
is needed to monitor cell cycle progression. Gut and his colleagues described a method,
combining EdU labelling and machine learning algorithm to determine cell cycle phases
from fixed cells (Gut et al. 2015). I adapted this approach to live cell imaging (Figure 27).
Basically, EdU labelling is performed to determine S-phase cells at the end point, and semi-
supervised classification on nuclear size and DNA content was used to determine G1 and
G2-phase cells. Lastly, I applied image registration technique to align the EdU labelling
images to live cell images. These together allowed linking the dynamics to both initial and
final cell cycle phase in the same cells (Figure 36). By doing so, I observed a clear
association between dynamics and cell cycle state (Figure 28, Figure 29, Figure 30, Figure
31 and Figure 32), suggesting high robustness of this approach and shape-based
clustering considering that they were independently performed.

Discussion
74
Figure 36 Endpoint assay establishes connections between dynamics and cell fate decisions
3.4 Regrouping cells upon both dynamics and cell fate decisions highlights cell
cycle specific heterogeneity
Shape-based clustering resulted in four subgroups of different p21 responses (Figure 26).
Relatively homogeneous p21 dynamics within each subgroup did not mean similar
cellular outcomes, for example, ‘immediate 2’ cells showed comparable dynamics but had
non-unique cell fates (G1-arrest or G2-arrest) (Figure 30). Reversely, cell cycle
progression was different even for cells with similar responses, for instance, S-G2 cells
from ‘delayed 1’ and ‘delayed 2’ showed slightly different dynamics (Figure 31C and Figure
32C). To understand this heterogeneity of cellular dynamics and outcomes, I separately
investigated same cell cycle phases in each subgroup (Figure 29, Figure 30, Figure 31 and
Figure 32) and systematically analyzed the differences and similarities among each
smaller subpopulation (Figure 33 and Figure 37A), which allows regrouping p21
dynamics upon cell fate determinations. This resulted in three types of p21, including
p210-1-0 p210-1-1 and p210-0-1 (Figure 37A) and four main different cell fate decisions, such
as G1 arrest, G1-S progression, S-G2 and G2 arrest (Figure 33 and Figure 37B). Moreover,

Discussion
75
it revealed strong connections between p21 dynamics to both initial cell cycle phase and
final cell fate decisions.
G1-phase cells showed a bifurcation on p21 dynamics and cellular decisions following
damage-induced p53 activation (Figure 37B). p210-1-0 was correlated to G1-S progression
and p210-1-1 was associated with G1 arrest. p21 can influence cellular decisions through
inhibiting CDK2 activity in G1 phase (Neganova et al. 2011). Suppression of p21 results in
high CDK2 activity, driving the normal progression of cell cycle; on the other hand,
elevation of p21 inhibits CDK2 activity, sending cells into transient or prolonged G0-like
state (Spencer et al. 2013). This may explain why different p21 dynamics are correlated
to cellular decisions in G1 phase. It is interesting but not clear why G1-phase cells had
bifurcated p21 dynamics in response to homogeneous p53 dynamics. The analysis on
single cell traces suggested that degradation rate might differentiate these two
subpopulations (Figure 33D and E). Recent research suggested that two ubiquitin ligases
CRL4Cdt2 and SCFSkp2 together mediate p21 degradation prior to G1-S transition (Barr et
al. 2017). PCNA is involved in CRL4Cdt2-dependent p21 degradation. It can bind to p21 and
drive it to CRL4Cdt2 for degradation (Havens & Walter 2009). However, block of PCNA-p21
interaction by mutating PIP box domain did not prevent the bifurcation in p21 dynamics
(Figure 26 A and G). This implies that CRL4Cdt2-mediated degradation may not be the
reason to cause the heterogeneous p21 responses in G1-phase cells. It was also reported
that Mdm2 and Mdm4 were able to promote p21 degradation in late G1 and early S phase
probably by recruiting p21 to the 26S proteasome complex (Jin et al. 2003; Jin et al. 2008).
These are the potential targets for further efforts to identify the molecular mechanisms
determining this bifurcation.
S-phase cells showed ‘delayed’ responses with p210-0-1(Figure 37B), revealed by division
analysis and confirmed by sequential BrdU labelling experiments (Figure 25). S-phase
cells in ‘delayed 1’ and ‘delayed 2’ had differences in the reacting time and cell division
time (Figure 31C and Figure 32C). The re-elevation of p21 was hypothesized to be a signal
of G2 entry, the differences between ‘delayed 1’ and ‘delayed 2’ seemed to agree with this
point. ‘Delayed 1’ cells had divided earlier (Figure 33G), meaning that they entered S phase
earlier. It is reasoned that they also entered G2 phase earlier since S phase delay induced
by irradiation is transient and short (Iliakis et al. 2003). Indeed, re-elevation of p21 in

Discussion
76
‘delayed 1’ cells occurred earlier, which might indicate the G2 entry (Figure 31C and Figure
32C). However, further investigations are needed to get a solid conclusion.
Why did S-phase cells have low p21 levels? p53 remained active during S phase after
irradiation (Figure 26B and C), suggesting that transcription of p21 was unlikely as low as
in basal condition. A recent report showed that post-translational regulation of p21 led to
delayed accumulation in S-phase cells (Stewart-Ornstein & Lahav 2016). However, this
report did not reveal which mechanisms were involved in p21 regulation during S phase.
In my thesis, I targeted an S-phase specific factor, PCNA, which can facilitate CRL4Cdt2-
dependent ubiquitination of p21 by binging to PIP Box motif (Havens & Walter 2009;
Galanos et al. 2016). The PIP Box-mutated cells showed more homogeneous p21 response,
especially p21 accumulated in all cells immediately after DNA damage (Figure 34). This
provided strong evidence for PCNA-mediated degradation determining the delayed
response of p21 during S phase. There are several hypotheses about the biochemical
function of p21-PCNA interaction. It may competitively inhibit other proteins, which also
contain PIP Box domain, such as DNA polymerase-, - and DNMT1 (Cazzalini et al. 2010;
Abbas & Dutta 2009), by which expression of p21 thereby can indirectly modulate DNA
synthesis and DNA repair. Additionally, a recent report showed that overexpressing p21
led to deregulated origin licensing and replication stress in absence of p53, by
overconsuming the CRL4CDT2 ubiquitin ligase together with PCNA (Galanos et al. 2016).
However, the interaction at endogenous level is still poorly understood. The p21PIPmut cell
line created in this thesis provides a robust tool to further study the direction, moreover,
this idea can be expanded to other proteins with PIP Box domain.
G2-phase cells showed homogeneous p210-1-1 dynamics and homogeneous outcomes
(Figure 30C and Figure 37A). The dynamical patterns were highly similar between two
arrested populations (G1 arrest and G2 arrest, Figure 37A), such as p21 maximum, p21
integral, decay rate and p21 end level (Figure 33J-M). The decay rate and final p21 level
were clearly different between arrested population (G1 arrest and G2 arrest) and
transited population (G1-S cells) (Figure 33D and E). These suggest that the low decay
rate and high final p21 level were probably key signals to prevent cell cycle transition,
since sustained high p21 may continually inhibit CDK1 activity in G2 phase (Charrier-
Savournin et al. 2004) or CDK2 activity during G1 phase (Neganova et al. 2011) (Figure
37B).

Discussion
77
In addition, there were also about 6% of cells undergoing mitosis and being in G1 phase
at the end of experiment (Figure 32B and Figure 37A). The initial cellular states could not
be determined using current analysis as cell divisions were equally distributed
throughout the period before irradiation (Figure 32B). These cells all had p210-0-1
dynamics (Figure 37A) and the low p21 level might not successfully prevent mitosis. This
may also explain the slight difference in cell cycle distribution after damage between
PCP45 and its parental cell lines, including wild type MCF10A and PC21. Provided that the
fusion protein p21-mCherry partially stabilize p21 in PCP45 cells (Figure 16 and Figure
18D), they would have less chance to escape G2 arrest to enter G1 phase, which fits the
observations of cell cycle distributions (Figure 17 and Figure 18E).
As summarized in Figure 37B, cells synchronously activate p53 network to induce p21
expression in response to DNA damage. Cell cycle specific factors drive p21 degradation
in different rates, which generate heterogeneous p21 dynamics in different cellular states.
Especially, PCNA-mediated degradation determines the ‘delayed’ response in S-phase
cells. These varying dynamics probably regulate cell fate decisions by controlling the
activity of CDK/Cyclin complexes.

Discussion
78
Figure 37 Post-translational regulations determine p21 heterogeneous dynamics in different
cellular states (A) Summary of various p21 dynamics and cellular outcomes. (B) The illustration of p21 model in p53 dependent DNA damage response.
3.5 Insights and challenges in investigation of cellular heterogeneity
Time-lapse microscopy allows investigating cellular and molecular behaviors with highly
spatio-temporal resolution, but the number of proteins that can be measured in a single

Discussion
79
experiment is limited due to the properties of fluorescent proteins and microscopy
setting. This hinders the comprehensive understanding of cellular heterogeneity. An
endpoint analysis allows additional measurements of other objects. Besides EdU labelling,
immunofluorescence or single molecule fluorescent in situ hybridization (smFISH) can in
principle link the dynamical behavior to other biomarkers (Yang et al. 2017). Especially,
multiplexed immunofluorescence and smFISH which allows measuring multiple proteins
or mRNAs in single cells (Gerdes et al. 2013; Chen et al. 2015) will largely extend the
throughput of biomarkers measured in the same cells after the signaling dynamics. This
direction is frequently discussed recently (Skylaki et al. 2016; Yuan et al. 2017), and my
project provides a paradigm for how to investigate the link at single cell level from
signaling dynamics to cellular states, such as cell cycle phases or states in which cells have
differentially expressed mRNAs or proteins.
Characterizing cell-to-cell variability has also shown importance in clinical applications,
for instance, studies of tumor heterogeneity revealed mechanisms of chemotherapy drug
resistance and can be applied to guide precision medicine for each patient and each tumor
type (Meacham & Morrison 2013; Bedard et al. 2013; Junttila & de Sauvage 2013; Schmitt
et al. 2015). Most studies focused so far on genetic variations among tumor populations,
which can be measured by single cell DNA sequencing (Y. Wang et al. 2014; Bedard et al.
2013). Recently, Andrew L. Paek and his colleagues reported the role of p53 dynamics in
drug resistance of colon cancer cells using time-lapse microscopy (Paek et al. 2016). The
fraction of cell death was related to both the time and level of p53. A threshold of p53 level
was required to reached to induce apoptosis and interestingly, this threshold was
increasing over time. This report underlined the importance of studying tumor
heterogeneity in a dynamic perspective. Live-cell imaging generates large datasets every
day, whereas the development of computational and theoretical tools is far behind
experimental approaches (Skylaki et al. 2016). Tight combination of experimental setting
and computational tools in this field will significantly expand our understanding in both
biological and medical research.

80
4 Methods and materials
4.1 Cell culture
Human embryonic kidney (HEK) cell line 293T was maintained in Dulbecco’s modified
Eagle’s medium (DMEM, high glucose, Thermo Fisher Scientific) with 10% fetal bovine
serum (Invitrogen), 100 U/ml penicillin and 100 g/ml streptomycin. Cells were seeded
in 12-well plate at a density of 175000 cells/well 24 hours prior to transfection. Cells were
transfected using TransIT-LT1 transfection reagent (Mirus) following the manufacturer’s
instruction. A total of 1 g product, including 500 ng Cas9 (or Cas9n) plasmid and 500 ng
sgRNA(s) (either plasmid or PCR product), was transfected. 24 hours later, transfection
reagent medium was replaced with fresh growth medium.
Human non-transformed breast epithelial cell line MCF10A was maintained in Dulbecco's
Modified Eagle Medium (DMEM/F12, Thermo Fisher Scientific) supplemented with 5%
horse serum (PAN-Biotech), 20 ng/ml EGF (Peprotech), 0.5 g/ml Hydrocortisone
(Sigma-Aldrich), 100 g/ml Cholera toxin (Sigma-Aldrich), 10 g/ml Insulin (Sigma-
Aldrich), 100 U/ml penicillin (Thermo Fisher Scientific) and 100 g/ml streptomycin
(Thermo Fisher Scientific), according to the description (Debnath et al. 2003).
4.2 Plasmids and cloning
The integrated construct co-expressing sgRNA_p53-T5 and Cas9 was cloned by inserting
the guide sequences into pSpCas9 (PX330, Addgene plasmid # 42230) which is a gift from
Feng Zhang’s lab (Cong et al. 2013). Separate Cas9 (Addgene plasmid # 41815), Cas9n
(Addgene plasmid # 41816) and sgRNA cloning vector (Addgene plasmid # 41824) are
gifts from George Church’s lab (Mali, Yang, et al. 2013). About 80 base pairs and an AgeI
site were inserted in the sgRNA cloning vector to obtain an optimal cloning vector
(sgRNA_AL, Loewer lab) which can reduce the cost for cloning further sgRNAs (Figure
38A). I used CRISPR Design tool (http://crispr.mit.edu) to design all sgRNA targets.

Methods and materials
81
Figure 38 Cloning strategies. (A) sgRNA cloning protocol. The target sequences are listed in Appendix. (B)
The cloning protocol of repair templates. Sequences of repair templates are listed in Appendix.

Methods and materials
82
To clone donor DNA, I first created an mCherry-LoxP-P2A-Neo-LoxP fragment into a
vector as an intermediate tool by Gibson Assembly (New England Biolabs). This fragment,
digested from the tool construct, together with fragments of homology arms amplified by
genomic PCR was assembled into pAAV-MCS vector (Cell Biolabs) or pDO3 vector (Lower
lab) (Figure 38B). pCS6-YFP-SMASh was a gift from Michael Lin (Addgene plasmid #
68853).
4.3 T7 endonuclease I assay
Function test of CRISPR/Cas9 was performed in HEK293T following the protocol
previously described (F. Ann Ran et al. 2013). In brief, indicated combinations of Cas9 and
sgRNA were transfected into HEK293T cells. 72 hours later, cells were harvested and
genomic DNA was extracted using the QIAamp DNA Mini and Blood Mini Kit (QIAGEN)
following the manufacturer’s protocol. The genomic regions containing cleavage sites
were amplified by PCR, and products were gel-purified using QIAamp gel Extraction Kit
(QIAGEN). 350 ng of the purified products were diluted in 20 l 1X Phusion DNA
Polymerase buffer (Thermo Fisher Scientific). The diluted products then were denatured
and reannealed using the following program:
cycle number condition 1 95C for 10 min 2 95-85C, -2C /s 3 85C for 1 min 4 85-75C, -0.3C /s 5 75C for 1 min 6 75-65C, -0.3C /s 7 65C for 1 min 8 65-55C, -0.3C /s 9 55C, 1 min 10 55-45C, -0.3C /s 11 45C, 1 min 12 45-35C, -0.3C /s 13 35C, 1 min 14 35-25C, -0.3C /s 15 25C for 1 min
After annealing, the products were mixed with 1 l T7 Endonuclease I (New England
Biolabs) and incubated at 37C for 1 hour, followed by DNA gel analysis. Intensities of DNA
bands were quantified in ImageJ and indel formation was calculated according to the
equation defined in a previous protocol (F Ann Ran et al. 2013).

Methods and materials
83
4.4 Endogenous tagging in MCF10A
MCF10A cells were seeded in 12-well plate at a density of 2.5x10⁵ cells/well 24 hours
prior to transfection. Cells were transfected using Lipofectamine 3000 (Life Technologies)
following the manufacturer’s instruction. A total of 1 g product, including 495 ng Cas9
(or Cas9n) plasmid, 495 ng sgRNA(s) and 10 ng donor DNA, was transfected. After 3 days,
cells were moved to 10 cm plate with G418-containing medium (400 g/ml, Carl Roth
GmbH + Co. KG) for selection. For the mutant cell line, 1 M was added to the medium
from the transfection to time-lapse microscopy. Another 14 days later, single colonies
emerged and the number of colonies were counted to estimate the insertion efficiency.
Colonies were then washed, trypsinized, picked, moved to 12-well plates and split
regularly. Genomic PCRs were performed using Phire Animal Tissue Direct PCR Kit
(Thermo Fisher Scientific) following the manufacturer’s protocol. PCR products of the
untagged alleles from heterozygotes were sequenced to ensure that no alterations
occurred. Excision of selection cassette was performed as previously described (Rago et
al. 2007). In brief, 5x10⁵ cells of selected clones were plated to a 25 cm2 cell culture flask.
24 hour later, 1 ml of Ad-cre virus stock (107 plaque forming units, Vector Biolabs) was
added to the flask and incubated with cells for 24 hours. Then cells were rinsed with 1x
HBSS (Thermo Fisher Scientific), detached with 1 ml of trypsin-EDTA, diluted to 50~100
cells/10 ml and seeded in 10 cm plates. After another two weeks, each colony was moved
into two separate well in 12-well plate. Cells were kept and validated by cell cycle assay,
microscopy and western blot.
4.5 Time-lapse microscopy
For live cell imaging, 1.5x10⁵ cells were plated in 3.5 cm Collagen-coated glass bottom
dishes (MatTek) two days before experiments. Two hours before imaging, cells were
washed twice with 1xPBS and media was replaced by FluoroBrite medium (Thermo
Fisher Scientific) supplemented with 0.5% horse serum and all other components
mentioned above to reduce the background. Additional 1 ml Anti-Evaporation Oil (Ibidi)
was added on the top to prevent medium evaporation. The dishes were placed in
incubation chamber with constant temperature (37 °C), CO2 concentration (5%), and
humidity maintained. Cells were imaged very 15 min or 20 mins on a Nikon Ti inverted
fluorescence microscope with a Hamamatsu Orca R2 or Nikon DS-Qi2 camera and a 20x
plan apo objective (NA 0.75) and image acquisition was controlled using Nikon Elements

Methods and materials
84
software. Appropriate filter sets were used (mCerulean: 438/24 nm excitation (EX), 458
nm dichroic beam splitter (BS), 483/32 nm emission (EM); mVenus: 500/24 nm EX, 520
nm BS, 542/27 nm EM; mCherry: 562/40 nm EX, 593 nm BS, 624/40 nm EM; Cy5: 628/40
nm EX, 692/40 nm EM; DAPI: 387/11 nm EX, 409 nm BS, 447/60 nm EM). Double strand
DNA breaks were induced by X-ray irradiation at dose rate of 1Gy / 26s (250 KeV, 10 mA).
4.6 Image analysis
As previously described (Finzel et al. 2016), cells were isolated and tracked from time-
series images using custom-written Matlab (MathWorks) scripts based on code developed
by the Alon lab (Cohen et al. 2008) and the CellProfiler project (Carpenter et al. 2006). In
brief, I first applied flat field correction and background subtraction to raw images,
followed by segmenting individual nuclei from nuclear marker images using thresholding
and seeded watershed algorithms. Segmented cells were then tracked in time-series
images using a greedy match algorithm. Only cells trackable through the full period of
experiments were considered. Cells were tracked in backward direction from the last to
the first time point. A self-developed Python3-based tool, image registration module was
performed before segmentation and tracking when shifting took place by taking dishes
out for irradiation or the endpoint assay. In detail, the shifted pixels between two images
were obtained from the maximum convolution calculated using fast Fourier transform
method (fftconvolve function in scipy package). The greatest common area was then
determined and cropped for all time points.
4.7 Shape-based clustering
Shape-based distance (SBD) was calculated using self-written Matlab scripts as previously
described (Paparrizos & Gravano 2015). In brief, p21 signal (�� ) after irradiation were
transformed into (𝑥′ ) to remove scaling variance using following equation.
𝑥′ = �� − 𝜇
𝜎
𝜇 and 𝜎 represent the mean and standard deviation, respectively.

Methods and materials
85
Cross-correlation was then used to determine the shift between two transformed signals
𝑎′ = (a1, a2, …, am) and 𝑏′ = (b1, b2, …, bm). It shifts 𝑎′ over 𝑏′ to generate a series of shifted
signals:
𝑎′(𝑠) { (0,0, … ,0, 𝑎1, 𝑎2, … , 𝑎𝑚); 𝑤ℎ𝑒𝑛 𝑠 ≥ 0, 𝑠 𝑧𝑒𝑟𝑜𝑠 𝑎𝑟𝑒 𝑖𝑛𝑠𝑒𝑟𝑡𝑒𝑑 𝑖𝑛𝑓𝑟𝑜𝑛𝑡 𝑜𝑓 𝑎′
(𝑎1, 𝑎2, … , 𝑎𝑚, 0,0, … ,0); 𝑤ℎ𝑒𝑛 𝑠 < 0, |𝑠| 𝑧𝑒𝑟𝑜𝑠 𝑎𝑟𝑒 𝑎𝑝𝑝𝑒𝑛𝑑𝑒𝑑 𝑎𝑡 𝑡ℎ𝑒 𝑒𝑛𝑑 𝑜𝑓 𝑎′
Here, 𝑎′(𝑠) represent shifted 𝑎′ with s unit. s ∈ [−𝑚,𝑚] since there are 2m-1 possibilities
of shifting. For each possibility, the correlation between 𝑎′(𝑠) and �� is calculated as:
𝐶𝑜𝑟𝑟(𝑎′(𝑠) , ��)
{
∑ 𝑎𝑙 ∗ 𝑏𝑙+𝑠
𝑚−𝑠
𝑙=1
; 𝑤ℎ𝑒𝑛 𝑠 ≥ 0
∑ 𝑎𝑙−𝑠 ∗ 𝑏𝑙;
𝑚+𝑠
𝑙=1
𝑤ℎ𝑒𝑛 𝑠 < 0
And distance between 𝑎′(𝑠) and �� is defined as:
𝐷𝑖𝑠𝑡(𝑎′(𝑠) , ��) =𝐶𝑜𝑟𝑟(𝑎′(𝑠) , ��)
√𝐶𝑜𝑟𝑟 (𝑎′(𝑠) , 𝑎′(𝑠) ) ∗ 𝐶𝑜𝑟𝑟(��, ��)
These 2m-1 distances form the cross-correlation sequence of 𝑎′ and 𝑏′ :
𝐶𝐶 = (𝐷𝑖𝑠𝑡 (𝑎′(−𝑚) , ��) , 𝐷𝑖𝑠𝑡 (𝑎′(1 −𝑚) , ��) , …𝐷𝑖𝑠𝑡(𝑎′(𝑚) , ��))
The shape-based distance between the original signals (�� and ��)) is defined as:
𝑆𝐵𝐷(��, ��) = 1 − max (𝐶𝐶 )
By doing so for each trajectory, I obtained the distance matrix, based on which the further
K-centroids clustering and binary tree were performed.
4.8 Cell cycle analysis
To validate the endogenous reporters, wild type MCF10A, PC21 and PCP45 were plated at
a density of 3~3.5x10⁵ cells in 6 cm plates two days before experiments. After 10 Gy -

Methods and materials
86
irradiation, cells were harvested at indicated time points, washed with 1xPBS, fixed with
ice-cold 80% Ethanol / 20% 1xPBS and stored at -20 °C until all samples were collected. I
washed the cells with 1xPBS again and stained the DNA with 25 g/ml PI in 0.1% Triton
1xPBS with 0.2 mg/ml RNAse A. DNA content was measured using flow cytometry
(Cytomics FC500, Beckman Coulter). Cell cycle phases were determined using FlowJo
software (FlowJo, LLC).
To assess the initial cell cycle phases for cells with different p21 responses, PCP45 cells
were imaged for about 20 hours prior to irradiation to monitor cell division events,
followed by irradiation and additional 24-hour imaging. The division time was used to
roughly estimate the cell cycle states. G2-phase cells should divide earlier than S and G1-
phase cells, and G1-phase cells should divide later than S-phase cells. By clustering p21
responses, cells were classified into two subgroups, ‘immediate’ or ‘delayed’ response.
Division time was analyzed between these two subgroups. Additional labeling
experiments were performed to validate the cell cycle prediction. At the end of 20-hour
pre-imaging, I added 10 M BrdU in cell culture 30 minutes before irradiation to label S-
phase cells and washed it away after irradiation. Then cells were irradiated, imaged for
another 24 hours and fixed to detect BrdU signals. This allows linking p21 dynamics to
initial cell cycle phases.
To measure the final cell cycle phases, EdU (EdU Click-647, Carl Roth GmbH + Co. KG) was
added in cell culture 30 minutes before the end of live-cell imaging and detected
immediately after imaging. EdU intensities were sorted and an edge detection algorithm
was performed to determine the S-phase cells. In order to distinguish G1- and G2-phase
cells, Hoechst staining was performed to measure the DNA content and to mark nuclear
sizes, upon which cells were classified into two groups (G1-phase and G2-phase) using K-
means (K=2) classification.
4.9 Immunofluorescence
Cells were plated at a density of 1.5x10⁵ cells in 3.5 cm Collagen-coated glass bottom
dishes (MatTek) two days before experiments. After 10 Gy -irradiation, cells were fixed
at indicated time points with 2% paraformaldehyde. Cells were permeabilized with 0.1%
Triton X-100 in 1xPBS, blocked with 10% goat serum in 1xPBS, incubated with primary
antibody in 1% BSA in 1xPBS, washed with 0.1% Triton X-100 in PBS, and incubated with

Methods and materials
87
secondary antibody conjugated with Alexa Fluor 647 (#A-21245, Thermo Fisher Scientific)
in 1% BSA in PBS. After washing, cells were stained with 2 µg/ml Hoechst in 0.1% Triton
X-100/PBS and imaged with a 20x plan apo objective (NA 0.75) using appropriate filter
sets. Automated segmentation was performed in Matlab (MathWorks) with algorithms
from CellProfiler (Carpenter et al, 2006).
4.10 Immunoblotting
Cells were plated two days at a density of 3.5x10⁵ cells in 6 cm plates before experiments.
After 10 Gy -irradiation, cells were harvested at indicated time points to extract proteins
by lysis in the presence of protease and phosphatase inhibitors. BCA assay (Thermo Fisher
Scientific) was used to measure total protein concentrations. Equal amounts of protein
were separated by electrophoreses on 10% SDS polyacrylamide gels and transferred to
Nitrocellulose membranes (Thermo Fisher Scientific) by electroblotting (Bio Rad). I
blocked membranes with 5% non-fat dried milk, incubated them overnight with primary
antibody, washed them, incubated them with secondary antibody coupled to peroxidase
(#31460, Thermo Fisher Scientific), washed again and detected protein levels using
chemoluminescence (ECL Prime, GE Healthcare).

88
5 References
Abbas, T. & Dutta, A., 2011. CRL4Cdt2: Master coordinator of cell cycle progression and genome stability. Cell Cycle, 10(2), pp.241–249.
Abbas, T. & Dutta, A., 2009. P21 in Cancer: Intricate Networks and Multiple Activities. Nature Reviews Cancer, 9(6), pp.400–414. Available at: http://www.nature.com/doifinder/10.1038/nrc2657.
Amador, V. et al., 2007. APC/CCdc20 Controls the Ubiquitin-Mediated Degradation of p21 in Prometaphase. Molecular Cell, 27(3), pp.462–473.
Anders, C. et al., 2014. Structural basis of PAM-dependent target DNA recognition by the Cas9 endonuclease. Nature, 513(7519), pp.569–573. Available at: http://www.nature.com/doifinder/10.1038/nature13579.
Bajar, B.T. et al., 2016. Fluorescent indicators for simultaneous reporting of all four cell cycle phases. Nature Methods, 13(12), pp.993–996. Available at: http://www.nature.com/doifinder/10.1038/nmeth.4045.
Barr, A.R. et al., 2017. DNA damage during S-phase mediates the proliferation-quiescence decision in the subsequent G1 via p21 expression. Nature Communications, 8, p.14728. Available at: http://www.nature.com/doifinder/10.1038/ncomms14728.
Bashir, T. et al., 2004. Control of the SCFSkp2–Cks1 ubiquitin ligase by the APC/CCdh1 ubiquitin ligase. Nature, 428(6979), pp.190–193. Available at: http://www.nature.com/doifinder/10.1038/nature02330.
Batchelor, E. et al., 2008. Recurrent Initiation: A Mechanism for Triggering p53 Pulses in Response to DNA Damage. Molecular Cell, 30(3), pp.277–289.
Batchelor, E. et al., 2011. Stimulus-dependent dynamics of p53 in single cells. Molecular Systems Biology, 7(1), pp.488–488. Available at: http://msb.embopress.org/cgi/doi/10.1038/msb.2011.20.
Bedard, P.L. et al., 2013. Tumour heterogeneity in the clinic. Nature, 501(7467), pp.355–364. Available at: http://www.nature.com/doifinder/10.1038/nature12627.
Besson, A., Dowdy, S.F. & Roberts, J.M., 2008. CDK Inhibitors: Cell Cycle Regulators and Beyond. Developmental Cell, 14(2), pp.159–169.
Böttcher, R. et al., 2014. Efficient chromosomal gene modification with CRISPR/cas9 and PCR-based homologous recombination donors in cultured Drosophila cells. Nucleic Acids Research, 42(11), pp.e89–e89. Available at: http://nar.oxfordjournals.org/lookup/doi/10.1093/nar/gku289.
Bunz, F., 1998. Requirement for p53 and p21 to Sustain G2 Arrest After DNA Damage. Science, 282(5393), pp.1497–1501. Available at: http://www.sciencemag.org/cgi/doi/10.1126/science.282.5393.1497.
Cappell, S.D. et al., 2016. Irreversible APCCdh1 Inactivation Underlies the Point of No Return for Cell-Cycle Entry. Cell, 166(1), pp.167–180. Available at: http://dx.doi.org/10.1016/j.cell.2016.05.077.
Carpenter, A.E. et al., 2006. CellProfiler: image analysis software for identifying and quantifying cell phenotypes. Genome biology, 7(10), p.R100.
Cazzalini, O. et al., 2010. Multiple roles of the cell cycle inhibitor p21CDKN1A in the DNA damage response. Mutation Research - Reviews in Mutation Research, 704(1–3), pp.12–20. Available at: http://www.sciencedirect.com/science/article/pii/S138357421000013X.
Charrier-Savournin, F.B. et al., 2004. p21-Mediated nuclear retention of cyclin B1-Cdk1 in response to genotoxic stress. Molecular biology of the cell, 15(9), pp.3965–76.

References
89
Available at: http://www.ncbi.nlm.nih.gov/pubmed/15181148%5Cnhttp://www.pubmedcentral.nih.gov/articlerender.fcgi?artid=PMC515331.
Chen, K.H. et al., 2015. Spatially resolved, highly multiplexed RNA profiling in single cells. Science, 348(6233), p.aaa6090-aaa6090. Available at: http://www.sciencemag.org/cgi/doi/10.1126/science.aaa6090.
Cheng, M., 1999. The p21Cip1 and p27Kip1 CDK `inhibitors’ are essential activators of cyclin D-dependent kinases in murine fibroblasts. The EMBO Journal, 18(6), pp.1571–1583. Available at: http://emboj.embopress.org/cgi/doi/10.1093/emboj/18.6.1571.
Cho, S.W. et al., 2014. Analysis of off-target effects of CRISPR/Cas-derived RNA-guided endonucleases and nickases. Genome Research, 24(1), pp.132–141.
Chung, H.K. et al., 2015. Tunable and reversible drug control of protein production via a self-excising degron. Nature Chemical Biology, 11(9), pp.713–720. Available at: http://www.nature.com/doifinder/10.1038/nchembio.1869.
Ciccia, A. & Elledge, S.J., 2010. The DNA Damage Response: Making It Safe to Play with Knives. Molecular Cell, 40(2), pp.179–204.
Cohen-Saidon, C. et al., 2009. Dynamics and Variability of ERK2 Response to EGF in Individual Living Cells. Molecular Cell, 36(5), pp.885–893. Available at: http://linkinghub.elsevier.com/retrieve/pii/S1097276509008661.
Cohen, A.A. et al., 2008. Dynamic Proteomics of Individual Cancer Cells in Response to a Drug. Science, 322(5907), pp.1511–1516. Available at: http://www.sciencemag.org/cgi/doi/10.1126/science.1160165.
Coleman, K.E. et al., 2015. Sequential replication-coupled destruction at G1/S ensures genome stability. Genes and Development, 29(16), pp.1734–1746.
Cong, L. et al., 2013. Multiplex genome engineering using CRISPR/Cas systems. Science (New York, N.Y.), 339(6121), pp.819–23. Available at: http://www.ncbi.nlm.nih.gov/pubmed/23287718%5Cnhttp://www.pubmedcentral.nih.gov/articlerender.fcgi?artid=PMC3795411.
Ben David, Y. et al., 1988. Inactivation of the p53 oncogene by internal deletion or retroviral integration in erythroleukemic cell lines induced by Friend leukemia virus. Oncogene, 3(2), pp.179–185. Available at: http://www.ncbi.nlm.nih.gov/pubmed/2842714.
Davis, D.M. & Purvis, J.E., 2015. Computational analysis of signaling patterns in single cells. Seminars in Cell & Developmental Biology, 37, pp.35–43. Available at: http://linkinghub.elsevier.com/retrieve/pii/S1084952114002705.
Debnath, J., Muthuswamy, S.K. & Brugge, J.S., 2003. Morphogenesis and oncogenesis of MCF-10A mammary epithelial acini grown in three-dimensional basement membrane cultures. Methods, 30(3), pp.256–268.
DeLeo, A.B. et al., 1979. Detection of a transformation-related antigen in chemically induced sarcomas and other transformed cells of the mouse. Proceedings of the National Academy of Sciences of the United States of America, 76(5), pp.2420–4. Available at: http://www.pubmedcentral.nih.gov/articlerender.fcgi?artid=383613&tool=pmcentrez&rendertype=abstract.
Doench, J.G. et al., 2014. Rational design of highly active sgRNAs for CRISPR-Cas9–mediated gene inactivation. Nature Biotechnology, 32(12), pp.1262–1267. Available at: http://www.nature.com/doifinder/10.1038/nbt.3026.
Efeyan, A. & Serrano, M., 2007. p53: Guardian of the genome and policeman of the oncogenes. Cell Cycle, 6(9), pp.1006–1010.

References
90
El-Deiry, W.S. et al., 1993. WAR1, a Potential Mediator of 53 Tumor Suppression. Cell, 75, pp.817–825.
Eliyahu, D. et al., 1988. Meth A fibrosarcoma cells express two transforming mutant p53 species. Oncogene, 3(3), pp.313–21. Available at: http://www.ncbi.nlm.nih.gov/pubmed/3060794.
Eliyahu, D. et al., 1984. Participation of p53 cellular tumour antigen in transformation of normal embryonic cells. Nature, 312(5995), pp.646–649. Available at: http://www.nature.com/doifinder/10.1038/312646a0.
Finlay, C.A., Hinds, P.W. & Levine, A.J., 1989. The p53 proto-oncogene can act as a suppressor of transformation. Cell, 57(7), pp.1083–1093.
Finzel, A. et al., 2016. Hyper-activation of ATM upon DNA-PKcs inhibition modulates p53 dynamics and cell fate in response to DNA damage. Molecular biology of the cell, pp.1–18.
Fischer, M., 2017. Census and evaluation of p53 target genes. Oncogene, 36(28), pp.3943–3956. Available at: http://www.nature.com/doifinder/10.1038/onc.2016.502.
Fu, Y. et al., 2013. High-frequency off-target mutagenesis induced by CRISPR-Cas nucleases in human cells. Nature Biotechnology, 31(9), pp.822–826. Available at: http://www.nature.com/doifinder/10.1038/nbt.2623.
Galanos, P. et al., 2016. Chronic p53-independent p21 expression causes genomic instability by deregulating replication licensing. Nature Cell Biology, 18(7), pp.777–89. Available at: http://www.nature.com/doifinder/10.1038/ncb3378.
Gerdes, M.J. et al., 2013. Highly multiplexed single-cell analysis of formalin-fixed, paraffin-embedded cancer tissue. Proceedings of the National Academy of Sciences of the United States of America, 110(29), pp.11982–11987.
Guardavaccaro, D. & Pagano, M., 2006. Stabilizers and Destabilizers Controlling Cell Cycle Oscillators. Molecular Cell, 22(1), pp.1–4.
Gupta, R.M. & Musunuru, K., 2014. Expanding the genetic editing tool kit: ZFNs, TALENs, and CRISPR-Cas9. Journal of Clinical Investigation, 124(10), pp.4154–4161.
Gut, G. et al., 2015. Trajectories of cell-cycle progression from fixed cell populations. Nature Methods, 12(10), pp.951–954. Available at: http://www.nature.com/doifinder/10.1038/nmeth.3545.
Halevy, O. et al., 1991. Frequent p53 mutations in chemically induced murine fibrosarcoma. Oncogene, 6(9), pp.1593–1600. Available at: http://www.ncbi.nlm.nih.gov/htbin-post/Entrez/query?db=m&form=6&dopt=r&uid=1923526.
Havens, C.G. & Walter, J.C., 2009. Docking of a Specialized PIP Box onto Chromatin-Bound PCNA Creates a Degron for the Ubiquitin Ligase CRL4Cdt2. Molecular Cell, 35(1), pp.93–104. Available at: http://dx.doi.org/10.1016/j.molcel.2009.05.012.
Hsu, P.D. et al., 2013. DNA targeting specificity of RNA-guided Cas9 nucleases. Nature Biotechnology, 31(9), pp.827–832. Available at: http://www.nature.com/doifinder/10.1038/nbt.2647.
Huang, S. et al., 2003. Sustained activation of the JNK cascade and rapamycin-induced apoptosis are suppressed by p53/p21Cip1. Molecular Cell, 11(6), pp.1491–1501.
Iliakis, G. et al., 2003. DNA damage checkpoint control in cells exposed to ionizing radiation. Oncogene, 22(37), pp.5834–5847. Available at: http://www.nature.com/doifinder/10.1038/sj.onc.1206682.
Jenkins, J.R., Rudge, K. & Currie, G.A., 1984. Cellular immortalization by a cDNA clone encoding the transformation- associated phosphoprotein p53. Nature, 312, pp.651–654.

References
91
Jeschke, M., Baumgärtner, S. & Legewie, S., 2013. Determinants of Cell-to-Cell Variability in Protein Kinase Signaling. PLoS Computational Biology, 9(12).
Jin, Y. et al., 2003. MDM2 promotes p21waf1/cip1 proteasomal turnover independently of ubiquitylation. EMBO Journal, 22(23), pp.6365–6377.
Jin, Y. et al., 2008. MDMX promotes proteasomal turnover of p21 at G1 and early S phases independently of, but in cooperation with, MDM2. Molecular and cellular biology, 28(4), pp.1218–1229.
Jinek, M. et al., 2012. A Programmable Dual-RNA-Guided DNA Endonuclease in Adaptive Bacterial Immunity. Science, 337(6096), pp.816–821. Available at: http://www.sciencemag.org/cgi/doi/10.1126/science.1225829.
Jinek, M. et al., 2013. RNA-programmed genome editing in human cells. eLife, 2013(2), pp.1–9.
Junttila, M.R. & de Sauvage, F.J., 2013. Influence of tumour micro-environment heterogeneity on therapeutic response. Nature, 501(7467), pp.346–354. Available at: http://www.nature.com/doifinder/10.1038/nature12626.
Karimian, A., Ahmadi, Y. & Yousefi, B., 2016. Multiple functions of p21 in cell cycle , apoptosis and transcriptional regulation after DNA damage. DNA Repair, 42, pp.63–71. Available at: http://dx.doi.org/10.1016/j.dnarep.2016.04.008.
Kastenhuber, E.R. & Lowe, S.W., 2017. Putting p53 in Context. Cell, 170(6), pp.1062–1078. Available at: http://linkinghub.elsevier.com/retrieve/pii/S0092867417309534.
Kim, J.H. et al., 2011. High cleavage efficiency of a 2A peptide derived from porcine teschovirus-1 in human cell lines, zebrafish and mice. PLoS ONE, 6(4), pp.1–8.
Kruiswijk, F., Labuschagne, C.F. & Vousden, K.H., 2015. p53 in survival, death and metabolic health: a lifeguard with a licence to kill. Nature Reviews Molecular Cell Biology, 16(7), pp.393–405. Available at: http://www.nature.com/doifinder/10.1038/nrm4007.
Kurki, P. et al., 1986. Expression of proliferating cell nuclear antigen (PCNA)/cyclin during the cell cycle. Experimental Cell Research, 166(1), pp.209–219.
Lahav, G. et al., 2004. Dynamics of the p53-Mdm2 feedback loop in individual cells. Nature Genetics, 36(2), pp.147–150. Available at: http://www.nature.com/doifinder/10.1038/ng1293.
Lane, D.P. & Crawford, L.V., 1979. T antigen is bound to a host protein in SY40-transformed cells. Nature, 278, p.261. Available at: http://www.nature.com/nature/journal/v278/n5701/pdf/278261a0.pdf.
Lane, K. et al., 2017. Measuring Signaling and RNA-Seq in the Same Cell Links Gene Expression to Dynamic Patterns of NF-κB Activation. Cell Systems, 4(4), p.458–469.e5.
Lee, E.-W. et al., 2009. Differential regulation of p53 and p21 by MKRN1 E3 ligase controls cell cycle arrest and apoptosis. The EMBO Journal, 28(14), pp.2100–2113. Available at: http://emboj.embopress.org/cgi/doi/10.1038/emboj.2009.164.
Di Leonardo, A. et al., 1994. DNA damage triggers a prolonged p53-dependent G1 arrest and long-term induction of Cip1 in normal human fibroblasts. Genes and Development, 8(21), pp.2540–2551.
Levine, A.J. & Oren, M., 2009. The first 30 years of p53: growing ever more complex. Nature Reviews Cancer, 9(10), pp.749–758. Available at: http://www.nature.com/doifinder/10.1038/nrc2723.
Li, C. & Jin, J., 2010. DNA replication licensing control and rereplication prevention. Protein and Cell, 1(3), pp.227–236.
Lin, T. & Lin, Y., 2017. p53 switches off pluripotency on differentiation. Stem Cell

References
92
Research & Therapy, 8(1), p.44. Available at: http://stemcellres.biomedcentral.com/articles/10.1186/s13287-017-0498-1.
Lin, Y. et al., 2014. CRISPR/Cas9 systems have off-target activity with insertions or deletions between target DNA and guide RNA sequences. Nucleic Acids Research, 42(11), pp.7473–7485. Available at: http://nar.oxfordjournals.org/lookup/doi/10.1093/nar/gku402.
Linzer, D.I.H. & Levine, A.J., 1979. Characterization of a 54K Dalton cellular SV40 tumor antigen present in SV40-transformed cells and uninfected embryonal carcinoma cells. Cell, 17(1), pp.43–52.
Loewer, A. et al., 2010. Basal Dynamics of p53 Reveal Transcriptionally Attenuated Pulses in Cycling Cells. Cell, 142(1), pp.89–100. Available at: http://linkinghub.elsevier.com/retrieve/pii/S0092867410005672.
Loewer, A. & Lahav, G., 2011. We are all individuals: Causes and consequences of non-genetic heterogeneity in mammalian cells. Current Opinion in Genetics and Development, 21(6), pp.753–758. Available at: http://linkinghub.elsevier.com/retrieve/pii/S0959437X11001456.
Lu, X. et al., 2007. The Wip1 Phosphatase Acts as a Gatekeeper in the p53-Mdm2 Autoregulatory Loop. Cancer Cell, 12(4), pp.342–354.
Lukas, J. & Bartek, J., 2004. Cell division: the heart of the cycle. Nature, 432(7017), pp.564–567. Available at: http://www.nature.com/nature/journal/v432/n7017/pdf/432564a.pdf.
Maiuri, M.C. et al., 2010. Autophagy regulation by p53. Current Opinion in Cell Biology, 22(2), pp.181–185.
Mali, P., Aach, J., et al., 2013. CAS9 transcriptional activators for target specificity screening and paired nickases for cooperative genome engineering. Nature Biotechnology, 31(9), pp.833–838. Available at: http://www.nature.com/doifinder/10.1038/nbt.2675.
Mali, P., Yang, L., et al., 2013. RNA-Guided Human Genome Engineering via Cas9 Prashant. Science, 339(6121), pp.823–826. Available at: http://www.ncbi.nlm.nih.gov/pubmed/23287722.
Meacham, C.E. & Morrison, S.J., 2013. Tumour heterogeneity and cancer cell plasticity. Nature, 501(7467), pp.328–337. Available at: http://www.nature.com/doifinder/10.1038/nature12624.
Miller, J.C. et al., 2007. An improved zinc-finger nuclease architecture for highly specific genome editing. Nature Biotechnology, 25(7), pp.778–785. Available at: http://www.nature.com/doifinder/10.1038/nbt1319.
Moldovan, G.L., Pfander, B. & Jentsch, S., 2007. PCNA, the Maestro of the Replication Fork. Cell, 129(4), pp.665–679.
Mortusewicz, O. et al., 2005. Recruitment of DNA methyltransferase I to DNA repair sites. Proceedings of the National Academy of Sciences of the United States of America, 102(25), pp.8905–9. Available at: http://www.pubmedcentral.nih.gov/articlerender.fcgi?artid=1157029&tool=pmcentrez&rendertype=abstract.
Nakano, K. & Vousden, K.H., 2001. PUMA, a novel proapoptotic gene, is induced by p53. Molecular Cell, 7(3), pp.683–694. Available at: http://www.sciencedirect.com/science/article/pii/S1097276501002143.
Neganova, I. et al., 2011. An important role for CDK2 in G1 to S checkpoint activation and DNA damage response in human embryonic stem cells. Stem Cells, 29(4), pp.651–659.
Ng, C.-C. et al., 2003. p53RFP, a p53-inducible RING-finger protein, regulates the stability
References
93
of p21WAF1. Oncogene, 22(28), pp.4449–58. Available at: http://www.ncbi.nlm.nih.gov/pubmed/12853982.
Nishimasu, H. et al., 2014. Crystal structure of Cas9 in complex with guide RNA and target DNA. Cell, 156(5), pp.935–949. Available at: http://www.ncbi.nlm.nih.gov/pubmed/24529477.
Paek, A.L. et al., 2016. Cell-to-Cell Variation in p53 Dynamics Leads to Fractional Killing. Cell, 165(3), pp.631–642. Available at: http://dx.doi.org/10.1016/j.cell.2016.03.025.
Paparrizos, J. & Gravano, L., 2017. Fast and Accurate Time-Series Clustering. ACM Transactions on Database Systems, 42(2), pp.1–49. Available at: http://dl.acm.org/citation.cfm?doid=3086510.3044711.
Paparrizos, J. & Gravano, L., 2015. k-Shape: efficient and accurate clustering of time series. Proceedings of the 2015 ACM SIGMOD International Conference on Management of Data - SIGMOD ’15, pp.1855–1870. Available at: http://dl.acm.org/citation.cfm?doid=2723372.2737793.
Pelkmans, L., 2012. Using Cell-to-Cell Variability--A New Era in Molecular Biology. Science, 336(6080), pp.425–426. Available at: http://www.sciencemag.org/cgi/doi/10.1126/science.1222161.
Petroski, M.D. & Deshaies, R.J., 2005. Function and regulation of cullin–RING ubiquitin ligases. Nature Reviews Molecular Cell Biology, 6(1), pp.9–20. Available at: http://www.nature.com/doifinder/10.1038/nrm1547.
Porter, J.R., Fisher, B.E. & Batchelor, E., 2016. P53 Pulses Diversify Target Gene Expression Dynamics in an mRNA Half-Life-Dependent Manner and Delineate Co-regulated Target Gene Subnetworks. Cell Systems, 2(4), pp.272–282. Available at: http://dx.doi.org/10.1016/j.cels.2016.03.006.
Purvis, J.E. et al., 2012. p53 Dynamics Control Cell Fate. Science, 336(6087), pp.1440–1444. Available at: http://www.sciencemag.org/cgi/doi/10.1126/science.1218351.
Purvis, J.E. & Lahav, G., 2013. Encoding and decoding cellular information through signaling dynamics. Cell, 152(5), pp.945–956. Available at: http://linkinghub.elsevier.com/retrieve/pii/S0092867413001530.
Rago, C., Vogelstein, B. & Bunz, F., 2007. Genetic knockouts and knockins in human somatic cells. Nature Protocols, 2(11), pp.2734–2746. Available at: http://www.ncbi.nlm.nih.gov/pubmed/18007609%5Cnhttp://www.nature.com/nprot/journal/v2/n11/pdf/nprot.2007.408.pdf.
Ran, F.A. et al., 2013. Double nicking by RNA-guided CRISPR cas9 for enhanced genome editing specificity. Cell, 154(6), pp.1380–1389. Available at: http://dx.doi.org/10.1016/j.cell.2013.08.021.
Ran, F.A. et al., 2013. Genome engineering using the CRISPR-Cas9 system. Nature Protocols, 8(11), pp.2281–2308. Available at: http://www.nature.com/doifinder/10.1038/nprot.2013.143.
Riley, T. et al., 2008. Transcriptional control of human p53-regulated genes. Nature Reviews Molecular Cell Biology, 9(5), pp.402–412. Available at: http://www.nature.com/doifinder/10.1038/nrm2395.
Rodier, G. et al., 2008. Phosphorylation of Skp2 regulated by CDK2 and Cdc14B protects it from degradation by APC(Cdh1) in G1 phase. The EMBO journal, 27(4), pp.679–691.
Romanov, V.S. & Rudolph, K.L., 2016. P21 Shapes Cancer Evolution. Nature Cell Biology, 18(7), pp.722–724. Available at: http://www.nature.com/doifinder/10.1038/ncb3382.
Rotter, V., 1983. p53, a transformation-related cellular-encoded protein, can be used as a

References
94
biochemical marker for the detection of primary mouse tumor cells. Proceedings of the National Academy of Sciences of the United States of America, 80(9), pp.2613–2617. Available at: http://www.pubmedcentral.nih.gov/articlerender.fcgi?artid=393877&tool=pmcentrez&rendertype=abstract%5Cnhttp://www.ncbi.nlm.nih.gov/pubmed/6189126%5Cnhttp://www.pubmedcentral.nih.gov/articlerender.fcgi?artid=PMC393877.
Sakaue-Sawano, A. et al., 2008. Visualizing Spatiotemporal Dynamics of Multicellular Cell-Cycle Progression. Cell, 132(3), pp.487–498.
Sander, J.D. & Joung, J.K., 2014. CRISPR-Cas systems for editing, regulating and targeting genomes. Nature Biotechnology, 32(4), pp.347–355. Available at: http://www.nature.com/doifinder/10.1038/nbt.2842.
Schmitt, M.W., Loeb, L.A. & Salk, J.J., 2015. The influence of subclonal resistance mutations on targeted cancer therapy. Nature Reviews Clinical Oncology, 13(6), pp.335–347. Available at: http://www.nature.com/doifinder/10.1038/nrclinonc.2015.175.
Shieh, S.Y. et al., 1997. DNA damage-induced phosphorylation of p53 alleviates inhibition by MDM2. Cell, 91(3), pp.325–334.
Shreeram, S. et al., 2006. Wip1 Phosphatase Modulates ATM-Dependent Signaling Pathways. Molecular Cell, 23(5), pp.757–764.
Sigal, A. et al., 2006. Dynamic proteomics in individual human cells uncovers widespread cell-cycle dependence of nuclear proteins. Nature Methods, 3(7), pp.525–531. Available at: http://www.nature.com/doifinder/10.1038/nmeth892.
Skylaki, S., Hilsenbeck, O. & Schroeder, T., 2016. Challenges in long-term imaging and quantification of single-cell dynamics. Nature Biotechnology, 34(11), pp.1137–1144. Available at: http://www.nature.com/doifinder/10.1038/nbt.3713.
Snijder, B. & Pelkmans, L., 2011. Origins of regulated cell-to-cell variability. Nature Reviews Molecular Cell Biology, 12(2), pp.119–125. Available at: http://www.nature.com/doifinder/10.1038/nrm3044.
Spencer, S.L. et al., 2009. Non-genetic origins of cell-to-cell variability in TRAIL-induced apoptosis. Nature, 459(7245), pp.428–432. Available at: http://www.nature.com/doifinder/10.1038/nature08012.
Spencer, S.L. et al., 2013. The proliferation-quiescence decision is controlled by a bifurcation in CDK2 activity at mitotic exit. Cell, 155(2), pp.369–383. Available at: http://www.cell.com/cell/fulltext/S0092-8674(13)01143-4.
Starostina, N.G. & Kipreos, E.T., 2012. Multiple degradation pathways regulate versatile CIP/KIP CDK inhibitors. Trends in Cell Biology, 22(1), pp.33–41. Available at: http://dx.doi.org/10.1016/j.tcb.2011.10.004.
Stewart-Ornstein, J. & Lahav, G., 2016. Dynamics of CDKN1A in Single Cells Defined by an Endogenous Fluorescent Tagging Toolkit. Cell Reports, 14(7), pp.1800–1811. Available at: http://linkinghub.elsevier.com/retrieve/pii/S2211124716300237.
Stivala, L.A., Cazzalini, O. & Prosperi, E., 2012. The cyclin-dependent kinase inhibitor p21CDKN1A as a target of anti-cancer drugs. Current cancer drug targets, 12(2), pp.85–96. Available at: http://www.ncbi.nlm.nih.gov/pubmed/22165965.
Tanenbaum, M.E. et al., 2014. A protein-tagging system for signal amplification in gene expression and fluorescence imaging. Cell, 159(3), pp.635–646. Available at: http://www.sciencedirect.com/science/article/pii/S0092867414012276.
Tay, S. et al., 2010. Single-cell NF-κB dynamics reveal digital activation and analogue information processing. Nature, 466(7303), pp.267–271. Available at: http://www.nature.com/doifinder/10.1038/nature09145.
Toettcher, J.E. et al., 2009. Distinct mechanisms act in concert to mediate cell cycle arrest,

References
95
Vermeulen,K.,Van Bockstaele,D.R.,Berneman, Z.N. et al., 2003. The cell cycle:a review of regulation,deregulation and therapeutic targets in cancer. Cell Proliferation, 36(3), pp.131–149.
Wang, B. et al., 2010. 14-3-3Tau regulates ubiquitin-independent proteasomal degradation of p21, a novel mechanism of p21 downregulation in breast cancer. Molecular and cellular biology, 30(6), pp.1508–27. Available at: http://www.ncbi.nlm.nih.gov/pubmed/20086099%5Cnhttp://www.pubmedcentral.nih.gov/articlerender.fcgi?artid=PMC2832502.
Wang, T. et al., 2014. Genetic Screens in Human Cells Using the CRISPR-Cas9 System. Science, 343(6166), pp.80–84. Available at: http://www.sciencemag.org/lookup/doi/10.1126/science.1246981.
Wang, Y. et al., 2014. Clonal evolution in breast cancer revealed by single nucleus genome sequencing. Nature, 512(7513), pp.155–160. Available at: http://www.nature.com/doifinder/10.1038/nature13600.
Warfel, N.A. & El-Deiry, W.S., 2013. p21WAF1 and tumourigenesis: 20 years after. Current Opinion in Oncology, 25(1), pp.52–58. Available at: http://content.wkhealth.com/linkback/openurl?sid=WKPTLP:landingpage&an=00001622-201301000-00011.
White, M.F. et al., 1997. Recognition and manipulation of branched DNA structure by junction-resolving enzymes. Journal of molecular biology, 269(5), pp.647–64. Available at: http://www.sciencedirect.com/science/article/pii/S0022283697910974.
Wolf, D. & Rotter, V., 1985. Major deletions in the gene encoding the p53 tumor antigen cause lack of p53 expression in HL-60 cells. Cell Biology, 82, pp.790–794.
Wood, A.J. et al., 2011. Targeted Genome Editing Across Species Using ZFNs and TALENs. Science, 333(6040), pp.307–307. Available at: http://www.sciencemag.org/lookup/doi/10.1126/science.1207773.
Wu, Q. et al., 2002. Transcriptional regulation during p21WAF1/CIP1-induced apoptosis in human ovarian cancer cells. The Journal of biological chemistry, 277(39), pp.36329–37. Available at: http://www.ncbi.nlm.nih.gov/pubmed/12138103.
Yang, H.W. et al., 2017. Competing memories of mitogen and p53 signalling control cell-cycle entry. Nature, 549(7672), pp.404–408. Available at: http://www.nature.com/doifinder/10.1038/nature23880.
Ye, Q. & Worman, H.J., 1996. Interaction between an integral protein of the nuclear envelope inner membrane and human chromodomain proteins homologous to Drosophila HP1. Journal of Biological Chemistry, 271(25), pp.14653–14656.
Yu, J. et al., 2001. PUMA induces the rapid apoptosis of colorectal cancer cells. Molecular Cell, 7(3), pp.673–682.
Yuan, G.-C. et al., 2017. Challenges and emerging directions in single-cell analysis. Genome Biology, 18(1), p.84. Available at: http://genomebiology.biomedcentral.com/articles/10.1186/s13059-017-1218-y.
Zhang, Y., Fujita, N. & Tsuruo, T., 1999. Caspase-mediated cleavage of p21Waf1/Cip1 converts cancer cells from growth arrest to undergoing apoptosis. Oncogene, 18(July 1998), pp.1131–1138.
Zhang, Y., Xiong, Y. & Yarbrough, W.G., 1998. ARF promotes MDM2 degradation and stabilizes p53: ARF-INK4a locus deletion impairs both the Rb and p53 tumor suppression pathways. Cell, 92(6), pp.725–734.
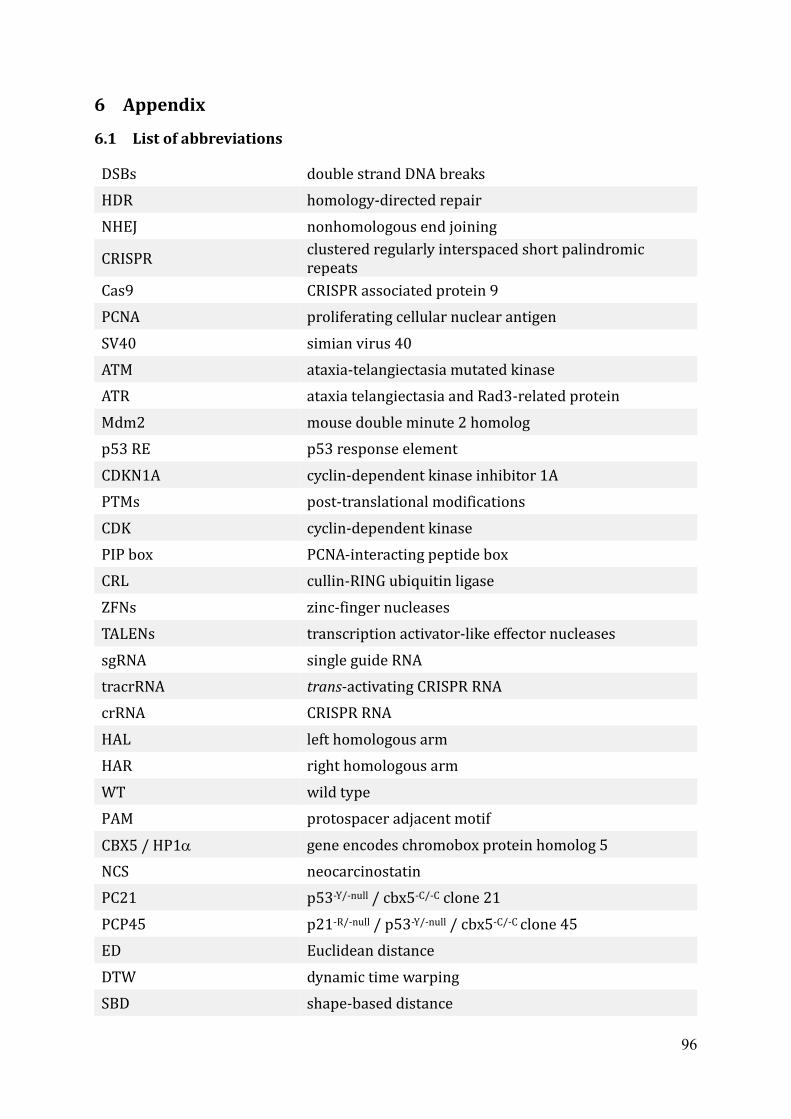
96
6 Appendix
6.1 List of abbreviations
DSBs double strand DNA breaks
HDR homology-directed repair
NHEJ nonhomologous end joining
CRISPR clustered regularly interspaced short palindromic repeats
Cas9 CRISPR associated protein 9
PCNA proliferating cellular nuclear antigen
SV40 simian virus 40
ATM ataxia-telangiectasia mutated kinase
ATR ataxia telangiectasia and Rad3-related protein
Mdm2 mouse double minute 2 homolog
p53 RE p53 response element
CDKN1A cyclin-dependent kinase inhibitor 1A
PTMs post-translational modifications
CDK cyclin-dependent kinase
PIP box PCNA-interacting peptide box
CRL cullin-RING ubiquitin ligase
ZFNs zinc-finger nucleases
TALENs transcription activator-like effector nucleases
sgRNA single guide RNA
tracrRNA trans-activating CRISPR RNA
crRNA CRISPR RNA
HAL left homologous arm
HAR right homologous arm
WT wild type
PAM protospacer adjacent motif
CBX5 / HP1 gene encodes chromobox protein homolog 5
NCS neocarcinostatin
PC21 p53-Y/-null / cbx5-C/-C clone 21
PCP45 p21-R/-null / p53-Y/-null / cbx5-C/-C clone 45
ED Euclidean distance
DTW dynamic time warping
SBD shape-based distance

Appendix
97
SMASh small molecule–assisted shutoff
ASV asunaprevir
IRES internal ribosomal entry site
FUCCI fluorescence ubiquitination cell cycle indicator
smFISH single molecule fluorescent in situ hybridization

Appendix
98
6.2 List of primers
target loci primers sequences applications
p53 labelling
p53 CS8_p53-endo-up CACTAATACTCTGAGGTGCTCAGTAAAC T7
p53 CS9_p53-endo-down CTAGAATGTGGCTGATTGTAAACTAACC T7, gPCR2
p53 CS15_HDR_p53_Fwd CCATTCTCATCCTGCCTTCATGGTC gPCR1, gPCR2
p53 CS16_HDR_p53_Rev TCGCCGTCCAGCTCGACCAG gPCR1
p53 CS122_p53SoC_Seq GATTTGAATTCCCGTTGTCC Seq
CBX5 labelling
CBX5 CS100_CBX5_EndoU GGTGAGGAGGAAATCAAGTCAAC T7, Seq
CBX5 CS101_CBX5_EndoD AAGGCCAGCTAGTCAGCAAC T7
CBX5 CS81_AAV_SEPTSeq TGGACAAACCACAACTAGAATG gPCR1
CBX5 CS73_CBX5_EndoD AGCCAAGAATGCAGGAGACA gPCR1
CBX5 CS192_CBX5_ScrF GCTGGACTGCTTTTTCCTACT gPCR2
CBX5 CS193_CBX5_ScrR ACAAAGGCCAGCTAGTCAGC gPCR2
p21 labelling
p21 CS190_AAVChe_Seq ACCCTTGGTCACCTTCAG gPCR1
p21 CS212_p21_ScrF CATTATGCCAGGCCCTTTGC gPCR1, gPCR2
p21 CS213_p21_ScrR AGGGTGCCCTTCTTCTTGTG gPCR2
p21 CS208_p21_Seq CTGGGCAGCTTGACTTAGAG Seq
mutant p21 CS311_p21E2_Up GCATGGACTCTGTGATCAAT gPCR2
mutant p21 CS312_p21I2_Down GTATCACTGCACTCCAGTCT gPCR2
mutant p21 CS307_p21mut_I2Seq GTGGACCTGTCACTGTCTTG Seq
mutant p21 CS288_p21_GenRev CGGCCAGGGTATGTACATGAGG Seq
Mdm2 labelling
Mdm2 CS158_Mdm2_ScrU GGGTTGAGCCTTTAAGGGAGT T7,gPCR1, gPCR2
Mdm2 CS159_Mdm2_ScrD TGGAGAGAGAAACTAAGGATCAGA T7, gPCR2
Mdm2 CS211_RuHALSeq TCCATGACCACCTTCATACG gPCR1
Mdm2 CS309_Mdm2KD_Fwd CTTTACCTTAGACATAGCAAAGTTG Seq
Wip1 labelling
Wip1 CS170_Wip_ScrU AATGCACACAGAGAATGCGA T7, gPCR1, gPCR2
Wip1 CS171_Wip_ScrD TGTTGGGAATTAGCAGCACC T7, gPCR2
Wip1 CS211_RuHALSeq TCCATGACCACCTTCATACG gPCR1
Wip1 PPM1D_Seq ACTCCTGGCCAAATGAAAGC Seq
Trim22 labelling

Appendix
99
Trim22 CS176_TRIM22_ScU GGGGAATGACCAGGTGTCTG T7
Trim22 CS177_TRIM22_ScD GGGTGTCACTGGTAAACCAAC T7, gPCR1
Trim22 CS198_NeoLoxPSeq CGAGTTCTTCTGAATAACTTCG gPCR1
Trim22 CS237_Trim22_ScrU GCTGTAAGACACACCTATCCC gPCR2
Trim22 CS238_Trim22_ScrD AGGGGAAAGAAAGGAAGAGATGG gPCR2, Seq
PCR amplification of homology arms with different lengths
p53 CS98_p53-HAL
GTCCAAAAAGGGTCAGTCTACCTCCCGCCATAAAAAACTCATGTTCAAGACAGAAGGGCCTGACTCAGACACTAGTATGGTGAGCAAGGGCGAGGAG
TemPCR
p53 CS99_p53-HAR AACCCAAAATGGCAGGGGAGGGAGAGATGGGGGTGGGAGGCTGTCAGTGGGGAACAAGAAGTGGAGAATGGAATTCATACATATGCACAGTGG
TemPCR
p53 CS76_p53_0.05HAU GTCCAAAAAGGGTCAGTCTACC TemPCR
p53 CS77_p53_0.05HAD AACCCAAAATGGCAGGGGAG TemPCR
p53 CS74_p53_0.1HAUp GCACAGACCCTCTCACTCAT TemPCR
p53 CS75_p53_0.1HADo CCGGGACAAAGCAAATGGAAG TemPCR
p53 CS46_p53_0.2HA_up GGAAGATTACGAGACTAATACAC TemPCR
p53 CS47_p53_0.2HA_down TGCAAGAACATTTCTTACATCTC TemPCR
p53 CS40_p53_0.3HA_up GGCTGAGGCAGGAGAATCGCTTGAAC TemPCR
p53 CS41_p53_0.3HA_down GGTGCAAATGCCAGCATTTCACAG TemPCR
p53 CS42_p53_0.4HA_up GAGGCCAAGGCGAGTGGATCACC TemPCR
p53 CS43_p53_0.4HA_down AACTACCAACCCACCGACCAACAG TemPCR
p53 CS44_p53_0.5HA_up CAGCCAGAGTTTCAGGTC TemPCR
p53 CS45_p53_0.5HA_down TGAAATCCTCCAGGGTGTG TemPCR
examinations of off-target effects
p53 CS110_p53-T5OT1U TTCCAACACCAAAAAGTGGGC OT
p53 CS111_p53-T5OT1D CCCTTCCCCAATTCTGAGCC OT
p53 CS112_p53-T5OT1S CAGTCACGTCACCAAGTC Seq
p53 CS113_p53-T5OT2U TTGCGGCTGAGGTCCAAG OT
p53 CS114_p53-T5OT2D ATGGCTGGCTTGCTTTAGGT OT
p53 CS115_p53-T5OT2S ATGGCACAATGACCACAG Seq
p53 CS116_p53-T5OT3U GCCCCAACCTAACTGCTGAA OT
p53 CS117_p53-T5OT3D CTGTTCTTCCGTCTCTGCCG OT
p53 CS118_p53-T5OT3S GTTCCTGCCTTGACCTTC Seq
p53 CS119_p53-T5OT4U CCTGGGATGCTGGGAGTTAG OT
p53 CS120_p53-T5OT4D GAGATGGGAAGTGCTGGTGG OT
p53 CS121_p53-T5OT4S GCAGTGACTGTCACTCTC Seq

Appendix
100
This table lists primers used for T7 endonuclease I assay (T7), Sanger sequencing (Seq),
genomic PCRs for screening (gPCR1 and gPCR2), genomic PCR for off-target examinations
(OT) and ordinary PCR for amplifying homology arms of different lengths (TemPCR).
Primers for cloning constructs are not listed since sgRNA guide sequences and sequences
of repair templates are presented in next sections.

Appendix
101
6.3 List of sgRNA targets
target locus
target guide sequences sgRNA efficiency
p53 T5 GGAGAATGTCAGTCTGAGTC ***
T8 TCCCCTGCCATTTTGGGTTT **
T14 TCTCCCTCCCCTGCCATTTT *
p21 T2 GGAAGCCCTAATCCGCCCAC ***
T3 GGCTTCCTGTGGGCGGATTA ***
T7 CTGCAGTCCTGGAAGCGCGA N. M.
p21 Exon2 Exon2-T2 CGGCGGCAGACCAGCATGAC **
Exon2-T3 GCATGTCCGCACCTGTCATGC **
CBX5 T2 TCTTTGTTTTCCGCATCCTC **
T4 AAACAGCAAAGAGCTAAAGG *
T5 ACAGCAAAGAGCTAAAGGAG ***
Mdm2 T1 CTTATAGACAGGTCAACTAG ***
T4 ATTTCTAACTATATAACCCT *
T8 GTTAGCACAATCATTTGAAT *
Mdm4 T3 TTAAGGTTTTTATAGCATAA *
T6 TGAATCTCTTTCTTGCAAAT *
Wip1 T4 GTGTTTGCTGAAATGCATCT ***
T5 TGTGTTTGCTGAAATGCATC **
T7 TTCCTGTGTTGATGAAGTAA *
Trim22 T1 AGAACACTCAGGAGCTCGGT *
T3 GAGAACACTCAGGAGCTCGG **
T12 GTAAAGGAATGAGAACACTC **
BBC3 T1 TGGGAGTCCAGTATGCTACA ***
T2 CTCTGCACCATGTAGCATAC *
T3 TCCCAGCCCTGCCTGTCCCG **
SESN1 T1 AAAGGCATCAGGTCATATAG ***
T2 CAGCAGATATAGTCTACAAG ***
T3 TCAGGTCATATAGCGGGTAA *
RRM2B T1 TTTTTAAAAATCTGCATCCA *
T2 AAACTCTATAAACTTGTCAT ***
T3 CAAGGTGAAGACGTTATCTG **
Stars represent the relative efficiency among the multiple sgRNAs for a single locus, which
was roughly estimated by T7 endonuclease I assay, in vitro digestion (Hsu et al. 2013) or
number of colonies in MCF10A. The third sgRNA targeting p21 (T7) was not measured
(N.M.) or used because the other targets (T2 and T3) were highly efficient. All sgRNAs
targeting Mdm2, Mdm4, Wip1 and Trim22 were cloned by Andrea Grybowski from Max
Delbruck Center for Molecular Medicine, Berlin, Germany. The designs for BBC3, SESN1

Appendix
102
and RRM2B were done together with Qingyao Huang. The sgRNA Cloning and efficiency
test of these targets was tested by Qingyao Huang.

Appendix
103
6.4 Sequences of constructs
6.4.1 p53 donor DNA 1 (pAAV-p53-SEPTV)
AGCGCGCAGAGAGGGAGTGGCCAACTCCATCACTAGGGGTTCCTGCGGCCGCGGGTCCCAGCCCTGCACAGACATTTTTTTAGTCTTCCTCCGGTTGAAT
CCTATAACCACATTCTTGCCTCAGTGTATCCACAGAACATCCAAACCCAGGGACGAGTGTGGATACTTCTTTGCCATTCTCCGCAACTCCCAGCCCAGAGC
TGGAGGGTCTCAAGGAGGGGCCTAATAATTGTGTAATACTGAATACAGCCAGAGTTTCAGGTCATATACTCAGCCCTGCCATGCACCGGCAGGTCCTAG
GTGACCCCCGTCAAACTCAGTTTCCTTATATATAAAATGGGGTAAGGGGGCCGGGCGCAGTGGCTCACGAATCCCACACTCTGGGAGGCCAAGGCGAG
TGGATCACCTGAGGTCGGGAGTTTGAGCCCAGCCTGACCAACATGGAGAAACCCCATCTCTACTAAAAATACAAAAGTAGCCGGGCGTGGTGATGCAT
GCCTGTAATCCCAGCTACCTACTCGGGAGGCTGAGGCAGGAGAATCGCTTGAACCCGGGAGGCAGAGGTTGCGGTGAGCTGAGATCTCACCATTACAC
TCCAGCCTGGGCAACAAGAGTGAAACTCCGTCTCAAAAAAGATAAATAAAGTAAAATGGGGTAAGGGAAGATTACGAGACTAATACACACTAATACTC
TGAGGTGCTCAGTAAACATATTTGCATGGGGTGTGGCCACCATCTTGATTTGAATTCCCGTTGTCCCAGCCTTAGGCCCTTCAAAGCATTGGTCAGGGAA
AAGGGGCACAGACCCTCTCACTCATGTGATGTCATCTCTCCTCCCTGCTTCTGTCTCCTACAGCCACCTGAAGTCCAAAAAGGGTCAGTCTACCTCCCGCC
ATAAAAAACTCATGTTCAAGACAGAAGGGCCTGACTCAGACACTAGTATGGTGAGCAAGGGCGAGGAGCTGTTCACCGGGGTGGTGCCCATCCTGGTC
GAGCTGGACGGCGACGTAAACGGCCACAAGTTCAGCGTGTCCGGCGAGGGCGAGGGCGATGCCACCTACGGCAAGCTGACCCTGAAGCTGATCTGCA
CCACCGGCAAGCTGCCCGTGCCCTGGCCCACCCTCGTGACCACCCTGGGCTACGGCCTGCAGTGCTTCGCCCGCTACCCCGACCACATGAAGCAGCACGA
CTTCTTCAAGTCCGCCATGCCCGAAGGCTACGTCCAGGAGCGCACCATCTTCTTCAAGGACGACGGCAACTACAAGACCCGCGCCGAGGTGAAGTTCGA
GGGCGACACCCTGGTGAACCGCATCGAGCTGAAGGGCATCGACTTCAAGGAGGACGGCAACATCCTGGGGCACAAGCTGGAGTACAACTACAACAGC
CACAACGTCTATATCACCGCCGACAAGCAGAAGAACGGCATCAAGGCCAACTTCAAGATCCGCCACAACATCGAGGACGGCGGCGTGCAGCTCGCCGA
CCACTACCAGCAGAACACCCCCATCGGCGACGGCCCCGTGCTGCTGCCCGACAACCACTACCTGAGCTACCAGTCCGCCCTGAGCAAAGACCCCAACGA
GAAGCGCGATCACATGGTCCTGCTGGAGTTCGTGACCGCCGCCGGGATCACTCTCGGCATGGACGAGCTGTACAAGTAATCTAGTGGATCCATAACTTC
GTATAGCATACATTATACGAAGTTATGGAATTAATTCGCTGTCTGCGAGGGCCAGCTGTTGGGGTGAGTACTCCCTCTCAAAAGCGGGCATGACTTCTGC
GCTAAGATTGTCAGTTTCCAAAAACGAGGAGGATTTGATATTCACCTGGCCCGCGGTGATGCCTTTGAGGGTGGCCGCGTCCATCTGGTCAGAAAAGACA
ATCTTTTTGTTGTCAAGCTTGAGGTGTGGCAGGCTTGAGATCTGGCCATACACTTGAGTGACAATGACATCCACTTTGCCTTTCTCTCCACAGGTGTCCACTC
CCAGGTCCAACTGCAGGTCGAGCGTCGAGAACGTTACTGGCCGAAGCCGCTTGGAATAAGGCCGGTGTGCGTTTGTCTATATGTTATTTTCCACCATATTG
CCGTCTTTTGGCAATGTGAGGGCCCGGAAACCTGGCCCTGTCTTCTTGACGAGCATTCCTAGGGGTCTTTCCCCTCTCGCCAAAGGAATGCAAGGTCTGTTG
AATGTCGTGAAGGAAGCAGTTCCTCTGGAAGCTTCTTGAAGACAAACAACGTCTGTAGCGACCCTTTGCAGGCAGCGGAACCCCCCACCTGGCGACAGGT
GCCTCTGCGGCCAAAAGCCACGTGTATAAGATACACCTGCAAAGGCGGCACAACCCCAGTGCCACGTTGTGAGTTGGATAGTTGTGGAAAGAGTCAAATG
GCTCTCCTCAAGCGTATTCAACAAGGGGCTGAAGGATGCCCAGAAGGTACCCCATTGTATGGGATCTGATCTGGGGCCTCGGTGCACATGCTTTACATGTG
TTTAGTCGAGGTTAAAAAAACGTCTAGGCCCCCCGAACCACGGGGACGTGGTTTTCCTTTGAAAAACACGATGATAAGCTTGCCACAACCATGGCTGAACA
AGATGGATTGCACGCAGGTTCTCCGGCCGCTTGGGTGGAGAGGCTATTCGGCTATGACTGGGCACAACAGACAATCGGCTGCTCTGATGCCGCCGTGTTC
CGGCTGTCAGCGCAGGGGCGCCCGGTTCTTTTTGTCAAGACCGACCTGTCCGGTGCCCTGAATGAACTGCAGGACGAGGCAGCGCGGCTATCGTGGCTGG
CCACGACGGGCGTTCCTTGCGCAGCTGTGCTCGACGTTGTCACTGAAGCGGGAAGGGACTGGCTGCTATTGGGCGAAGTGCCGGGGCAGGATCTCCTGTC
ATCTCACCTTGCTCCTGCCGAGAAAGTATCCATCATGGCTGATGCAATGCGGCGGCTGCATACGCTTGATCCGGCTACCTGCCCATTCGACCACCAAGCGA
AACATCGCATCGAGCGAGCACGTACTCGGATGGAAGCCGGTCTTGTCGATCAGGATGATCTGGACGAAGAGCATCAGGGGCTCGCGCCAGCCGAACTGT
TCGCCAGGCTCAAGGCGCGCATGCCCGACGGCGAGGATCTCGTCGTGACCCATGGCGATGCCTGCTTGCCGAATATCATGGTGGAAAATGGCCGCTTTTC
TGGATTCATCGACTGTGGCCGGCTGGGTGTGGCGGACCGCTATCAGGACATAGCGTTGGCTACCCGTGATATTGCTGAAGAGCTTGGCGGCGAATGGGCT
GACCGCTTCCTCGTGCTTTACGGTATCGCCGCTCCCGATTCGCAGCGCATCGCCTTCTATCGCCTTCTTGACGAGTTCTTCTGAGCGGGACTCTGGGGTTCG
GGGGATCCAGACATGATAAGATACATTGATGAGTTTGGACAAACCACAACTAGAATGCAGTGAAAAAAATGCTTTATTTGTGAAATTTGTGATGCTATTGC
TTTATTTGTAACCATTATAAGCTGCAATAAACAAGTTAACAACAACAATTGCATTCATTTTATGTTTCAGGTTCAGGGGGAGGTGTGGGAGGTTTTTTCTAG
GGGGCCCCGGCGAGGCCGGGATGAGTTGGGAATAACTTCGTATAGCATACATTATACGAAGTTATCCAAATTTTAAGGTACCACTGTGCATATGTATGAA
TTCCATTCTCCACTTCTTGTTCCCCACTGACAGCCTCCCACCCCCATCTCTCCCTCCCCTGCCATTTTGGGTTTTGGGTCTTTGAACCCTTGCTTGCAATAGGT
GTGCGTCAGAAGCACCCAGGACTTCCATTTGCTTTGTCCCGGGGCTCCACTGAACAAGTTGGCCTGCACTGGTGTTTTGTTGTGGGGAGGAGGATGGGG
AGTAGGACATACCAGCTTAGATTTTAAGGTTTTTACTGTGAGGGATGTTTGGGAGATGTAAGAAATGTTCTTGCAGTTAAGGGTTAGTTTACAATCAGC
CACATTCTAGGTAGGGGCCCACTTCACCGTACTAACCAGGGAAGCTGTCCCTCACTGTTGAATTTTCTCTAACTTCAAGGCCCATATCTGTGAAATGCTGG
CATTTGCACCTACCTCACAGAGTGCATTGTGAGGGTTAATGAAATAATGTACATCTGGCCTTGAAACCACCTTTTATTACATGGGGTCTAGAACTTGACC
CCCTTGAGGGTGCTTGTTCCCTCTCCCTGTTGGTCGGTGGGTTGGTAGTTTCTACAGTTGGGCAGCTGGTTAGGTAGAGGGAGTTGTCAAGTCTCTGCTG
GCCCAGCCAAACCCTGTCTGACAACCTCTTGGTGAACCTTAGTACCTAAAAGGAAATCTCACCCCATCCCACACCCTGGAGGATTTCATCTCTTGTATATG
ATGATCTGGATCCACCAAGACTTGTTTTATGCTCAGGGTCAATTTCTTTTTTCTTTTTTTTTTTTTTTTTTCTTTTTCTTTGAGACTGGGTCTCGCTTTGTTGCC
CAGGCTGGAGTGGAGTGGCGTGATCTTGGCTTACTGCAGCCTTTGCCTCCCCGGCTCGAGCAGTCCTGCCTCAGCCTCCGGAGTAGCTGGGACCACAGG
TTGCGGCCGCAGGAACCCCTAGTGATGGAG
GGGTCCCAGCCCT…CTCAGAC: The left homology arm of p53
ATGGTGA…CAAGTAA: mVenus
ATAACTTCGTATAGCATACATTATACGAAGTTA: Loxp sites
GGAATTAA…ACAACC: IRES
ATGGCTG…TCTTCTGA: Neomycin resistance gene
CATTCTCCACTTCT…CCACAGG: The right homology arm of p53
This construct was designed and cloned by Dr. Alexander Loewer.

Appendix
104
6.4.2 mCherry-LoxP-P2A-Neo-LoxP construct (pC2aN)
AAAAGCTGGAGCTCCACCGCGGTGGCGGCCGCTCTAGACTAGTATGGTGAGCAAGGGCGAGGAGGATAACATGGCCATCATCAAGGAGTTCATGCGCT
TCAAGGTGCACATGGAGGGCTCCGTGAACGGCCACGAGTTCGAGATCGAGGGCGAGGGCGAGGGCCGCCCCTACGAGGGCACCCAGACCGCCAAGCT
GAAGGTGACCAAGGGTGGCCCCCTGCCCTTCGCCTGGGACATCCTGTCCCCTCAGTTCATGTACGGCTCCAAGGCCTACGTGAAGCACCCCGCCGACATC
CCCGACTACTTGAAGCTGTCCTTCCCCGAGGGCTTCAAGTGGGAGCGCGTGATGAACTTCGAGGACGGCGGCGTGGTGACCGTGACCCAGGACTCCTCC
CTGCAGGACGGCGAGTTCATCTACAAGGTGAAGCTGCGCGGCACCAACTTCCCCTCCGACGGCCCCGTAATGCAGAAGAAGACCATGGGCTGGGAGGC
CTCCTCCGAGCGGATGTACCCCGAGGACGGCGCCCTGAAGGGCGAGATCAAGCAGAGGCTGAAGCTGAAGGACGGCGGCCACTACGACGCTGAGGTC
AAGACCACCTACAAGGCCAAGAAGCCCGTGCAGCTGCCCGGCGCCTACAACGTCAACATCAAGTTGGACATCACCTCCCACAACGAGGACTACACCATC
GTGGAACAGTACGAACGCGCCGAGGGCCGCCACTCCACCGGCGGCATGGACGAGCTGTACAAGATAACTTCGTATAGCATACATTATACGAAGTTATTT
GGAAGCGGAGCTACTAACTTCAGCCTGCTGAAGCAGGCTGGAGACGTGGAGGAGAACCCTGGACCTATGGCTGAACAAGATGGATTGCACGCAGGTTC
TCCGGCCGCTTGGGTGGAGAGGCTATTCGGCTATGACTGGGCACAACAGACAATCGGCTGCTCTGATGCCGCCGTGTTCCGGCTGTCAGCGCAGGGGCGC
CCGGTTCTTTTTGTCAAGACCGACCTGTCCGGTGCCCTGAATGAACTGCAGGACGAGGCAGCGCGGCTATCGTGGCTGGCCACGACGGGCGTTCCTTGCG
CAGCTGTGCTCGACGTTGTCACTGAAGCGGGAAGGGACTGGCTGCTATTGGGCGAAGTGCCGGGGCAGGATCTCCTGTCATCTCACCTTGCTCCTGCCGA
GAAAGTATCCATCATGGCTGATGCAATGCGGCGGCTGCATACGCTTGATCCGGCTACCTGCCCATTCGACCACCAAGCGAAACATCGCATCGAGCGAGCAC
GTACTCGGATGGAAGCCGGTCTTGTCGATCAGGATGATCTGGACGAAGAGCATCAGGGGCTCGCGCCAGCCGAACTGTTCGCCAGGCTCAAGGCGCGCA
TGCCCGACGGCGAGGATCTCGTCGTGACCCATGGCGATGCCTGCTTGCCGAATATCATGGTGGAAAATGGCCGCTTTTCTGGATTCATCGACTGTGGCCGG
CTGGGTGTGGCGGACCGCTATCAGGACATAGCGTTGGCTACCCGTGATATTGCTGAAGAGCTTGGCGGCGAATGGGCTGACCGCTTCCTCGTGCTTTACG
GTATCGCCGCTCCCGATTCGCAGCGCATCGCCTTCTATCGCCTTCTTGACGAGTTCTTCTGAATAACTTCGTATAGCATACATTATACGAAGTTATAACCACT
GTGCATATGTATGAATTCGATATCAAGCTTATCGATACCGTCGACCT
ATGGTGA…ACAAG: mCherry
GGAAGCGGAGCTACTAACTTCAGCCTGCTGAAGCAGGCTGGAGACGTGGAGGAGAACCCT: P2A
ATAACTTCGTATAGCATACATTATACGAAGTTAT: Loxp sites
ATGGCTG…TCTTCTGA: Neomycin resistance gene
6.4.3 p53 donor DNA 2 (p53-C2aN)
GTCCAAAAAGGGTCAGTCTACCTCCCGCCATAAAAAACTCATGTTCAAGACAGAAGGGCCTGACTCAGACACTAGTATGGTGAGCAAGGGCGAGGAG
GATAACATGGCCATCATCAAGGAGTTCATGCGCTTCAAGGTGCACATGGAGGGCTCCGTGAACGGCCACGAGTTCGAGATCGAGGGCGAGGGCGAGG
GCCGCCCCTACGAGGGCACCCAGACCGCCAAGCTGAAGGTGACCAAGGGTGGCCCCCTGCCCTTCGCCTGGGACATCCTGTCCCCTCAGTTCATGTACG
GCTCCAAGGCCTACGTGAAGCACCCCGCCGACATCCCCGACTACTTGAAGCTGTCCTTCCCCGAGGGCTTCAAGTGGGAGCGCGTGATGAACTTCGAGG
ACGGCGGCGTGGTGACCGTGACCCAGGACTCCTCCCTGCAGGACGGCGAGTTCATCTACAAGGTGAAGCTGCGCGGCACCAACTTCCCCTCCGACGGCC
CCGTAATGCAGAAGAAGACCATGGGCTGGGAGGCCTCCTCCGAGCGGATGTACCCCGAGGACGGCGCCCTGAAGGGCGAGATCAAGCAGAGGCTGAA
GCTGAAGGACGGCGGCCACTACGACGCTGAGGTCAAGACCACCTACAAGGCCAAGAAGCCCGTGCAGCTGCCCGGCGCCTACAACGTCAACATCAAGT
TGGACATCACCTCCCACAACGAGGACTACACCATCGTGGAACAGTACGAACGCGCCGAGGGCCGCCACTCCACCGGCGGCATGGACGAGCTGTACAAG
ATAACTTCGTATAGCATACATTATACGAAGTTATTTGGAAGCGGAGCTACTAACTTCAGCCTGCTGAAGCAGGCTGGAGACGTGGAGGAGAACCCTGGA
CCTATGGCTGAACAAGATGGATTGCACGCAGGTTCTCCGGCCGCTTGGGTGGAGAGGCTATTCGGCTATGACTGGGCACAACAGACAATCGGCTGCTCTG
ATGCCGCCGTGTTCCGGCTGTCAGCGCAGGGGCGCCCGGTTCTTTTTGTCAAGACCGACCTGTCCGGTGCCCTGAATGAACTGCAGGACGAGGCAGCGCG
GCTATCGTGGCTGGCCACGACGGGCGTTCCTTGCGCAGCTGTGCTCGACGTTGTCACTGAAGCGGGAAGGGACTGGCTGCTATTGGGCGAAGTGCCGGG
GCAGGATCTCCTGTCATCTCACCTTGCTCCTGCCGAGAAAGTATCCATCATGGCTGATGCAATGCGGCGGCTGCATACGCTTGATCCGGCTACCTGCCCATT
CGACCACCAAGCGAAACATCGCATCGAGCGAGCACGTACTCGGATGGAAGCCGGTCTTGTCGATCAGGATGATCTGGACGAAGAGCATCAGGGGCTCGC
GCCAGCCGAACTGTTCGCCAGGCTCAAGGCGCGCATGCCCGACGGCGAGGATCTCGTCGTGACCCATGGCGATGCCTGCTTGCCGAATATCATGGTGGAA
AATGGCCGCTTTTCTGGATTCATCGACTGTGGCCGGCTGGGTGTGGCGGACCGCTATCAGGACATAGCGTTGGCTACCCGTGATATTGCTGAAGAGCTTG
GCGGCGAATGGGCTGACCGCTTCCTCGTGCTTTACGGTATCGCCGCTCCCGATTCGCAGCGCATCGCCTTCTATCGCCTTCTTGACGAGTTCTTCTGAATAA
CTTCGTATAGCATACATTATACGAAGTTATAACCACTGTGCATATGTATGAATTCCATTCTCCACTTCTTGTTCCCCACTGACAGCCTCCCACCCCCATCTCT
CCCTCCCCTGCCATTTTGGGTT
GTCCAAAAA…TAGT: The left homology arm of p53
GGAAGCGGAGCTACTAACTTCAGCCTGCTGAAGCAGGCTGGAGACGTGGAGGAGAACCCT: P2A
ATAACTTCGTATAGCATACATTATACGAAGTTAT: Loxp sites
ATGGCTG…TCTTCTGA: Neomycin resistance gene
AACCACTGT…GGTT: The right homology arm of p53
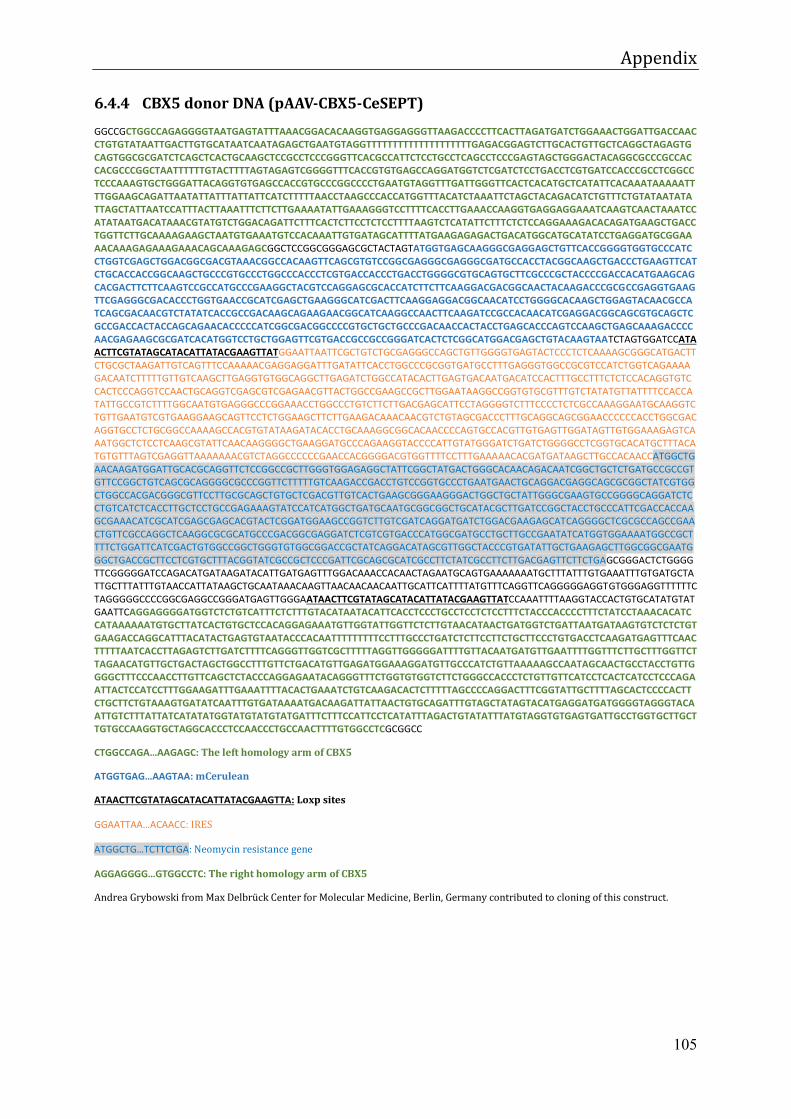
Appendix
105
6.4.4 CBX5 donor DNA (pAAV-CBX5-CeSEPT)
GGCCGCTGGCCAGAGGGGTAATGAGTATTTAAACGGACACAAGGTGAGGAGGGTTAAGACCCCTTCACTTAGATGATCTGGAAACTGGATTGACCAACCTGTGTATAATTGACTTGTGCATAATCAATAGAGCTGAATGTAGGTTTTTTTTTTTTTTTTTTTTGAGACGGAGTCTTGCACTGTTGCTCAGGCTAGAGTGCAGTGGCGCGATCTCAGCTCACTGCAAGCTCCGCCTCCCGGGTTCACGCCATTCTCCTGCCTCAGCCTCCCGAGTAGCTGGGACTACAGGCGCCCGCCACCACGCCCGGCTAATTTTTTGTACTTTTAGTAGAGTCGGGGTTTCACCGTGTGAGCCAGGATGGTCTCGATCTCCTGACCTCGTGATCCACCCGCCTCGGCCTCCCAAAGTGCTGGGATTACAGGTGTGAGCCACCGTGCCCGGCCCCTGAATGTAGGTTTGATTGGGTTCACTCACATGCTCATATTCACAAATAAAAATTTTGGAAGCAGATTAATATTATTTATTATTCATCTTTTTAACCTAAGCCCACCATGGTTTACATCTAAATTCTAGCTACAGACATCTGTTTCTGTATAATATATTAGCTATTAATCCATTTACTTAAATTTCTTCTTGAAAATATTGAAAGGGTCCTTTTCACCTTGAAACCAAGGTGAGGAGGAAATCAAGTCAACTAAATCCATATAATGACATAAACGTATGTCTGGACAGATTCTTTCACTCTTCCTCTCCTTTTAAGTCTCATATTCTTTCTCTCCAGGAAAGACACAGATGAAGCTGACCTGGTTCTTGCAAAAGAAGCTAATGTGAAATGTCCACAAATTGTGATAGCATTTTATGAAGAGAGACTGACATGGCATGCATATCCTGAGGATGCGGAAAACAAAGAGAAAGAAACAGCAAAGAGCGGCTCCGGCGGGAGCGCTACTAGTATGGTGAGCAAGGGCGAGGAGCTGTTCACCGGGGTGGTGCCCATCCTGGTCGAGCTGGACGGCGACGTAAACGGCCACAAGTTCAGCGTGTCCGGCGAGGGCGAGGGCGATGCCACCTACGGCAAGCTGACCCTGAAGTTCATCTGCACCACCGGCAAGCTGCCCGTGCCCTGGCCCACCCTCGTGACCACCCTGACCTGGGGCGTGCAGTGCTTCGCCCGCTACCCCGACCACATGAAGCAGCACGACTTCTTCAAGTCCGCCATGCCCGAAGGCTACGTCCAGGAGCGCACCATCTTCTTCAAGGACGACGGCAACTACAAGACCCGCGCCGAGGTGAAGTTCGAGGGCGACACCCTGGTGAACCGCATCGAGCTGAAGGGCATCGACTTCAAGGAGGACGGCAACATCCTGGGGCACAAGCTGGAGTACAACGCCATCAGCGACAACGTCTATATCACCGCCGACAAGCAGAAGAACGGCATCAAGGCCAACTTCAAGATCCGCCACAACATCGAGGACGGCAGCGTGCAGCTCGCCGACCACTACCAGCAGAACACCCCCATCGGCGACGGCCCCGTGCTGCTGCCCGACAACCACTACCTGAGCACCCAGTCCAAGCTGAGCAAAGACCCCAACGAGAAGCGCGATCACATGGTCCTGCTGGAGTTCGTGACCGCCGCCGGGATCACTCTCGGCATGGACGAGCTGTACAAGTAATCTAGTGGATCCATAACTTCGTATAGCATACATTATACGAAGTTATGGAATTAATTCGCTGTCTGCGAGGGCCAGCTGTTGGGGTGAGTACTCCCTCTCAAAAGCGGGCATGACTTCTGCGCTAAGATTGTCAGTTTCCAAAAACGAGGAGGATTTGATATTCACCTGGCCCGCGGTGATGCCTTTGAGGGTGGCCGCGTCCATCTGGTCAGAAAAGACAATCTTTTTGTTGTCAAGCTTGAGGTGTGGCAGGCTTGAGATCTGGCCATACACTTGAGTGACAATGACATCCACTTTGCCTTTCTCTCCACAGGTGTCCACTCCCAGGTCCAACTGCAGGTCGAGCGTCGAGAACGTTACTGGCCGAAGCCGCTTGGAATAAGGCCGGTGTGCGTTTGTCTATATGTTATTTTCCACCATATTGCCGTCTTTTGGCAATGTGAGGGCCCGGAAACCTGGCCCTGTCTTCTTGACGAGCATTCCTAGGGGTCTTTCCCCTCTCGCCAAAGGAATGCAAGGTCTGTTGAATGTCGTGAAGGAAGCAGTTCCTCTGGAAGCTTCTTGAAGACAAACAACGTCTGTAGCGACCCTTTGCAGGCAGCGGAACCCCCCACCTGGCGACAGGTGCCTCTGCGGCCAAAAGCCACGTGTATAAGATACACCTGCAAAGGCGGCACAACCCCAGTGCCACGTTGTGAGTTGGATAGTTGTGGAAAGAGTCAAATGGCTCTCCTCAAGCGTATTCAACAAGGGGCTGAAGGATGCCCAGAAGGTACCCCATTGTATGGGATCTGATCTGGGGCCTCGGTGCACATGCTTTACATGTGTTTAGTCGAGGTTAAAAAAACGTCTAGGCCCCCCGAACCACGGGGACGTGGTTTTCCTTTGAAAAACACGATGATAAGCTTGCCACAACCATGGCTGAACAAGATGGATTGCACGCAGGTTCTCCGGCCGCTTGGGTGGAGAGGCTATTCGGCTATGACTGGGCACAACAGACAATCGGCTGCTCTGATGCCGCCGTGTTCCGGCTGTCAGCGCAGGGGCGCCCGGTTCTTTTTGTCAAGACCGACCTGTCCGGTGCCCTGAATGAACTGCAGGACGAGGCAGCGCGGCTATCGTGGCTGGCCACGACGGGCGTTCCTTGCGCAGCTGTGCTCGACGTTGTCACTGAAGCGGGAAGGGACTGGCTGCTATTGGGCGAAGTGCCGGGGCAGGATCTCCTGTCATCTCACCTTGCTCCTGCCGAGAAAGTATCCATCATGGCTGATGCAATGCGGCGGCTGCATACGCTTGATCCGGCTACCTGCCCATTCGACCACCAAGCGAAACATCGCATCGAGCGAGCACGTACTCGGATGGAAGCCGGTCTTGTCGATCAGGATGATCTGGACGAAGAGCATCAGGGGCTCGCGCCAGCCGAACTGTTCGCCAGGCTCAAGGCGCGCATGCCCGACGGCGAGGATCTCGTCGTGACCCATGGCGATGCCTGCTTGCCGAATATCATGGTGGAAAATGGCCGCTTTTCTGGATTCATCGACTGTGGCCGGCTGGGTGTGGCGGACCGCTATCAGGACATAGCGTTGGCTACCCGTGATATTGCTGAAGAGCTTGGCGGCGAATGGGCTGACCGCTTCCTCGTGCTTTACGGTATCGCCGCTCCCGATTCGCAGCGCATCGCCTTCTATCGCCTTCTTGACGAGTTCTTCTGAGCGGGACTCTGGGGTTCGGGGGATCCAGACATGATAAGATACATTGATGAGTTTGGACAAACCACAACTAGAATGCAGTGAAAAAAATGCTTTATTTGTGAAATTTGTGATGCTATTGCTTTATTTGTAACCATTATAAGCTGCAATAAACAAGTTAACAACAACAATTGCATTCATTTTATGTTTCAGGTTCAGGGGGAGGTGTGGGAGGTTTTTTCTAGGGGGCCCCGGCGAGGCCGGGATGAGTTGGGAATAACTTCGTATAGCATACATTATACGAAGTTATCCAAATTTTAAGGTACCACTGTGCATATGTATGAATTCAGGAGGGGATGGTCTCTGTCATTTCTCTTTGTACATAATACATTCACCTCCCTGCCTCCTCTCCTTTCTACCCACCCCTTTCTATCCTAAACACATCCATAAAAAATGTGCTTATCACTGTGCTCCACAGGAGAAATGTTGGTATTGGTTCTCTTGTAACATAACTGATGGTCTGATTAATGATAAGTGTCTCTCTGTGAAGACCAGGCATTTACATACTGAGTGTAATACCCACAATTTTTTTTTCCTTTGCCCTGATCTCTTCCTTCTGCTTCCCTGTGACCTCAAGATGAGTTTCAACTTTTTAATCACCTTAGAGTCTTGATCTTTTCAGGGTTGGTCGCTTTTTAGGTTGGGGGATTTTGTTACAATGATGTTGAATTTTGGTTTCTTGCTTTGGTTCTTAGAACATGTTGCTGACTAGCTGGCCTTTGTTCTGACATGTTGAGATGGAAAGGATGTTGCCCATCTGTTAAAAAGCCAATAGCAACTGCCTACCTGTTGGGGCTTTCCCAACCTTGTTCAGCTCTACCCAGGAGAATACAGGGTTTCTGGTGTGGTCTTCTGGGCCACCCTCTGTTGTTCATCCTCACTCATCCTCCCAGAATTACTCCATCCTTTGGAAGATTTGAAATTTTACACTGAAATCTGTCAAGACACTCTTTTTAGCCCCAGGACTTTCGGTATTGCTTTTAGCACTCCCCACTTCTGCTTCTGTAAAGTGATATCAATTTGTGATAAAATGACAAGATTATTAACTGTGCAGATTTGTAGCTATAGTACATGAGGATGATGGGGTAGGGTACAATTGTCTTTATTATCATATATGGTATGTATGTATGATTTCTTTCCATTCCTCATATTTAGACTGTATATTTATGTAGGTGTGAGTGATTGCCTGGTGCTTGCTTGTGCCAAGGTGCTAGGCACCCTCCAACCCTGCCAACTTTTGTGGCCTCGCGGCC
CTGGCCAGA…AAGAGC: The left homology arm of CBX5
ATGGTGAG…AAGTAA: mCerulean
ATAACTTCGTATAGCATACATTATACGAAGTTA: Loxp sites
GGAATTAA…ACAACC: IRES
ATGGCTG…TCTTCTGA: Neomycin resistance gene
AGGAGGGG…GTGGCCTC: The right homology arm of CBX5
Andrea Grybowski from Max Delbrück Center for Molecular Medicine, Berlin, Germany contributed to cloning of this construct.

Appendix
106
6.4.5 p21 donor DNA (pAAV-p21-CSEPT)
GGCCGCTGGCTCACTGCAGCTTCAAACTCCTGGGCTCAAGCGATCTTCCTACCTCAGCCTCCTGGGTAGCTGGGAAGCTGGGACTATAGTTGTACACCAC
TACGCCCGGTTAATTTTTTGAGTTTTTGTAGAGACAAGGTCTCACCATGTTGCCCGGGCTGGTCTTGAACTCCTGAGCTCAAGCAGTCCTCCTGCCTCAGC
CTCCCAAAGTGTTGTGATTACAGGCGTGAGCCACCATGCCCAGCCCCTTGCCATCCTTTTAGGGCAAGGAAACCAGGCTCAGAGAGGTAGAGTGATTTA
TCTAAGGTCTCAAAGTGAATTTGCCGTTGGGTCAAGACTAATTATAATAACAACAACTACTGACGTTTATATGGGCCCGGCATTGTGCTGAACACTTTCA
TGGATTTTGTAACAGAATCCCTAGATCAGCACTGTCCAGTAACTCTGCAGGGATGGGAGTGTCCGGTACAGGGGCCACGAGCCACATACGGCTGTTGTG
CATTTGACACACAGCTCATGTGACTGAGGAACTGAATTGTTCATTTTATTTGATTGTAGTCTGTTTAAACAAGCACACAGAGCTAGTAGTGGTTCCTCTGC
TGGGCAGCTTGACTTAGAGCAGACCCATGGGTGCGGGTGCGGTGATGGATAAAATCACATCTGTGAAGCATGGTGGGACACTCCATAATACCCCTCAA
GAGACAGAGTGGACGTTCCCCGAGTTCTTCCTGTTCTCAGCAGTCGGCCCCATTGGCCCCAGGGAAGGGTGTCCTGGCCCCCCACTGTCTTCCTCAGTTG
GGCAGCTCCGCCGCGTCCTCTTCTTCTTGGCCTGGCTGACTTCTGCTGTCTCTCCTCAGATTTCTACCACTCCAAACGCCGGCTGATCTTCTCCAAGAGGAA
GCCCACTAGTATGGTGAGCAAGGGCGAGGAGGATAACATGGCCATCATCAAGGAGTTCATGCGCTTCAAGGTGCACATGGAGGGCTCCGTGAACGGC
CACGAGTTCGAGATCGAGGGCGAGGGCGAGGGCCGCCCCTACGAGGGCACCCAGACCGCCAAGCTGAAGGTGACCAAGGGTGGCCCCCTGCCCTTCG
CCTGGGACATCCTGTCCCCTCAGTTCATGTACGGCTCCAAGGCCTACGTGAAGCACCCCGCCGACATCCCCGACTACTTGAAGCTGTCCTTCCCCGAGGGC
TTCAAGTGGGAGCGCGTGATGAACTTCGAGGACGGCGGCGTGGTGACCGTGACCCAGGACTCCTCCCTGCAGGACGGCGAGTTCATCTACAAGGTGAA
GCTGCGCGGCACCAACTTCCCCTCCGACGGCCCCGTAATGCAGAAGAAGACCATGGGCTGGGAGGCCTCCTCCGAGCGGATGTACCCCGAGGACGGCG
CCCTGAAGGGCGAGATCAAGCAGAGGCTGAAGCTGAAGGACGGCGGCCACTACGACGCTGAGGTCAAGACCACCTACAAGGCCAAGAAGCCCGTGCA
GCTGCCCGGCGCCTACAACGTCAACATCAAGTTGGACATCACCTCCCACAACGAGGACTACACCATCGTGGAACAGTACGAACGCGCCGAGGGCCGCCA
CTCCACCGGCGGCATGGACGAGCTGTACAAGTAATCTAAGTAATCACTAGTGGATCCATAACTTCGTATAGCATACATTATACGAAGTTATGGAATTAAT
TCGCTGTCTGCGAGGGCCAGCTGTTGGGGTGAGTACTCCCTCTCAAAAGCGGGCATGACTTCTGCGCTAAGATTGTCAGTTTCCAAAAACGAGGAGGATTT
GATATTCACCTGGCCCGCGGTGATGCCTTTGAGGGTGGCCGCGTCCATCTGGTCAGAAAAGACAATCTTTTTGTTGTCAAGCTTGAGGTGTGGCAGGCTTG
AGATCTGGCCATACACTTGAGTGACAATGACATCCACTTTGCCTTTCTCTCCACAGGTGTCCACTCCCAGGTCCAACTGCAGGTCGAGCGTCGAGAACGTTA
CTGGCCGAAGCCGCTTGGAATAAGGCCGGTGTGCGTTTGTCTATATGTTATTTTCCACCATATTGCCGTCTTTTGGCAATGTGAGGGCCCGGAAACCTGGCC
CTGTCTTCTTGACGAGCATTCCTAGGGGTCTTTCCCCTCTCGCCAAAGGAATGCAAGGTCTGTTGAATGTCGTGAAGGAAGCAGTTCCTCTGGAAGCTTCTT
GAAGACAAACAACGTCTGTAGCGACCCTTTGCAGGCAGCGGAACCCCCCACCTGGCGACAGGTGCCTCTGCGGCCAAAAGCCACGTGTATAAGATACACC
TGCAAAGGCGGCACAACCCCAGTGCCACGTTGTGAGTTGGATAGTTGTGGAAAGAGTCAAATGGCTCTCCTCAAGCGTATTCAACAAGGGGCTGAAGGAT
GCCCAGAAGGTACCCCATTGTATGGGATCTGATCTGGGGCCTCGGTGCACATGCTTTACATGTGTTTAGTCGAGGTTAAAAAAACGTCTAGGCCCCCCGAA
CCACGGGGACGTGGTTTTCCTTTGAAAAACACGATGATAAGCTTGCCACAACCATGGCTGAACAAGATGGATTGCACGCAGGTTCTCCGGCCGCTTGGGT
GGAGAGGCTATTCGGCTATGACTGGGCACAACAGACAATCGGCTGCTCTGATGCCGCCGTGTTCCGGCTGTCAGCGCAGGGGCGCCCGGTTCTTTTTGTC
AAGACCGACCTGTCCGGTGCCCTGAATGAACTGCAGGACGAGGCAGCGCGGCTATCGTGGCTGGCCACGACGGGCGTTCCTTGCGCAGCTGTGCTCGAC
GTTGTCACTGAAGCGGGAAGGGACTGGCTGCTATTGGGCGAAGTGCCGGGGCAGGATCTCCTGTCATCTCACCTTGCTCCTGCCGAGAAAGTATCCATCA
TGGCTGATGCAATGCGGCGGCTGCATACGCTTGATCCGGCTACCTGCCCATTCGACCACCAAGCGAAACATCGCATCGAGCGAGCACGTACTCGGATGGA
AGCCGGTCTTGTCGATCAGGATGATCTGGACGAAGAGCATCAGGGGCTCGCGCCAGCCGAACTGTTCGCCAGGCTCAAGGCGCGCATGCCCGACGGCGA
GGATCTCGTCGTGACCCATGGCGATGCCTGCTTGCCGAATATCATGGTGGAAAATGGCCGCTTTTCTGGATTCATCGACTGTGGCCGGCTGGGTGTGGCG
GACCGCTATCAGGACATAGCGTTGGCTACCCGTGATATTGCTGAAGAGCTTGGCGGCGAATGGGCTGACCGCTTCCTCGTGCTTTACGGTATCGCCGCTCC
CGATTCGCAGCGCATCGCCTTCTATCGCCTTCTTGACGAGTTCTTCTGAGCGGGACTCTGGGGTTCGGGGGATCCAGACATGATAAGATACATTGATGAGT
TTGGACAAACCACAACTAGAATGCAGTGAAAAAAATGCTTTATTTGTGAAATTTGTGATGCTATTGCTTTATTTGTAACCATTATAAGCTGCAATAAACAAG
TTAACAACAACAATTGCATTCATTTTATGTTTCAGGTTCAGGGGGAGGTGTGGGAGGTTTTTTCTAGGGGGCCCCGGCGAGGCCGGGATGAGTTGGGAAT
AACTTCGTATAGCATACATTATACGAAGTTATCCAAATTTTAAGGTACCACTGTGCATATGTATGAATTCGATATCAAGCTTATCGATACCGTCGACTCCGC
CCACAGGAAGCCTGCAGTCCTGGAAGCGCGAGGGCCTCAAAGGCCCGCTCTACATCTTCTGCCTTAGTCTCAGTTTGTGTGTCTTAATTATTATTTGTGTT
TTAATTTAAACACCTCCTCATGTACATACCCTGGCCGCCCCCTGCCCCCCAGCCTCTGGCATTAGAATTATTTAAACAAAAACTAGGCGGTTGAATGAGAG
GTTCCTAAGAGTGCTGGGCATTTTTATTTTATGAAATACTATTTAAAGCCTCCTCATCCCGTGTTCTCCTTTTCCTCTCTCCCGGAGGTTGGGTGGGCCGGC
TTCATGCCAGCTACTTCCTCCTCCCCACTTGTCCGCTGGGTGGTACCCTCTGGAGGGGTGTGGCTCCTTCCCATCGCTGTCACAGGCGGTTATGAAATTCA
CCCCCTTTCCTGGACACTCAGACCTGAATTCTTTTTCATTTGAGAAGTAAACAGATGGCACTTTGAAGGGGCCTCACCGAGTGGGGGCATCATCAAAAAC
TTTGGAGTCCCCTCACCTCCTCTAAGGTTGGGCAGGGTGACCCTGAAGTGAGCACAGCCTAGGGCTGAGCTGGGGACCTGGTACCCTCCTGGCTCTTGA
TACCCCCCTCTGTCTTGTGAAGGCAGGGGGAAGGTGGGGTCCTGGAGCAGACCACCCCGCCTGCCCTCATGGCCCCTCTGACCTGCACTGGGGAGCCCG
TCTCAGTGTTGAGCCTTTTCCCTCTTTGGCTCCCCTGTACCTTTTGAGGAGCCCCAGCTACCCTTTTTCTCCAGCTGGGCTCTGCAATTCCCCTCTGCTGCTG
TCCCTCCCCCTTGTCCTTTCCCTTCAGTACCCTCTCAGCTCCAGGTGGCTCTGAGGTGCCTGTCCCACCCGCGGCC
TGGCTCACTGC…GAAGCCC: The left homology arm of p21
ATGGTGA…ACAAG: mCherry
ATAACTTCGTATAGCATACATTATACGAAGTTA: Loxp sites
GGAATTAA…ACAACC: IRES
ATGGCTG…TCTTCTGA: Neomycin resistance gene
TCCGCCC…CCCACCC: The right homology arm of p21
This construct was designed and cloned by Dr. Alexander Loewer.

Appendix
107
6.4.6 mutant p21 donor DNA (pDO-p21-CSN)
AGTCGCGGCCGCTGCTGCATGGACTCTGTGATCAATTTCTTGAGTATGTGTCTGTAGCCATGCTCTTTAAACTTGTACATGGCCCCATTTATGGATGAGGA
AACTGAGACCTAGAGACATTAAGTGGCTTTTTAAAGCTTACGTAGTAACTGGCAGAGCTAGGACCACAACCCGGGTGCTTTTTGCCCCAAAGTCCCGGG
TACTTTTACTTGGCAGAGCAGGGTTACCCTACTTGGGGATCTGGGTCGGGGGACTTAGGAGGCTGGAGGAACTGTCAGACTGTTTCTTCTTTTGGGAAT
TGACCTTCTGGCCAGGGCTGCGATTAGGAAACTGCTGGACTCTGGCAATTCACACATATTTGGGGGGCATTCACACCCATGAGGGACACCTCTGGGGGG
AAAACAAATTGATTTTAGCTGATAATACCTGGTGGCAAACAGGACCCTGGTCCTTGCTCTTGCAATAGACTTGCCTTTGTTGACATTAGCTTGCCCTTCAG
TTGCCTGCTCTCCCAGTGACCTTGGTGTGCCAGGCTGGCTGAGCTCTGCTGGTGGGGGTCAGGCCTCCTGTGGGAAGGAAGCAGGAAGACCAGCTGGA
AGGAGTGAGAGAGACCCTCTGGTAGGAAGACGTCACCTGAGGTGACACAGCAAAGCCCGGCCAGGTAACATAGTGTCTAATCTCCGCCGTGACCAGG
GCCTTCCTTGTATCTCTGCTGCAGGCGCCATGTCAGAACCGGCTGGGGATGTCCGTCAGAACCCATGCGGCAGCAAGGCCTGCCGCCGCCTCTTCGGCCC
AGTGGACAGCGAGCAGCTGAGCCGCGACTGTGATGCGCTAATGGCGGGCTGCATCCAGGAGGCCCGTGAGCGATGGAACTTCGACTTTGTCACCGAG
ACACCACTGGAGGGTGACTTCGCCTGGGAGCGTGTGCGGGGCCTTGGCCTGCCCAAGCTCTACCTTCCCACGGGGCCCCGGCGAGGCCGGGATGAGTT
GGGAGGAGGCAGGCGGCCTGGCACCTCACCTGCTCTGCTGCAGGGGACAGCAGAGGAAGACCATGTGGACCTGTCACTGTCTTGTACCCTTGTGCCTC
GCTCAGGGGAGCAGGCTGAAGGGTCCCCAGGTGGACCTGGAGACTCTCAGGGTCGAAAACGGCGGGCAACCAGCGCGACAGGTGCGGACATGTGCA
CGGAAGGACTTTGTAAGGGACCAGGATTCTCAGAATCCATGGTCCAAGGGCTGACCTGTCTGGTCCTGGTCCAGCATGCTCCAGGTAGAAGGAAACAG
GCCCAGAGAGGGGAAGCAACCTCCCTGAGGTCACACAGCAAGTAGGCAGCAAAGACCAACTAGCTAACATTTATTGGGAATGTTCATTATGCCAGGCC
CTTTGCCAAGCTTCTAAGGTAGATTTATTTAGTCCTTATAGCAATGTTATAACATAAGACATTCTTGTCACCCTGCCCGCCTTTCTTTTTGAGACAGGTGTC
TTAACTCTGTTGGCCAGACTGGAGTGCAGTGATACGATCATGGCTCACTGCAGCTTCAAACTCCTGGGCTCAAGCGATCTTCCTACCTCAGCCTCCTGGGT
AGCTGGGAAGCTGGGACTATAGTTGTACACCACTACGCCCGGTTAATTTTTTGAGTTTTTGTAGAGACAAGGTCTCACCATGTTGCCCGGGCTGGTCTTG
AACTCCTGAGCTCAAGCAGTCCTCCTGCCTCAGCCTCCCAAAGTGTTGTGATTACAGGCGTGAGCCACCATGCCCAGCCCCTTGCCATCCTTTTAGGGCAA
GGAAACCAGGCTCAGAGAGGTAGAGTGATTTATCTAAGGTCTCAAAGTGAATTTGCCGTTGGGTCAAGACTAATTATAATAACAACAACTACTGACGTT
TATATGGGCCCGGCATTGTGCTGAACACTTTCATGGATTTTGTAACAGAATCCCTAGATCAGCACTGTCCAGTAACTCTGCAGGGATGGGAGTGTCCGGT
ACAGGGGCCACGAGCCACATACGGCTGTTGTGCATTTGACACACAGCTCATGTGACTGAGGAACTGAATTGTTCATTTTATTTGATTGTAGTCTGTTTAA
ACAAGCACACAGAGCTAGTAGTGGTTCCTCTGCTGGGCAGCTTGACTTAGAGCAGACCCATGGGTGCGGGTGCGGTGATGGATAAAATCACATCTGTG
AAGCATGGTGGGACACTCCATAATACCCCTCAAGAGACAGAGTGGACGTTCCCCGAGTTCTTCCTGTTCTCAGCAGTCGGCCCCATTGGCCCCAGGGAA
GGGTGTCCTGGCCCCCCACTGTCTTCCTCAGTTGGGCAGCTCCGCCGCGTCCTCTTCTTCTTGGCCTGGCTGACTTCTGCTGTCTCTCCTCAGATGCCTACCA
CTCCAAACGCCGGCTGATCTTCTCCAAGAGGAAGCCCCGCTCTAGAACTAGTATGGTGAGCAAGGGCGAGGAGGATAACATGGCCATCATCAAGGAGT
TCATGCGCTTCAAGGTGCACATGGAGGGCTCCGTGAACGGCCACGAGTTCGAGATCGAGGGCGAGGGCGAGGGCCGCCCCTACGAGGGCACCCAGAC
CGCCAAGCTGAAGGTGACCAAGGGTGGCCCCCTGCCCTTCGCCTGGGACATCCTGTCCCCTCAGTTCATGTACGGCTCCAAGGCCTACGTGAAGCACCCC
GCCGACATCCCCGACTACTTGAAGCTGTCCTTCCCCGAGGGCTTCAAGTGGGAGCGCGTGATGAACTTCGAGGACGGCGGCGTGGTGACCGTGACCCA
GGACTCCTCCCTGCAGGACGGCGAGTTCATCTACAAGGTGAAGCTGCGCGGCACCAACTTCCCCTCCGACGGCCCCGTAATGCAGAAGAAGACCATGG
GCTGGGAGGCCTCCTCCGAGCGGATGTACCCCGAGGACGGCGCCCTGAAGGGCGAGATCAAGCAGAGGCTGAAGCTGAAGGACGGCGGCCACTACG
ACGCTGAGGTCAAGACCACCTACAAGGCCAAGAAGCCCGTGCAGCTGCCCGGCGCCTACAACGTCAACATCAAGTTGGACATCACCTCCCACAACGAG
GACTACACCATCGTGGAACAGTACGAACGCGCCGAGGGCCGCCACTCCACCGGCGGCATGGACGAGCTGTACAAGCCCGGGGATGAGATGGAAGAGT
GCTCTCAGCACTTACCCGGCGCCGGCAGTAGTGGCGATATCATGGATTACAAGGATGACGACGATAAGGGCTCTTCCGGGACAGGCTCCGGATCCGGCAC
TAGTGCGCCCATCACGGCGTACGCCCAGCAGACGAGAGGCCTCCTAGGGTGTATAATCACCAGCCTGACTGGCCGGGACAAAAACCAAGTGGAGGGTGA
GGTCCAGATCGTGTCAACTGCTACCCAAACCTTCCTGGCAACGTGCATCAATGGGGTATGCTGGGCAGTCTACCACGGGGCCGGAACGAGGACCATCGCA
TCACCCAAGGGTCCTGTCATCCAGATGTATACCAATGTGGACCAAGACCTTGTGGGCTGGCCCGCTCCTCAAGGTTCCCGCTCATTGACACCCTGTACCTGC
GGCTCCTCGGACCTTTACCTGGTCACGAGGCACGCCGATGTCATTCCCGTGCGCCGGCGAGGTGATAGCAGGGGTAGCCTGCTTTCGCCCCGGCCCATTTC
CTACTTGAAAGGCTCCTCTGGGGGTCCGCTGTTGTGCCCCGCGGGACACGCCGTGGGCCTATTCAGGGCCGCGGTGTGCACCCGTGGAGTGGCTAAAGCG
GTGGACTTTATCCCTGTGGAGAACCTAGAGACAACCATGAGATCCCCGGTGTTCACGGACAACTCCTCTCCACCAGCAGTCACCCTGACGCACCCAATCACC
AAAATCGATACCAAATACATCATGACATGCATGTCGGCCGACCTGGAGGTCGTCACGAGCACCTGGGTGCTCGTTGGCGGCGTCCTGGCTGCTCTGGCCG
CGTATTGCCTGTCAACAGGCTGCGTGGTCATAGTGGGCAGGATCGTCTTGTCCGGGAAGCCGGCAATTATACCTGACAGGGAGGTTCTCTACAAGATAAC
TTCGTATAGCATACATTATACGAAGTTATTTGGAAGCGGAGCTACTAACTTCAGCCTGCTGAAGCAGGCTGGAGACGTGGAGGAGAACCCTGGACCTAT
GGCTGAACAAGATGGATTGCACGCAGGTTCTCCGGCCGCTTGGGTGGAGAGGCTATTCGGCTATGACTGGGCACAACAGACAATCGGCTGCTCTGATGCC
GCCGTGTTCCGGCTGTCAGCGCAGGGGCGCCCGGTTCTTTTTGTCAAGACCGACCTGTCCGGTGCCCTGAATGAACTGCAGGACGAGGCAGCGCGGCTAT
CGTGGCTGGCCACGACGGGCGTTCCTTGCGCAGCTGTGCTCGACGTTGTCACTGAAGCGGGAAGGGACTGGCTGCTATTGGGCGAAGTGCCGGGGCAGG
ATCTCCTGTCATCTCACCTTGCTCCTGCCGAGAAAGTATCCATCATGGCTGATGCAATGCGGCGGCTGCATACGCTTGATCCGGCTACCTGCCCATTCGACC
ACCAAGCGAAACATCGCATCGAGCGAGCACGTACTCGGATGGAAGCCGGTCTTGTCGATCAGGATGATCTGGACGAAGAGCATCAGGGGCTCGCGCCAG
CCGAACTGTTCGCCAGGCTCAAGGCGCGCATGCCCGACGGCGAGGATCTCGTCGTGACCCATGGCGATGCCTGCTTGCCGAATATCATGGTGGAAAATGG
CCGCTTTTCTGGATTCATCGACTGTGGCCGGCTGGGTGTGGCGGACCGCTATCAGGACATAGCGTTGGCTACCCGTGATATTGCTGAAGAGCTTGGCGGC
GAATGGGCTGACCGCTTCCTCGTGCTTTACGGTATCGCCGCTCCCGATTCGCAGCGCATCGCCTTCTATCGCCTTCTTGACGAGTTCTTCTGAATAACTTCGT
ATAGCATACATTATACGAAGTTATAACCACTGTGCATATGTATGTCCGCCCACAGGAAGCCTGCAGTCCTGGAAGCGCGAGGGCCTCAAAGGCCCGCTCT
ACATCTTCTGCCTTAGTCTCAGTTTGTGTGTCTTAATTATTATTTGTGTTTTAATTTAAACACCTCCTCATGTACATACCCTGGCCGCCCCCTGCCCCCCAGC
CTCTGGCATTAGAATTATTTAAACAAAAACTAGGCGGTTGAATGAGAGGTTCCTAAGAGTGCTGGGCATTTTTATTTTATGAAATACTATTTAAAGCCTC
CTCATCCCGTGTTCTCCTTTTCCTCTCTCCCGGAGGTTGGGTGGGCCGGCTTCATGCCAGCTACTTCCTCCTCCCCACTTGTCCGCTGGGTGGTACCCTCTGG
AGGGGTGTGGCTCCTTCCCATCGCTGTCACAGGCGGTTATGAAATTCACCCCCTTTCCTGGACACTCAGACCTGAATTCTTTTTCATTTGAGAAGTAAACA
GATGGCACTTTGAAGGGGCCTCACCGAGTGGGGGCATCATCAAAAACTTTGGAGTCCCCTCACCTCCTCTAAGGTTGGGCAGGGTGACCCTGAAGTGA
GCACAGCCTAGGGCTGAGCTGGGGACCTGGTACCCTCCTGGCTCTTGATACCCCCCTCTGTCTTGTGAAGGCAGGGGGAAGGTGGGGTCCTGGAGCAG
ACCACCCCGCCTGCCCTCATGGCCCCTCTGACCTGCACTGGGGAGCCCGTCTCAGTGTTGAGCCTTTTCCCTCTTTGGCTCCCCTGTACCTTTTGAGGAGCC
CCAGCTACCCTTTTTCTCCAGCTGGGCTCTGCAATTCCCCTCTGCTGCTGTCCCTCCCCCTTGTCCTTTCCCTTCAGTACCCTCTCAGCTCCAGGTGGCTCTGA
GGTGCCTGTCCCACCCGCGGCCGCGATATCC
TGCTGCATGG...AGGAAGCCC: The left homology arm of p21 which contains following mutations:

Appendix
108
…GTCGAAAACGGCGGCAGACCAGCATGACAGGTGC… (WT sequences in Exon 2) ->
…GTCGAAAACGGCGGGCAACCAGCGCGACAGGTGC… (corresponding mutant sequences)
…AGATTTCTAC… (WT sequences in Exon 3) ->
…AGATGCCTAC… (corresponding mutant sequences in Exon 3)
ATGGTGA…ACAAG: mCherry
CCCGGGG…CAAG: SMASh
GGAAGCGGAGCTACTAACTTCAGCCTGCTGAAGCAGGCTGGAGACGTGGAGGAGAACCCT: P2A
ATAACTTCGTATAGCATACATTATACGAAGTTAT: Loxp sites
ATGGCTG…TCTTCTGA: Neomycin resistance gene
TCCGCCC...CACCC: The right homology arm of p21

Appendix
109
6.5 Single cell trajectories
72 randomly selected samples (to be continued)

Appendix
110
72 randomly selected samples (continued)

111
Acknowledgements
Frist of all I would like to give my great thanks to Prof. Dr. Alexander Loewer, who gives
me the opportunity to start this thesis, guides me with patience whenever frustrating
moments came and always supports me with full kindness.
I also would like to thank Prof. Dr. Andreas Herrmann for your efforts on my doctoral study,
including participating in my first committee meeting and reviewing this thesis. I also
want to thank Dr. Jana Wolf for your willingness to review my thesis.
A very special thank goes to the Loewer lab, especially to Andrea (MDC), Ulrike (TU
Darmstadt) and Petra (TU Darmstadt) for your technical assistance; Marcel for
bioinformatics support and development of image analysis; Stefan for the SMASh; Stefanie,
Anna and Laura for the translation of abstract. I would like to thank Qingyao, Christian,
Jonathan and Sara who all help me on part of my thesis or other projects. I would also like
to thank Isabella from Prof. Dr. Barbara Drossel’s group for the collaboration on modelling
which is not mentioned in this thesis. I also want to thank Jennifer (TU Darmstadt) and
Ines (MDC) for your help on many document works.
I would also like to express my thanks to Ana, Andrea, Dhana, Marcel, Jette, Ilias, Elena for
all honest advices and help. You guys not only share your skills with me but also offer me
aid on personal business (e.g., communicating with my landlord). Thanks for inviting me
to your friends and sharing your personal experiences. There are many unforgettable
memories at MDC and on the way home after work.
Last but not least, I would like to express my thanks to my family and girlfriend. 其实语言
已经无法表达对我家人的感谢。我的父亲盛跃进,母亲陈秀芹和姐姐盛彩铃一家,因
为你们一直以来的默默支持和无私的奉献才可能有今天的我。Most importantly, I want
to thank my beloved, Qingyao. It is my great fortune to meet you. 你的特别和纯粹深深地
吸引了我。你的爱和信任给了我力量去做个更好的人。谢谢你愿意和我一起面对未来
的挑战!

112
Selbststandigkeitserklarung
Ich erkläre ausdrücklich, dass es sich bei der von mir eingereichten Arbeit um eine
von mir selbstständig und ohne fremde Hilfe verfasste Arbeit handelt.
Ich erkläre ausdrücklich, dass ich sämtliche in der oben genannten Arbeit
verwendeten fremden Quellen, auch aus dem Internet (einschließlich Tabellen,
Grafiken u. Ä.) als solche kenntlich gemacht habe. Insbesondere bestätige ich, dass
ich ausnahmslos sowohl bei wörtlich übernommenen Aussagen bzw. unverändert
übernommenen Tabellen, Grafiken o. Ä. (Zitaten) als auch bei in eigenen Worten
wiedergegebenen Aussagen bzw. von mir abgewandelten Tabellen, Grafiken o.Ä.
anderer Autorinnen und Autoren die Quelle angegeben habe.
Mir ist bewusst, dass Verstöße gegen die Grundsätze der Selbstständigkeit als
Täuschung betrachtet und entsprechend geahndet werden.
Datum Unterschrift Doktorand/in