Embed Size (px)
Citation preview

Vision Research 47 (2007) 501–511www.elsevier.com/locate/visres
brought to you by COREView metadata, citation and similar papers at core.ac.uk
provided by Elsevier - Publisher Connector
Cellular pattern formation during retinal regeneration: A role for homotypic control of cell fate acquisition
Melinda J. Tyler a,b, David A. Cameron a,¤
a Department of Neuroscience and Physiology, SUNY Upstate Medical University, 750 E. Adams St., Syracuse, NY 13210, USAb MD/PhD Program, SUNY Upstate Medical University, Syracuse, NY, USA
Received 18 July 2006; received in revised form 23 August 2006
Abstract
A dominant mechanism of cellular patterning in the growing Wsh retina is control of cell fate acquisition by negative feedback signalsarising from diVerentiated cells. We tested the ability of a computational model of this pattern formation mechanism to simulate cellularpatterns in regenerated goldWsh retina. The model successfully simulated quantitative features of in vivo regenerated patterns, indicatingthat regenerating retina has access to and utilizes patterning mechanisms that are operational during normal growth. The atypical pat-terns of regenerated retina could arise in part from regenerative progenitors that, compared to normal growth progenitors, are lessresponsive to the feedback patterning signals.© 2006 Elsevier Ltd. All rights reserved.
Keywords: Retina; Repair; Regenerated; Modeling; Progenitor
1. Introduction
The lack of neuronal regeneration in the human centralnervous system is a contributing factor to the functionaldeWcits often associated with neurological disease andtrauma. In contrast, the central nervous systems of Wsh andamphibians exhibit a capacity for substantial cellularregeneration. Much experimental attention has beenfocused upon regeneration of the anamniote retina, withevidence mounting that the underlying mechanisms resem-ble those of development (Cameron, Gentile, Middleton, &Yurco, 2005; Cheon, Kuwata, & Saito, 2001; Chiba,Nakamura, Unno, & Saito, 2004; Chiba, Oi, & Saito, 2005;Goldman, Hankin, Li, Dai, & Ding, 2001; Mader & Cam-eron, 2004; Naruoka, Kojima, Ohmasa, Layer, & Saito,2003; Ohmasa & Saito, 2004; Otteson & Hitchcock, 2003;Raymond & Hitchcock, 2000; Reh & Levine, 1998; Saito,Kaneko, Maruo, Niino, & Sakaki, 1994; Stenkamp & Cam-eron, 2002). Many key aspects of regenerative cytogenesis
* Corresponding author. Fax: +1 315 464 7712.E-mail address: [email protected] (D.A. Cameron).
0042-6989/$ - see front matter © 2006 Elsevier Ltd. All rights reserved.doi:10.1016/j.visres.2006.08.025
in the retina, however, such as the molecular determinantsof cell fate acquisition, remain unresolved. By extension it isnot clear why atypical cellular patterns, which may nega-tively impact functional recovery, emerge in regeneratedretina (Braisted, Essman, & Raymond, 1994; Cameron &Carney, 2000; Cameron & Easter, 1995; Hitchcock & Van-DeRyt, 1994).
With respect to deWning the mechanisms that controlcellular pattern formation in the growing retina, compu-tational modeling provides a powerful method for gener-ating testable hypotheses. Several studies have usedcomputational approaches to investigate and objectivelyevaluate candidate patterning mechanisms during nor-mal retinal development such as the control of cell migra-tion and/or diVerentiation (Cameron & Carney, 2004;Eglen, van Ooyen, & Willshaw, 2000; Eglen & Willshaw,2002; Raven, Eglen, Ohab, & Reese, 2003; Tohya, Moc-hizuki, & Iwasa, 1999, 2003; Tyler, Carney, & Cameron,2005). Computational models of cellular pattern forma-tion during retinal regeneration, however, are absent.There is thus a limited theoretical basis for predictingwhether regenerative patterning mechanisms are similar

502 M.J. Tyler, D.A. Cameron / Vision Research 47 (2007) 501–511
to, or signiWcantly diVerent from, those in operation dur-ing normal retinal growth.
The aims of the current investigation were to evaluate adynamic computational model of cellular pattern forma-tion during retinal regeneration and to identify modeledparameters that could account quantitatively for the atypi-cal cellular patterns observed within the regenerated struc-ture. Previous empirical and computational analyses haveindicated that, in the inner retina of Wsh, cellular patternformation is dominated by mechanisms through which cellfate decisions are controlled via a set of independent,homotypic, inhibitory signals arising from diVerentiatedcells (Cameron & Carney, 2004; Tyler et al., 2005). Todetermine if similar mechanisms might control cellular pat-terning during adult retinal regeneration, we empiricallyevaluated regenerated goldWsh retina and performed com-putational simulations of regenerative growth. The resultssuggest that, as with normal retinal growth, cellular patternformation in regenerating retina is dominated by inhibi-tory, or negative feedback, signals that control cell fateacquisition in a homotypic manner, indicating a regenera-tive recapitulation of developmental patterning mecha-nisms. Evidence is also provided that suggests the atypicalcellular patterns of regenerated retina might emerge as aconsequence of both geometric characteristics of the regen-erating structure and regenerative progenitors with lowersensitivity to the feedback signals than that inferred fornormal growth progenitors.
2. Methods
2.1. Model system, intraocular drug delivery, and surgical lesion
Adult, light-adapted goldWsh (Carassius auratus) of standard length4.8–7.5 cm (mean 5.7 § 0.7, n D 34) were used for all experiments. Animaluse was approved by the Committee for the Humane Use of Animals,SUNY Upstate Medical University. To control for cellular pattern attri-butes that might vary as a function of Wsh size or retinal hemiWeld, Wsh ofsimilar standard lengths were used and cellular patterns were analyzedonly for dorsal retina. The procedures and details of intraocular applica-tion of the neurotoxin 6-hydroxydopamine (6-OHDA) or vehicle only(Tyler et al., 2005), and surgical excision of a patch of dorsal retina fromone eye of each Wsh (Cameron & Easter, 1995; Hitchcock, Lindsey Myhr,Easter, Mangione-Smith, & Jones, 1992) were as described previously. 6-OHDA selectively ablates retinal tyrosine hydroxylase-positive cells(TH+), the putative dopaminergic neurons of the goldWsh retina. Follow-ing surgery, Wsh were returned to their tanks and maintained for at least 12weeks.
2.2. Immunohistochemistry
Detection of TH+ and serotonin-positive (5-HT+) cells was achieved inretinal whole mounts using procedures described previously (Cameron &Carney, 2000, 2004; Tyler et al., 2005). These two inner nuclear layer neu-ron subtypes were chosen for pattern analysis due to the ease of selectivelabeling and neurotoxin-mediated ablation, as well as the previously char-acterized regularity of their two-dimensional patterns (Cameron & Car-ney, 2000, 2004; Tyler et al., 2005). BrieXy, light-adapted retinas were Wxed(0.25% picric acid/4% paraformaldehyde/0.1 M PO4, pH 7.0), Xat mounted,and processed for indirect epiXuorescence immunohistochemical labelingof TH+ or 5-HT+ cells. The primary antibodies used were anti-TH (Cat.#MAB318; Chemicon, Temecula, CA) and/or anti-5-HT (Cat. #MAB352;
Chemicon, Temecula, CA). Secondary antibodies (Cy3- or Cy2-conju-gated; Jackson ImmunoResearch, West Grove, PA) were used to screenfor primary antibody labeling; to enhance detection of 5-HT+ cells a ter-tiary antibody with the same conjugated Xuorophore as the secondaryantibody was often utilized. The reacted tissue was washed repeatedly withphosphate-buVered saline, mounted on a glass slide (pigmented epitheliumside down), and visualized with standard epiXuorescence light microscopy.The location and boundary determination of patches of regenerated retinawere achieved by (a) identiWcation of dorsal hemiretina via ocular land-marks and (b) evaluation and mapping of discontinuities in the conemosaic structure between extant and regenerated retina (Braisted et al.,1994; Cameron & Easter, 1995). Fields of labeled cells of area approxi-mately 0.5 mm2 were collected with a digital image capture system (Meta-morph).
2.3. Quantitative analysis of cellular patterns
The two-dimensional patterns of TH+ and 5-HT+ cells were analyzedusing spatial pattern analyses described previously (Cameron & Carney,2000, 2004; Tyler et al., 2005). BrieXy, for a given Weld of labeled cells incontrol or regenerated retina (two non-overlapping Welds were sampledfrom each retina) each labeled soma was assigned a two-dimensionalCartesian coordinate value. For each Weld the set of coordinate values wasevaluated quantitatively using three analyses: nearest neighbor distance(NND), density recovery proWle (DRP), and quadrat analyses. The attri-butes and application of each analysis have been described in depth(Greig-Smith, 1957; Rodieck, 1991; Cook, 1996; Cameron & Carney, 2000,2004; Eglen et al., 2000; Stenkamp, Powers, Carney, & Cameron, 2001). Allcell density measurements and pattern analyses were performed using cus-tom software (Tyler et al., 2005).
2.4. Computational modeling of retinal cell pattern formation
A computational, dynamic model of cellular pattern formation wastested for its ability to simulate the cellular organization and assembly ofregenerated retina. The fundamental details of this model have beendescribed previously (Cameron & Carney, 2004; Tyler et al., 2005). BrieXy,the model utilizes a physiologically realistic, negative feedback signalingmechanism that controls cell fate acquisition within an undiVerentiatedneuroepithelium. In the model, cell fates are regulated by signals thatinhibit the production of homotypic cells. These signals originate fromeach diVerentiated cell and decay exponentially with distance. The spaceconstant describing the exponential decay determines the density of newlyproduced cells. This model successfully recapitulates cell pattern forma-tion in the inner retina during normal growth of the goldWsh retina; otherhypothetical patterning mechanisms, such as migration of diVerentiatedcells, are not required. Additionally, the computational model accuratelysimulates cellular pattern formation in growing retina subsequent to selec-tive ablation of diVerentiated retinal neurons (Tyler et al., 2005).
For this report the computational model was extended to mimic regen-erative growth of the goldWsh retina after surgical lesion. SpeciWcally,model-derived growth was altered so that cellular assembly proceededfrom the edge of a lesion site into the region of excised retina, matching acommonly accepted geometry of retinal lesion resolution in adult Wsh(Hitchcock et al., 1992; Yurco & Cameron, 2005). To accommodate andevaluate the complex geometries of this “inward” regenerative growth,three geometric lesion conditions were tested: a circular patch, a squarepatch, and a roughly square patch with jagged edges. The latter geometryis hypothesized to best represent the spatial contours of surgically excisedretina, whereas the former two conditions provide well deWned, idealizedgeometric conditions that are relatively easily implemented.
For each model simulation of regenerative growth of TH+ patterns (sixsimulations were run for each geometric condition) a virtual control retinawas Wrst derived from simulated normal growth, using the “seed” coordi-nates of labeled cells derived from actual goldWsh retina (Tyler et al., 2005).These model-derived control patterns were not signiWcantly diVerent fromthe actual in vivo patterns (see Section 3), but provided larger areas fromwhich to collect quantitative pattern information. Within the central

M.J. Tyler, D.A. Cameron / Vision Research 47 (2007) 501–511 503
region of the large model-derived pattern a circular, square, or jaggedregion of minimum total area 4.0 mm2 was removed. A 50 �m wide bandof randomly patterned undiVerentiated cells was then aYxed contiguouslyto the excision boundary, consisting of a cellular density previously dem-onstrated to be suYcient for simulating the patterns of inner retinal cells(based on estimates from empirical measurements of the circumferentialgerminal zone; Cameron & Carney, 2004; Tyler et al., 2005). Increasing thedensity of these cells did not aVect the results nor did decreases to the low-est tested value of 50% (data not shown).
Modeled regenerative growth was initiated using cell-type-speciWcparameters appropriate for normal retinal growth (Cameron & Carney,2004; Tyler et al., 2005). In later simulations the parameter representingthe threshold of undiVerentiated cells to the inhibitory signal was varied inan eVort to improve the match between the cell density of the in vivo andmodel-derived regenerated cell patterns (see Section 3; Fig. 8 of Cameron& Carney, 2004). Following each iteration of regenerative growth (i.e.,50 �m linear growth into the lesion site) a new band of randomly distrib-uted undiVerentiated cells was generated and aYxed to the new lesionedge, and the feedback signal proWle determined de novo. Regenerativegrowth continued in this manner until the excision site was Wlled withregenerated cells. As with the earlier modeling of normal retinal growththe feedback signal is assumed to not accumulate (sum) across iterations.To evaluate patterning in the simulated regenerated retina a region ofWxed area completely within the Wnal, model-derived regenerated patternwas analyzed with NND, DRP, and quadrat analysis. For each simulationthe area of analyzed retina (0.5 mm2) approximated that analyzed for
in vivo retinas. Copies of the model code (in MatLab) are available fromthe corresponding author.
3. Results
3.1. Cellular patterns in control and regenerated goldWsh retina
Quantitative, two-dimensional spatial pattern analysesof TH+ cells in six control retinas were performed. Theresults are summarized in Table 1. Autocorrelation NND(aNND) analysis revealed normal distributions with values92.3§9.1 �m (mean§SD; nD12 non-overlapping sam-ples). Conformity ratio (CR) analysis of the aNND distri-butions indicated that the patterns were signiWcantlydiVerent (p < .05) from those expected for a random distri-bution (CR value 3.9§0.6, nD12; Cook, 1996). Autocorre-lation DRP (aDRP) analysis revealed eVective radiusvalues (Rodieck, 1991) of 76.5§ 13.5�m (nD 12), indicatingthe presence of local anti-clustering. Quadrat analysis indi-cated pattern regularity over large spatial scales. Theseanalyses revealed that patterns of TH+ cells in control
Table 1Spatial analyses of in vivo control and regenerated TH+ cell patterns
For each sampled retina in each category two non-overlapping regions were analyzed. The result of statistical comparison between the control and regen-erated data is reported as the p value from independent t-test analysis. ID, sampled region identiWer; n, number of analyzed cells; NND, nearest neighbordistance; CR, conformity ratio (Cook, 1996); ReV, eVective radius (Rodieck, 1991); Quadrat, pattern attributes derived from the dispersion index functionof quadrat analysis (Stenkamp et al., 2001) recorded as regular, random, Reg/rand (dispersion index distributed equally between regular and random), orClust/rand (dispersion index values distributed equally between clustered and random).
ID (n) NND (�m) mean § SD CR Density (mm¡2) ReV (�m) Quadrat
ControlTH1a (38) 86.3 § 25.5 3.4 75.4 66 RegularTH1b (41) 74.3 § 20.7 3.6 81.3 45 RegularTH2a (38) 87.1 § 23.1 3.8 75.4 77 RegularTH2b (41) 79.9 § 21.6 3.7 81.3 68 RegularTH3a (33) 98.2 § 24.7 4.0 65.5 82 RegularTH3b (42) 89.8 § 22.2 4.0 83.3 87 RegularTH4a (29) 99.4 § 27.7 3.6 57.5 99 RegularTH4b (30) 106.2 §21.2 5.0 59.5 85 RegularTH5a (28) 94.9 § 20.1 4.7 55.6 69 RegularTH5b (27) 99.6 § 32.3 3.1 53.6 78 RegularTH6a (35) 95.4 § 20.8 4.6 69.4 79 RegularTH6b (30) 96.6 § 29.6 3.6 59.5 83 Regular
Mean § SD 92.3 § 9.1 3.9 § 0.6 68.1 § 11.0 76.5 § 13.5p values
RegeneratedTH1a (45) 71.4 § 28.6 2.5 89.3 47 Reg/randTH1b (38) 60.6 § 24.3 2.5 75.4 0 RandomTH2a (49) 68.8 § 23.1 3.0 97.2 48 Reg/randTH2b (45) 71.0 § 33.7 2.1 89.3 52 Reg/randTH3a (52) 65.7 § 23.5 2.8 103.2 53 Reg/randTH3b (53) 64.6 § 24.2 2.7 105.2 85 Reg/randTH4a (50) 68.9 § 22.2 3.1 99.2 62 RegularTH4b (75) 47.8 § 31.1 1.5 148.8 30 RandomTH5a (29) 55.8 § 33.5 1.7 57.5 12 Clust/randTH5b (59) 52.8 § 32.4 1.6 117.1 0 RandomTH6a (40) 78.4 § 22.3 3.5 79.4 69 RegularTH6b (42) 76.9 § 29.5 2.6 83.3 59 Reg/rand
Mean § SD 65.2 § 9.4 2.5 § 0.6 95.4 § 23.0 43.1 § 27.1p values <.001 <.001 <.005 <.001

504 M.J. Tyler, D.A. Cameron / Vision Research 47 (2007) 501–511
retina are non-random, consistent with an earlier report(Tyler et al., 2005).
Visual inspection of lesioned retinas 12 weeks followingsurgery revealed successful retinal regeneration, as indi-cated by a localized region in dorsal retina of substantialdisruption in the cone mosaic (Fig. 1A; Cameron & Easter,1995). TH+ cells were present in regenerated retina(Fig. 1B), but aberrations in their cellular patterns were evi-dent; summary information for individual data sets fromregenerated retinas is tabulated in Table 1. Consistent withearlier reports (Cameron & Carney, 2000; Hitchcock &VanDeRyt, 1994) the density of regenerated TH+ cells wassigniWcantly elevated compared to control retinas (Fig. 2D,independent t-test p < .001). For regenerated TH+ cells theaNND values were signiWcantly smaller than in control ret-inas, as expected for a higher density of cells (Fig. 2A,65.2§ 9.4�m, nD12; p < .001). CR analysis indicated thatregenerated patterns, although non-random, were signiW-cantly less regular than those of control retinas (Fig. 2B,conformity ratio 2.5§ .6, nD12; p < .001). DRP analysisrevealed regenerated eVective radius values that were sig-niWcantly lower than controls, suggesting a disruption inhomotypic anti-clustering during regeneration (Fig. 2C,43.1§ 27.1�m, nD12; p < .001). Lastly, quadrat analysis
Fig. 1. IdentiWcation of regenerated retina in vivo. (A) Cone photorecep-tors viewed in a retinal whole-mount. The cone mosaic of regenerated ret-ina (right of the dotted line) is overtly disrupted relative to the adjoiningextant retina (left of the dotted line). (B) TH+ cells viewed in the same ret-inal whole-mount as (A), with the focal plane adjusted to the inner retina.The TH+ cells in the regenerated region tend to be packed more closelythan those in extant retina, suggesting a disruption in TH+ cell patterning(see Section 3 and Table 1).
revealed that regenerated patterns tended to be less regularthan those of control retina (Table 1). These analyses indi-cated that although TH+ cells were present in regeneratedretinas, they were arrayed in two-dimensional patterns sig-niWcantly diVerent from, and disrupted relative to, the pat-terns of control retinas.
3.2. EVects of targeted cell ablation upon regenerated cellular patterns
To investigate the determinants of cellular pattern for-mation in regenerated retina, patterns of TH+ and 5-HT+
cells were analyzed in retinas exposed to 6-OHDA prior tosurgical lesion. By utilizing a neurotoxin speciWc for onlyone of the neuron types but examining patterns of both celltypes, it was possible to rule out heterotypic eVects uponpattern formation of neurons residing within the same reti-nal lamina, conWrming Wndings of previous studies involv-ing goldWsh and zebraWsh retinal growth (Cameron &Carney, 2000, 2004; Tyler et al., 2005). Neurotoxin speciWc-ity was conWrmed by the loss of TH+ but not 5-HT+ cells,consistent with earlier reports (Fig. 3; Negishi, Teranishi, &Kato, 1982; Watling, Parkinson, & Dowling, 1982; Reh &Tully, 1986; Yazulla & Studholme, 1997; Tyler et al., 2005).TH+ cells were present in regenerated retina but not in theextant, neurotoxin exposed retina, indicating a lack of lat-eral migration of regenerated TH+ cells into the denudedretina (Fig. 3A). Furthermore, a signiWcantly elevated den-sity of regenerated TH+ cells, on the order of 1.7-fold com-pared to control, was observed adjacent to the original
Fig. 2. Spatial analysis of control and regenerated TH+ cell patternsin vivo. Nearest neighbor distance (NND; A), conformity ratio (B), eVec-tive radius (C), and cell density (D) analyses all revealed consistent, statis-tically signiWcant diVerences in the patterns of TH+ cells in control andregenerated retina (cf. Table 1). Values presented as means § standarddeviation.

M.J. Tyler, D.A. Cameron / Vision Research 47 (2007) 501–511 505
lesion edge (Fig. 3B; p < .05). This region of elevated densitycorresponds to retina regenerated immediately subsequentto injury (Hitchcock et al., 1992), and its presence 712weeks post-lesion was consistent with a lack of signiWcant“pruning” by cell death or lateral migration. There was nocorresponding elevation in the density of 5-HT+ cells(Fig. 3B). This regional, cell-type-speciWc hyperplasia wasconceptually identical to that observed for normal retinalgrowth following neurotoxin exposure (Tyler et al., 2005),and the operation of similar patterning mechanisms duringretinal regeneration was thus indicated.
3.3. Computational modeling of pattern formation in regenerated retina
Because the spatiotemporal control of cell fate acquisi-tion, and not cell death or cell migration, evidently domi-
Fig. 3. Regeneration of TH+ cells in cell ablated retina. (A) TH+ cells inregenerated retina (red cells) to the right of the image, as well as 5HT+
cells (green cells, arrows). The dotted line estimates the boundary betweenextant (left) and regenerated retina (right). Note the absence of TH+ cells,and presence of 5-HT+ cells, in the 6-OHDA-exposed region of retina (tothe left of the dotted line). (B) Normalized cell densities as a function ofdistance from the edge of the lesion site. TH+ cell density (red) was signiW-cantly elevated in regenerated region within the Wrst 50 �m of growthadjacent to the neurotoxin exposed retina (*, p < .05). 5-HT+ cell density(green) was not signiWcantly aVected (see Section 3).
nates the formation of TH+ cellular patterns in the growinggoldWsh retina, the contribution of this mechanism to theregeneration of TH+ patterns was assessed using a compu-tational model (see Section 3). Fields of model-derived con-trol retina (Fig. 4A) contained patterns of TH+ cells thatwere not statistically diVerent from the in vivo control pat-terns, as determined by NND, DRP (i.e., eVective radius),and quadrat analyses (Table 2). Patches of deWned geome-tries were removed to simulate retinal lesions (Fig. 4B–D).These model-derived regenerated patterns were producedwith the same model parameter values as used for TH+ cellproduction during normal retinal growth (Tyler et al.,2005). The model-derived regenerated patterns were statis-tically compared to the model-derived control patterns,with summary information for each data set provided inTable 2.
For all lesion geometries (circular, square, and jagged)model-derived regenerated cellular patterns had aNND dis-tributions that were greater (Fig. 5A), CR values that weresigniWcantly lower (Fig. 5B), eVective radius values that weregreater (Fig. 5C, with the exception of the jagged patterns),and densities that were signiWcantly smaller (Fig. 5D) thanthe model-derived control patterns. Compared to controlpatterns, quadrat analysis revealed that regenerated patternsalso tended to be less regular (Table 2). The geometry of thesurgical lesions apparently inXuenced the ability of the modelto simulate regenerated cellular patterns, with the jaggedlesion simulations producing patterns that were most similarto those observed in vivo. These analyses indicated thatalthough the model-derived regenerated patterns tended to
Fig. 4. Model-derived patterns of TH+ cells in control and regenerated ret-ina. (A) The fan-shaped distribution of black circles denotes the positionsof model-generated TH+ cells in a “control” retina. With the expectedexception of conformity ratio, spatial analyses revealed no signiWcantdiVerence between the model-derived and in vivo control patterns of TH+
cells (see Table 2). Examples of circular (B), square (C), or jagged (D) exci-sions from the control pattern of (A) are illustrated, within which model-derived, regenerated patterns of TH+ cells were produced (red).

506 M.J. Tyler, D.A. Cameron / Vision Research 47 (2007) 501–511
Table 2Spatial analyses of model-derived control and regenerated patterns of TH+ cells
For each category the spatial analyses are statistically compared to the corresponding in vivo control or regenerated data set (Table 1), with attendant p values indicated forindependent t-test analysis. Summary values in bold font are not signiWcantly diVerent from the corresponding in vivo data. The circular, square, and jagged data sets corre-spond to the geometry of the modeled lesion site (Fig. 4). Terminologies as in Table 1.
ID (n) NND (�m) Mean§SD CR Density (mm¡2) ReV (�m) Quadrat
ControlTH1a (39) 85.2§19.6 4.3 77.4 70 RegularTH1b (56) 74.2§14.7 5.0 111.1 62 RegularTH2a (36) 85.1§19.3 4.4 71.4 65 RegularTH2b (44) 76.6§18.3 4.2 87.3 65 RegularTH3a (34) 96.6§12.8 7.5 67.5 75 RegularTH3b (35) 88.2§16.9 5.2 69.4 86 RegularTH4a (35) 91.0§20.5 4.4 69.4 88 RegularTH4b (28) 103.1§12.9 8.0 55.6 84 RegularTH5a (33) 90.7§16.0 5.7 65.5 79 RegularTH5b (26) 96.8§21.3 4.5 51.6 71 RegularTH6a (34) 92.5§18.7 4.9 67.5 75 RegularTH6b (37) 89.2§17.2 5.2 73.4 73 Regular
Mean§SD 89.1§8.2 5.3§1.2 72.3§15.3 74.4§8.5In vivo test (p) .37 <.01 .45 .66
Circular lesionTH1a (36) 90.8§19.7 4.6 71.4 66 RegularTH1b (46) 74.3§19.7 3.8 91.3 61 RegularTH2a (31) 90.1§25.1 3.6 61.5 82 RegularTH2b (36) 88.2§22.6 3.9 71.4 76 RegularTH3a (26) 108.5§18.0 6.0 51.6 87 RegularTH3b (27) 97.5§26.3 3.7 53.6 84 Reg/randTH4a (25) 99.5§26.1* 3.8 49.6 92 Reg/randTH4b (22) 121.1§36.8 3.3 43.7 103 RegularTH5a (26) 102.2§20.6 5.0 51.6 93 Reg/randTH5b (24) 110.5§29.4 3.8 47.6 95 Reg/randTH6a (25) 99.8§26.1 3.8 49.6 85 Reg/randTH6b (30) 99.8§28.9 3.5 59.5 73 Regular
Mean§SD 98.5§12.0 4.1§0.8 58.5§13.6 83.1§12.3In vivo test (p) <.001 <.001 <.001 <.001
Square lesionTH1a (33) 96.1§18.8 5.1 65.5 77 RegularTH1b (49) 76.6§16.2 4.7 97.2 61 RegularTH2a (32) 94.7§22.0 4.3 63.5 79 RegularTH2b (42) 85.6§21.2 4.0 83.3 71 RegularTH3a (26) 96.0§30.7 3.1 51.6 79 Reg/randTH3b (28) 91.7§24.9 3.7 55.6 77 Reg/randTH4a (27) 107.1§28.5 3.8 53.6 93 Reg/randTH4b (22) 116.5§37.4 3.1 43.7 83 Reg/randTH5a (27) 102.7§26.3 3.9 53.6 91 Reg/randTH5b (22) 119.4§28.9 4.1 43.7 100 RegularTH6a (26) 103.7§28.0 3.7 51.6 86 Reg/randTH6b (29) 85.9§29.2 2.9 57.5 50 Reg/rand
Mean§SD 98.0§12.6 3.9§0.6 60.0§15.8 78.9§13.8In vivo test (p) <.001 <.001 <.001 <.001
Jagged lesionTH1a (36) 78.1§23.5 3.3 71.4 68 RegularTH1b (47) 73.8§17.5 4.2 93.3 48 RegularTH2a (32) 83.1§18.6 4.5 63.5 50 RegularTH2b (39) 80.6§25.1 3.2 77.4 65 Reg/randTH3a (28) 90.4§39.1 2.3 55.6 0 RandomTH3b (29) 86.9§30.9 2.8 57.5 50 RandomTH4a (29) 92.4§23.0 4.0 57.5 78 RegularTH4b (25) 101.1§34.7 2.9 49.6 82 RandomTH5a (28) 98.7§28.4 3.5 55.6 75 Reg/randTH5b (19) 110.4§34.7 2.9 37.7 79 Reg/randTH6a (29) 91.9§32.1 3.5 57.5 52 Reg/randTH6b (32) 98.6§28.1 3.2 63.5 77 Regular
Mean§SD 90.5§10.6 3.4§0.6 61.7§14.1 60.3§22.9In vivo test (p) <.001 <.01 <.001 .11

M.J. Tyler, D.A. Cameron / Vision Research 47 (2007) 501–511 507
be signiWcantly diVerent from the control patterns, with thejagged lesion geometry best matching the empirical data,they were in general poor estimates of the in vivo regeneratedpatterns (cf. Tables 1 and 2).
In an eVort to improve the simulations of regenerativepattern formation, a single model parameter that controlsthe undiVerentiated cells’ sensitivity (i.e., threshold) to thefeedback inhibitory signal was adjusted (see Fig. 8 of
Fig. 5. Spatial analysis of model-derived control and regenerated TH+ cellpatterns. In all plots mean § standard deviation are indicated for control(open bars) and regenerated patterns (Wlled bars), the latter including cir-cular, square, and jagged lesion geometries. NND (A), conformity ratio(B), eVective radius (C), and density (D) analyses are plotted as in Fig. 2.Asterisks indicate distributions not signiWcantly diVerent (p > .05) fromthe corresponding in vivo control or regenerated patterns (see Table 2).
Cameron & Carney, 2004). Adjustment was made to mini-mize the error in mean cell density between the in vivoregenerated cell patterns and the model jagged edged regen-erated cells patterns (cf. Tables 1 and 3). At the level ofundiVerentiated progenitors this adjustment is consistentwith either a decrease in the amount or level of the recep-tor/detector mechanism for the signal that inhibits cell fateacquisition, or diminished signaling eYcacy through theunderlying transduction pathway; as with our simulationsof normal retinal growth (Tyler et al., 2005), increases inmodeled progenitor cell density did not signiWcantly aVectthe regenerated cell patterns (data not shown).
By decreasing the threshold parameter representingundiVerentiated cells’ sensitivity to the inhibitory signalfrom ¡1.0 to ¡1.8§0.7 (nD12), but changing no othersimulation parameters, model-derived regenerated patternswere produced with aNND, DRP, and density results insig-niWcantly diVerent from those of in vivo regenerated retina(Table 3; Fig. 6A, C, and D). Like simulations of controlretinal growth the modeled CR values of regenerated retinawere consistently greater than the in vivo patterns (Cam-eron & Carney, 2004; Tyler et al., 2005), indicating thatalthough a certain degree of ‘noise’ in the biological pat-terning mechanism is absent from the model, the model stillproduces good pattern estimates over short and long spa-tial scales (cf. Tables 1 and 3, Figs. 2B, 6B). These resultsindicate that although a general negative feedback schemefor regulating cell fate acquisition can account for the for-mation of cellular patterns during both normal retinalgrowth and regeneration, some fundamental aspect of thesignaling scheme must be diVerent between the two cyto-genic conditions.
4. Discussion
A computational model that successfully simulates pat-tern formation of inner retinal cells in the growing goldWsh
Table 3Spatial analyses of adjusted model-derived patterns of regenerated TH+ cells
The jagged lesion geometry was used for all simulations. For each simulation ID (matching that of the jagged data set in Table 2), the model parameterrepresenting threshold for the inhibitory signal (Cameron & Carney, 2004) was adjusted downward to achieve a match between the model-derived andin vivo regenerated density of cells (see Section 3). Symbols, terminology, and statistical comparisons are the same as those of Table 2.
ID (n) Threshold NND (�m) mean § SD CR Density (mm¡2) ReV (�m) Quadrat
Adjusted jagged regeneratedTH1a (48) ¡1.5 74.6§ 21.9 3.4 95.2 62 RegularTH1b (47) ¡1.01 78.8§ 18.6 4.2 93.3 50 RegularTH2a (49) ¡1.7 69.4§ 23.3 3.0 97.2 46 RegularTH2b (45) ¡1.2 68.6§ 19.8 3.5 89.3 49 RegularTH3a (48) ¡1.75 59.0§ 15.1 3.9 95.2 34 Reg/randTH3b (55) ¡2.1 69.6§ 23.0 3.0 109.1 74 RegularTH4a (49) ¡2.1 66.6§ 17.1 3.9 97.2 41 RegularTH4b (60) ¡3.1 60.6§ 20.5 3.0 119.0 42 RegularTH5a (31) ¡1.1 86.5§ 26.3 3.3 61.5 50 RegularTH5b (59) ¡3.1 55.0§ 26.7 2.1 117.1 53 Reg/randTH6a (43) ¡1.75 69.4§ 26.6 2.6 85.3 49 RegularTH6b (43) ¡1.5 70.0§ 17.6 4.0 85.3 66 Regular
Mean § SD ¡1.8§ 0.7 69.0§ 8.6 3.3§ 0.6 95.4 § 15.4 51.3 § 11.2In vivo test (p) .31 <.01 .99 .34
508 M.J. Tyler, D.A. Cameron / Vision Research 47 (2007) 501–511
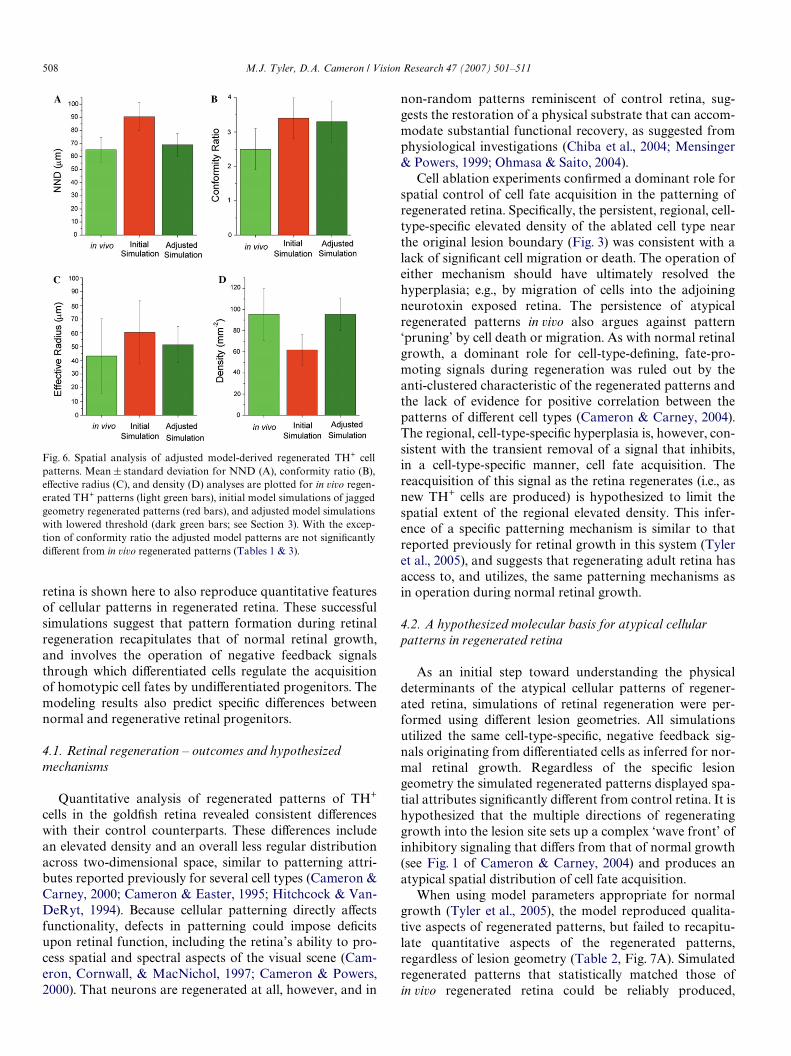
retina is shown here to also reproduce quantitative featuresof cellular patterns in regenerated retina. These successfulsimulations suggest that pattern formation during retinalregeneration recapitulates that of normal retinal growth,and involves the operation of negative feedback signalsthrough which diVerentiated cells regulate the acquisitionof homotypic cell fates by undiVerentiated progenitors. Themodeling results also predict speciWc diVerences betweennormal and regenerative retinal progenitors.
4.1. Retinal regeneration – outcomes and hypothesized mechanisms
Quantitative analysis of regenerated patterns of TH+
cells in the goldWsh retina revealed consistent diVerenceswith their control counterparts. These diVerences includean elevated density and an overall less regular distributionacross two-dimensional space, similar to patterning attri-butes reported previously for several cell types (Cameron &Carney, 2000; Cameron & Easter, 1995; Hitchcock & Van-DeRyt, 1994). Because cellular patterning directly aVectsfunctionality, defects in patterning could impose deWcitsupon retinal function, including the retina’s ability to pro-cess spatial and spectral aspects of the visual scene (Cam-eron, Cornwall, & MacNichol, 1997; Cameron & Powers,2000). That neurons are regenerated at all, however, and in
Fig. 6. Spatial analysis of adjusted model-derived regenerated TH+ cellpatterns. Mean § standard deviation for NND (A), conformity ratio (B),eVective radius (C), and density (D) analyses are plotted for in vivo regen-erated TH+ patterns (light green bars), initial model simulations of jaggedgeometry regenerated patterns (red bars), and adjusted model simulationswith lowered threshold (dark green bars; see Section 3). With the excep-tion of conformity ratio the adjusted model patterns are not signiWcantlydiVerent from in vivo regenerated patterns (Tables 1 & 3).
non-random patterns reminiscent of control retina, sug-gests the restoration of a physical substrate that can accom-modate substantial functional recovery, as suggested fromphysiological investigations (Chiba et al., 2004; Mensinger& Powers, 1999; Ohmasa & Saito, 2004).
Cell ablation experiments conWrmed a dominant role forspatial control of cell fate acquisition in the patterning ofregenerated retina. SpeciWcally, the persistent, regional, cell-type-speciWc elevated density of the ablated cell type nearthe original lesion boundary (Fig. 3) was consistent with alack of signiWcant cell migration or death. The operation ofeither mechanism should have ultimately resolved thehyperplasia; e.g., by migration of cells into the adjoiningneurotoxin exposed retina. The persistence of atypicalregenerated patterns in vivo also argues against pattern‘pruning’ by cell death or migration. As with normal retinalgrowth, a dominant role for cell-type-deWning, fate-pro-moting signals during regeneration was ruled out by theanti-clustered characteristic of the regenerated patterns andthe lack of evidence for positive correlation between thepatterns of diVerent cell types (Cameron & Carney, 2004).The regional, cell-type-speciWc hyperplasia is, however, con-sistent with the transient removal of a signal that inhibits,in a cell-type-speciWc manner, cell fate acquisition. Thereacquisition of this signal as the retina regenerates (i.e., asnew TH+ cells are produced) is hypothesized to limit thespatial extent of the regional elevated density. This infer-ence of a speciWc patterning mechanism is similar to thatreported previously for retinal growth in this system (Tyleret al., 2005), and suggests that regenerating adult retina hasaccess to, and utilizes, the same patterning mechanisms asin operation during normal retinal growth.
4.2. A hypothesized molecular basis for atypical cellular patterns in regenerated retina
As an initial step toward understanding the physicaldeterminants of the atypical cellular patterns of regener-ated retina, simulations of retinal regeneration were per-formed using diVerent lesion geometries. All simulationsutilized the same cell-type-speciWc, negative feedback sig-nals originating from diVerentiated cells as inferred for nor-mal retinal growth. Regardless of the speciWc lesiongeometry the simulated regenerated patterns displayed spa-tial attributes signiWcantly diVerent from control retina. It ishypothesized that the multiple directions of regeneratinggrowth into the lesion site sets up a complex ‘wave front’ ofinhibitory signaling that diVers from that of normal growth(see Fig. 1 of Cameron & Carney, 2004) and produces anatypical spatial distribution of cell fate acquisition.
When using model parameters appropriate for normalgrowth (Tyler et al., 2005), the model reproduced qualita-tive aspects of regenerated patterns, but failed to recapitu-late quantitative aspects of the regenerated patterns,regardless of lesion geometry (Table 2, Fig. 7A). Simulatedregenerated patterns that statistically matched those ofin vivo regenerated retina could be reliably produced,
M.J. Tyler, D.A. Cameron / Vision Research 47 (2007) 501–511 509
however, by adjusting a single parameter of the model. Thisparameter represents the sensitivity of progenitors to theinhibitory signal regulating cell fate acquisition, or equiva-lently reducing the amount of signal present. The modeldoes not diVerentiate between these two eVects, but theformer was chosen for adjustment because of the lack ofany explicit evidence to suggest that diVerentiated cells sur-rounding the lesion site diVer from their counterparts at theretinal margin. By adjusting the sensitivity parameterdownward, simulated regenerated patterns that matchedthe in vivo patterns were consistently produced (Table 3;Fig 7B and C). No other model parameter needed to beadjusted, including the space constant of the inferred inhib-itory signal (Cameron & Carney, 2004) or the density ofprogenitor cells (Tyler et al., 2005), suggesting that the samemolecular signal(s) could mediate patterning during regen-eration and normal growth. Although not formally exclu-sionary, the cell ablation experiments also argued againstthe hypothesis that set of signals diVerent from those aVect-ing normal retinal growth are in operation during regenera-tion (see below). These results supported the hypothesisthat cellular patterning during regeneration involves therecapitulation of developmental mechanisms that regulatecell fate acquisition.
The mechanisms that enable an adult retina to regener-ate are not well deWned, but are likely to involve a com-plex set of cellular and transcriptional events (Cameronet al., 2005). At the cellular level recent investigations indi-cate that Müller cells can exhibit a regenerative ‘stem cell’phenotype following retinal damage (Fausett & Goldman,2006; Fischer & Reh, 2001, 2003; Garcia & Vecino, 2003;Wu et al., 2001; Yurco & Cameron, 2005). Whether theseinjury induced stem cells are functionally identical tothose associated with normal retinal growth is unknown,but our modeling results suggest they are not. SpeciWcally,to successfully simulate regenerated cellular patterns, pro-genitors with signiWcantly lower sensitivity to the signalsthat inhibit cell fate acquisition were required. This resultpredicts that, compared to their counterparts at the cir-cumferential germinal zone (CGZ), regenerative progeni-tors in this system manifest lower expression/productionof the receptor, and/or a less eVective transduction path-way, leading to the cell fate decision mechanism. Such adichotomy may not be surprising given the diVerent cellu-lar histories of the growth and regenerative progenitorcells. Unlike regenerative progenitors, cells at the CGZare likely to not arise from Müller cells (or any otherdiVerentiated retinal cell type), and instead are likely aself-renewing population with origins early in develop-ment. That distinct populations of intrinsic progenitorscould produce the full complement of diVerentiated reti-nal cells might ultimately have implications regarding thedevelopment of strategies based upon stem cells for eVect-ing cellular repair in damaged or diseased retina. Itremains possible that physical parameters of the inhibi-tory feedback mechanism might vary between normal andregenerated retina: diVerences in the microenvironment
might aVect signal diVusion, and newly regenerated cellsmight produce less of the signal. Because the empiricalfoundations of these (and other) possibilities is quite lim-ited, for the current study we chose to manipulate thethreshold parameter, from which explicit and testable pre-dictions arise; i.e., that regenerative precursors mightexpress less receptor than their counterparts at the CGZ.
4.3. Candidate pattern formation signals
Cellular pattern formation in the CNS is a highly com-plex phenomenon, involving the coordinated productionof millions of cells via signaling mechanisms involvingdirect contact (Austin, Feldman, Ida, & Cepko, 1995;Spana & Doe, 1996; Umino & Saito, 2002) and diVusiblemolecules (Hyatt, Schmitt, Fadool, & Dowling, 1996;Neumann & Nuesslein-Volhard, 2000; Strutt & Strutt,2003; Waid & McLoon, 1998). Furthermore, the mecha-nisms aVecting cell fate acquisition within the CNSappear to be location-speciWc (Chizhikov & Millen, 2005;Wilson & Maden, 2005) and even time-speciWc (Binor &Heathcote, 2005). Computational modeling presents anopportunity to simplify the investigation of this complextopic by generating testable predictions about arestricted, well-deWned set of hypothetical patterningmechanisms. Although an inWnite number of disparatepatterning mechanisms could, in theory, account for theobserved cellular patterns, our relatively simple “onestep” model of cell fate acquisition in the retina is parsi-monious and explains inner retinal pattern formationduring both growth and regeneration.
Previous investigations have revealed the operation ofinhibitory signaling molecules that aVect phenotypicassignments in the retina (Belliveau & Cepko, 1999; Negishiet al., 1982, 1985; Reh & Tully, 1986; Waid & McLoon,1998). The results from our present and previous studies(Cameron & Carney, 2000, 2004; Tyler et al., 2005) deWne atleast three constraints that must be met by any candidatesignaling mechanism controlling cell fate acquisition in thissystem: (1) it must be present during both normal growthand regeneration; (2) it must control cell fate acquisition inan inhibitory, cell-type-speciWc manner; (3) the spatiotem-poral attributes of the signaling mechanisms, and thus theirmolecular components (receptors, ligands, etc.) are invari-ant between growth and regeneration.
We hypothesize that neurotransmitters could meet theabove criteria and could thus function as agents that inhibitthe acquisition of speciWc cell fates during retinal growthand regeneration. This hypothesis does not rule out theoperation of other agents (e.g., neurotrophins) in cellularpatterning, nor does it preclude distinct cell types fromsharing a common patterning signal. Neurotransmitters arepresent, however, during both normal and regenerativegrowth, are selectively produced by diVerentiated retinalcells, and could inXuence cellular phenomena over rela-tively large distances. Furthermore, both dopamine andserotonin have been shown to aVect various aspects of

510 M.J. Tyler, D.A. Cameron / Vision Research 47 (2007) 501–511
neuronal development (e.g., Buznikov, Shmukler, &Lauder, 1999; Herlenius & Lagercrantz, 2001; Lankford,DeMello, & Klein, 1998; Lima & Schmeer, 1994; Lima,Urbina, Matus, & Drujan, 1996; Moiseiwitsch, 2000;Rodrigues & Dowling, 1990; Zachor, Moore, Brezausek,Theibert, & Percy, 2000). These Wndings provide indirectsupport for the role of neurotransmitters as feedback mod-ulators of cell fate acquisition in the retina, and experimentsdesigned to directly test this hypothesis are currently beingpursued.
Acknowledgments
We thank Laurel Carney, Sandra Mooney, and PatrickYurco for helpful discussions and comments on the manu-script. Supported by National Science Foundation Grant0351250 (DAC).
References
Austin, C. P., Feldman, D. E., Ida, J. A., Jr., & Cepko, C. L. (1995). Verte-brate retinal ganglion cells are selected from competent progenitors bythe action of Notch. Development, 121, 3637–3650.
Belliveau, M. J., & Cepko, C. L. (1999). Extrinsic and intrinsic factors con-trol the genesis of amacrine and cone cells in the rat retina. Develop-ment, 126, 555–566.
Binor, E., & Heathcote, R. D. (2005). Activated notch disrupts the initialpatterning of dopaminergic spinal cord neurons. Developmental Neuro-science, 27, 306–312.
Braisted, J. E., Essman, T. F., & Raymond, P. A. (1994). Selective regenera-tion of photoreceptors in goldWsh retina. Development, 120, 2409–2419.
Buznikov, G. A., Shmukler, Y., & Lauder, J. M. (1999). Changes in thephysiological roles of neurotransmitters during individual develop-ment. Neuroscience and Behavioral Physiology, 29, 11–21.
Cameron, D. A., & Carney, L. H. (2000). Cell mosaic patterns in the nativeand regenerated inner retina of zebraWsh: implications for retinalassembly. Journal of Comparative Neurology, 416, 356–367.
Cameron, D. A., & Carney, L. H. (2004). Cellular patterns in the inner retinaof adult zebraWsh: Quantitative analyses and a computational model oftheir formation. Journal of Comparative Neurology, 471, 11–25.
Cameron, D. A., Cornwall, M. C., & MacNichol, E. F., Jr. (1997). Visualpigment assignments in regenerated retina. Journal of Neuroscience, 17,917–923.
Cameron, D. A., & Easter, S. S., Jr. (1995). Cone photoreceptor regenera-tion in adult Wsh retina: Phenotypic determination and mosaic patternformation. Journal of Neuroscience, 15, 2255–2271.
Cameron, D. A., Gentile, K. L., Middleton, F. A., & Yurco, P. (2005). Geneexpression proWles of intact and regenerating zebraWsh retina. Molecu-lar Vision, 11, 775–791.
Cameron, D. A., & Powers, M. K. (2000). Morphology and visual pigmentcontent of photoreceptors from injured goldWsh retina. Visual Neuro-science, 17, 623–630.
Cheon, E. W., Kuwata, O., & Saito, T. (2001). Muscarinic acetylcholinereceptors in the normal, developing and regenerating newt retinas.Brain Research Developmental Brain Research, 127, 9–21.
Chiba, C., Nakamura, K., Unno, S., & Saito, T. (2004). Intraocular implan-tation of DNA-transfected retinal pigment epithelium cells: A newapproach for analyzing molecular functions in the newt retinal regen-eration. Neuroscience Letters, 368, 171–175.
Chiba, C., Oi, H., & Saito, T. (2005). Changes in somatic sodium currentsof ganglion cells during retinal regeneration in the adult newt. BrainResearch Developmental Brain Research, 154, 25–34.
Chizhikov, V. V., & Millen, K. J. (2005). Roof plate-dependent patterningof the vertebrate dorsal central nervous system. Developmental Biology,277, 287–295.
Cook, J. E. (1996). Spatial properties of retinal mosaics: An empiricalevaluation of some existing measures. Visual Neuroscience, 13, 15–30.
Eglen, S. J., van Ooyen, A., & Willshaw, D. J. (2000). Lateral cell movementdriven by dendritic interactions is suYcient to form retinal mosaics.Network Computation in Neural Systems, 11, 103–118.
Eglen, S. J., & Willshaw, D. J. (2002). InXuence of cell fate mechanismsupon retinal mosaic formation: A modelling study. Development, 129,5399–5408.
Fausett, B. V., & Goldman, D. (2006). A role for alpha1 tubulin-expressingMüller glia in regeneration of the injured zebraWsh retina. Journal ofNeuroscience, 26, 6303–6313.
Fischer, A. J., & Reh, T. A. (2001). Müller glia are a potential source ofneural regeneration in the postnatal chicken retina. Nature Neurosci-ence, 4, 247–252.
Fischer, A. J., & Reh, T. A. (2003). Potential of Müller glia to become neu-rogenic progenitor cells. Glia, 43, 70–76.
Garcia, M., & Vecino, E. (2003). Role of Müller glia in neuroprotectionand regeneration in the retina. Histology and Histopathology, 18,1205–1218.
Goldman, D., Hankin, M., Li, Z., Dai, X., & Ding, J. (2001). TransgeniczebraWsh for studying nervous system development and regeneration.Transgenic Research, 10, 21–33.
Greig-Smith, P. (1957). Quantitative plant ecology. London: Butterworths.Herlenius, E., & Lagercrantz, H. (2001). Neurotransmitters and neuro-
modulators during early human development. Early Human Develop-ment, 65, 21–37.
Hitchcock, P. F., Lindsey Myhr, K. J., Easter, S. S., Jr., Mangione-Smith,R., & Jones, D. D. (1992). Local regeneration in the retina of the gold-Wsh. Journal of Neurobiology, 23, 187–203.
Hitchcock, P. F., & VanDeRyt, J. T. (1994). Regeneration of the dopa-mine-cell mosaic in the retina of the goldWsh. Visual Neuroscience, 11,209–217.
Hyatt, G. A., Schmitt, E. A., Fadool, J. M., & Dowling, J. E. (1996). Reti-noic acid alters photoreceptor development in vivo. Proceedings of theNational Academy of Sciences USA, 93, 13298–13303.
Lankford, K. L., DeMello, F. G., & Klein, W. L. (1998). D1-type dopaminereceptors inhibit growth cone motility in cultured retina neurons: Evi-dence that neurotransmitters act as morphogenetic growth regulatorsin the developing central nervous system. Proceedings of the NationalAcademy of Sciences USA, 85, 2839–2843.
Lima, L., & Schmeer, C. (1994). Characterization of serotonin trans-porter in goldWsh retina by the binding of [3H]paroxetine and theuptake of [3H]serotonin: Modulation by light. Journal of Neurochem-istry, 62, 528–535.
Lima, L., Urbina, M., Matus, P., & Drujan, Y. (1996). Synthesis of seroto-nin from 5-hydroxytryptophan in the post-crush retina: Inhibition ofin vitro outgrowth by the intraocular administration of the precursor.Neurochemical Research, 21, 939–946.
Mader, M. M., & Cameron, D. A. (2004). Photoreceptor diVerentiationduring retinal development, growth, and regeneration in a metamor-phic vertebrate. Journal of Neuroscience, 24, 11463–11472.
Mensinger, A. F., & Powers, M. K. (1999). Visual function in regeneratingteleost retina following cytotoxic lesioning. Visual Neuroscience, 16,241–251.
Moiseiwitsch, J. R. (2000). The role of serotonin and neurotransmittersduring craniofacial development. Critical Reviews in Oral Biology andMedicine, 11, 230–239.
Naruoka, H., Kojima, R., Ohmasa, M., Layer, P. G., & Saito, T. (2003).Transient muscarinic calcium mobilisation in transdiVerentiating as inreaggregating embryonic chick retinae. Brain Research DevelopmentalBrain Research, 143, 233–244.
Negishi, K., Teranishi, T., & Kato, S. (1982). New dopaminergic andindoleamine-accumulating cells in the growth zone of goldWsh retinasafter neurotoxic destruction. Science, 216, 747–749.
Negishi, K., Teranishi, T., & Kato, S. (1985). Growth rate of a peripheralannulus deWned by neurotoxic destruction in the goldWsh retina. BrainResearch, 352, 291–295.

M.J. Tyler, D.A. Cameron / Vision Research 47 (2007) 501–511 511
Neumann, C. J., & Nuesslein-Volhard, C. (2000). Patterning of the zebraWshretina by a wave of sonic hedgehog activity. Science, 289, 2137–2139.
Ohmasa, M., & Saito, T. (2004). GABAA-receptor-mediated increase inintracellular Ca2+ concentration in the regenerating retina of adultnewt. Neuroscience Research, 49, 219–227.
Otteson, D. C., & Hitchcock, P. F. (2003). Stem cells in the teleost retina:Persistent neurogenesis and injury-induced regeneration. VisionResearch, 43, 927–936.
Raven, M. A., Eglen, S. J., Ohab, J. J., & Reese, B. E. (2003). Determinantsof the exclusion zone in dopaminergic amacrine cell mosaics. Journal ofComparative Neurology, 461, 123–136.
Raymond, P. A., & Hitchcock, P. F. (2000). How the neural retina regener-ates. Results and Problems in Cell DiVerentiation, 31, 197–218.
Reh, T. A., & Levine, E. M. (1998). Multipotential stem cells and progeni-tors in the vertebrate retina. Journal of Neurobiology, 36, 206–220.
Reh, T. A., & Tully, T. (1986). Regulation of tyrosine hydroxylase-contain-ing amacrine cell number in larval frog retina. Developmental Biology,114, 463–469.
Rodieck, R. W. (1991). The density recovery proWle: a method for the anal-ysis of points in the plane applicable to retinal studies. Visual Neurosci-ence, 6, 95–111.
Rodrigues, S., & Dowling, J. E. (1990). Dopamine induces neurite retrac-tion in retinal horizontal cells via diacylglycerol and protein kinase C.Proceedings of the National Academy of Sciences USA, 87, 9693–9697.
Saito, T., Kaneko, Y., Maruo, F., Niino, M., & Sakaki, Y. (1994). Study ofthe regenerating newt retina by electrophysiology and immunohisto-chemistry (bipolar- and cone-speciWc antigen localization). Journal ofExperimental Zoology, 270, 491–500.
Spana, E. P., & Doe, C. Q. (1996). Numb antagonizes Notch signaling tospecify sibling neuron cell fate. Neuron, 17, 21–26.
Stenkamp, D. L., & Cameron, D. A. (2002). Cellular pattern formation in theretina: Retinal regeneration as a model system. Molecular Vision, 8, 280–293.
Stenkamp, D. L., Powers, M. K., Carney, L. H., & Cameron, D. A. (2001).Evidence for two distinct mechanisms of neurogenesis and cellular pat-tern formation in regenerated goldWsh retinas. Journal of ComparativeNeurology, 431, 363–381.
Strutt, H., & Strutt, D. (2003). EGF signaling and ommatidial rotation inthe Drosophila eye. Current Biology, 13, 1451–1457.
Tohya, S., Mochizuki, A., & Iwasa, Y. (1999). Formation of cone mosaic ofzebraWsh retina. Journal of Theoretical Biology, 200, 231–244.
Tohya, S., Mochizuki, A., & Iwasa, Y. (2003). DiVerence in the retinal conemosaic pattern between zebraWsh and medaka: Cell-rearrangementmodel. Journal of Theoretical Biology, 221, 289–300.
Tyler, M., Carney, L. H., & Cameron, D. A. (2005). Control of cellular pat-tern formation in the vertebrate retina by homotypic regulation of cellfate decisions. Journal of Neuroscience, 25, 4565–4576.
Umino, Y., & Saito, T. (2002). Spatial and temporal patterns of distri-bution of the gap junctional protein connexin43 during retinalregeneration of adult newt. Journal of Comparative Neurology, 454,255–262.
Waid, D. K., & McLoon, S. C. (1998). Ganglion cells inXuence the fate ofdividing retinal cells in culture. Development, 125, 1059–1066.
Watling, K. J., Parkinson, D., & Dowling, J. E. (1982). EVects of intraocu-lar injections of 6-hydroxydopamine on dopamine-dependent cyclicAMP accumulation in intact pieces of carp retina. Brain Research, 253,334–336.
Wilson, L., & Maden, M. (2005). The mechanisms of dorsoventralpatterning in the vertebrate neural tube. Developmental Biology,282, 1–13.
Wu, D. M., Schneiderman, T., Burgett, J., Gokhale, P., Barthel, L., & Ray-mond, P. A. (2001). Cones regenerate from retinal stem cells seques-tered in the inner nuclear layer of adult goldWsh retina. InvestigativeOphthalmology and Visual Science, 42, 2115–2124.
Yazulla, S., & Studholme, K. M. (1997). DiVerential reinnervation of reti-nal bipolar cell dendrites and axon terminals by dopamine interplexi-form cells following dopamine depletion with 6-OHDA. Journal ofComparative Neurology, 382, 535–545.
Yurco, P., & Cameron, D. A. (2005). Responses of Müller glia to retinalinjury in adult zebraWsh. Vision Research, 45, 991–1002.
Zachor, D. A., Moore, J. F., Brezausek, C., Theibert, A., & Percy, A. K.(2000). Cocaine inhibits NGF-induced PC12 cells diVerentiationthrough D1-type dopamine receptors. Brain Research, 869, 85–97.