Embed Size (px)
Citation preview
Investor presentation
Results of the first half 2021

CONTENTS
CEMBRE | Investor relations 2
CEMBRE at a glance
Group management team
Main product lines & applications
Results of the first half 2021
First half 2021 guidance
Stock data & shareholding structure
Contact

CEMBRE AT A GLANCE
CEMBRE is Europe’s leading manufacturer of electrical crimp typeconnectors and related installation tools.
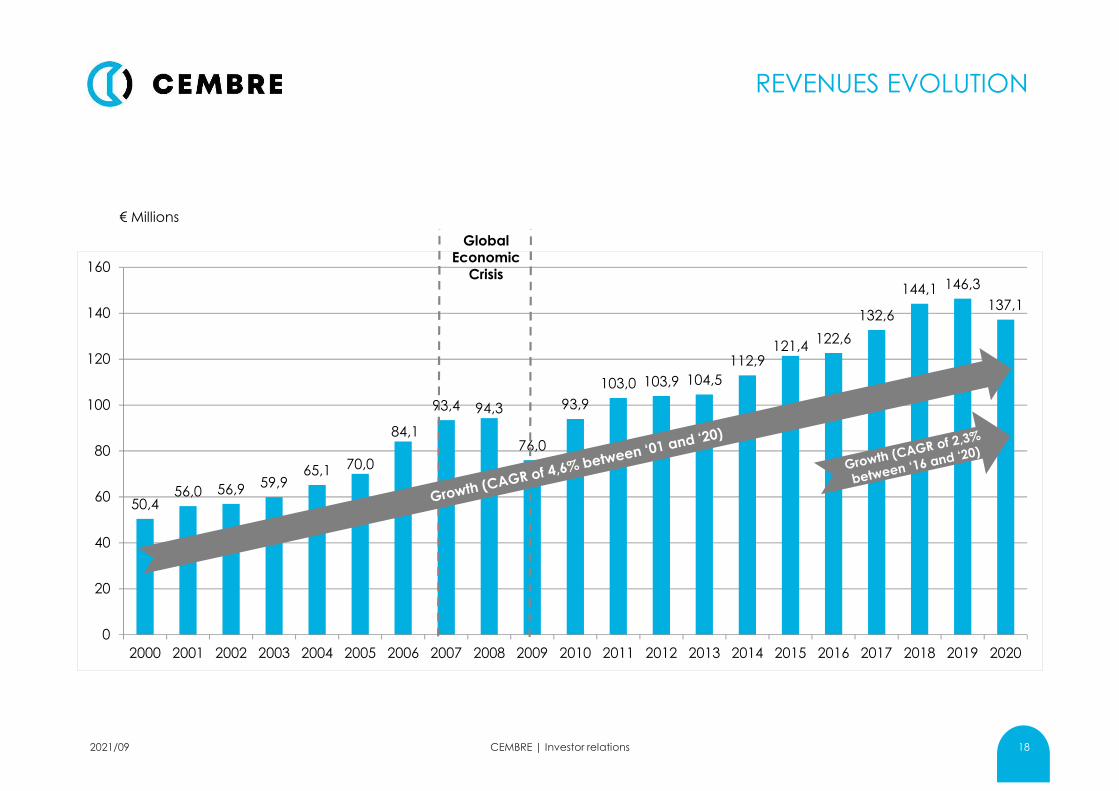
The Group has grown its revenues by a CAGR of 4.8% in the last 20 years
(2001-2020), from 56 M€ in 2001 to 137.1 M€ in 2020. In the last 5 years theGroup has grown by a CAGR of 2.8% (2016-2020).
It is a dividend payer with a 20 years average dividend payout ratio of
45.2%, and an average dividend yield of 3.7% (2000-2020). The averagedividend yield in the last 5 years has been of 4.3% (2016-2020).
In 2020, the Group invested 8.0 M€; the total amount of investmentsmade by the company in the last five years (2016-2020) is 58.6 M€; at
December 31, 2019 investments amounted to 11.7 M€.
The product mix (a total of more than 18K end products sold during 2020)is offered to around 7K single clients around the world, with 10-biggest
clients’ purchases corresponding to c.18% of the consolidated turnover.
CEMBRE | Investor relations 32021/09
MISSION
CEMBRE cooperates with the users of its productsto search the best technical and economical
solutions related to electrical connection applications
2021/02 CEMBRE | Investor relations 4
GROUP MANAGEMENT TEAM
Giovanni RosaniChief Executive Officer (CEO)
Aldo Bottini BongraniMember of the boardM&A and Special Projects
Claudio BornatiChief Financial Officer (CFO)
Felice AlbertazziMember of the boardChief Sales & Marketing Officer (CSMO)
Franco CelliMember of the boardChief Operating Officer (COO)
5CEMBRE | Investor relations2021/09
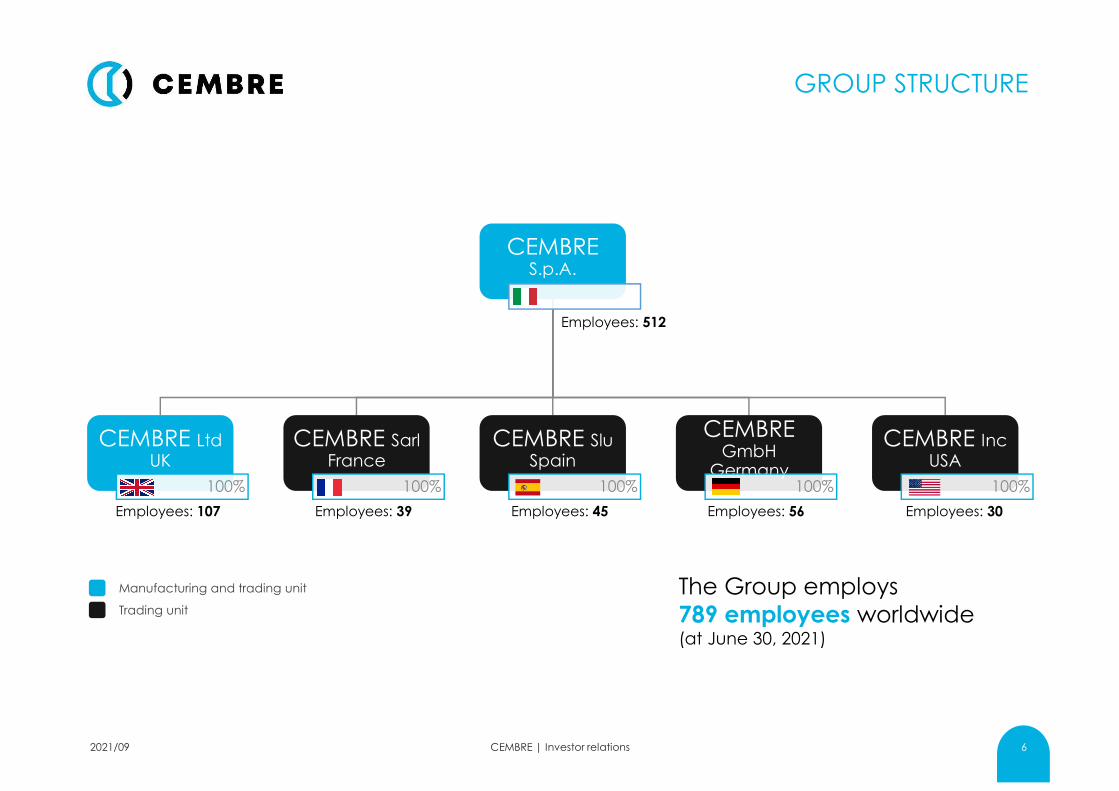
GROUP STRUCTURE
CEMBRE S.p.A.
CEMBRE LtdUK
100%
CEMBRE SarlFrance
100%
CEMBRE SluSpain
100%
CEMBRE GmbH
Germany100%
CEMBRE IncUSA
100%
CEMBRE | Investor relations 6
Manufacturing and trading unit
Trading unit
Employees: 39Employees: 107 Employees: 45 Employees: 56 Employees: 30
The Group employs
789 employees worldwide (at June 30, 2021)
Employees: 481
2021/09
Employees: 512
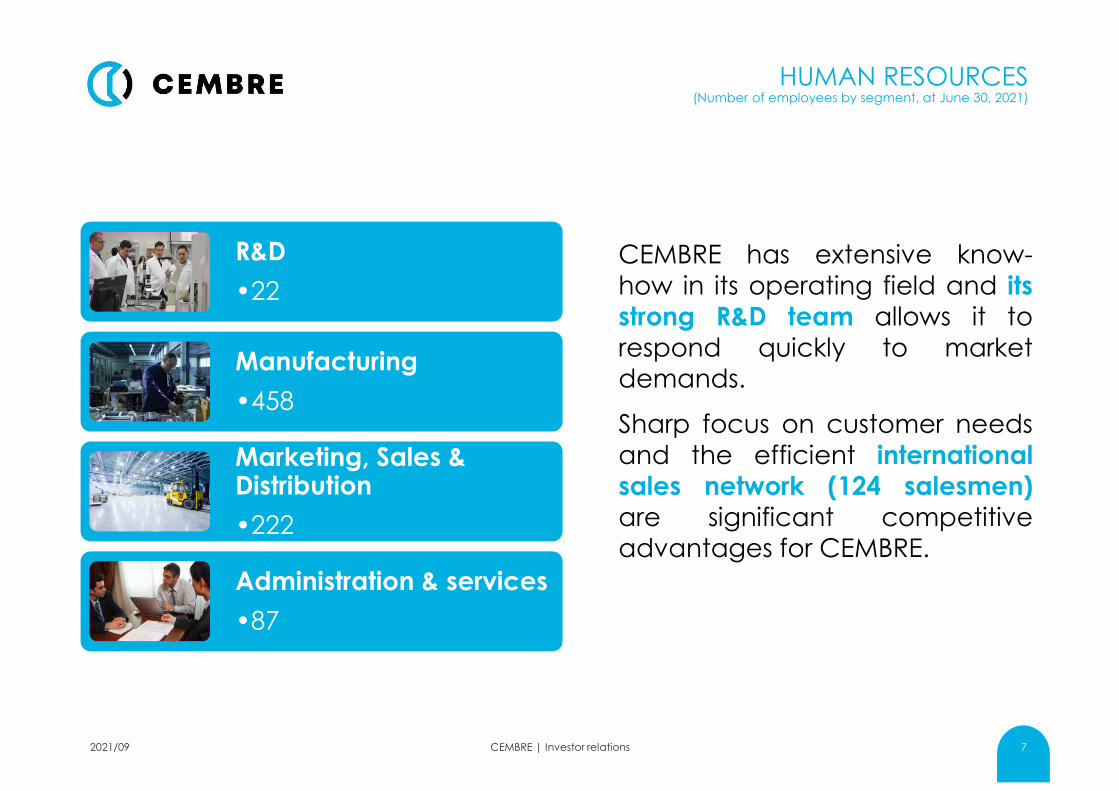
CEMBRE has extensive know-
how in its operating field and its
strong R&D team allows it to
respond quickly to marketdemands.
Sharp focus on customer needs
and the efficient international
sales network (124 salesmen)
are significant competitiveadvantages for CEMBRE.
HUMAN RESOURCES(Number of employees by segment, at June 30, 2021)
R&D
•22
Manufacturing
•458
Marketing, Sales & Distribution
•222
Administration & services
•87
CEMBRE | Investor relations 72021/09
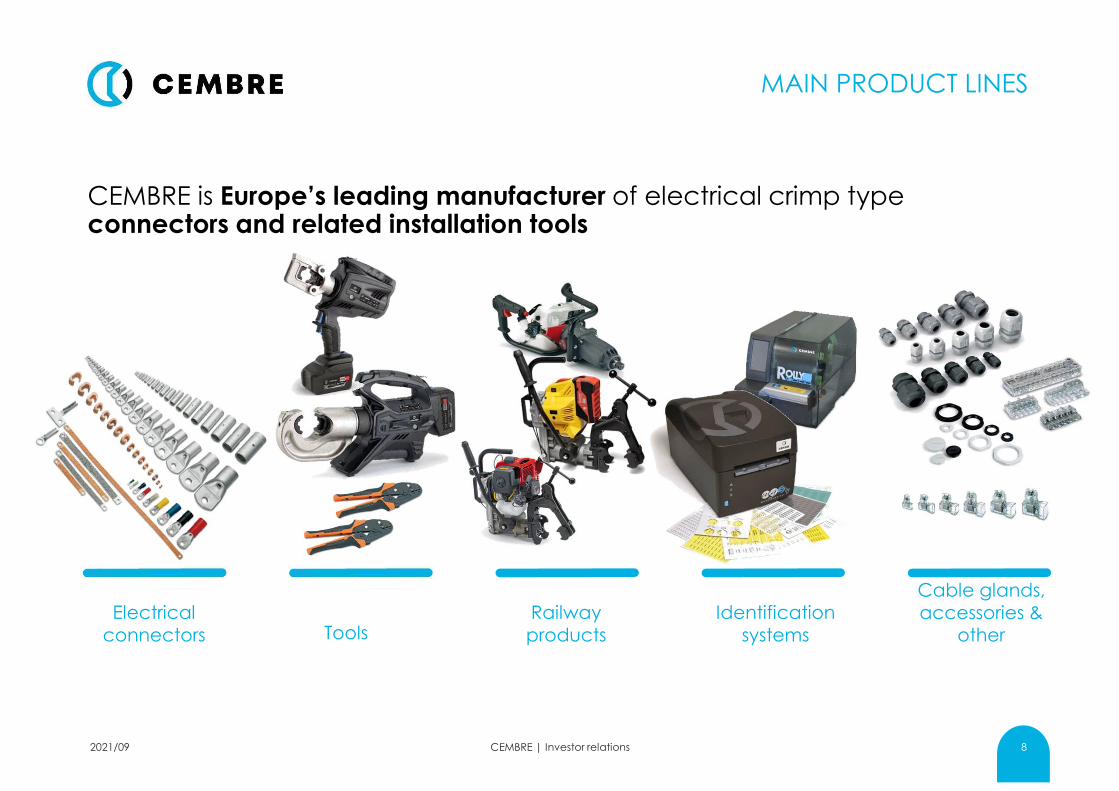
MAIN PRODUCT LINES
CEMBRE is Europe’s leading manufacturer of electrical crimp type connectors and related installation tools
CEMBRE | Investor relations 8
Railway
products
Identification
systems
Cable glands,
accessories & other
Electrical
connectors Tools
2021/09
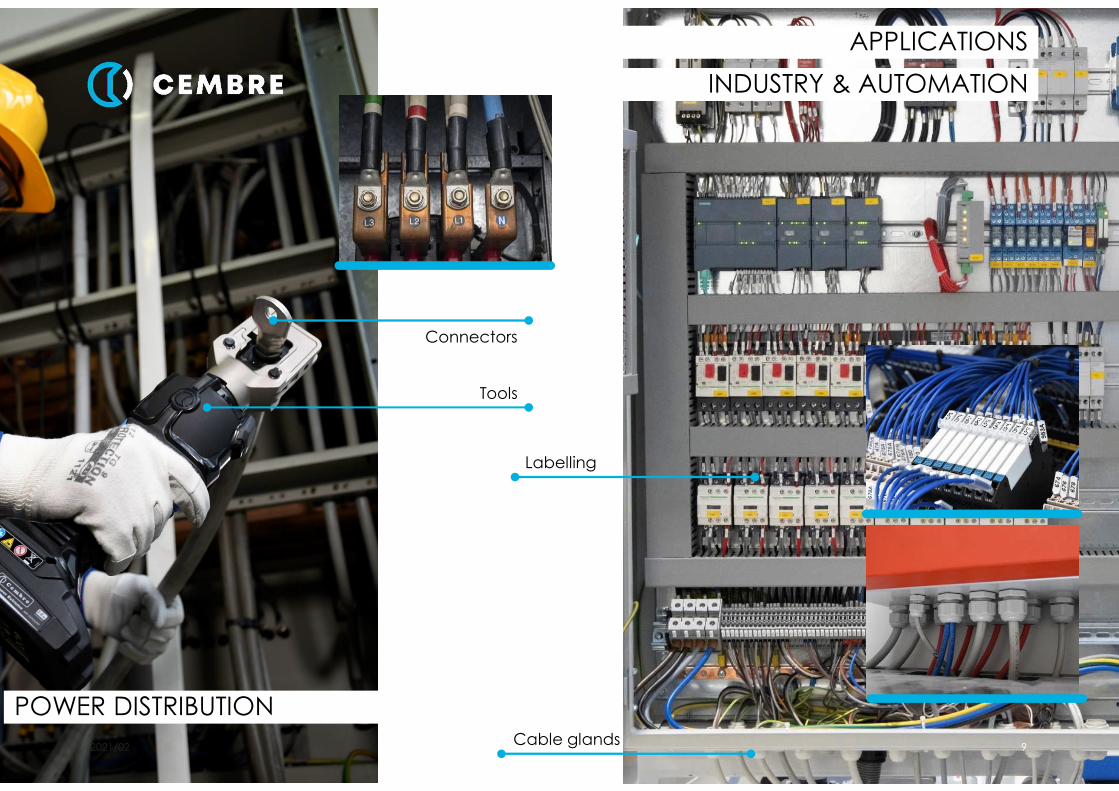
Cable glands
Connectors
Tools
Labelling
INDUSTRY & AUTOMATION
2021/02 9
POWER DISTRIBUTION
APPLICATIONS
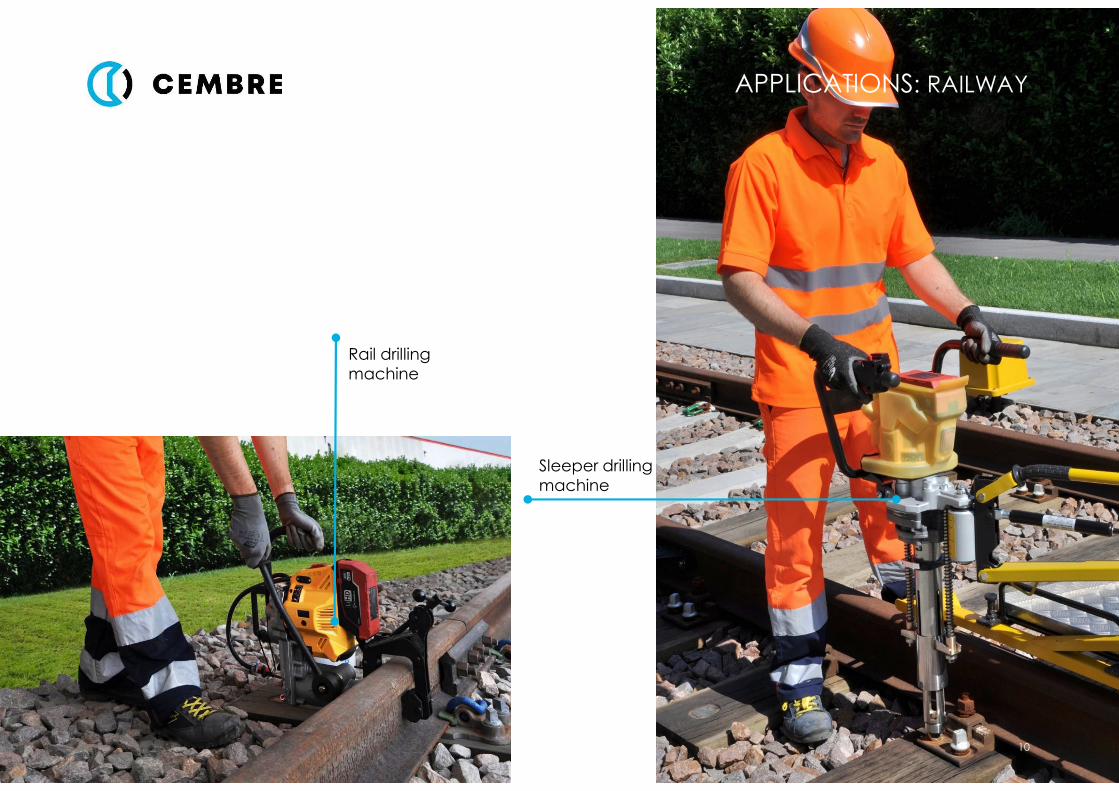
Rail drilling
machine
Sleeper drilling
machine
APPLICATIONS: RAILWAY
10
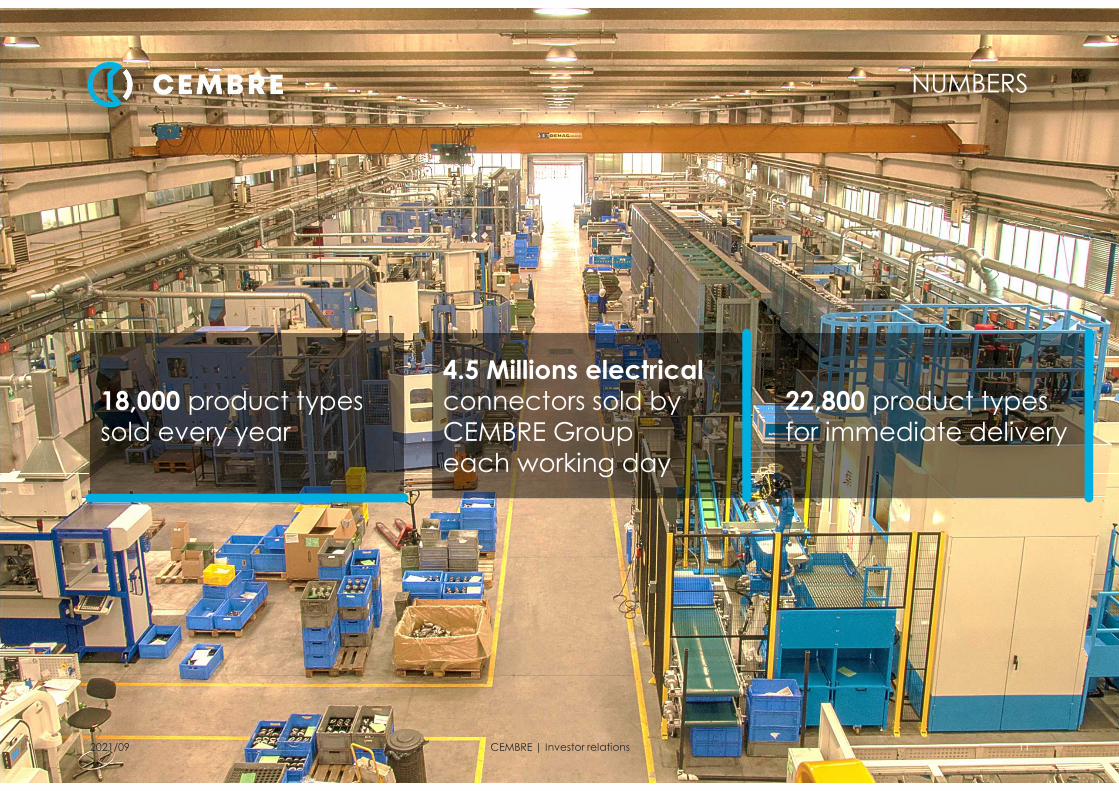
NUMBERS
CEMBRE | Investor relations 11
18,000 product types sold every year
22,800 product types for immediate delivery
4.5 Millions electrical
connectors sold by CEMBRE Group
each working day
2021/09
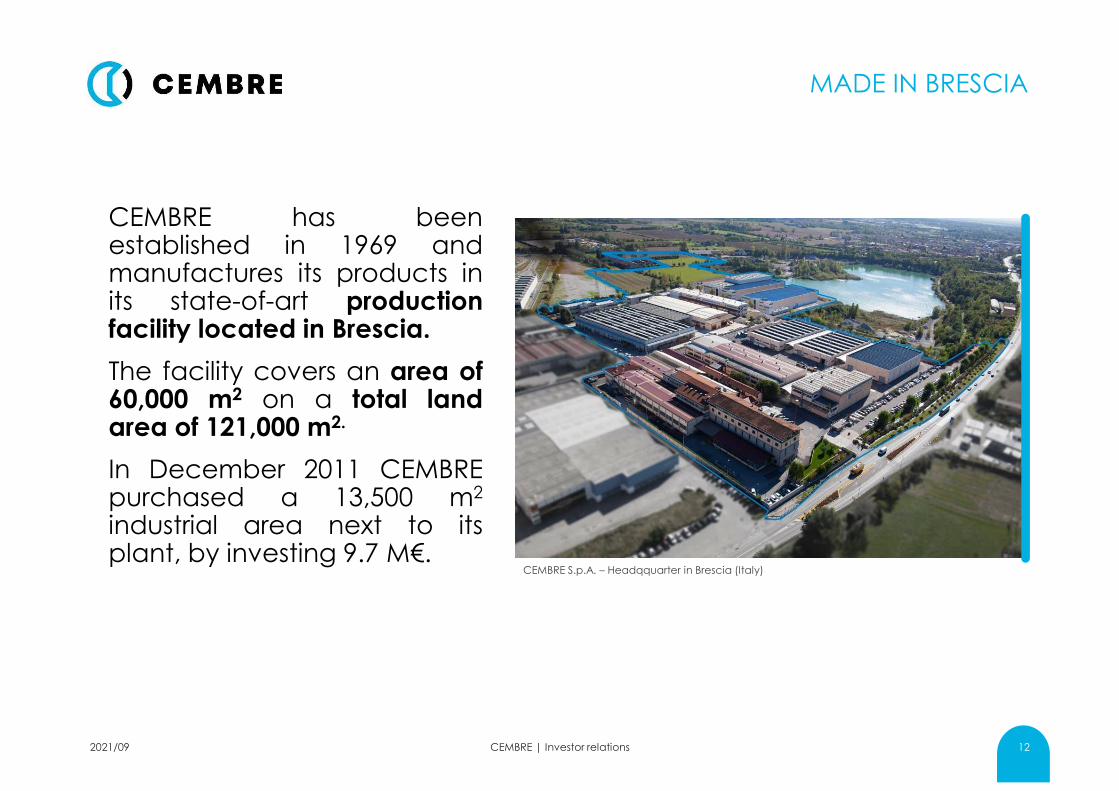
MADE IN BRESCIA
CEMBRE has beenestablished in 1969 andmanufactures its products inits state-of-art productionfacility located in Brescia.
The facility covers an area of60,000 m2 on a total landarea of 121,000 m2.
In December 2011 CEMBREpurchased a 13,500 m2
industrial area next to itsplant, by investing 9.7 M€.
CEMBRE | Investor relations 12
CEMBRE S.p.A. – Headqquarter in Brescia (Italy)
2021/09
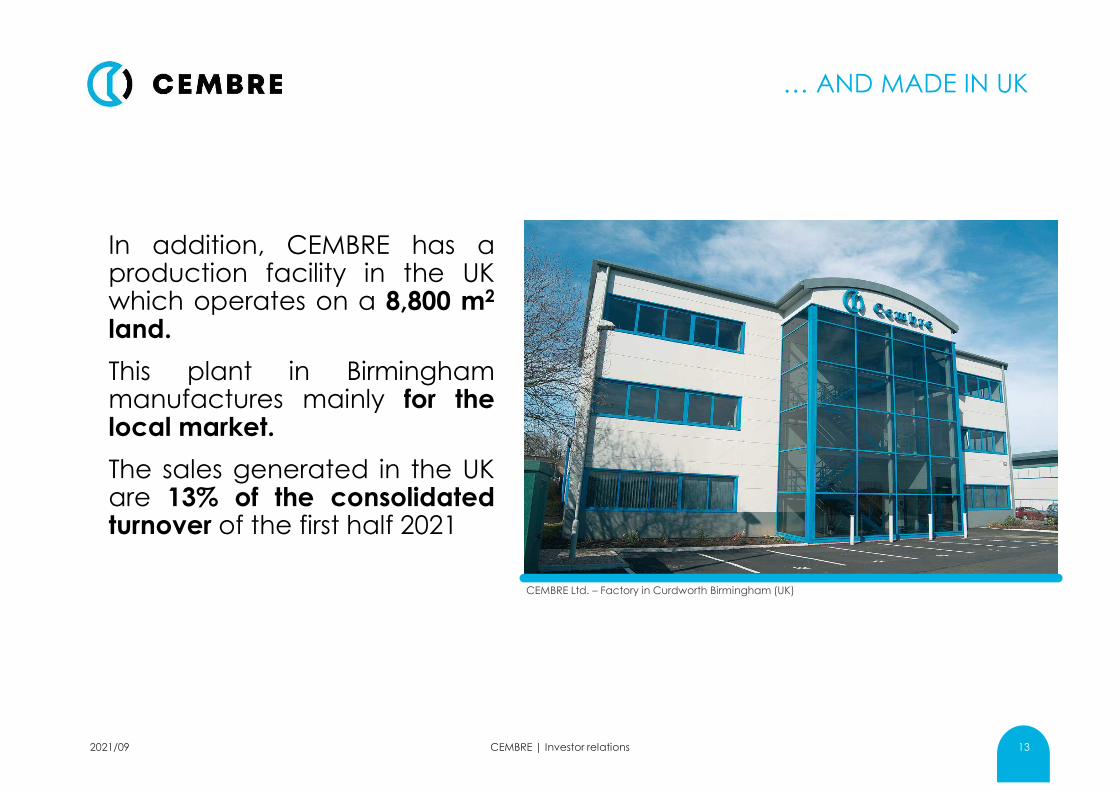
… AND MADE IN UK
In addition, CEMBRE has aproduction facility in the UKwhich operates on a 8,800 m2
land.
This plant in Birminghammanufactures mainly for thelocal market.
The sales generated in the UKare 13% of the consolidatedturnover of the first half 2021
CEMBRE | Investor relations 13
CEMBRE Ltd. – Factory in Curdworth Birmingham (UK)
2021/09
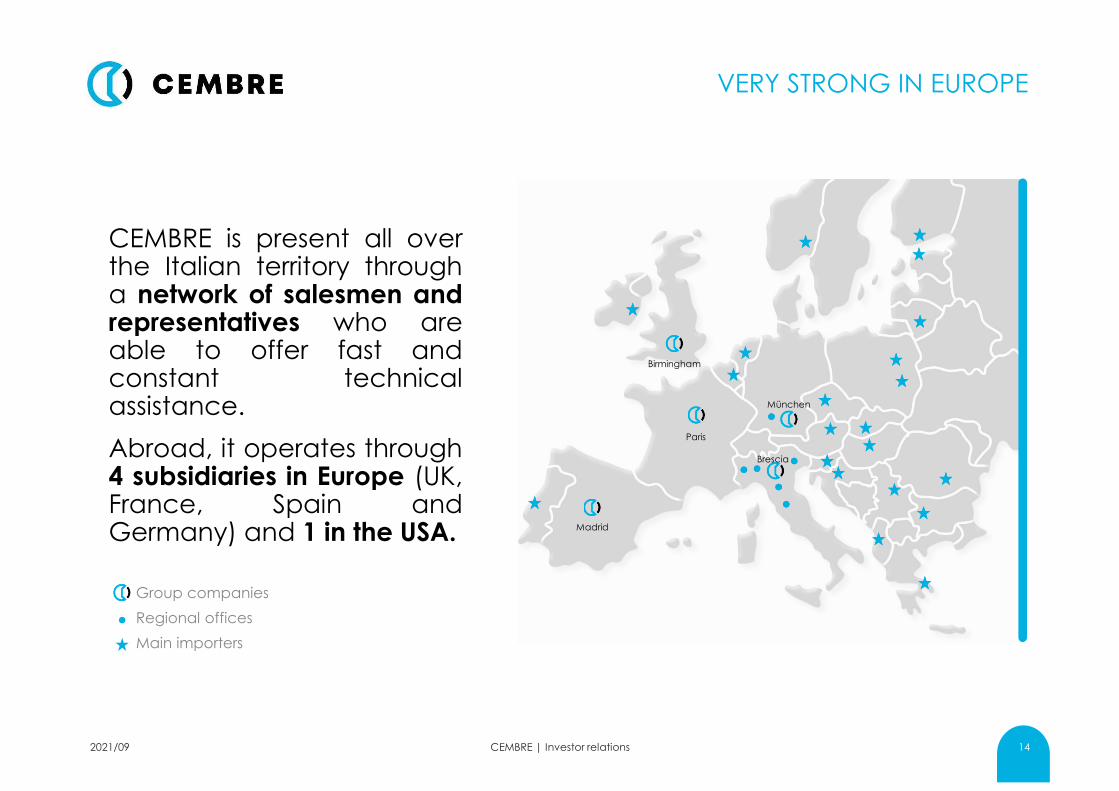
VERY STRONG IN EUROPE
CEMBRE is present all overthe Italian territory througha network of salesmen andrepresentatives who areable to offer fast andconstant technicalassistance.
Abroad, it operates through4 subsidiaries in Europe (UK,France, Spain andGermany) and 1 in the USA.
CEMBRE | Investor relations 14
Group companies
Regional offices
Main importers
Brescia
Madrid
München
Paris
Birmingham
2021/09
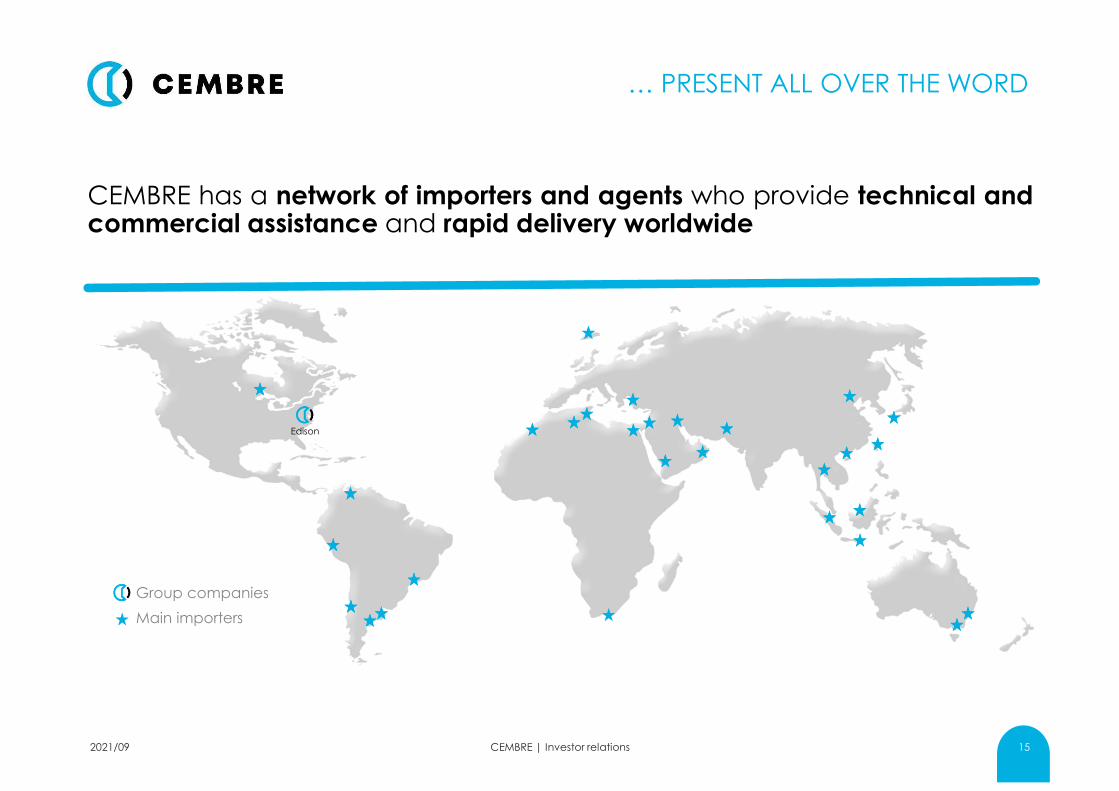
… PRESENT ALL OVER THE WORD
CEMBRE has a network of importers and agents who provide technical andcommercial assistance and rapid delivery worldwide
CEMBRE | Investor relations 15
Edison
Group companies
Main importers
2021/09
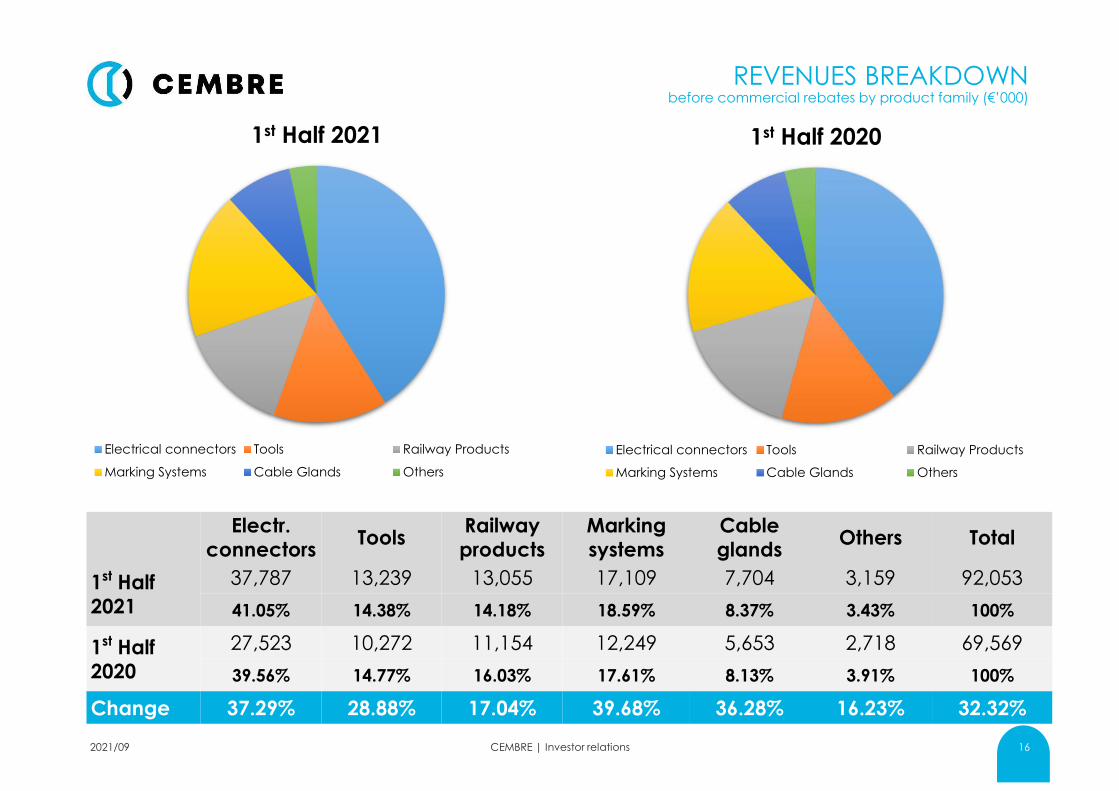
REVENUES BREAKDOWN before commercial rebates by product family (€’000)
CEMBRE | Investor relations 16
Electr.
connectorsTools
Railway
products
Marking
systems
Cable
glandsOthers Total
1st Half
2021
37,787 13,239 13,055 17,109 7,704 3,159 92,053
41.05% 14.38% 14.18% 18.59% 8.37% 3.43% 100%
1st Half
2020
27,523 10,272 11,154 12,249 5,653 2,718 69,569
39.56% 14.77% 16.03% 17.61% 8.13% 3.91% 100%
Change 37.29% 28.88% 17.04% 39.68% 36.28% 16.23% 32.32%
1st Half 2021
Electrical connectors Tools Railway Products
Marking Systems Cable Glands Others
1st Half 2020
Electrical connectors Tools Railway Products
Marking Systems Cable Glands Others
2021/09

GEOGRAPHICAL REVENUES BREAKDOWN
CEMBRE | Investor relations 17
Italy 1st Half 2021 1st Half 2020 ∆
Sales 36.4 M 25.4M 43.2%
% on total 43.0% 39.3%
Rest of the World 1st Half 2021 1st Half 2020 ∆
Sales 8.6 M 8.9 M -3.1%
% on total 10.2% 13.7%
Europe (Italy excluded)
1st Half 2021 1st Half 2020 ∆
Sales 39.6 M 30.4 M 30.2%
% on total 46.8% 47.0%
2021/09
50,456,0 56,9 59,9
65,1 70,0
84,1
93,4 94,3
76,0
93,9
103,0 103,9 104,5
112,9121,4
122,6
132,6
144,1 146,3
137,1
0
20
40
60
80
100
120
140
160
2000 2001 2002 2003 2004 2005 2006 2007 2008 2009 2010 2011 2012 2013 2014 2015 2016 2017 2018 2019 2020
REVENUES EVOLUTION
CEMBRE | Investor relations 18
Global Economic
Crisis
€ Millions
2021/09

CONSOLIDATED RESULTS OF THE FIRST HALF 2021
CEMBRE | Investor relations 19
€ Millions1st Half
2021
1st Half
2020
Change %
2021-2020
1st Half
2019
Change %
2021-2019
Sales 84.5 64.7 30.8% 76.9 10.0%
EBITDA% of sales
25.229.8%
15.624.1%
61.9% 20.927.2%
20.6%
EBIT% of sales
19.623.2%
10.215.8%
92.1% 16.221.0%
21.2%
EBT% of sales
19.723.3%
10.215.8%
92.9% 16.020.9%
22.7%
Net profit% of sales
14.717.3%
7.611.8%
92.8% 12.416.1%
18.4%
Tax rate % 25.5% 25.5% 22.8%
2021/09

«PATENT BOX» FISCAL BENEFIT
The parent company CEMBRE S.p.A. in December 2017 signed, with thesupport of Business Tax and Consulting firm Deloitte, an agreement with theItalian Revenue Office defining the calculation methods and criteria for theeconomic contribution to business revenue of intangible assets in thecontext of the «Patent Box» scheme, for tax years 2015-2019. The renewal ofthe agreement for tax years 2020-2024 is under evaluation, but, at the timeof present document, the closing date and the result of this process is notforeseeable.
CEMBRE | Investor relations 20
€ Millions 2019 2018 2017
Fiscal benefit 1.7 1.8 1.7
Fiscal benefit for years 2015-2016 - - 2.3
Tax rate % 19.5% 19.8% 14.5%
Normalised tax rate % 26.0% 26.2% 29.2%
2021/09

GROUP’S COMPANIES TURNOVER* OF THE FIRST HALF 2021
CEMBRE | Investor relations 21
Company(Euro thousands)
1st Half
2021
1st Half
2020
Changes
%
1st Half
2019
CEMBRE S.p.A. (Italy) 46,948 33,279 41.1% 40,361
CEMBRE Ltd. (UK) 10,983 7,642 43.7% 10,401
CEMBRE S.a.r.l. (France) 5,956 4,309 38.2% 5,633
CEMBRE España S.L.U. (Spain) 6,548 5,495 19.2% 6,045
CEMBRE GmbH (Germany)** 9,335 7,956 17.3% 7,689
CEMBRE Inc. (USA) 4,777 5,975 -20.1% 6,749
CEMBRE Group 84,547 64,656 30.8% 76,878
* net of intragroup sales
** 2019 datum includes IKUMA turnover
2021/09
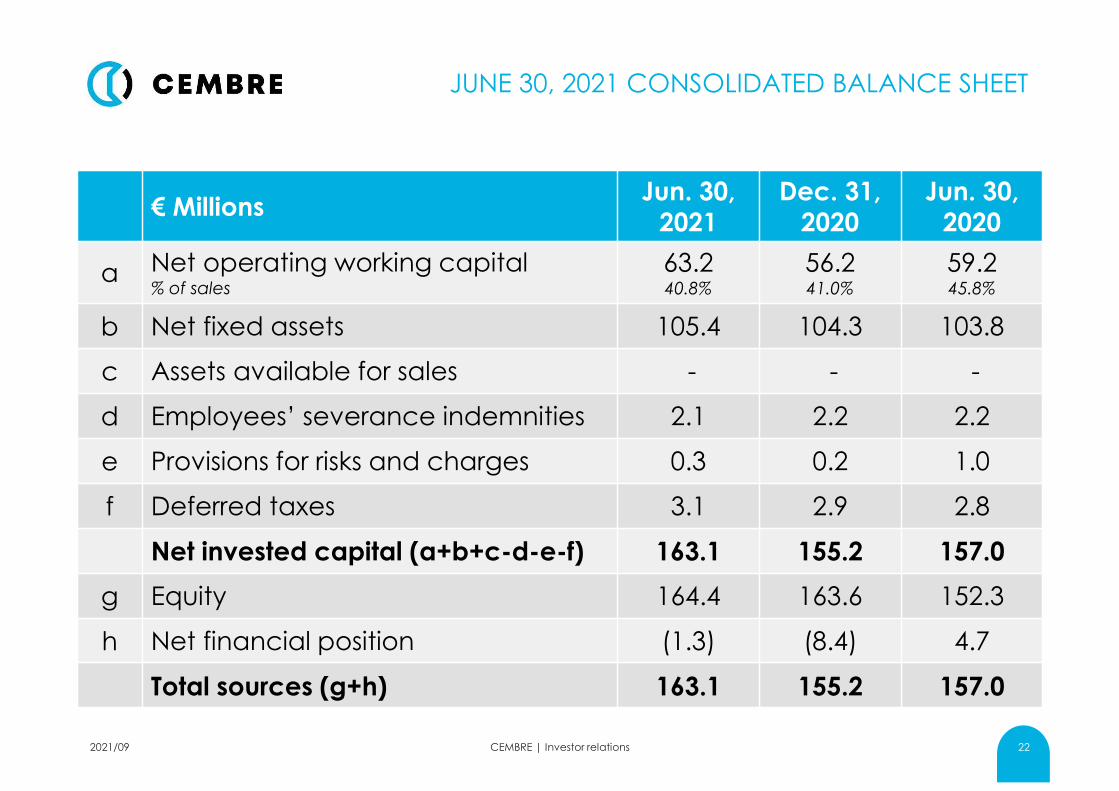
€ MillionsJun. 30,
2021
Dec. 31,
2020
Jun. 30,
2020
a Net operating working capital% of sales
63.240.8%
56.241.0%
59.245.8%
b Net fixed assets 105.4 104.3 103.8
c Assets available for sales - - -
d Employees’ severance indemnities 2.1 2.2 2.2
e Provisions for risks and charges 0.3 0.2 1.0
f Deferred taxes 3.1 2.9 2.8
Net invested capital (a+b+c-d-e-f) 163.1 155.2 157.0
g Equity 164.4 163.6 152.3
h Net financial position (1.3) (8.4) 4.7
Total sources (g+h) 163.1 155.2 157.0
JUNE 30, 2021 CONSOLIDATED BALANCE SHEET
CEMBRE | Investor relations 222021/09
CEMBRE | Investor relations 23
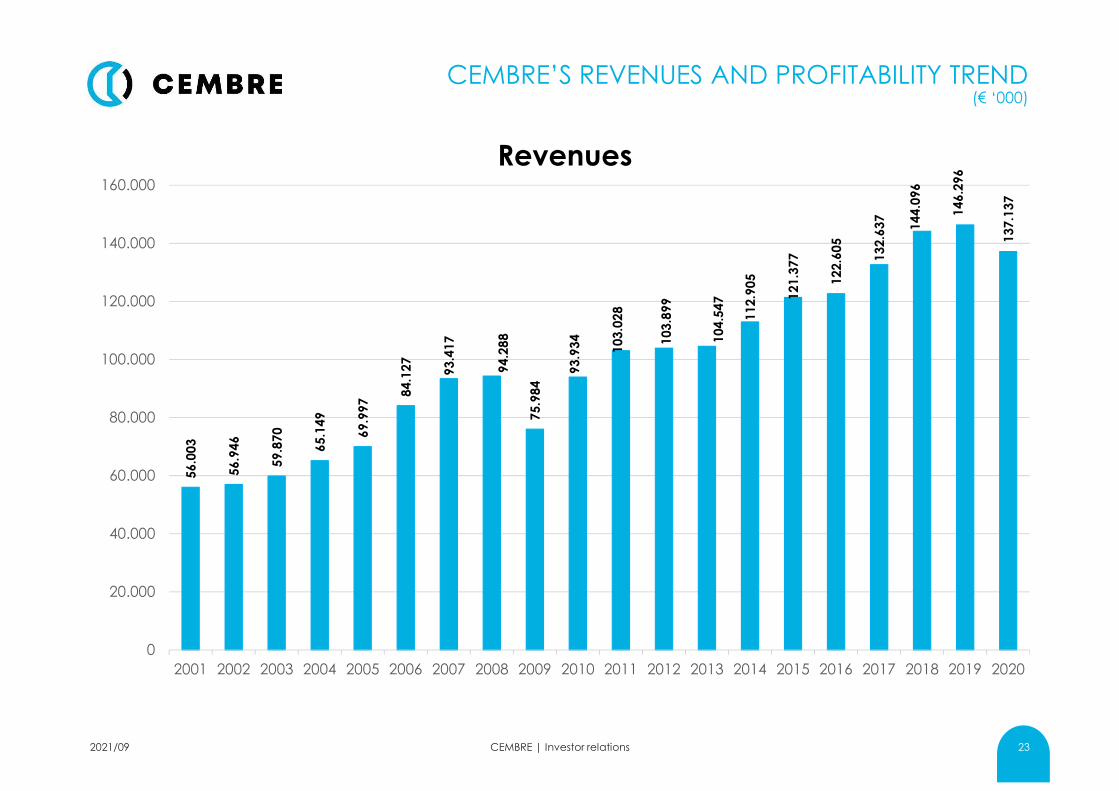
CEMBRE’S REVENUES AND PROFITABILITY TREND (€ ‘000)
56.0
03
56.9
46
59.8
70
65.1
49
69.9
97
84.1
27
93.4
17
94.2
88
75.9
84
93.9
34
103.0
28
103.8
99
104.5
47
112.9
05
121.3
77
122.6
05
132.6
37
144.0
96
146.2
96
137.1
37
0
20.000
40.000
60.000
80.000
100.000
120.000
140.000
160.000
2001 2002 2003 2004 2005 2006 2007 2008 2009 2010 2011 2012 2013 2014 2015 2016 2017 2018 2019 2020
Revenues
2021/09
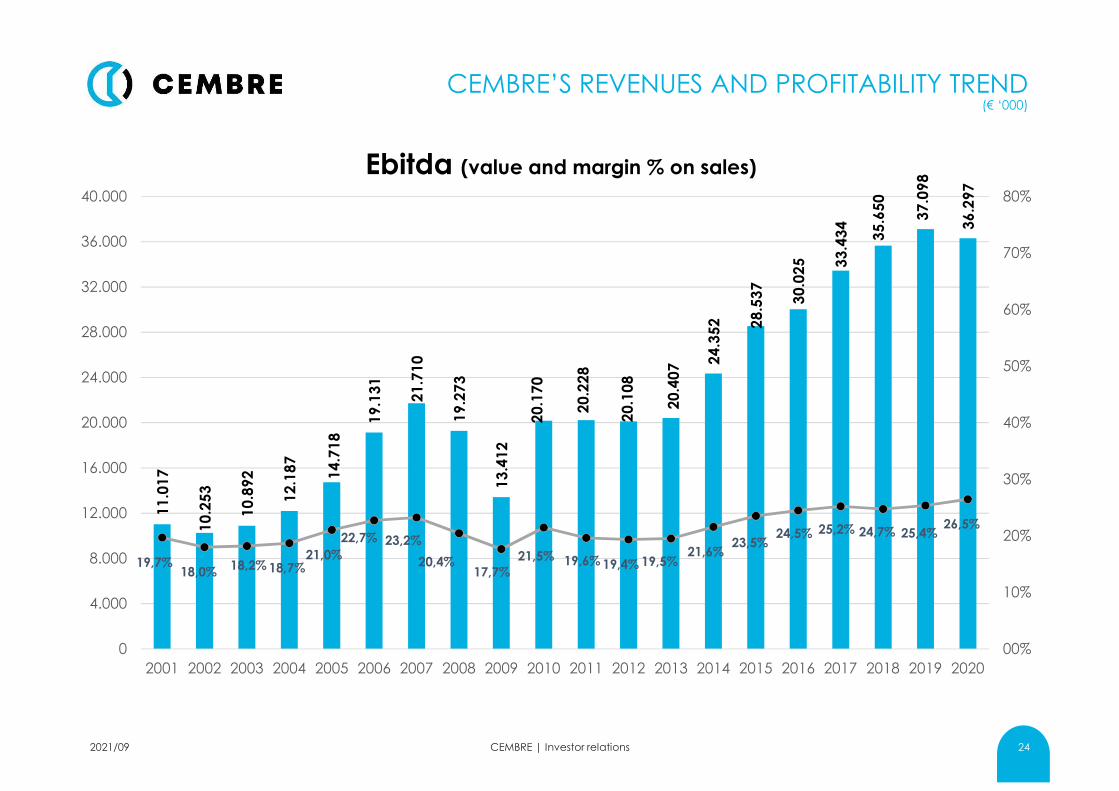
CEMBRE’S REVENUES AND PROFITABILITY TREND (€ ‘000)
CEMBRE | Investor relations 24
11
.01
7
10
.25
3
10
.89
2
12
.18
7
14
.71
8
19
.13
1
21
.71
0
19
.27
3
13
.41
2
20
.17
0
20
.22
8
20
.10
8
20
.40
7 24
.35
2 28
.53
7
30
.02
5 33
.43
4
35
.65
0
37
.09
8
36
.29
7
19,7%18,0%
18,2% 18,7%21,0%
22,7% 23,2%
20,4%17,7%
21,5% 19,6% 19,4% 19,5%21,6%
23,5%24,5% 25,2% 24,7% 25,4%
26,5%
00%
10%
20%
30%
40%
50%
60%
70%
80%
0
4.000
8.000
12.000
16.000
20.000
24.000
28.000
32.000
36.000
40.000
2001 2002 2003 2004 2005 2006 2007 2008 2009 2010 2011 2012 2013 2014 2015 2016 2017 2018 2019 2020
Ebitda (value and margin % on sales)
2021/09
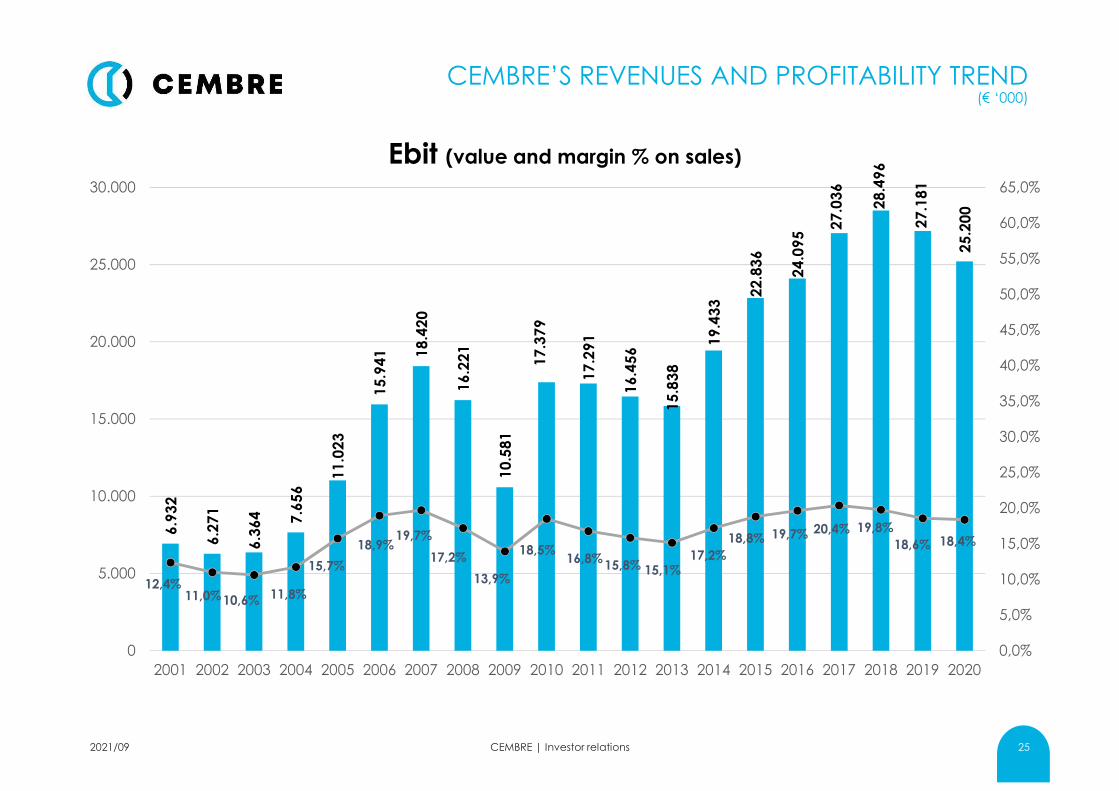
CEMBRE’S REVENUES AND PROFITABILITY TREND (€ ‘000)
CEMBRE | Investor relations 25
6.9
32
6.2
71
6.3
64 7.6
56
11
.02
3
15
.94
1 18
.42
0
16
.22
1
10
.58
1
17
.37
9
17
.29
1
16
.45
6
15
.83
8
19
.43
3
22
.83
6
24
.09
5
27
.03
6
28
.49
6
27
.18
1
25
.20
0
12,4%11,0% 10,6% 11,8%
15,7%
18,9%19,7%
17,2%
13,9%
18,5%16,8%
15,8% 15,1%17,2%
18,8% 19,7% 20,4% 19,8%
18,6% 18,4%
0,0%
5,0%
10,0%
15,0%
20,0%
25,0%
30,0%
35,0%
40,0%
45,0%
50,0%
55,0%
60,0%
65,0%
0
5.000
10.000
15.000
20.000
25.000
30.000
2001 2002 2003 2004 2005 2006 2007 2008 2009 2010 2011 2012 2013 2014 2015 2016 2017 2018 2019 2020
Ebit (value and margin % on sales)
2021/09

CEMBRE’S REVENUES AND PROFITABILITY TREND(€ ‘000)
CEMBRE | Investor relations 26
3.806
3.213
2.988
3.830
6.605
9.327
11.896
10.857
6.887
11.340
11.400
11.507
10.503
13.542
15.933
16.927
22.727
22.736
21.690
18.975
6,8%5,6%
5,0% 5,9%
9,4%
11,1%12,7%
11,5%
9,1%
12,1%11,1% 11,1% 10,0%
12,0%13,1%
13,8%
17,1% 15,8%14,8% 13,8%
0,0%
5,0%
10,0%
15,0%
20,0%
25,0%
30,0%
35,0%
40,0%
45,0%
0
5.000
10.000
15.000
20.000
25.000
2001 2002 2003 2004 2005 2006 2007 2008 2009 2010 2011 2012 2013 2014 2015 2016 2017 2018 2019 2020
Net profit (value and margin % on sales)
2021/09

INDEX ANALYSIS
CEMBRE | Investor relations 27
ROI (EBIT/Investments) ROACE (EBIT/Average Net Capital Employed)
ROE (Net profit/Equity) ROS (EBIT/Net Sales)
10,69%
8,69% 9,01%9,80%
14,18%
17,80%
18,85%
16,60%
10,79%
15,56%
13,90%
12,40%11,64%
13,26%
14,66%14,72%
15,85%
14,62%
13,37%
11,41%
0,00%
4,00%
8,00%
12,00%
16,00%
20,00%
9,89%
8,08%7,28%
8,13%
12,54%
15,69%
17,83%
15,19%
9,06%
13,23%
12,24%11,28%
9,59%
11,29%
12,15%
12,30%
15,88%
14,87%
13,52%
11,60%
0,00%
4,00%
8,00%
12,00%
16,00%
20,00%
14,84%
13,61% 12,87%
15,59%
22,24%
29,45% 29,05%
23,39%
15,01%
24,34%
21,23%
17,12%
15,45%
18,35%
20,61%
21,49%
23,13%
21,25%
18,11%
16,26%
0,00%
5,00%
10,00%
15,00%
20,00%
25,00%
30,00%
35,00%
12,38%
11,01% 10,63%
11,75%
15,75%
18,95%
19,72%
17,20%
13,93%
18,50%
16,78%15,84%
15,15%
17,21%
18,81%
19,65%20,38%
19,78%18,58%
18,38%
0,00%
5,00%
10,00%
15,00%
20,00%
25,00%
2021/09
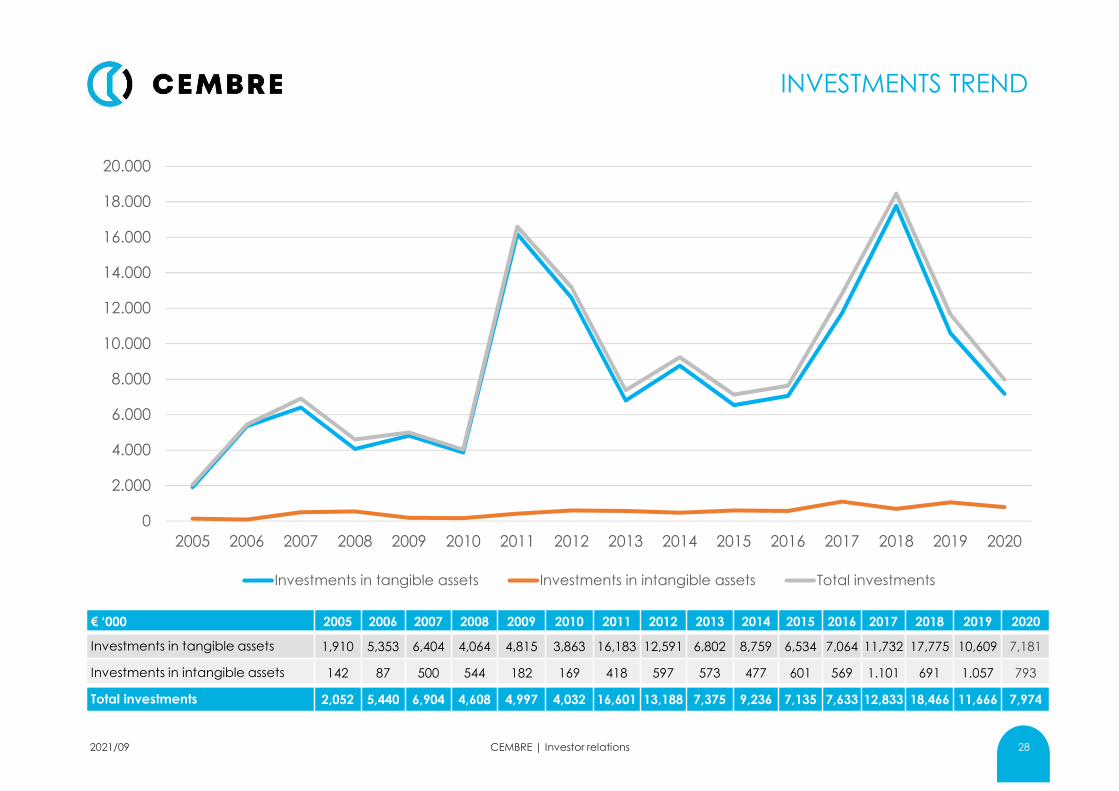
INVESTMENTS TREND
CEMBRE | Investor relations 28
€ ‘000 2005 2006 2007 2008 2009 2010 2011 2012 2013 2014 2015 2016 2017 2018 2019 2020
Investments in tangible assets 1,910 5,353 6,404 4,064 4,815 3,863 16,183 12,591 6,802 8,759 6,534 7,064 11,732 17,775 10,609 7,181
Investments in intangible assets 142 87 500 544 182 169 418 597 573 477 601 569 1.101 691 1.057 793
Total investments 2,052 5,440 6,904 4,608 4,997 4,032 16,601 13,188 7,375 9,236 7,135 7,633 12,833 18,466 11,666 7,974
0
2.000
4.000
6.000
8.000
10.000
12.000
14.000
16.000
18.000
20.000
2005 2006 2007 2008 2009 2010 2011 2012 2013 2014 2015 2016 2017 2018 2019 2020
Investments in tangible assets Investments in intangible assets Total investments
2021/09
CEMBRE | Presentazione agli investitori 29
COVID-19 PANDEMIC
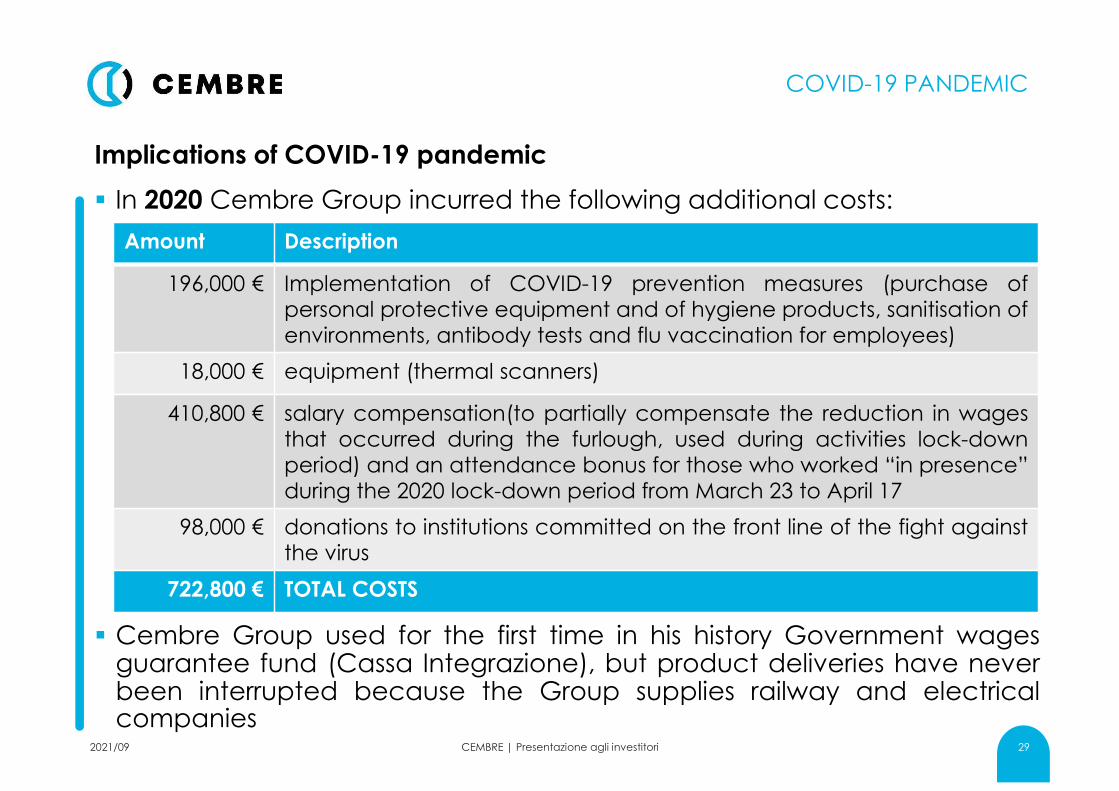
Implications of COVID-19 pandemic
In 2020 Cembre Group incurred the following additional costs:
Amount Description
196,000 € Implementation of COVID-19 prevention measures (purchase of
personal protective equipment and of hygiene products, sanitisation of
environments, antibody tests and flu vaccination for employees)
18,000 € equipment (thermal scanners)
410,800 € salary compensation(to partially compensate the reduction in wages
that occurred during the furlough, used during activities lock-down
period) and an attendance bonus for those who worked “in presence”
during the 2020 lock-down period from March 23 to April 17
98,000 € donations to institutions committed on the front line of the fight against
the virus
722,800 € TOTAL COSTS
Cembre Group used for the first time in his history Government wagesguarantee fund (Cassa Integrazione), but product deliveries have neverbeen interrupted because the Group supplies railway and electricalcompanies
2021/09
2021 AND ONWARDS
CEMBRE focused on these targets:
Business development thanks to:
A strengthening of CEMBRE competitive advantage by developingnew products and continuous product range renewing by an intenseR&D activity
Improvement of the distributor channel in foreign countries
An higher penetration in the foreign markets, especially in the US andGermany
A commercial commitment focus on high growing potential products
Cost management by a better operative efficiency obtained fromeconomies of scale and process innovations;
Enforcing the manufacturing structure by investing in high-tech, highly-automated machinery.
CEMBRE | Investor relations 302021/09
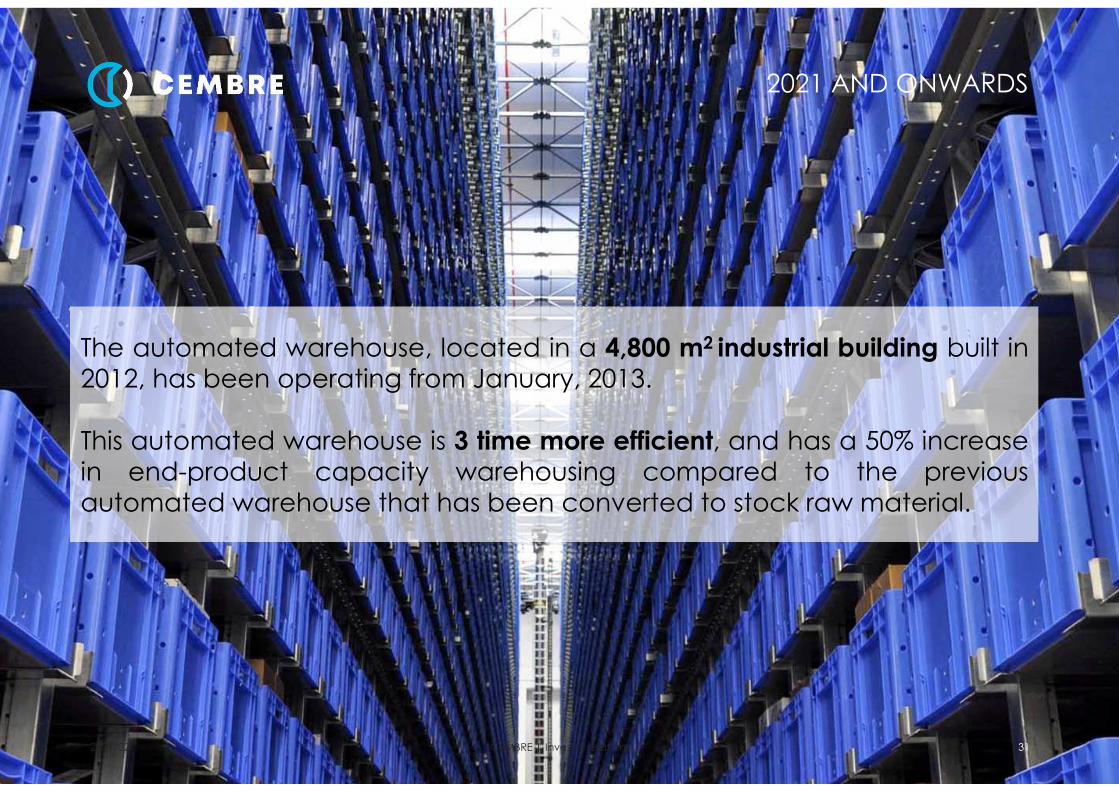
The automated warehouse, located in a 4,800 m2 industrial building built in2012, has been operating from January, 2013.
This automated warehouse is 3 time more efficient, and has a 50% increasein end-product capacity warehousing compared to the previousautomated warehouse that has been converted to stock raw material.
2021 AND ONWARDS
CEMBRE | Investor relations 312021/02
2021 AND ONWARDS
CEMBRE | Investor relations 32
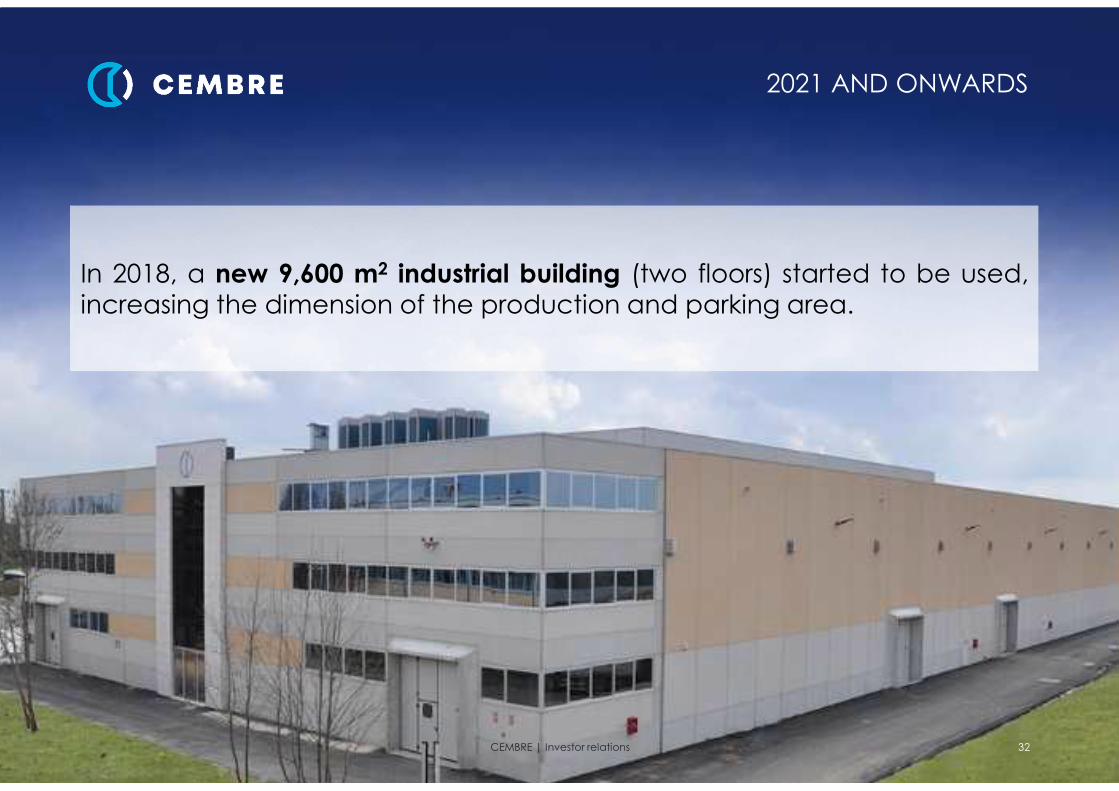
In 2018, a new 9,600 m2 industrial building (two floors) started to be used,increasing the dimension of the production and parking area.
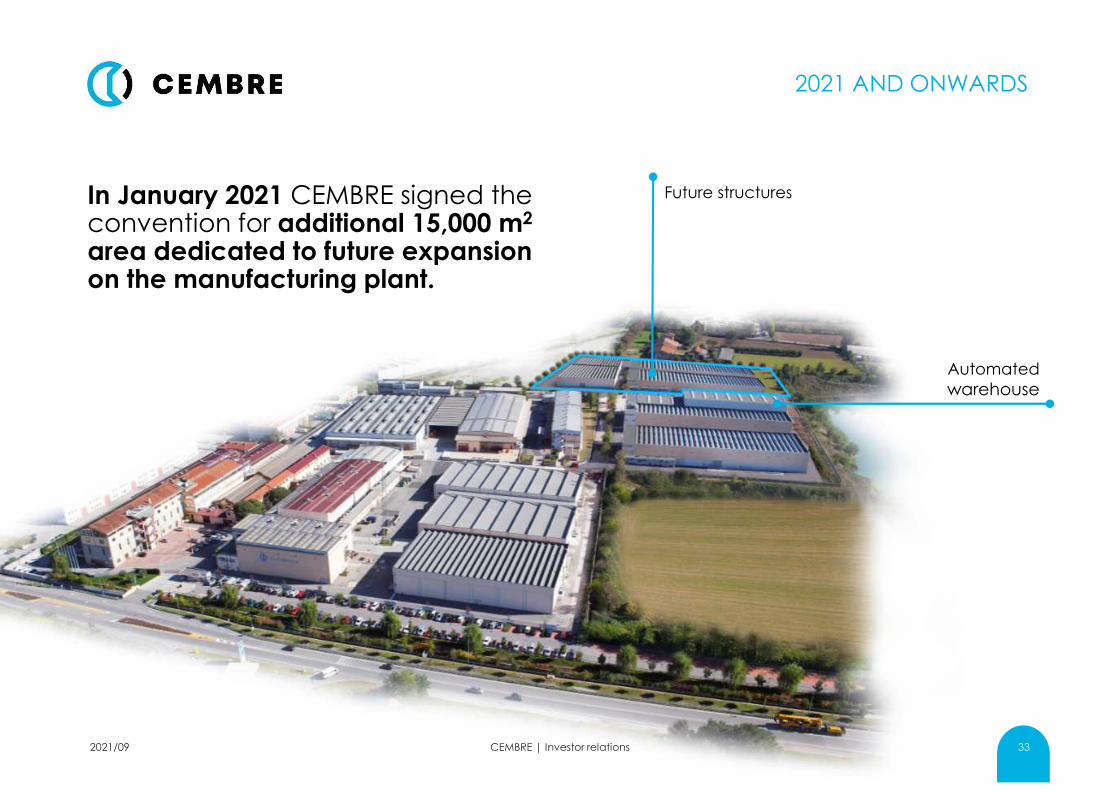
In January 2021 CEMBRE signed the convention for additional 15,000 m2
area dedicated to future expansion on the manufacturing plant.
CEMBRE | Investor relations
2021 AND ONWARDS
33
Future structures
Automated
warehouse
2021/09

STOCK DATA & SHAREHOLDING STRUCTURE
CEMBRE | Investor relations 34
Cembre has been listed since
December 1997, and is a part ofthe Star Index since September
2001.
Shareholders Share
LYSNE Spa 52.39%
Sara Rosani 8.65%
Giovanni Rosani 8.53%
Anna Maria Onofri 0.71%
Others 29.72%
2001 2002 2003 2004 2005 2006 2007 2008 2009 2010 2011 2012 2013 2014 2015 2016 2017 2018 2019 2020
Dividend per share (€) 0.10 0.08 0.07 0.10 0.15 0.22 0.26 0.16 0.12 0.26 0.16 0.16 0.26 0,36 0.46 0.70 0.80 0.90 0.90 0.90
Payout Ratio1 44% 42% 41% 41% 39% 40% 37% 25% 30% 39% 24% 24% 42% 45% 49% 70% 59% 66% 69% 79%
Dividend Yield2 4.1% 4.4% 2.9% 3.3% 3.2% 3.6% 4.2% 4.8% 2.6% 4.2% 2.9% 2.5% 2.9% 3.5% 3.3% 5.0% 3.7% 4.4% 4.8%3 4.8%
Cembre
FTSE Italia Stardata updated at September 8, 2021
1 Using consolidated profit 2 Using the year-end share price
2021/09
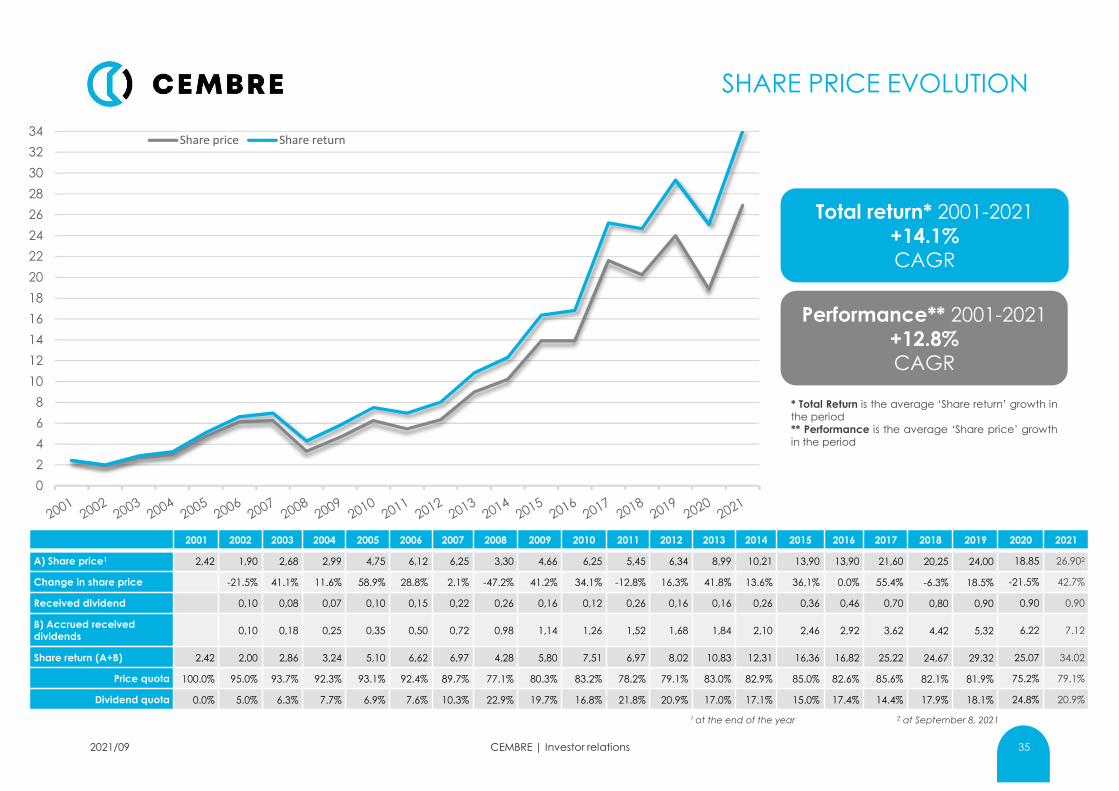
SHARE PRICE EVOLUTION
CEMBRE | Investor relations 35
Total return* 2001-2021
+14.1%
CAGR
Performance** 2001-2021
+12.8%
CAGR
* Total Return is the average ‘Share return’ growth inthe period** Performance is the average ‘Share price’ growthin the period
1 at the end of the year 2 at September 8, 2021
2001 2002 2003 2004 2005 2006 2007 2008 2009 2010 2011 2012 2013 2014 2015 2016 2017 2018 2019 2020 2021
A) Share price1 2,42 1,90 2,68 2,99 4,75 6,12 6,25 3,30 4,66 6,25 5,45 6,34 8,99 10,21 13,90 13,90 21,60 20,25 24,00 18.85 26.902
Change in share price -21.5% 41.1% 11.6% 58.9% 28.8% 2.1% -47.2% 41.2% 34.1% -12.8% 16.3% 41.8% 13.6% 36.1% 0.0% 55.4% -6.3% 18.5% -21.5% 42.7%
Received dividend 0,10 0,08 0,07 0,10 0,15 0,22 0,26 0,16 0,12 0,26 0,16 0,16 0,26 0,36 0,46 0,70 0,80 0,90 0.90 0.90
B) Accrued receiveddividends
0,10 0,18 0,25 0,35 0,50 0,72 0,98 1,14 1,26 1,52 1,68 1,84 2,10 2,46 2,92 3,62 4,42 5,32 6.22 7.12
Share return (A+B) 2,42 2,00 2,86 3,24 5,10 6,62 6,97 4,28 5,80 7,51 6,97 8,02 10,83 12,31 16,36 16,82 25,22 24,67 29,32 25.07 34.02
Price quota 100.0% 95.0% 93.7% 92.3% 93.1% 92.4% 89.7% 77.1% 80.3% 83.2% 78.2% 79.1% 83.0% 82.9% 85.0% 82.6% 85.6% 82.1% 81.9% 75.2% 79.1%
Dividend quota 0.0% 5.0% 6.3% 7.7% 6.9% 7.6% 10.3% 22.9% 19.7% 16.8% 21.8% 20.9% 17.0% 17.1% 15.0% 17.4% 14.4% 17.9% 18.1% 24.8% 20.9%
2021/09
0
2
4
6
8
10
12
14
16
18
20
22
24
26
28
30
32
34Share price Share return

Claudio BornatiCFO & IR
Via Serenissima 9 • 25135 Brescia (BS) ITALYph. +39 030 [email protected]
The manager responsible for preparing the Company’s financial reports,Claudio Bornati, declares, pursuant to paragraph 2 of Article 154 bis ofthe Consolidated Law on Finance, that the accounting informationcontained in this presentation corresponds to the document results,books and accounting records.
CEMBRE | Investor relations 36
CONTACTS
Thank you
2021/09