Embed Size (px)
Citation preview
CEMENT SECTOR –
AN OVERVIEW
November 2018
CEMENT INDUSTRY | INDUSTRY STRUCTURE
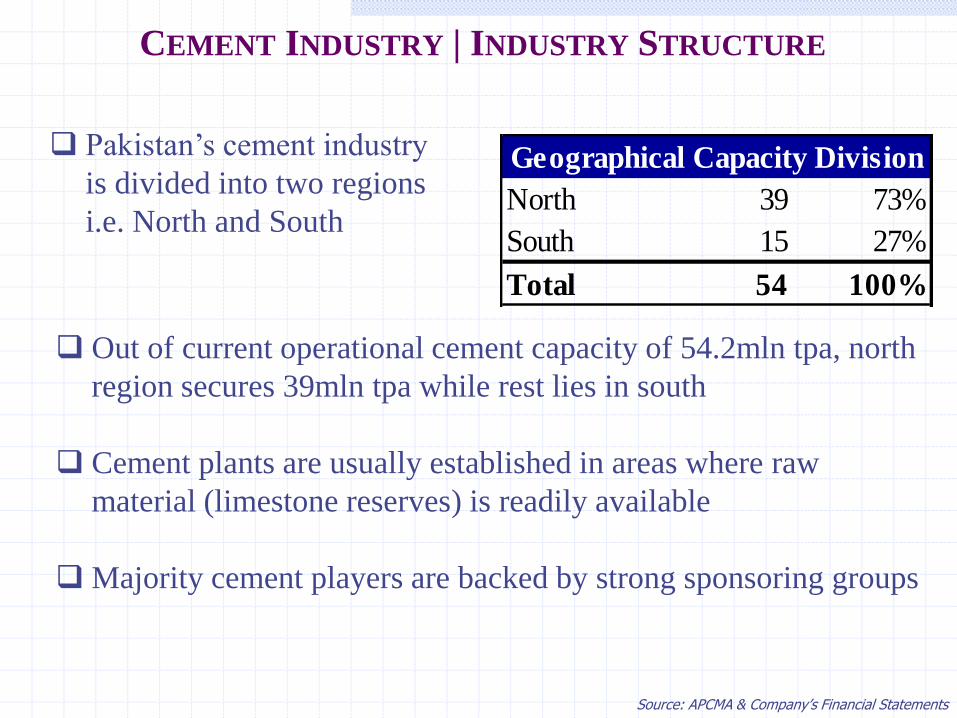
Pakistan’s cement industry
is divided into two regions
i.e. North and South North 39 73%
South 15 27%
Total 54 100%
Geographical Capacity Division
Out of current operational cement capacity of 54.2mln tpa, north
region secures 39mln tpa while rest lies in south
Cement plants are usually established in areas where raw
material (limestone reserves) is readily available
Majority cement players are backed by strong sponsoring groups
Source: APCMA & Company’s Financial Statements
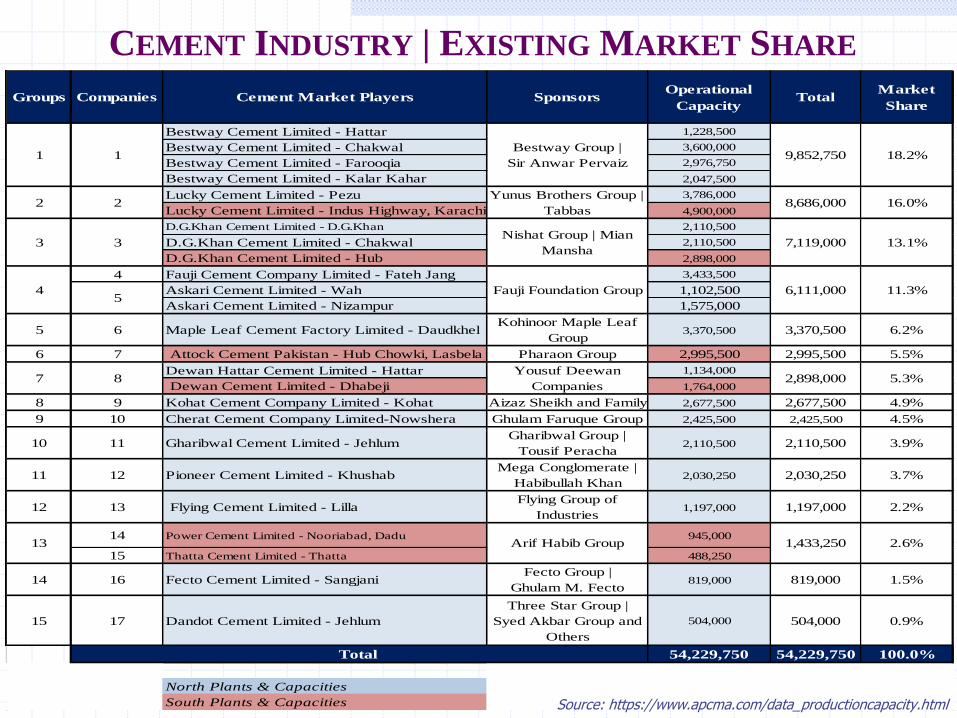
CEMENT INDUSTRY | EXISTING MARKET SHARE
Groups Companies Cement Market Players SponsorsOperational
CapacityTotal
Market
Share
Bestway Cement Limited - Hattar 1,228,500
Bestway Cement Limited - Chakwal 3,600,000
Bestway Cement Limited - Farooqia 2,976,750
Bestway Cement Limited - Kalar Kahar 2,047,500
Lucky Cement Limited - Pezu 3,786,000
Lucky Cement Limited - Indus Highway, Karachi 4,900,000
D.G.Khan Cement Limited - D.G.Khan 2,110,500
D.G.Khan Cement Limited - Chakwal 2,110,500
D.G.Khan Cement Limited - Hub 2,898,000
4 Fauji Cement Company Limited - Fateh Jang 3,433,500
Askari Cement Limited - Wah 1,102,500
Askari Cement Limited - Nizampur 1,575,000
5 6 Maple Leaf Cement Factory Limited - DaudkhelKohinoor Maple Leaf
Group3,370,500 3,370,500 6.2%
6 7 Attock Cement Pakistan - Hub Chowki, Lasbela Pharaon Group 2,995,500 2,995,500 5.5%
Dewan Hattar Cement Limited - Hattar 1,134,000
Dewan Cement Limited - Dhabeji 1,764,000
8 9 Kohat Cement Company Limited - Kohat Aizaz Sheikh and Family 2,677,500 2,677,500 4.9%
9 10 Cherat Cement Company Limited-Nowshera Ghulam Faruque Group 2,425,500 2,425,500 4.5%
10 11 Gharibwal Cement Limited - JehlumGharibwal Group |
Tousif Peracha2,110,500 2,110,500 3.9%
11 12 Pioneer Cement Limited - Khushab Mega Conglomerate |
Habibullah Khan2,030,250 2,030,250 3.7%
12 13 Flying Cement Limited - LillaFlying Group of
Industries1,197,000 1,197,000 2.2%
14 Power Cement Limited - Nooriabad, Dadu 945,000
15 Thatta Cement Limited - Thatta 488,250
14 16 Fecto Cement Limited - Sangjani Fecto Group |
Ghulam M. Fecto819,000 819,000 1.5%
15 17 Dandot Cement Limited - Jehlum
Three Star Group |
Syed Akbar Group and
Others
504,000 504,000 0.9%
54,229,750 54,229,750 100.0%
North Plants & Capacities
South Plants & Capacities
13
6,111,000 11.3%
1,433,250 2.6%
5.3%8
Fauji Foundation Group
Yousuf Deewan
Companies
Arif Habib Group
1
2
3
7
4
18.2%
16.0%
7,119,000 13.1%
Yunus Brothers Group |
Tabbas
Nishat Group | Mian
Mansha
1
Total
2,898,000
8,686,000
Bestway Group |
Sir Anwar Pervaiz9,852,750
2
3
5
Source: https://www.apcma.com/data_productioncapacity.html
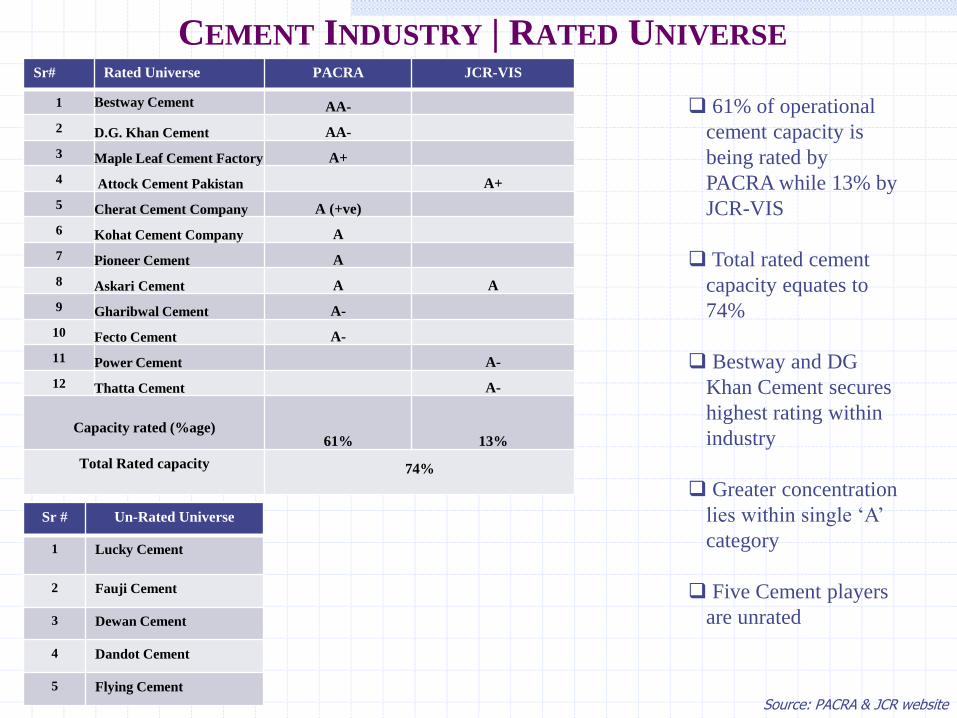
Sr# Rated Universe PACRA JCR-VIS
1 Bestway Cement AA-
2 D.G. Khan Cement AA-
3 Maple Leaf Cement Factory A+
4 Attock Cement Pakistan A+
5 Cherat Cement Company A (+ve)
6 Kohat Cement Company A
7 Pioneer Cement A
8 Askari Cement A A
9 Gharibwal Cement A-
10 Fecto Cement A-
11 Power Cement A-
12 Thatta Cement A-
Capacity rated (%age)61% 13%
Total Rated capacity 74%
CEMENT INDUSTRY | RATED UNIVERSE
61% of operational
cement capacity is
being rated by
PACRA while 13% by
JCR-VIS
Total rated cement
capacity equates to
74%
Bestway and DG
Khan Cement secures
highest rating within
industry
Greater concentration
lies within single ‘A’
category
Five Cement players
are unrated
Sr # Un-Rated Universe
1 Lucky Cement
2 Fauji Cement
3 Dewan Cement
4 Dandot Cement
5 Flying Cement
Source: PACRA & JCR website
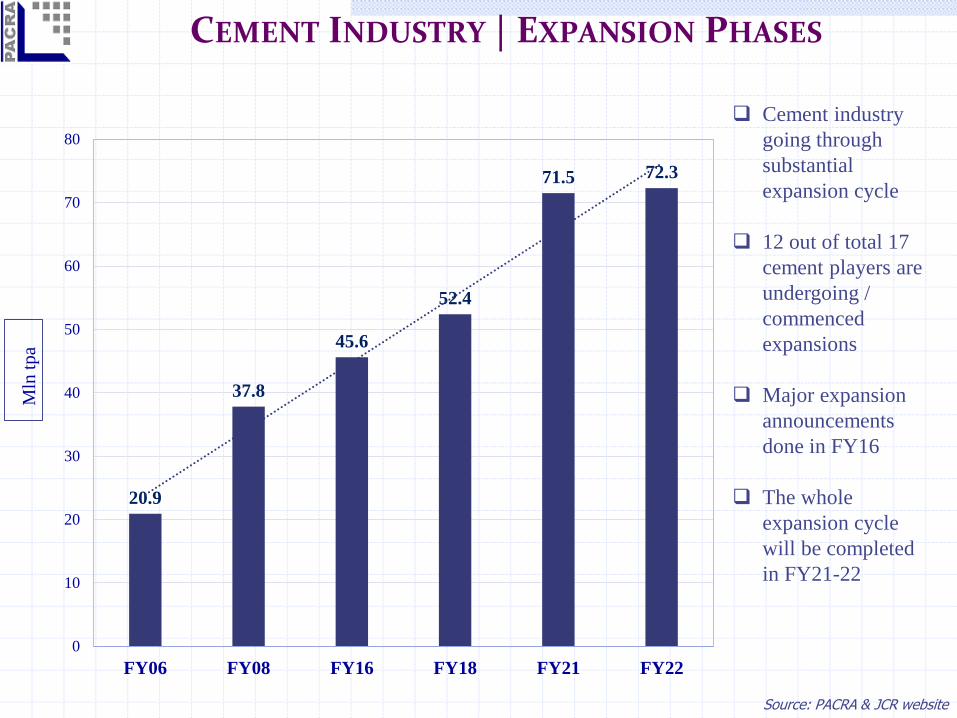
CEMENT INDUSTRY | EXPANSION PHASES
20.9
37.8
45.6
52.4
71.5 72.3
0
10
20
30
40
50
60
70
80
FY06 FY08 FY16 FY18 FY21 FY22
Mln
tpa
Cement industry
going through
substantial
expansion cycle
12 out of total 17
cement players are
undergoing /
commenced
expansions
Major expansion
announcements
done in FY16
The whole
expansion cycle
will be completed
in FY21-22
Source: PACRA & JCR website

CEMENT INDUSTRY | UPCOMING EXPANSIONSMln tpa
Sr.
# Companies
Announced
Expansion North South FY18 FY19 FY20 FY21 Total
Market
Share
1 Bestway Cement Limited 1.9 1.9 - 1.9 1.9 - - 9.9 13.8%
2 Lucky Cement Limited 3.9 2.6 1.3 1.3 1.3 2.6 2.6 11.3 15.8%
3 D.G.Khan Cement Limited 5.1 2.2 2.9 - 2.9 - - 7.1 9.9%
4 Maple Leaf Cement Factory Limited 2.2 2.2 - - 2.2 2.2 - 5.6 7.8%
5 Kohat Cement Company Limited 2.3 2.3 - - - 2.3 - 5.0 7.0%
6 Gharibwal Cement Limited 1.0 1.0 - - - - - 2.1 2.9%
7 Pioneer Cement Limited 2.2 2.2 - - - 2.2 - 4.2 5.9%
8 Cherat Cement Company Limited 2.4 2.4 - 1.2 2.4 2.4 - 4.9 6.9%
9 Attock Cement Pakistan Limited 1.1 - 1.1 1.1 1.1 - - 3.0 4.2%
10 Power Cement Limited 2.5 - 2.5 - 2.5 2.5 - 3.0 4.2%
11 Flying Cement Limited 1.2 - 1.2 - - 1.2 - 2.4 3.4%
12 Fecto Cement Limited 1.9 1.9 - - - 1.9 2.7 3.8%
13 Dewan Cement Limited - - - - - - - 2.9 4.1%
14 Fauji Cement Limited - - - - - - - 3.4 4.8%
15 Askari Cement Limited - - - - - - - 2.7 3.8%
16 Dandot Cement Limited - - - - - - - 0.5 0.7%
17 Thatta Cement Limited - - - - - - - 0.5 0.7%
Total Upcoming Expansion 27.7 18.7 9.0 5.5 14.3 15.4 4.5 71.5 100%
Total Capacities 54.2 61.3 69.6 71.5
Partial operations of new line
Full year operations of new line
Construction at halt
DG Khan Cement lately commenced its green field
expansion at Hub Site while all others (planned and
undergoing) are brown-field expansionsSource: PSX notices & Company’s financial statements
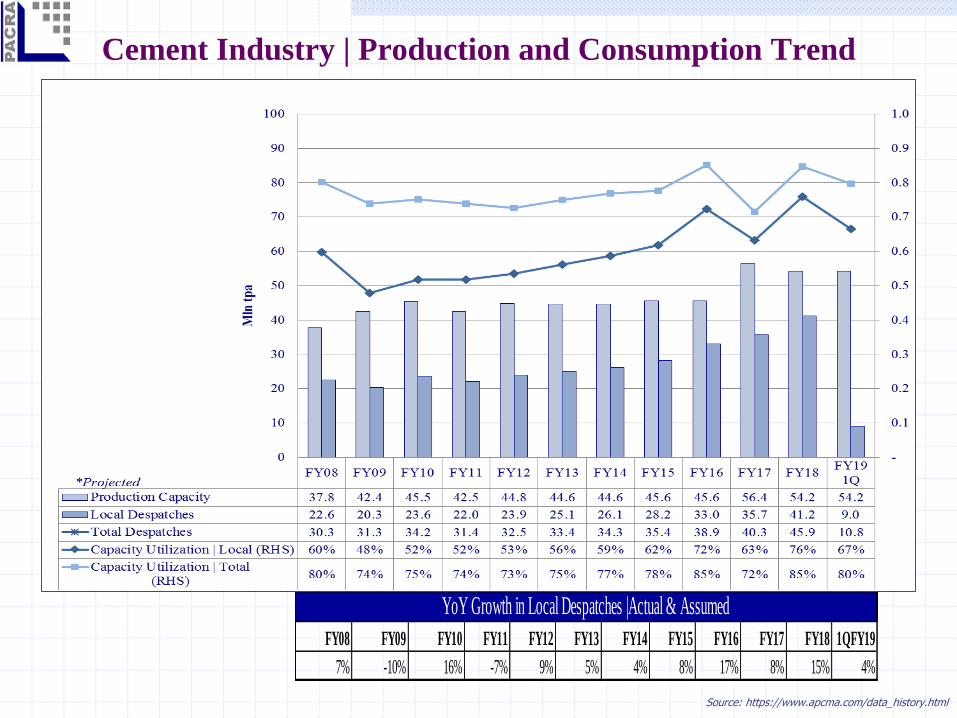
Cement Industry | Production and Consumption Trend
Source: https://www.apcma.com/data_history.html
FY08 FY09 FY10 FY11 FY12 FY13 FY14 FY15 FY16 FY17 FY18 1QFY19
7% -10% 16% -7% 9% 5% 4% 8% 17% 8% 15% 4%
YoY Growth in Local Despatches |Actual & Assumed
Cement Industry | Production and Consumption Trend
Cement industry’s capacity enhanced by cumulative 43% (16.4mln tons per
annum) in last one decade
In recent years, local dispatches gained momentum driven by greater PSDP
spending, housing schemes and CPEC related activities
During FY18, total dispatches witnessed ~14% YoY growth while 1QFY19
recorded growth in total dispatches of 4.4% YoY
Cement demand is expected to pick up pace in 2HFY19 driven by release
of PSDP funds 2018-19 of PKR 110.6bln (against total budgeted allocation
of PKR 675bln) and establishment of Pakistan Housing Authority on
priority basis
Source: https://epaper.brecorder.com/2018/11/11/1-page/748901-news.html

Cement Industry | Local – Export Mix
In recent years, dispatches were channeled to local market as demand
picked pace
Source: https://www.apcma.com/data_history.html
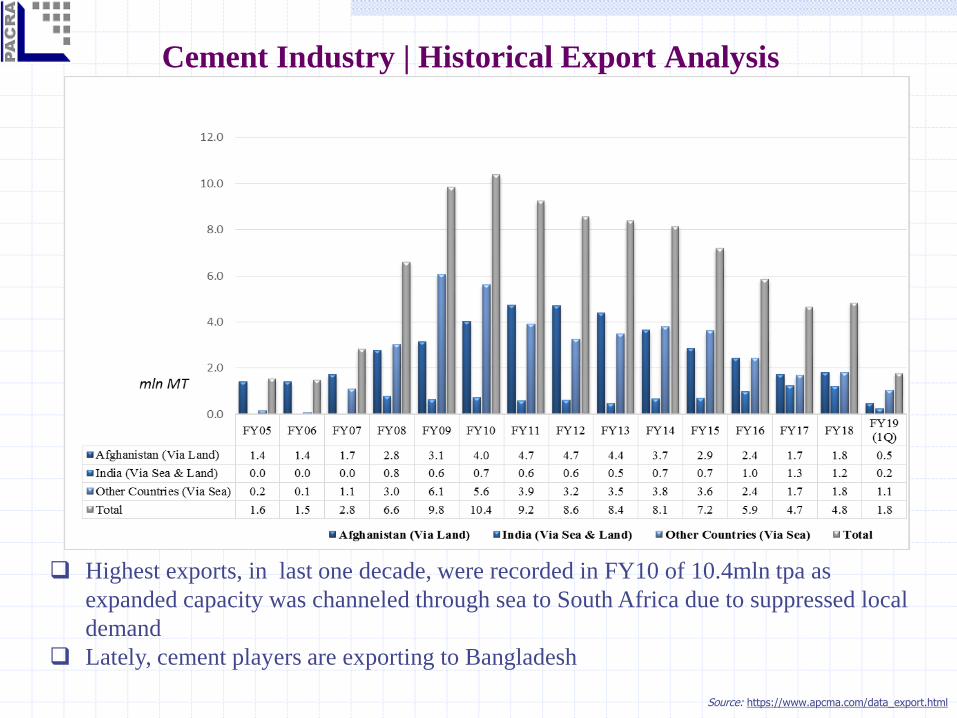
Cement Industry | Historical Export Analysis
Highest exports, in last one decade, were recorded in FY10 of 10.4mln tpa as
expanded capacity was channeled through sea to South Africa due to suppressed local
demand
Lately, cement players are exporting to Bangladesh
Source: https://www.apcma.com/data_export.html
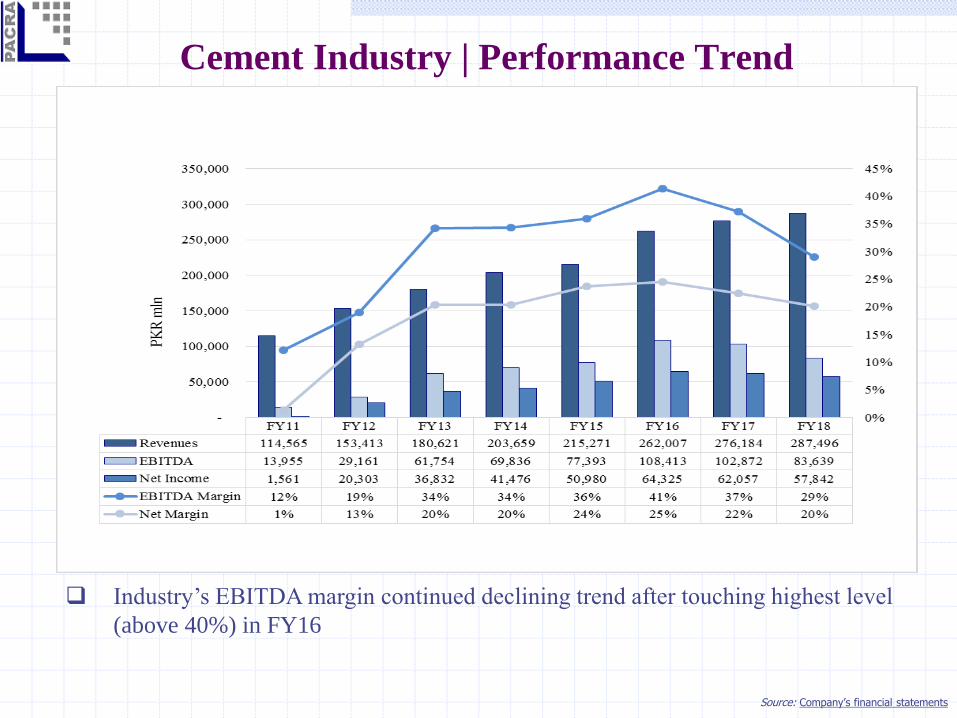
Cement Industry | Performance Trend
Industry’s EBITDA margin continued declining trend after touching highest level
(above 40%) in FY16
Source: Company’s financial statements
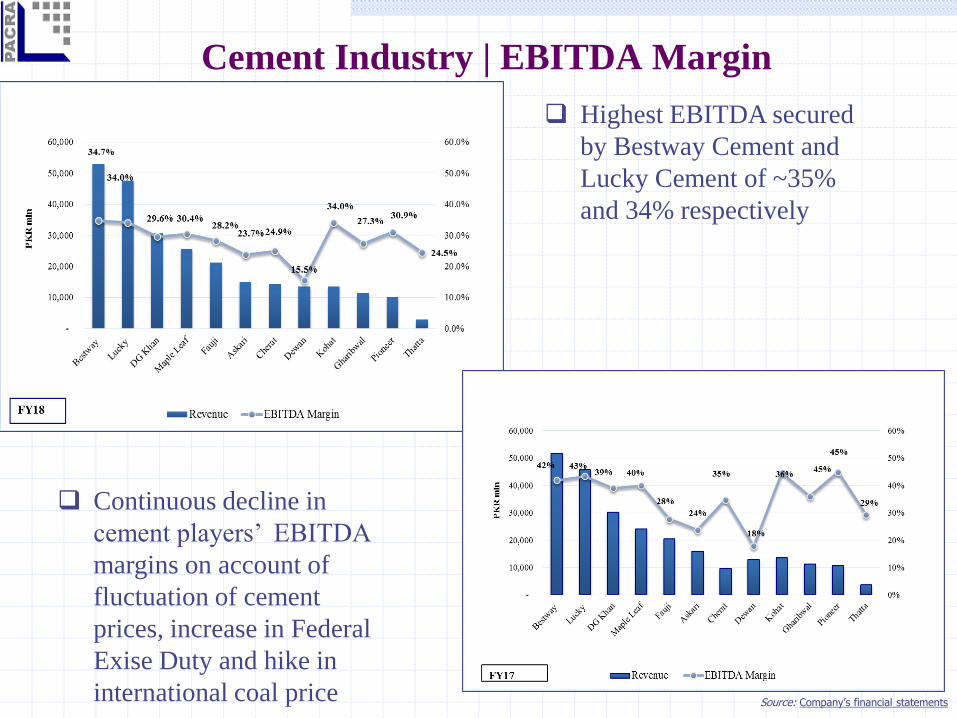
Cement Industry | EBITDA Margin
Continuous decline in
cement players’ EBITDA
margins on account of
fluctuation of cement
prices, increase in Federal
Exise Duty and hike in
international coal price
Highest EBITDA secured
by Bestway Cement and
Lucky Cement of ~35%
and 34% respectively
Source: Company’s financial statements
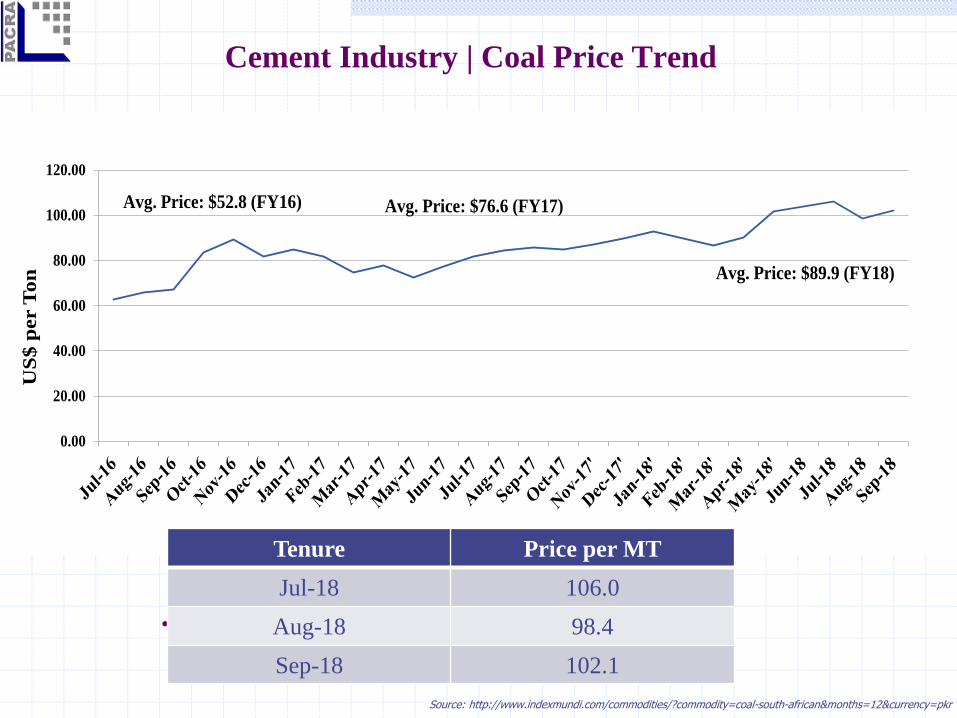
Cement Industry | Coal Price Trend
•
0.00
20.00
40.00
60.00
80.00
100.00
120.00
US
$ p
er T
on
Avg. Price: $76.6 (FY17)
Avg. Price: $89.9 (FY18)
Avg. Price: $52.8 (FY16)
Tenure Price per MT
Jul-18 106.0
Aug-18 98.4
Sep-18 102.1
Source: http://www.indexmundi.com/commodities/?commodity=coal-south-african&months=12¤cy=pkr

Cement Industry | Cement Price Trend
Cement Price – North region – witnessed high level of instability on account of
supply glut and non-existence of consensus amongst north players
Cement Price – South region – smooth sail as there are only two major players
Last price war incurred in FY08-09, when debt driven expansions were underway
and demand didn’t arise as expectedSource: http://www.pbs.gov.pk/cpi
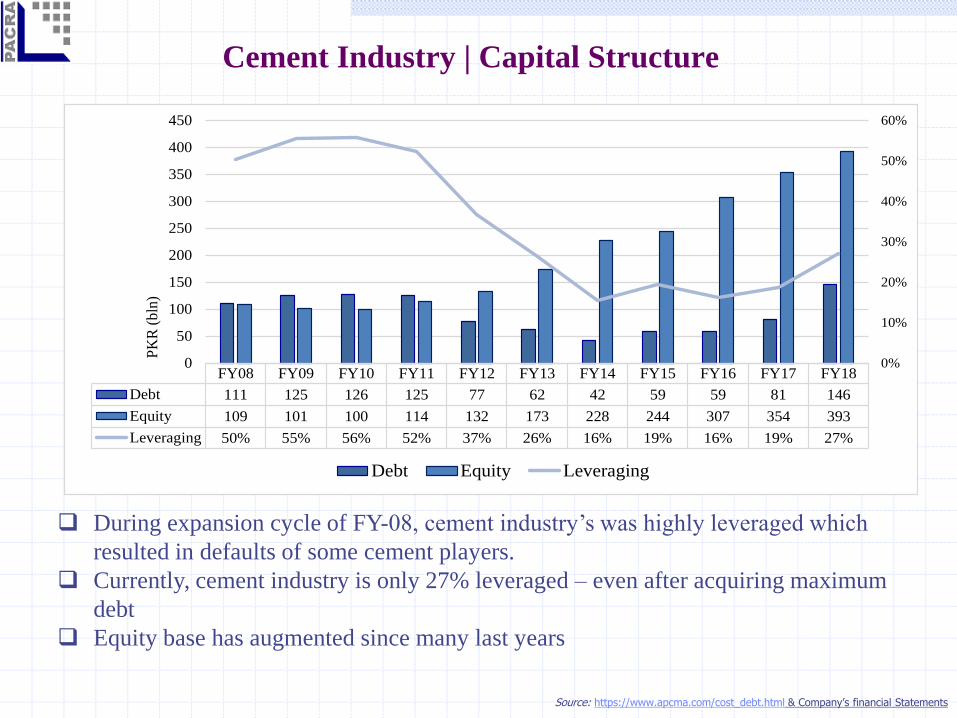
Cement Industry | Capital Structure
During expansion cycle of FY-08, cement industry’s was highly leveraged which
resulted in defaults of some cement players.
Currently, cement industry is only 27% leveraged – even after acquiring maximum
debt
Equity base has augmented since many last years
FY08 FY09 FY10 FY11 FY12 FY13 FY14 FY15 FY16 FY17 FY18
Debt 111 125 126 125 77 62 42 59 59 81 146
Equity 109 101 100 114 132 173 228 244 307 354 393
Leveraging 50% 55% 56% 52% 37% 26% 16% 19% 16% 19% 27%
0%
10%
20%
30%
40%
50%
60%
0
50
100
150
200
250
300
350
400
450
PK
R (
bln
)
Debt Equity Leveraging
Source: https://www.apcma.com/cost_debt.html & Company’s financial Statements

Cement Industry | Total Debt/EBITDA
Source: Company’s financial Statements
Cement Players FY16 FY17 FY18 FY16 FY17 FY18 FY16 FY17 FY18
Bestway 20,776 21,640 18,345 18,940 14,888 22,152 0.91 0.69 1.21
Lucky 21,224 19,784 16,185 - - - 0.00 0.00 0.00
DG Khan 12,770 11,758 9,064 7,002 21,615 32,277 0.55 1.84 3.56
Fauji 10,137 5,655 5,972 4,090 1,802 2,702 0.40 0.32 0.45
Askari 5,731 5,534 3,499 7,385 8,185 10,862 1.29 1.48 3.10
Maple Leaf 10,042 9,574 7,805 2,999 6,723 19,397 0.30 0.70 2.49
Attock 4,441 4,907 3,957 8 3,585 6,050 0.00 0.73 1.53
Dewan 2,390 2,293 2,088 3,076 6,060 5,961 1.29 2.64 2.85
Kohat 6,638 6,033 4,567 1,593 917 430 0.24 0.15 0.09
Cherat 2,350 3,349 3,579 4,231 6,401 16,064 1.80 1.91 4.49
Gharibwal 4,305 4,044 3,135 4,029 4,506 4,288 0.94 1.11 1.37
Pioneer 4,314 4,769 3,131 645 2,354 10,889 0.15 0.49 3.48
Flying 290 303 369 475 1,145 3,515 1.63 3.78 9.52
Power 849 953 590 3,143 1,707 10,853 3.70 1.79 18.40
Thatta 867 1,073 696 1,283 746 684 1.48 0.70 0.98
Fecto 1,289 1,204 656 - - 18 0.00 0.00 0.03
Dandot (2,344) (211) (211) 3,099 3,210 3,210 -1.32 -15.18 -15.18
Total 106,069 102,660 83,427 61,997 83,842 149,352 0.58 0.82 1.79
EBITDA Total Debt Total Debt/EBITDAPKR mln
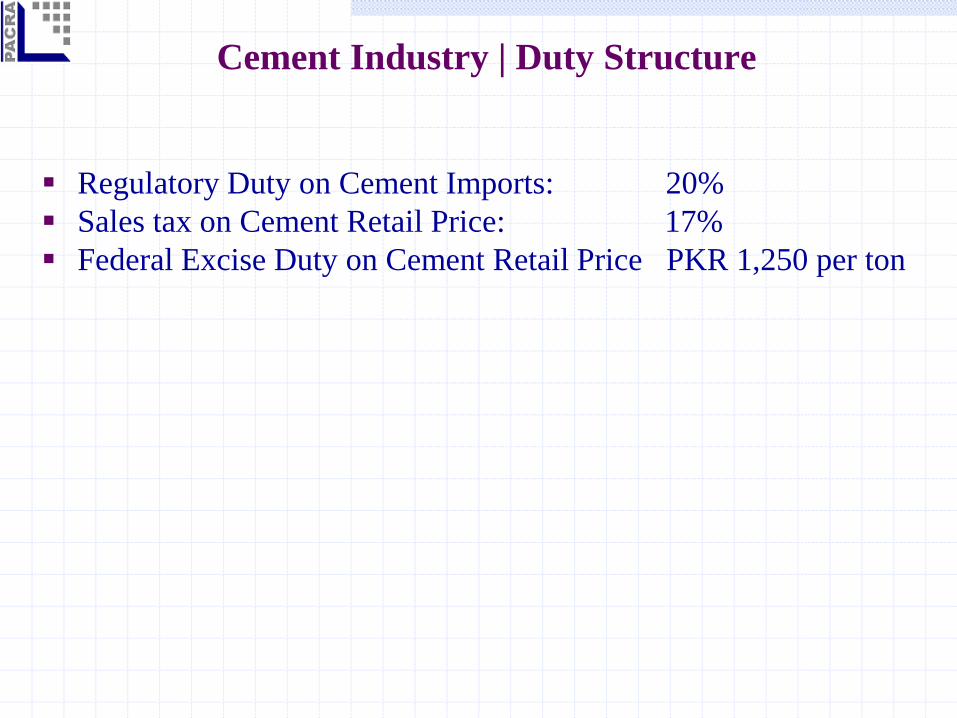
Regulatory Duty on Cement Imports: 20%
Sales tax on Cement Retail Price: 17%
Federal Excise Duty on Cement Retail Price PKR 1,250 per ton
Cement Industry | Duty Structure
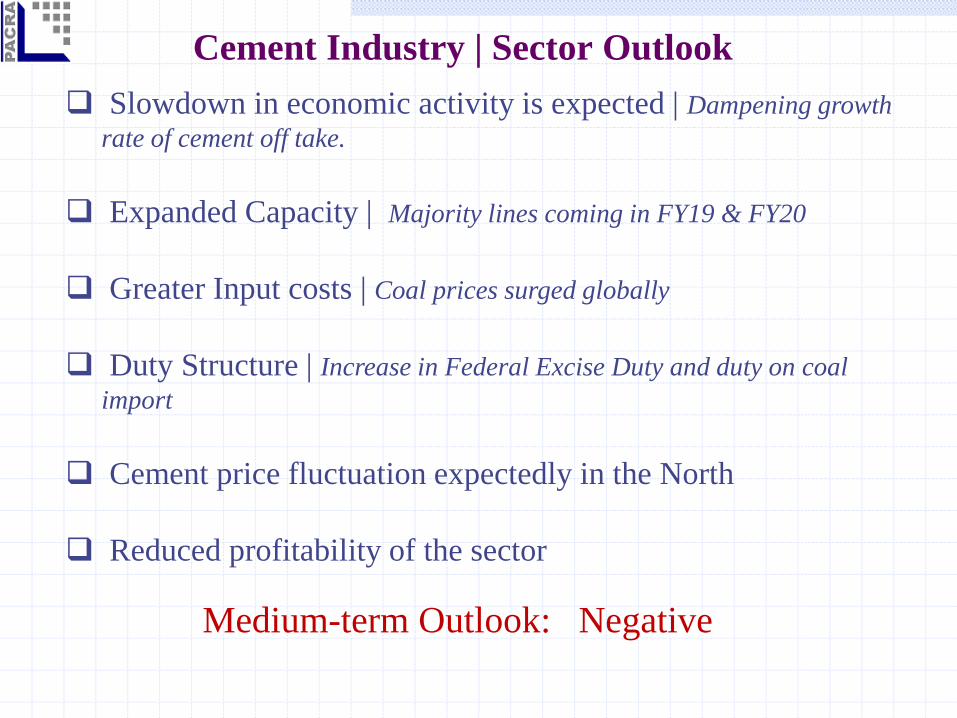
Medium-term Outlook: Negative
Cement Industry | Sector Outlook
Slowdown in economic activity is expected | Dampening growth
rate of cement off take.
Expanded Capacity | Majority lines coming in FY19 & FY20
Greater Input costs | Coal prices surged globally
Duty Structure | Increase in Federal Excise Duty and duty on coal
import
Cement price fluctuation expectedly in the North
Reduced profitability of the sector
Rating Team Unit Head - RatingsJhangeer Hanif
Supervisory SeniorSehar Fatima
Saliha Sajid
Contact Number: +92 42 3586 9504
DISCLAIMERPACRA has used due care in preparation of this document. Our information has been obtained from
sources we consider to be reliable but its accuracy or completeness is not guaranteed. The information
in this document may be copied or otherwise reproduced, in whole or in part, provided the source is
duly acknowledged. The presentation should not be relied upon as professional advice.