Embed Size (px)
Citation preview
Cement Stabilization of Subbase and Subgrade
RESEARCH PROJECT TITLEBoone County Expo Research Phase I – Granular Road Compaction and Stabilization
SPONSORIowa Department of Transportation
RESEARCH TEAMDavid J. White, PhDAssociate [email protected]
Pavana K. R. Vennapusa, PhDResearch Assistant [email protected]
Peter BeckerResearch [email protected]
Christianna White, PhDTechnical [email protected]
RESEARCH PARTNERSIowa Department of TransportationCentral Iowa ExpoBoone County EngineerFoth Engineering AllianceJB Holland Construction, Inc.Center for Earthworks Engineering Research
IOWA DOT CONTACT Mark Dunn, PEOperations Research EngineerOffice of Research & AnalyticsIowa Department of [email protected]
MORE INFORMATIONhttp://www.ceer.iastate.edu
May 2013
The Iowa Department of Transportation (DOT) worked with its research partners to design comparative pavement foundation test sections at the Central Iowa Expo Site in Boone, Iowa. The project was constructed from May through July 2012. Sixteen 700 ft long test sections were constructed on 4.8 miles of roadway with the following goals:
• Construct a test area that will allow long-term performance monitoring
• Develop local experience with new stiffness measurement technologies to assist with near-term implementation
• Increase the range of stabilization technologies to be considered for future pavement foundation design to optimize the pavement system
This tech brief provides an overview of in situ test results and key findings from two test sections constructed using portland cement (PC) stabilization in subgrade and subbase layers.
BackgroundPotential improvements to strength/stiffness of foundation layers from PC stabilization are not currently considered in Iowa DOT pavement design procedures.
One of the objectives of this study is to investigate the use of PC stabilization to optimize pavement foundation design, by measuring in situ engineering properties over time with a special focus on freeze/thaw performance. The performance and cost of construction of foundation layers with PC stabilization in subgrade versus subbase layers are compared in this study.
Laboratory mix design procedures for soil-cement mixtures are well-documented in the literature (PCA 1995, Terrel et al. 1979). According to PCA (1995), normal range of cement percentage requirement (by soil weight) for A-1-A soils is 3%-5%, and for A-6 soils is 9%-15%. In this study, A-6 subgrade soil was stabilized with 10% PC, and A-1-A granular soil was stabilized with 5% PC.
Description of Test Sections and In Situ TestingThe test sections originally consisted of a thin chipseal coat and an 8 in. recycled asphalt subbase at the surface. The subbase material was excavated down to the subgrade level (Figure 1). The existing subgrade material is classified as CL or A-6(5).
TECH BRIEF
The sponsors of this research are not responsible for the accuracy of the information presented herein. The conclusions expressed in this publication are not necessarily those of the sponsors.
Boone County Expo Test SectionsDRAFT
Figure 1. Prepared subgrade prior to placement of PC on the 11th St. North
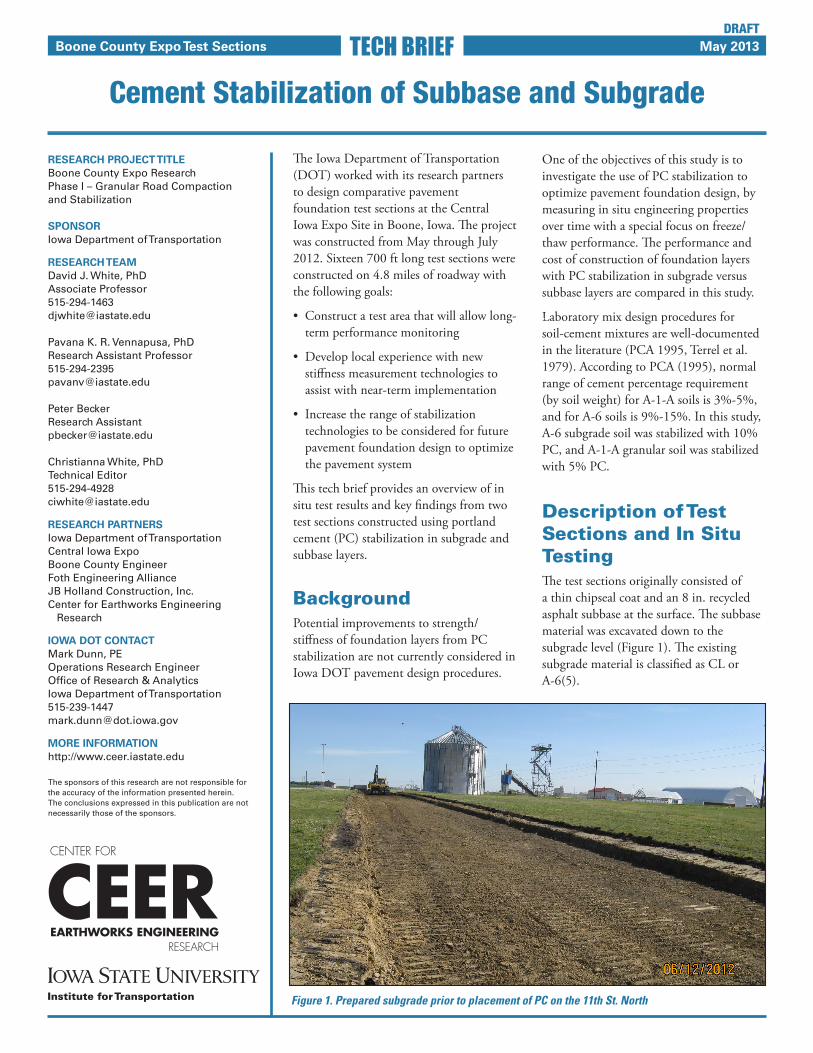
The test section with subgrade PC stabilization was constructed by mixing a target 10% PC into 12 in. of subgrade on 11th St. North. The process involved distributing PC onto the subgrade (Figure 2), mixing and moisture-conditioning the material with a soil reclaimer by injecting water into the mixing drum (Figure 3), and compacting the stabilized subgrade layer with a vibratory pad drum roller immediately behind the reclaimer (Figure 3). A maximum 1 hour compaction delay was specified on this project.
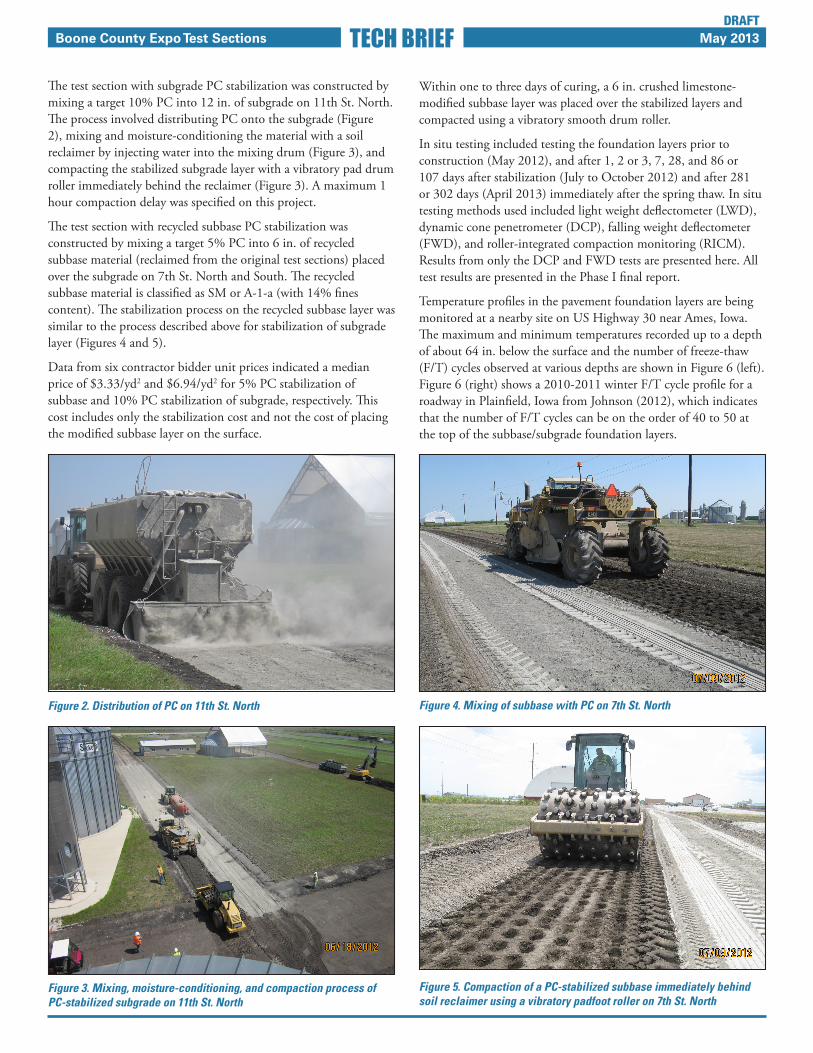
The test section with recycled subbase PC stabilization was constructed by mixing a target 5% PC into 6 in. of recycled subbase material (reclaimed from the original test sections) placed over the subgrade on 7th St. North and South. The recycled subbase material is classified as SM or A-1-a (with 14% fines content). The stabilization process on the recycled subbase layer was similar to the process described above for stabilization of subgrade layer (Figures 4 and 5).
Data from six contractor bidder unit prices indicated a median price of $3.33/yd2 and $6.94/yd2 for 5% PC stabilization of subbase and 10% PC stabilization of subgrade, respectively. This cost includes only the stabilization cost and not the cost of placing the modified subbase layer on the surface.
May 2013TECH BRIEFBoone County Expo Test Sections
1.12
292CBR =PI
Figure 4. Mixing of subbase with PC on 7th St. North
Figure 3. Mixing, moisture-conditioning, and compaction process of PC-stabilized subgrade on 11th St. North
Figure 2. Distribution of PC on 11th St. North
Figure 5. Compaction of a PC-stabilized subbase immediately behind soil reclaimer using a vibratory padfoot roller on 7th St. North
DRAFT
Within one to three days of curing, a 6 in. crushed limestone-modified subbase layer was placed over the stabilized layers and compacted using a vibratory smooth drum roller.
In situ testing included testing the foundation layers prior to construction (May 2012), and after 1, 2 or 3, 7, 28, and 86 or 107 days after stabilization (July to October 2012) and after 281 or 302 days (April 2013) immediately after the spring thaw. In situ testing methods used included light weight deflectometer (LWD), dynamic cone penetrometer (DCP), falling weight deflectometer (FWD), and roller-integrated compaction monitoring (RICM). Results from only the DCP and FWD tests are presented here. All test results are presented in the Phase I final report.
Temperature profiles in the pavement foundation layers are being monitored at a nearby site on US Highway 30 near Ames, Iowa. The maximum and minimum temperatures recorded up to a depth of about 64 in. below the surface and the number of freeze-thaw (F/T) cycles observed at various depths are shown in Figure 6 (left). Figure 6 (right) shows a 2010-2011 winter F/T cycle profile for a roadway in Plainfield, Iowa from Johnson (2012), which indicates that the number of F/T cycles can be on the order of 40 to 50 at the top of the subbase/subgrade foundation layers.
Various laboratory tests to characterize the compressive strength and freeze-thaw durability of the PC-stabilized subgrade and subbase mixtures are also underway and will be reported separately.
In Situ Test ResultsThe field-determined PC content was calculated by dividing the delivered weight of PC over the roadway area and assuming a uniform reclamation depth of 6 in. for PC-stabilized subbase and 12 in. for PC-stabilized subgrade. The calculated PC content was about 11.4% in the 11th St. North section, about 5.2% in the 7th St. North section, and about 6.2% in the 7th St. South section.
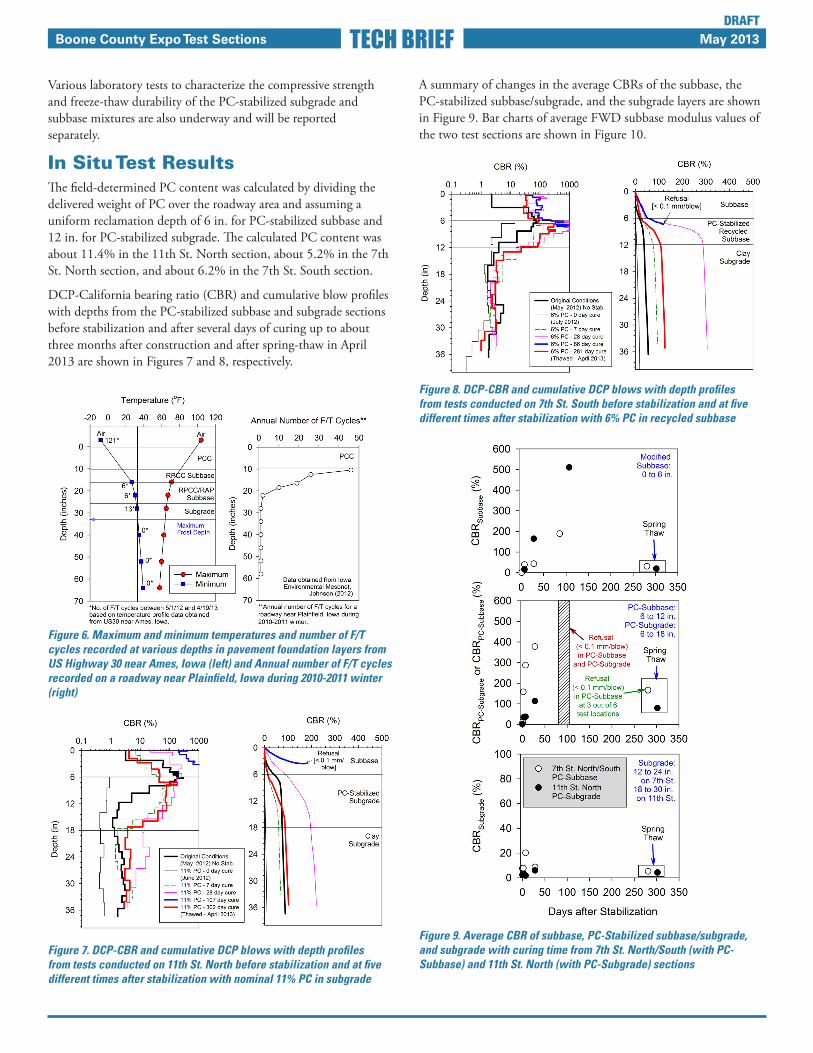
DCP-California bearing ratio (CBR) and cumulative blow profiles with depths from the PC-stabilized subbase and subgrade sections before stabilization and after several days of curing up to about three months after construction and after spring-thaw in April 2013 are shown in Figures 7 and 8, respectively.
May 2013TECH BRIEFBoone County Expo Test Sections
Figure 7. DCP-CBR and cumulative DCP blows with depth profiles from tests conducted on 11th St. North before stabilization and at five different times after stabilization with nominal 11% PC in subgrade
Figure 6. Maximum and minimum temperatures and number of F/T cycles recorded at various depths in pavement foundation layers from US Highway 30 near Ames, Iowa (left) and Annual number of F/T cycles recorded on a roadway near Plainfield, Iowa during 2010-2011 winter (right)
DRAFT
A summary of changes in the average CBRs of the subbase, the PC-stabilized subbase/subgrade, and the subgrade layers are shown in Figure 9. Bar charts of average FWD subbase modulus values of the two test sections are shown in Figure 10.
Figure 8. DCP-CBR and cumulative DCP blows with depth profiles from tests conducted on 7th St. South before stabilization and at five different times after stabilization with 6% PC in recycled subbase
Figure 9. Average CBR of subbase, PC-Stabilized subbase/subgrade, and subgrade with curing time from 7th St. North/South (with PC-Subbase) and 11th St. North (with PC-Subgrade) sections
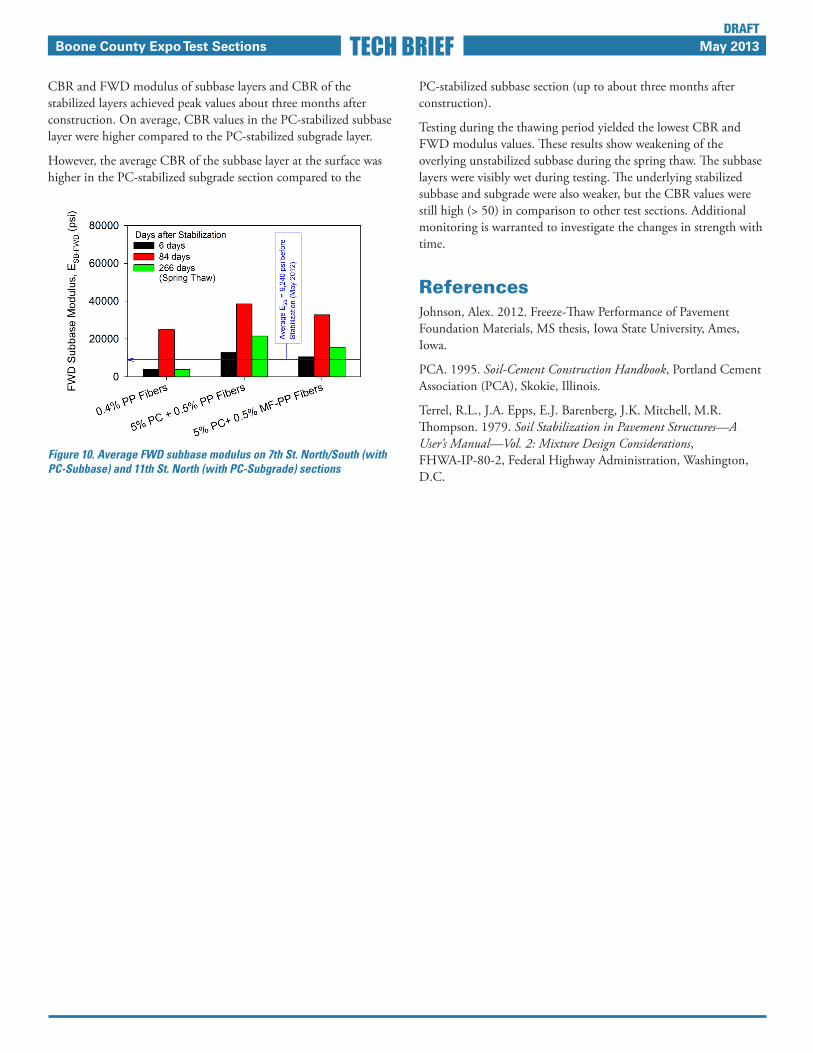
CBR and FWD modulus of subbase layers and CBR of the stabilized layers achieved peak values about three months after construction. On average, CBR values in the PC-stabilized subbase layer were higher compared to the PC-stabilized subgrade layer.
However, the average CBR of the subbase layer at the surface was higher in the PC-stabilized subgrade section compared to the
May 2013TECH BRIEFBoone County Expo Test SectionsDRAFT
Figure 10. Average FWD subbase modulus on 7th St. North/South (with PC-Subbase) and 11th St. North (with PC-Subgrade) sections
PC-stabilized subbase section (up to about three months after construction).
Testing during the thawing period yielded the lowest CBR and FWD modulus values. These results show weakening of the overlying unstabilized subbase during the spring thaw. The subbase layers were visibly wet during testing. The underlying stabilized subbase and subgrade were also weaker, but the CBR values were still high (> 50) in comparison to other test sections. Additional monitoring is warranted to investigate the changes in strength with time.
ReferencesJohnson, Alex. 2012. Freeze-Thaw Performance of Pavement Foundation Materials, MS thesis, Iowa State University, Ames, Iowa.
PCA. 1995. Soil-Cement Construction Handbook, Portland Cement Association (PCA), Skokie, Illinois.
Terrel, R.L., J.A. Epps, E.J. Barenberg, J.K. Mitchell, M.R. Thompson. 1979. Soil Stabilization in Pavement Structures—A User’s Manual—Vol. 2: Mixture Design Considerations, FHWA-IP-80-2, Federal Highway Administration, Washington, D.C.