Embed Size (px)
Citation preview
______________________________________________________________________
Center for Independent Experts (CIE) Reviewer’s Independent Peer Review Report on the
62nd Stock Assessment Workshop/Stock Assessment Review Committee (SAW/SARC) Benchmark stock assessment for
Black sea bass and Witch flounder ______________________________________________________________________ Prepared by Neil Klaer Prepared for The Center for Independent Experts Review Meeting Woods Hole, Massachusetts 29 November – 2 December 2017
2
Contents Executive Summary 1 Introduction
1.1 Background 1.2 Review of Activities
2 Assessments
2.1 Review findings by term of reference for Black sea bass 2.1.1. Summarize the conclusions of the February 2016 SSC peer review regarding the potential for
spatial partitioning of the black sea bass stock. The consequences for the stock assessment will be addressed in TOR-6.)
2.1.2. Estimate catch from all sources including landings and discards. Characterize the uncertainty
in these sources of data. Evaluate available information on discard mortality and, if appropriate, update mortality rates applied to discard components of the catch. Describe the spatial and temporal distribution of fishing effort.
2.1.3. Present the survey data being used in the assessment (e.g., indices of abundance,
recruitment, state surveys, age-length data, etc.). Investigate the utility of fishery dependent indices as a measure of relative abundance. Characterize the uncertainty and any bias in these sources of data.
2.1.4. Consider the consequences of environmental factors on the estimates of abundance or
relative indices derived from surveys. 2.1.5. Investigate implications of hermaphroditic life history on stock assessment model. If possible,
incorporate parameters to account for hermaphroditism. 2.1.6. Estimate annual fishing mortality, recruitment and stock biomass (both total and spawning
stock), using measures that are appropriate to the assessment model, for the time series (integrating results from TORs-1,-4, & -5 as appropriate), and estimate their uncertainty. Include a historical retrospective analysis and past projection performance evaluation to allow a comparison with most recent assessment results.
2.1.7. Estimate biological reference points (BRPs; point estimates or proxies for BMSY,
BTHRESHOLD, FMSY, and MSY), including defining BRPs for spatially explicit areas if appropriate, and provide estimates of their uncertainty. If analytic model-based estimates are unavailable, consider recommending alternative measurable proxies for BRPs. Comment on the appropriateness of existing BRPs and the “new” (i.e., updated, redefined, or alternative) BRPs.
2.1.8. Evaluate overall stock status with respect to a new model or new models that considered
spatial units developed for this peer review. 2.1.9. Develop approaches and apply them to conduct stock projections.

3
a. Provide numerical annual projections (3-5 years) and the statistical distribution (e.g., probability density function) of the OFL (overfishing level) that fully incorporates observation, process and model uncertainty (see Appendix to the SAW TORs). Each projection should estimate and report annual probabilities of exceeding threshold BRPs for F, and probabilities of falling below threshold BRPs for biomass. Use a sensitivity analysis approach in which a range of assumptions about the most important uncertainties in the assessment are considered (e.g., terminal year abundance, variability in recruitment, and definition of BRPs for black sea bass).
b. Comment on which projections seem most realistic. Consider major uncertainties in the assessment as well as the sensitivity of the projections to various assumptions.
c. Describe this stock’s vulnerability (see “Appendix to the SAW TORs”) to becoming overfished, and how this could affect the choice of ABC.
2.1.10. Review, evaluate and report on the status of the SARC and Working Group research
recommendations listed in recent SARC reviewed assessments and review panel reports. Identify new research recommendations.
2.2 Review findings by term of reference for Witch flounder 2.2.1. Estimate catch from all sources including landings and discards. Describe the spatial and
temporal distribution of landings, discards, and fishing effort. Characterize the uncertainty in these sources of data.
2.2.2. Present available federal, state, and other survey data, indices of relative or absolute
abundance, recruitment, etc. Characterize the uncertainty and any bias in these sources of data and compare survey coverage to locations of fishery catches. Select the surveys and indices for use in the assessment.
2.2.3. Investigate effects of environmental factors and climate change on recruitment, growth and
natural mortality of witch flounder. If quantifiable relationships are identified, consider incorporating these into the stock assessment.
2.2.4. Estimate annual fishing mortality, recruitment and stock biomass (both total and spawning
stock) for the time series (integrating results from TOR-3 if appropriate), and estimate their uncertainty. Include a historical retrospective analysis to allow a comparison with previous assessment results and previous projections. Compare F’s and SSB’s that were projected during the previous assessment to their realized values.
2.2.5. State the existing stock status definitions for “overfished” and “overfishing”. Then update or
redefine biological reference points (BRPs; point estimates or proxies for BMSY, BTHRESHOLD, FMSY and MSY) and provide estimates of their uncertainty. If analytic model- based estimates are unavailable, consider recommending alternative measurable proxies for BRPs. Comment on the scientific adequacy of existing BRPs and the “new” (i.e., updated, redefined, or alternative) BRPs.
2.2.6. Evaluate stock status with respect to the existing model (from previous peer reviewed
accepted assessment) and with respect to a new model (or possibly models, in accord with guidance in attached “Appendix to the SAW Assessment TORs”) developed for this peer review. In both cases, evaluate whether the stock is rebuilt. a. When working with the existing model, update it with new data and evaluate stock
status (overfished and overfishing) with respect to the updated BRP estimates. b. Then use the newly proposed model (or possibly models, in accord with guidance in
“Appendix to the SAW Assessment TORs”) and evaluate stock status with respect to “new” BRPs and their estimates (from TOR-5).
4
2.2.7. Develop approaches and apply them to conduct stock projections.
a. Provide numerical annual projections (3 years) and the statistical distribution (e.g., probability density function) of the catch at FMSY or an FMSY proxy (i.e. the overfishing level, OFL) (see Appendix). Each projection should estimate and report annual probabilities of exceeding threshold BRPs for F, and probabilities of falling below threshold BRPs for biomass. Use a sensitivity analysis approach in which a range of assumptions about the most important uncertainties in the assessment are considered (e.g., terminal year abundance, magnitude and variability in recruitment).
b. Comment on which projections seem most realistic. Consider the major uncertainties in the assessment as well as sensitivity of the projections to various assumptions. Identify reasonable projection parameters (recruitment, weight-at- age, retrospective adjustments, etc.) to use when setting specifications.
c. Describe this stock’s vulnerability to becoming overfished, and how this could affect the choice of ABC. The choice takes scientific uncertainty into account (see Appendix).
2.2.8. Evaluate the validity of the current stock definition, taking into account what is known about
migration, and make a recommendation about whether there is a need to modify the current stock definition for future stock assessments.
2.2.9. Review, evaluate and report on the status of research recommendations from the last peer
reviewed benchmark stock assessment. Identify new research recommendations. Annex 1: Bibliography of materials provided for review Annex 2: A copy of the CIE Statement of Work Annex 3: List of participants

5
Executive Summary The 62nd Stock Assessment Review Committee (SARC) on assessments of Black sea bass (Centropristis striata) and Witch flounder (Glyptocephalus cynoglossus) met in the Aquarium Conference Room at NOAA’s Northeast Fisheries Science Center (NEFSC) in Woods Hole from Tuesday November 29 to Friday December 2, 2016. The meeting was chaired by Dr Patrick J. Sullivan from the New England Fisheries Management Council’s Scientific and Statistical Committee and the review panel (the Panel) was composed of three scientists appointed by the Center for Independent Experts: Vivian Haist, Neil Klaer, and Anders Nielsen. The meeting generally followed the draft agenda and included presentations by representatives of the stock assessment teams: Dr Gary Shepherd for Black sea bass and Dr Susan Wigley for Witch flounder. The meeting was open to the public and was available also on live audio via the web. Discussion was mostly restricted to clarification during presentations with broader discussion at the conclusion of presentations. There was limited time available for additional work outside the meeting, but several homework analyses were requested by the Panel and results were provided during the meeting. The meeting atmosphere was congenial, the venue was excellent, and contributors to the meeting all did so in a professional and efficient manner, allowing the meeting work to be completed on-time and without contention. Findings for Black sea bass A Mid-Atlantic Fisheries Management Council Scientific and Statistical Committee peer review approved the SAW Working Group recommended spatial partitioning of the black sea bass population north of Cape Hatteras into North and South sub-units using the Hudson Canyon as the boundary. The Panel agrees that evidence, particularly from tagging and observed differences in recruitment patterns within sub-units provides a good basis for this choice of sub-units. There were several fishery components comprising both the commercial (bottom trawl, handline, pot and other) and the recreational fisheries and each was well described. Methods used for the calculation of discards and associated errors seem appropriate. Further work is required to characterize catch/discard uncertainty – either by assignment of error to each (at least annually), or through construction of alternative matrices that provide scenarios that account for that error for stock assessment sensitivity testing. Data filtering methods and index standardization procedures were not examined in detail for this review, but the information provided suggests that best-practice methods for these could be considered for review at a national level. Data collection associated with the fishery-independent trawl indices provide a good source of length and age data, and lengths are available from all surveys. There are very obvious differences in abundance trends in the north and south sub-units further justifying an area-based approach. Further work is encouraged to determine environmental factors affecting abundance of different life stages – particularly in an ecosystem context for the NW Atlantic region. Broad patterns of change across species complexes require characterization that may lead to co-variates useful to stock assessments. Apparent northward movement of the center of population abundance is consistent with range movement associated with climate change as observed globally, so further work on range shift across species in the region and implications for stock assessment also seems warranted.
6
Application of the ASAP model to each sub-unit was largely successful (including an account of catch exchange between sub-units), except that strong and opposing retrospective patterns are evident within each sub-unit. To examine the entire stock, results from the assessed sub-units are added together, and when this is done, some retrospective pattern remains, although not sufficient to move the current stock status out of the not overfished and not overfishing quadrant after application of a rho adjustment. The Panel accepted the SAW Working Group’s proposed base case and concurred that it provided a credible basis for providing management advice. Although presented as a preliminary model for information only, an SS3 model was constructed that allowed partitioning of annual recruitment levels differently to each sub-area annually, and potentially allowed for mixing among areas. This model did not exhibit a substantial retrospective pattern that would require rho adjustment. A comparison of overall SSB and recruitment trends of the SS3 model and the combined ASAP results for the north and south sub-units showed overall agreement. Biological reference points were calculated using results of the two-area stock assessments. The Panel agrees the BRPs calculated for black sea bass are appropriate. The Panel supports the conclusion of the SAW that the Black sea bass stock is not overfished and overfishing is not occurring. Findings for Witch flounder Methods for calculation of discards and associated errors seem appropriate. The magnitude of under-reported catch throughout the time series should be more fully assessed and documented. Using age-length keys on landings data from survey sources rather than those derived from landings age-length samples directly is problematic. If age samples are not available, it would be preferable to fit directly to the available length data by source. The spring and autumn NEFSC surveys are regarded as providing the best available fishery independent indices for this species and they show broadly similar patterns of a decline from the early 1960s to record low levels in the late 1980s and early 1990s, an increase to early 2000s followed by a declining trend. Dealer Report LPUE, Vessel Trip Report, Observer Program and Study Fleet were evaluated as potential fishery-dependent indices. The Panel agrees with the evaluations made, and the provision of the LPUE index using 40% filtering as an appropriate best candidate. The Panel also agrees that quantification of bias in the LPUE index is a difficult technical problem and that quantitative measures of some important influencing factors may not be available. Data filtering methods and index standardization procedures were not examined in detail for this review, but information provided suggests that best-practice methods for these could be considered for review at a national level. The sweep study provides a q estimate that can be applied to the NEFSC survey to determine absolute abundance, and the Panel agrees that this is an appropriate piece of information to use for constructing an abundance series for this species. The Panel rejected the SAW’s ASAP base model because the major retrospective pattern exhibited by the stock reconstruction was deemed unacceptable, and none of the sensitivity runs presented were considered to be an acceptable alternative as they also had major retrospective patterns or reflected unacceptable assumptions. Additionally, some of the alternative models had quite different abundance estimates or trends than the base model indicating results were not robust to the uncertain assumptions of the analysis.

7
Retrospective analysis is a good method for identifying model misspecification (as caused by inconsistencies in data or model structure), and the apparent data quality issues or model misspecification in the witch flounder assessment needs to be resolved (e.g., applying a model or multiple models that remove the pattern while using an objective basis for model selection). Rho-based bias adjustment is an ad hoc procedure that may not correct such retrospective problems in the long term and as such it may not always provide appropriate management advice. The Panel believes that the previously accepted VPA model is not an acceptable alternative to the rejected ASAP application because it exhibits a similar major retrospective pattern and the Panel recommends that the NEFMC SSC consider using the empirical approach discussed in the assessment document for use as the basis for developing management advice. The empirical analysis indicates stock biomass declined since 2002 although it appears to have stabilized in recent years.
The empirical approach, based on the NEFSCs spring and autumn surveys, calculates swept-area abundance incorporating results of the swept-area experiment. While absolute biomass estimates from this method will be highly uncertain (because of assumptions required in the conversion of survey catch rate to absolute estimates), the estimates of relative exploitation rates will be more robust to those uncertainties. The alternative empirical approach was used to determined biomass and exploitation rates, but not biological reference points. As a consequence, stock status is currently unknown.

8
1 Introduction 1.1 Background The 62nd Stock Assessment Review Committee (SARC) on assessments of Black sea bass (Centropristis striata) and Witch flounder (Glyptocephalus cynoglossus) met in the Aquarium Conference Room at NOAA’s Northeast Fisheries Science Center (NEFSC) in Woods Hole from Tuesday November 29 to Friday December 2, 2016. The meeting was chaired by Dr Patrick J. Sullivan from the New England Fisheries Management Council’s Scientific and Statistical Committee. The review panel (the Panel) was composed of three scientists appointed by the Center for Independent Experts: Vivian Haist, Neil Klaer, and Anders Nielsen. The SARC was assisted by the NEFSC Stock Assessment Workshop (SAW) Chairman, Dr James Weinberg, Ms Sheena Steiner, and Dr Chris Legault. Draft stock assessment reports as well as all associated background documents were made available via a public web site to the Panel on 11 November for Witch flounder and 15 November for Black sea bass prior to the review meeting. During the meeting, all documents were available electronically via the same web site, and additional documents and presentations made during the meeting were also posted there. 1.2 Review Activities A pre-review meeting on Tuesday morning of the Panel, Chair, Dr Weinberg and Dr Russell Brown (NEFSC) was held to discuss meeting logistics and reporting requirements. Time was taken after this meeting to assign draft reporting tasks among the Panel for working towards completion of a draft SARC 62 Summary Report by Friday. Terms of Reference (ToRs) were assigned according to broad categories: input data (N Klaer – ToRs 1-5 Black sea bass, ToRs 1-3 Witch flounder), stock assessment (V Haist – ToRs 5-8 Black sea bass, ToRs 4-6 Witch flounder), and projections and uncertainty (A Nielsen – ToRs 9-10 Black sea bass, ToRs 7-9 Witch flounder). The meeting generally followed the draft agenda and included presentations by representatives of the stock assessment teams: Dr Gary Shepherd for Black sea bass and Dr Susan Wigley for Witch flounder. The meeting was open to the public and was available also on live audio via the web. Discussion was mostly restricted to clarification during presentations with broader discussion at the conclusion of presentations. Rapporteur notes were taken throughout. There was limited time available for additional work outside the meeting, but several homework analyses were requested by the Panel and results were provided during the meeting. The Panel participated in the review of each TOR for the meeting. Further drafting and agreement on the Assessment Summary Report for both species was completed on Thursday with particular assistance from Gary Shepherd, John Maniscalco, Susan Wigley, Mark Terceio, Liz Brooks and Chris Legault. On the final day, the meeting draft Summary Report was compiled from Panel drafts and edited, with additional editing in following weeks.

9
The meeting atmosphere was congenial, the venue was excellent, and contributors to the meeting all did so in a professional and efficient manner, allowing the meeting work to be completed on-time and without contention.
10
2 Review of assessments of Black sea bass and Witch flounder The comments below refer to aspects that were examined during the meeting, but include my own additional commentary for preparation of this CIE report. 2.1 Findings by term of reference for Black sea bass 2.1.1 Summarize the conclusions of the February 2016 SSC peer review regarding the potential for spatial partitioning of the black sea bass stock. The consequences for the stock assessment will be addressed in TOR-6.) This TOR was met satisfactorily. A Mid-Atlantic Fisheries Management Council Scientific and Statistical Committee peer review approved the SAW Working Group recommended spatial partitioning of the black sea bass population north of Cape Hatteras into North and South sub-units using the Hudson Canyon as the boundary. The Panel agrees that evidence, particularly from tagging and observed differences in recruitment patterns within sub-units, provides a good basis for this choice of sub-units. It was also noted that there is some degree of mixing among units particularly due to movement of some Northern fish along the shelf in winter and caught in the Southern unit. 2.1.2 Estimate catch from all sources including landings and discards. Characterize the uncertainty in these sources of data. Evaluate available information on discard mortality and, if appropriate, update mortality rates applied to discard components of the catch. Describe the spatial and temporal distribution of fishing effort. This TOR was met satisfactorily. There were several components comprising both the commercial (bottom trawl, handline, pot and other) and the recreational fisheries and each was well described. Methods used for the calculation of discards and associated errors seem appropriate. Evidence for evaluation of errors in landings for commercial fleets should be assembled and quantified if possible. The major source of uncertainty influencing the stock assessment appears to derive from recreational catch, which is a significant component of the fishery, and the associated discard mortality. Fine-scale seasonal maps of trawl fishing catch by year and season provided a good way to demonstrate and visualize the spatial and temporal distribution of the commercial fishery catches. Methods used to construct trawl and non-trawl catch at age matrices combined and by sub-unit appear appropriate given the available data. Further work is required to characterize uncertainty – either by assignment of error (at least annually), or through construction of alternative matrices that provide scenarios that account for that error for stock assessment sensitivity testing (see research recommendations).

11
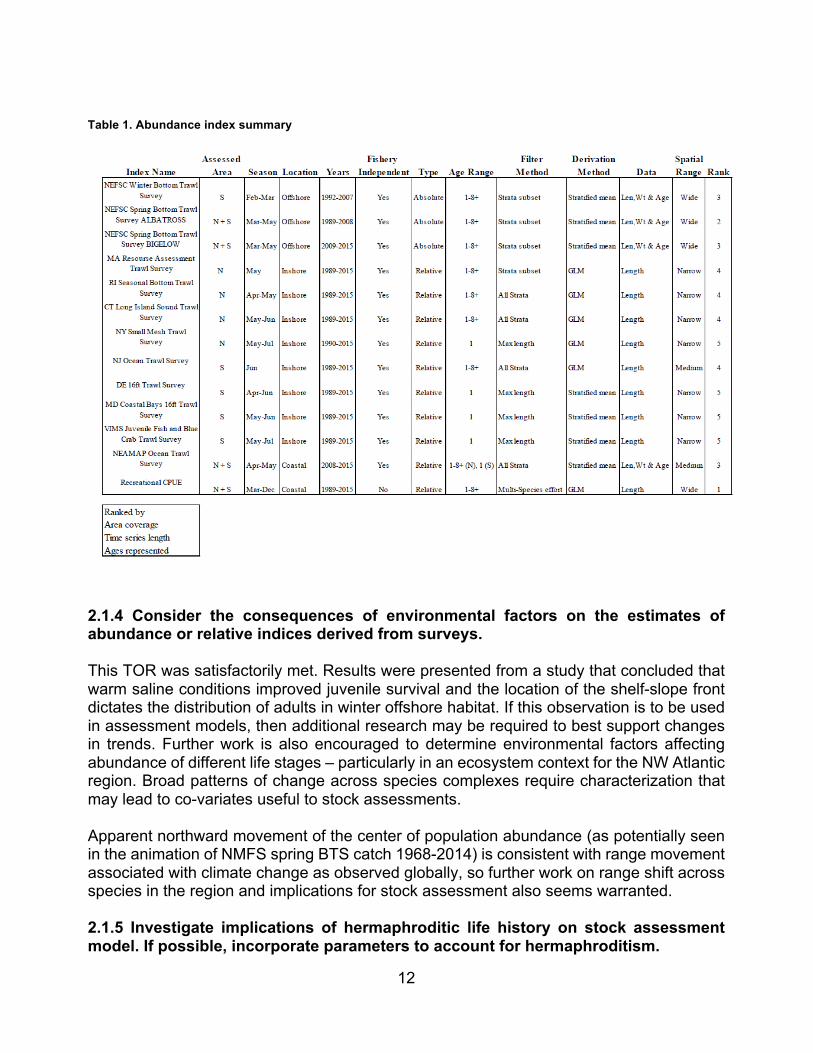
2.1.3 Present the survey data being used in the assessment (e.g., indices of abundance, recruitment, state surveys, age-length data, etc.). Investigate the utility of fishery dependent indices as a measure of relative abundance. Characterize the uncertainty and any bias in these sources of data. Evaluate model assumptions, estimates, and major sources of uncertainty. This TOR was met satisfactorily. There are many abundance indices and associated data sources. To assist review, a summary table describing important aspects of each index should be provided in future (the requested table is shown here as Table 1). The Panel suggests that a review of the a priori degree of bias in abundance indices as a ranking be conducted by a set of technical experts that best understands the nature of the input data. Such information would provide guidance for how they are best included into a stock assessment (if at all). The recreational catch per angler index is fishery-dependent, covers a wide stock area and catch age distribution and is judged a priori as the index that best corresponds to the population level (this index was ranked 1st among considered indices – see Table 1). Data filtering methods and index standardization procedures were not examined in detail for this review, but the information provided suggests that best-practice methods for these could be considered for review at a national level. Data collection associated with the fishery-independent trawl indices provide a good source of length and age data, and lengths are available from all surveys. As there are many indices that bridge the R/V Albatross/Bigelow change in the NEFSC index, a split of that index for this species seems justified. The NEFSC Albatross survey also covers a wide stock area and catch age distribution and was judged as the second most important index for modeling fitting purposes for this stock. There are very obvious differences in abundance trends in the North and South sub-units further justifying an area-based approach, as evidenced by the recreational catch per angler data (Figures A24 and A25 in the SAW62 Stock Assessment Report). While there is long term agreement in trends between indices, there is some conflict in trends and peak years among indices for ages 1-8+ and age 1 within the North and South sub-units (e.g., VIMS, MD, DE age 1 indices in the S, Figures A9-A11 in the SAW62 Stock Assessment Report). To assist future reviews, plots of normalized comparable indices within each assessed sub-unit should be provided. There is general agreement that a recent increase occurs in abundance in the North sub-unit in both the NEFSC Bigelow and recreational CPA.
12
Table 1. Abundance index summary
2.1.4 Consider the consequences of environmental factors on the estimates of abundance or relative indices derived from surveys. This TOR was satisfactorily met. Results were presented from a study that concluded that warm saline conditions improved juvenile survival and the location of the shelf-slope front dictates the distribution of adults in winter offshore habitat. If this observation is to be used in assessment models, then additional research may be required to best support changes in trends. Further work is also encouraged to determine environmental factors affecting abundance of different life stages – particularly in an ecosystem context for the NW Atlantic region. Broad patterns of change across species complexes require characterization that may lead to co-variates useful to stock assessments. Apparent northward movement of the center of population abundance (as potentially seen in the animation of NMFS spring BTS catch 1968-2014) is consistent with range movement associated with climate change as observed globally, so further work on range shift across species in the region and implications for stock assessment also seems warranted. 2.1.5 Investigate implications of hermaphroditic life history on stock assessment model. If possible, incorporate parameters to account for hermaphroditism.
13
This TOR was satisfactorily met. Results were presented of a simulation study of the effect of hermaphroditism appropriate to measures of spawning stock biomass (SSB) for stock assessment. The Panel agreed that use of combined male and female SSB was most appropriate for this species at this time. 2.1.6 Estimate annual fishing mortality, recruitment and stock biomass (both total and spawning stock), using measures that are appropriate to the assessment model, for the time series (integrating results from ToRs-1,-4, & -5 as appropriate), and estimate their uncertainty. Include a historical retrospective analysis and past projection performance evaluation to allow a comparison with most recent assessment results. This TOR was met satisfactorily and I agree with the comments in the summary report. The Panel accepted the SAW Working Group’s proposed base case and concurred that it provided a credible basis for providing management advice. ASAP is a forward-running age-structured assessment model from the NOAA toolbox that has a long history of use for stock assessments and is considered to be an appropriate method for species with compatible available data. The method has identical or similar input data requirements to VPA (catch-at-age, weight-at-age, abundance indices), has provided a good bridge from VPA to forward-running age-structured models, and has often been used for this purpose. Spatial sub-structuring is not explicitly handled, so if spatial sub-units are to be dealt with using ASAP, they are each modeled as separate independent populations. As part of the data preparation process, complete catch-at-age matrices for each fleet (for landings and discards if required) are constructed. Various rules are used to complete regions of these matrices that have known catch but little or no associated age or length composition samples. Such rules as applied to Black sea bass appear appropriate. There are good reasons (as also highlighted by previous reviews) to consider modeling the north and south sub-units separately – principally the apparent differences in abundance trends and appearance of strong year classes in composition data between the areas. Application of the ASAP model to each sub-unit was largely successful (including an account of catch exchange between sub-units), except that strong and opposing retrospective patterns are evident within each sub-unit. To examine the entire stock, results from the assessed sub-units are added together, and when this is done, some retrospective pattern remains, although not sufficient to move the current stock status out of the not overfished and not overfishing quadrant after application of a rho adjustment. Stock Synthesis (currently SS3) is also available from the NOAA toolbox and allows spatial sub-units within a single assessed population, and does not require the data preparation step of construction of comprehensive catch-at-age matrices. Although presented as a preliminary model for information only, an SS3 model was constructed that allowed
14
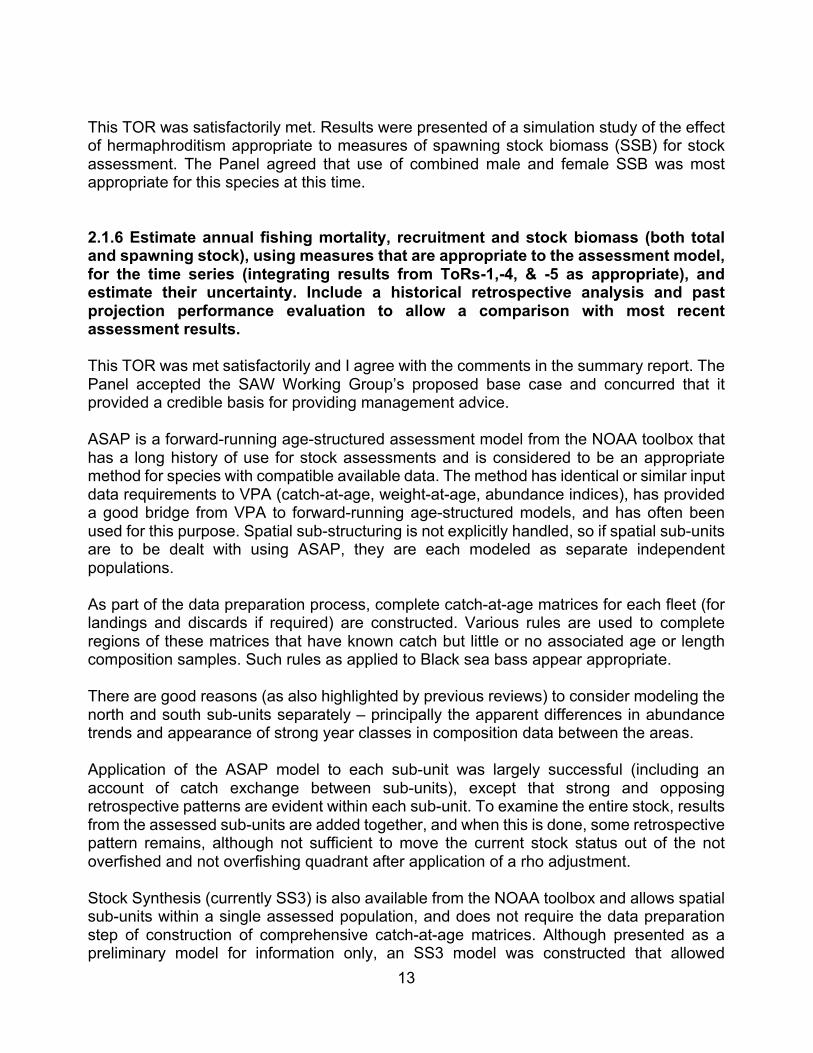
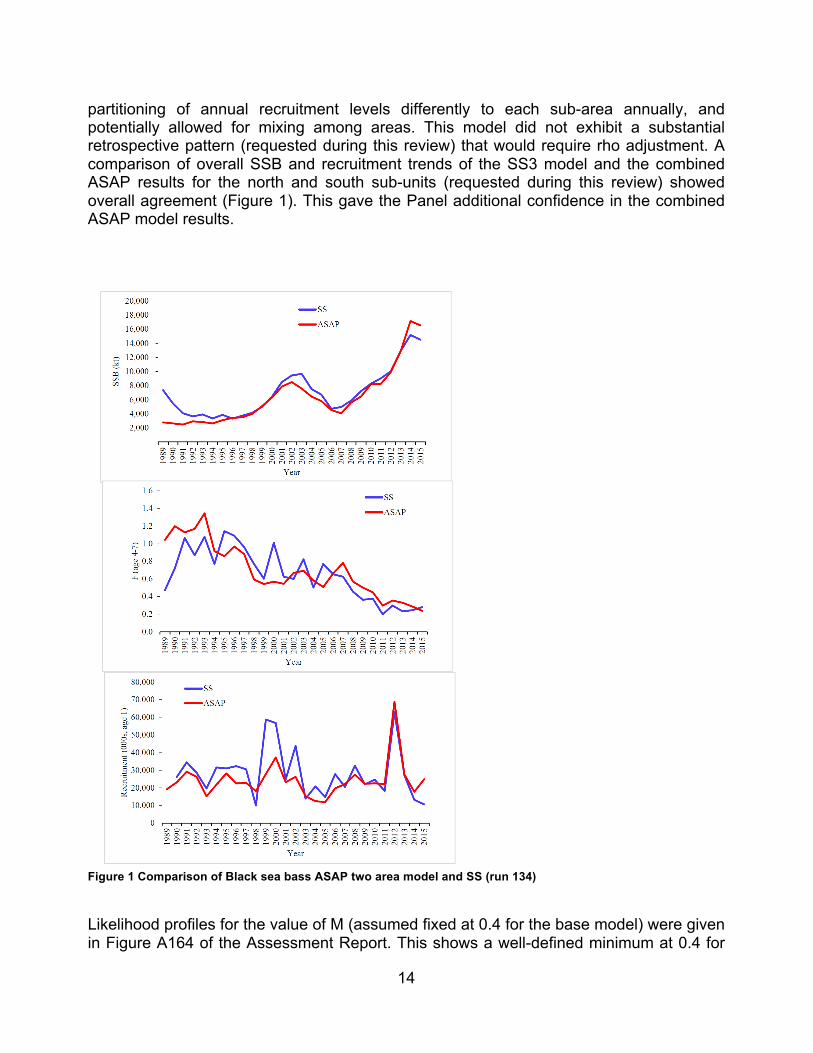
partitioning of annual recruitment levels differently to each sub-area annually, and potentially allowed for mixing among areas. This model did not exhibit a substantial retrospective pattern (requested during this review) that would require rho adjustment. A comparison of overall SSB and recruitment trends of the SS3 model and the combined ASAP results for the north and south sub-units (requested during this review) showed overall agreement (Figure 1). This gave the Panel additional confidence in the combined ASAP model results.
Figure 1 Comparison of Black sea bass ASAP two area model and SS (run 134)
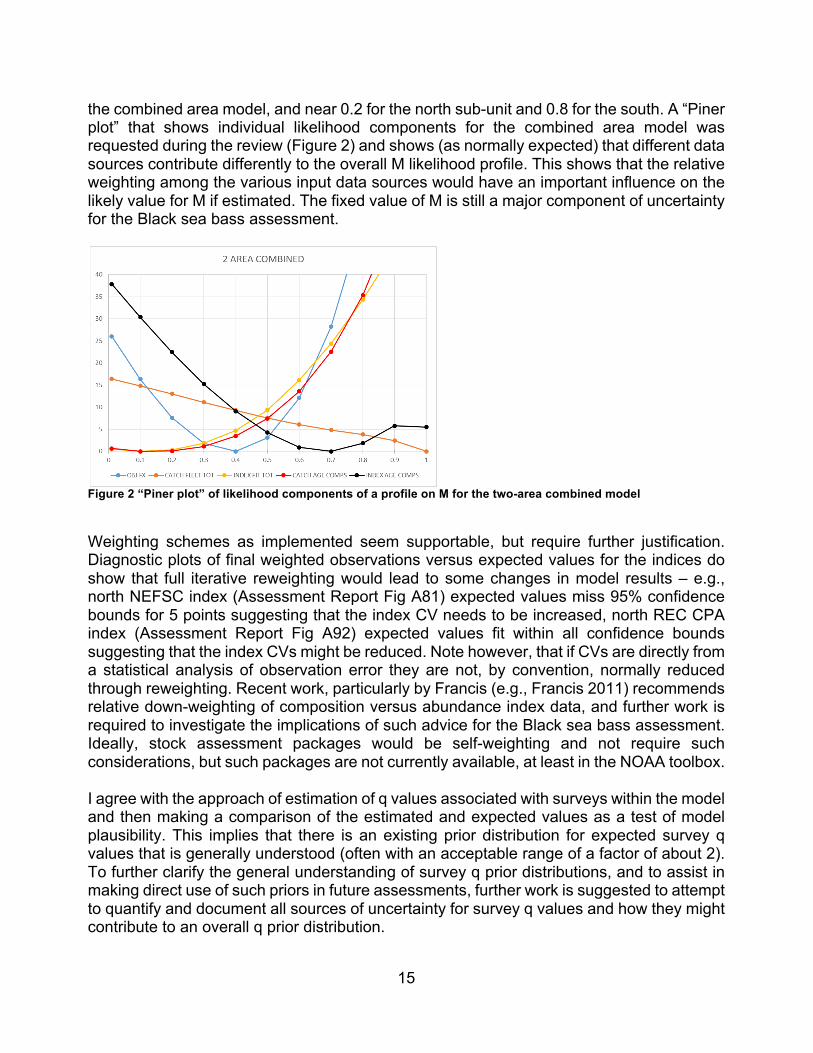
Likelihood profiles for the value of M (assumed fixed at 0.4 for the base model) were given in Figure A164 of the Assessment Report. This shows a well-defined minimum at 0.4 for
15
the combined area model, and near 0.2 for the north sub-unit and 0.8 for the south. A “Piner plot” that shows individual likelihood components for the combined area model was requested during the review (Figure 2) and shows (as normally expected) that different data sources contribute differently to the overall M likelihood profile. This shows that the relative weighting among the various input data sources would have an important influence on the likely value for M if estimated. The fixed value of M is still a major component of uncertainty for the Black sea bass assessment.
Figure 2 “Piner plot” of likelihood components of a profile on M for the two-area combined model
Weighting schemes as implemented seem supportable, but require further justification. Diagnostic plots of final weighted observations versus expected values for the indices do show that full iterative reweighting would lead to some changes in model results – e.g., north NEFSC index (Assessment Report Fig A81) expected values miss 95% confidence bounds for 5 points suggesting that the index CV needs to be increased, north REC CPA index (Assessment Report Fig A92) expected values fit within all confidence bounds suggesting that the index CVs might be reduced. Note however, that if CVs are directly from a statistical analysis of observation error they are not, by convention, normally reduced through reweighting. Recent work, particularly by Francis (e.g., Francis 2011) recommends relative down-weighting of composition versus abundance index data, and further work is required to investigate the implications of such advice for the Black sea bass assessment. Ideally, stock assessment packages would be self-weighting and not require such considerations, but such packages are not currently available, at least in the NOAA toolbox. I agree with the approach of estimation of q values associated with surveys within the model and then making a comparison of the estimated and expected values as a test of model plausibility. This implies that there is an existing prior distribution for expected survey q values that is generally understood (often with an acceptable range of a factor of about 2). To further clarify the general understanding of survey q prior distributions, and to assist in making direct use of such priors in future assessments, further work is suggested to attempt to quantify and document all sources of uncertainty for survey q values and how they might contribute to an overall q prior distribution.
16
2.1.7 Estimate biological reference points (BRPs; point estimates or proxies for BMSY, BTHRESHOLD, FMSY, and MSY), including defining BRPs for spatially explicit areas if appropriate, and provide estimates of their uncertainty. If analytic model-based estimates are unavailable, consider recommending alternative measurable proxies for BRPs. Comment on the appropriateness of existing BRPs and the “new” (i.e., updated, redefined, or alternative) BRPs. This TOR was met satisfactorily. Biological reference points were calculated using results of the two-area stock assessments. Reference points were calculated separately for the Northern and Southern sub-units, and biomass metrics summed and fishing mortality metrics averaged across the sub-units. Given uncertainty in the stock recruitment relationship, F40% was chosen as a proxy for the FMSY reference point and spawning stock biomass at F40% (SSB40%) as the proxy for the stock biomass target reference point. Uncertainty in the BRPs, estimated using an MCMC algorithm, reflects uncertainty associated with the base assessment models but does not reflect the additional uncertainty associated with model misspecification or structural uncertainty. The Panel agrees the BRPs calculated for black sea bass are appropriate. No BRPs existed for this stock under the previous assessment. Conveyance of model and projection uncertainty to management is currently built around the selection of a single best model, and the characterization of uncertainty with respect to that model, without accounting for model structural uncertainty. Model structural uncertainty is due to the necessarily simple assumptions in an assessment model relative to the more complex and unknowable complexity of the actual real-world fish population. Alternative simplifying assumptions made for the base case (e.g., fixing certain parameter values at point estimates, inclusion of particular abundance indices, selection of relative weighting for available data sets) can provide a range of plausible alternative values, and can result in a number of plausible alternative models. Provided that the relative plausibility of alternative models can be factored into weighting of the alternative models, a suite of plausibility-weighted models can provide information on the additional uncertainty not captured by the base case. Model structural uncertainty is normally large in comparison to within-model uncertainty as estimated by MCMC, etc., and should be considered when providing information about model uncertainty to management. Rice and Harley (2013) provide an example of a somewhat systematic exploration of model structural uncertainty and implications for stock status. 2.1.8 Evaluate overall stock status with respect to a new model or new models that considered spatial units developed for this peer review. This TOR was met satisfactorily. The Panel supports the conclusion of the SAW that the black sea bass stock is not overfished and overfishing is not occurring. The Panel believed that the use of the rho-adjustment was reasonable because of the cancelling effect when area sub-units were combined and the adjustments did not influence the status of the stock determination when applied. The consistency among stock reconstructions from alternative
17
formulations of the ASAP model and from an alternative model (SS3) suggest that these results will be robust to uncertainties associated to modeling assumptions. 2.1.9 Evaluate overall stock status with respect to a new model or new models that considered spatial units developed for this peer review.
a. Provide numerical annual projections (3-5 years) and the statistical distribution (e.g., probability density function) of the OFL (overfishing level) that fully incorporates observation, process and model uncertainty (see Appendix to the SAW ToRs). Each projection should estimate and report annual probabilities of exceeding threshold BRPs for F, and probabilities of falling below threshold BRPs for biomass. Use a sensitivity analysis approach in which a range of assumptions about the most important uncertainties in the assessment are considered (e.g., terminal year abundance, variability in recruitment, and definition of BRPs for black sea bass).
b. Comment on which projections seem most realistic. Consider major uncertainties in the assessment as well as the sensitivity of the projections to various assumptions.
c. Describe this stock’s vulnerability (see “Appendix to the SAW ToRs”) to becoming overfished, and how this could affect the choice of ABC.
The panel concluded that this TOR was completed satisfactorily. Short term projections were carried out for each area sub-unit and results were summed to get projections for the combined stock. This is consistent with the accepted model. The uncertainty in the final year's estimate is represented by an MCMC sample from its posterior distribution. The recruits used in the projections are sampled from the smoothed empirical distribution of estimated recruits in the period 2000-2015. The estimation uncertainty and recruitment process uncertainty are propagated through in the projections. The statistical distributions of the projected quantities are summarized by their means and standard deviations. We note that the TOR might be even better addressed if the probabilities of SSB below the threshold in the projected years were directly provided. Projections are carried out for two fishing scenarios, F at status quo and F at the proxy FMSY. Model sensitivities were explored by comparing projections with and without rho-adjustment and a projection from the overall combined model. We note that the sensitivities could be further examined using short term projections supplied for the model sensitivity runs. The SAW report indicates that the rho-adjustment seems most realistic. The Panel notes that even though projections are conducted for each sub-unit, the combined projections should only be used, because of the major retrospective issues seen within each sub-unit. 2.1.10 Review, evaluate and report on the status of the SARC and Working Group research recommendations listed in recent SARC reviewed assessments and review panel reports. Identify new research recommendations.

18
The panel concluded that this TOR was completed satisfactorily. The research recommendations from recent assessments are listed in the SAW report and progress on each recommendation is described. Further research recommendations from the SAW are put forward. The existing recommendations include: multiple age-structured models, species specific surveys, expand tagging, genetic studies, sex-change research, age reading validation, climate impacts, study catchability in gear types, investigate social and spawning dynamics, habitat studies, and evaluate use of industry samples. The SAW expressed concern about how to convince managers about their estimated uncertainty levels. To address this, the following two research recommendations are made: 1) Research into using self-weighting models. Uncertainty estimates of estimated quantities are obtained by propagating observation uncertainties through the models. When observation uncertainties are subjectively assigned, then so are the uncertainties of the results. 2) Application of prediction based methods to validate that actual prediction uncertainties correspond to estimated prediction uncertainties. In addition, I include for consideration the following as potential additional areas of future research:
• Evidence for evaluation of errors in landings for commercial fleets should be assembled and quantified if possible. This may be accomplished either by assignment of annual error to catch, or through construction of alternative catch-at-age matrices that provide scenarios that account for that error for stock assessment sensitivity testing. These might be considered (for simplicity here) as components of model structural uncertainty.
• Data filtering methods and index standardization procedures were not examined in
detail for this review, but the information provided suggests that best-practice methods for these could be considered for review at a national level. For example, there seems to be some inconsistency among various US stock assessment regions in filtering methods applied to similar or identical data sources (e.g., methods to select species “target” records from multi-species trips).
• Results were presented from a study that concluded that warm saline conditions
improved juvenile survival and the location of the shelf-slope front dictates the distribution of adults in winter offshore habitat. If this observation is to be used in assessment models, then additional research may be required to best support changes in trends. Further work is also encouraged to determine environmental factors affecting abundance of different life stages – particularly in an ecosystem context for the NW Atlantic region. Broad patterns of change across species complexes require characterization that may lead to co-variates useful to stock assessments.
• Apparent northward movement of the center of population abundance is consistent
with range movement associated with climate change as observed globally, so further work on range shift across species in the region and implications for stock assessment also seems warranted.
19
• Resolution of model bias as indicated by retrospective patterns requires the
construction of alternative plausible hypotheses for the cause of such bias and the construction of corresponding alternative models. An approach that allows quick formulation of alternative models is to use a modeling framework that allows many additional flexibilities – particularly with regard to spatial sub-structuring or time-varying processes. An available framework with such flexibility is Stock Synthesis, and work to continue model exploration using such a flexible framework is encouraged.
• Recent work, particularly by Francis (e.g., Francis 2011) recommends relative down-
weighting of composition versus abundance index data, and further work is required to investigate the implications of such advice for the Black sea bass assessment.
• To further clarify the general understanding of survey q prior distributions, and to assist in making direct use of such priors in future assessments, further work is suggested to attempt to quantify and document all sources of uncertainty for survey q values and how they might contribute to an overall q prior distribution.
• Conveyance of model and projection uncertainty to management is currently built
around the selection of a single best model, and the characterization of uncertainty with respect to that model, without accounting for model structural uncertainty. Investigation of procedures for inclusion of structural uncertainty in management advice is recommended.
20
2.2 Findings by term of reference for Witch flounder 2.2.1 Estimate catch from all sources including landings and discards. Describe the spatial and temporal distribution of landings, discards, and fishing effort. Characterize the uncertainty in these sources of data. The panel concluded that this TOR was generally completed satisfactorily as discussed below. The majority of the witch flounder catch was taken with otter trawl gear from the western Gulf of Maine and central basin and from deeper waters of the South Channel – principally in waters off the Maine and Massachusetts coast. A large decline in large market category fish occurred in the late 1980s. A reduction in catch over a long period from the Maine region appears to be heavily affected by changes in fisheries regulations (closures and catch restrictions). Methods for calculation of discards and associated errors seem appropriate. Evidence for evaluation of errors in landings for commercial fleet should be gathered and quantified if possible. Major sources of catch uncertainty are currently derived mainly from estimates of discards. However, while uncertainty in under-reported catch exists, it is not quantified. The magnitude of under-reported catch throughout the time series should be more fully assessed and documented. Using age-length keys on landings data from survey sources rather than those derived from landings age-length samples directly is problematic. If age samples are not available, it would be preferable to fit directly to the available length data by source. 2.2.2 Present available federal, state, and other survey data, indices of relative or absolute abundance, recruitment, etc. Characterize the uncertainty and any bias in these sources of data and compare survey coverage to locations of fishery catches. Select the surveys and indices for use in the assessment. The Panel concluded that this TOR was completed satisfactorily. The spring and autumn NEFSC surveys are regarded as providing the best available fishery independent indices for this species and they show broadly similar patterns of a decline from the early 1960s to record low levels in the late 1980s and early 1990s, an increase to early 2000s followed by a declining trend. These surveys were combined across the Albatross-Bigelow transition period using a constant calibration factor. Pre-recruit indices are provided by the ASMFC and MENH surveys. Dealer Report LPUE, Vessel Trip Report, Observer Program and Study Fleet were evaluated as potential fishery-dependent indices. The Panel agrees with the evaluations made, and the provision of the LPUE index using 40% filtering as an appropriate best candidate. Many reasons for why such a series may be biased (e.g., under reporting) were given, although as noted during public comment, little quantified evidence to support the degree of bias was provided. The Panel agrees that the purpose of gathering fishery-independent series (such as the NEFSC) is to avoid such biases that are likely to be present in fishery-dependent indices. The Panel also agrees that quantification of bias in the LPUE index is a difficult technical problem and that quantitative measures of some important influencing factors may not be available. However, including LPUE in a sensitivity run, for example, might highlight how the fleet’s perception of stock trends compares to model derived population trends, which might facilitate discussion with stakeholders. Perhaps including a time varying trend in selectivity and catchability for the fleet might allow this data to be usefully included into an assessment.
21
Data filtering methods and index standardization procedures were not examined in detail for this review, but information provided suggests that best-practice methods for these could be considered for review at a national level. This applies particularly to the potential inclusion of LPUE data, for example. The sweep study provides a q estimate that can be applied to the NEFSC survey to determine absolute abundance and the Panel agrees that this is an appropriate piece of information to use for constructing an abundance series for this species. However, several assumptions are required to scale to the absolute values and care should be taken in evaluating these assumptions. For survey vessel calibration, consider including a prior representing the vessel comparison information when fitting these separate time series into the model or even including the calibration data explicitly into the model. Comparing the prior to the posterior estimates could prove fruitful in determining the efficacy of the calibration. 2.2.3 Investigate effects of environmental factors and climate change on recruitment, growth and natural mortality of witch flounder. If quantifiable relationships are identified, consider incorporating these into the stock assessment. The panel concluded that this TOR was completed satisfactorily. Further work is encouraged to determine how environmental factors affect abundance at different life history stages – particularly in an ecosystem context for the NW Atlantic region. Broad patterns of change across species complexes require global characterizations that may lead to finding co-variates that are useful for informing stock assessments. 2.2.4 Estimate annual fishing mortality, recruitment and stock biomass (both total and spawning stock) for the time series (integrating results from TOR-3 if appropriate), and estimate their uncertainty. Include a historical retrospective analysis to allow a comparison with previous assessment results and previous projections. Compare F’s and SSB’s that were projected during the previous assessment to their realized values. This TOR was met. However, because the analytical assessment was rejected, reporting on some of these metrics is not possible. The Panel rejected the SAWs ASAP base model because the major retrospective pattern exhibited by the stock reconstruction was deemed unacceptable, and none of the sensitivity runs presented were considered to be an acceptable alternative as they also had major retrospective patterns or reflected unacceptable assumptions. Additionally, some of the alternative models had quite different abundance estimates or trends than the base model indicating results were not robust to the uncertain assumptions of the analysis. Other problems with the assessment, that would in themselves not have been reason for rejecting the model, included: strong and common patterns in residuals (positive residuals for most of the final 15 years of the time series) for the fits to abundance survey indices
22
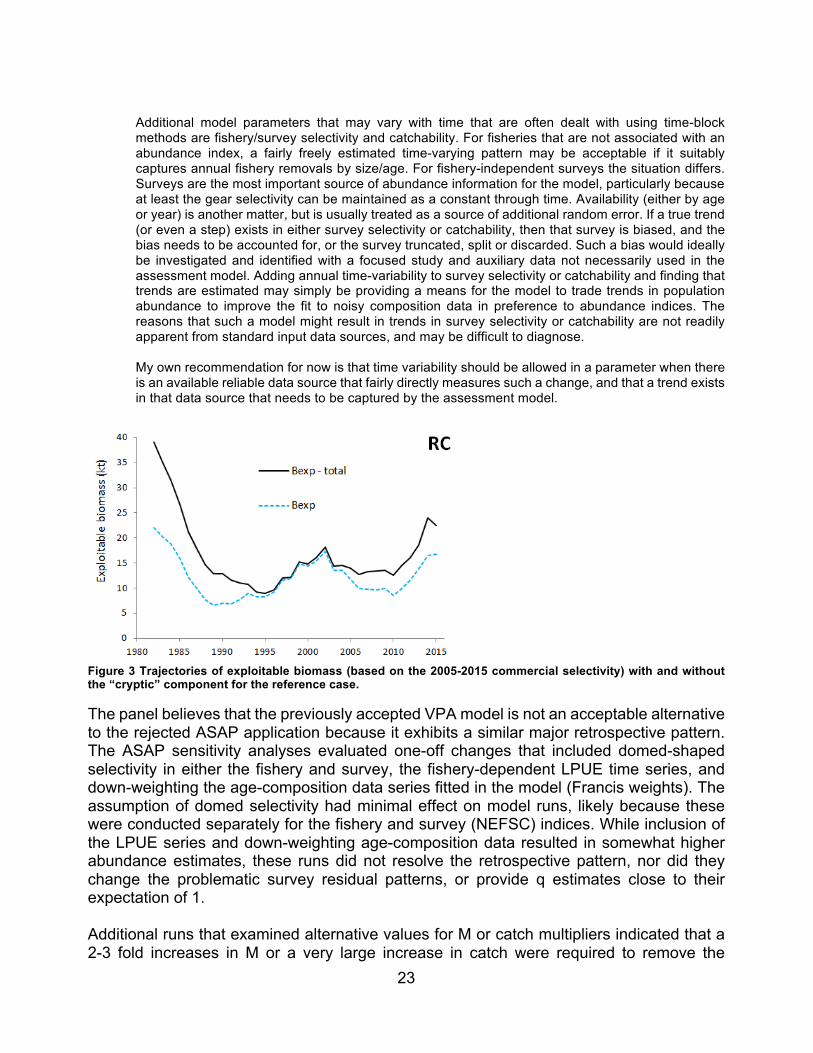
(NEFSC spring and autumn surveys and ASMFC survey) and catchability estimates of about 4 for the NEFSC surveys, which had an expectation of 1 based on the area swept study. Retrospective analysis is a good method for identifying model misspecification (as caused by inconsistencies in data or model structure) and the apparent data quality issues or model misspecification in the witch flounder assessment needs to be resolved (e.g., applying a model or multiple models that remove the retrospective pattern while using an objective basis for model selection). Rho-based bias adjustment is an ad hoc procedure that may not correct such retrospective problems in the long term, and as such it may not always provide for appropriate management advice. It is easy to say that further model structural exploration should be pursued in order to find alternatives that do not exhibit a strong retrospective pattern. I agree that this has already been fairly extensively attempted for Witch flounder – to an extreme of grid searching in multiple dimensions in terms of the extent of the retrospective bias. I have not seen work on retrospectives done more thoroughly elsewhere. However, several additional potential directions were shown by work provided as individual comment by Butterworth and Rademeyer – specifically the possibility of domed selectivity, the inclusion of the LPUE times series, and objectively-based down-weighting of the contribution to the likelihood of the CAA data (also examined separately as sensitivities for the ASAP model). There is often a concern that dome selectivity may lead to large levels of cryptic (usually spawning) biomass that can be difficult to justify without supporting evidence. An examination was requested during the review of the proportion of cryptic biomass generated by the Butterworth and Rademeyer reference case, and that proportion was significant at least at the start and end of the period assessed (Figure 3). Of course, a usual alternative to dome selectivity is to allow increased natural mortality at older ages, as also noted by Butterworth and Rademeyer. The main use of these alternative models for the review was however, to point out that it is possible to construct a number of alternative and potentially combined hypotheses and associated models that show at least less pronounced retrospective patterns and potentially improved fit to available data. Further work along these lines for Witch flounder is encouraged. A known possible cause of retrospective patterns is the treatment of a time-varying process as time-invariant. I have participated in other reviews that have grappled with how far to go with the introduction of time-varying processes in assessment models, so I also add my own previous thoughts regarding that here for information:
The only population biological parameter allowed to vary with time in most stock assessments is annual recruitment levels. Cumulative information on annual recruitment strength is provided fairly directly by composition data, so the reasons especially for high peaks and troughs in recruitment are usually apparent in the available data. It has also been recognized that other parameters are likely to vary through time – in particular natural mortality, but also growth and maturity. For natural mortality, it has been considered difficult to estimate time trends in changes without strong independent estimates for those changes, such as from ecosystem studies showing differences in predator abundance, and that time trends in M are difficult to disentangle from other factors such as catch mis-specification (e.g. see Brodziak et al., 2011). Allowing time variation in factors that directly affect productivity also leads to questions about choice of appropriate time periods for the selection of management reference points, and how to make appropriate stock projections.
23
Additional model parameters that may vary with time that are often dealt with using time-block methods are fishery/survey selectivity and catchability. For fisheries that are not associated with an abundance index, a fairly freely estimated time-varying pattern may be acceptable if it suitably captures annual fishery removals by size/age. For fishery-independent surveys the situation differs. Surveys are the most important source of abundance information for the model, particularly because at least the gear selectivity can be maintained as a constant through time. Availability (either by age or year) is another matter, but is usually treated as a source of additional random error. If a true trend (or even a step) exists in either survey selectivity or catchability, then that survey is biased, and the bias needs to be accounted for, or the survey truncated, split or discarded. Such a bias would ideally be investigated and identified with a focused study and auxiliary data not necessarily used in the assessment model. Adding annual time-variability to survey selectivity or catchability and finding that trends are estimated may simply be providing a means for the model to trade trends in population abundance to improve the fit to noisy composition data in preference to abundance indices. The reasons that such a model might result in trends in survey selectivity or catchability are not readily apparent from standard input data sources, and may be difficult to diagnose. My own recommendation for now is that time variability should be allowed in a parameter when there is an available reliable data source that fairly directly measures such a change, and that a trend exists in that data source that needs to be captured by the assessment model.
Figure 3 Trajectories of exploitable biomass (based on the 2005-2015 commercial selectivity) with and without the “cryptic” component for the reference case.
The panel believes that the previously accepted VPA model is not an acceptable alternative to the rejected ASAP application because it exhibits a similar major retrospective pattern. The ASAP sensitivity analyses evaluated one-off changes that included domed-shaped selectivity in either the fishery and survey, the fishery-dependent LPUE time series, and down-weighting the age-composition data series fitted in the model (Francis weights). The assumption of domed selectivity had minimal effect on model runs, likely because these were conducted separately for the fishery and survey (NEFSC) indices. While inclusion of the LPUE series and down-weighting age-composition data resulted in somewhat higher abundance estimates, these runs did not resolve the retrospective pattern, nor did they change the problematic survey residual patterns, or provide q estimates close to their expectation of 1. Additional runs that examined alternative values for M or catch multipliers indicated that a 2-3 fold increases in M or a very large increase in catch were required to remove the
24
retrospective pattern and were considered implausible. An SCAA model analysis was considered during the SAW and further analyses were provided during the public comment period of the SARC peer review meeting. This work helped identify other model configurations that might be usefully explored in the future provided that the assumptions used in creating them are valid. The Panel recommends that the NEFMC SSC consider using the empirical approach discussed in the assessment document for use as the basis for developing management advice. The empirical analysis indicates stock biomass declined since 2002 although appears to have stabilized in recent years. Because both the VPA and ASAP age-structured model applications were rejected, there is no basis for conducting a historical retrospective analysis, or to compare F’s and SSB’s that were estimated or projected during previous assessments. 2.2.5 State the existing stock status definitions for “overfished” and “overfishing”. Then update or redefine biological reference points (BRPs; point estimates or proxies for BMSY, BTHRESHOLD, FMSY and MSY) and provide estimates of their uncertainty. If analytic model- based estimates are unavailable, consider recommending alternative measurable proxies for BRPs. Comment on the scientific adequacy of existing BRPs and the “new” (i.e., updated, redefined, or alternative) BRPs. This TOR was met. However, because the analytical assessment was rejected, reporting on some of these metrics is not possible. Because of major retrospective patterns, the Panel rejected the analytical assessment conducted for the SARC review as well as the previous VPA model, so there is no basis for calculating model-based reference points. Regarding the biological reference points estimated in the 2015 assessment update, these reference points were based on results of a VPA model that was rejected during the SARC 62 peer review process. The Panel supports the SAWs proposed alternative to use an FMSY proxy of a relative exploitation of 0.05 in the near term, where other alternatives are unavailable. The basis of this value is ad hoc, calculated as the average of the most recent 9 years of estimated relative exploitation rates from the empirical approach. Over that period stock abundance was relatively stable. The empirical approach, based on the NEFSCs spring and autumn surveys, calculates swept-area abundance incorporating results of the swept-area experiment. While absolute biomass estimates from this method will be highly uncertain (because of assumptions required in the conversion of survey catch rate to absolute estimates), the estimates of relative exploitation rates will be more robust to those uncertainties. The SARC did not have time to fully review this approach in comparison to other data poor procedures or to the Terms of Reference provided for the meeting. The Panel does not recommend using the F40% approach for catch advice because the assessment basis for that value has been rejected.
25
2.2.6 Evaluate stock status with respect to the existing model (from previous peer reviewed accepted assessment) and with respect to a new model (or possibly models, in accord with guidance in attached “Appendix to the SAW Assessment ToRs”) developed for this peer review. In both cases, evaluate whether the stock is rebuilt.
a. When working with the existing model, update it with new data and evaluate stock status (overfished and overfishing) with respect to the updated BRP estimates. The Panel rejected the existing VPA model with current data for the same reasons discussed for the other age-structured analyses discussed above, so there is no basis for evaluating stock status relative to updated BRP estimates.
b. Then use the newly proposed model (or possibly models, in accord with guidance in “Appendix to the SAW Assessment ToRs”) and evaluate stock status with respect to “new” BRPs and their estimates (from TOR-5). The assessment model application was rejected due to a major retrospective pattern; therefore, an alternative empirical approach was used to determined biomass and exploitation rates, but not biological reference points. As a consequence, stock status is currently unknown.
2.2.7 Develop approaches and apply them to conduct stock projections.
a. Provide numerical annual projections (3 years) and the statistical distribution (e.g., probability density function) of the catch at FMSY or an FMSY proxy (i.e. the overfishing level, OFL) (see Appendix). Each projection should estimate and report annual probabilities of exceeding threshold BRPs for F, and probabilities of falling below threshold BRPs for biomass. Use a sensitivity analysis approach in which a range of assumptions about the most important uncertainties in the assessment are considered (e.g., terminal year abundance, magnitude and variability in recruitment).
b. Comment on which projections seem most realistic. Consider the major uncertainties in the assessment as well as sensitivity of the projections to various assumptions. Identify reasonable projection parameters (recruitment, weight-at- age, retrospective adjustments, etc.) to use when setting specifications.
c. Describe this stock’s vulnerability to becoming overfished, and how this could affect the choice of ABC. The choice takes scientific uncertainty into account (see Appendix).
This TOR was met. However, because the analytical assessment was rejected reporting on some of these metrics is not possible. The alternative empirical area-swept method does
26
not offer projections, as it contains no process model for the stock dynamic, which is needed for short-term and long-term projections. The empirical area-swept method does not provide a biomass threshold, but does indicate that the stock is at low historical levels. 2.3.9 Review, evaluate and report on the status of research recommendations from the last peer reviewed benchmark stock assessment. Identify new research recommendations. The panel concluded that this TOR was completed satisfactorily. The research recommendations from previous benchmarks are listed in the SAW assessment report and progress on each recommendation is described. Further research recommendations from the SAW are put forward. Existing recommendations include: refining calibration factors, examine mean weight trends, research in causes for retrospective patterns, aging archived samples, stock identification, tagging, larval index, environmental/habitat preferences, influence of age-composition data, spatial modelling, and investigate plausible M changes. The panel noted and support that many of the recommendations relate to solving the major retrospective issue. This issue is seen in many stocks in the region, so any insight gained here would be widely beneficial. The panel recommends that this issue be addressed as a research track topic. Focus should be on identifying causes that could lead to such retrospective patterns, and then on evaluating how plausible each potential cause is. A list of scenarios to consider could include: time evolving or mis-specified: catchability, selectivity, natural mortality, misreporting, or age assignment. The scenarios could be constructed via simulations to validate that they could cause such retrospective patterns. When evaluating how plausible each scenario is for the real data, it may be useful to run prediction-based validations (estimate from one part of the data and predict the remaining). The panel is aware that this is a large undertaking and assessment history in the region shows that no quick fixes should be expected. In addition, I include for consideration the following as potential additional areas of future research:
• Evidence for evaluation of errors in landings for commercial fleets should be assembled and quantified if possible. This may be accomplished either by assignment of annual error to catch, or through construction of alternative catch-at-age matrices that provide scenarios that account for that error for stock assessment sensitivity testing. These might be considered (for simplicity here) as components of model structural uncertainty.
• Data filtering methods and index standardization procedures were not examined in
detail for this review, but the information provided suggests that best-practice methods for these could be considered for review at a national level. For example, there seems to be some inconsistency among various US stock assessment regions in filtering methods applied to similar or identical data sources (e.g., methods to select species “target” records from multi-species trips).
27
• Further work is encouraged to determine environmental factors affecting abundance of different life stages – particularly in an ecosystem context for the NW Atlantic region. Broad patterns of change across species complexes require characterization that may lead to co-variates useful to stock assessments.
• Resolution of model bias as indicated by retrospective patterns requires the construction of alternative plausible hypotheses for the cause of such bias and the construction of corresponding alternative models. An approach that allows quick formulation of alternative models is to use a modeling framework that allows many additional flexibilities – particularly with regard to spatial sub-structuring or time-varying processes. An available framework with such flexibility is Stock Synthesis, and work to continue model exploration using such a flexible framework is encouraged.
• To further clarify the general understanding of survey q prior distributions, and to
assist in making direct use of such priors in future assessments, further work is suggested to attempt to quantify and document all sources of uncertainty for survey q values and how they might contribute to an overall q prior distribution.
• Conveyance of model and projection uncertainty to management is currently built
around the selection of a single best model, and the characterization of uncertainty with respect to that model, without accounting for model structural uncertainty. Investigation of procedures for inclusion of structural uncertainty in management advice is recommended.
28
References Brodziak, J., Ianelli, J., Lorenzen, K. and Methot, R.D. 2011. Estimating Natural Mortality in Stock Assessment Applications. NOAA Technical Memorandum NMFS-F/SPO-199. Francis, R. I. C. C. 2011. Data weighting in statistical fisheries stock assessment models. Canadian Journal of Fisheries and Aquatic Sciences 68:1124–1138. Rice J. and S. Harley. 2013. Updated stock assessment of silky sharks in the western and central Pacific Ocean. Paper WCPFC-SC9-2013/ SA-WP-03 to the Ninth Regular Session of the Scientific Committee, Western and Central Pacific Fisheries Committee, Pohnpei, Federated States of Micronesia, 6-14 August 2013. 71 pp.

29
Annex 1: Bibliography of materials provided for review BlackSeaBass
BackgroundPapers
BlaylockJ,ShepherdGR.2016.Evaluatingthevulnerabilityofanatypicalprotogynoushermaphroditetofisheryexploitation:resultsfromapopulationmodelforblackseabass(Centropristisstriata).FishBull.114:476–489.
BrooksENetal.2008.Stockassessmentofprotogynousfish:evaluatingmeasuresofspawningbiomassusedtoestimatebiologicalreferencepoints.FishBull.106:12–23.
KeigwinB,ShepherdGR,WuenschelMJ.2016.Geomorphometricanalysisindicatesoverlapinbodyshapebetweensexesofblackseabass(Centropristisstriata).USDeptCommer,NortheastFishSciCentRefDoc.16-07;26p.
MillerAS,ShepherdGR,FratantoniPS.2016.OffshoreHabitatPreferenceofOverwinteringJuvenileandAdultBlackSeaBass,Centropristisstriata,andtheRelationshiptoYear-ClassSuccess.PLoSONE11(1):19p.
MoserJ,ShepherdGR.2009.SeasonalDistributionandMovementofBlackSeaBass(Centropristisstriata)intheNorthwestAtlanticasDeterminedfromaMark-RecaptureExperiment.JNorthwAtlFishSci.40:17–28.
NielandJL,ShepherdGR.2011.ComparingBlackSeaBassCatchandPresenceBetweenSmoothandStructuredHabitatinNortheastFisheriesScienceCenterSpringBottomTrawlSurveys(WorkingPaperforSAW53).7p.
NortheastFisheriesScienceCenter.2012.53rdNortheastRegionalStockAssessmentWorkshop(53rdSAW)AssessmentSummaryReport.USDeptCommer,NortheastFishSciCentRefDoc.12-03;33p.
Shepherd,G.,K.Shertzer,J.Coakley,andM.Caldwell(Editors).2013.Proceedingsfromaworkshoponmodelingprotogynoushermaphroditefishes.Raleigh,NC.33p.
WorkingPapers
FayG.2016.RetrospectiveanalysisforBlackseabassStockSynthesismodel‘run_164’.November29–December2,2016.NOAAFisheries,NortheastFisheriesScienceCenter.WoodsHole,MA.6p.
Fay,GandCadrinS.2016.SimulationtestingassessmentmodelsforBlackSeaBass.AppendixA6,StockAssessmentReportofBlackSeaBass.SAW/SARC62.November29–December2,2016.NOAAFisheries,NortheastFisheriesScienceCenter.WoodsHole,MA.26p.
FayG,McNameeJ,CadrinS.2016.StockSynthesisApplicationtoBlackSeaBass.AppendixA9,StockAssessmentReportofBlackSeaBass.SAW/SARC62.November29–December2,2016.NOAAFisheries,NortheastFisheriesScienceCenter.WoodsHole,MA.59p.

30
FayG,McNameeJ,CadrinS.2016.StockSynthesisApplicationtoBlackSeaBass.AppendixA9,StockAssessmentReportofBlackSeaBass.SAW/SARC62.November29–December2,2016.NOAAFisheries,NortheastFisheriesScienceCenter.WoodsHole,MA.59p.
RobillardEetal.2016.ValidationofBlackSeabass,Centropristisstriata,AgesUsingOxytetracyclineMarkingandScaleMarginIncrements.AppendixA1,StockAssessmentReportofBlackSeaBass.SAW/SARC62.November29–December2,2016.NOAAFisheries,NortheastFisheriesScienceCenter.WoodsHole,MA.18p.
WorkingGroup,StockAssessmentWorkshop(SAW62).2016.StockAssessmentReportofBlackSeaBass.SAW/SARC62.November29–December2,2016.NOAAFisheries,NortheastFisheriesScienceCenter.WoodsHole,MA.247p.
WorkingGroup,StockAssessmentWorkshop(SAW62).2016.StockAssessmentSummaryReportofBlackSeaBass.SAW/SARC62.November29–December2,2016.NOAAFisheries,NortheastFisheriesScienceCenter.WoodsHole,MA.8p.
WorkingGroup,StockAssessmentWorkshop(SAW62).2016.Port-BasedBlackSeaBassOutreachProject.AppendixA2,StockAssessmentReportofBlackSeaBass.SAW/SARC62.November29–December2,2016.NOAAFisheries,NortheastFisheriesScienceCenter.WoodsHole,MA.21p.
WorkingGroup,StockAssessmentWorkshop(SAW62).2016.Investigatingtheutilityofinshoretrawlsurveysfordevelopingblackseabassabundanceindices.AppendixA3,StockAssessmentReportofBlackSeaBass.SAW/SARC62.November29–December2,2016.NOAAFisheries,NortheastFisheriesScienceCenter.WoodsHole,MA.27p.
WorkingGroup,StockAssessmentWorkshop(SAW62).2016.FisheryManagementHistory.AppendixA4,StockAssessmentReportofBlackSeaBass.SAW/SARC62.November29–December2,2016.NOAAFisheries,NortheastFisheriesScienceCenter.WoodsHole,MA.15p.
WorkingGroup,StockAssessmentWorkshop(SAW62).2016.TermofReference1–SpatialIssues.AppendixA5,StockAssessmentReportofBlackSeaBass.SAW/SARC62.November29–December2,2016.NOAAFisheries,NortheastFisheriesScienceCenter.WoodsHole,MA.46p.
WorkingGroup,StockAssessmentWorkshop(SAW62).2016.Blackseabassdistributionmaps–DistributionofStateandFederalsurveysandNEFSCspringsurveydistributionmaps,1989-2015.AppendixA7,StockAssessmentReportofBlackSeaBass.SAW/SARC62.November29–December2,2016.NOAAFisheries,NortheastFisheriesScienceCenter.WoodsHole,MA.206p.
WorkingGroup,StockAssessmentWorkshop(SAW62).2016.ALKsimulationtotestefficacyofmultinomialapproach.AppendixA8,StockAssessmentReportofBlackSeaBass.SAW/SARC62.November29–December2,2016.NOAAFisheries,NortheastFisheriesScienceCenter.WoodsHole,MA.19p.
WorkingGroup,StockAssessmentWorkshop(SAW62).2016.OverallModelofAllPlots.AppendixA10,StockAssessmentReportofBlackSeaBass.SAW/SARC62.November29–December2,2016.NOAAFisheries,NortheastFisheriesScienceCenter.WoodsHole,MA.156p.
WorkingGroup,StockAssessmentWorkshop(SAW62).2016.NorthModelofAllPlots.AppendixA11,StockAssessmentReportofBlackSeaBass.SAW/SARC62.November29–December2,2016.NOAAFisheries,NortheastFisheriesScienceCenter.WoodsHole,MA.134p.
31
WorkingGroup,StockAssessmentWorkshop(SAW62).2016.SouthModelofAllPlots.AppendixA12,StockAssessmentReportofBlackSeaBass.SAW/SARC62.November29–December2,2016.NOAAFisheries,NortheastFisheriesScienceCenter.WoodsHole,MA.116p.
WorkingGroup,StockAssessmentWorkshop(SAW62).2016.NorthAreaExchangeofAllPlots.AppendixA13,StockAssessmentReportofBlackSeaBass.SAW/SARC62.November29–December2,2016.NOAAFisheries,NortheastFisheriesScienceCenter.WoodsHole,MA.134p.
WorkingGroup,StockAssessmentWorkshop(SAW62).2016.SouthAreaExchangeofAllPlots.AppendixA14,StockAssessmentReportofBlackSeaBass.SAW/SARC62.November29–December2,2016.NOAAFisheries,NortheastFisheriesScienceCenter.WoodsHole,MA.116p.
WorkingGroup,StockAssessmentWorkshop(SAW62).2016.TwoAreaModelJustification.November29–December2,2016.NOAAFisheries,NortheastFisheriesScienceCenter.WoodsHole,MA.1p.
WorkingGroup,StockAssessmentWorkshop(SAW62).2016.CombinedASAPRetros.SAW/SARC62.November29–December2,2016.NOAAFisheries,NortheastFisheriesScienceCenter.WoodsHole,MA.PowerPointpresentation.3slides.
WorkingGroup,StockAssessmentWorkshop(SAW62).2016.ComparisonofresultsforBlackSeaBassASAPTwoAreamodelandSS(run134).SAW/SARC62.November29–December2,2016.NOAAFisheries,NortheastFisheriesScienceCenter.WoodsHole,MA.1p.
WorkingGroup,StockAssessmentWorkshop(SAW62).2016.Groundfishretro-adjustedvaluesusedinmanagement.SAW/SARC62.November29–December2,2016.NOAAFisheries,NortheastFisheriesScienceCenter.WoodsHole,MA.1p.
WorkingGroup,StockAssessmentWorkshop(SAW62).2016.Indextables.SAW/SARC62.November29–December2,2016.NOAAFisheries,NortheastFisheriesScienceCenter.WoodsHole,MA.2p.
WorkingGroup,StockAssessmentWorkshop(SAW62).2016.MProfileObjFXComponents.SAW/SARC62.November29–December2,2016.NOAAFisheries,NortheastFisheriesScienceCenter.WoodsHole,MA.2p.
WorkingGroup,StockAssessmentWorkshop(SAW62).2016.ModelJustificationDiagnostics.SAW/SARC62.November29–December2,2016.NOAAFisheries,NortheastFisheriesScienceCenter.WoodsHole,MA.PowerPointpresentation.8slides.
WorkingGroup,StockAssessmentWorkshop(SAW62).2016.NormalizedindicesusedinbothNorthandSouthareamodels.SAW/SARC62.November29–December2,2016.NOAAFisheries,NortheastFisheriesScienceCenter.WoodsHole,MA.PowerPointpresentation.4slides.
WorkingGroup,StockAssessmentWorkshop(SAW62).2016.SScomparisons.SAW/SARC62.November29–December2,2016.NOAAFisheries,NortheastFisheriesScienceCenter.WoodsHole,MA.1p.
WorkingGroup,StockAssessmentWorkshop(SAW62).2016.StandardizedAgeCompResidualPlots.SAW/SARC62.November29–December2,2016.NOAAFisheries,NortheastFisheriesScienceCenter.WoodsHole,MA.PowerPointpresentation.18slides.
32
WorkingGroup,StockAssessmentWorkshop(SAW62).2016.Stockrecruit.SAW/SARC62.November29–December2,2016.NOAAFisheries,NortheastFisheriesScienceCenter.WoodsHole,MA.PowerPointpresentation.2slides.
WorkingGroup,StockAssessmentWorkshop(SAW62).2016.BlackseabassZ-scorenormalizedindexvalues.SAW/SARC62.November29–December2,2016.NOAAFisheries,NortheastFisheriesScienceCenter.WoodsHole,MA.PowerPointpresentation.1slide.
Presentations
WorkingGroup,StockAssessmentWorkshop(SAW62).2016.BlackSeaBassAssessmentReview.SAW/SARC62.November29–December2,2016.NOAAFisheries,NortheastFisheriesScienceCenter.WoodsHole,MA.PowerPointpresentation.261slides.
WorkingGroup,StockAssessmentWorkshop(SAW62).2016.CommercialVTRs.SAW/SARC62.November29–December2,2016.NOAAFisheries,NortheastFisheriesScienceCenter.WoodsHole,MA.PowerPointpresentation.40slides.
WorkingGroup,StockAssessmentWorkshop(SAW62).2016.VTRTrawlandSpringSurvey.SAW/SARC62.November29–December2,2016.NOAAFisheries,NortheastFisheriesScienceCenter.WoodsHole,MA.PowerPointpresentation.23slides.
WitchFlounder
BackgroundPapers
ButterworthDSandRademeyerRA.2016.FurtherRemarksonGulfofMaine-GeorgesBankWitchFlounderAssessmentResults.WorkingPaperforSAW/SARC62.November29–December2,2016.NOAAFisheries,NortheastFisheriesScienceCenter.WoodsHole,MA.12p.
CadrinSandWrightB.2016.FisheryCatchRatesofWorkingFlounder.WorkingPaperforSAW/SARC62.November29–December2,2016.NOAAFisheries,NortheastFisheriesScienceCenter.WoodsHole,MA.17p.
DeCellesG.2016.AnAssessmentofWitchFlounder(Glyptocephaluscynoglossus)StockStructure.WorkingPaperforSAW/SARC62.November29–December2,2016.NOAAFisheries,NortheastFisheriesScienceCenter.WoodsHole,MA.18p.
FriedlandK.2016.Datatoinformhabitatmodelconstructionforwitchflounder.WorkingPaperforSAW/SARC62.November29–December2,2016.NOAAFisheries,NortheastFisheriesScienceCenter.WoodsHole,MA.23p.
FriedlandK.2016.Estimatedwitchflounderhabitatusingrandomforestmodels.WorkingPaperforSAW/SARC62.November29–December2,2016.NOAAFisheries,NortheastFisheriesScienceCenter.WoodsHole,MA.15p.

33
HareJetal.2016.Insitutemperatureandsalinitydataforuseinstockassessments.WorkingPaperforSAW/SARC62.November29–December2,2016.NOAAFisheries,NortheastFisheriesScienceCenter.WoodsHole,MA.4p.
HareJetal.2016.EmpiricalestimatesofmaximumcatchabilityofWitchFlounderGlyptocaphaluscynoglossusL.ontheNortheastFisheriesScienceCenterFallbottomtrawlsurvey.WorkingPaperforSAW/SARC62.November29–December2,2016.NOAAFisheries,NortheastFisheriesScienceCenter.WoodsHole,MA.27p.
HareJetal.2016.Environmentallyexplicitstock-recruitmentrelationshipsinWitchFlounder.WorkingPaperforSAW/SARC62.November29–December2,2016.NOAAFisheries,NortheastFisheriesScienceCenter.WoodsHole,MA.5p.
KritzerJPetal.2016.SpatialandTemporalPatternsinHabitatUseandDepthDistributionofWitchFlounder:ImplicationsforStockAssessment.WorkingPaperforSAW/SARC62.November29–December2,2016.NOAAFisheries,NortheastFisheriesScienceCenter.WoodsHole,MA.11p.
NortheastFisheriesScienceCenter.2008.Assessmentof19NortheastGroundfishStocksthrough2007:Reportofthe3rdGroundfishAssessmentReviewMeeting(GARMIII),NortheastFisheriesScienceCenter,WoodsHole,Massachusetts,August4-8,2008.USDepCommer,NOAAFisheries,NortheastFishSciCentRefDoc.08-15;884p+xvii.
NortheastFisheriesScienceCenter.2012.AssessmentorDataUpdatesof13NortheastGroundfishStocksthrough2010.USDeptCommer,NortheastFishSciCentRefDoc.12-06;789p.
NortheastFisheriesScienceCenter.2015.OperationalAssessmentof20NortheastGroundfishStocks,UpdatedThrough2014.USDeptCommer,NortheastFishSciCentRefDoc.15-24;251p.
OdellJetal.2016.NSC-AFM-GFCPFWitchFlounderLetter.WorkingPaperforSAW/SARC62.November29–December2,2016.NOAAFisheries,NortheastFisheriesScienceCenter.WoodsHole,MA.2p.
PalmerMC.2016.Catchcurveanalysisofwitchflounderfisheryandsurveycatch-at-agedata.WorkingPaperforSAW/SARC62.November29–December2,2016.NOAAFisheries,NortheastFisheriesScienceCenter.WoodsHole,MA.9p.
RichardsonD.2016.AminimumestimateofWitchFlounderspawningstockbiomassusingexperimentalestimatesofcatchabilityontheNEFSCtrawlsurvey.WorkingPaperforSAW/SARC62.November29–December2,2016.NOAAFisheries,NortheastFisheriesScienceCenter.WoodsHole,MA.4p.
TerceiroM.2016.TOR1:DescriptionofcommercialfisheryDealerReporttrawlgearlandingsandeffortandmodelinglandingsrate(LPUE)dataforwitchflounder.WorkingPaperforSAW/SARC62.November29–December2,2016.NOAAFisheries,NortheastFisheriesScienceCenter.WoodsHole,MA.21p.
TerceiroM.2016.TOR1:DescriptionofcommercialfisheryDealerReporttrawlgearlandingsandeffortandmodelinglandingsrate(LPUE)dataforwitchflounder:‘Directed’Trips(=>40%oftriplandings).WorkingPaperforSAW/SARC62.November29–December2,2016.NOAAFisheries,NortheastFisheriesScienceCenter.WoodsHole,MA.11p.
TerceiroM.2016.TOR1&2:ModelingcommercialfisheryDealerReportfishtrawlgearlandingsrate(LPUE)dataforwitchflounder:‘Directed’Trips(=>40%,=>25%,and=>10%oftriplandings).Working
34
PaperforSAW/SARC62.November29–December2,2016.NOAAFisheries,NortheastFisheriesScienceCenter.WoodsHole,MA.27p.
TerceiroM.2016.TOR1:DescriptionandmodelingofNEFOP(Observer)fishtrawlgearcatchrate(CPUE)dataforwitchflounder.WorkingPaperforSAW/SARC62.November29–December2,2016.NOAAFisheries,NortheastFisheriesScienceCenter.WoodsHole,MA.17p.
TerceiroM.2016.TOR1&2:DescriptionofVesselTripReporttrawlgearcatchandeffortdataandmodelingcatchrates(CPUE)forwitchflounder.WorkingPaperforSAW/SARC62.November29–December2,2016.NOAAFisheries,NortheastFisheriesScienceCenter.WoodsHole,MA.30p.
WalshHJetal.2016.Changesinthedistributionsoflarval,juvenile,andadultwitchflounderintheNortheastUSShelfEcosystem:UpdatesThrough2015.WorkingPaperforSAW/SARC62.November29–December2,2016.NOAAFisheries,NortheastFisheriesScienceCenter.WoodsHole,MA.9p.
WigleySE.2016.RoughvsSmoothBottomType:AnInitialExploration.WorkingPaperforSAW/SARC62.November29–December2,2016.NOAAFisheries,NortheastFisheriesScienceCenter.WoodsHole,MA.15p.
WigleySEandBurnettJM.2016.PreliminaryEstimatesofBiologicalandYieldCharacteristicsofDeep-waterWitchFlounder(Glyptocephaluscynoglossus)intheGeorgesBank-Mid-AtlanticBightRegion.JNorthwAtlFishSci.31:181-194.
WigleySE.2016.Refinementsto1982-2014WitchFlounderDiscardEstimates.WorkingPaperforSAW/SARC62.November29–December2,2016.NOAAFisheries,NortheastFisheriesScienceCenter.WoodsHole,MA.39p.
WigleySE,BrodziakJKT,ColL.2003.AssessmentoftheGulfofMaineandGeorgesBankwitchflounderstockfor2003.NortheastFish.Sci.Cent.Ref.Doc.03-14;186p.
WorkingPapers
ButterworthDSandRademeyerRA.2016.ResponsetoreviewerrequestsinregardtotheimpactofselectivitydominginthepreferredSCAAmodel.SAW/SARC62.November29–December2,2016.NOAAFisheries,NortheastFisheriesScienceCenter.WoodsHole,MA.4p.
WorkingGroup,StockAssessmentWorkshop(SAW62).2016.StockAssessmentofWitchFlounderfor2016.SAW/SARC62.November29–December2,2016.NOAAFisheries,NortheastFisheriesScienceCenter.WoodsHole,MA.523p.
WorkingGroup,StockAssessmentWorkshop(SAW62).2016.StockAssessmentSummaryofWitchFlounderfor2016.SAW/SARC62.November29–December2,2016.NOAAFisheries,NortheastFisheriesScienceCenter.WoodsHole,MA.16p.
Presentations
HareJetal.2016.EmpiricalEstimatesofMaximumCatchabilityofWitchFlounderontheNortheastFisheriesScienceCenterFallBottomTrawlSurvey.SAW/SARC62.November29–December2,2016.
35
NOAAFisheries,NortheastFisheriesScienceCenter.WoodsHole,MA.PowerPointpresentation.23slides.
WorkingGroup,StockAssessmentWorkshop(SAW62).2016.WitchFlounderAssessmentReview,TORs1-3.SAW/SARC62.November29–December2,2016.NOAAFisheries,NortheastFisheriesScienceCenter.WoodsHole,MA.PowerPointpresentation.89slides.
WorkingGroup,StockAssessmentWorkshop(SAW62).2016.WitchFlounderAssessmentReview,TORs4-9.SAW/SARC62.November29–December2,2016.NOAAFisheries,NortheastFisheriesScienceCenter.WoodsHole,MA.PowerPointpresentation.123slides.
WorkingGroup,StockAssessmentWorkshop(SAW62).2016.WitchFlounderSARCDiscussionSlides.SAW/SARC62.November29–December2,2016.NOAAFisheries,NortheastFisheriesScienceCenter.WoodsHole,MA.PowerPointpresentation.32slides.

36
Annex 2: Copy of the Statement of Work
StatementofWorkNationalOceanicandAtmosphericAdministration(NOAA)NationalMarine
FisheriesService(NMFS)CenterforIndependentExperts(CIE)ProgramExternalIndependent
PeerReview
62ndStockAssessmentWorkshop/StockAssessmentReviewCommittee(SAW/SARC)BenchmarkstockassessmentforBlackseabassandWitchflounder
BackgroundTheNationalMarineFisheriesService(NMFS)ismandatedbytheMagnuson-StevensFisheryConservationandManagementAct,EndangeredSpeciesAct,andMarineMammalProtectionActtoconserve,protect,andmanageournation’smarinelivingresourcesbaseduponthebestscientificinformationavailable(BSIA).NMFSscienceproducts,includingscientificadvice,areoftencontroversialandmayrequiretimelyscientificpeerreviewsthatarestrictlyindependentofalloutsideinfluences. Aformalexternalprocessfor independentexpertreviewsoftheagency'sscientificproductsandprogramsensurestheircredibility. Therefore,externalscientificpeerreviewshavebeenandcontinuetobeessentialtostrengtheningscientific qualityassuranceforfisheryconservationandmanagementactions.Scientificpeerreviewisdefinedastheorganizedreviewprocesswhereoneormorequalifiedexpertsreviewscientificinformationtoensurequalityandcredibi l i ty.Theseexpert(s)mustconducttheirpeerreviewimpartially,objectively,andwithoutconflictsofinterest. Eachreviewermustalsobeindependentfromthedevelopmentofthescience,withoutinfluencefromanypositionthattheagencyorconstituentgroupsmayhave.Furthermore,theOfficeofManagementandBudget(OMB),authorizedbytheInformationQualityAct,requiresall federalagenciestoconductpeerreviewsofhighlyinfluentialandcontroversial sciencebeforedissemination,andthatpeerreviewersmustbedeemedqualifiedbasedontheOMB PeerReviewBulletinstandards.(http://www.cio.noaa.gov/services_programs/pdfs/OMB_Peer_Review_Bulletin_m05-03.pdf).Furtherinformationmaybeobtainedfromwww.ciereviews.org.
ScopeTheNortheastRegionalStockAssessmentReviewCommittee(SARC)meetingisaformal,multiple-daymeetingofstockassessmentexpertswhoserveasapaneltopeer-reviewtabledstockassessmentsandmodels. TheSARCpeerreviewisthecornerstoneoftheNortheastStockAssessmentWorkshop(SAW)process,whichincludesassessmentdevelopmentandreportpreparation(whichisdonebySAWWorkingGroupsorASMFCtechnicalcommittees),assessmentpeerreview(bytheSARC),publicpresentations,anddocumentpublication. Thisreviewdetermineswhetherornotthescientificassessmentsareadequatetoserveasabasisfordevelopingfisherymanagementadvice.ResultsprovidethescientificbasisforfisherieswithinthejurisdictionofNOAA’sGreaterAtlanticRegionalFisheriesOffice(GARFO).

37
ThepurposeofthismeetingwillbetoprovideanexternalpeerreviewofabenchmarkstockassessmentforBlackseabassandWitchflounder.Therequirementsforthepeerreviewfollow. ThisStatementofWork(SOW)alsoincludesAppendix1:TORsforthestockassessment,whicharetheresponsibilityoftheanalysts;Appendix2:adraftmeetingagenda;Appendix3:IndividualIndependentReviewReportRequirements;andAppendix4:SARCSummaryReportRequirements.RequirementsNMFSrequiresthreereviewersunderthiscontract(i.e.subjecttoCIEstandardsforreviewers)toparticipateinthepanelreview. TheSARCchair,whoisinadditiontothethreereviewers,willbeprovidedbyeithertheNewEnglandorMid-AtlanticFisheryManagementCouncil’s ScienceandStatisticalCommittee;althoughtheSARCchairwillbeparticipatinginthisreview, thechair’sparticipation(i.e.laborandtravel)isnotcoveredbythiscontract.EachreviewerwillwriteanindividualreviewreportinaccordancewiththeSOW,OMBGuidelines,andtheTORsbelow. AllTORsmustbeaddressedineachreviewer’sreport. NomorethanoneofthereviewersselectedforthisreviewispermittedtohaveservedonaSARCpanelthatreviewedthissamespeciesinthepast.Thereviewersshallhaveworkingknowledgeandrecentexperienceintheapplicationofmodernfisherystockassessmentmodels. Expertiseshouldincludeforwardprojectingstatisticalcatch-at-agemodels. Reviewersshouldalsohaveexperienceinevaluatingmeasuresofmodelfit,identification,uncertainty,andforecasting.ReviewersshouldhaveexperienceindevelopmentofBiologicalReferencePoints(BRPs)thatincludesanappreciationforthevaryingqualityandquantityofdataavailabletosupportestimationofBRPs. ForBlackseabass,knowledgeofspatialmodelsandcomplexfisherieswithmultiplefleetsandrecreationalfisherieswouldbeuseful. ForWitchflounder,knowledgeofflatfishecologywouldbeuseful.RequirementsforReviewers
• Reviewthebackgroundmaterialsandreportspriortothereviewmeeting• Attendandparticipateinthepanelreviewmeeting
o ThemeetingwillconsistofpresentationsbyNOAAandotherscientists,stockassessmentauthorsandotherstofacilitatethereview,toprovideanyadditionalinformationrequiredbythereviewers,andtoansweranyquestionsfromreviewers
• ReviewersshallconductanindependentpeerreviewinaccordancewiththerequirementsspecifiedinthisSOWandTORs,inadherencewiththerequiredformattingandcontentguidelines;reviewersarenotrequiredtoreachaconsensus.
• EachreviewershallassisttheSARCChairwithcontributionstotheSARCSummaryReport
• DeliverindividualIndependentReviewReportstotheGovernmentaccordingtothespecifiedmilestonedates
38
• ThisreportshouldexplainwhethereachstockassessmentTermofReferenceoftheSAWwasorwasnotcompletedsuccessfullyduringtheSARCmeeting,usingthecriteriaspecifiedbelowinthe“RequirementsforSARCpanel.”
• IfanyexistingBiologicalReferencePoints(BRP)ortheirproxiesareconsideredinappropriate,theIndependentReportshouldincluderecommendationsandjustificationforsuitablealternatives. Ifsuchalternativescannotbeidentified,thenthereportshouldindicatethattheexistingBRPsarethebestavailableatthistime.
• Duringthemeeting,additionalquestionsthatwerenotintheTermsofReferencebutthataredirectlyrelatedtotheassessmentsmayberaised.CommentsonthesequestionsshouldbeincludedinaseparatesectionattheendoftheIndependentReportproducedbyeachreviewer.
• TheIndependentReportcanalsobeusedtoprovidegreaterdetailthantheSARCSummaryReportonspecificstockassessmentTermsofReferenceoronadditionalquestionsraisedduringthemeeting.
RequirementsforSARCpanel
• DuringtheSARCmeeting,thepanelistodeterminewhethereachstockassessmentTermofReference(TOR)oftheSAWwasorwasnotcompletedsuccessfully. Tomakethisdetermination,panelistsshouldconsiderwhethertheworkprovidesascientificallycrediblebasisfordevelopingfisherymanagementadvice.Criteriatoconsiderinclude:whetherthedatawereadequateandusedproperly,theanalysesandmodelswerecarriedoutcorrectly,andtheconclusionsarecorrect/reasonable. Ifalternativeassessmentmodelsandmodelassumptionsarepresented,evaluatetheirstrengthsandweaknessesandthenrecommendwhich,ifany,scientificapproachshouldbeadopted.Wherepossible,theSARCchairshallidentifyorfacilitateagreementamongthereviewersforeachstockassessmentTORoftheSAW.
• IfthepanelrejectsanyofthecurrentBRPorBRPproxies(forBMSYandFMSYandMSY),thepanelshouldexplainwhythoseparticularBRPsorproxiesarenotsuitable,andthepanelshouldrecommendsuitablealternatives. Ifsuchalternativescannotbeidentified,thenthepanelshouldindicatethattheexistingBRPsorBRPproxiesarethebestavailableatthistime.
• EachreviewershallcompletethetasksinaccordancewiththeSOWandScheduleofMilestonesandDeliverablesbelow.
RequirementsforSARCchairandreviewerscombined:ReviewboththeAssessmentReportandthedraftAssessmentSummaryReport.ThedraftAssessmentSummaryReportisreviewedandeditedtoassurethatitisconsistentwiththeoutcomeofthepeerreview,particularlystatementsthataddressstockstatusandassessmentuncertainty.
39
TheSARCChair,withtheassistancefromthereviewers,willwritetheSARCSummaryReport.EachreviewerandthechairwilldiscusswhethertheyholdsimilarviewsoneachstockassessmentTermofReferenceandwhethertheiropinionscanbesummarizedintoasingleconclusionforalloronlyforsomeoftheTermsofReferenceoftheSAW. Fortermswhereasimilarviewcanbereached,theSARCSummaryReportwillcontainasummaryofsuchopinions. Incaseswheremultipleand/ordifferingviewsexistonagivenTermofReference,theSARCSummaryReportwillnotethatthereisnoagreementandwillspecify-inasummarymanner–whatthedifferentopinionsareandthereason(s)forthedifferenceinopinions.Thechair’sobjectiveduringthisSARCSummaryReportdevelopmentprocesswillbetoidentifyorfacilitatethefindingofanagreementratherthanforcingthepaneltoreachanagreement.Thechairwilltaketheleadineditingandcompletingthisreport.Thechairmayexpressthechair’sopiniononeachTermofReferenceoftheSAW,eitheraspartofthegroupopinion,orasaseparateminorityopinion.TheSARCSummaryReportwillnotbesubmitted,reviewed,orapprovedbytheContractor.IfanyexistingBiologicalReferencePoints(BRP)orBRPproxiesareconsideredinappropriate,theSARCSummaryReportshouldincluderecommendationsandjustificationforsuitablealternatives. Ifsuchalternativescannotbeidentified,thenthereportshouldindicatethattheexistingBRPproxiesarethebestavailableatthistime.ForeignNationalSecurityClearanceWhenreviewersparticipateduringapanelreviewmeetingatagovernmentfacility,theNMFSProjectContactisresponsibleforobtainingtheForeignNationalSecurityClearanceapprovalforreviewerswhoarenon-UScitizens. Forthisreason,thereviewersshallproviderequestedinformation(e.g.,firstandlastname,contactinformation,gender,birthdate,countryofbirth,countryofcitizenship,countryofpermanentresidence,countryofcurrentresidence,dualcitizenship(yes,no),passportnumber,countryofpassport,traveldates.)totheNEFSCSAWChairforthepurposeoftheirsecurityclearance,andthisinformationshallbesubmittedatleast30daysbeforethepeerreviewinaccordancewiththeNOAADeemedExportTechnologyControlProgramNAO207-12regulationsavailableattheDeemedExportsNAOwebsite:http://deemedexports.noaa.gov/andhttp://deemedexports.noaa.gov/compliance_access_control_procedures/noaa-foreign-national-registration-system.html.ThecontractorisrequiredtouseallappropriatemethodstosafeguardPersonallyIdentifiableInformation(PII).PlaceofPerformanceTheplaceofperformanceshallbeatthecontractor’sfacilities,andattheNortheastFisheriesScienceCenterinWoodsHole,Massachusetts.PeriodofPerformanceTheperiodofperformanceshallbefromthetimeofawardthroughJanuary15,2017. Eachreviewer’sdutiesshallnotexceed14daystocompleteallrequiredtasks.

40
ScheduleofMilestonesandDeliverables: Thecontractorshallcompletethetasksanddeliverablesinaccordancewiththefollowingschedule.
* TheSARCSummaryReportwillnotbesubmittedto,reviewed,orapprovedbytheContractor.ApplicablePerformanceStandardsTheacceptanceofthecontractdeliverablesshallbebasedonthreeperformancestandards:(1)Thereportsshallbecompletedinaccordancewiththerequiredformattingandcontent;(2)ThereportsshalladdresseachTORasspecified;(3)Thereportsshallbedeliveredasspecified inthescheduleofmilestonesanddeliverables.TravelAlltravelexpensesshallbereimbursableinaccordancewithFederalTravelRegulations(http://www.gsa.gov/portal/content/104790). Internationaltravelisauthorizedforthiscontract.Travelisnottoexceed$20,000.
NolaterthanNovember15,2016
ContractorsendsreviewercontactinformationtotheCOR,whothensendsthistotheNMFSProjectContact
NolaterthanNovember15,2016
NMFSProjectContactwillprovidereviewersthepre-reviewdocuments
Nov.29–Dec.2,2016 EachreviewerparticipatesandconductsanindependentpeerreviewduringthepanelreviewmeetinginWoodsHole,MA
December2,2016 SARCChairandreviewersworkatdraftingreportsduringmeetingatWoodsHole,MA,USA
December16,2016 Reviewerssubmitdraftindependentpeerreviewreportstothe
contractor’stechnicalteamforreview December16, 2016 DraftofSARCSummaryReport,reviewedbyallreviewers,duetothe
SARCChair* December23,2016 SARCChairsendsFinalSARCSummaryReport,approvedby
reviewers,toNMFSProjectcontact(i.e.,SAWChairman) December30,2016 ContractorsubmitsindependentpeerreviewreportstotheCORand
technicalpointofcontact(POC) January6,2017 TheCORand/ortechnicalPOCdistributesthefinalreportstothe
NMFSProjectContactandregionalCenterDirector
41
RestrictedorLimitedUseofDataThecontractorsmayberequiredtosignandadheretoanon-disclosureagreement.ProjectContactsDr.JamesWeinberg,NEFSCSAWChairNortheastFisheriesScienceCenter166WaterStreet,WoodsHole,[email protected] Phone:508-495-2352
Dr.WilliamKarp,NEFSCScienceDirectorNortheastFisheriesScienceCenter166WaterSt.,WoodsHole,[email protected] Phone:508-495-2233

42
Appendix1.TermsofReferencefortheSAWWorkingGroup(62ndSAW/SARCStockAssessment)
TheSARCReviewPanelshallassesswhetherornottheSAWWorkingGrouphasreasonablyandsatisfactorilycompletedthefollowingactions.A. Blackseabass
1. SummarizetheconclusionsoftheFebruary2016SSCpeerreviewregardingthepotentialforspatialpartitioningoftheblackseabassstock.TheconsequencesforthestockassessmentwillbeaddressedinTOR-6.)
2. Estimatecatchfromallsourcesincludinglandingsanddiscards. Characterizethe
uncertaintyinthesesourcesofdata. Evaluateavailableinformationondiscardmortalityand,ifappropriate,updatemortalityratesappliedtodiscardcomponentsofthecatch.Describethespatialandtemporaldistributionoffishingeffort.
3. Presentthesurveydatabeingusedintheassessment(e.g.,indicesofabundance,
recruitment,statesurveys,age-lengthdata,etc.).Investigatetheutilityoffisherydependentindicesasameasureofrelativeabundance.Characterizetheuncertaintyandanybiasinthesesourcesofdata.
4. Considertheconsequencesofenvironmentalfactorsontheestimatesofabundanceor
relativeindicesderivedfromsurveys.
5. Investigateimplicationsofhermaphroditiclifehistoryonstockassessmentmodel.Ifpossible,incorporateparameterstoaccountforhermaphroditism.
6. Estimateannualfishingmortality,recruitmentandstockbiomass(bothtotaland
spawningstock),usingmeasuresthatareappropriatetotheassessmentmodel,forthetimeseries(integratingresultsfromTORs-1,-4,&-5asappropriate),andestimatetheiruncertainty.Includeahistoricalretrospectiveanalysisandpastprojectionperformanceevaluationtoallowacomparisonwithmostrecentassessmentresults.
7. Estimatebiologicalreferencepoints(BRPs;pointestimatesorproxiesforBMSY,BTHRESHOLD,
FMSY,andMSY),includingdefiningBRPsforspatiallyexplicitareasifappropriate,andprovideestimatesoftheiruncertainty. Ifanalyticmodel-basedestimatesareunavailable,considerrecommendingalternativemeasurableproxiesforBRPs.CommentontheappropriatenessofexistingBRPsandthe“new”(i.e.,updated,redefined,oralternative)BRPs.

43
8. Evaluateoverallstockstatuswithrespecttoanewmodelornewmodelsthatconsideredspatialunitsdevelopedforthispeerreview.
9. Developapproachesandapplythemtoconductstockprojections.
a. Providenumericalannualprojections(3-5years)andthestatisticaldistribution(e.g.,probabilitydensityfunction)oftheOFL(overfishinglevel)thatfullyincorporatesobservation,processandmodeluncertainty(seeAppendixtotheSAWTORs).EachprojectionshouldestimateandreportannualprobabilitiesofexceedingthresholdBRPsforF,andprobabilitiesoffallingbelowthresholdBRPsforbiomass.Useasensitivityanalysisapproachinwhicharangeofassumptionsaboutthemostimportantuncertaintiesintheassessmentareconsidered(e.g.,terminalyearabundance,variabilityinrecruitment,anddefinitionofBRPsforblackseabass).
b. Commentonwhichprojectionsseemmostrealistic.Considermajoruncertaintiesintheassessmentaswellasthesensitivityoftheprojectionstovariousassumptions.
c. Describethisstock’svulnerability(see“AppendixtotheSAWTORs”)tobecomingoverfished,andhowthiscouldaffectthechoiceofABC.
10. Review,evaluateandreportonthestatusoftheSARCandWorkingGroupresearch
recommendationslistedinrecentSARCreviewedassessmentsandreviewpanelreports.Identifynewresearchrecommendations.
B. Witchflounder
1. Estimatecatchfromallsourcesincludinglandingsanddiscards. Describethespatialandtemporaldistributionoflandings,discards,andfishingeffort. Characterizetheuncertaintyinthesesourcesofdata.
2. Presentavailablefederal,state,andothersurveydata,indicesofrelativeorabsolute
abundance,recruitment,etc.Characterizetheuncertaintyandanybiasinthesesourcesofdataandcomparesurveycoveragetolocationsoffisherycatches. Selectthesurveysandindicesforuseintheassessment.
3. Investigateeffectsofenvironmentalfactorsandclimatechangeonrecruitment,growth
andnaturalmortalityofwitchflounder.Ifquantifiablerelationshipsareidentified,considerincorporatingtheseintothestockassessment.
4. Estimateannualfishingmortality,recruitmentandstockbiomass(bothtotaland
spawningstock)forthetimeseries(integratingresultsfromTOR-3ifappropriate),andestimatetheiruncertainty.Includeahistoricalretrospectiveanalysistoallowacomparisonwithpreviousassessmentresultsandpreviousprojections.CompareF’sandSSB’sthatwereprojectedduringthepreviousassessmenttotheirrealizedvalues.

44
5. Statetheexistingstockstatusdefinitionsfor“overfished”and“overfishing”.Thenupdateorredefinebiologicalreferencepoints(BRPs;pointestimatesorproxiesforBMSY,BTHRESHOLD,FMSYandMSY)andprovideestimatesoftheiruncertainty. Ifanalyticmodel-basedestimatesareunavailable,considerrecommendingalternativemeasurableproxiesforBRPs. CommentonthescientificadequacyofexistingBRPsandthe“new”(i.e.,updated,redefined,oralternative)BRPs.
6. Evaluatestockstatuswithrespecttotheexistingmodel(frompreviouspeerreviewed
acceptedassessment)andwithrespecttoanewmodel(orpossiblymodels,inaccordwithguidanceinattached“AppendixtotheSAWAssessmentTORs”)developedforthispeerreview. Inbothcases,evaluatewhetherthestockisrebuilt.
a. Whenworkingwiththeexistingmodel,updateitwithnewdataandevaluatestockstatus(overfishedandoverfishing)withrespecttotheupdatedBRPestimates.
b. Thenusethenewlyproposedmodel(orpossiblymodels,inaccordwithguidancein“AppendixtotheSAWAssessmentTORs”)andevaluatestockstatuswithrespectto“new”BRPsandtheirestimates(fromTOR-5).
7. Developapproachesandapplythemtoconductstockprojections.
a. Providenumericalannualprojections(3years)andthestatisticaldistribution(e.g.,probabilitydensityfunction)ofthecatchatFMSYoranFMSYproxy(i.e.theoverfishinglevel,OFL)(seeAppendix).EachprojectionshouldestimateandreportannualprobabilitiesofexceedingthresholdBRPsforF,andprobabilitiesoffallingbelowthresholdBRPsforbiomass. Useasensitivityanalysisapproachinwhicharangeofassumptionsaboutthemostimportantuncertaintiesintheassessmentareconsidered(e.g.,terminalyearabundance,magnitudeandvariabilityinrecruitment).
b. Commentonwhichprojectionsseemmostrealistic.Considerthemajoruncertaintiesintheassessmentaswellassensitivityoftheprojectionstovariousassumptions.Identifyreasonableprojectionparameters(recruitment,weight-at-age,retrospectiveadjustments,etc.)tousewhensettingspecifications.
c. Describethisstock’svulnerabilitytobecomingoverfished,andhowthiscouldaffectthechoiceofABC.Thechoicetakesscientificuncertaintyintoaccount(seeAppendix).
8. Evaluatethevalidityofthecurrentstockdefinition,takingintoaccountwhatisknown
aboutmigration,and makearecommendationaboutwhetherthereisaneedtomodifythecurrentstockdefinitionforfuturestockassessments.
9. Review,evaluateandreportonthestatusofresearchrecommendationsfromthelast
peerreviewedbenchmarkstockassessment. Identifynewresearchrecommendations.

45
ClarificationofTermsusedintheSAW/SARCTermsofReference
GuidancetoSAWWGabout“NumberofModelstoincludeintheAssessmentReport”:Ingeneral,foranyTORinwhichoneormoremodelsareexploredbytheWG,giveadetailedpresentationofthe“best”model,includinginputs,outputs,diagnosticsofmodeladequacy,andsensitivityanalysesthatevaluaterobustnessofmodelresultstotheassumptions. Inlessdetail,describeothermodelsthatwereevaluatedbytheWGandexplaintheirstrengths,weaknessesandresultsinrelationtothe“best”model. Ifselectionofa“best”modelisnotpossible,presentalternativemodelsindetail,andsummarizetherelativeutilityeachmodel,includingacomparisonofresults. Itshouldbehighlightedwhetheranymodelsrepresentaminorityopinion.On“AcceptableBiologicalCatch”(DOCNat.Stand.Guidel.Fed.Reg.,v.74,no.11,1-16-2009):Acceptablebiologicalcatch(ABC)isalevelofastockorstockcomplex’sannualcatchthataccountsforthescientificuncertaintyintheestimateofOverfishingLimit(OFL)andanyotherscientificuncertainty…”(p.3208)[Inotherwords,OFL≥ABC.]ABCforoverfishedstocks.Foroverfishedstocksandstockcomplexes,arebuildingABCmustbesettoreflecttheannualcatchthatisconsistentwiththescheduleoffishingmortalityratesintherebuildingplan.(p.3209)NMFSexpectsthatinmostcasesABCwillbereducedfromOFLtoreducetheprobabilitythatoverfishingmightoccurinayear. (p.3180)ABCreferstoalevelof‘‘catch’’thatis‘‘acceptable’’giventhe‘‘biological’’characteristicsofthestockorstockcomplex.Assuch,OptimalYield(OY)doesnotequatewithABC.ThespecificationofOYisrequiredtoconsideravarietyoffactors,includingsocialandeconomicfactors,andtheprotectionofmarineecosystems,whicharenotpartoftheABCconcept. (p.3189)On“Vulnerability”(DOCNatl.Stand.Guidelines.Fed.Reg.,v.74,no.11,1-16-2009):“Vulnerability.Astock’svulnerabilityisacombinationofitsproductivity,whichdependsuponitslifehistorycharacteristics,anditssusceptibilitytothefishery.ProductivityreferstothecapacityofthestocktoproduceMaximumSustainableYield(MSY)andtorecoverifthepopulationisdepleted,andsusceptibilityisthepotentialforthestocktobeimpactedbythefishery,whichincludesdirectcaptures,aswellasindirectimpactstothefishery(e.g.,lossofhabitatquality).”(p.3205)

46
ParticipationamongmembersofaStockAssessmentWorkingGroup:AnyoneparticipatinginSAWmeetingsthatwillberunningorpresentingresultsfromanassessmentmodelisexpectedtosupplythesourcecode,acompiledexecutable,aninputfilewiththeproposedconfiguration,andadetailedmodeldescriptioninadvanceofthemodelmeeting. SourcecodeforNOAAToolboxprogramsisavailableonrequest. Thesemeasuresallowtransparencyandafairevaluationofdifferencesthatemergebetweenmodels.

47
Appendix2.DraftReviewMeetingAgenda
{FinalMeetingagendatobeprovidedattimeofaward}
62ndStockAssessmentWorkshop/StockAssessmentReviewCommittee(SAW/SARC)BenchmarkstockassessmentforA.BlackseabassandB.Witchflounder
Nov.29–Dec.2,2016
StephenH.ClarkConferenceRoom–NortheastFisheriesScienceCenterWoodsHole,
MassachusettsDRAFTAGENDA*
TOPIC PRESENTER(S) SARCLEADER RAPPORTEUR
Tuesday,Nov.29
10–10:30AMWelcome JamesWeinberg,SAWChairIntroduction PatSullivan,SARCChairAgendaConductofMeeting10:30–12:30PM AssessmentPresentation(A.Blackseabass)GaryShepherd TBD12:30–1:30PM Lunch1:30–3:30PM AssessmentPresentation(A.Blackseabass)GaryShepherd TBD3:30–3:45PM Break3:45–5:45PM SARCDiscussionw/Presenters(A.Blackseabass)PatSullivan,SARCChair TBD5:45–6PM PublicComments

48
TOPIC PRESENTER(S) SARCLEADER RAPPORTEUR
Wednesday,Nov.30
8:30–10:30AM AssessmentPresentation(B.Witchflounder)SusanWigley TBD10:30–10:45AM Break10:45–12:30PM AssessmentPresentation(B.Witchflounder)SusanWigley TBD12:30–1:30PM Lunch1:30–3:30PM SARCDiscussionw/presenters(B.Witchflounder)PatSullivan,SARCChair TBD3:30–3:45PM PublicComments3:45-4PM Break4–6PM RevisitwithPresenters(A.Blackseabass)PatSullivan,SARCChair TBD7PM (SocialGathering)

49
TOPIC PRESENTER(S) SARCLEADER RAPPORTEUR
Thursday,Dec.1
8:30–10:30 RevisitwithPresenters(B.Witchflounder)PatSullivan,SARCChair TBD10:30–10:45 Break10:45–12:15 Review/EditAssessmentSummaryReport(A.Blackseabass)PatSullivan,SARCChair TBD12:15–1:15PM Lunch1:15–2:45PM (cont.)EditAssessmentSummaryReport(A.Blackseabass)PatSullivan,SARCChair TBD2:45–3PM Break3–6PM Review/editAssessmentSummaryReport(B.Witchflounder)PatSullivan,SARCChair TBDFriday,Dec.2
9:00AM–5:00PM SARCReportwriting***Alltimesareapproximate,andmaybechangedatthediscretionoftheSARCchair. Themeetingisopentothepublic.**DuringtheSARCReportwritingstage,thepublicshouldnotengageindiscussionwiththeSARC.
50
Appendix3.IndividualIndependentPeerReviewReportRequirements1. TheindependentpeerreviewreportshallbeprefacedwithanExecutiveSummaryproviding
aconcisesummaryofwhethertheyacceptorrejecttheworkthattheyreviewed,withanexplanationoftheirdecision(strengths,weaknessesoftheanalyses,etc.).
2. Thereportmustcontainabackgroundsection,descriptionoftheindividualreviewers’roles
inthereviewactivities,summaryoffindingsforeachTORinwhichtheweaknessesandstrengthsaredescribed,andconclusionsandrecommendationsinaccordancewiththeTORs.Theindependentreportshallbeanindependentpeerreview,andshallnotsimplyrepeatthecontentsoftheSARCSummaryReport.
a. Reviewersshoulddescribeintheirownwordsthereviewactivitiescompletedduringthe
panelreviewmeeting,includingaconcisesummaryofwhethertheyacceptorrejecttheworkthattheyreviewed,andexplaintheirdecisions(strengths,weaknessesoftheanalyses,etc.),conclusions,andrecommendations.
b. ReviewersshoulddiscusstheirindependentviewsoneachTORevenifthesewere
consistentwiththoseofotherpanelists,butespeciallywherethereweredivergentviews.
c. ReviewersshouldelaborateonanypointsraisedintheSARCSummaryReportthatthey
believemightrequirefurtherclarification.
d. Thereportmayincluderecommendationsonhowtoimprovefutureassessments.3. Thereportshallincludethefollowingappendices:
Appendix1: BibliographyofmaterialsprovidedforreviewAppendix2: AcopyofthisStatementofWorkAppendix3: Panelmembershiporotherpertinentinformationfromthepanelreviewmeeting.
51
Appendix4.SARCSummaryReportRequirements1. ThemainbodyofthereportshallconsistofanintroductionpreparedbytheSARCchair
thatwillincludethebackgroundandareviewofactivitiesandcommentsontheappropriatenessoftheprocessinreachingthegoalsoftheSARC. Followingtheintroduction,foreachassessmentreviewed,thereportshouldaddresswhetherornoteachTermofReferenceoftheSAWWorkingGroupwascompletedsuccessfully. ForeachTermofReference,theSARCSummaryReportshouldstatewhythatTermofReferencewasorwasnotcompletedsuccessfully.
Tomakethisdetermination,theSARCchairandreviewersshouldconsiderwhetherornottheworkprovidesascientificallycrediblebasisfordevelopingfisherymanagementadvice.IfthereviewersandSARCchairdonotreachanagreementonaTermofReference,thereportshouldexplainwhy. Itispermissibletoexpressmajorityaswellasminorityopinions.Thereportmayincluderecommendationsonhowtoimprovefutureassessments.2. IfanyexistingBiologicalReferencePoints(BRPs)orBRPproxiesareconsidered
inappropriate,includerecommendationsandjustificationforalternatives. Ifsuchalternativescannotbeidentified,thenindicatethattheexistingBRPsorBRPproxiesarethebestavailableatthistime.
3. ThereportshallalsoincludethebibliographyofallmaterialsprovidedduringtheSAW,
andrelevantpaperscitedintheSARCSummaryReport,alongwithacopyoftheStatementofWork.
ThereportshallalsoincludeasaseparateappendixtheassessmentTermsofReferenceusedfortheSAW,includinganychangestotheTermsofReferenceorspecifictopics/issuesdirectlyrelatedtotheassessmentsandrequiringPaneladvice.

52
Annex 3: List of participants
SAW-SARC62ATTENDEESNOVEMBER29–DECEMBER2,2016
NAME AFFILIATION
JamesWeinberg NEFSCRussBrown NEFSCGaryShepherd NEFSCMarkTerceiro NEFSCSusanWigley NEFSCTonyWood NEFSCKierstenCurti NEFSCSheenaSteiner NEFSCChrisLegault NEFSCSarahGaichas NEFSCAliciaMiller NEFSCPaulNitzschke NEFSCChuckAdams NEFSCLorettaO’Brien NEFSCJohnManiscalco NYDECJamieCournane NEFMCKileyDancy MAFMCPatriciaPerez NEFOPSteveCadrin SMASTVivianHaist CentreforIndependentExperts(Reviewer)AndersNielsen CentreforIndependentExperts(Reviewer)NeilKlaer CentreforIndependentExperts(Reviewer)PatSullivan NEFMC(SARCChair)KirbyRootes-Murdy ASMFCRichMcBride NEFSCNicholaMeserve MADMFAshleyWeston SMASTGregPower GARFOLizDaskey CornellUnivBobGlenn MADMFLarryAlade NEFSCMikeRadziszewski NEFOPBrandonMuffley MAFMCKatherineSosebee NEFSCHeathCook NEFSCTimMiller NEFSCGavinFay UMASSDartmouthGregDeCelles MADMFJackieOdell NSC

53
SAW-SARC62ATTENDEES–Page2
NAME AFFILIATION
VitoGiacalone NSCLizBrooks NEFSCBrookeWright SMASTAjaSzumylo GARFODaveRichardson NEFSCHarveyWalsh NEFSCAmandaHart UMASSDartmouthHannahGoodale GARFOJessicaBlaylock NEFSCMelanieGriffin


![EDIUS NLE Software Reviewer’s Guide - ediushd.com.ar1].pdf · Grass Valley EDIUS - EDIUS NLE Software Reviewer’s Guide July 2007 Page 1. EDIUS Software Reviewer’s Guide 1.1](https://img.pdfslide.net/doc/110x75/5ad4c24a7f8b9aff228c3988/edius-nle-software-reviewers-guide-1pdfgrass-valley-edius-edius-nle-software.jpg)