Embed Size (px)
Citation preview
CENTER FOR SOCIAL SERVICES RESEARCH School of Social Welfare, UC Berkeley
Ethnic/Racial Disproportionality and Disparity:
A National Perspective
Barbara Needell, MSW, PhDCenter for Social Services ResearchUniversity of California at Berkeley
New York, NYOctober 16, 2007
The Performance Indicators Project at CSSR is supported by the California Department of Social Services and the Stuart Foundation
Presentation developed by Emily Putnam-Hornstein, MSW
CENTER FOR SOCIAL SERVICES RESEARCH School of Social Welfare, UC Berkeley
National Efforts:
• Casey Alliance/CSSP • GAO Report • APHSA/NAPCWA Workgroup• CFP Breakthru Series• AECF Race Matters Toolkit• California Disproportionality Project• Other state efforts
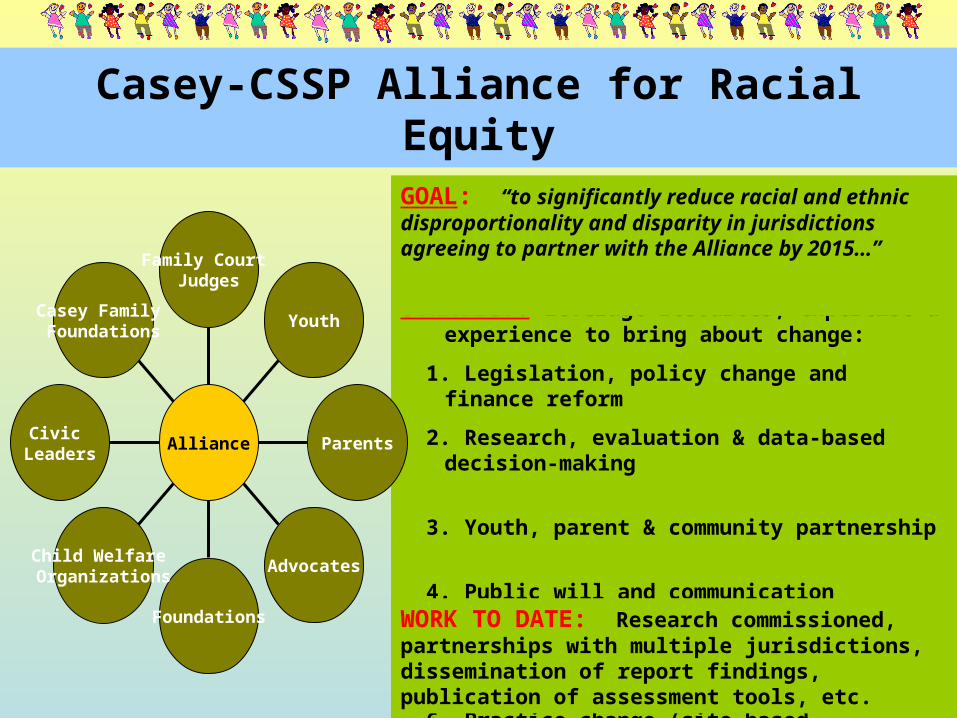
STRATEGY: Leverage resources, expertise & experience to bring about change:
1. Legislation, policy change and finance reform
2. Research, evaluation & data-based decision-making
3. Youth, parent & community partnership
4. Public will and communication
5. Human service workforce development
6. Practice change (site-based implementation)
Casey-CSSP Alliance for Racial Equity
GOAL: “to significantly reduce racial and ethnic disproportionality and disparity in jurisdictions agreeing to partner with the Alliance by 2015…”
WORK TO DATE: Research commissioned, partnerships with multiple jurisdictions, dissemination of report findings, publication of assessment tools, etc.
Family Court Judges
Youth
Parents
Advocates
Foundations
Child Welfare Organizations
Civic Leaders
Casey Family Foundations
Alliance
CENTER FOR SOCIAL SERVICES RESEARCH School of Social Welfare, UC Berkeley
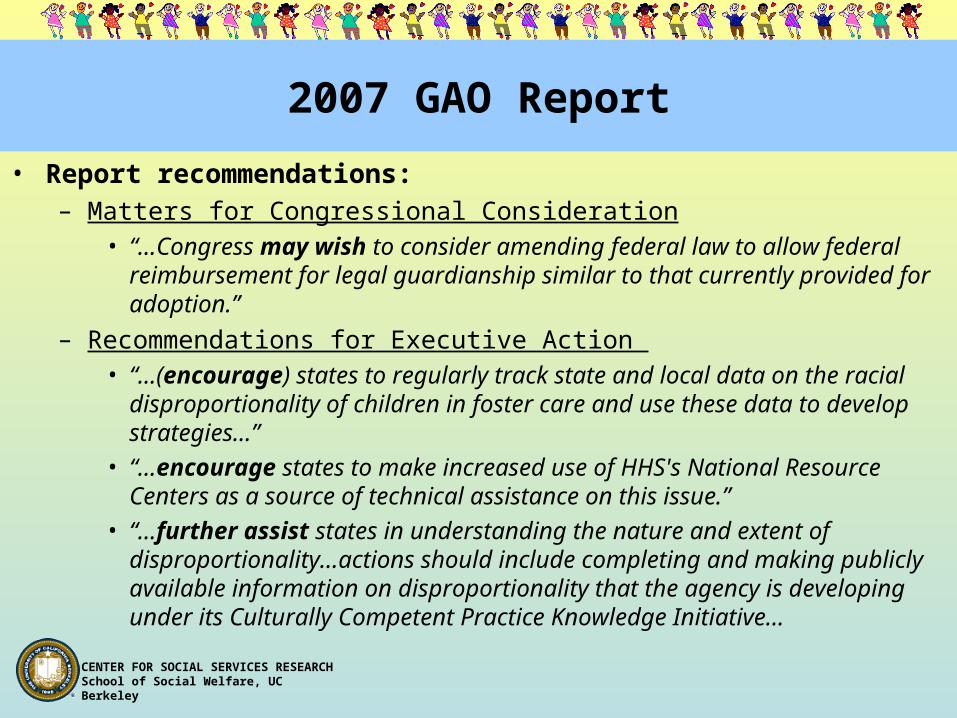
2007 GAO Report
• Report recommendations:– Matters for Congressional Consideration
• “…Congress may wish to consider amending federal law to allow federal reimbursement for legal guardianship similar to that currently provided for adoption.”
– Recommendations for Executive Action • “…(encourage) states to regularly track state and local data on
the racial disproportionality of children in foster care and use these data to develop strategies…”
• “…encourage states to make increased use of HHS's National Resource Centers as a source of technical assistance on this issue.”
• “…further assist states in understanding the nature and extent of disproportionality…actions should include completing and making publicly available information on disproportionality that the agency is developing under its Culturally Competent Practice Knowledge Initiative…
CENTER FOR SOCIAL SERVICES RESEARCH School of Social Welfare, UC Berkeley
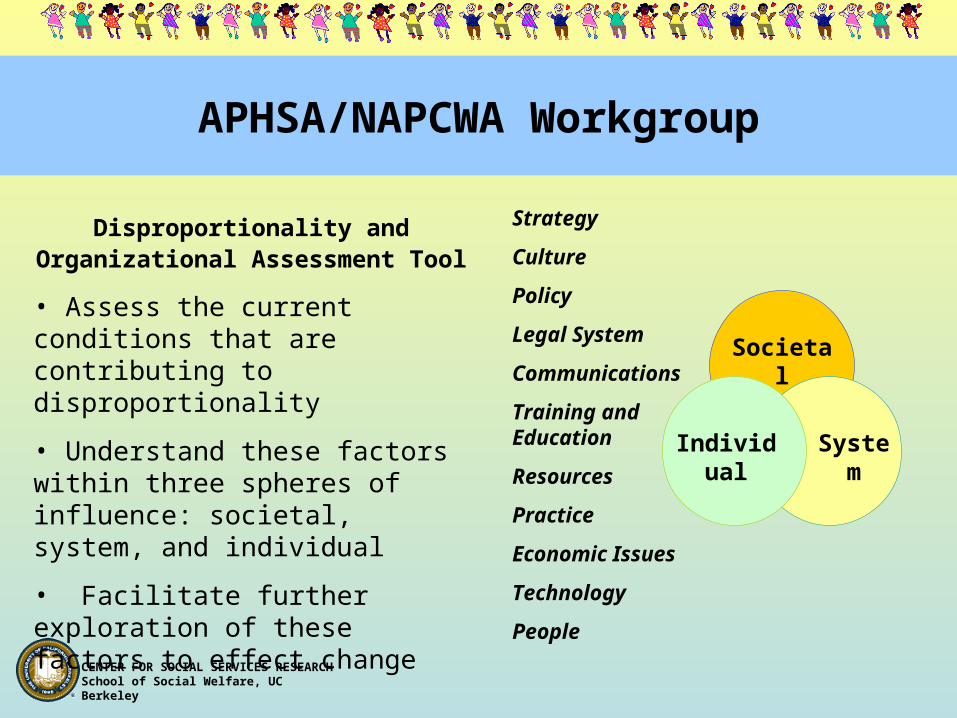
APHSA/NAPCWA Workgroup
System
Individual
Societal
Strategy
Culture
Policy
Legal System
Communications
Training and Education
Resources
Practice
Economic Issues
Technology
People
Disproportionality and Organizational Assessment Tool
• Assess the current conditions that are contributing to disproportionality
• Understand these factors within three spheres of influence: societal, system, and individual
• Facilitate further exploration of these factors to effect change
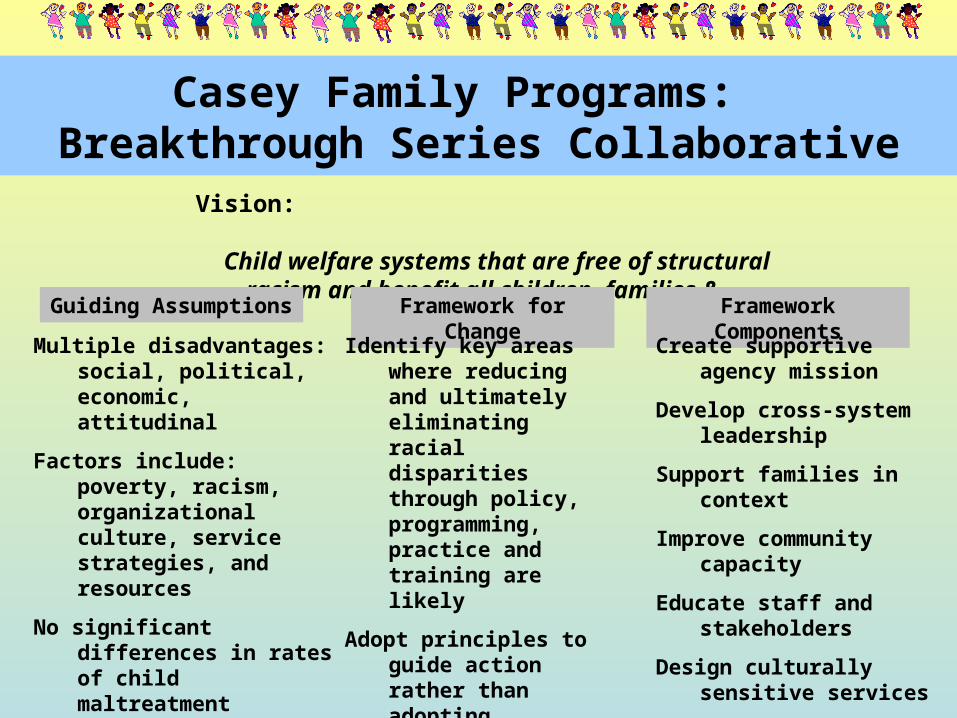
Casey Family Programs: Breakthrough Series Collaborative
Vision: Child welfare systems that are free of structural racism and benefit all
children, families & communitiesGuiding
AssumptionsMultiple disadvantages:
social, political, economic, attitudinal
Factors include: poverty, racism, organizational culture, service strategies, and resources
No significant differences in rates of child maltreatment (suggesting influence of race in institutional response and decision making)
Framework for Change
Identify key areas where reducing and ultimately eliminating racial disparities through policy, programming, practice and training are likely
Adopt principles to guide action rather than adopting prescriptive approaches
Framework Components
Create supportive agency mission
Develop cross-system leadership
Support families in context
Improve community capacity
Educate staff and stakeholders
Design culturally sensitive services
Use and share Data
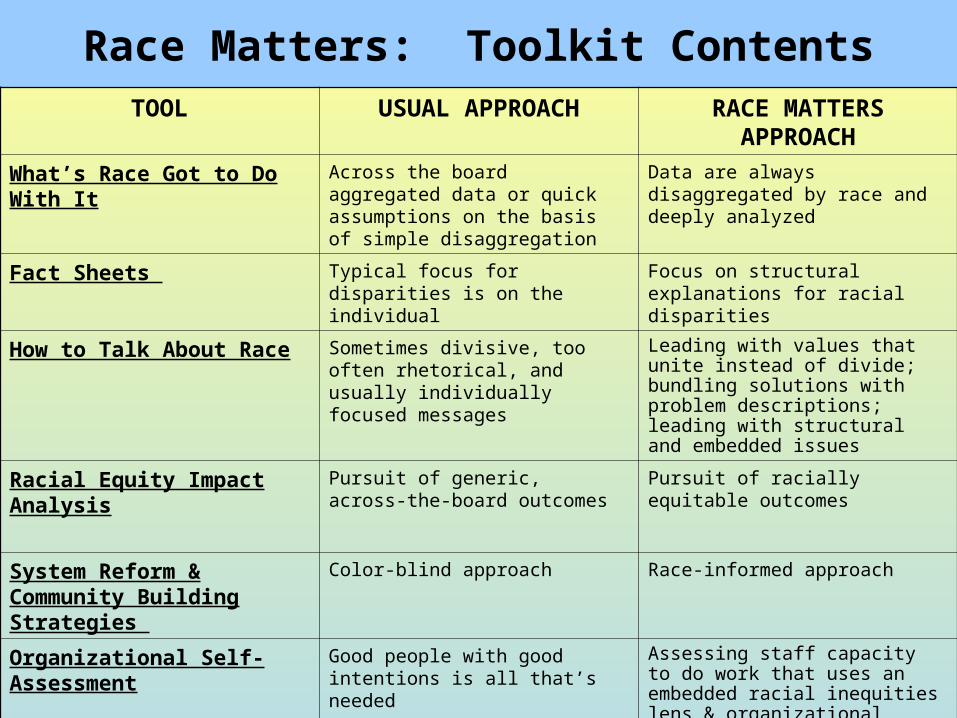
Race Matters: Toolkit ContentsTOOL USUAL APPROACH RACE MATTERS
APPROACH
What’s Race Got to Do With It
Across the board aggregated data or quick assumptions on the basis of simple disaggregation
Data are always disaggregated by race and deeply analyzed
Fact Sheets Typical focus for disparities is on the individual
Focus on structural explanations for racial disparities
How to Talk About Race Sometimes divisive, too often rhetorical, and usually individually focused messages
Leading with values that unite instead of divide; bundling solutions with problem descriptions; leading with structural and embedded issues
Racial Equity Impact Analysis
Pursuit of generic, across-the-board outcomes
Pursuit of racially equitable outcomes
System Reform & Community Building Strategies
Color-blind approach Race-informed approach
Organizational Self-Assessment
Good people with good intentions is all that’s needed
Assessing staff capacity to do work that uses an embedded racial inequities lens & organizational operations that model equity
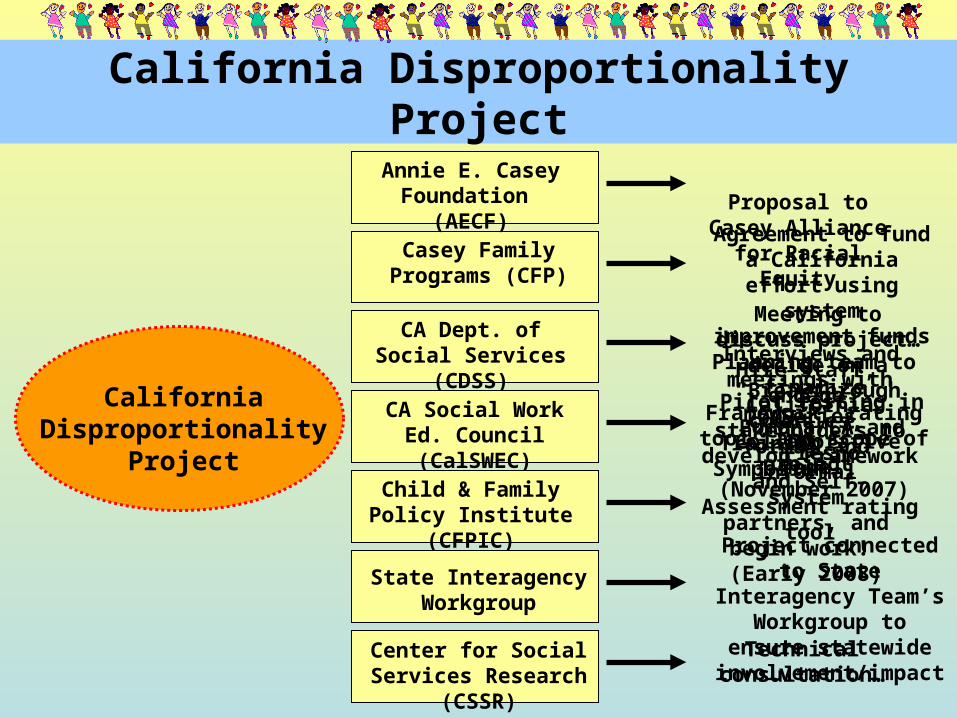
California Disproportionality Project
California Disproportionality
Project
Casey Family Programs (CFP)
Annie E. Casey Foundation
(AECF)
CA Dept. of Social Services (CDSS)
CA Social Work Ed. Council (CalSWEC)
Child & Family Policy Institute
(CFPIC)
State Interagency Workgroup
Center for Social Services Research
(CSSR)
2003 Training
Symposium
Meeting to discuss project…decide on a “Breakthrough
Series Collaborative
Model”
Proposal to Casey Alliance
for Racial Equity
Agreement to fund a California
effort using system
improvement funds
Project connected to State
Interagency Team’s Workgroup
to ensure statewide
involvement/impact
Technical consultation…
Interviews and meetings with
California stakeholders to
develop Framework and Self-Assessment
rating tool
Pilot testing in Pomona/LA and
Fresno
Planning team to finalize
Framework, rating tool, and scope of
project (November 2007)
Hire staff, engage
counties, formal and informal system
partners, and begin work! (Early 2008)
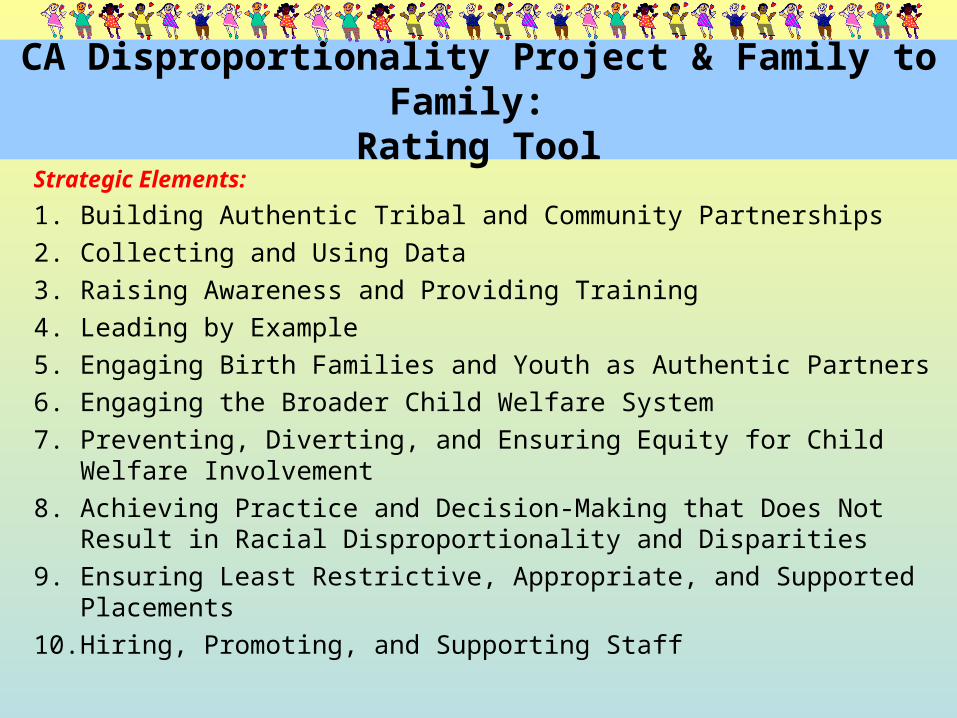
CA Disproportionality Project & Family to Family:
Rating ToolStrategic Elements:
1. Building Authentic Tribal and Community Partnerships 2. Collecting and Using Data3. Raising Awareness and Providing Training4. Leading by Example5. Engaging Birth Families and Youth as Authentic Partners6. Engaging the Broader Child Welfare System7. Preventing, Diverting, and Ensuring Equity for Child Welfare
Involvement8. Achieving Practice and Decision-Making that Does Not Result in
Racial Disproportionality and Disparities9. Ensuring Least Restrictive, Appropriate, and Supported
Placements10. Hiring, Promoting, and Supporting Staff
CENTER FOR SOCIAL SERVICES RESEARCH School of Social Welfare, UC Berkeley
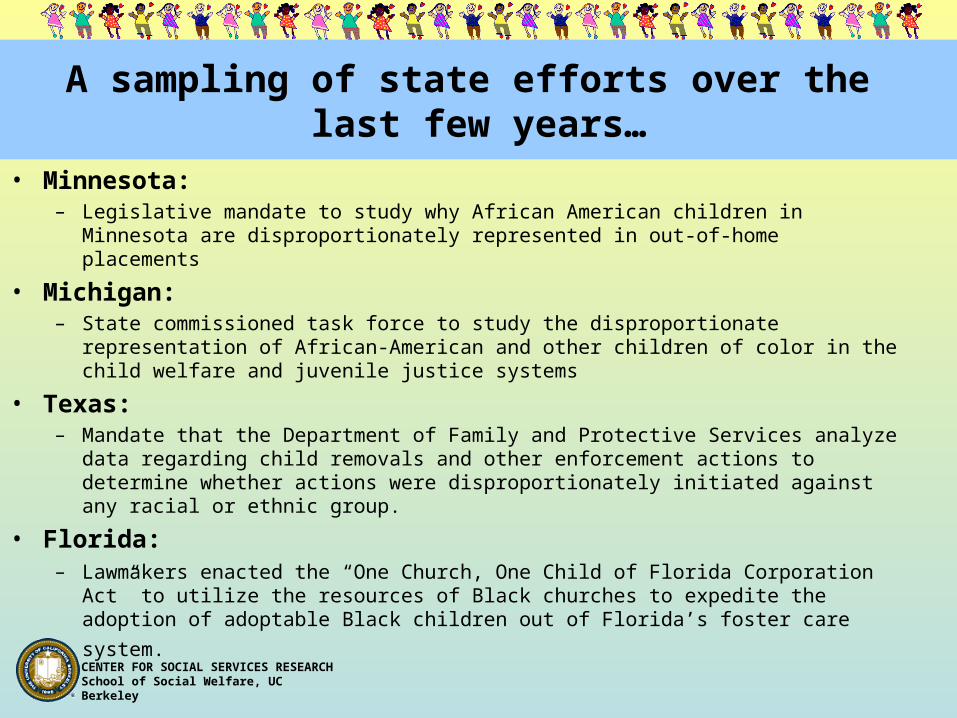
A sampling of state efforts over the last few years…
• Minnesota:– Legislative mandate to study why African American children in Minnesota
are disproportionately represented in out-of-home placements
• Michigan:– State commissioned task force to study the disproportionate representation
of African-American and other children of color in the child welfare and juvenile justice systems
• Texas:– Mandate that the Department of Family and Protective Services analyze
data regarding child removals and other enforcement actions to determine whether actions were disproportionately initiated against any racial or ethnic group.
• Florida:– Lawmakers enacted the “One Church, One Child of Florida Corporation Act”
to utilize the resources of Black churches to expedite the adoption of
adoptable Black children out of Florida’s foster care system.
CENTER FOR SOCIAL SERVICES RESEARCH School of Social Welfare, UC Berkeley
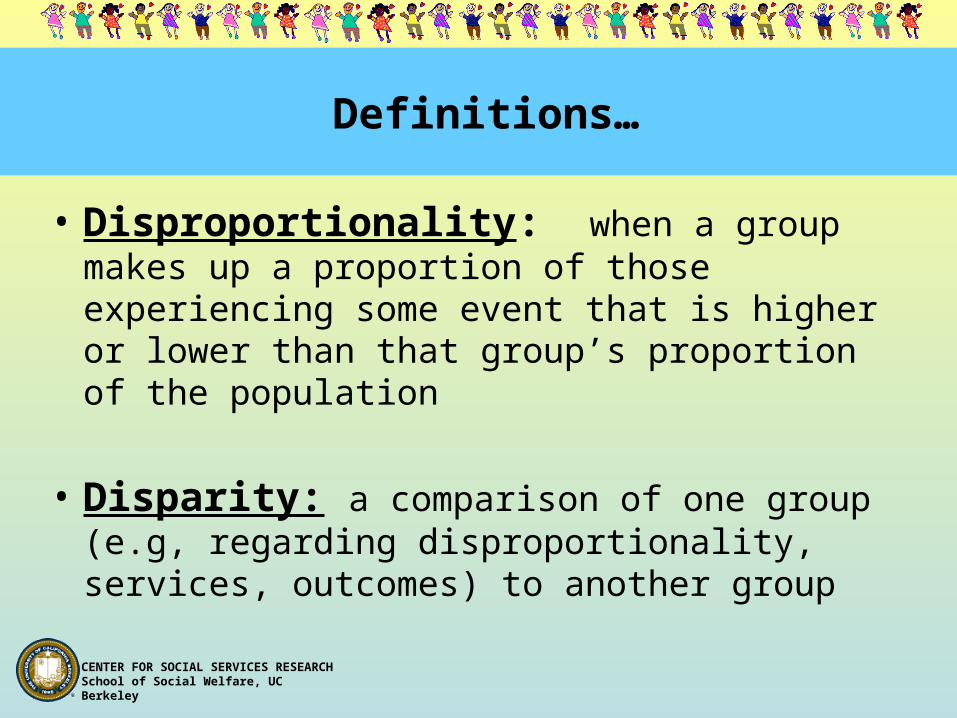
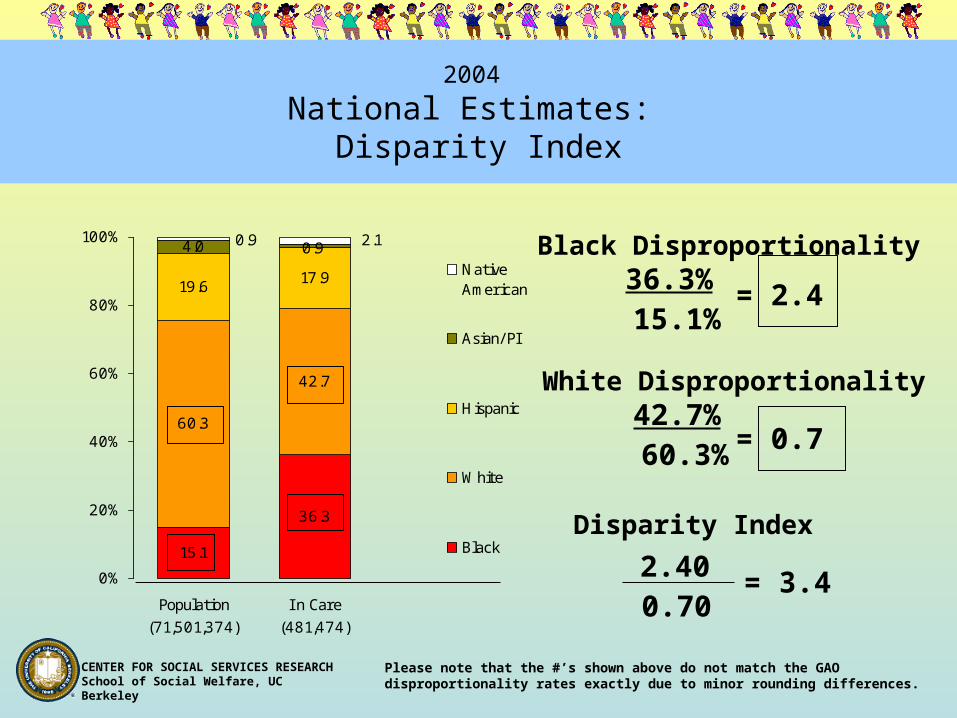
Definitions…
• Disproportionality: when a group makes up a proportion of those experiencing some event that is higher or lower than that group’s proportion of the population
• Disparity: a comparison of one group (e.g, regarding disproportionality, services, outcomes) to another group
CENTER FOR SOCIAL SERVICES RESEARCH School of Social Welfare, UC Berkeley
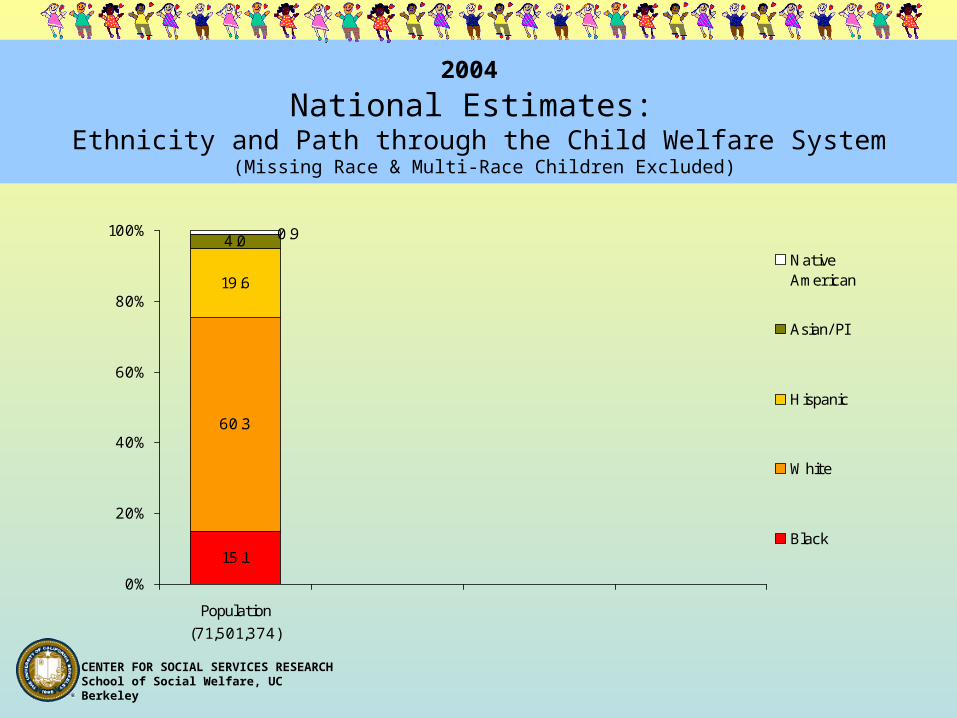
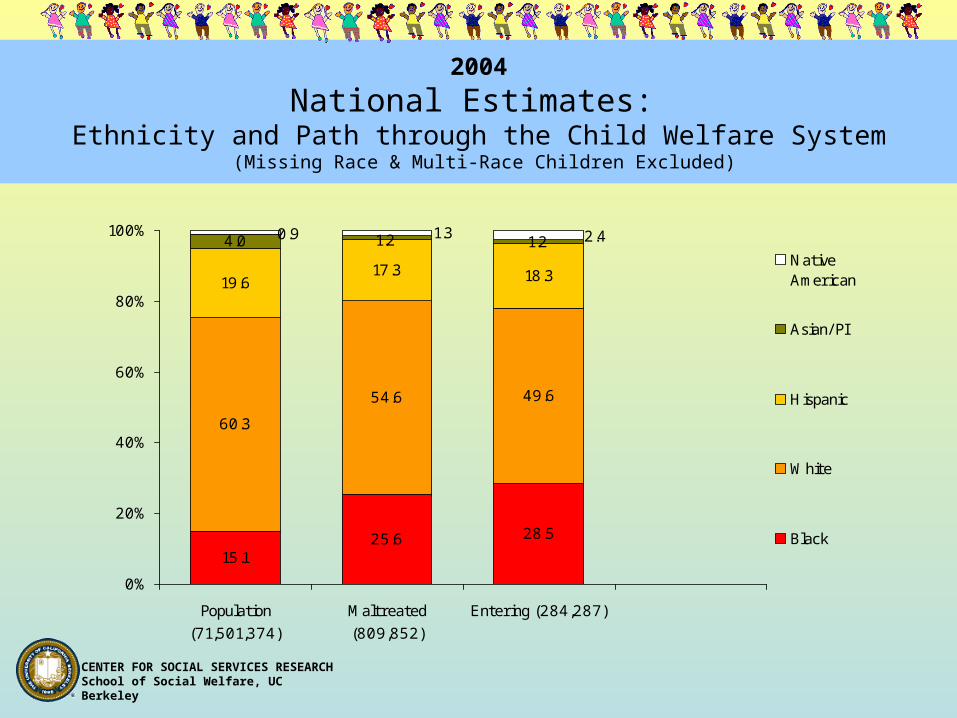
2004 National Estimates:
Ethnicity and Path through the Child Welfare System (Missing Race & Multi-Race Children Excluded)
15.1
60.3
19.6
4.0 0.9
0%
20%
40%
60%
80%
100%
Population
(71,501,374)
NativeAmerican
Asian/ PI
Hispanic
White
Black
CENTER FOR SOCIAL SERVICES RESEARCH School of Social Welfare, UC Berkeley
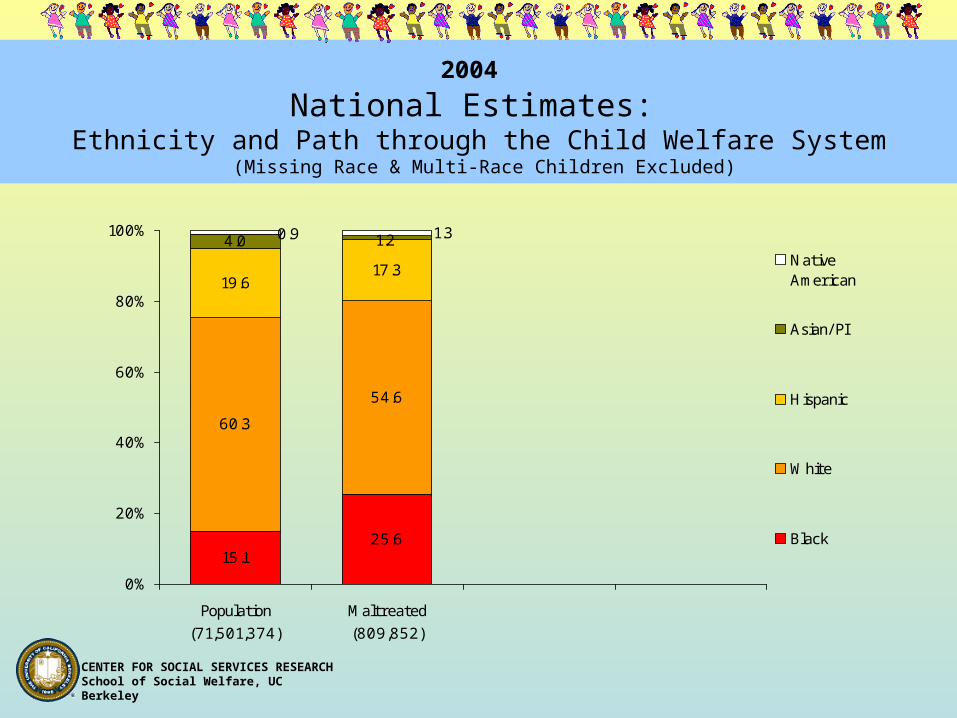
2004 National Estimates:
Ethnicity and Path through the Child Welfare System (Missing Race & Multi-Race Children Excluded)
15.125.6
60.3
54.6
19.6
4.0
17.3
1.20.9 1.3
0%
20%
40%
60%
80%
100%
Population
(71,501,374)
Maltreated
(809,852)
NativeAmerican
Asian/ PI
Hispanic
White
Black
CENTER FOR SOCIAL SERVICES RESEARCH School of Social Welfare, UC Berkeley
2004
National Estimates: Ethnicity and Path through the Child Welfare System
(Missing Race & Multi-Race Children Excluded)
15.125.6 28.5
60.3
54.6 49.6
19.6 18.3
4.0
17.3
1.2 1.20.9 1.3 2.4
0%
20%
40%
60%
80%
100%
Population
(71,501,374)
Maltreated
(809,852)
Entering (284,287)
NativeAmerican
Asian/ PI
Hispanic
White
Black
CENTER FOR SOCIAL SERVICES RESEARCH School of Social Welfare, UC Berkeley
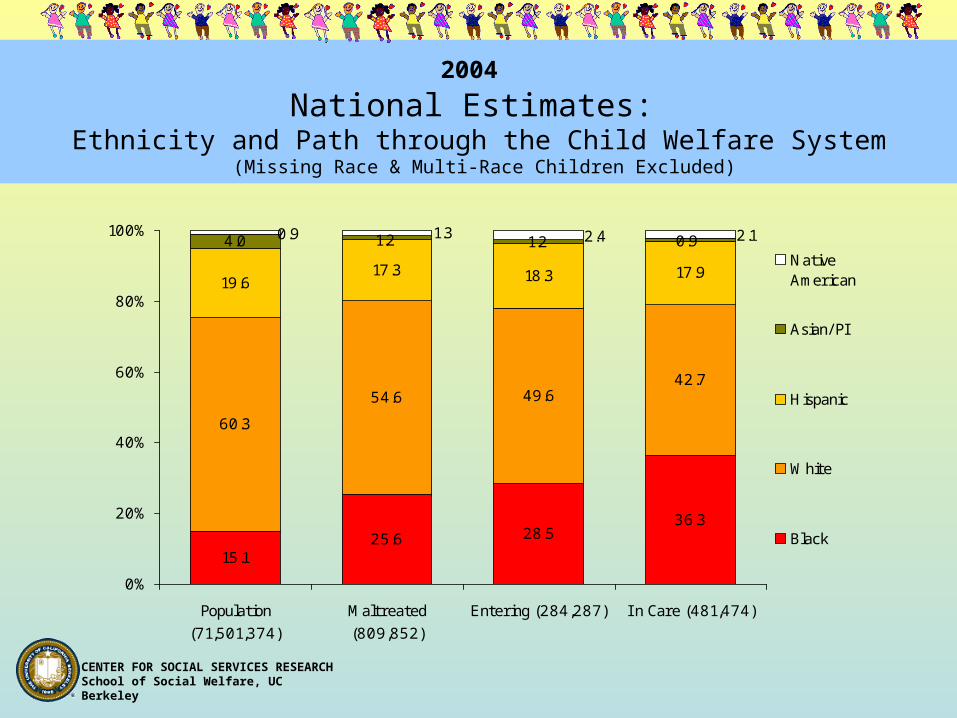
2004 National Estimates:
Ethnicity and Path through the Child Welfare System (Missing Race & Multi-Race Children Excluded)
15.125.6 28.5
36.3
60.3
54.6 49.642.7
19.6 18.3
4.0
17.3 17.9
1.2 1.2 0.90.9 1.3 2.4 2.1
0%
20%
40%
60%
80%
100%
Population
(71,501,374)
Maltreated
(809,852)
Entering (284,287) I n Care (481,474)
NativeAmerican
Asian/ PI
Hispanic
White
Black
CENTER FOR SOCIAL SERVICES RESEARCH School of Social Welfare, UC Berkeley
15.1
36.3
60.3
42.7
19.6
4.0
17.9
0.90.9 2.1
0%
20%
40%
60%
80%
100%
Population
(71,501,374)
I n Care
(481,474)
NativeAmerican
Asian/ PI
Hispanic
White
Black
Black Disproportionality36.3%15.1%
= 2.4
2004
National Estimates: Disparity Index
White Disproportionality42.7%60.3%= 0.7
Disparity Index
2.40 0.70
= 3.4
Please note that the #’s shown above do not match the GAO disproportionality rates exactly due to minor rounding differences.
CENTER FOR SOCIAL SERVICES RESEARCH School of Social Welfare, UC Berkeley
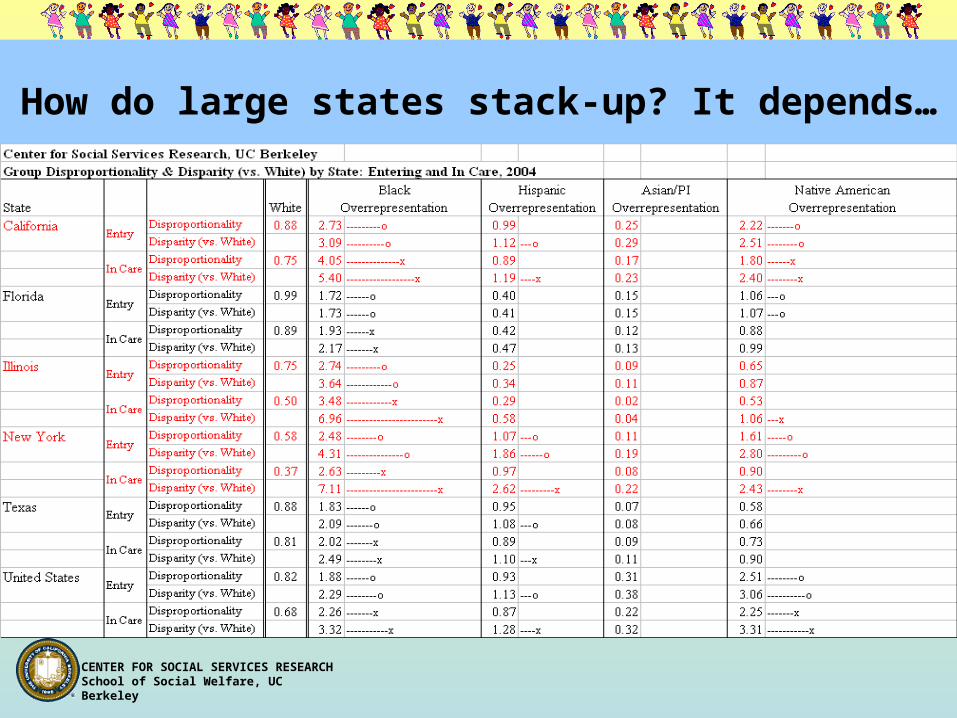
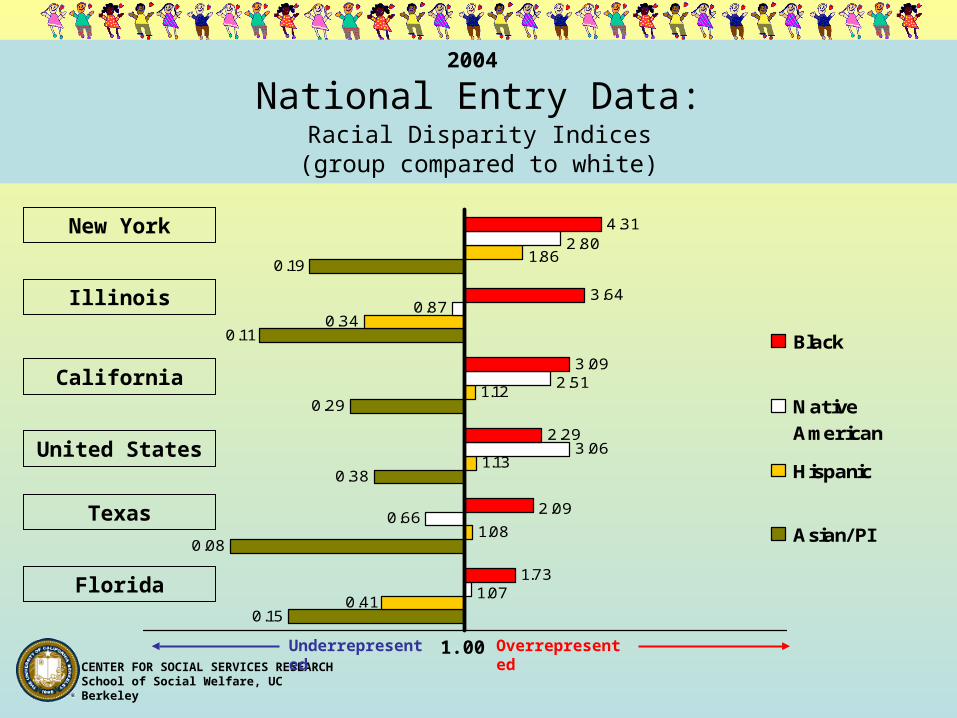
How do large states stack-up? It depends…
CENTER FOR SOCIAL SERVICES RESEARCH School of Social Welfare, UC Berkeley
0.19
0.11
0.29
0.38
0.08
0.15
1.86
0.34
1.12
1.13
1.08
0.41
2.80
0.87
2.51
3.06
0.66
1.07
4.31
3.64
3.09
2.29
2.09
1.73
Black
NativeAmerican
Hispanic
Asian/PI
New York
1.00
Overrepresented
Illinois
California
United States
Texas
Florida
Underrepresented
2004
National Entry Data: Racial Disparity Indices
(group compared to white)
CENTER FOR SOCIAL SERVICES RESEARCH School of Social Welfare, UC Berkeley
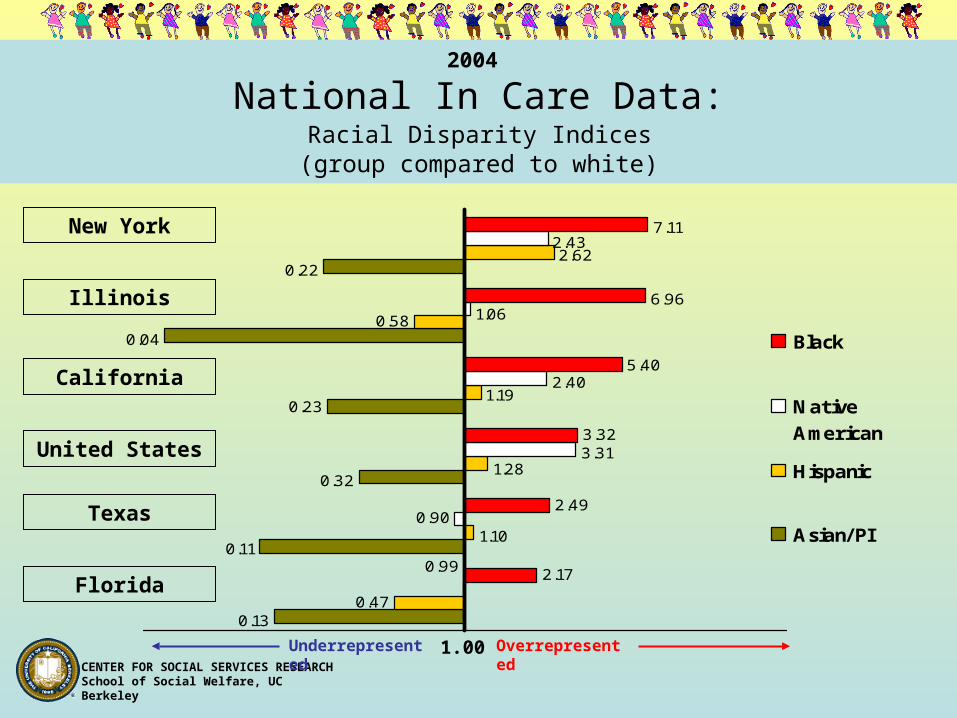
0.11
0.13
0.22
0.04
0.32
0.23
0.47
0.58
1.10
1.19
2.62
1.28
0.99
1.06
2.43
3.31
2.40
0.90
2.17
2.49
3.32
5.40
6.96
7.11
Black
NativeAmerican
Hispanic
Asian/PI
New York
1.00
Overrepresented
Illinois
California
United States
Texas
Florida
Underrepresented
2004
National In Care Data: Racial Disparity Indices
(group compared to white)
CENTER FOR SOCIAL SERVICES RESEARCH School of Social Welfare, UC Berkeley
CSSR.BERKELEY.EDU/UCB_CHILDWELFARE
Needell, B., Webster, D., Armijo, M., Lee, S., Cuccaro-Alamin, S., Shaw, T., Dawson, W., Piccus, W., Magruder, J., Exel, M., Conley, A., Smith, J. , Dunn, A., Frerer, K., & Putnam Hornstein, E., (2007). Child Welfare Services Reports for California. Retrieved [month day, year], from University of California at Berkeley Center for Social Services Research website. URL: <http://cssr.berkeley.edu/UCB_CHILDWELFARE/>
Barbara [email protected]
510.642.1893510.290.6334 (pcs)
GO BEARS!!!!