Embed Size (px)
Citation preview
Available online at www.sciencedirect.com
Applied Geochemistry 22 (2007) 2664–2683
www.elsevier.com/locate/apgeochem
AppliedGeochemistry
Centimeter-scale characterization of biogeochemical gradientsat a wetland–aquifer interface using capillary electrophoresis
Susan Baez-Cazull a, Jennifer T. McGuire a,*, Isabelle M. Cozzarelli b,Anne Raymond a, Lisa Welsh a
a Texas A&M University, 3115 TAMU College Station, TX 77843, United Statesb US Geological Survey, 431 National Center, Reston, VA 20192, United States
Available online 21 June 2007
Abstract
Steep biogeochemical gradients were measured at mixing interfaces in a wetland–aquifer system impacted by landfillleachate in Norman, Oklahoma. The system lies within a reworked alluvial plain and is characterized by layered lowhydraulic conductivity wetland sediments interbedded with sandy aquifer material. Using cm-scale passive diffusion sam-plers, ‘‘peepers’’, water samples were collected in a depth profile to span interfaces between surface water and a sequence ofdeeper sedimentary layers. Geochemical indicators including electron acceptors, low-molecular-weight organic acids, basecations, and NHþ4 were analyzed by capillary electrophoresis (CE) and field techniques to maximize the small sample vol-umes available from the centimeter-scale peepers. Steep concentration gradients of biogeochemical indicators wereobserved at various interfaces including those created at sedimentary boundaries and boundaries created by heterogeneitiesin organic C and available electron acceptors. At the sediment–water interface, chemical profiles with depth suggest thatSO2�
4 and Fe reduction dominate driven by inputs of organic C from the wetland and availability of electron acceptors.Deeper in the sediments (not associated with a lithologic boundary), a steep gradient of organic acids (acetate maximum8.8 mM) and NHþ4 (maximum 36 mM) is observed due to a localized source of organic matter coupled with the lack ofelectron acceptor inputs. These findings highlight the importance of quantifying the redox reactions occurring in smallinterface zones and assessing their role on biogeochemical cycling at the system scale.� 2007 Elsevier Ltd. All rights reserved.
1. Introduction
To understand and predict the fate and transportof numerous chemical species, including nutrientsand contaminants, it is important to identify themost active zones of biogeochemical cycling withina system. It has been proposed that in natural sys-tems, zones with steep biogeochemical gradients
0883-2927/$ - see front matter � 2007 Elsevier Ltd. All rights reserveddoi:10.1016/j.apgeochem.2007.06.003
* Corresponding author.E-mail address: [email protected] (J.T. McGuire).
may be areas of increased microbial activity (Kap-pler et al., 2005). Microbial activity is enhancedwhen concentration gradients of limiting electronacceptors and/or electron donors come in contact,such as in the transition zones between environ-ments of differing redox potential (Koretsky et al.,2003; Llobet-Brossa et al., 2002; McMahon andChapelle, 1991; Sass et al., 2002; Ulrich et al.,1998). Although the potential importance of transi-tion zones is widely accepted, characterization ischallenging because chemical and microbiological
.
S. Baez-Cazull et al. / Applied Geochemistry 22 (2007) 2664–2683 2665
measurements must be collected at sufficiently finespatial resolution to describe resulting gradients.The microbial processes that control natural attenu-ation of contaminants typically occur at the lm tomm scale, yet measurements of electron acceptorand donor concentrations are most often made atthe meter scale (Kappler et al., 2005). Here, findingsof steep biogeochemical gradients observed at cm-scale transition zones in an aquifer–wetland systemimpacted by landfill leachate are presented.
The reduction–oxidation (redox) potential of asystem, influenced by linked hydrological, microbio-logical and geochemical processes, largely controlsthe elemental cycling of nutrients and contaminants(Lyngkilde and Christensen, 1992; Nicholson et al.,1983; Peterson and Sun, 2000). In subsurface sys-tems, much work has focused on documentingredox zonation and associated biodegradation atthe plume scale. Many studies have suggested asequential pattern of redox zones, each of which isdominated by a single terminal electron acceptingprocess (TEAP) coupled to the oxidation of organiccompounds (Baun et al., 2003; Chapelle and Mcma-hon, 1991; Christensen et al., 2000; McGuire et al.,2000). Based on thermodynamic energy yield,microorganisms first use O2 as an electron acceptorfollowed by the reduction of alternate electronacceptors including NO�3 , Fe(III), SO2�
4 , and CO2
(methanogenesis). This results in the characteristicredox zonation observed in sediments (Achtnichet al., 1995; Albrechtsen and Christensen, 1994;Champ et al., 1979; Chapelle et al., 1996; Christen-sen et al., 2000; Cozzarelli et al., 2000; Lovley andPhillips, 1987; Ludvigsen et al., 1998). However,studies have found TEAPs appear to occur simulta-neously at the plume scale, thereby adding complex-ity to this sequential redox zone model (Blodauet al., 1998; Koretsky et al., 2003; Ludvigsenet al., 1998; McGuire et al., 2002; Motelica-Heinoet al., 2003). Complexities in the distribution ofTEAPs have also been identified at the ‘‘fringe’’zones surrounding contaminant plumes whereanoxic water contacts more oxic recharge water,creating gradients of electron acceptors and donors(Christensen et al., 2000; Mayer et al., 2001; Tuxenet al., 2006; van Breukelen and Griffioen, 2004; vanBreukelen et al., 2003). Similarly, heterogeneities inthe spatial distribution of sediments (e.g., particlesize, mineralogy), organic C content, and availabil-ity of electron acceptors can allow for the coexis-tence of several C oxidation pathways usingmultiple electron acceptors (Koretsky et al., 2003).
Complexities in the redox zonation model illustratethe importance of collecting biogeochemical mea-surements at sufficiently small spatial intervals tocharacterize the active zones of biogeochemicalcycling. For example, studies by Cozzarelli et al.(2001) and Bekins et al. (2001) observed that Fereduction gradients occurred at centimeter scalesin a hydrocarbon contaminated plume due to theheterogeneous distribution of reducible Fe minerals.
Quantifying the redox reactions occurring atthese relatively small transition zones may be criticalto assessing the overall biogeochemical cycling in asystem if these zones are indeed areas of enhancedmicrobial activity. Previous studies have docu-mented enhanced microbial activity at interfacezones created by lithologic boundaries (Ulrichet al., 1998) and surface water–groundwater inter-faces (Dahm et al., 1998) due to the mixing of elec-tron donors and acceptors. Steep geochemicalgradients of metabolic byproducts (i.e. organicacids) have also been observed at the interfacebetween aquifer and aquitard sediments (McMahonand Chapelle, 1991). In a recent study, Tuxen et al.(2006) documented a steep gradient of phenoxyacids and O2 at the fringe of a contaminant plumewhere microbial degradation was enhanced, demon-strating the importance of measuring these gradi-ents at small (decimeter) scales. However, fewstudies have undertaken extensive characterizationof the complex biogeochemical processes at relevantsampling scales to describe transition zones.
Past field investigations have been limited by thedifficulty in obtaining geochemical measurements atrepresentative spatial scales to characterize the smalland transient nature of interface zones (Hunt et al.,1997). The small volumes of fluid available for ana-lytical measurements also limit the characterizationof the organic and inorganic species involved incomplex redox reactions (Christensen et al., 2000).Commonly used sampling methods, including wellpumping and porewater extraction from sedimentcores, raise concerns such as the potential mixingof waters from various zones and sediment distur-bances. Water samples reflecting in situ equilibriumconditions at discrete intervals can be collectedusing passive diffusion samplers or ‘‘peepers’’ (Hess-lein, 1976) to limit mixing with adjacent zones. Oneconsequence of using peepers at 0.5–1 cm intervalsis the small sample volumes obtained. Generally,sample volumes greater than 0.5 mL are requiredfor common analytical techniques for inorganicand organic ions, such as ion chromatography,
2666 S. Baez-Cazull et al. / Applied Geochemistry 22 (2007) 2664–2683
atomic absorption, and gas chromatography. Usingthese techniques, the total volumes necessary forcomplete redox characterization cannot be obtainedfrom cm-scale peepers. Capillary electrophoresis(CE), an emerging technology in environmental sci-ences, overcomes these volume limitations, byrequiring very small sample volumes, �1 nL perinjection for a chemical suite with no preprocesseing(Linhardt and Toida, 2002). For example, all anio-nic parameters can be analyzed in triplicate with10 lL of pipetted sample.
This paper presents a high-resolution biogeo-chemical study targeting the mixing interface zoneswithin a wetland–aquifer system near the NormanLandfill in Norman, Oklahoma. The site is an ideallocation for studying geochemical gradients becausethe wetland–aquifer system contains several shallowinterfaces where waters of differing redox potentialmix. The purpose of this paper is to document thebiogeochemical gradients that result at these mixinginterfaces and present appropriate field-laboratorymethods to describe resulting gradients at suffi-ciently fine spatial resolution. Emerging CE technol-ogy to analyze environmental samples provides theability to measure biogeochemical indicators onsmaller volumes of fluid and thus allow investiga-tions at smaller spatial scales. New knowledge ofthe importance of interface zones on biogeochemi-cal cycling will allow for improved prediction ofchemical fate and transport and assessment of natu-ral attenuation of contaminated sites.
2. Background
2.1. Site description
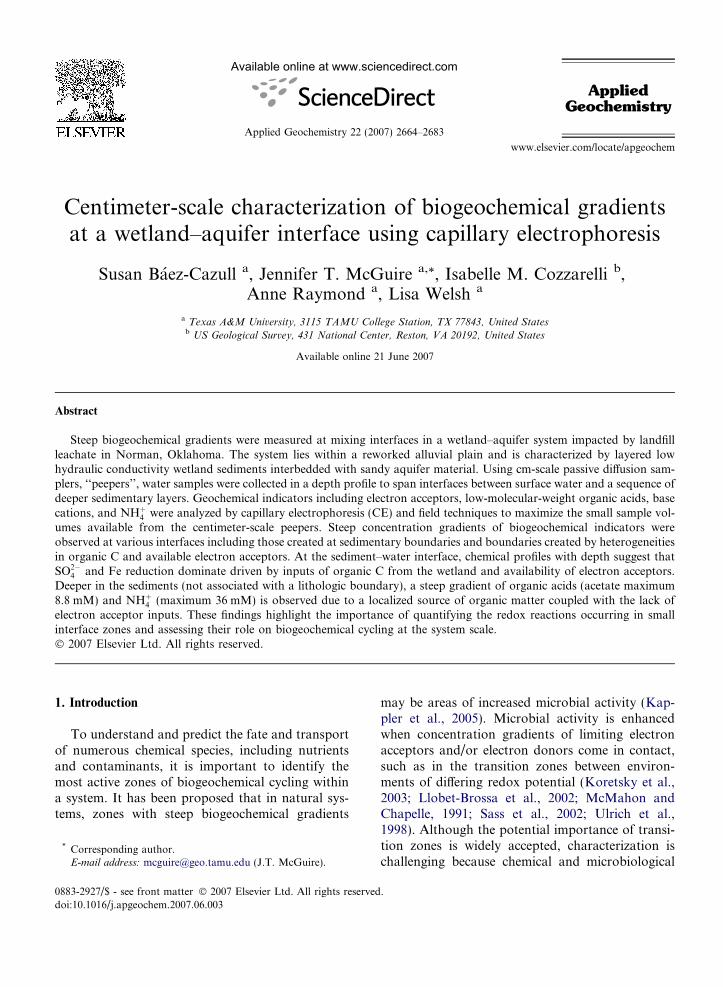
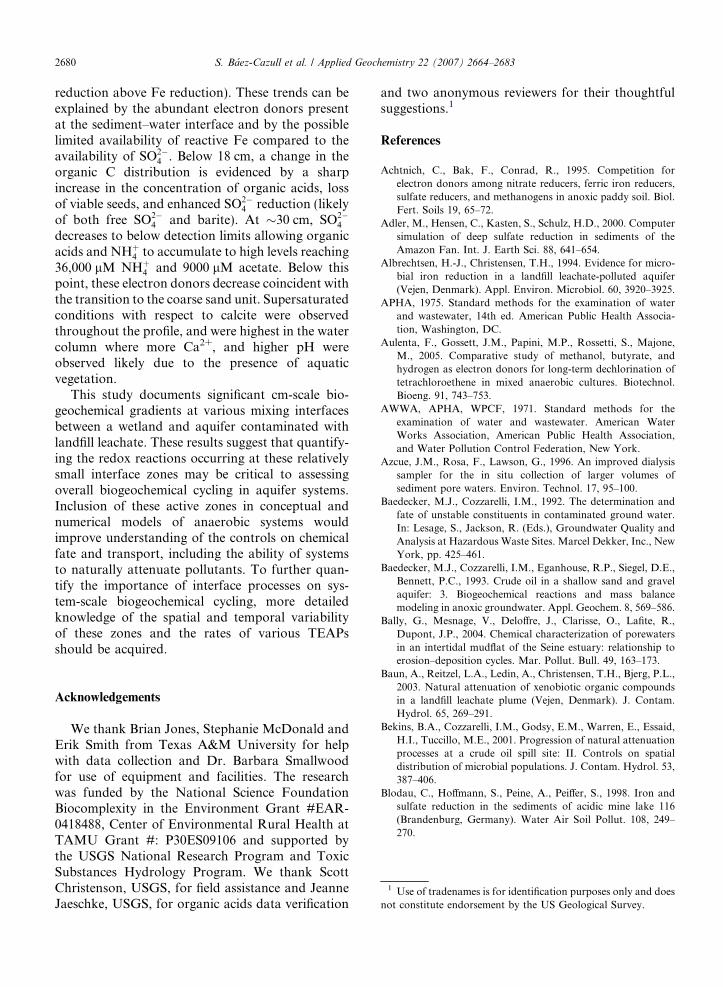
The Norman Landfill, situated in the CanadianRiver alluvial plain in central Oklahoma (Fig. 1),was a municipal, non-restricted solid waste landfillthat operated from 1922 to 1985 in the city of Nor-man, OK. The geologic setting is characterized bymoderately permeable alluvial and terrace depositswith a shallow water table that overlies a Permianshale and mudstone confining unit known as theHennessy Group (Scholl and Christenson, 1998).The reworked alluvium is about 12 m thick in thelandfill area (Stacy, 1961) and the hydraulic conduc-tivity is estimated to range from 7.3 · 10�2 to2.4 · 101 m/day (Scholl and Christenson, 1998).Leachate from the unlined landfill has resulted ina groundwater plume that extends downgradientapproximately 250 m from the landfill toward the
Canadian River and flows directly beneath the wet-land (slough) (Scholl and Christenson, 1998). Thewetland is likely a previous location of the mainriver channel, fed by groundwater discharge andprecipitation. The wetland’s water levels vary sea-sonally ranging from approximately 1 m deep inthe spring to dry in the summer. Upper sedimentshave been variably saturated during the summermonths.
The Norman Landfill has been designated as aU.S. Geological Survey research site under theUSGS Toxic Substances Hydrology Program since1995. It is the site of active, ongoing investigationsinto the biogeochemistry of the plume. Recent stud-ies at the site by Lorah et al. (submitted for publica-tion) targeting biogeochemical cycling within thewetland system demonstrate the spatial and tempo-ral link between redox conditions in the wetlandsediments and fluctuations in groundwater/surfacewater levels. Generally, during periods of highrecharge, the upgradient bank of the slough hadhigher concentrations of leachate constituentsincluding NHþ4 , dissolved organic C, Fe2+ andHCO�3 in the top 60 cm of the wetland–sedimentporewater compared to low recharge periods, indi-cating that leachate plume water from the aquiferdischarged into the wetland. Scholl et al. (2005) alsoobserved that exchange between the wetland andshallow groundwater was episodic and that shallowgroundwater downgradient from the slough con-tained, on average, 29% wetland water during peri-ods of high recharge. A generalized conceptualmodel showing the connection between the wetland(slough) and surrounding aquifer is shown in Fig. 2.
2.2. Core description
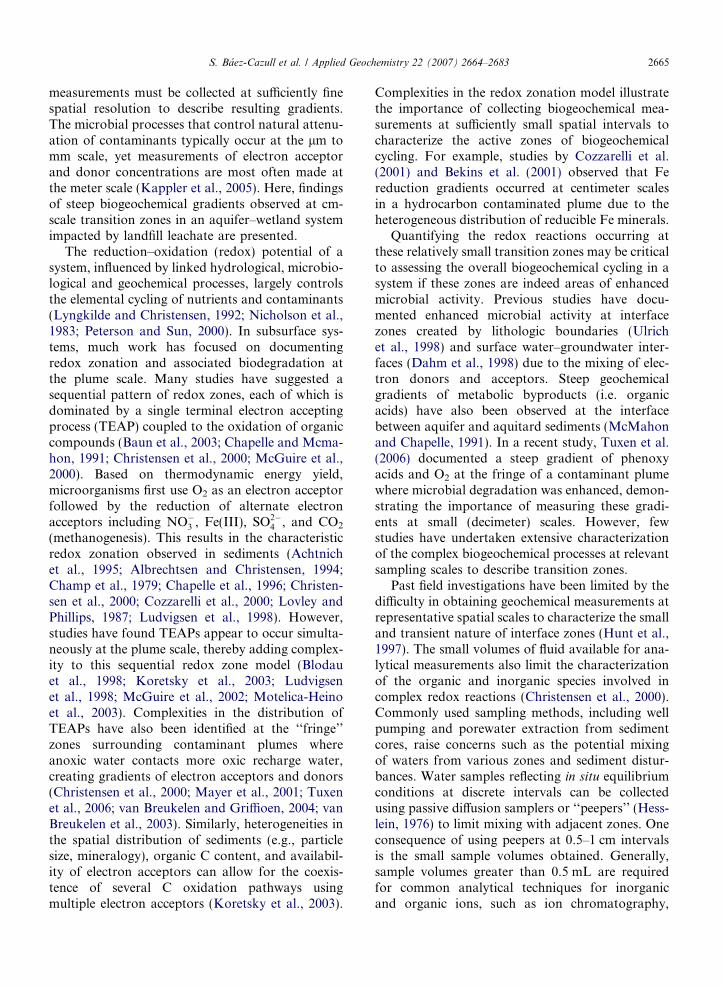
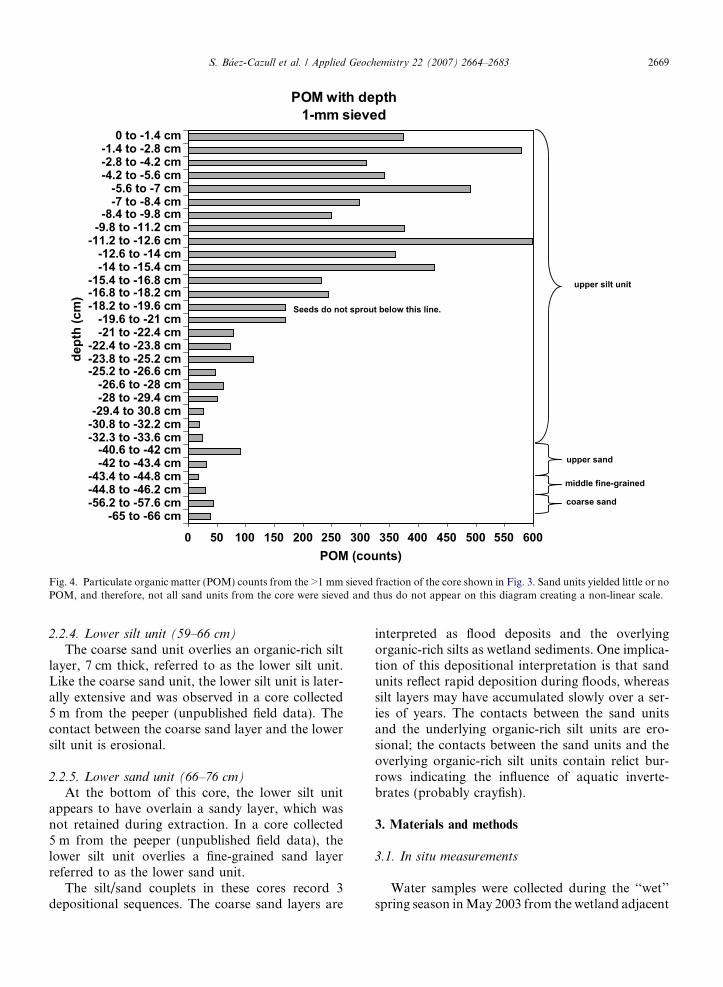
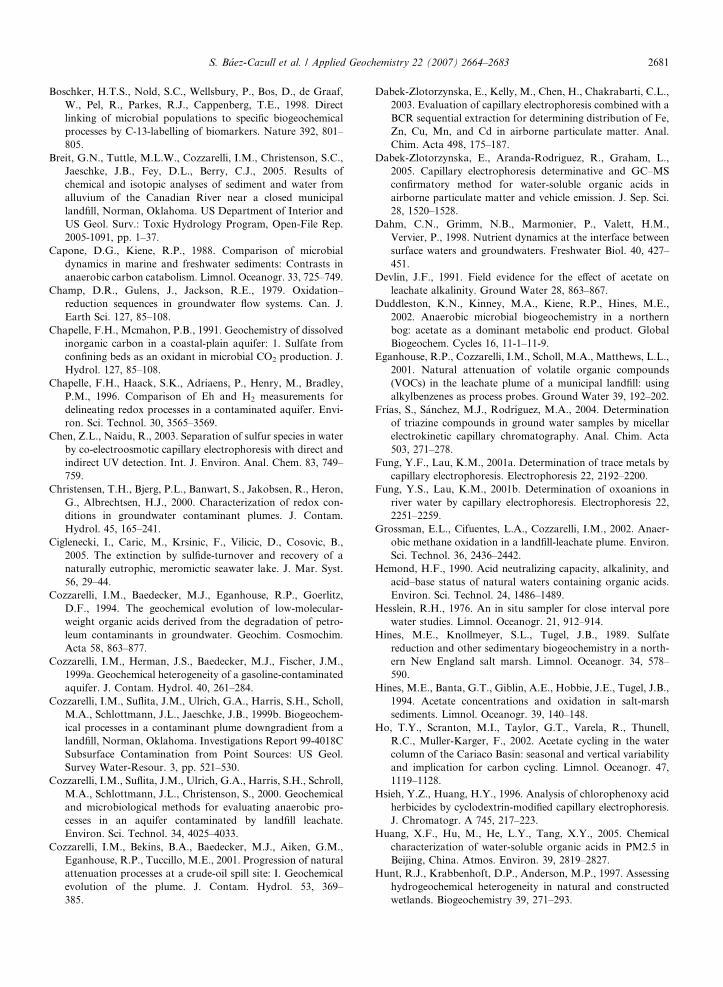
The surficial sediments of the wetland adjacent tothe Norman Landfill consist of alternating units offluvial silt and sand. The following description isbased on the sequence of layers in a shallow corecollected near the location of the peepers (Fig. 3).
2.2.1. Upper silt unit (0–40 cm)The upper 40 cm of the core consists of organic-
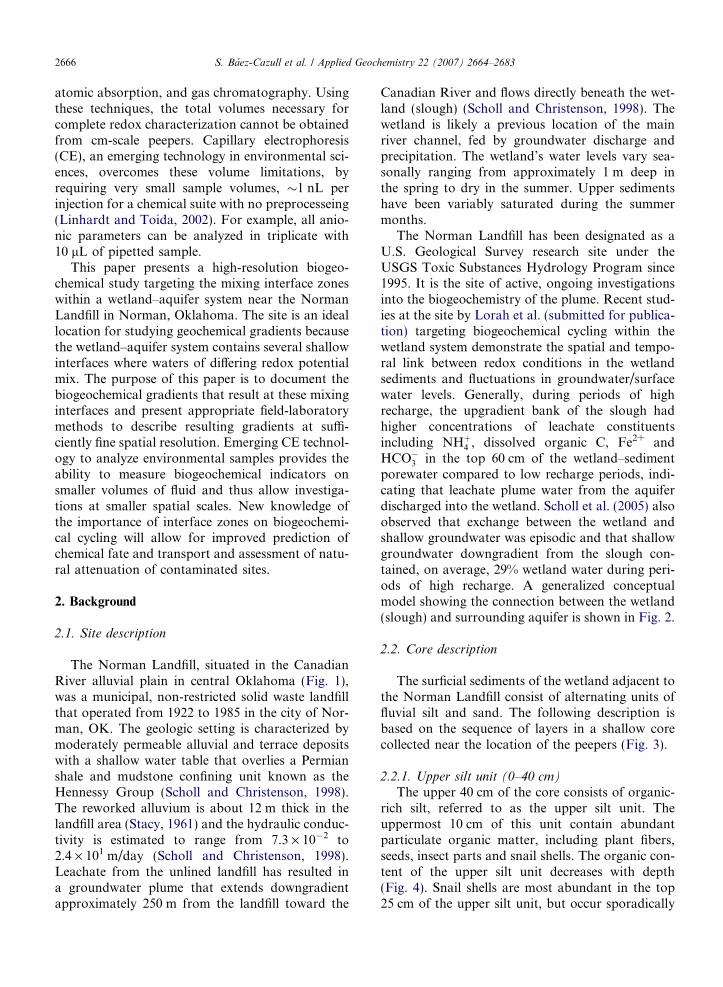
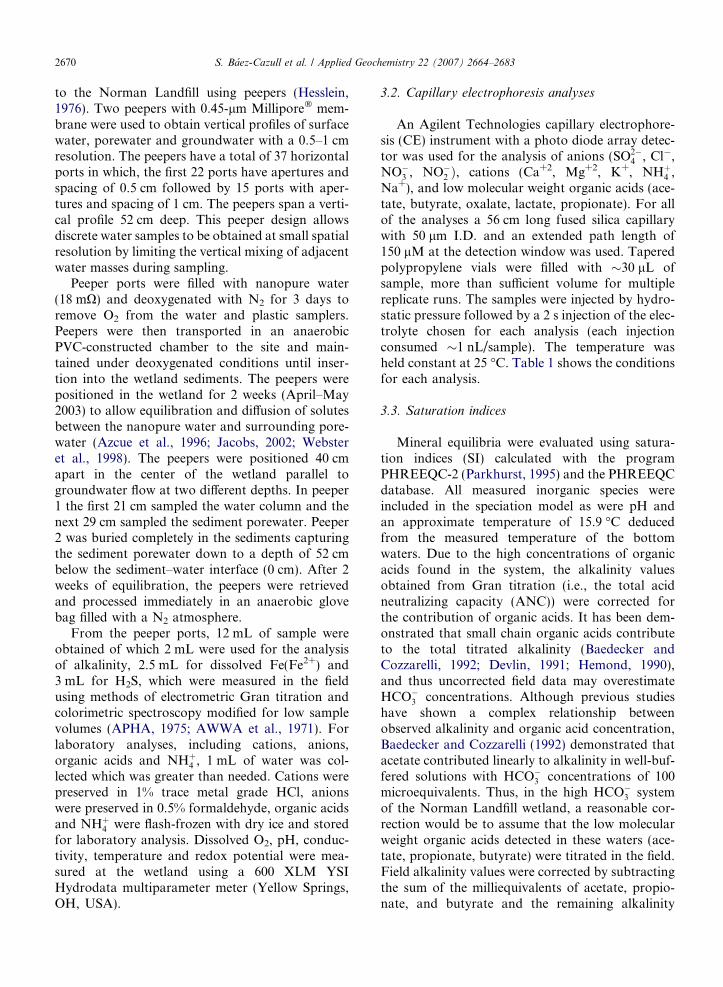
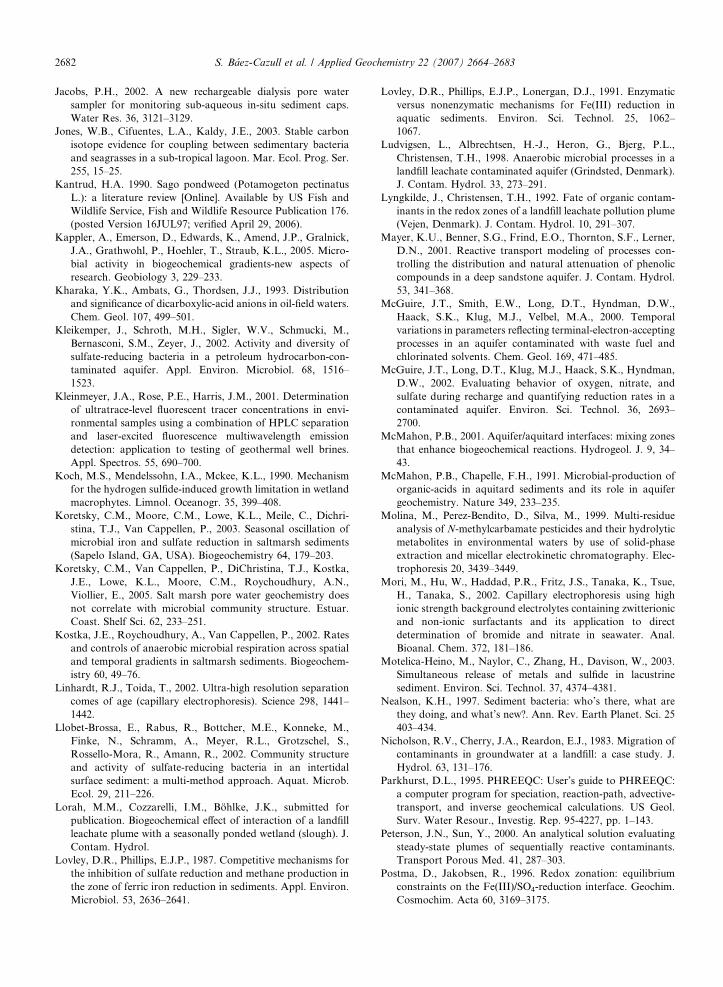
rich silt, referred to as the upper silt unit. Theuppermost 10 cm of this unit contain abundantparticulate organic matter, including plant fibers,seeds, insect parts and snail shells. The organic con-tent of the upper silt unit decreases with depth(Fig. 4). Snail shells are most abundant in the top25 cm of the upper silt unit, but occur sporadically
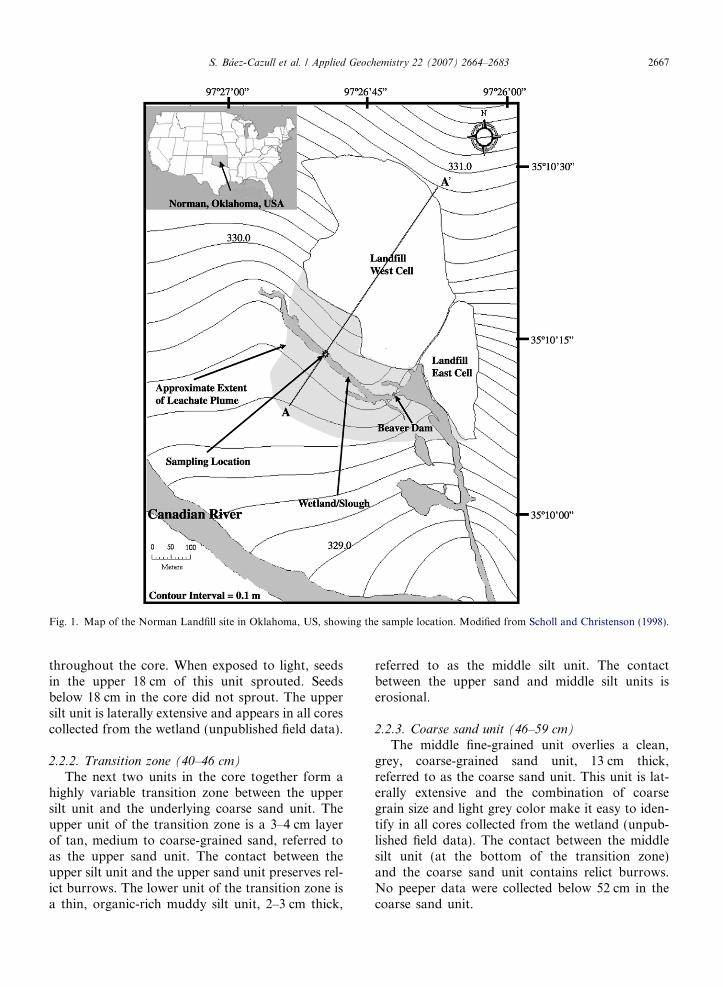
Fig. 1. Map of the Norman Landfill site in Oklahoma, US, showing the sample location. Modified from Scholl and Christenson (1998).
S. Baez-Cazull et al. / Applied Geochemistry 22 (2007) 2664–2683 2667
throughout the core. When exposed to light, seedsin the upper 18 cm of this unit sprouted. Seedsbelow 18 cm in the core did not sprout. The uppersilt unit is laterally extensive and appears in all corescollected from the wetland (unpublished field data).
2.2.2. Transition zone (40–46 cm)
The next two units in the core together form ahighly variable transition zone between the uppersilt unit and the underlying coarse sand unit. Theupper unit of the transition zone is a 3–4 cm layerof tan, medium to coarse-grained sand, referred toas the upper sand unit. The contact between theupper silt unit and the upper sand unit preserves rel-ict burrows. The lower unit of the transition zone isa thin, organic-rich muddy silt unit, 2–3 cm thick,
referred to as the middle silt unit. The contactbetween the upper sand and middle silt units iserosional.
2.2.3. Coarse sand unit (46–59 cm)
The middle fine-grained unit overlies a clean,grey, coarse-grained sand unit, 13 cm thick,referred to as the coarse sand unit. This unit is lat-erally extensive and the combination of coarsegrain size and light grey color make it easy to iden-tify in all cores collected from the wetland (unpub-lished field data). The contact between the middlesilt unit (at the bottom of the transition zone)and the coarse sand unit contains relict burrows.No peeper data were collected below 52 cm in thecoarse sand unit.
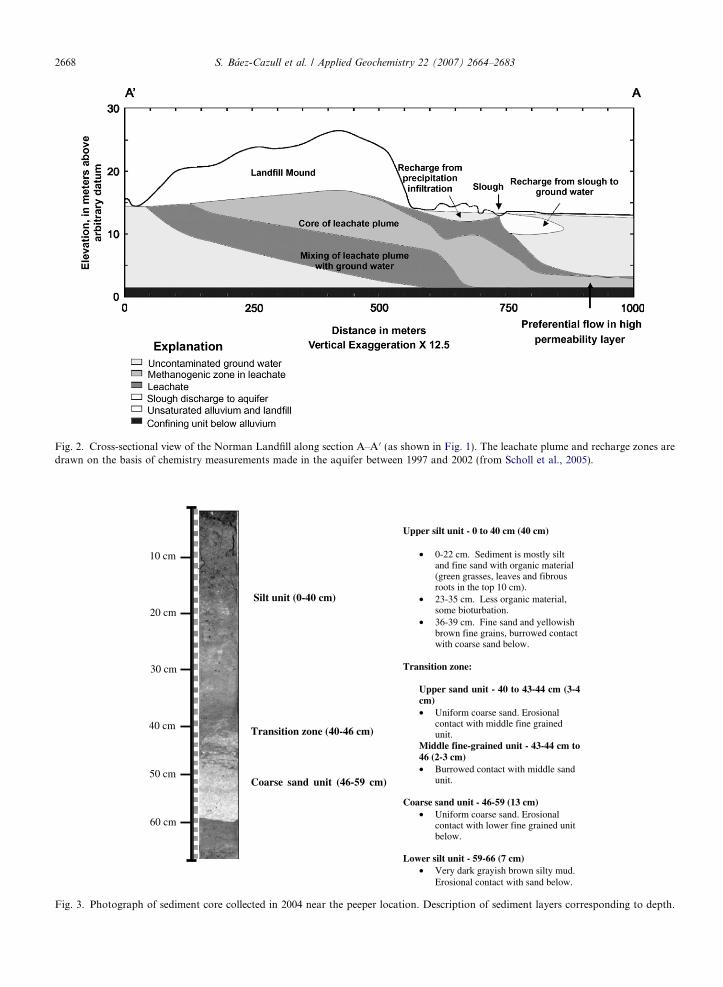
Fig. 2. Cross-sectional view of the Norman Landfill along section A–A 0 (as shown in Fig. 1). The leachate plume and recharge zones aredrawn on the basis of chemistry measurements made in the aquifer between 1997 and 2002 (from Scholl et al., 2005).
Upper silt unit - 0 to 40 cm (40 cm)
• 0-22 cm. Sediment is mostly silt and fine sand with organic material (green grasses, leaves and fibrous roots in the top 10 cm).
• 23-35 cm. Less organic material, some bioturbation.
• 36-39 cm. Fine sand and yellowish brown fine grains, burrowed contact with coarse sand below.
Transition zone:
Upper sand unit - 40 to 43-44 cm (3-4 cm)• Uniform coarse sand. Erosional
contact with middle fine grained unit.
Middle fine-grained unit - 43-44 cm to 46 (2-3 cm) • Burrowed contact with middle sand
unit.
Coarse sand unit - 46-59 (13 cm) • Uniform coarse sand. Erosional
contact with lower fine grained unit below.
Lower silt unit - 59-66 (7 cm) • Very dark grayish brown silty mud.
Erosional contact with sand below.
Silt unit (0-40 cm)
Coarse sand unit (46-59 cm)
Transition zone (40-46 cm)
60 cm
40 cm
30 cm
50 cm
10 cm
20 cm
Fig. 3. Photograph of sediment core collected in 2004 near the peeper location. Description of sediment layers corresponding to depth.
2668 S. Baez-Cazull et al. / Applied Geochemistry 22 (2007) 2664–2683
POM with depth1-mm sieved
0 50 100 150 200 250 300 350 400 450 500 550 600
-65 to -66 cm-56.2 to -57.6 cm-44.8 to -46.2 cm-43.4 to -44.8 cm
-42 to -43.4 cm-40.6 to -42 cm
-32.3 to -33.6 cm-30.8 to -32.2 cm-29.4 to 30.8 cm-28 to -29.4 cm-26.6 to -28 cm
-25.2 to -26.6 cm-23.8 to -25.2 cm-22.4 to -23.8 cm
-21 to -22.4 cm-19.6 to -21 cm
-18.2 to -19.6 cm-16.8 to -18.2 cm-15.4 to -16.8 cm
-14 to -15.4 cm-12.6 to -14 cm
-11.2 to -12.6 cm-9.8 to -11.2 cm-8.4 to -9.8 cm
-7 to -8.4 cm-5.6 to -7 cm
-4.2 to -5.6 cm-2.8 to -4.2 cm-1.4 to -2.8 cm
0 to -1.4 cm
dept
h (c
m)
POM (counts)
upper silt unit
upper sand
middle fine-grained
coarse sand
Seeds do not sprout below this line.
Fig. 4. Particulate organic matter (POM) counts from the >1 mm sieved fraction of the core shown in Fig. 3. Sand units yielded little or noPOM, and therefore, not all sand units from the core were sieved and thus do not appear on this diagram creating a non-linear scale.
S. Baez-Cazull et al. / Applied Geochemistry 22 (2007) 2664–2683 2669
2.2.4. Lower silt unit (59–66 cm)
The coarse sand unit overlies an organic-rich siltlayer, 7 cm thick, referred to as the lower silt unit.Like the coarse sand unit, the lower silt unit is later-ally extensive and was observed in a core collected5 m from the peeper (unpublished field data). Thecontact between the coarse sand layer and the lowersilt unit is erosional.
2.2.5. Lower sand unit (66–76 cm)At the bottom of this core, the lower silt unit
appears to have overlain a sandy layer, which wasnot retained during extraction. In a core collected5 m from the peeper (unpublished field data), thelower silt unit overlies a fine-grained sand layerreferred to as the lower sand unit.
The silt/sand couplets in these cores record 3depositional sequences. The coarse sand layers are
interpreted as flood deposits and the overlyingorganic-rich silts as wetland sediments. One implica-tion of this depositional interpretation is that sandunits reflect rapid deposition during floods, whereassilt layers may have accumulated slowly over a ser-ies of years. The contacts between the sand unitsand the underlying organic-rich silt units are ero-sional; the contacts between the sand units and theoverlying organic-rich silt units contain relict bur-rows indicating the influence of aquatic inverte-brates (probably crayfish).
3. Materials and methods
3.1. In situ measurements
Water samples were collected during the ‘‘wet’’spring season in May 2003 from the wetland adjacent
2670 S. Baez-Cazull et al. / Applied Geochemistry 22 (2007) 2664–2683
to the Norman Landfill using peepers (Hesslein,1976). Two peepers with 0.45-lm Millipore� mem-brane were used to obtain vertical profiles of surfacewater, porewater and groundwater with a 0.5–1 cmresolution. The peepers have a total of 37 horizontalports in which, the first 22 ports have apertures andspacing of 0.5 cm followed by 15 ports with aper-tures and spacing of 1 cm. The peepers span a verti-cal profile 52 cm deep. This peeper design allowsdiscrete water samples to be obtained at small spatialresolution by limiting the vertical mixing of adjacentwater masses during sampling.
Peeper ports were filled with nanopure water(18 mX) and deoxygenated with N2 for 3 days toremove O2 from the water and plastic samplers.Peepers were then transported in an anaerobicPVC-constructed chamber to the site and main-tained under deoxygenated conditions until inser-tion into the wetland sediments. The peepers werepositioned in the wetland for 2 weeks (April–May2003) to allow equilibration and diffusion of solutesbetween the nanopure water and surrounding pore-water (Azcue et al., 1996; Jacobs, 2002; Websteret al., 1998). The peepers were positioned 40 cmapart in the center of the wetland parallel togroundwater flow at two different depths. In peeper1 the first 21 cm sampled the water column and thenext 29 cm sampled the sediment porewater. Peeper2 was buried completely in the sediments capturingthe sediment porewater down to a depth of 52 cmbelow the sediment–water interface (0 cm). After 2weeks of equilibration, the peepers were retrievedand processed immediately in an anaerobic glovebag filled with a N2 atmosphere.
From the peeper ports, 12 mL of sample wereobtained of which 2 mL were used for the analysisof alkalinity, 2.5 mL for dissolved Fe(Fe2+) and3 mL for H2S, which were measured in the fieldusing methods of electrometric Gran titration andcolorimetric spectroscopy modified for low samplevolumes (APHA, 1975; AWWA et al., 1971). Forlaboratory analyses, including cations, anions,organic acids and NHþ4 , 1 mL of water was col-lected which was greater than needed. Cations werepreserved in 1% trace metal grade HCl, anionswere preserved in 0.5% formaldehyde, organic acidsand NHþ4 were flash-frozen with dry ice and storedfor laboratory analysis. Dissolved O2, pH, conduc-tivity, temperature and redox potential were mea-sured at the wetland using a 600 XLM YSIHydrodata multiparameter meter (Yellow Springs,OH, USA).
3.2. Capillary electrophoresis analyses
An Agilent Technologies capillary electrophore-sis (CE) instrument with a photo diode array detec-tor was used for the analysis of anions (SO2�
4 , Cl�,NO�3 , NO�2 Þ, cations (Ca+2, Mg+2, K+, NHþ4 ,Na+), and low molecular weight organic acids (ace-tate, butyrate, oxalate, lactate, propionate). For allof the analyses a 56 cm long fused silica capillarywith 50 lm I.D. and an extended path length of150 lM at the detection window was used. Taperedpolypropylene vials were filled with �30 lL ofsample, more than sufficient volume for multiplereplicate runs. The samples were injected by hydro-static pressure followed by a 2 s injection of the elec-trolyte chosen for each analysis (each injectionconsumed �1 nL/sample). The temperature washeld constant at 25 �C. Table 1 shows the conditionsfor each analysis.
3.3. Saturation indices
Mineral equilibria were evaluated using satura-tion indices (SI) calculated with the programPHREEQC-2 (Parkhurst, 1995) and the PHREEQCdatabase. All measured inorganic species wereincluded in the speciation model as were pH andan approximate temperature of 15.9 �C deducedfrom the measured temperature of the bottomwaters. Due to the high concentrations of organicacids found in the system, the alkalinity valuesobtained from Gran titration (i.e., the total acidneutralizing capacity (ANC)) were corrected forthe contribution of organic acids. It has been dem-onstrated that small chain organic acids contributeto the total titrated alkalinity (Baedecker andCozzarelli, 1992; Devlin, 1991; Hemond, 1990),and thus uncorrected field data may overestimateHCO�3 concentrations. Although previous studieshave shown a complex relationship betweenobserved alkalinity and organic acid concentration,Baedecker and Cozzarelli (1992) demonstrated thatacetate contributed linearly to alkalinity in well-buf-fered solutions with HCO�3 concentrations of 100microequivalents. Thus, in the high HCO�3 systemof the Norman Landfill wetland, a reasonable cor-rection would be to assume that the low molecularweight organic acids detected in these waters (ace-tate, propionate, butyrate) were titrated in the field.Field alkalinity values were corrected by subtractingthe sum of the milliequivalents of acetate, propio-nate, and butyrate and the remaining alkalinity
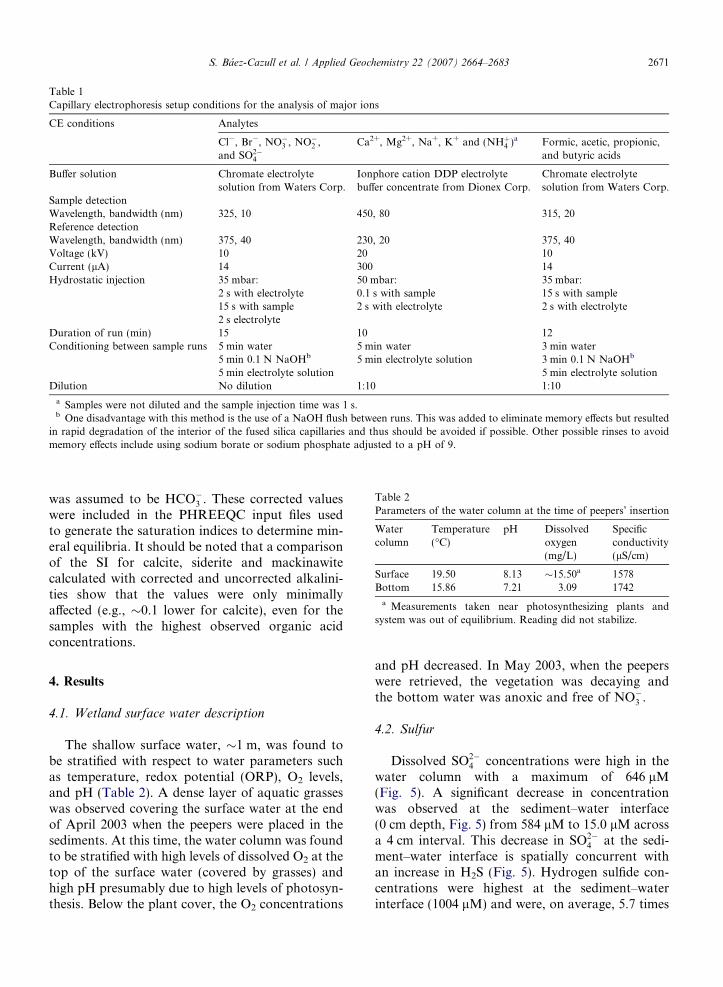
Table 1Capillary electrophoresis setup conditions for the analysis of major ions
CE conditions Analytes
Cl�, Br�, NO�3 , NO�2 ,and SO2�
4
Ca2+, Mg2+, Na+, K+ and (NHþ4 )a Formic, acetic, propionic,and butyric acids
Buffer solution Chromate electrolytesolution from Waters Corp.
Ionphore cation DDP electrolytebuffer concentrate from Dionex Corp.
Chromate electrolytesolution from Waters Corp.
Sample detectionWavelength, bandwidth (nm) 325, 10 450, 80 315, 20Reference detectionWavelength, bandwidth (nm) 375, 40 230, 20 375, 40Voltage (kV) 10 20 10Current (lA) 14 300 14Hydrostatic injection 35 mbar: 50 mbar: 35 mbar:
2 s with electrolyte 0.1 s with sample 15 s with sample15 s with sample2 s electrolyte
2 s with electrolyte 2 s with electrolyte
Duration of run (min) 15 10 12Conditioning between sample runs 5 min water 5 min water 3 min water
5 min 0.1 N NaOHb 5 min electrolyte solution 3 min 0.1 N NaOHb
5 min electrolyte solution 5 min electrolyte solutionDilution No dilution 1:10 1:10
a Samples were not diluted and the sample injection time was 1 s.b One disadvantage with this method is the use of a NaOH flush between runs. This was added to eliminate memory effects but resulted
in rapid degradation of the interior of the fused silica capillaries and thus should be avoided if possible. Other possible rinses to avoidmemory effects include using sodium borate or sodium phosphate adjusted to a pH of 9.
Table 2Parameters of the water column at the time of peepers’ insertion
Watercolumn
Temperature(�C)
pH Dissolvedoxygen(mg/L)
Specificconductivity(lS/cm)
Surface 19.50 8.13 �15.50a 1578Bottom 15.86 7.21 3.09 1742
a Measurements taken near photosynthesizing plants andsystem was out of equilibrium. Reading did not stabilize.
S. Baez-Cazull et al. / Applied Geochemistry 22 (2007) 2664–2683 2671
was assumed to be HCO�3 . These corrected valueswere included in the PHREEQC input files usedto generate the saturation indices to determine min-eral equilibria. It should be noted that a comparisonof the SI for calcite, siderite and mackinawitecalculated with corrected and uncorrected alkalini-ties show that the values were only minimallyaffected (e.g., �0.1 lower for calcite), even for thesamples with the highest observed organic acidconcentrations.
4. Results
4.1. Wetland surface water description
The shallow surface water, �1 m, was found tobe stratified with respect to water parameters suchas temperature, redox potential (ORP), O2 levels,and pH (Table 2). A dense layer of aquatic grasseswas observed covering the surface water at the endof April 2003 when the peepers were placed in thesediments. At this time, the water column was foundto be stratified with high levels of dissolved O2 at thetop of the surface water (covered by grasses) andhigh pH presumably due to high levels of photosyn-thesis. Below the plant cover, the O2 concentrations
and pH decreased. In May 2003, when the peeperswere retrieved, the vegetation was decaying andthe bottom water was anoxic and free of NO�3 .
4.2. Sulfur
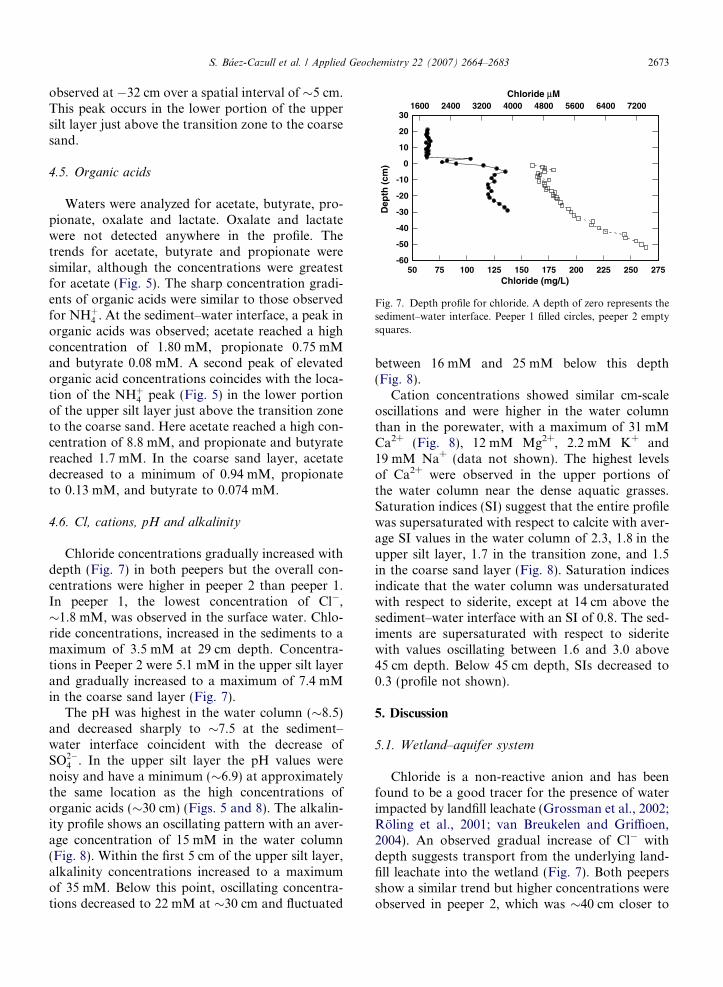
Dissolved SO2�4 concentrations were high in the
water column with a maximum of 646 lM(Fig. 5). A significant decrease in concentrationwas observed at the sediment–water interface(0 cm depth, Fig. 5) from 584 lM to 15.0 lM acrossa 4 cm interval. This decrease in SO2�
4 at the sedi-ment–water interface is spatially concurrent withan increase in H2S (Fig. 5). Hydrogen sulfide con-centrations were highest at the sediment–waterinterface (1004 lM) and were, on average, 5.7 times
Dep
th (
cm)
-3
-2
-1
0
1
2
3
4
5
SO42-
Fe2+
H2S
2672 S. Baez-Cazull et al. / Applied Geochemistry 22 (2007) 2664–2683
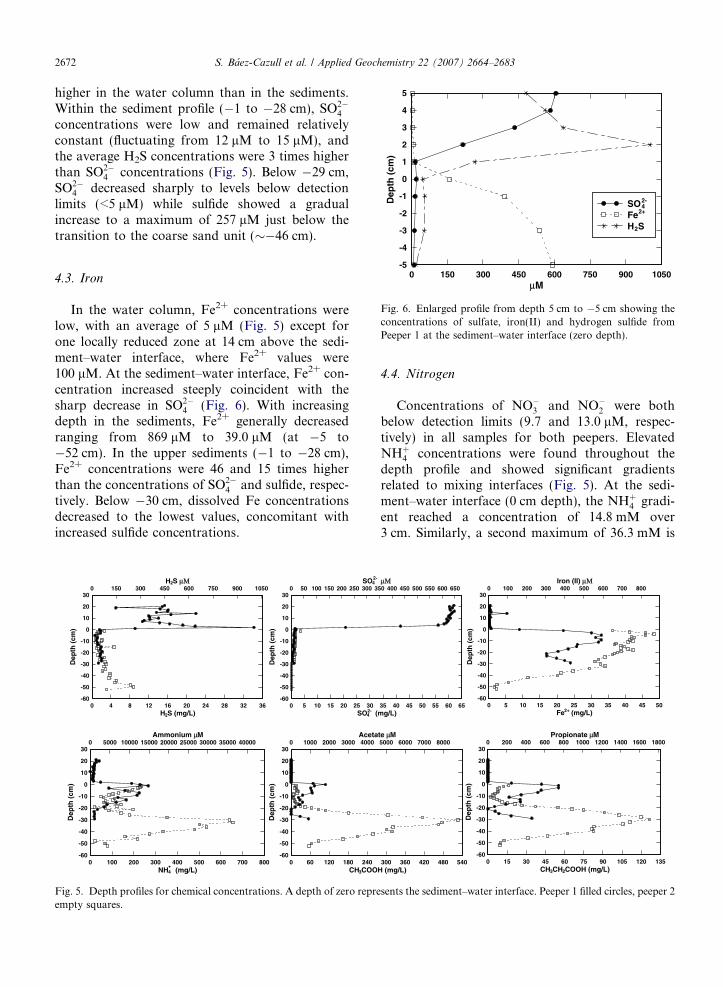
higher in the water column than in the sediments.Within the sediment profile (�1 to �28 cm), SO2�
4
concentrations were low and remained relativelyconstant (fluctuating from 12 lM to 15 lM), andthe average H2S concentrations were 3 times higherthan SO2�
4 concentrations (Fig. 5). Below �29 cm,SO2�
4 decreased sharply to levels below detectionlimits (<5 lM) while sulfide showed a gradualincrease to a maximum of 257 lM just below thetransition to the coarse sand unit (��46 cm).
μM0 150 300 450 600 750 900 1050
-5
-4
Fig. 6. Enlarged profile from depth 5 cm to �5 cm showing theconcentrations of sulfate, iron(II) and hydrogen sulfide fromPeeper 1 at the sediment–water interface (zero depth).
4.3. Iron
In the water column, Fe2+ concentrations werelow, with an average of 5 lM (Fig. 5) except forone locally reduced zone at 14 cm above the sedi-ment–water interface, where Fe2+ values were100 lM. At the sediment–water interface, Fe2+ con-centration increased steeply coincident with thesharp decrease in SO2�
4 (Fig. 6). With increasingdepth in the sediments, Fe2+ generally decreasedranging from 869 lM to 39.0 lM (at �5 to�52 cm). In the upper sediments (�1 to �28 cm),Fe2+ concentrations were 46 and 15 times higherthan the concentrations of SO2�
4 and sulfide, respec-tively. Below �30 cm, dissolved Fe concentrationsdecreased to the lowest values, concomitant withincreased sulfide concentrations.
SO (
SO
Dep
th (
cm)
0 5 10 15 20 25 30
0 50 100 150 200 250 300 3
-60
-50
-40
-30
-20
-10
0
10
20
30
H S (mg/L)
H S μΜ
Dep
th (
cm)
0 4 8 12 16 20 24 28 32 36
0 150 300 450 600 750 900 1050
-60
-50
-40
-30
-20
-10
0
10
20
30
CH COO
Aceta
Dep
th (
cm)
0 60 120 180 240
0 1000 2000 3000 4000
-60
-50
-40
-30
-20
-10
0
10
20
30
NH (mg/L)
Ammonium μM
Dep
th (
cm)
0 100 200 300 400 500 600 700 800
0 5000 10000 15000 20000 25000 30000 35000 40000
-60
-50
-40
-30
-20
-10
0
10
20
30
Fig. 5. Depth profiles for chemical concentrations. A depth of zero repreempty squares.
4.4. Nitrogen
Concentrations of NO�3 and NO�2 were bothbelow detection limits (9.7 and 13.0 lM, respec-tively) in all samples for both peepers. ElevatedNHþ4 concentrations were found throughout thedepth profile and showed significant gradientsrelated to mixing interfaces (Fig. 5). At the sedi-ment–water interface (0 cm depth), the NHþ4 gradi-ent reached a concentration of 14.8 mM over3 cm. Similarly, a second maximum of 36.3 mM is
Fe (mg/L)
Iron (II) μΜ
Dep
th (
cm)
0 5 10 15 20 25 30 35 40 45 50
0 100 200 300 400 500 600 700 800
-60
-50
-40
-30
-20
-10
0
10
20
30
mg/L)
μΜ
35 40 45 50 55 60 65
50 400 450 500 550 600 650
CH CH COOH (mg/L)
Propionate μM
Dep
th (
cm)
0 15 30 45 60 75 90 105 120 135
0 200 400 600 800 1000 1200 1400 1600 1800
-60
-50
-40
-30
-20
-10
0
10
20
30
H (mg/L)
te μM
300 360 420 480 540
5000 6000 7000 8000
sents the sediment–water interface. Peeper 1 filled circles, peeper 2
Chloride (mg/L)
Chloride μM
Dep
th (
cm)
50 75 100 125 150 175 200 225 250 275
1600 2400 3200 4000 4800 5600 6400 7200
-60
-50
-40
-30
-20
-10
0
10
20
30
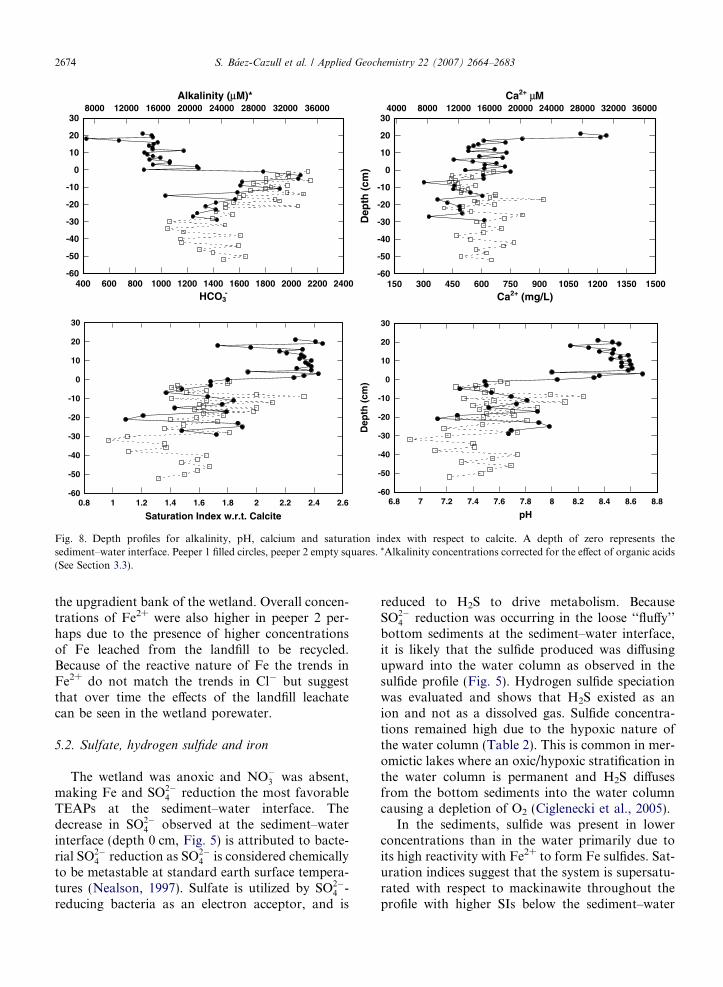
Fig. 7. Depth profile for chloride. A depth of zero represents thesediment–water interface. Peeper 1 filled circles, peeper 2 emptysquares.
S. Baez-Cazull et al. / Applied Geochemistry 22 (2007) 2664–2683 2673
observed at �32 cm over a spatial interval of �5 cm.This peak occurs in the lower portion of the uppersilt layer just above the transition zone to the coarsesand.
4.5. Organic acids
Waters were analyzed for acetate, butyrate, pro-pionate, oxalate and lactate. Oxalate and lactatewere not detected anywhere in the profile. Thetrends for acetate, butyrate and propionate weresimilar, although the concentrations were greatestfor acetate (Fig. 5). The sharp concentration gradi-ents of organic acids were similar to those observedfor NHþ4 . At the sediment–water interface, a peak inorganic acids was observed; acetate reached a highconcentration of 1.80 mM, propionate 0.75 mMand butyrate 0.08 mM. A second peak of elevatedorganic acid concentrations coincides with the loca-tion of the NHþ4 peak (Fig. 5) in the lower portionof the upper silt layer just above the transition zoneto the coarse sand. Here acetate reached a high con-centration of 8.8 mM, and propionate and butyratereached 1.7 mM. In the coarse sand layer, acetatedecreased to a minimum of 0.94 mM, propionateto 0.13 mM, and butyrate to 0.074 mM.
4.6. Cl, cations, pH and alkalinity
Chloride concentrations gradually increased withdepth (Fig. 7) in both peepers but the overall con-centrations were higher in peeper 2 than peeper 1.In peeper 1, the lowest concentration of Cl�,�1.8 mM, was observed in the surface water. Chlo-ride concentrations, increased in the sediments to amaximum of 3.5 mM at 29 cm depth. Concentra-tions in Peeper 2 were 5.1 mM in the upper silt layerand gradually increased to a maximum of 7.4 mMin the coarse sand layer (Fig. 7).
The pH was highest in the water column (�8.5)and decreased sharply to �7.5 at the sediment–water interface coincident with the decrease ofSO2�
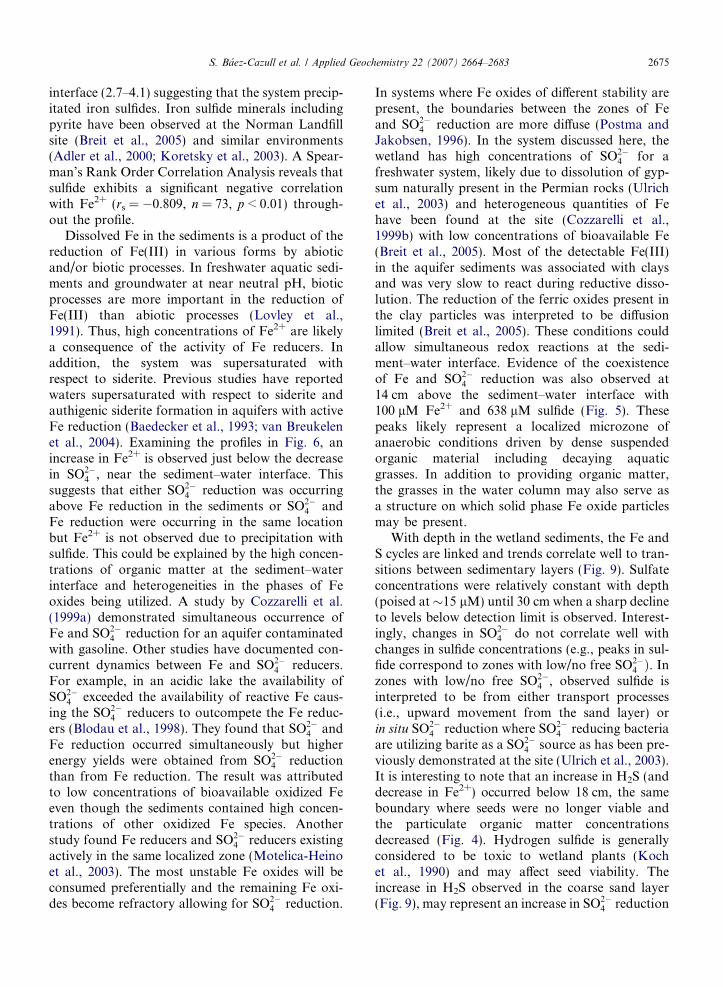
4 . In the upper silt layer the pH values werenoisy and have a minimum (�6.9) at approximatelythe same location as the high concentrations oforganic acids (�30 cm) (Figs. 5 and 8). The alkalin-ity profile shows an oscillating pattern with an aver-age concentration of 15 mM in the water column(Fig. 8). Within the first 5 cm of the upper silt layer,alkalinity concentrations increased to a maximumof 35 mM. Below this point, oscillating concentra-tions decreased to 22 mM at �30 cm and fluctuated
between 16 mM and 25 mM below this depth(Fig. 8).
Cation concentrations showed similar cm-scaleoscillations and were higher in the water columnthan in the porewater, with a maximum of 31 mMCa2+ (Fig. 8), 12 mM Mg2+, 2.2 mM K+ and19 mM Na+ (data not shown). The highest levelsof Ca2+ were observed in the upper portions ofthe water column near the dense aquatic grasses.Saturation indices (SI) suggest that the entire profilewas supersaturated with respect to calcite with aver-age SI values in the water column of 2.3, 1.8 in theupper silt layer, 1.7 in the transition zone, and 1.5in the coarse sand layer (Fig. 8). Saturation indicesindicate that the water column was undersaturatedwith respect to siderite, except at 14 cm above thesediment–water interface with an SI of 0.8. The sed-iments are supersaturated with respect to sideritewith values oscillating between 1.6 and 3.0 above45 cm depth. Below 45 cm depth, SIs decreased to0.3 (profile not shown).
5. Discussion
5.1. Wetland–aquifer system
Chloride is a non-reactive anion and has beenfound to be a good tracer for the presence of waterimpacted by landfill leachate (Grossman et al., 2002;Roling et al., 2001; van Breukelen and Griffioen,2004). An observed gradual increase of Cl� withdepth suggests transport from the underlying land-fill leachate into the wetland (Fig. 7). Both peepersshow a similar trend but higher concentrations wereobserved in peeper 2, which was �40 cm closer to
Ca2+ (mg/L)
Ca2+ μM
Dep
th (
cm)
150 300 450 600 750 900 1050 1200 1350 1500
4000 8000 12000 16000 20000 24000 28000 32000 36000
-60
-50
-40
-30
-20
-10
0
10
20
30
HCO3-
Alkalinity (μM)*
400 600 800 1000 1200 1400 1600 1800 2000 2200 2400
8000 12000 16000 20000 24000 28000 32000 36000
-60
-50
-40
-30
-20
-10
0
10
20
30
Saturation Index w.r.t. Calcite0.8 1 1.2 1.4 1.6 1.8 2 2.2 2.4 2.6
-60
-50
-40
-30
-20
-10
0
10
20
30
pH
Dep
th (
cm)
6.8 7 7.2 7.4 7.6 7.8 8 8.2 8.4 8.6 8.8-60
-50
-40
-30
-20
-10
0
10
20
30
Fig. 8. Depth profiles for alkalinity, pH, calcium and saturation index with respect to calcite. A depth of zero represents thesediment–water interface. Peeper 1 filled circles, peeper 2 empty squares. *Alkalinity concentrations corrected for the effect of organic acids(See Section 3.3).
2674 S. Baez-Cazull et al. / Applied Geochemistry 22 (2007) 2664–2683
the upgradient bank of the wetland. Overall concen-trations of Fe2+ were also higher in peeper 2 per-haps due to the presence of higher concentrationsof Fe leached from the landfill to be recycled.Because of the reactive nature of Fe the trends inFe2+ do not match the trends in Cl� but suggestthat over time the effects of the landfill leachatecan be seen in the wetland porewater.
5.2. Sulfate, hydrogen sulfide and iron
The wetland was anoxic and NO�3 was absent,making Fe and SO2�
4 reduction the most favorableTEAPs at the sediment–water interface. Thedecrease in SO2�
4 observed at the sediment–waterinterface (depth 0 cm, Fig. 5) is attributed to bacte-rial SO2�
4 reduction as SO2�4 is considered chemically
to be metastable at standard earth surface tempera-tures (Nealson, 1997). Sulfate is utilized by SO2�
4 -reducing bacteria as an electron acceptor, and is
reduced to H2S to drive metabolism. BecauseSO2�
4 reduction was occurring in the loose ‘‘fluffy’’bottom sediments at the sediment–water interface,it is likely that the sulfide produced was diffusingupward into the water column as observed in thesulfide profile (Fig. 5). Hydrogen sulfide speciationwas evaluated and shows that H2S existed as anion and not as a dissolved gas. Sulfide concentra-tions remained high due to the hypoxic nature ofthe water column (Table 2). This is common in mer-omictic lakes where an oxic/hypoxic stratification inthe water column is permanent and H2S diffusesfrom the bottom sediments into the water columncausing a depletion of O2 (Ciglenecki et al., 2005).
In the sediments, sulfide was present in lowerconcentrations than in the water primarily due toits high reactivity with Fe2+ to form Fe sulfides. Sat-uration indices suggest that the system is supersatu-rated with respect to mackinawite throughout theprofile with higher SIs below the sediment–water
S. Baez-Cazull et al. / Applied Geochemistry 22 (2007) 2664–2683 2675
interface (2.7–4.1) suggesting that the system precip-itated iron sulfides. Iron sulfide minerals includingpyrite have been observed at the Norman Landfillsite (Breit et al., 2005) and similar environments(Adler et al., 2000; Koretsky et al., 2003). A Spear-man’s Rank Order Correlation Analysis reveals thatsulfide exhibits a significant negative correlationwith Fe2+ (rs = �0.809, n = 73, p < 0.01) through-out the profile.
Dissolved Fe in the sediments is a product of thereduction of Fe(III) in various forms by abioticand/or biotic processes. In freshwater aquatic sedi-ments and groundwater at near neutral pH, bioticprocesses are more important in the reduction ofFe(III) than abiotic processes (Lovley et al.,1991). Thus, high concentrations of Fe2+ are likelya consequence of the activity of Fe reducers. Inaddition, the system was supersaturated withrespect to siderite. Previous studies have reportedwaters supersaturated with respect to siderite andauthigenic siderite formation in aquifers with activeFe reduction (Baedecker et al., 1993; van Breukelenet al., 2004). Examining the profiles in Fig. 6, anincrease in Fe2+ is observed just below the decreasein SO2�
4 , near the sediment–water interface. Thissuggests that either SO2�
4 reduction was occurringabove Fe reduction in the sediments or SO2�
4 andFe reduction were occurring in the same locationbut Fe2+ is not observed due to precipitation withsulfide. This could be explained by the high concen-trations of organic matter at the sediment–waterinterface and heterogeneities in the phases of Feoxides being utilized. A study by Cozzarelli et al.(1999a) demonstrated simultaneous occurrence ofFe and SO2�
4 reduction for an aquifer contaminatedwith gasoline. Other studies have documented con-current dynamics between Fe and SO2�
4 reducers.For example, in an acidic lake the availability ofSO2�
4 exceeded the availability of reactive Fe caus-ing the SO2�
4 reducers to outcompete the Fe reduc-ers (Blodau et al., 1998). They found that SO2�
4 andFe reduction occurred simultaneously but higherenergy yields were obtained from SO2�
4 reductionthan from Fe reduction. The result was attributedto low concentrations of bioavailable oxidized Feeven though the sediments contained high concen-trations of other oxidized Fe species. Anotherstudy found Fe reducers and SO2�
4 reducers existingactively in the same localized zone (Motelica-Heinoet al., 2003). The most unstable Fe oxides will beconsumed preferentially and the remaining Fe oxi-des become refractory allowing for SO2�
4 reduction.
In systems where Fe oxides of different stability arepresent, the boundaries between the zones of Feand SO2�
4 reduction are more diffuse (Postma andJakobsen, 1996). In the system discussed here, thewetland has high concentrations of SO2�
4 for afreshwater system, likely due to dissolution of gyp-sum naturally present in the Permian rocks (Ulrichet al., 2003) and heterogeneous quantities of Fehave been found at the site (Cozzarelli et al.,1999b) with low concentrations of bioavailable Fe(Breit et al., 2005). Most of the detectable Fe(III)in the aquifer sediments was associated with claysand was very slow to react during reductive disso-lution. The reduction of the ferric oxides present inthe clay particles was interpreted to be diffusionlimited (Breit et al., 2005). These conditions couldallow simultaneous redox reactions at the sedi-ment–water interface. Evidence of the coexistenceof Fe and SO2�
4 reduction was also observed at14 cm above the sediment–water interface with100 lM Fe2+ and 638 lM sulfide (Fig. 5). Thesepeaks likely represent a localized microzone ofanaerobic conditions driven by dense suspendedorganic material including decaying aquaticgrasses. In addition to providing organic matter,the grasses in the water column may also serve asa structure on which solid phase Fe oxide particlesmay be present.
With depth in the wetland sediments, the Fe andS cycles are linked and trends correlate well to tran-sitions between sedimentary layers (Fig. 9). Sulfateconcentrations were relatively constant with depth(poised at�15 lM) until 30 cm when a sharp declineto levels below detection limit is observed. Interest-ingly, changes in SO2�
4 do not correlate well withchanges in sulfide concentrations (e.g., peaks in sul-fide correspond to zones with low/no free SO2�
4 Þ. Inzones with low/no free SO2�
4 , observed sulfide isinterpreted to be from either transport processes(i.e., upward movement from the sand layer) orin situ SO2�
4 reduction where SO2�4 reducing bacteria
are utilizing barite as a SO2�4 source as has been pre-
viously demonstrated at the site (Ulrich et al., 2003).It is interesting to note that an increase in H2S (anddecrease in Fe2+) occurred below 18 cm, the sameboundary where seeds were no longer viable andthe particulate organic matter concentrationsdecreased (Fig. 4). Hydrogen sulfide is generallyconsidered to be toxic to wetland plants (Kochet al., 1990) and may affect seed viability. Theincrease in H2S observed in the coarse sand layer(Fig. 9), may represent an increase in SO2�
4 reduction
μM
Dep
th (
cm)
0 100 200 300 400 500 600 700 800 900-60
-50
-40
-30
-20
-10
0
Silt unit
Transition zone
Coarse sand unit
SOFeH SViable seed boundaryUpper transition zoneLower transition zone
μM
Dep
th (
cm)
0 1000 2000 3000 4000 5000 6000 7000 8000-60
-50
-40
-30
-20
-10
0
Silt unit
Transition zone
Coarse sand unit
AcetateButyratePropionateViable seed boundaryUpper transition zoneLower transition zone
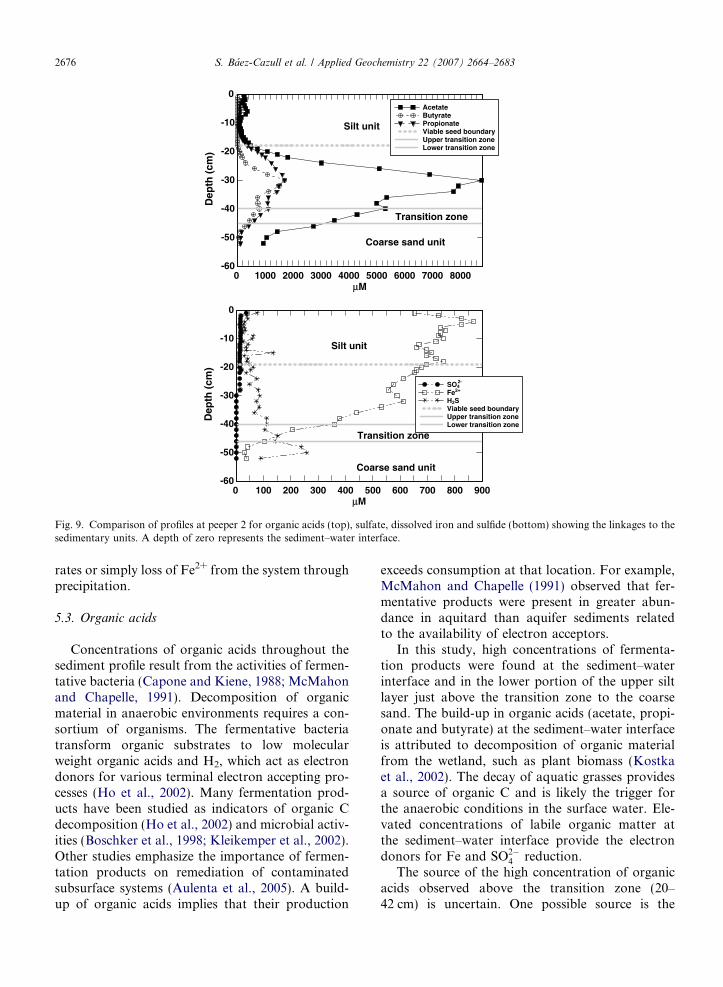
Fig. 9. Comparison of profiles at peeper 2 for organic acids (top), sulfate, dissolved iron and sulfide (bottom) showing the linkages to thesedimentary units. A depth of zero represents the sediment–water interface.
2676 S. Baez-Cazull et al. / Applied Geochemistry 22 (2007) 2664–2683
rates or simply loss of Fe2+ from the system throughprecipitation.
5.3. Organic acids
Concentrations of organic acids throughout thesediment profile result from the activities of fermen-tative bacteria (Capone and Kiene, 1988; McMahonand Chapelle, 1991). Decomposition of organicmaterial in anaerobic environments requires a con-sortium of organisms. The fermentative bacteriatransform organic substrates to low molecularweight organic acids and H2, which act as electrondonors for various terminal electron accepting pro-cesses (Ho et al., 2002). Many fermentation prod-ucts have been studied as indicators of organic Cdecomposition (Ho et al., 2002) and microbial activ-ities (Boschker et al., 1998; Kleikemper et al., 2002).Other studies emphasize the importance of fermen-tation products on remediation of contaminatedsubsurface systems (Aulenta et al., 2005). A build-up of organic acids implies that their production
exceeds consumption at that location. For example,McMahon and Chapelle (1991) observed that fer-mentative products were present in greater abun-dance in aquitard than aquifer sediments relatedto the availability of electron acceptors.
In this study, high concentrations of fermenta-tion products were found at the sediment–waterinterface and in the lower portion of the upper siltlayer just above the transition zone to the coarsesand. The build-up in organic acids (acetate, propi-onate and butyrate) at the sediment–water interfaceis attributed to decomposition of organic materialfrom the wetland, such as plant biomass (Kostkaet al., 2002). The decay of aquatic grasses providesa source of organic C and is likely the trigger forthe anaerobic conditions in the surface water. Ele-vated concentrations of labile organic matter atthe sediment–water interface provide the electrondonors for Fe and SO2�
4 reduction.The source of the high concentration of organic
acids observed above the transition zone (20–42 cm) is uncertain. One possible source is the
S. Baez-Cazull et al. / Applied Geochemistry 22 (2007) 2664–2683 2677
decomposition of a localized concentration oforganic matter. Although, the overall trend of theparticulate organic matter found in the core(Fig. 4) shows a decrease with depth, this does notexclude the possibility that a local organic concen-tration exists near the peepers given the heterogene-ity of the macrobiology in the system. Anotherpossibility is that the organic acids originate fromdegradation of DOC from the leachate plume. Dis-charge from the aquifer into the wetland duringrecharge periods can be a source of DOC to the wet-land sediments (Lorah et al., submitted for publica-tion). The gradual increase in Cl� concentrationswith depth supports that leachate components havemigrated upward into the wetland. However, thehighest concentrations of DOC (160 mg/L) foundin the leachate-contaminated aquifer upgradientfrom the wetland (Eganhouse et al., 2001) are muchlower than the sum of organic acids observed in thisstudy. A likely scenario is that both natural DOCfrom buried organic matter in the wetland andDOC from leachate contribute to the high acetateconcentrations observed.
Below �18 cm, concentrations of organic acidsincrease reaching a maximum at �30 cm due tothe low availability of electron acceptors. This issupported by other studies that have shown steepgradients in organic acids associated with abruptchanges in biological activity due to changes in thesupply of electron acceptors, temperature, supplyof labile organic C, or shifts in methanogen popula-tion (Cozzarelli et al., 1994; Ho et al., 2002; Shan-non and White, 1996). Acetate concentrationreaches 8800 lM, which is 4 times higher than thepeak at the sediment–water interface and higherthan levels reported in the literature (Fig. 9). Studiesin diverse sedimentary environments report acetateconcentrations such as, 1000 lM in peat bogs (Dud-dleston et al., 2002; Shannon and White, 1996),1200 lM (Kostka et al., 2002) and 1600 lM (Hineset al., 1994) in salt-marsh sediments, 60 lM(McMahon and Chapelle, 1991) and 500 lM(McMahon, 2001) in aquifer–aquitard sediments,25 lM in estuarine sediments (Wellsbury and Par-kes, 1995), and 10 lM in marine environments(Ho et al., 2002). However, in petroleum depositslow molecular weight organic acids can reach higherconcentrations up to 166,500 lM (10,000 mg/L foracetate) (Kharaka et al., 1993).
In addition to finding a steep gradient of organicacids in the upper silt layer, the shape and locationof this gradient is also interesting (Fig. 9). The steep
increase in organic acids at 18 cm coincides with themaximum depth of seed viability in the core andwith decreased levels of coarse particulate organicmatter (Fig. 4). Loss of seed viability may be aresponse to increased levels of organic acid in theporewater, as well as increased levels of H2S (seeSection 5.2). Crop residues have been shown to inhi-bit seed germination in fields due to high levels ofphenolic acid in the soil (Sene et al., 2000). How-ever, almost no data exist on the link between seedviability and the abundance of simple organic acidsin wetland soil. The steep increase in organic acidsmay also signal a change in the quality of particu-late organic matter below 18 cm. This is the focusof ongoing studies.
5.4. Ammonium and nitrate
Thermodynamics suggest that NO�3 will be oneof the first alternate electron acceptors to be utilizedby anaerobic bacteria in anoxic aquifers. Nitratewas below detection limits throughout the profilessuggesting that any available NO�3 has been con-sumed and less thermodynamically favorable pro-cesses (e.g., SO2�
4 reduction) dominate. Theprimary N species in the system is NHþ4 which orig-inates from both active microbial cycling of wetlandorganic matter and transport from the landfill leach-ate plume. Elevated NHþ4 concentrations werefound throughout the sediment profile (Fig. 5) butgenerally follow the same trend as acetate, propio-nate, and butyrate with maximum concentrationsat the sediment–water interface and �30 cm depthsuggesting a similar source (see Section 5.6). Thecorrelation of NHþ4 and organic acids is consistentwith mineralization of organic matter as noted inother studies (Bally et al., 2004). The high levels ofNHþ4 together with lower pH and higher alkalinitiessuggest significant organic matter degradation.
5.5. Cations and alkalinity
The alkalinity profile is controlled by TEAPs andmineral precipitation/dissolution reactions. Ironand SO2�
4 reduction increase alkalinity whereasmethanogenesis decreases alkalinity (Schlesinger,1997). In the surface water, alkalinities are lowerwith the exception of a peak at 14 cm above the sed-iment water–interface where other TEAP indicatorssuggest Fe and SO2�
4 reduction. At the sediment–water interface, a sharp increase in alkalinity is con-sistent with the sharp increase in Fe2+ and decrease
2678 S. Baez-Cazull et al. / Applied Geochemistry 22 (2007) 2664–2683
in SO2�4 . These trends support the interpretation of
active SO2�4 and Fe reduction at 14 cm and at the
sediment–water interface. With depth in thesediments, alkalinities decrease as a result of CO2
reduction likely by methanogenesis and possibleprecipitation of carbonate minerals including calciteand siderite. The surface water is undersaturatedwith respect to siderite with the exception of 14 cm(SI = 0.8) and within the silt unit, siderite SIsincrease to 2–3 suggesting the system favors precip-itation of siderite, which will decrease alkalinity.Saturation indices indicate that the system is super-saturated with respect to calcite (Fig. 8), however,the extent to which calcite is precipitating is unclear.Calcium concentrations are unusually high through-out the profile (highest concentrations observed inthe upper water column near the aquatic grasses,see Section 5.6). These values may be explained bythe high concentrations of organic C present inthe system. Dissolved organic compounds andhumic acids have been shown to inhibit calcite pre-cipitation (Reynolds, 1978) and may explain the sys-tem being out of equilibrium.
5.6. Vegetation effects
Aquatic plants floating in the wetland providean O2 source to the surface water via photosynthe-sis. Oxygen levels (�15.9 mg/L) within the top10 cm of the surface water are supersaturated (the-oretical saturation at 20 �C is 10.9 mg/L). Measure-ments were taken from waters in contact with theaquatic vegetation and high concentrations areattributed to active photosynthesis. Senescence ofthe thick layer of aquatic grasses leads to decompo-sition of organic matter coupled to the depletion ofO2 and other electron acceptors. Jones et al. (2003)suggested that the redox gradient from oxic toanoxic conditions in the water column is influencedby the dynamic activity of aquatic plant cover. Therandom distribution of aquatic vegetation in thesystem resulted in microzones of reducing condi-tions within the water column as evidenced by (1)the increase in NHþ4 and decrease in SO2�
4 at20 cm above the sediment–water interface and (2)elevated sulfide and Fe2+ concentrations at 14 cmabove the sediments.
The input of organic matter from decomposingplants provides abundant electron donors at thesediment–water interface for Fe and SO2�
4 reduc-tion. Previous studies found an increase in SO2�
4
reduction rates when a wetland was covered with
vegetation (Hines et al., 1989; Koretsky et al.,2005) and demonstrated the influence on redoxstratification in the sediments to be more pro-nounced in the summer than in the winter due tovegetation dynamics (Koretsky et al., 2005).
Calcium carbonate dynamics also appear to belinked to the vegetation in the wetland system. Inthe upper portion of the water column, where aqua-tic grasses are abundant, Ca2+ concentrations andcalcite SI were at their highest (�31 mM and 2.4,respectively). This is consistent with the possibilitythat grasses are playing a role in the cycling ofCaCO3 in the system. Some aquatic grasses suchas sago pondweed precipitate CaCO3 on theirleaves, stems and lacunae which can be released tothe water upon senescence (Kantrud, 1990).
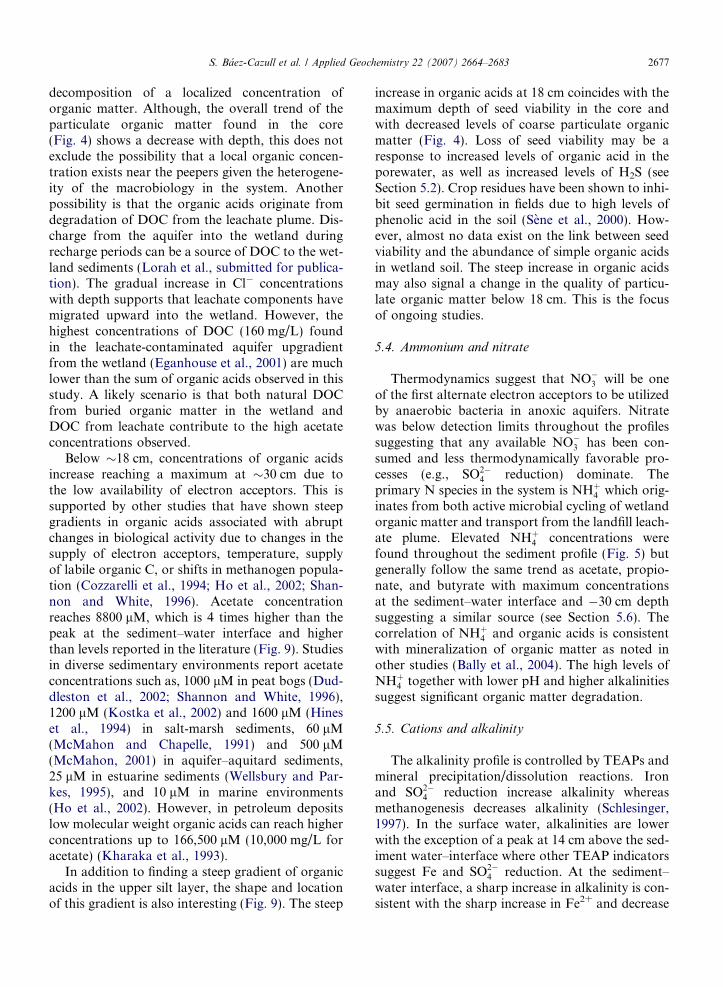
5.7. Scale considerations
The potential effect of collecting samples at a lar-ger spatial resolution than the cm-scale used in thisstudy was evaluated numerically using the acetateconcentrations measured in Peeper 2 as an example.The concentrations of acetate that would have beenobserved had samples been collected at intervals of5 cm or 10 cm (Cw) were calculated by
Cw ¼P
VkiCkiPVki
where Cki is the actual acetate concentrations mea-sured at 1 cm intervals and Vki is total volume asso-ciated with that concentration. Results show that ifsamples were collected at 5 cm intervals, the generaltrend would be the same but the maximum concen-tration observed would be �78% of that observedusing 1cm sampling (Fig. 10). The use of an evenlarger sampling interval, 10 cm, results in a substan-tially different concentration profile with the loca-tion of the maximum concentration being shifted�7 cm lower than the peak concentration shownin the 1 cm profile. In addition, at �30 cm depth,the acetate concentration predicted from the10 cm sampling interval would be �60% of thatshown in the 1 cm profile (Fig. 10). This exerciseillustrates the significant impact that the scale ofthe sampling interval has on the observable concen-tration profiles in heterogeneous systems such asthis.
Sampling at discrete 0.5–1 cm intervals was suffi-cient to resolve steep gradients observed (1) withinthe water column (e.g., 0.5 cm peaks in Fe2+ andH2S at 14 cm above the sediment–water interface),
Acetate μM0 1000 2000 3000 4000 5000 6000 7000 8000 9000
-60
-55
-50
-45
-40
-35
-30
-25
-20
-15
-10
-5
0
Sampling Interval1 cm5 cm10 cm
Fig. 10. Model of acetate concentrations by increasing thesample scale (5 and 10 cm) compared to the acetate concentra-tions obtained from peeper 2 (1 cm).
S. Baez-Cazull et al. / Applied Geochemistry 22 (2007) 2664–2683 2679
(2) at the sediment–water interface (e.g., decrease inSO2�
4 /increases in H2S and Fe2+ over 4 cm), (3) atmajor lithologic boundaries within the sediment(e.g. decrease in organic acids in the transition zoneto the coarse sand layer), and (4) within the sedi-ment not associated with major lithologic contacts(e.g., �20 cm peak in organic acids at 30 cm depthwithin the silt unit; oscillations of carbonate chemis-try over 3–4 cm intervals). Although the microbio-logical processes controlling these gradients likelyoccur at a smaller (lm) scale, it is clear that resultingchemical dynamics can be resolved at the cm-scalein this system. This suggests that the combined useof small-scale peepers to collect discrete field sam-ples and capillary electrophoresis to conduct com-plete geochemical analyses on limited samplevolumes is a powerful technique for providing newinsights into redox dynamics.
CE technology is becoming popular in environ-mental studies due to the wide arrange of chemicalcompounds that can be analyzed even in complexmatrices. Some of the applications of CE include:analysis of organic acids in water and air (Dabek-Zlotorzynska et al., 2005; Huang et al., 2005; Wuet al., 2003), analysis of pesticides and pollutantsin environmental waters (Frıas et al., 2004; Hsiehand Huang, 1996; Molina et al., 1999; Safarpouret al., 2004; Sanchez et al., 2003), analysis of miner-als in hydrothermal veins (Voicu and Hallbauer,2005), analysis of trace metals in water and air(Dabek-Zlotorzynska et al., 2003; Fung and Lau,2001a; Shakulashvili et al., 2000; Yang et al.,2003), oxyanions in groundwater (Fung and Lau,2001b), analysis of tracers in brine (Kleinmeyer
et al., 2001), separation and quantification of Fespecies (Rennert and Mansfeldt, 2005; Seidel andFaubel, 1998), Br� and NO3 in seawater (Moriet al., 2002), N species (Yao and Xu, 2002), and Sspecies (Chen and Naidu, 2003). Given theseadvances, the combined use of peepers and CE haveapplications to a wide range of biogeochemicalquestions at small scales and can provide insightsinto linkages between microorganisms, mineralsand aqueous solutions. Modifications to fieldsampling designs could allow resolution of gradientsat even finer spatial resolution than presentedhere.
6. Conclusions
Steep geochemical gradients indicating zones ofsignificant biogeochemical cycling were observedat sediment interfaces within a wetland–aquifer sys-tem. Both the sediment–water and silt–sand inter-faces appear to be contact zones between watersof different redox potential. At the sediment–waterinterface, the more oxidizing surface water is asource of electron acceptors to the anoxic wetlandsediments while the wetland sediments supplyorganic acids to serve as electron donors. Similarly,the interface between the upper silt zone and lessreducing coarse sand lens marks the contactbetween zones of differing redox potential. In theseunique zones microbial metabolism is enhancedbecause it benefits from the mixing of electrondonors and electron acceptors. Centimeter-scalesampling allowed for resolution of steep geochemi-cal gradients (SO2�
4 , Fe, sulfide, NHþ4 , acetate, pro-pionate and butyrate) supporting the idea thatincreased microbial activity occurs over small spa-tial scales at mixing interfaces. This resolution wasmade possible by the use of capillary electrophoresis(CE) to analyze the majority of geochemical param-eters on the low sample volumes available incm-scale porewaters. Data provided in this paperindicates that CE is a powerful tool to quantify geo-chemical indicators in complex natural waters whensample volumes are limited and suggest that thecombination of custom peepers and CE could beused to evaluate geochemical gradients at even finerspatial resolution.
At the sediment–water interface the dominantTEAPs, SO2�
4 and Fe reduction, were enhanced bythe senescence of an aquatic grass cover. Both pro-cesses appear to be occurring at the same locationor in reversed thermodynamic order (i.e., SO2�
4
2680 S. Baez-Cazull et al. / Applied Geochemistry 22 (2007) 2664–2683
reduction above Fe reduction). These trends can beexplained by the abundant electron donors presentat the sediment–water interface and by the possiblelimited availability of reactive Fe compared to theavailability of SO2�
4 . Below 18 cm, a change in theorganic C distribution is evidenced by a sharpincrease in the concentration of organic acids, lossof viable seeds, and enhanced SO2�
4 reduction (likelyof both free SO2�
4 and barite). At �30 cm, SO2�4
decreases to below detection limits allowing organicacids and NHþ4 to accumulate to high levels reaching36,000 lM NHþ4 and 9000 lM acetate. Below thispoint, these electron donors decrease coincident withthe transition to the coarse sand unit. Supersaturatedconditions with respect to calcite were observedthroughout the profile, and were highest in the watercolumn where more Ca2+, and higher pH wereobserved likely due to the presence of aquaticvegetation.
This study documents significant cm-scale bio-geochemical gradients at various mixing interfacesbetween a wetland and aquifer contaminated withlandfill leachate. These results suggest that quantify-ing the redox reactions occurring at these relativelysmall interface zones may be critical to assessingoverall biogeochemical cycling in aquifer systems.Inclusion of these active zones in conceptual andnumerical models of anaerobic systems wouldimprove understanding of the controls on chemicalfate and transport, including the ability of systemsto naturally attenuate pollutants. To further quan-tify the importance of interface processes on sys-tem-scale biogeochemical cycling, more detailedknowledge of the spatial and temporal variabilityof these zones and the rates of various TEAPsshould be acquired.
1 Use of tradenames is for identification purposes only and doesnot constitute endorsement by the US Geological Survey.
Acknowledgements
We thank Brian Jones, Stephanie McDonald andErik Smith from Texas A&M University for helpwith data collection and Dr. Barbara Smallwoodfor use of equipment and facilities. The researchwas funded by the National Science FoundationBiocomplexity in the Environment Grant #EAR-0418488, Center of Environmental Rural Health atTAMU Grant #: P30ES09106 and supported bythe USGS National Research Program and ToxicSubstances Hydrology Program. We thank ScottChristenson, USGS, for field assistance and JeanneJaeschke, USGS, for organic acids data verification
and two anonymous reviewers for their thoughtfulsuggestions.1
References
Achtnich, C., Bak, F., Conrad, R., 1995. Competition for
electron donors among nitrate reducers, ferric iron reducers,
sulfate reducers, and methanogens in anoxic paddy soil. Biol.
Fert. Soils 19, 65–72.
Adler, M., Hensen, C., Kasten, S., Schulz, H.D., 2000. Computer
simulation of deep sulfate reduction in sediments of the
Amazon Fan. Int. J. Earth Sci. 88, 641–654.
Albrechtsen, H.-J., Christensen, T.H., 1994. Evidence for micro-
bial iron reduction in a landfill leachate-polluted aquifer
(Vejen, Denmark). Appl. Environ. Microbiol. 60, 3920–3925.
APHA, 1975. Standard methods for the examination of water
and wastewater, 14th ed. American Public Health Associa-
tion, Washington, DC.
Aulenta, F., Gossett, J.M., Papini, M.P., Rossetti, S., Majone,
M., 2005. Comparative study of methanol, butyrate, and
hydrogen as electron donors for long-term dechlorination of
tetrachloroethene in mixed anaerobic cultures. Biotechnol.
Bioeng. 91, 743–753.
AWWA, APHA, WPCF, 1971. Standard methods for the
examination of water and wastewater. American Water
Works Association, American Public Health Association,
and Water Pollution Control Federation, New York.
Azcue, J.M., Rosa, F., Lawson, G., 1996. An improved dialysis
sampler for the in situ collection of larger volumes of
sediment pore waters. Environ. Technol. 17, 95–100.
Baedecker, M.J., Cozzarelli, I.M., 1992. The determination and
fate of unstable constituents in contaminated ground water.
In: Lesage, S., Jackson, R. (Eds.), Groundwater Quality and
Analysis at Hazardous Waste Sites. Marcel Dekker, Inc., New
York, pp. 425–461.
Baedecker, M.J., Cozzarelli, I.M., Eganhouse, R.P., Siegel, D.E.,
Bennett, P.C., 1993. Crude oil in a shallow sand and gravel
aquifer: 3. Biogeochemical reactions and mass balance
modeling in anoxic groundwater. Appl. Geochem. 8, 569–586.
Bally, G., Mesnage, V., Deloffre, J., Clarisse, O., Lafite, R.,
Dupont, J.P., 2004. Chemical characterization of porewaters
in an intertidal mudflat of the Seine estuary: relationship to
erosion–deposition cycles. Mar. Pollut. Bull. 49, 163–173.
Baun, A., Reitzel, L.A., Ledin, A., Christensen, T.H., Bjerg, P.L.,
2003. Natural attenuation of xenobiotic organic compounds
in a landfill leachate plume (Vejen, Denmark). J. Contam.
Hydrol. 65, 269–291.
Bekins, B.A., Cozzarelli, I.M., Godsy, E.M., Warren, E., Essaid,
H.I., Tuccillo, M.E., 2001. Progression of natural attenuation
processes at a crude oil spill site: II. Controls on spatial
distribution of microbial populations. J. Contam. Hydrol. 53,
387–406.
Blodau, C., Hoffmann, S., Peine, A., Peiffer, S., 1998. Iron and
sulfate reduction in the sediments of acidic mine lake 116
(Brandenburg, Germany). Water Air Soil Pollut. 108, 249–
270.
S. Baez-Cazull et al. / Applied Geochemistry 22 (2007) 2664–2683 2681
Boschker, H.T.S., Nold, S.C., Wellsbury, P., Bos, D., de Graaf,
W., Pel, R., Parkes, R.J., Cappenberg, T.E., 1998. Direct
linking of microbial populations to specific biogeochemical
processes by C-13-labelling of biomarkers. Nature 392, 801–
805.
Breit, G.N., Tuttle, M.L.W., Cozzarelli, I.M., Christenson, S.C.,
Jaeschke, J.B., Fey, D.L., Berry, C.J., 2005. Results of
chemical and isotopic analyses of sediment and water from
alluvium of the Canadian River near a closed municipal
landfill, Norman, Oklahoma. US Department of Interior and
US Geol. Surv.: Toxic Hydrology Program, Open-File Rep.
2005-1091, pp. 1–37.
Capone, D.G., Kiene, R.P., 1988. Comparison of microbial
dynamics in marine and freshwater sediments: Contrasts in
anaerobic carbon catabolism. Limnol. Oceanogr. 33, 725–749.
Champ, D.R., Gulens, J., Jackson, R.E., 1979. Oxidation–
reduction sequences in groundwater flow systems. Can. J.
Earth Sci. 127, 85–108.
Chapelle, F.H., Mcmahon, P.B., 1991. Geochemistry of dissolved
inorganic carbon in a coastal-plain aquifer: 1. Sulfate from
confining beds as an oxidant in microbial CO2 production. J.
Hydrol. 127, 85–108.
Chapelle, F.H., Haack, S.K., Adriaens, P., Henry, M., Bradley,
P.M., 1996. Comparison of Eh and H2 measurements for
delineating redox processes in a contaminated aquifer. Envi-
ron. Sci. Technol. 30, 3565–3569.
Chen, Z.L., Naidu, R., 2003. Separation of sulfur species in water
by co-electroosmotic capillary electrophoresis with direct and
indirect UV detection. Int. J. Environ. Anal. Chem. 83, 749–
759.
Christensen, T.H., Bjerg, P.L., Banwart, S., Jakobsen, R., Heron,
G., Albrechtsen, H.J., 2000. Characterization of redox con-
ditions in groundwater contaminant plumes. J. Contam.
Hydrol. 45, 165–241.
Ciglenecki, I., Caric, M., Krsinic, F., Vilicic, D., Cosovic, B.,
2005. The extinction by sulfide-turnover and recovery of a
naturally eutrophic, meromictic seawater lake. J. Mar. Syst.
56, 29–44.
Cozzarelli, I.M., Baedecker, M.J., Eganhouse, R.P., Goerlitz,
D.F., 1994. The geochemical evolution of low-molecular-
weight organic acids derived from the degradation of petro-
leum contaminants in groundwater. Geochim. Cosmochim.
Acta 58, 863–877.
Cozzarelli, I.M., Herman, J.S., Baedecker, M.J., Fischer, J.M.,
1999a. Geochemical heterogeneity of a gasoline-contaminated
aquifer. J. Contam. Hydrol. 40, 261–284.
Cozzarelli, I.M., Suflita, J.M., Ulrich, G.A., Harris, S.H., Scholl,
M.A., Schlottmann, J.L., Jaeschke, J.B., 1999b. Biogeochem-
ical processes in a contaminant plume downgradient from a
landfill, Norman, Oklahoma. Investigations Report 99-4018C
Subsurface Contamination from Point Sources: US Geol.
Survey Water-Resour. 3, pp. 521–530.
Cozzarelli, I.M., Suflita, J.M., Ulrich, G.A., Harris, S.H., Schroll,
M.A., Schlottmann, J.L., Christenson, S., 2000. Geochemical
and microbiological methods for evaluating anaerobic pro-
cesses in an aquifer contaminated by landfill leachate.
Environ. Sci. Technol. 34, 4025–4033.
Cozzarelli, I.M., Bekins, B.A., Baedecker, M.J., Aiken, G.M.,
Eganhouse, R.P., Tuccillo, M.E., 2001. Progression of natural
attenuation processes at a crude-oil spill site: I. Geochemical
evolution of the plume. J. Contam. Hydrol. 53, 369–
385.
Dabek-Zlotorzynska, E., Kelly, M., Chen, H., Chakrabarti, C.L.,
2003. Evaluation of capillary electrophoresis combined with a
BCR sequential extraction for determining distribution of Fe,
Zn, Cu, Mn, and Cd in airborne particulate matter. Anal.
Chim. Acta 498, 175–187.
Dabek-Zlotorzynska, E., Aranda-Rodriguez, R., Graham, L.,
2005. Capillary electrophoresis determinative and GC–MS
confirmatory method for water-soluble organic acids in
airborne particulate matter and vehicle emission. J. Sep. Sci.
28, 1520–1528.
Dahm, C.N., Grimm, N.B., Marmonier, P., Valett, H.M.,
Vervier, P., 1998. Nutrient dynamics at the interface between
surface waters and groundwaters. Freshwater Biol. 40, 427–
451.
Devlin, J.F., 1991. Field evidence for the effect of acetate on
leachate alkalinity. Ground Water 28, 863–867.
Duddleston, K.N., Kinney, M.A., Kiene, R.P., Hines, M.E.,
2002. Anaerobic microbial biogeochemistry in a northern
bog: acetate as a dominant metabolic end product. Global
Biogeochem. Cycles 16, 11-1–11-9.
Eganhouse, R.P., Cozzarelli, I.M., Scholl, M.A., Matthews, L.L.,
2001. Natural attenuation of volatile organic compounds
(VOCs) in the leachate plume of a municipal landfill: using
alkylbenzenes as process probes. Ground Water 39, 192–202.
Frıas, S., Sanchez, M.J., Rodrıguez, M.A., 2004. Determination
of triazine compounds in ground water samples by micellar
electrokinetic capillary chromatography. Anal. Chim. Acta
503, 271–278.
Fung, Y.F., Lau, K.M., 2001a. Determination of trace metals by
capillary electrophoresis. Electrophoresis 22, 2192–2200.
Fung, Y.S., Lau, K.M., 2001b. Determination of oxoanions in
river water by capillary electrophoresis. Electrophoresis 22,
2251–2259.
Grossman, E.L., Cifuentes, L.A., Cozzarelli, I.M., 2002. Anaer-
obic methane oxidation in a landfill-leachate plume. Environ.
Sci. Technol. 36, 2436–2442.
Hemond, H.F., 1990. Acid neutralizing capacity, alkalinity, and
acid–base status of natural waters containing organic acids.
Environ. Sci. Technol. 24, 1486–1489.
Hesslein, R.H., 1976. An in situ sampler for close interval pore
water studies. Limnol. Oceanogr. 21, 912–914.
Hines, M.E., Knollmeyer, S.L., Tugel, J.B., 1989. Sulfate
reduction and other sedimentary biogeochemistry in a north-
ern New England salt marsh. Limnol. Oceanogr. 34, 578–
590.
Hines, M.E., Banta, G.T., Giblin, A.E., Hobbie, J.E., Tugel, J.B.,
1994. Acetate concentrations and oxidation in salt-marsh
sediments. Limnol. Oceanogr. 39, 140–148.
Ho, T.Y., Scranton, M.I., Taylor, G.T., Varela, R., Thunell,
R.C., Muller-Karger, F., 2002. Acetate cycling in the water
column of the Cariaco Basin: seasonal and vertical variability
and implication for carbon cycling. Limnol. Oceanogr. 47,
1119–1128.
Hsieh, Y.Z., Huang, H.Y., 1996. Analysis of chlorophenoxy acid
herbicides by cyclodextrin-modified capillary electrophoresis.
J. Chromatogr. A 745, 217–223.
Huang, X.F., Hu, M., He, L.Y., Tang, X.Y., 2005. Chemical
characterization of water-soluble organic acids in PM2.5 in
Beijing, China. Atmos. Environ. 39, 2819–2827.
Hunt, R.J., Krabbenhoft, D.P., Anderson, M.P., 1997. Assessing
hydrogeochemical heterogeneity in natural and constructed
wetlands. Biogeochemistry 39, 271–293.
2682 S. Baez-Cazull et al. / Applied Geochemistry 22 (2007) 2664–2683
Jacobs, P.H., 2002. A new rechargeable dialysis pore water
sampler for monitoring sub-aqueous in-situ sediment caps.
Water Res. 36, 3121–3129.
Jones, W.B., Cifuentes, L.A., Kaldy, J.E., 2003. Stable carbon
isotope evidence for coupling between sedimentary bacteria
and seagrasses in a sub-tropical lagoon. Mar. Ecol. Prog. Ser.
255, 15–25.
Kantrud, H.A. 1990. Sago pondweed (Potamogeton pectinatus
L.): a literature review [Online]. Available by US Fish and
Wildlife Service, Fish and Wildlife Resource Publication 176.
(posted Version 16JUL97; verified April 29, 2006).
Kappler, A., Emerson, D., Edwards, K., Amend, J.P., Gralnick,
J.A., Grathwohl, P., Hoehler, T., Straub, K.L., 2005. Micro-
bial activity in biogeochemical gradients-new aspects of
research. Geobiology 3, 229–233.
Kharaka, Y.K., Ambats, G., Thordsen, J.J., 1993. Distribution
and significance of dicarboxylic-acid anions in oil-field waters.
Chem. Geol. 107, 499–501.
Kleikemper, J., Schroth, M.H., Sigler, W.V., Schmucki, M.,
Bernasconi, S.M., Zeyer, J., 2002. Activity and diversity of
sulfate-reducing bacteria in a petroleum hydrocarbon-con-
taminated aquifer. Appl. Environ. Microbiol. 68, 1516–
1523.
Kleinmeyer, J.A., Rose, P.E., Harris, J.M., 2001. Determination
of ultratrace-level fluorescent tracer concentrations in envi-
ronmental samples using a combination of HPLC separation
and laser-excited fluorescence multiwavelength emission
detection: application to testing of geothermal well brines.
Appl. Spectros. 55, 690–700.
Koch, M.S., Mendelssohn, I.A., Mckee, K.L., 1990. Mechanism
for the hydrogen sulfide-induced growth limitation in wetland
macrophytes. Limnol. Oceanogr. 35, 399–408.
Koretsky, C.M., Moore, C.M., Lowe, K.L., Meile, C., Dichri-
stina, T.J., Van Cappellen, P., 2003. Seasonal oscillation of
microbial iron and sulfate reduction in saltmarsh sediments
(Sapelo Island, GA, USA). Biogeochemistry 64, 179–203.
Koretsky, C.M., Van Cappellen, P., DiChristina, T.J., Kostka,
J.E., Lowe, K.L., Moore, C.M., Roychoudhury, A.N.,
Viollier, E., 2005. Salt marsh pore water geochemistry does
not correlate with microbial community structure. Estuar.
Coast. Shelf Sci. 62, 233–251.
Kostka, J.E., Roychoudhury, A., Van Cappellen, P., 2002. Rates
and controls of anaerobic microbial respiration across spatial
and temporal gradients in saltmarsh sediments. Biogeochem-
istry 60, 49–76.
Linhardt, R.J., Toida, T., 2002. Ultra-high resolution separation
comes of age (capillary electrophoresis). Science 298, 1441–
1442.
Llobet-Brossa, E., Rabus, R., Bottcher, M.E., Konneke, M.,
Finke, N., Schramm, A., Meyer, R.L., Grotzschel, S.,
Rossello-Mora, R., Amann, R., 2002. Community structure
and activity of sulfate-reducing bacteria in an intertidal
surface sediment: a multi-method approach. Aquat. Microb.
Ecol. 29, 211–226.
Lorah, M.M., Cozzarelli, I.M., Bohlke, J.K., submitted for
publication. Biogeochemical effect of interaction of a landfill
leachate plume with a seasonally ponded wetland (slough). J.
Contam. Hydrol.
Lovley, D.R., Phillips, E.J.P., 1987. Competitive mechanisms for
the inhibition of sulfate reduction and methane production in
the zone of ferric iron reduction in sediments. Appl. Environ.
Microbiol. 53, 2636–2641.
Lovley, D.R., Phillips, E.J.P., Lonergan, D.J., 1991. Enzymatic
versus nonenzymatic mechanisms for Fe(III) reduction in
aquatic sediments. Environ. Sci. Technol. 25, 1062–
1067.
Ludvigsen, L., Albrechtsen, H.-J., Heron, G., Bjerg, P.L.,
Christensen, T.H., 1998. Anaerobic microbial processes in a
landfill leachate contaminated aquifer (Grindsted, Denmark).
J. Contam. Hydrol. 33, 273–291.
Lyngkilde, J., Christensen, T.H., 1992. Fate of organic contam-
inants in the redox zones of a landfill leachate pollution plume
(Vejen, Denmark). J. Contam. Hydrol. 10, 291–307.
Mayer, K.U., Benner, S.G., Frind, E.O., Thornton, S.F., Lerner,
D.N., 2001. Reactive transport modeling of processes con-
trolling the distribution and natural attenuation of phenolic
compounds in a deep sandstone aquifer. J. Contam. Hydrol.
53, 341–368.
McGuire, J.T., Smith, E.W., Long, D.T., Hyndman, D.W.,
Haack, S.K., Klug, M.J., Velbel, M.A., 2000. Temporal
variations in parameters reflecting terminal-electron-accepting
processes in an aquifer contaminated with waste fuel and
chlorinated solvents. Chem. Geol. 169, 471–485.
McGuire, J.T., Long, D.T., Klug, M.J., Haack, S.K., Hyndman,
D.W., 2002. Evaluating behavior of oxygen, nitrate, and
sulfate during recharge and quantifying reduction rates in a
contaminated aquifer. Environ. Sci. Technol. 36, 2693–
2700.
McMahon, P.B., 2001. Aquifer/aquitard interfaces: mixing zones
that enhance biogeochemical reactions. Hydrogeol. J. 9, 34–
43.
McMahon, P.B., Chapelle, F.H., 1991. Microbial-production of
organic-acids in aquitard sediments and its role in aquifer
geochemistry. Nature 349, 233–235.
Molina, M., Perez-Bendito, D., Silva, M., 1999. Multi-residue
analysis of N-methylcarbamate pesticides and their hydrolytic
metabolites in environmental waters by use of solid-phase
extraction and micellar electrokinetic chromatography. Elec-
trophoresis 20, 3439–3449.
Mori, M., Hu, W., Haddad, P.R., Fritz, J.S., Tanaka, K., Tsue,
H., Tanaka, S., 2002. Capillary electrophoresis using high
ionic strength background electrolytes containing zwitterionic
and non-ionic surfactants and its application to direct
determination of bromide and nitrate in seawater. Anal.
Bioanal. Chem. 372, 181–186.
Motelica-Heino, M., Naylor, C., Zhang, H., Davison, W., 2003.
Simultaneous release of metals and sulfide in lacustrine
sediment. Environ. Sci. Technol. 37, 4374–4381.
Nealson, K.H., 1997. Sediment bacteria: who’s there, what are
they doing, and what’s new?. Ann. Rev. Earth Planet. Sci. 25
403–434.
Nicholson, R.V., Cherry, J.A., Reardon, E.J., 1983. Migration of
contaminants in groundwater at a landfill: a case study. J.
Hydrol. 63, 131–176.
Parkhurst, D.L., 1995. PHREEQC: User’s guide to PHREEQC:
a computer program for speciation, reaction-path, advective-
transport, and inverse geochemical calculations. US Geol.
Surv. Water Resour., Investig. Rep. 95-4227, pp. 1–143.
Peterson, J.N., Sun, Y., 2000. An analytical solution evaluating
steady-state plumes of sequentially reactive contaminants.
Transport Porous Med. 41, 287–303.
Postma, D., Jakobsen, R., 1996. Redox zonation: equilibrium
constraints on the Fe(III)/SO4-reduction interface. Geochim.
Cosmochim. Acta 60, 3169–3175.
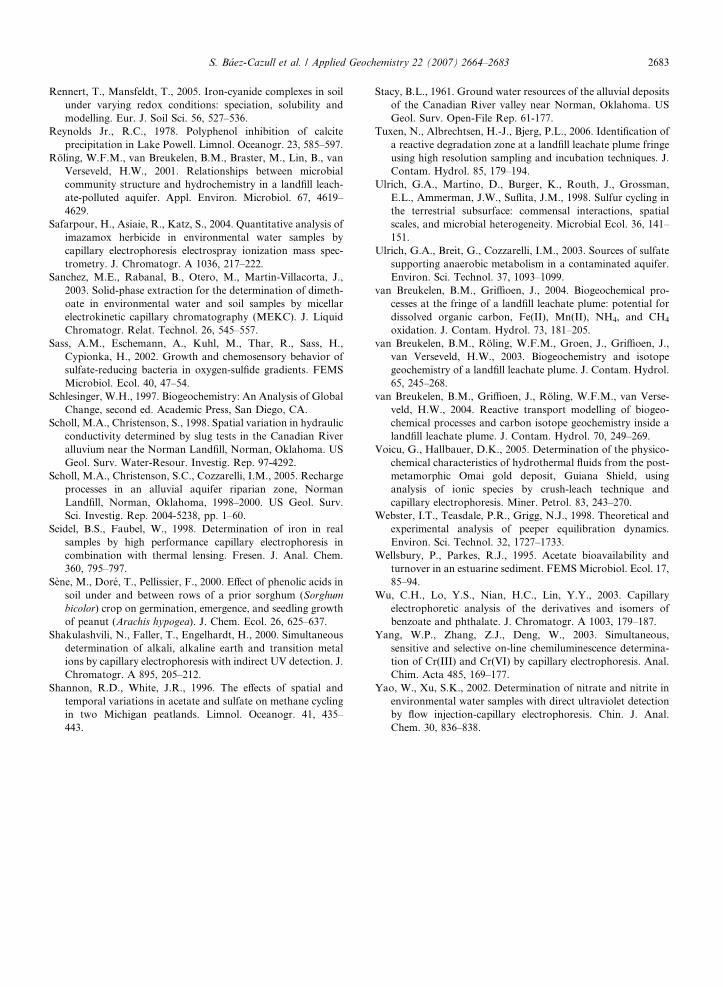
S. Baez-Cazull et al. / Applied Geochemistry 22 (2007) 2664–2683 2683
Rennert, T., Mansfeldt, T., 2005. Iron-cyanide complexes in soil
under varying redox conditions: speciation, solubility and
modelling. Eur. J. Soil Sci. 56, 527–536.
Reynolds Jr., R.C., 1978. Polyphenol inhibition of calcite
precipitation in Lake Powell. Limnol. Oceanogr. 23, 585–597.
Roling, W.F.M., van Breukelen, B.M., Braster, M., Lin, B., van
Verseveld, H.W., 2001. Relationships between microbial
community structure and hydrochemistry in a landfill leach-
ate-polluted aquifer. Appl. Environ. Microbiol. 67, 4619–
4629.
Safarpour, H., Asiaie, R., Katz, S., 2004. Quantitative analysis of
imazamox herbicide in environmental water samples by
capillary electrophoresis electrospray ionization mass spec-
trometry. J. Chromatogr. A 1036, 217–222.
Sanchez, M.E., Rabanal, B., Otero, M., Martin-Villacorta, J.,
2003. Solid-phase extraction for the determination of dimeth-
oate in environmental water and soil samples by micellar
electrokinetic capillary chromatography (MEKC). J. Liquid
Chromatogr. Relat. Technol. 26, 545–557.
Sass, A.M., Eschemann, A., Kuhl, M., Thar, R., Sass, H.,
Cypionka, H., 2002. Growth and chemosensory behavior of
sulfate-reducing bacteria in oxygen-sulfide gradients. FEMS
Microbiol. Ecol. 40, 47–54.
Schlesinger, W.H., 1997. Biogeochemistry: An Analysis of Global
Change, second ed. Academic Press, San Diego, CA.
Scholl, M.A., Christenson, S., 1998. Spatial variation in hydraulic
conductivity determined by slug tests in the Canadian River
alluvium near the Norman Landfill, Norman, Oklahoma. US
Geol. Surv. Water-Resour. Investig. Rep. 97-4292.
Scholl, M.A., Christenson, S.C., Cozzarelli, I.M., 2005. Recharge
processes in an alluvial aquifer riparian zone, Norman
Landfill, Norman, Oklahoma, 1998–2000. US Geol. Surv.
Sci. Investig. Rep. 2004-5238, pp. 1–60.
Seidel, B.S., Faubel, W., 1998. Determination of iron in real
samples by high performance capillary electrophoresis in
combination with thermal lensing. Fresen. J. Anal. Chem.
360, 795–797.
Sene, M., Dore, T., Pellissier, F., 2000. Effect of phenolic acids in
soil under and between rows of a prior sorghum (Sorghum
bicolor) crop on germination, emergence, and seedling growth
of peanut (Arachis hypogea). J. Chem. Ecol. 26, 625–637.
Shakulashvili, N., Faller, T., Engelhardt, H., 2000. Simultaneous
determination of alkali, alkaline earth and transition metal
ions by capillary electrophoresis with indirect UV detection. J.
Chromatogr. A 895, 205–212.
Shannon, R.D., White, J.R., 1996. The effects of spatial and
temporal variations in acetate and sulfate on methane cycling
in two Michigan peatlands. Limnol. Oceanogr. 41, 435–
443.
Stacy, B.L., 1961. Ground water resources of the alluvial deposits
of the Canadian River valley near Norman, Oklahoma. US
Geol. Surv. Open-File Rep. 61-177.
Tuxen, N., Albrechtsen, H.-J., Bjerg, P.L., 2006. Identification of
a reactive degradation zone at a landfill leachate plume fringe
using high resolution sampling and incubation techniques. J.
Contam. Hydrol. 85, 179–194.
Ulrich, G.A., Martino, D., Burger, K., Routh, J., Grossman,
E.L., Ammerman, J.W., Suflita, J.M., 1998. Sulfur cycling in
the terrestrial subsurface: commensal interactions, spatial
scales, and microbial heterogeneity. Microbial Ecol. 36, 141–
151.
Ulrich, G.A., Breit, G., Cozzarelli, I.M., 2003. Sources of sulfate
supporting anaerobic metabolism in a contaminated aquifer.
Environ. Sci. Technol. 37, 1093–1099.
van Breukelen, B.M., Griffioen, J., 2004. Biogeochemical pro-
cesses at the fringe of a landfill leachate plume: potential for
dissolved organic carbon, Fe(II), Mn(II), NH4, and CH4
oxidation. J. Contam. Hydrol. 73, 181–205.
van Breukelen, B.M., Roling, W.F.M., Groen, J., Griffioen, J.,
van Verseveld, H.W., 2003. Biogeochemistry and isotope
geochemistry of a landfill leachate plume. J. Contam. Hydrol.
65, 245–268.
van Breukelen, B.M., Griffioen, J., Roling, W.F.M., van Verse-
veld, H.W., 2004. Reactive transport modelling of biogeo-
chemical processes and carbon isotope geochemistry inside a
landfill leachate plume. J. Contam. Hydrol. 70, 249–269.
Voicu, G., Hallbauer, D.K., 2005. Determination of the physico-
chemical characteristics of hydrothermal fluids from the post-
metamorphic Omai gold deposit, Guiana Shield, using
analysis of ionic species by crush-leach technique and
capillary electrophoresis. Miner. Petrol. 83, 243–270.
Webster, I.T., Teasdale, P.R., Grigg, N.J., 1998. Theoretical and
experimental analysis of peeper equilibration dynamics.
Environ. Sci. Technol. 32, 1727–1733.
Wellsbury, P., Parkes, R.J., 1995. Acetate bioavailability and
turnover in an estuarine sediment. FEMS Microbiol. Ecol. 17,
85–94.
Wu, C.H., Lo, Y.S., Nian, H.C., Lin, Y.Y., 2003. Capillary
electrophoretic analysis of the derivatives and isomers of
benzoate and phthalate. J. Chromatogr. A 1003, 179–187.
Yang, W.P., Zhang, Z.J., Deng, W., 2003. Simultaneous,
sensitive and selective on-line chemiluminescence determina-
tion of Cr(III) and Cr(VI) by capillary electrophoresis. Anal.
Chim. Acta 485, 169–177.
Yao, W., Xu, S.K., 2002. Determination of nitrate and nitrite in
environmental water samples with direct ultraviolet detection
by flow injection-capillary electrophoresis. Chin. J. Anal.
Chem. 30, 836–838.