Embed Size (px)
Citation preview
Compiled by:
Jim Dubovsky, Central Flyway RepresentativeDivision of Migratory Bird Management
U.S. Fish & Wildlife Service
CENTRAL FLYWAY
MID-WINTER SURVEY
RESULTS
2018
United States Department of the Interior
FISH AND WILDLIFE SERVICE
Division of Migratory Bird Management 755 Parfet Street, Suite 235 Lakewood, Colorado 80215
Phone 303-275-2386; Fax 303-275-2384
March 5, 2018 To: Central Flyway Council and Central Flyway Waterfowl Technical Committee Re: January 2018 Mid-Winter Waterfowl Survey The Central Flyway’s 2018 Mid-Winter Waterfowl Survey was completed during January 2-19, with almost all survey activity accomplished during January 2-8. Most areas important to waterfowl were covered by aerial or ground survey crews. Survey conditions generally were good across the Flyway. Throughout most of the Flyway, fall and early winter temperatures were mild with little snow, so food availability appeared good in natural and agricultural landscapes. Cold temperatures occurred intermittently causing birds to move, but milder temperatures often returned. In mid- to late-December in northern states, cold to very cold temperatures arrived, freezing most water bodies and causing most birds to move farther south. Precipitation during this time was variable, but most areas continued to have little snow cover, so field feeding was still available to birds. An exception was Montana, where snowfall was more plentiful, precluding birds from feeding in many fields. Nonetheless, many Canada geese remained in the area, despite apparently limited food availability. Farther south, fall and winter remained relatively mild and dry, with many wetlands having low water levels. Although food availability appeared good in these southern areas, water conditions for waterfowl were average or below. The overall waterfowl count for 2018 was 14% lower than in 2017, with duck counts generally decreasing and goose counts increasing. The overall duck count was 37% lower and the overall goose count was 48% higher than the previous year. Dabbling ducks decreased by 30%, influenced by large decreases in green-winged teal and northern pintails. However, the 2018 count was only 12% below the 2010-2017 average for dabbling ducks, and 8% above the long-term (1948-2017) average. The mallard count decreased by 15% from that of last year, but was near the long-term average. The number of diving ducks decreased by 62%, led by large decreases for several species counted in Texas compared to last year. The diving duck count was 37% and 2% lower than the 2010-17 and long-term averages, respectively. Most species of diving ducks showed substantial (>30%) decreases compared to counts from January 2017. The total goose count exceeded 4.3 million birds this year, eclipsing the previous high count of 3.2 million in January 1999. Both Mid-continent and Western Central Flyway light goose counts in the Central Flyway were record highs this year, with the Kansas count surpassing 1 million light geese. Canada goose counts overall and for several populations also were at record-high levels. More specific information for species and populations are provided in the report. Thank you to all the collaborators who conducted or otherwise supported the survey this year.
Jim Dubovsky
COORDINATORS 2018 Mid-Winter Waterfowl Survey
Central Flyway
Dave Olson, Regional Coordinator Migratory Bird Biologist - Region 6
U.S. Fish and Wildlife Service Denver, Colorado
North Dakota South Dakota Andy Dinges, Migratory Game Bird Biologist Rocco Murano, Senior Waterfowl Biologist ND Game and Fish Department SD Game, Fish and Parks Bismarck, North Dakota Brookings, South Dakota Nebraska Kansas Mark Vrtiska, Waterfowl Program Manager Tom Bidrowski, Migratory Game Bird NE Game and Parks Commission Program Manager
Lincoln, Nebraska KS Dept. of Wildlife & Parks Great Bend, Kansas Montana Wyoming Jim Hansen, Migratory Bird Coordinator Nate Huck, Migratory Game Bird Biologist MT Fish, Wildlife & Parks WY Game and Fish Department Billings, Montana Casper, Wyoming Colorado Jim Gammonley, Avian Research Leader CO Division of Wildlife Fort Collins, Colorado
Dan Collins, Regional Coordinator Migratory Bird Biologist - Region 2
U.S. Fish and Wildlife Service Albuquerque, New Mexico
Oklahoma Texas Josh Richardson, Migratory Bird Biologist Kevin Kraai, Waterfowl Program Leader OK Dept. of Wildlife Conservation TX Parks & Wildlife Department Oklahoma City, Oklahoma Austin, Texas New Mexico Mason Cline, Bird Program Manager NM Dept. of Game & Fish Santa Fe, New Mexico

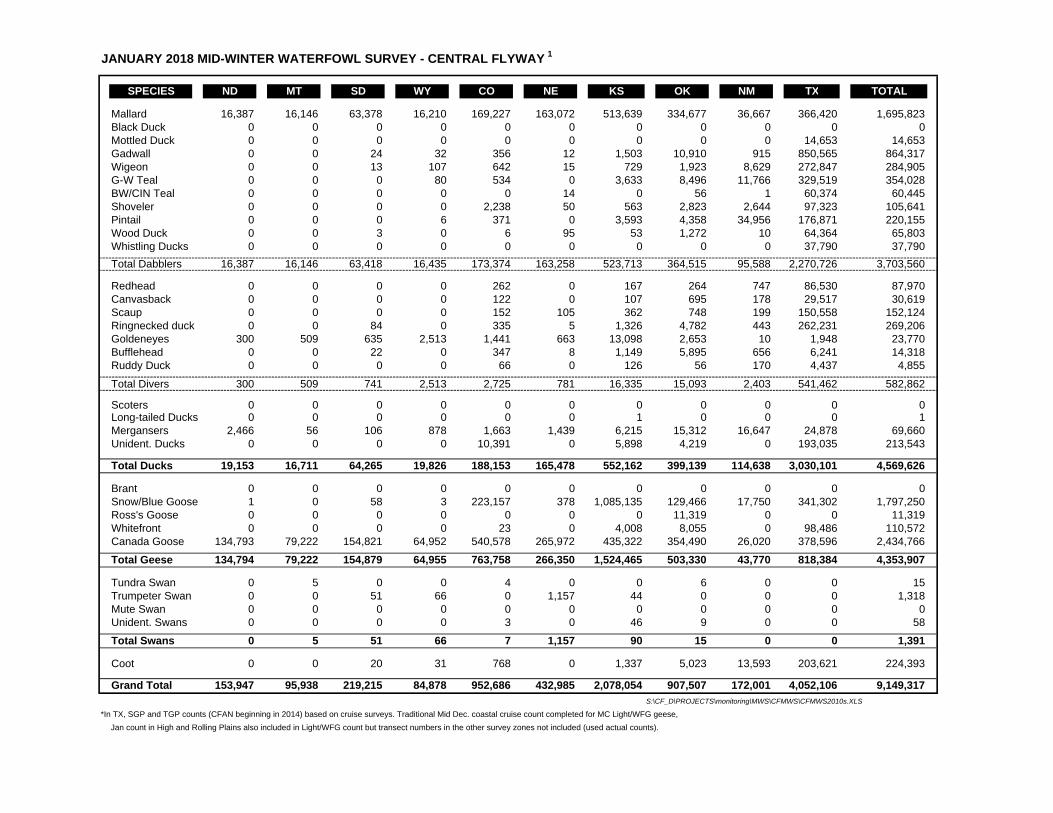
JANUARY 2018 MID-WINTER WATERFOWL SURVEY - CENTRAL FLYWAY 1
SPECIES ND MT SD WY CO NE KS OK NM TX TOTAL
Mallard 16,387 16,146 63,378 16,210 169,227 163,072 513,639 334,677 36,667 366,420 1,695,823Black Duck 0 0 0 0 0 0 0 0 0 0 0Mottled Duck 0 0 0 0 0 0 0 0 0 14,653 14,653Gadwall 0 0 24 32 356 12 1,503 10,910 915 850,565 864,317Wigeon 0 0 13 107 642 15 729 1,923 8,629 272,847 284,905G-W Teal 0 0 0 80 534 0 3,633 8,496 11,766 329,519 354,028BW/CIN Teal 0 0 0 0 0 14 0 56 1 60,374 60,445Shoveler 0 0 0 0 2,238 50 563 2,823 2,644 97,323 105,641Pintail 0 0 0 6 371 0 3,593 4,358 34,956 176,871 220,155Wood Duck 0 0 3 0 6 95 53 1,272 10 64,364 65,803Whistling Ducks 0 0 0 0 0 0 0 0 0 37,790 37,790Total Dabblers 16,387 16,146 63,418 16,435 173,374 163,258 523,713 364,515 95,588 2,270,726 3,703,560
Redhead 0 0 0 0 262 0 167 264 747 86,530 87,970Canvasback 0 0 0 0 122 0 107 695 178 29,517 30,619Scaup 0 0 0 0 152 105 362 748 199 150,558 152,124Ringnecked duck 0 0 84 0 335 5 1,326 4,782 443 262,231 269,206Goldeneyes 300 509 635 2,513 1,441 663 13,098 2,653 10 1,948 23,770Bufflehead 0 0 22 0 347 8 1,149 5,895 656 6,241 14,318Ruddy Duck 0 0 0 0 66 0 126 56 170 4,437 4,855
Total Divers 300 509 741 2,513 2,725 781 16,335 15,093 2,403 541,462 582,862
Scoters 0 0 0 0 0 0 0 0 0 0 0Long-tailed Ducks 0 0 0 0 0 0 1 0 0 0 1Mergansers 2,466 56 106 878 1,663 1,439 6,215 15,312 16,647 24,878 69,660Unident. Ducks 0 0 0 0 10,391 0 5,898 4,219 0 193,035 213,543
Total Ducks 19,153 16,711 64,265 19,826 188,153 165,478 552,162 399,139 114,638 3,030,101 4,569,626
Brant 0 0 0 0 0 0 0 0 0 0 0Snow/Blue Goose 1 0 58 3 223,157 378 1,085,135 129,466 17,750 341,302 1,797,250Ross's Goose 0 0 0 0 0 0 0 11,319 0 0 11,319Whitefront 0 0 0 0 23 0 4,008 8,055 0 98,486 110,572Canada Goose 134,793 79,222 154,821 64,952 540,578 265,972 435,322 354,490 26,020 378,596 2,434,766
Total Geese 134,794 79,222 154,879 64,955 763,758 266,350 1,524,465 503,330 43,770 818,384 4,353,907
Tundra Swan 0 5 0 0 4 0 0 6 0 0 15Trumpeter Swan 0 0 51 66 0 1,157 44 0 0 0 1,318Mute Swan 0 0 0 0 0 0 0 0 0 0 0Unident. Swans 0 0 0 0 3 0 46 9 0 0 58
Total Swans 0 5 51 66 7 1,157 90 15 0 0 1,391
Coot 0 0 20 31 768 0 1,337 5,023 13,593 203,621 224,393
Grand Total 153,947 95,938 219,215 84,878 952,686 432,985 2,078,054 907,507 172,001 4,052,106 9,149,317S:\CF_D\PROJECTS\monitoring\MWS\CFMWS\CFMWS2010s.XLS
*In TX, SGP and TGP counts (CFAN beginning in 2014) based on cruise surveys. Traditional Mid Dec. coastal cruise count completed for MC Light/WFG geese, Jan count in High and Rolling Plains also included in Light/WFG count but transect numbers in the other survey zones not included (used actual counts).
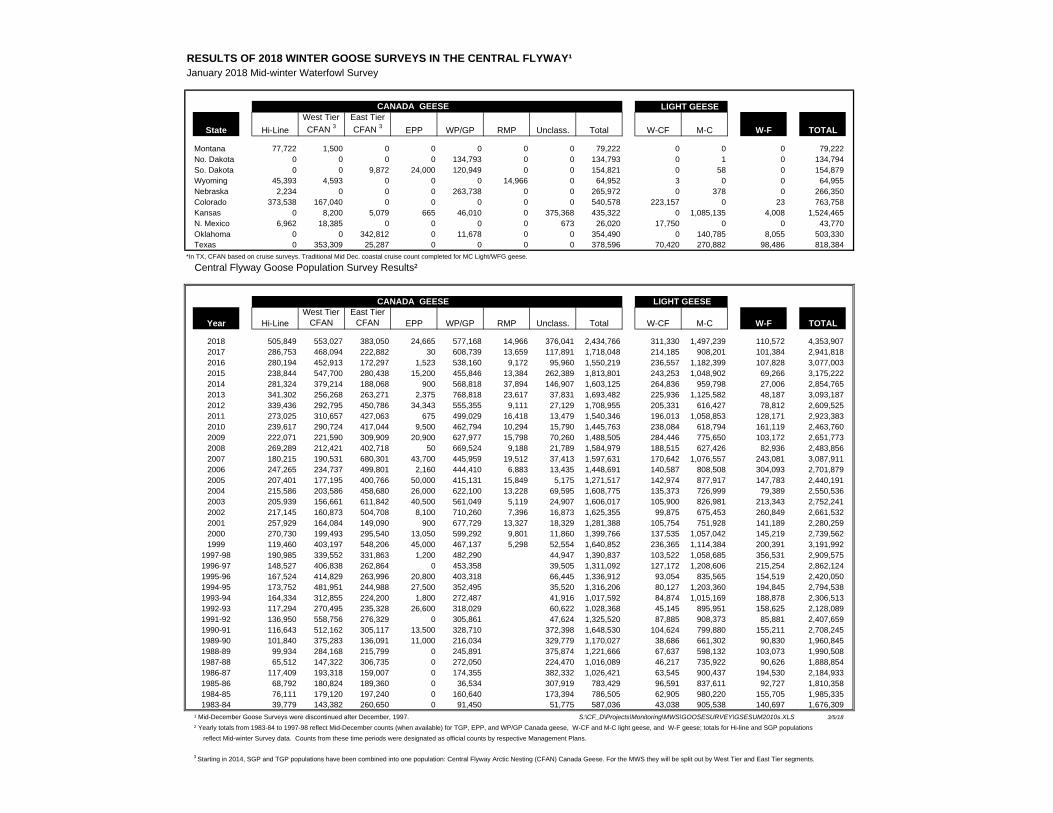
RESULTS OF 2018 WINTER GOOSE SURVEYS IN THE CENTRAL FLYWAY¹
January 2018 Mid-winter Waterfowl Survey
CANADA GEESE LIGHT GEESE
State Hi-LineWest Tier CFAN 3
East Tier CFAN 3 EPP WP/GP RMP Unclass. Total W-CF M-C W-F TOTAL
Montana 77,722 1,500 0 0 0 0 0 79,222 0 0 0 79,222No. Dakota 0 0 0 0 134,793 0 0 134,793 0 1 0 134,794So. Dakota 0 0 9,872 24,000 120,949 0 0 154,821 0 58 0 154,879Wyoming 45,393 4,593 0 0 0 14,966 0 64,952 3 0 0 64,955Nebraska 2,234 0 0 0 263,738 0 0 265,972 0 378 0 266,350Colorado 373,538 167,040 0 0 0 0 0 540,578 223,157 0 23 763,758Kansas 0 8,200 5,079 665 46,010 0 375,368 435,322 0 1,085,135 4,008 1,524,465N. Mexico 6,962 18,385 0 0 0 0 673 26,020 17,750 0 0 43,770Oklahoma 0 0 342,812 0 11,678 0 0 354,490 0 140,785 8,055 503,330Texas 0 353,309 25,287 0 0 0 0 378,596 70,420 270,882 98,486 818,384
*In TX, CFAN based on cruise surveys. Traditional Mid Dec. coastal cruise count completed for MC Light/WFG geese.
Central Flyway Goose Population Survey Results²
CANADA GEESE LIGHT GEESE
Year Hi-LineWest Tier
CFANEast Tier
CFAN EPP WP/GP RMP Unclass. Total W-CF M-C W-F TOTAL
2018 505,849 553,027 383,050 24,665 577,168 14,966 376,041 2,434,766 311,330 1,497,239 110,572 4,353,9072017 286,753 468,094 222,882 30 608,739 13,659 117,891 1,718,048 214,185 908,201 101,384 2,941,8182016 280,194 452,913 172,297 1,523 538,160 9,172 95,960 1,550,219 236,557 1,182,399 107,828 3,077,0032015 238,844 547,700 280,438 15,200 455,846 13,384 262,389 1,813,801 243,253 1,048,902 69,266 3,175,2222014 281,324 379,214 188,068 900 568,818 37,894 146,907 1,603,125 264,836 959,798 27,006 2,854,7652013 341,302 256,268 263,271 2,375 768,818 23,617 37,831 1,693,482 225,936 1,125,582 48,187 3,093,1872012 339,436 292,795 450,786 34,343 555,355 9,111 27,129 1,708,955 205,331 616,427 78,812 2,609,5252011 273,025 310,657 427,063 675 499,029 16,418 13,479 1,540,346 196,013 1,058,853 128,171 2,923,3832010 239,617 290,724 417,044 9,500 462,794 10,294 15,790 1,445,763 238,084 618,794 161,119 2,463,7602009 222,071 221,590 309,909 20,900 627,977 15,798 70,260 1,488,505 284,446 775,650 103,172 2,651,7732008 269,289 212,421 402,718 50 669,524 9,188 21,789 1,584,979 188,515 627,426 82,936 2,483,8562007 180,215 190,531 680,301 43,700 445,959 19,512 37,413 1,597,631 170,642 1,076,557 243,081 3,087,9112006 247,265 234,737 499,801 2,160 444,410 6,883 13,435 1,448,691 140,587 808,508 304,093 2,701,8792005 207,401 177,195 400,766 50,000 415,131 15,849 5,175 1,271,517 142,974 877,917 147,783 2,440,1912004 215,586 203,586 458,680 26,000 622,100 13,228 69,595 1,608,775 135,373 726,999 79,389 2,550,5362003 205,939 156,661 611,842 40,500 561,049 5,119 24,907 1,606,017 105,900 826,981 213,343 2,752,2412002 217,145 160,873 504,708 8,100 710,260 7,396 16,873 1,625,355 99,875 675,453 260,849 2,661,5322001 257,929 164,084 149,090 900 677,729 13,327 18,329 1,281,388 105,754 751,928 141,189 2,280,2592000 270,730 199,493 295,540 13,050 599,292 9,801 11,860 1,399,766 137,535 1,057,042 145,219 2,739,5621999 119,460 403,197 548,206 45,000 467,137 5,298 52,554 1,640,852 236,365 1,114,384 200,391 3,191,992
1997-98 190,985 339,552 331,863 1,200 482,290 44,947 1,390,837 103,522 1,058,685 356,531 2,909,5751996-97 148,527 406,838 262,864 0 453,358 39,505 1,311,092 127,172 1,208,606 215,254 2,862,1241995-96 167,524 414,829 263,996 20,800 403,318 66,445 1,336,912 93,054 835,565 154,519 2,420,0501994-95 173,752 481,951 244,988 27,500 352,495 35,520 1,316,206 80,127 1,203,360 194,845 2,794,5381993-94 164,334 312,855 224,200 1,800 272,487 41,916 1,017,592 84,874 1,015,169 188,878 2,306,5131992-93 117,294 270,495 235,328 26,600 318,029 60,622 1,028,368 45,145 895,951 158,625 2,128,0891991-92 136,950 558,756 276,329 0 305,861 47,624 1,325,520 87,885 908,373 85,881 2,407,6591990-91 116,643 512,162 305,117 13,500 328,710 372,398 1,648,530 104,624 799,880 155,211 2,708,2451989-90 101,840 375,283 136,091 11,000 216,034 329,779 1,170,027 38,686 661,302 90,830 1,960,8451988-89 99,934 284,168 215,799 0 245,891 375,874 1,221,666 67,637 598,132 103,073 1,990,5081987-88 65,512 147,322 306,735 0 272,050 224,470 1,016,089 46,217 735,922 90,626 1,888,8541986-87 117,409 193,318 159,007 0 174,355 382,332 1,026,421 63,545 900,437 194,530 2,184,9331985-86 68,792 180,824 189,360 0 36,534 307,919 783,429 96,591 837,611 92,727 1,810,3581984-85 76,111 179,120 197,240 0 160,640 173,394 786,505 62,905 980,220 155,705 1,985,3351983-84 39,779 143,382 260,650 0 91,450 51,775 587,036 43,038 905,538 140,697 1,676,309
¹ Mid-December Goose Surveys were discontinued after December, 1997. S:\CF_D\Projects\Monitoring\MWS\GOOSESURVEY\GSESUM2010s.XLS 3/5/18
² Yearly totals from 1983-84 to 1997-98 reflect Mid-December counts (when available) for TGP, EPP, and WP/GP Canada geese, W-CF and M-C light geese, and W-F geese; totals for Hi-line and SGP populations reflect Mid-winter Survey data. Counts from these time periods were designated as official counts by respective Management Plans.
3 Starting in 2014, SGP and TGP populations have been combined into one population: Central Flyway Arctic Nesting (CFAN) Canada Geese. For the MWS they will be split out by West Tier and East Tier segments.
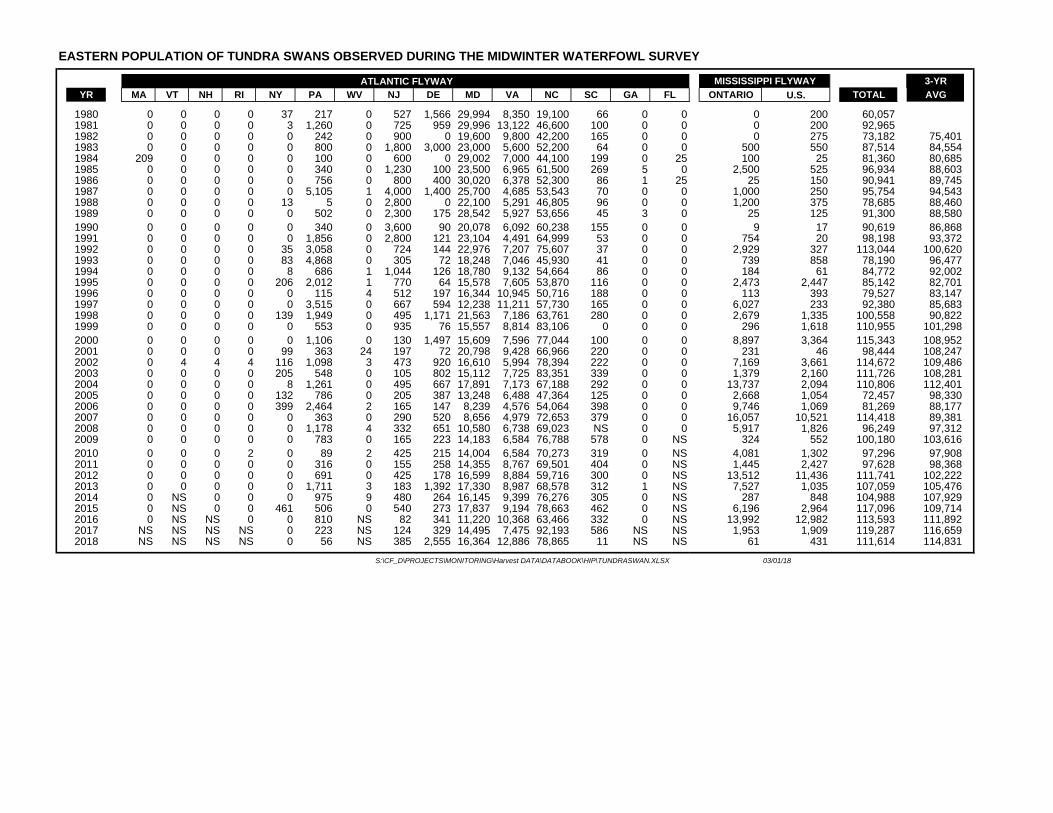
EASTERN POPULATION OF TUNDRA SWANS OBSERVED DURING THE MIDWINTER WATERFOWL SURVEY
ATLANTIC FLYWAY 3-YRYR MA VT NH RI NY PA WV NJ DE MD VA NC SC GA FL ONTARIO U.S. TOTAL AVG
1980 0 0 0 0 37 217 0 527 1,566 29,994 8,350 19,100 66 0 0 0 200 60,0571981 0 0 0 0 3 1,260 0 725 959 29,996 13,122 46,600 100 0 0 0 200 92,9651982 0 0 0 0 0 242 0 900 0 19,600 9,800 42,200 165 0 0 0 275 73,182 75,4011983 0 0 0 0 0 800 0 1,800 3,000 23,000 5,600 52,200 64 0 0 500 550 87,514 84,5541984 209 0 0 0 0 100 0 600 0 29,002 7,000 44,100 199 0 25 100 25 81,360 80,6851985 0 0 0 0 0 340 0 1,230 100 23,500 6,965 61,500 269 5 0 2,500 525 96,934 88,6031986 0 0 0 0 0 756 0 800 400 30,020 6,378 52,300 86 1 25 25 150 90,941 89,7451987 0 0 0 0 0 5,105 1 4,000 1,400 25,700 4,685 53,543 70 0 0 1,000 250 95,754 94,5431988 0 0 0 0 13 5 0 2,800 0 22,100 5,291 46,805 96 0 0 1,200 375 78,685 88,4601989 0 0 0 0 0 502 0 2,300 175 28,542 5,927 53,656 45 3 0 25 125 91,300 88,5801990 0 0 0 0 0 340 0 3,600 90 20,078 6,092 60,238 155 0 0 9 17 90,619 86,8681991 0 0 0 0 0 1,856 0 2,800 121 23,104 4,491 64,999 53 0 0 754 20 98,198 93,3721992 0 0 0 0 35 3,058 0 724 144 22,976 7,207 75,607 37 0 0 2,929 327 113,044 100,6201993 0 0 0 0 83 4,868 0 305 72 18,248 7,046 45,930 41 0 0 739 858 78,190 96,4771994 0 0 0 0 8 686 1 1,044 126 18,780 9,132 54,664 86 0 0 184 61 84,772 92,0021995 0 0 0 0 206 2,012 1 770 64 15,578 7,605 53,870 116 0 0 2,473 2,447 85,142 82,7011996 0 0 0 0 0 115 4 512 197 16,344 10,945 50,716 188 0 0 113 393 79,527 83,1471997 0 0 0 0 0 3,515 0 667 594 12,238 11,211 57,730 165 0 0 6,027 233 92,380 85,6831998 0 0 0 0 139 1,949 0 495 1,171 21,563 7,186 63,761 280 0 0 2,679 1,335 100,558 90,8221999 0 0 0 0 0 553 0 935 76 15,557 8,814 83,106 0 0 0 296 1,618 110,955 101,2982000 0 0 0 0 0 1,106 0 130 1,497 15,609 7,596 77,044 100 0 0 8,897 3,364 115,343 108,9522001 0 0 0 0 99 363 24 197 72 20,798 9,428 66,966 220 0 0 231 46 98,444 108,2472002 0 4 4 4 116 1,098 3 473 920 16,610 5,994 78,394 222 0 0 7,169 3,661 114,672 109,4862003 0 0 0 0 205 548 0 105 802 15,112 7,725 83,351 339 0 0 1,379 2,160 111,726 108,2812004 0 0 0 0 8 1,261 0 495 667 17,891 7,173 67,188 292 0 0 13,737 2,094 110,806 112,4012005 0 0 0 0 132 786 0 205 387 13,248 6,488 47,364 125 0 0 2,668 1,054 72,457 98,3302006 0 0 0 0 399 2,464 2 165 147 8,239 4,576 54,064 398 0 0 9,746 1,069 81,269 88,1772007 0 0 0 0 0 363 0 290 520 8,656 4,979 72,653 379 0 0 16,057 10,521 114,418 89,3812008 0 0 0 0 0 1,178 4 332 651 10,580 6,738 69,023 NS 0 0 5,917 1,826 96,249 97,3122009 0 0 0 0 0 783 0 165 223 14,183 6,584 76,788 578 0 NS 324 552 100,180 103,6162010 0 0 0 2 0 89 2 425 215 14,004 6,584 70,273 319 0 NS 4,081 1,302 97,296 97,9082011 0 0 0 0 0 316 0 155 258 14,355 8,767 69,501 404 0 NS 1,445 2,427 97,628 98,3682012 0 0 0 0 0 691 0 425 178 16,599 8,884 59,716 300 0 NS 13,512 11,436 111,741 102,2222013 0 0 0 0 0 1,711 3 183 1,392 17,330 8,987 68,578 312 1 NS 7,527 1,035 107,059 105,4762014 0 NS 0 0 0 975 9 480 264 16,145 9,399 76,276 305 0 NS 287 848 104,988 107,9292015 0 NS 0 0 461 506 0 540 273 17,837 9,194 78,663 462 0 NS 6,196 2,964 117,096 109,7142016 0 NS NS 0 0 810 NS 82 341 11,220 10,368 63,466 332 0 NS 13,992 12,982 113,593 111,8922017 NS NS NS NS 0 223 NS 124 329 14,495 7,475 92,193 586 NS NS 1,953 1,909 119,287 116,6592018 NS NS NS NS 0 56 NS 385 2,555 16,364 12,886 78,865 11 NS NS 61 431 111,614 114,831
S:\CF_D\PROJECTS\MONITORING\Harvest DATA\DATABOOK\HIP\TUNDRASWAN.XLSX 03/01/18
MISSISSIPPI FLYWAY
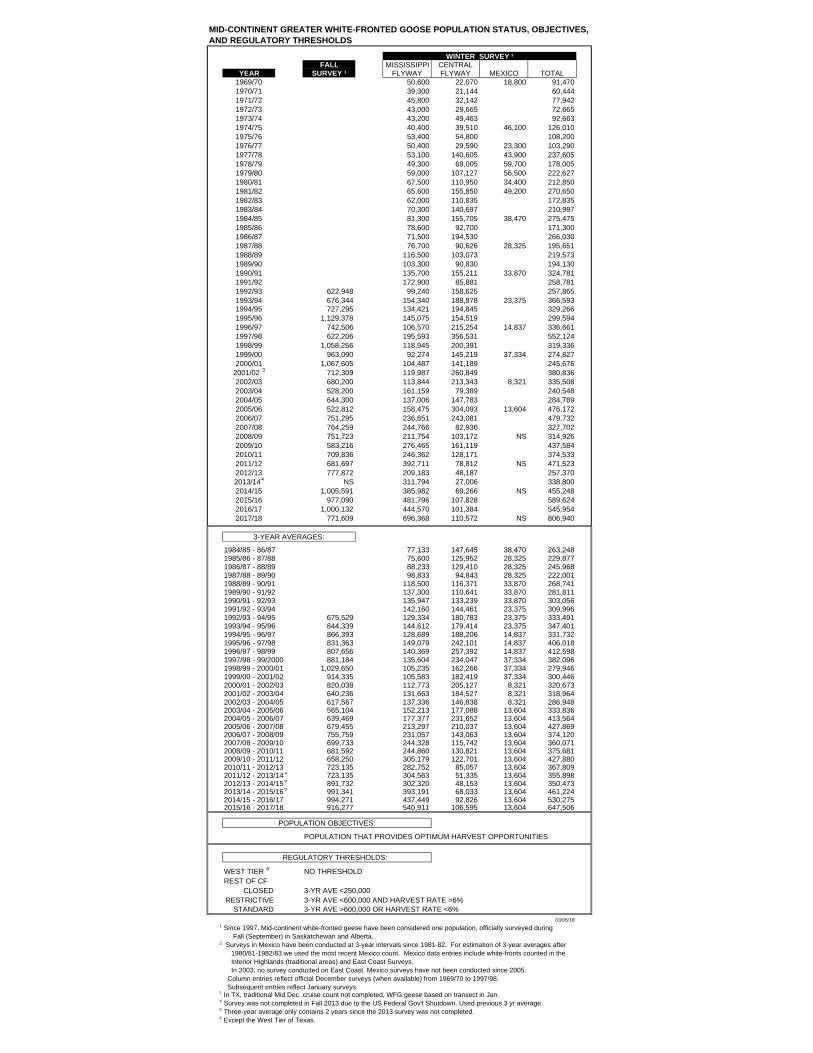
MID-CONTINENT GREATER WHITE-FRONTED GOOSE POPULATION STATUS, OBJECTIVES,AND REGULATORY THRESHOLDS
WINTER SURVEY ²FALL MISSISSIPPI CENTRAL
YEAR SURVEY ¹ FLYWAY FLYWAY MEXICO TOTAL1969/70 50,600 22,070 18,800 91,4701970/71 39,300 21,144 60,4441971/72 45,800 32,142 77,9421972/73 43,000 29,665 72,6651973/74 43,200 49,463 92,6631974/75 40,400 39,510 46,100 126,0101975/76 53,400 54,800 108,2001976/77 50,400 29,590 23,300 103,2901977/78 53,100 140,605 43,900 237,6051978/79 49,300 69,005 59,700 178,0051979/80 59,000 107,127 56,500 222,6271980/81 67,500 110,950 34,400 212,8501981/82 65,600 155,850 49,200 270,6501982/83 62,000 110,835 172,8351983/84 70,300 140,697 210,9971984/85 81,300 155,705 38,470 275,4751985/86 78,600 92,700 171,3001986/87 71,500 194,530 266,0301987/88 76,700 90,626 28,325 195,6511988/89 116,500 103,073 219,5731989/90 103,300 90,830 194,1301990/91 135,700 155,211 33,870 324,7811991/92 172,900 85,881 258,7811992/93 622,948 99,240 158,625 257,8651993/94 676,344 154,340 188,878 23,375 366,5931994/95 727,295 134,421 194,845 329,2661995/96 1,129,378 145,075 154,519 299,5941996/97 742,506 106,570 215,254 14,837 336,6611997/98 622,206 195,593 356,531 552,1241998/99 1,058,256 118,945 200,391 319,3361999/00 963,090 92,274 145,219 37,334 274,8272000/01 1,067,605 104,487 141,189 245,676
2001/02 3 712,309 119,987 260,849 380,8362002/03 680,200 113,844 213,343 8,321 335,5082003/04 528,200 161,159 79,389 240,5482004/05 644,300 137,006 147,783 284,7892005/06 522,812 158,475 304,093 13,604 476,1722006/07 751,295 236,651 243,081 479,7322007/08 764,259 244,766 82,936 327,7022008/09 751,723 211,754 103,172 NS 314,9262009/10 583,216 276,465 161,119 437,5842010/11 709,836 246,362 128,171 374,5332011/12 681,697 392,711 78,812 NS 471,5232012/13 777,872 209,183 48,187 257,3702013/144 NS 311,794 27,006 338,8002014/15 1,005,591 385,982 69,266 NS 455,2482015/16 977,090 481,796 107,828 589,6242016/17 1,000,132 444,570 101,384 545,9542017/18 771,609 696,368 110,572 NS 806,940
3-YEAR AVERAGES:
1984/85 - 86/87 77,133 147,645 38,470 263,2481985/86 - 87/88 75,600 125,952 28,325 229,8771986/87 - 88/89 88,233 129,410 28,325 245,9681987/88 - 89/90 98,833 94,843 28,325 222,0011988/89 - 90/91 118,500 116,371 33,870 268,7411989/90 - 91/92 137,300 110,641 33,870 281,8111990/91 - 92/93 135,947 133,239 33,870 303,0561991/92 - 93/94 142,160 144,461 23,375 309,9961992/93 - 94/95 675,529 129,334 180,783 23,375 333,4911993/94 - 95/96 844,339 144,612 179,414 23,375 347,4011994/95 - 96/97 866,393 128,689 188,206 14,837 331,7321995/96 - 97/98 831,363 149,079 242,101 14,837 406,0181996/97 - 98/99 807,656 140,369 257,392 14,837 412,5981997/98 - 99/2000 881,184 135,604 234,047 37,334 382,0961998/99 - 2000/01 1,029,650 105,235 162,266 37,334 279,9461999/00 - 2001/02 914,335 105,583 182,419 37,334 300,4462000/01 - 2002/03 820,038 112,773 205,127 8,321 320,6732001/02 - 2003/04 640,236 131,663 184,527 8,321 318,9642002/03 - 2004/05 617,567 137,336 146,838 8,321 286,9482003/04 - 2005/06 565,104 152,213 177,088 13,604 333,8362004/05 - 2006/07 639,469 177,377 231,652 13,604 413,5642005/06 - 2007/08 679,455 213,297 210,037 13,604 427,8692006/07 - 2008/09 755,759 231,057 143,063 13,604 374,1202007/08 - 2009/10 699,733 244,328 115,742 13,604 360,0712008/09 - 2010/11 681,592 244,860 130,821 13,604 375,6812009/10 - 2011/12 658,250 305,179 122,701 13,604 427,8802010/11 - 2012/13 723,135 282,752 85,057 13,604 367,8092011/12 - 2013/14 4 723,135 304,563 51,335 13,604 355,8982012/13 - 2014/15 5 891,732 302,320 48,153 13,604 350,4732013/14 - 2015/16 5 991,341 393,191 68,033 13,604 461,2242014/15 - 2016/17 994,271 437,449 92,826 13,604 530,2752015/16 - 2017/18 916,277 540,911 106,595 13,604 647,506
POPULATION OBJECTIVES:
POPULATION THAT PROVIDES OPTIMUM HARVEST OPPORTUNITIES
REGULATORY THRESHOLDS:
WEST TIER 6 NO THRESHOLDREST OF CF
CLOSED 3-YR AVE <250,000RESTRICTIVE 3-YR AVE <600,000 AND HARVEST RATE >6%
STANDARD 3-YR AVE >600,000 OR HARVEST RATE <6%03/05/18
1 Since 1997, Mid-continent white-fronted geese have been considered one population, officially surveyed during Fall (September) in Saskatchewan and Alberta.
2 Surveys in Mexico have been conducted at 3-year intervals since 1981-82. For estimation of 3-year averages after 1980/81-1982/83 we used the most recent Mexico count. Mexico data entries include white-fronts counted in the Interior Highlands (traditional areas) and East Coast Surveys. In 2003, no survey conducted on East Coast. Mexico surveys have not been conducted since 2005. Column entries reflect official December surveys (when available) from 1969/70 to 1997/98. Subsequent entries reflect January surveys.
3 In TX, traditional Mid Dec. cruise count not completed, WFG geese based on transect in Jan.4 Survey was not completed in Fall 2013 due to the US Federal Gov't Shutdown. Used previous 3 yr average.5 Three-year average only contains 2 years since the 2013 survey was not completed.6 Except the West Tier of Texas.
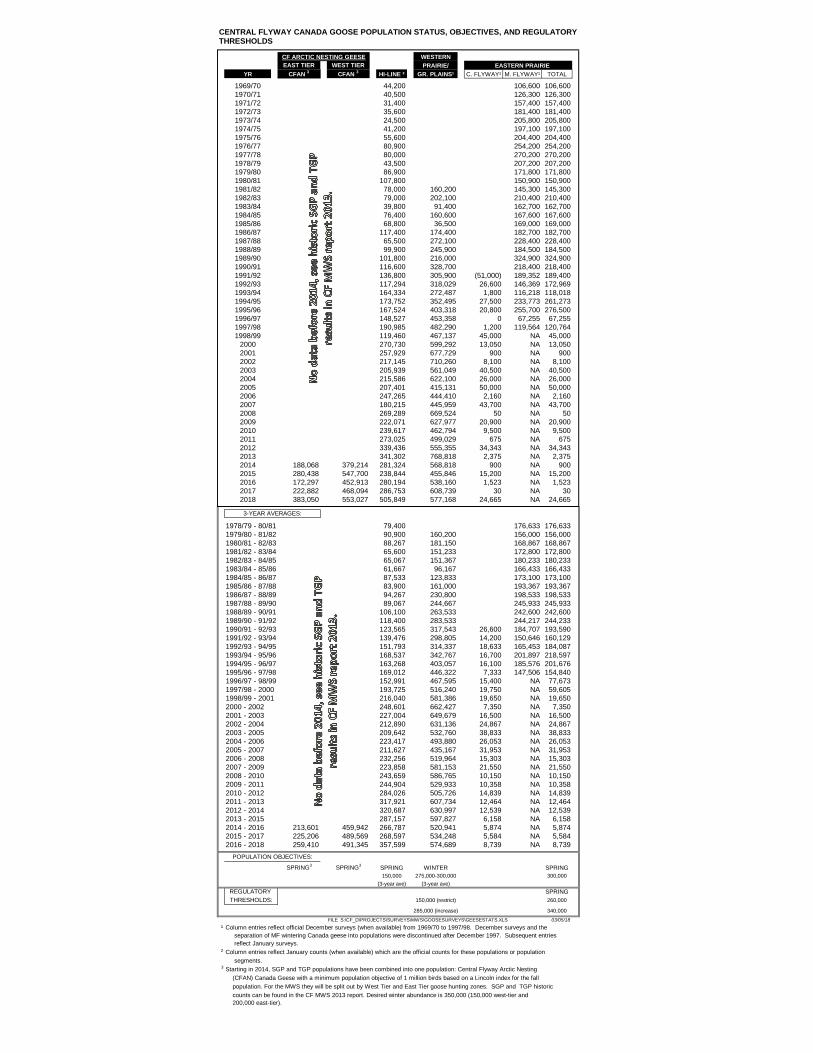
CENTRAL FLYWAY CANADA GOOSE POPULATION STATUS, OBJECTIVES, AND REGULATORYTHRESHOLDS
WESTERNPRAIRIE/ EASTERN PRAIRIE
YR HI-LINE ² GR. PLAINS¹ C. FLYWAY¹ M. FLYWAY¹ TOTAL
1969/70 44,200 106,600 106,6001970/71 40,500 126,300 126,3001971/72 31,400 157,400 157,4001972/73 35,600 181,400 181,4001973/74 24,500 205,800 205,8001974/75 41,200 197,100 197,1001975/76 55,600 204,400 204,4001976/77 80,900 254,200 254,2001977/78 80,000 270,200 270,2001978/79 43,500 207,200 207,2001979/80 86,900 171,800 171,8001980/81 107,800 150,900 150,9001981/82 78,000 160,200 145,300 145,3001982/83 79,000 202,100 210,400 210,4001983/84 39,800 91,400 162,700 162,7001984/85 76,400 160,600 167,600 167,6001985/86 68,800 36,500 169,000 169,0001986/87 117,400 174,400 182,700 182,7001987/88 65,500 272,100 228,400 228,4001988/89 99,900 245,900 184,500 184,5001989/90 101,800 216,000 324,900 324,9001990/91 116,600 328,700 218,400 218,4001991/92 136,800 305,900 (51,000) 189,352 189,4001992/93 117,294 318,029 26,600 146,369 172,9691993/94 164,334 272,487 1,800 116,218 118,0181994/95 173,752 352,495 27,500 233,773 261,2731995/96 167,524 403,318 20,800 255,700 276,5001996/97 148,527 453,358 0 67,255 67,255
1997/98 190,985 482,290 1,200 119,564 120,7641998/99 119,460 467,137 45,000 NA 45,000
2000 270,730 599,292 13,050 NA 13,0502001 257,929 677,729 900 NA 9002002 217,145 710,260 8,100 NA 8,1002003 205,939 561,049 40,500 NA 40,5002004 215,586 622,100 26,000 NA 26,0002005 207,401 415,131 50,000 NA 50,0002006 247,265 444,410 2,160 NA 2,1602007 180,215 445,959 43,700 NA 43,7002008 269,289 669,524 50 NA 502009 222,071 627,977 20,900 NA 20,9002010 239,617 462,794 9,500 NA 9,5002011 273,025 499,029 675 NA 6752012 339,436 555,355 34,343 NA 34,3432013 341,302 768,818 2,375 NA 2,3752014 188,068 379,214 281,324 568,818 900 NA 9002015 280,438 547,700 238,844 455,846 15,200 NA 15,2002016 172,297 452,913 280,194 538,160 1,523 NA 1,5232017 222,882 468,094 286,753 608,739 30 NA 302018 383,050 553,027 505,849 577,168 24,665 NA 24,665
3-YEAR AVERAGES:
1978/79 - 80/81 79,400 176,633 176,6331979/80 - 81/82 90,900 160,200 156,000 156,0001980/81 - 82/83 88,267 181,150 168,867 168,8671981/82 - 83/84 65,600 151,233 172,800 172,8001982/83 - 84/85 65,067 151,367 180,233 180,2331983/84 - 85/86 61,667 96,167 166,433 166,4331984/85 - 86/87 87,533 123,833 173,100 173,1001985/86 - 87/88 83,900 161,000 193,367 193,3671986/87 - 88/89 94,267 230,800 198,533 198,5331987/88 - 89/90 89,067 244,667 245,933 245,9331988/89 - 90/91 106,100 263,533 242,600 242,6001989/90 - 91/92 118,400 283,533 244,217 244,2331990/91 - 92/93 123,565 317,543 26,600 184,707 193,5901991/92 - 93/94 139,476 298,805 14,200 150,646 160,1291992/93 - 94/95 151,793 314,337 18,633 165,453 184,0871993/94 - 95/96 168,537 342,767 16,700 201,897 218,5971994/95 - 96/97 163,268 403,057 16,100 185,576 201,6761995/96 - 97/98 169,012 446,322 7,333 147,506 154,8401996/97 - 98/99 152,991 467,595 15,400 NA 77,6731997/98 - 2000 193,725 516,240 19,750 NA 59,6051998/99 - 2001 216,040 581,386 19,650 NA 19,6502000 - 2002 248,601 662,427 7,350 NA 7,3502001 - 2003 227,004 649,679 16,500 NA 16,5002002 - 2004 212,890 631,136 24,867 NA 24,8672003 - 2005 209,642 532,760 38,833 NA 38,8332004 - 2006 223,417 493,880 26,053 NA 26,0532005 - 2007 211,627 435,167 31,953 NA 31,9532006 - 2008 232,256 519,964 15,303 NA 15,3032007 - 2009 223,858 581,153 21,550 NA 21,5502008 - 2010 243,659 586,765 10,150 NA 10,1502009 - 2011 244,904 529,933 10,358 NA 10,3582010 - 2012 284,026 505,726 14,839 NA 14,8392011 - 2013 317,921 607,734 12,464 NA 12,4642012 - 2014 320,687 630,997 12,539 NA 12,5392013 - 2015 287,157 597,827 6,158 NA 6,1582014 - 2016 213,601 459,942 266,787 520,941 5,874 NA 5,8742015 - 2017 225,206 489,569 268,597 534,248 5,584 NA 5,5842016 - 2018 259,410 491,345 357,599 574,689 8,739 NA 8,739
POPULATION OBJECTIVES:
SPRING3 SPRING3 SPRING WINTER SPRING150,000 275,000-300,000 300,000
(3-year ave) (3-year ave)REGULATORY SPRINGTHRESHOLDS: 150,000 (restrict) 260,000
285,000 (increase) 340,000FILE S:\CF_D\PROJECTS\SURVEYS\MWS\GOOSESURVEYS\GEESESTATS.XLS 03/05/18
¹ Column entries reflect official December surveys (when available) from 1969/70 to 1997/98. December surveys and the separation of MF wintering Canada geese into populations were discontinued after December 1997. Subsequent entries reflect January surveys.
² Column entries reflect January counts (when available) which are the official counts for these populations or population segments.
3
200,000 east-tier).
Starting in 2014, SGP and TGP populations have been combined into one population: Central Flyway Arctic Nesting
WEST TIER CFAN 3
EAST TIER CFAN 3
CF ARCTIC NESTING GEESE
(CFAN) Canada Geese with a minimum population objective of 1 million birds based on a Lincoln index for the fall population. For the MWS they will be split out by West Tier and East Tier goose hunting zones. SGP and TGP historic counts can be found in the CF MWS 2013 report. Desired winter abundance is 350,000 (150,000 west-tier and
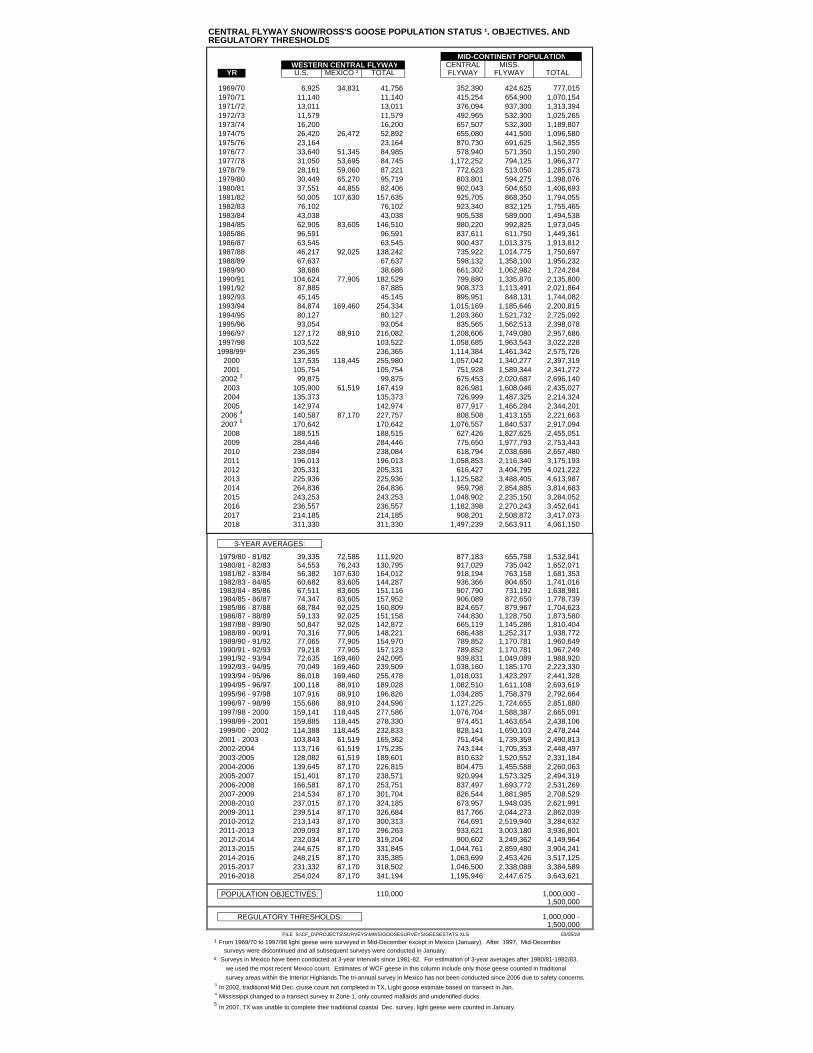
CENTRAL FLYWAY SNOW/ROSS'S GOOSE POPULATION STATUS ¹, OBJECTIVES, ANDREGULATORY THRESHOLDS
MID-CONTINENT POPULATION WESTERN CENTRAL FLYWAY CENTRAL MISS.
YR U.S. MEXICO ² TOTAL FLYWAY FLYWAY TOTAL
1969/70 6,925 34,831 41,756 352,390 424,625 777,0151970/71 11,140 11,140 415,254 654,900 1,070,1541971/72 13,011 13,011 376,094 937,300 1,313,3941972/73 11,579 11,579 492,965 532,300 1,025,2651973/74 16,200 16,200 657,507 532,300 1,189,8071974/75 26,420 26,472 52,892 655,080 441,500 1,096,5801975/76 23,164 23,164 870,730 691,625 1,562,3551976/77 33,640 51,345 84,985 578,940 571,350 1,150,2901977/78 31,050 53,695 84,745 1,172,252 794,125 1,966,3771978/79 28,161 59,060 87,221 772,623 513,050 1,285,6731979/80 30,449 65,270 95,719 803,801 594,275 1,398,0761980/81 37,551 44,855 82,406 902,043 504,650 1,406,6931981/82 50,005 107,630 157,635 925,705 868,350 1,794,0551982/83 76,102 76,102 923,340 832,125 1,755,4651983/84 43,038 43,038 905,538 589,000 1,494,5381984/85 62,905 83,605 146,510 980,220 992,825 1,973,0451985/86 96,591 96,591 837,611 611,750 1,449,3611986/87 63,545 63,545 900,437 1,013,375 1,913,8121987/88 46,217 92,025 138,242 735,922 1,014,775 1,750,6971988/89 67,637 67,637 598,132 1,358,100 1,956,2321989/90 38,686 38,686 661,302 1,062,982 1,724,2841990/91 104,624 77,905 182,529 799,880 1,335,870 2,135,8001991/92 87,885 87,885 908,373 1,113,491 2,021,8641992/93 45,145 45,145 895,951 848,131 1,744,0821993/94 84,874 169,460 254,334 1,015,169 1,185,646 2,200,8151994/95 80,127 80,127 1,203,360 1,521,732 2,725,0921995/96 93,054 93,054 835,565 1,562,513 2,398,0781996/97 127,172 88,910 216,082 1,208,606 1,749,080 2,957,6861997/98 103,522 103,522 1,058,685 1,963,543 3,022,2281998/99¹ 236,365 236,365 1,114,384 1,461,342 2,575,726
2000 137,535 118,445 255,980 1,057,042 1,340,277 2,397,3192001 105,754 105,754 751,928 1,589,344 2,341,272
2002 3 99,875 99,875 675,453 2,020,687 2,696,1402003 105,900 61,519 167,419 826,981 1,608,046 2,435,0272004 135,373 135,373 726,999 1,487,325 2,214,3242005 142,974 142,974 877,917 1,466,284 2,344,201
2006 4 140,587 87,170 227,757 808,508 1,413,155 2,221,6632007 5 170,642 170,642 1,076,557 1,840,537 2,917,0942008 188,515 188,515 627,426 1,827,625 2,455,0512009 284,446 284,446 775,650 1,977,793 2,753,4432010 238,084 238,084 618,794 2,038,686 2,657,4802011 196,013 196,013 1,058,853 2,116,340 3,175,1932012 205,331 205,331 616,427 3,404,795 4,021,2222013 225,936 225,936 1,125,582 3,488,405 4,613,9872014 264,836 264,836 959,798 2,854,885 3,814,6832015 243,253 243,253 1,048,902 2,235,150 3,284,0522016 236,557 236,557 1,182,398 2,270,243 3,452,6412017 214,185 214,185 908,201 2,508,872 3,417,0732018 311,330 311,330 1,497,239 2,563,911 4,061,150
3-YEAR AVERAGES:
1979/80 - 81/82 39,335 72,585 111,920 877,183 655,758 1,532,9411980/81 - 82/83 54,553 76,243 130,795 917,029 735,042 1,652,0711981/82 - 83/84 56,382 107,630 164,012 918,194 763,158 1,681,3531982/83 - 84/85 60,682 83,605 144,287 936,366 804,650 1,741,0161983/84 - 85/86 67,511 83,605 151,116 907,790 731,192 1,638,9811984/85 - 86/87 74,347 83,605 157,952 906,089 872,650 1,778,7391985/86 - 87/88 68,784 92,025 160,809 824,657 879,967 1,704,6231986/87 - 88/89 59,133 92,025 151,158 744,830 1,128,750 1,873,5801987/88 - 89/90 50,847 92,025 142,872 665,119 1,145,286 1,810,4041988/89 - 90/91 70,316 77,905 148,221 686,438 1,252,317 1,938,7721989/90 - 91/92 77,065 77,905 154,970 789,852 1,170,781 1,960,6491990/91 - 92/93 79,218 77,905 157,123 789,852 1,170,781 1,967,2491991/92 - 93/94 72,635 169,460 242,095 939,831 1,049,089 1,988,9201992/93 - 94/95 70,049 169,460 239,509 1,038,160 1,185,170 2,223,3301993/94 - 95/96 86,018 169,460 255,478 1,018,031 1,423,297 2,441,3281994/95 - 96/97 100,118 88,910 189,028 1,082,510 1,611,108 2,693,6191995/96 - 97/98 107,916 88,910 196,826 1,034,285 1,758,379 2,792,6641996/97 - 98/99 155,686 88,910 244,596 1,127,225 1,724,655 2,851,8801997/98 - 2000 159,141 118,445 277,586 1,076,704 1,588,387 2,665,0911998/99 - 2001 159,885 118,445 278,330 974,451 1,463,654 2,438,1061999/00 - 2002 114,388 118,445 232,833 828,141 1,650,103 2,478,2442001 - 2003 103,843 61,519 165,362 751,454 1,739,359 2,490,8132002-2004 113,716 61,519 175,235 743,144 1,705,353 2,448,4972003-2005 128,082 61,519 189,601 810,632 1,520,552 2,331,1842004-2006 139,645 87,170 226,815 804,475 1,455,588 2,260,0632005-2007 151,401 87,170 238,571 920,994 1,573,325 2,494,3192006-2008 166,581 87,170 253,751 837,497 1,693,772 2,531,2692007-2009 214,534 87,170 301,704 826,544 1,881,985 2,708,5292008-2010 237,015 87,170 324,185 673,957 1,948,035 2,621,9912009-2011 239,514 87,170 326,684 817,766 2,044,273 2,862,0392010-2012 213,143 87,170 300,313 764,691 2,519,940 3,284,6322011-2013 209,093 87,170 296,263 933,621 3,003,180 3,936,8012012-2014 232,034 87,170 319,204 900,602 3,249,362 4,149,9642013-2015 244,675 87,170 331,845 1,044,761 2,859,480 3,904,2412014-2016 248,215 87,170 335,385 1,063,699 2,453,426 3,517,1252015-2017 231,332 87,170 318,502 1,046,500 2,338,088 3,384,5892016-2018 254,024 87,170 341,194 1,195,946 2,447,675 3,643,621
POPULATION OBJECTIVES: 110,000 1,000,000 -1,500,000
REGULATORY THRESHOLDS: 1,000,000 -1,500,000
FILE S:\CF_D\PROJECTS\SURVEYS\MWS\GOOSESURVEYS\GEESESTATS.XLS 03/05/18
¹ From 1969/70 to 1997/98 light geese were surveyed in Mid-December except in Mexico (January). After 1997, Mid-December surveys were discontinued and all subsequent surveys were conducted in January.
² Surveys in Mexico have been conducted at 3-year intervals since 1981-82. For estimation of 3-year averages after 1980/81-1982/83, we used the most recent Mexico count. Estimates of WCF geese in this column include only those geese counted in traditional survey areas within the Interior Highlands.The tri-annual survey in Mexico has not been conducted since 2006 due to safety concerns.
3 In 2002, traditional Mid Dec. cruise count not completed in TX, Light goose estimate based on transect in Jan.4 Mississippi changed to a transect survey in Zone 1, only counted mallards and unidentified ducks.5 In 2007, TX was unable to complete their traditional coastal Dec. survey, light geese were counted in January.
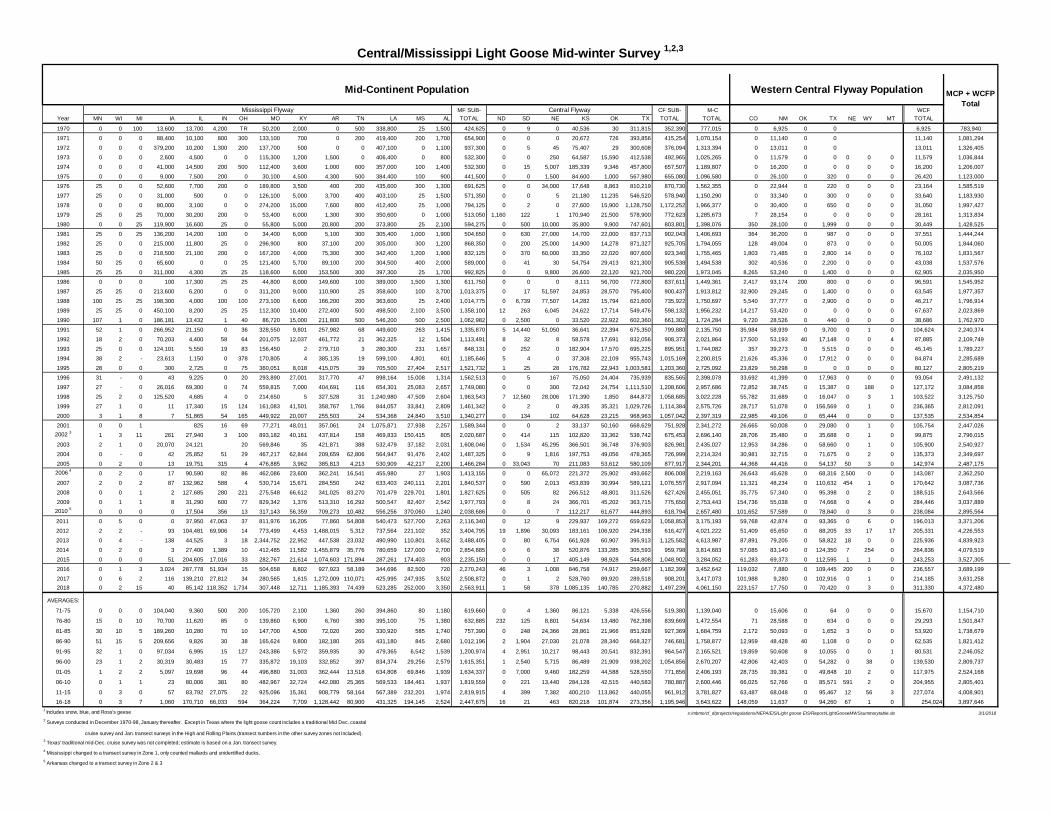
Mississippi Flyway MF SUB- Central Flyway CF SUB- M-C WCFYear MN WI MI IA IL IN OH MO KY AR TN LA MS AL TOTAL ND SD NE KS OK TX TOTAL TOTAL CO NM OK TX NE WY MT TOTAL
1970 0 0 100 13,600 13,700 4,200 TR 50,200 2,000 0 500 338,800 25 1,500 424,625 0 9 0 40,536 30 311,815 352,390 777,015 0 6,925 0 0 6,925 783,940
1971 0 0 0 88,400 10,100 800 300 133,100 700 0 200 419,400 200 1,700 654,900 0 0 0 20,672 726 393,856 415,254 1,070,154 0 11,140 0 0 11,140 1,081,294
1972 0 0 0 379,200 10,200 1,300 200 137,700 500 0 0 407,100 0 1,100 937,300 0 5 45 75,407 29 300,608 376,094 1,313,394 0 13,011 0 0 13,011 1,326,405
1973 0 0 0 2,600 4,500 0 0 115,300 1,200 1,500 0 406,400 0 800 532,300 0 0 250 64,587 15,590 412,538 492,965 1,025,265 0 11,579 0 0 0 0 0 11,579 1,036,844
1974 0 0 0 41,000 14,500 200 500 112,400 3,600 1,000 600 357,000 100 1,400 532,300 0 15 5,007 185,339 9,346 457,800 657,507 1,189,807 0 16,200 0 0 0 0 0 16,200 1,206,007
1975 0 0 0 9,000 7,500 200 0 30,100 4,500 4,300 500 384,400 100 900 441,500 0 0 1,500 84,600 1,000 567,980 655,080 1,096,580 0 26,100 0 320 0 0 0 26,420 1,123,000
1976 25 0 0 52,600 7,700 200 0 189,800 3,500 400 200 435,600 300 1,300 691,625 0 0 34,000 17,648 8,863 810,219 870,730 1,562,355 0 22,944 0 220 0 0 0 23,164 1,585,519
1977 25 0 0 31,000 500 0 0 126,100 5,000 3,700 400 403,100 25 1,500 571,350 0 0 5 21,180 11,235 546,520 578,940 1,150,290 0 33,340 0 300 0 0 0 33,640 1,183,930
1978 0 0 0 80,000 3,100 0 0 274,200 15,000 7,600 800 412,400 25 1,000 794,125 0 2 0 27,600 15,900 1,128,750 1,172,252 1,966,377 0 30,400 0 650 0 0 0 31,050 1,997,427
1979 25 0 25 70,000 30,200 200 0 53,400 6,000 1,300 300 350,600 0 1,000 513,050 1,160 122 1 170,940 21,500 578,900 772,623 1,285,673 7 28,154 0 0 0 0 0 28,161 1,313,834
1980 0 0 25 119,900 16,600 25 0 55,800 5,000 20,800 200 373,800 25 2,100 594,275 0 500 10,000 35,800 9,900 747,601 803,801 1,398,076 350 28,100 0 1,999 0 0 0 30,449 1,428,525
1981 25 0 25 136,200 14,200 100 0 34,400 6,000 5,100 300 305,400 1,000 1,900 504,650 0 630 27,000 14,700 22,000 837,713 902,043 1,406,693 364 36,200 0 987 0 0 0 37,551 1,444,244
1982 25 0 0 215,000 11,800 25 0 296,900 800 37,100 200 305,000 300 1,200 868,350 0 200 25,000 14,900 14,278 871,327 925,705 1,794,055 128 49,004 0 873 0 0 0 50,005 1,844,060
1983 25 0 0 218,500 21,100 200 0 167,200 4,000 75,300 300 342,400 1,200 1,900 832,125 0 370 60,000 33,350 22,020 807,600 923,340 1,755,465 1,803 71,485 0 2,800 14 0 0 76,102 1,831,567
1984 50 25 0 65,600 0 0 25 121,400 5,700 89,100 200 304,500 400 2,000 589,000 0 41 30 54,754 29,413 821,300 905,538 1,494,538 302 40,536 0 2,200 0 0 0 43,038 1,537,576
1985 25 25 0 311,000 4,300 25 25 118,600 6,000 153,500 300 397,300 25 1,700 992,825 0 0 9,800 26,600 22,120 921,700 980,220 1,973,045 8,265 53,240 0 1,400 0 0 0 62,905 2,035,950
1986 0 0 0 100 17,300 25 25 44,800 8,000 149,600 100 389,000 1,500 1,300 611,750 0 0 0 8,111 56,700 772,800 837,611 1,449,361 2,417 93,174 200 800 0 0 0 96,591 1,545,952
1987 25 25 0 213,600 6,200 0 0 311,200 9,000 110,900 25 358,600 100 3,700 1,013,375 0 17 51,597 24,853 28,570 795,400 900,437 1,913,812 32,900 29,245 0 1,400 0 0 0 63,545 1,977,357
1988 100 25 25 198,300 4,000 100 100 273,100 6,600 166,200 200 363,600 25 2,400 1,014,775 0 6,739 77,507 14,282 15,794 621,600 735,922 1,750,697 5,540 37,777 0 2,900 0 0 0 46,217 1,796,914
1989 25 25 0 450,100 8,200 25 25 112,300 10,400 272,400 500 498,500 2,100 3,500 1,358,100 12 263 6,045 24,622 17,714 549,476 598,132 1,956,232 14,217 53,420 0 0 0 0 0 67,637 2,023,869
1990 107 1 0 186,181 13,432 1 40 86,720 15,000 211,800 500 546,200 500 2,500 1,062,982 0 2,500 0 33,520 22,922 602,360 661,302 1,724,284 9,720 28,526 0 440 0 0 0 38,686 1,762,970
1991 52 1 0 266,952 21,150 0 36 328,550 9,801 257,982 68 449,600 263 1,415 1,335,870 5 14,440 51,050 36,641 22,394 675,350 799,880 2,135,750 35,984 58,939 0 9,700 0 1 0 104,624 2,240,374
1992 18 2 0 70,203 4,400 58 64 201,075 12,037 461,772 21 362,325 12 1,504 1,113,491 8 32 8 58,578 17,691 832,056 908,373 2,021,864 17,500 53,193 40 17,148 0 0 4 87,885 2,109,749
1993 25 0 0 124,101 5,550 19 83 156,450 2 279,710 3 280,300 231 1,657 848,131 0 252 0 182,904 17,570 695,225 895,951 1,744,082 357 39,273 0 5,515 0 0 0 45,145 1,789,227
1994 38 2 - 23,613 1,150 0 378 170,805 4 385,135 19 599,100 4,801 601 1,185,646 5 4 0 37,308 22,109 955,743 1,015,169 2,200,815 21,626 45,336 0 17,912 0 0 0 84,874 2,285,689
1995 28 0 0 300 2,725 0 75 360,051 8,018 415,075 39 705,500 27,404 2,517 1,521,732 1 25 28 176,782 22,943 1,003,581 1,203,360 2,725,092 23,829 56,298 0 0 0 0 0 80,127 2,805,219
1996 31 - 0 43 9,225 0 20 293,890 27,001 317,770 47 898,164 15,008 1,314 1,562,513 0 5 167 75,050 24,404 735,939 835,565 2,398,078 33,692 41,399 0 17,963 0 0 0 93,054 2,491,132
1997 27 - 0 26,016 69,300 0 74 559,815 7,000 404,691 116 654,301 25,083 2,657 1,749,080 0 0 300 72,042 24,754 1,111,510 1,208,606 2,957,686 72,852 38,745 0 15,387 0 188 0 127,172 3,084,858
1998 25 2 0 125,520 4,685 4 0 214,650 5 327,528 31 1,240,980 47,509 2,604 1,963,543 7 12,560 28,006 171,390 1,850 844,872 1,058,685 3,022,228 55,782 31,689 0 16,047 0 3 1 103,522 3,125,750
1999 27 1 0 11 17,340 15 124 161,083 41,501 358,767 1,766 844,057 33,841 2,809 1,461,342 0 2 0 49,335 35,321 1,029,726 1,114,384 2,575,726 28,717 51,078 0 156,569 0 1 0 236,365 2,812,091
2000 3 1 8 7 51,865 54 165 449,922 20,007 255,503 24 534,368 24,840 3,510 1,340,277 0 134 102 64,628 23,215 968,963 1,057,042 2,397,319 22,985 49,106 0 65,444 0 0 0 137,535 2,534,854
2001 0 0 1 825 16 69 77,271 48,011 357,061 24 1,075,871 27,938 2,257 1,589,344 0 0 2 33,137 50,160 668,629 751,928 2,341,272 26,665 50,008 0 29,080 0 1 0 105,754 2,447,0262002 3 1 3 11 261 27,940 3 100 893,182 40,161 437,814 158 469,833 150,415 805 2,020,687 0 414 115 102,820 33,362 538,742 675,453 2,696,140 28,706 35,480 0 35,688 0 1 0 99,875 2,796,015
2003 2 1 0 20,070 24,121 20 569,846 35 421,871 388 532,479 37,182 2,031 1,608,046 0 1,534 45,295 366,501 36,748 376,903 826,981 2,435,027 12,953 34,286 0 58,660 0 1 0 105,900 2,540,927
2004 0 - 0 42 25,852 51 29 467,217 62,844 209,659 62,806 564,947 91,476 2,402 1,487,325 0 9 1,816 197,753 49,056 478,365 726,999 2,214,324 30,981 32,715 0 71,675 0 2 0 135,373 2,349,697
2005 0 2 0 13 19,751 315 4 476,885 3,962 385,813 4,213 530,909 42,217 2,200 1,466,284 0 33,043 70 211,083 53,612 580,109 877,917 2,344,201 44,368 44,416 0 54,137 50 3 0 142,974 2,487,1752006 4 0 2 0 17 90,590 82 86 462,086 23,600 362,241 16,541 455,980 27 1,903 1,413,155 0 0 65,072 221,372 25,902 493,662 806,008 2,219,163 26,643 45,628 0 68,316 2,500 0 0 143,087 2,362,250
2007 2 0 2 87 132,962 588 4 530,714 15,671 284,550 242 633,403 240,111 2,201 1,840,537 0 590 2,013 453,839 30,994 589,121 1,076,557 2,917,094 11,321 48,234 0 110,632 454 1 0 170,642 3,087,736
2008 0 0 1 2 127,685 280 221 275,548 66,612 341,025 83,270 701,479 229,701 1,801 1,827,625 0 505 82 266,512 48,801 311,526 627,426 2,455,051 35,775 57,340 0 95,398 0 2 0 188,515 2,643,566
2009 0 1 1 8 31,290 600 77 829,342 1,376 513,310 16,292 500,547 82,407 2,542 1,977,793 0 8 24 366,701 45,202 363,715 775,650 2,753,443 154,736 55,038 0 74,668 0 4 0 284,446 3,037,8892010 5 0 0 0 0 17,504 356 13 317,143 56,359 709,273 10,482 556,256 370,060 1,240 2,038,686 0 0 7 112,217 61,677 444,893 618,794 2,657,480 101,652 57,589 0 78,840 0 3 0 238,084 2,895,564
2011 0 5 0 0 37,950 47,063 37 811,976 16,205 77,860 54,808 540,473 527,700 2,263 2,116,340 0 12 9 229,937 169,272 659,623 1,058,853 3,175,193 59,768 42,874 0 93,365 0 6 0 196,013 3,371,206
2012 2 2 - 93 104,481 69,906 14 773,499 4,453 1,488,015 5,312 737,564 221,102 352 3,404,795 19 1,896 30,093 183,161 106,920 294,338 616,427 4,021,222 51,409 65,650 0 88,205 33 17 17 205,331 4,226,553
2013 0 4 - 138 44,525 3 18 2,344,752 22,952 447,538 23,032 490,990 110,801 3,652 3,488,405 0 80 6,754 661,928 60,907 395,913 1,125,582 4,613,987 87,891 79,205 0 58,822 18 0 0 225,936 4,839,923
2014 0 2 0 3 27,400 1,389 10 412,485 11,582 1,455,879 35,776 780,659 127,000 2,700 2,854,885 0 6 38 520,876 133,285 305,593 959,798 3,814,683 57,085 83,140 0 124,350 7 254 0 264,836 4,079,519
2015 0 0 0 51 204,605 17,016 33 282,767 21,614 1,074,603 171,894 287,261 174,403 903 2,235,150 0 0 17 405,149 98,928 544,808 1,048,902 3,284,052 61,283 69,373 0 112,595 1 1 0 243,253 3,527,305
2016 0 1 3 3,024 287,778 51,934 15 504,658 8,802 927,923 58,189 344,696 82,500 720 2,270,243 46 3 1,008 846,758 74,917 259,667 1,182,399 3,452,642 119,032 7,880 0 109,445 200 0 0 236,557 3,689,199
2017 0 6 2 116 139,210 27,812 34 280,565 1,615 1,272,009 110,071 425,995 247,935 3,502 2,508,872 0 1 2 528,760 89,920 289,518 908,201 3,417,073 101,988 9,280 0 102,916 0 1 0 214,185 3,631,2582018 0 2 15 40 85,142 118,352 1,734 307,448 12,711 1,185,393 74,439 523,285 252,000 3,350 2,563,911 1 58 378 1,085,135 140,785 270,882 1,497,239 4,061,150 223,157 17,750 0 70,420 0 3 0 311,330 4,372,480
AVERAGES:
71-75 0 0 0 104,040 9,360 500 200 105,720 2,100 1,360 260 394,860 80 1,180 619,660 0 4 1,360 86,121 5,338 426,556 519,380 1,139,040 0 15,606 0 64 0 0 0 15,670 1,154,710
76-80 15 0 10 70,700 11,620 85 0 139,860 6,900 6,760 380 395,100 75 1,380 632,885 232 125 8,801 54,634 13,480 762,398 839,669 1,472,554 71 28,588 0 634 0 0 0 29,293 1,501,847
81-85 30 10 5 189,260 10,280 70 10 147,700 4,500 72,020 260 330,920 585 1,740 757,390 0 248 24,366 28,861 21,966 851,928 927,369 1,684,759 2,172 50,093 0 1,652 3 0 0 53,920 1,738,679
86-90 51 15 5 209,656 9,826 30 38 165,624 9,800 182,180 265 431,180 845 2,680 1,012,196 2 1,904 27,030 21,078 28,340 668,327 746,681 1,758,877 12,959 48,428 40 1,108 0 0 0 62,535 1,821,412
91-95 32 1 0 97,034 6,995 15 127 243,386 5,972 359,935 30 479,365 6,542 1,539 1,200,974 4 2,951 10,217 98,443 20,541 832,391 964,547 2,165,521 19,859 50,608 8 10,055 0 0 1 80,531 2,246,052
96-00 23 1 2 30,319 30,483 15 77 335,872 19,103 332,852 397 834,374 29,256 2,579 1,615,351 1 2,540 5,715 86,489 21,909 938,202 1,054,856 2,670,207 42,806 42,403 0 54,282 0 38 0 139,530 2,809,737
01-05 1 2 2 5,097 19,698 96 44 496,880 31,003 362,444 13,518 634,808 69,846 1,939 1,634,337 0 7,000 9,460 182,259 44,588 528,550 771,856 2,406,193 28,735 39,381 0 49,848 10 2 0 117,975 2,524,168
06-10 0 1 1 23 80,006 381 80 482,967 32,724 442,080 25,365 569,533 184,461 1,937 1,819,559 0 221 13,440 284,128 42,515 440,583 780,887 2,600,446 66,025 52,766 0 85,571 591 2 0 204,955 2,805,401
11-15 0 3 0 57 83,792 27,075 22 925,096 15,361 908,779 58,164 567,389 232,201 1,974 2,819,915 4 399 7,382 400,210 113,862 440,055 961,912 3,781,827 63,487 68,048 0 95,467 12 56 3 227,074 4,008,901
16-18 0 3 7 1,060 170,710 66,033 594 364,224 7,709 1,128,442 80,900 431,325 194,145 2,524 2,447,675 16 21 463 820,218 101,874 273,356 1,195,946 3,643,622 148,059 11,637 0 94,260 67 1 0 254,024 3,897,6461 Includes snow, blue, and Ross's geese s:/mbmo/cf_d/projects/regulations/NEPA/EIS/Light goose EIS/Report/LightGooseMWSsummarytable.xls 3/1/20182 Surveys conducted in December 1970-98, January thereafter. Except in Texas where the light goose count includes a traditional Mid Dec. coastal
cruise survey and Jan. transect surveys in the High and Rolling Plains (transect numbers in the other survey zones not included).3 Texas' traditional mid-Dec. cruise survey was not completed; estimate is based on a Jan. transect survey.4 Mississippi changed to a transect survey in Zone 1, only counted mallards and unidentified ducks.5 Arkansas changed to a transect survey in Zone 2 & 3
Central/Mississippi Light Goose Mid-winter Survey 1,2,3
Mid-Continent Population Western Central Flyway Population MCP + WCFP Total
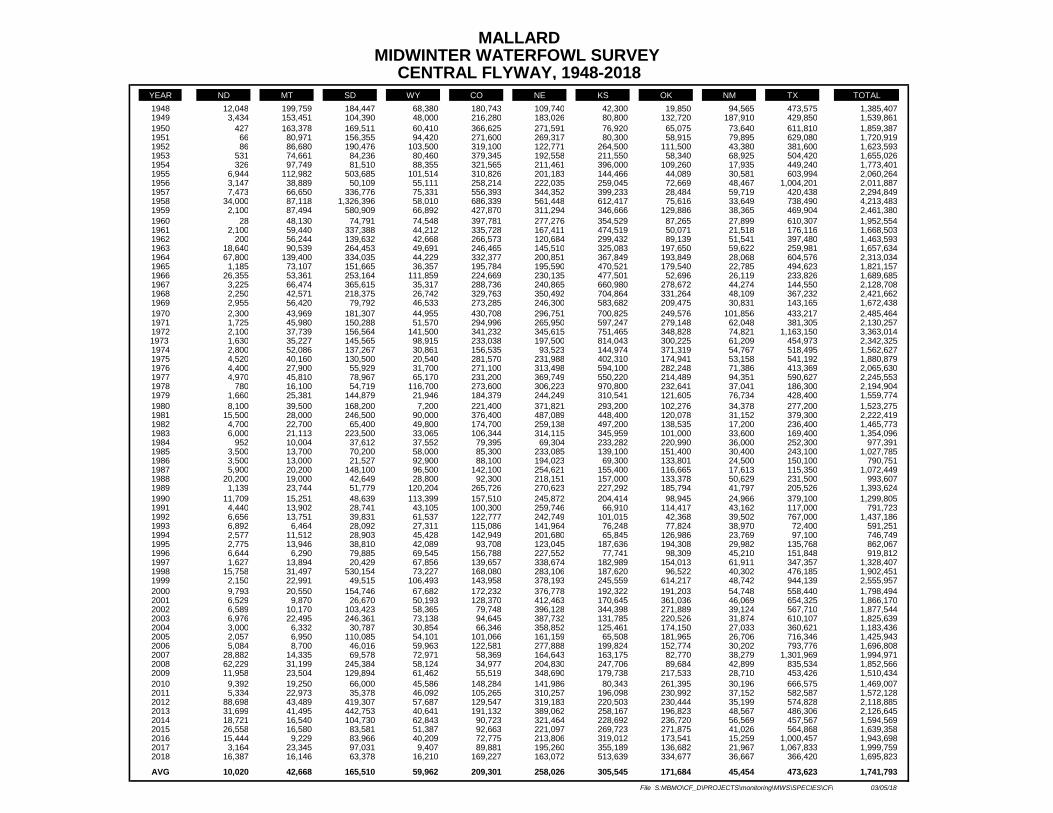
MALLARDMIDWINTER WATERFOWL SURVEY
CENTRAL FLYWAY, 1948-2018YEAR ND MT SD WY CO NE KS OK NM TX TOTAL1948 12,048 199,759 184,447 68,380 180,743 109,740 42,300 19,850 94,565 473,575 1,385,4071949 3,434 153,451 104,390 48,000 216,280 183,026 80,800 132,720 187,910 429,850 1,539,8611950 427 163,378 169,511 60,410 366,625 271,591 76,920 65,075 73,640 611,810 1,859,3871951 66 80,971 156,355 94,420 271,600 269,317 80,300 58,915 79,895 629,080 1,720,9191952 86 86,680 190,476 103,500 319,100 122,771 264,500 111,500 43,380 381,600 1,623,5931953 531 74,661 84,236 80,460 379,345 192,558 211,550 58,340 68,925 504,420 1,655,0261954 326 97,749 81,510 88,355 321,565 211,461 396,000 109,260 17,935 449,240 1,773,4011955 6,944 112,982 503,685 101,514 310,826 201,183 144,466 44,089 30,581 603,994 2,060,2641956 3,147 38,889 50,109 55,111 258,214 222,035 259,045 72,669 48,467 1,004,201 2,011,8871957 7,473 66,650 336,776 75,331 556,393 344,352 399,233 28,484 59,719 420,438 2,294,8491958 34,000 87,118 1,326,396 58,010 686,339 561,448 612,417 75,616 33,649 738,490 4,213,4831959 2,100 87,494 580,909 66,892 427,870 311,294 346,666 129,886 38,365 469,904 2,461,3801960 28 48,130 74,791 74,548 397,781 277,276 354,529 87,265 27,899 610,307 1,952,5541961 2,100 59,440 337,388 44,212 335,728 167,411 474,519 50,071 21,518 176,116 1,668,5031962 200 56,244 139,632 42,668 266,573 120,684 299,432 89,139 51,541 397,480 1,463,5931963 18,640 90,539 264,453 49,691 246,465 145,510 325,083 197,650 59,622 259,981 1,657,6341964 67,800 139,400 334,035 44,229 332,377 200,851 367,849 193,849 28,068 604,576 2,313,0341965 1,185 73,107 151,665 36,357 195,784 195,590 470,521 179,540 22,785 494,623 1,821,1571966 26,355 53,361 253,164 111,859 224,669 230,135 477,501 52,696 26,119 233,826 1,689,6851967 3,225 66,474 365,615 35,317 288,736 240,865 660,980 278,672 44,274 144,550 2,128,7081968 2,250 42,571 218,375 26,742 329,763 350,492 704,864 331,264 48,109 367,232 2,421,6621969 2,955 56,420 79,792 46,533 273,285 246,300 583,682 209,475 30,831 143,165 1,672,4381970 2,300 43,969 181,307 44,955 430,708 296,751 700,825 249,576 101,856 433,217 2,485,4641971 1,725 45,980 150,288 51,570 294,996 265,950 597,247 279,148 62,048 381,305 2,130,2571972 2,100 37,739 156,564 141,500 341,232 345,615 751,465 348,828 74,821 1,163,150 3,363,0141973 1,630 35,227 145,565 98,915 233,038 197,500 814,043 300,225 61,209 454,973 2,342,3251974 2,800 52,086 137,267 30,861 156,535 93,523 144,974 371,319 54,767 518,495 1,562,6271975 4,520 40,160 130,500 20,540 281,570 231,988 402,310 174,941 53,158 541,192 1,880,8791976 4,400 27,900 55,929 31,700 271,100 313,498 594,100 282,248 71,386 413,369 2,065,6301977 4,970 45,810 78,967 65,170 231,200 369,749 550,220 214,489 94,351 590,627 2,245,5531978 780 16,100 54,719 116,700 273,600 306,223 970,800 232,641 37,041 186,300 2,194,9041979 1,660 25,381 144,879 21,946 184,379 244,249 310,541 121,605 76,734 428,400 1,559,7741980 8,100 39,500 168,200 7,200 221,400 371,821 293,200 102,276 34,378 277,200 1,523,2751981 15,500 28,000 246,500 90,000 376,400 487,089 448,400 120,078 31,152 379,300 2,222,4191982 4,700 22,700 65,400 49,800 174,700 259,138 497,200 138,535 17,200 236,400 1,465,7731983 6,000 21,113 223,500 33,065 106,344 314,115 345,959 101,000 33,600 169,400 1,354,0961984 952 10,004 37,612 37,552 79,395 69,304 233,282 220,990 36,000 252,300 977,3911985 3,500 13,700 70,200 58,000 85,300 233,085 139,100 151,400 30,400 243,100 1,027,7851986 3,500 13,000 21,527 92,900 88,100 194,023 69,300 133,801 24,500 150,100 790,7511987 5,900 20,200 148,100 96,500 142,100 254,621 155,400 116,665 17,613 115,350 1,072,4491988 20,200 19,000 42,649 28,800 92,300 218,151 157,000 133,378 50,629 231,500 993,6071989 1,139 23,744 51,779 120,204 265,726 270,623 227,292 185,794 41,797 205,526 1,393,6241990 11,709 15,251 48,639 113,399 157,510 245,872 204,414 98,945 24,966 379,100 1,299,8051991 4,440 13,902 28,741 43,105 100,300 259,746 66,910 114,417 43,162 117,000 791,7231992 6,656 13,751 39,831 61,537 122,777 242,749 101,015 42,368 39,502 767,000 1,437,1861993 6,892 6,464 28,092 27,311 115,086 141,964 76,248 77,824 38,970 72,400 591,2511994 2,577 11,512 28,903 45,428 142,949 201,680 65,845 126,986 23,769 97,100 746,7491995 2,775 13,946 38,810 42,089 93,708 123,045 187,636 194,308 29,982 135,768 862,0671996 6,644 6,290 79,885 69,545 156,788 227,552 77,741 98,309 45,210 151,848 919,8121997 1,627 13,894 20,429 67,856 139,657 338,674 182,989 154,013 61,911 347,357 1,328,4071998 15,758 31,497 530,154 73,227 168,080 283,106 187,620 96,522 40,302 476,185 1,902,4511999 2,150 22,991 49,515 106,493 143,958 378,193 245,559 614,217 48,742 944,139 2,555,9572000 9,793 20,550 154,746 67,682 172,232 376,778 192,322 191,203 54,748 558,440 1,798,4942001 6,529 9,870 26,670 50,193 128,370 412,463 170,645 361,036 46,069 654,325 1,866,1702002 6,589 10,170 103,423 58,365 79,748 396,128 344,398 271,889 39,124 567,710 1,877,5442003 6,976 22,495 246,361 73,138 94,645 387,732 131,785 220,526 31,874 610,107 1,825,6392004 3,000 6,332 30,787 30,854 66,346 358,852 125,461 174,150 27,033 360,621 1,183,4362005 2,057 6,950 110,085 54,101 101,066 161,159 65,508 181,965 26,706 716,346 1,425,9432006 5,084 8,700 46,016 59,963 122,581 277,888 199,824 152,774 30,202 793,776 1,696,8082007 28,882 14,335 69,578 72,971 58,369 164,643 163,175 82,770 38,279 1,301,969 1,994,9712008 62,229 31,199 245,384 58,124 34,977 204,830 247,706 89,684 42,899 835,534 1,852,5662009 11,958 23,504 129,894 61,462 55,519 348,690 179,738 217,533 28,710 453,426 1,510,4342010 9,392 19,250 66,000 45,586 148,284 141,986 80,343 261,395 30,196 666,575 1,469,0072011 5,334 22,973 35,378 46,092 105,265 310,257 196,098 230,992 37,152 582,587 1,572,1282012 88,698 43,489 419,307 57,687 129,547 319,183 220,503 230,444 35,199 574,828 2,118,8852013 31,699 41,495 442,753 40,641 191,132 389,062 258,167 196,823 48,567 486,306 2,126,6452014 18,721 16,540 104,730 62,843 90,723 321,464 228,692 236,720 56,569 457,567 1,594,5692015 26,558 16,580 83,581 51,387 92,663 221,097 269,723 271,875 41,026 564,868 1,639,3582016 15,444 9,229 83,966 40,209 72,775 213,806 319,012 173,541 15,259 1,000,457 1,943,6982017 3,164 23,345 97,031 9,407 89,881 195,260 355,189 136,682 21,967 1,067,833 1,999,7592018 16,387 16,146 63,378 16,210 169,227 163,072 513,639 334,677 36,667 366,420 1,695,823
AVG 10,020 42,668 165,510 59,962 209,301 258,026 305,545 171,684 45,454 473,623 1,741,793
File S:MBMO\CF_D\PROJECTS\monitoring\MWS\SPECIES\CFM 03/05/18
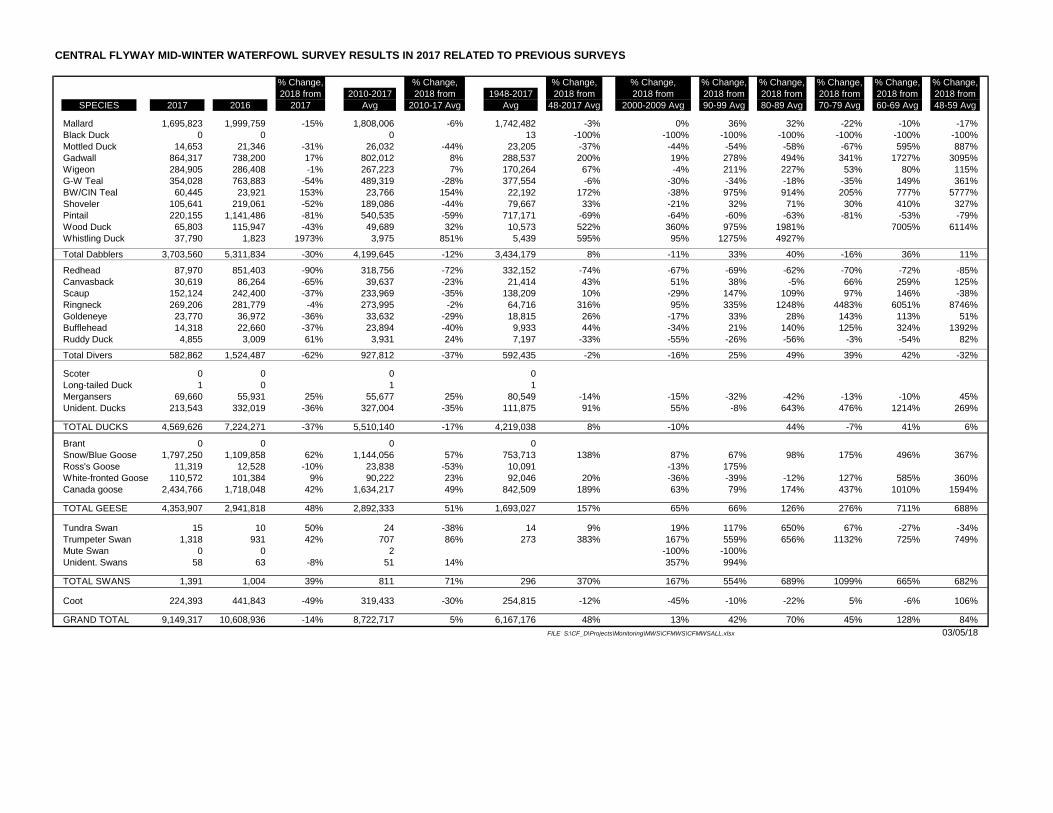
CENTRAL FLYWAY MID-WINTER WATERFOWL SURVEY RESULTS IN 2017 RELATED TO PREVIOUS SURVEYS
% Change, % Change, % Change, % Change, % Change, % Change, % Change, % Change, % Change,2018 from 2010-2017 2018 from 1948-2017 2018 from 2018 from 2018 from 2018 from 2018 from 2018 from 2018 from
SPECIES 2017 2016 2017 Avg 2010-17 Avg Avg 48-2017 Avg 2000-2009 Avg 90-99 Avg 80-89 Avg 70-79 Avg 60-69 Avg 48-59 Avg
Mallard 1,695,823 1,999,759 -15% 1,808,006 -6% 1,742,482 -3% 0% 36% 32% -22% -10% -17%Black Duck 0 0 0 13 -100% -100% -100% -100% -100% -100% -100%Mottled Duck 14,653 21,346 -31% 26,032 -44% 23,205 -37% -44% -54% -58% -67% 595% 887%Gadwall 864,317 738,200 17% 802,012 8% 288,537 200% 19% 278% 494% 341% 1727% 3095%Wigeon 284,905 286,408 -1% 267,223 7% 170,264 67% -4% 211% 227% 53% 80% 115%G-W Teal 354,028 763,883 -54% 489,319 -28% 377,554 -6% -30% -34% -18% -35% 149% 361%BW/CIN Teal 60,445 23,921 153% 23,766 154% 22,192 172% -38% 975% 914% 205% 777% 5777%Shoveler 105,641 219,061 -52% 189,086 -44% 79,667 33% -21% 32% 71% 30% 410% 327%Pintail 220,155 1,141,486 -81% 540,535 -59% 717,171 -69% -64% -60% -63% -81% -53% -79%Wood Duck 65,803 115,947 -43% 49,689 32% 10,573 522% 360% 975% 1981% 7005% 6114%Whistling Duck 37,790 1,823 1973% 3,975 851% 5,439 595% 95% 1275% 4927% Total Dabblers 3,703,560 5,311,834 -30% 4,199,645 -12% 3,434,179 8% -11% 33% 40% -16% 36% 11% Redhead 87,970 851,403 -90% 318,756 -72% 332,152 -74% -67% -69% -62% -70% -72% -85%Canvasback 30,619 86,264 -65% 39,637 -23% 21,414 43% 51% 38% -5% 66% 259% 125%Scaup 152,124 242,400 -37% 233,969 -35% 138,209 10% -29% 147% 109% 97% 146% -38%Ringneck 269,206 281,779 -4% 273,995 -2% 64,716 316% 95% 335% 1248% 4483% 6051% 8746%Goldeneye 23,770 36,972 -36% 33,632 -29% 18,815 26% -17% 33% 28% 143% 113% 51%Bufflehead 14,318 22,660 -37% 23,894 -40% 9,933 44% -34% 21% 140% 125% 324% 1392%Ruddy Duck 4,855 3,009 61% 3,931 24% 7,197 -33% -55% -26% -56% -3% -54% 82% Total Divers 582,862 1,524,487 -62% 927,812 -37% 592,435 -2% -16% 25% 49% 39% 42% -32%
Scoter 0 0 0 0 Long-tailed Duck 1 0 1 1 Mergansers 69,660 55,931 25% 55,677 25% 80,549 -14% -15% -32% -42% -13% -10% 45%Unident. Ducks 213,543 332,019 -36% 327,004 -35% 111,875 91% 55% -8% 643% 476% 1214% 269%
TOTAL DUCKS 4,569,626 7,224,271 -37% 5,510,140 -17% 4,219,038 8% -10% 44% -7% 41% 6% Brant 0 0 0 0 Snow/Blue Goose 1,797,250 1,109,858 62% 1,144,056 57% 753,713 138% 87% 67% 98% 175% 496% 367%Ross's Goose 11,319 12,528 -10% 23,838 -53% 10,091 -13% 175%White-fronted Goose 110,572 101,384 9% 90,222 23% 92,046 20% -36% -39% -12% 127% 585% 360%Canada goose 2,434,766 1,718,048 42% 1,634,217 49% 842,509 189% 63% 79% 174% 437% 1010% 1594%
TOTAL GEESE 4,353,907 2,941,818 48% 2,892,333 51% 1,693,027 157% 65% 66% 126% 276% 711% 688%
Tundra Swan 15 10 50% 24 -38% 14 9% 19% 117% 650% 67% -27% -34%Trumpeter Swan 1,318 931 42% 707 86% 273 383% 167% 559% 656% 1132% 725% 749%Mute Swan 0 0 2 -100% -100%Unident. Swans 58 63 -8% 51 14% 357% 994%
TOTAL SWANS 1,391 1,004 39% 811 71% 296 370% 167% 554% 689% 1099% 665% 682%
Coot 224,393 441,843 -49% 319,433 -30% 254,815 -12% -45% -10% -22% 5% -6% 106%
GRAND TOTAL 9,149,317 10,608,936 -14% 8,722,717 5% 6,167,176 48% 13% 42% 70% 45% 128% 84%
FILE S:\CF_D\Projects\Monitoring\MWS\CFMWS\CFMWSALL.xlsx 03/05/18
MID-WINTER WATERFOWL SURVEYCENTRAL FLYWAY
S:\WKFILES\MWS\MWSTITLE\MWSTITLS.123
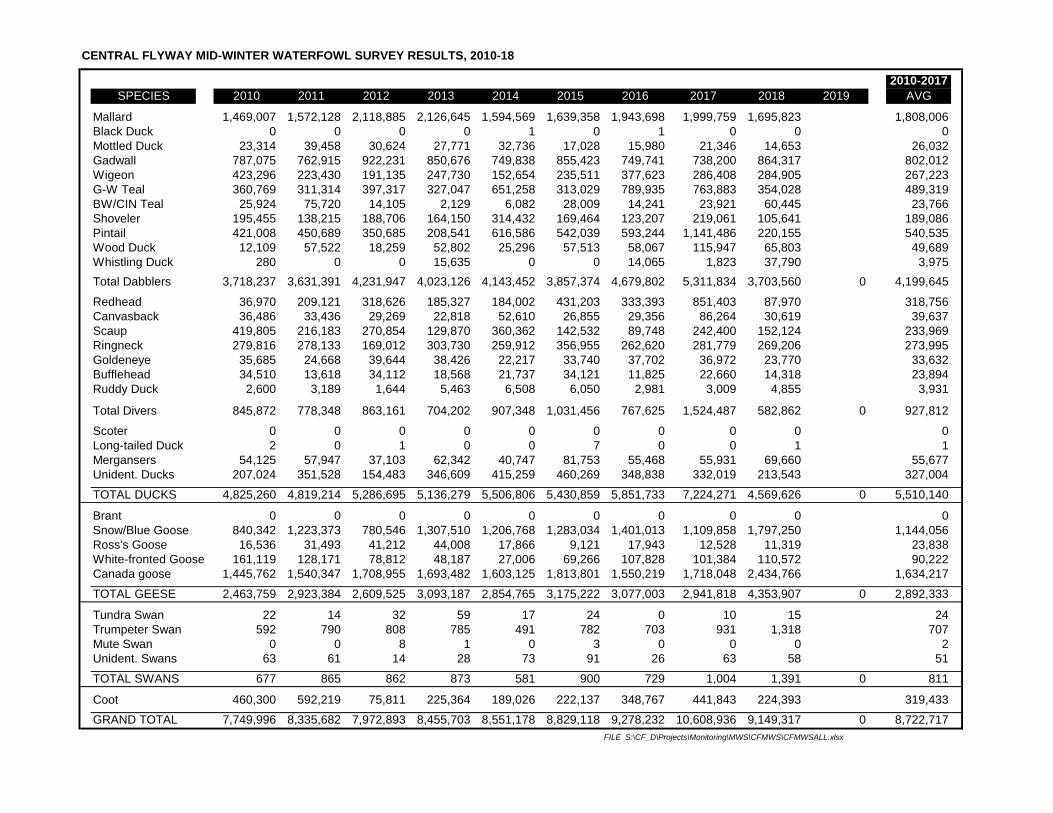
CENTRAL FLYWAY MID-WINTER WATERFOWL SURVEY RESULTS, 2010-18
2010-2017SPECIES 2010 2011 2012 2013 2014 2015 2016 2017 2018 2019 AVG
Mallard 1,469,007 1,572,128 2,118,885 2,126,645 1,594,569 1,639,358 1,943,698 1,999,759 1,695,823 1,808,006Black Duck 0 0 0 0 1 0 1 0 0 0Mottled Duck 23,314 39,458 30,624 27,771 32,736 17,028 15,980 21,346 14,653 26,032Gadwall 787,075 762,915 922,231 850,676 749,838 855,423 749,741 738,200 864,317 802,012Wigeon 423,296 223,430 191,135 247,730 152,654 235,511 377,623 286,408 284,905 267,223G-W Teal 360,769 311,314 397,317 327,047 651,258 313,029 789,935 763,883 354,028 489,319BW/CIN Teal 25,924 75,720 14,105 2,129 6,082 28,009 14,241 23,921 60,445 23,766Shoveler 195,455 138,215 188,706 164,150 314,432 169,464 123,207 219,061 105,641 189,086Pintail 421,008 450,689 350,685 208,541 616,586 542,039 593,244 1,141,486 220,155 540,535Wood Duck 12,109 57,522 18,259 52,802 25,296 57,513 58,067 115,947 65,803 49,689Whistling Duck 280 0 0 15,635 0 0 14,065 1,823 37,790 3,975Total Dabblers 3,718,237 3,631,391 4,231,947 4,023,126 4,143,452 3,857,374 4,679,802 5,311,834 3,703,560 0 4,199,645
Redhead 36,970 209,121 318,626 185,327 184,002 431,203 333,393 851,403 87,970 318,756Canvasback 36,486 33,436 29,269 22,818 52,610 26,855 29,356 86,264 30,619 39,637Scaup 419,805 216,183 270,854 129,870 360,362 142,532 89,748 242,400 152,124 233,969Ringneck 279,816 278,133 169,012 303,730 259,912 356,955 262,620 281,779 269,206 273,995Goldeneye 35,685 24,668 39,644 38,426 22,217 33,740 37,702 36,972 23,770 33,632Bufflehead 34,510 13,618 34,112 18,568 21,737 34,121 11,825 22,660 14,318 23,894Ruddy Duck 2,600 3,189 1,644 5,463 6,508 6,050 2,981 3,009 4,855 3,931
Total Divers 845,872 778,348 863,161 704,202 907,348 1,031,456 767,625 1,524,487 582,862 0 927,812
Scoter 0 0 0 0 0 0 0 0 0 0Long-tailed Duck 2 0 1 0 0 7 0 0 1 1Mergansers 54,125 57,947 37,103 62,342 40,747 81,753 55,468 55,931 69,660 55,677Unident. Ducks 207,024 351,528 154,483 346,609 415,259 460,269 348,838 332,019 213,543 327,004
TOTAL DUCKS 4,825,260 4,819,214 5,286,695 5,136,279 5,506,806 5,430,859 5,851,733 7,224,271 4,569,626 0 5,510,140
Brant 0 0 0 0 0 0 0 0 0 0Snow/Blue Goose 840,342 1,223,373 780,546 1,307,510 1,206,768 1,283,034 1,401,013 1,109,858 1,797,250 1,144,056Ross's Goose 16,536 31,493 41,212 44,008 17,866 9,121 17,943 12,528 11,319 23,838White-fronted Goose 161,119 128,171 78,812 48,187 27,006 69,266 107,828 101,384 110,572 90,222Canada goose 1,445,762 1,540,347 1,708,955 1,693,482 1,603,125 1,813,801 1,550,219 1,718,048 2,434,766 1,634,217
TOTAL GEESE 2,463,759 2,923,384 2,609,525 3,093,187 2,854,765 3,175,222 3,077,003 2,941,818 4,353,907 0 2,892,333
Tundra Swan 22 14 32 59 17 24 0 10 15 24Trumpeter Swan 592 790 808 785 491 782 703 931 1,318 707Mute Swan 0 0 8 1 0 3 0 0 0 2Unident. Swans 63 61 14 28 73 91 26 63 58 51
TOTAL SWANS 677 865 862 873 581 900 729 1,004 1,391 0 811
Coot 460,300 592,219 75,811 225,364 189,026 222,137 348,767 441,843 224,393 319,433
GRAND TOTAL 7,749,996 8,335,682 7,972,893 8,455,703 8,551,178 8,829,118 9,278,232 10,608,936 9,149,317 0 8,722,717FILE S:\CF_D\Projects\Monitoring\MWS\CFMWS\CFMWSALL.xlsx
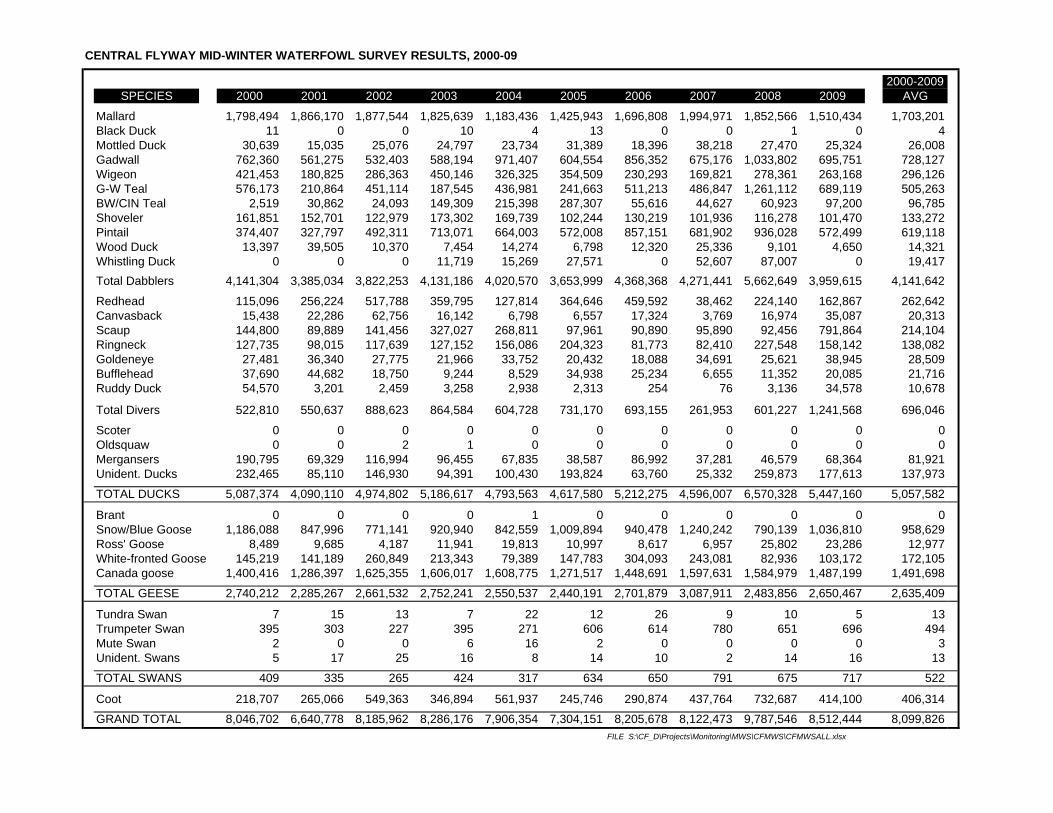
CENTRAL FLYWAY MID-WINTER WATERFOWL SURVEY RESULTS, 2000-09
2000-2009SPECIES 2000 2001 2002 2003 2004 2005 2006 2007 2008 2009 AVG
Mallard 1,798,494 1,866,170 1,877,544 1,825,639 1,183,436 1,425,943 1,696,808 1,994,971 1,852,566 1,510,434 1,703,201Black Duck 11 0 0 10 4 13 0 0 1 0 4Mottled Duck 30,639 15,035 25,076 24,797 23,734 31,389 18,396 38,218 27,470 25,324 26,008Gadwall 762,360 561,275 532,403 588,194 971,407 604,554 856,352 675,176 1,033,802 695,751 728,127Wigeon 421,453 180,825 286,363 450,146 326,325 354,509 230,293 169,821 278,361 263,168 296,126G-W Teal 576,173 210,864 451,114 187,545 436,981 241,663 511,213 486,847 1,261,112 689,119 505,263BW/CIN Teal 2,519 30,862 24,093 149,309 215,398 287,307 55,616 44,627 60,923 97,200 96,785Shoveler 161,851 152,701 122,979 173,302 169,739 102,244 130,219 101,936 116,278 101,470 133,272Pintail 374,407 327,797 492,311 713,071 664,003 572,008 857,151 681,902 936,028 572,499 619,118Wood Duck 13,397 39,505 10,370 7,454 14,274 6,798 12,320 25,336 9,101 4,650 14,321Whistling Duck 0 0 0 11,719 15,269 27,571 0 52,607 87,007 0 19,417Total Dabblers 4,141,304 3,385,034 3,822,253 4,131,186 4,020,570 3,653,999 4,368,368 4,271,441 5,662,649 3,959,615 4,141,642
Redhead 115,096 256,224 517,788 359,795 127,814 364,646 459,592 38,462 224,140 162,867 262,642Canvasback 15,438 22,286 62,756 16,142 6,798 6,557 17,324 3,769 16,974 35,087 20,313Scaup 144,800 89,889 141,456 327,027 268,811 97,961 90,890 95,890 92,456 791,864 214,104Ringneck 127,735 98,015 117,639 127,152 156,086 204,323 81,773 82,410 227,548 158,142 138,082Goldeneye 27,481 36,340 27,775 21,966 33,752 20,432 18,088 34,691 25,621 38,945 28,509Bufflehead 37,690 44,682 18,750 9,244 8,529 34,938 25,234 6,655 11,352 20,085 21,716Ruddy Duck 54,570 3,201 2,459 3,258 2,938 2,313 254 76 3,136 34,578 10,678
Total Divers 522,810 550,637 888,623 864,584 604,728 731,170 693,155 261,953 601,227 1,241,568 696,046
Scoter 0 0 0 0 0 0 0 0 0 0 0Oldsquaw 0 0 2 1 0 0 0 0 0 0 0Mergansers 190,795 69,329 116,994 96,455 67,835 38,587 86,992 37,281 46,579 68,364 81,921Unident. Ducks 232,465 85,110 146,930 94,391 100,430 193,824 63,760 25,332 259,873 177,613 137,973
TOTAL DUCKS 5,087,374 4,090,110 4,974,802 5,186,617 4,793,563 4,617,580 5,212,275 4,596,007 6,570,328 5,447,160 5,057,582
Brant 0 0 0 0 1 0 0 0 0 0 0Snow/Blue Goose 1,186,088 847,996 771,141 920,940 842,559 1,009,894 940,478 1,240,242 790,139 1,036,810 958,629Ross' Goose 8,489 9,685 4,187 11,941 19,813 10,997 8,617 6,957 25,802 23,286 12,977White-fronted Goose 145,219 141,189 260,849 213,343 79,389 147,783 304,093 243,081 82,936 103,172 172,105Canada goose 1,400,416 1,286,397 1,625,355 1,606,017 1,608,775 1,271,517 1,448,691 1,597,631 1,584,979 1,487,199 1,491,698
TOTAL GEESE 2,740,212 2,285,267 2,661,532 2,752,241 2,550,537 2,440,191 2,701,879 3,087,911 2,483,856 2,650,467 2,635,409
Tundra Swan 7 15 13 7 22 12 26 9 10 5 13Trumpeter Swan 395 303 227 395 271 606 614 780 651 696 494Mute Swan 2 0 0 6 16 2 0 0 0 0 3Unident. Swans 5 17 25 16 8 14 10 2 14 16 13
TOTAL SWANS 409 335 265 424 317 634 650 791 675 717 522
Coot 218,707 265,066 549,363 346,894 561,937 245,746 290,874 437,764 732,687 414,100 406,314
GRAND TOTAL 8,046,702 6,640,778 8,185,962 8,286,176 7,906,354 7,304,151 8,205,678 8,122,473 9,787,546 8,512,444 8,099,826FILE S:\CF_D\Projects\Monitoring\MWS\CFMWS\CFMWSALL.xlsx
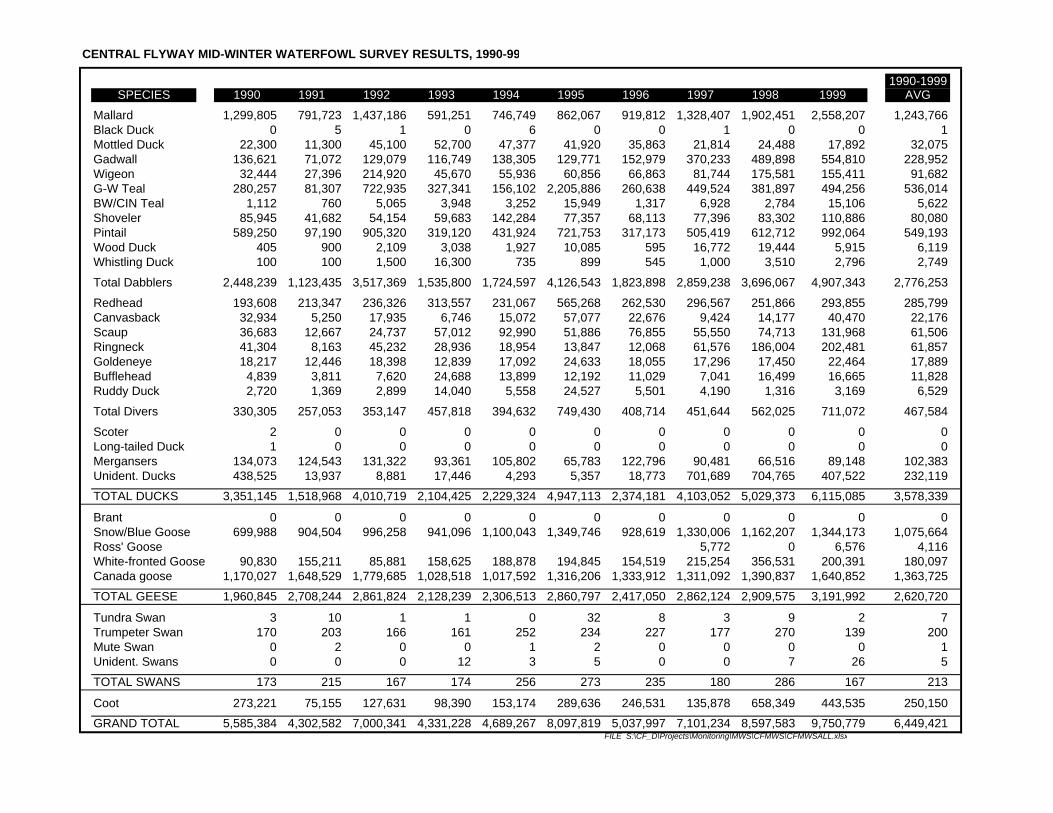
CENTRAL FLYWAY MID-WINTER WATERFOWL SURVEY RESULTS, 1990-99
1990-1999SPECIES 1990 1991 1992 1993 1994 1995 1996 1997 1998 1999 AVG
Mallard 1,299,805 791,723 1,437,186 591,251 746,749 862,067 919,812 1,328,407 1,902,451 2,558,207 1,243,766Black Duck 0 5 1 0 6 0 0 1 0 0 1Mottled Duck 22,300 11,300 45,100 52,700 47,377 41,920 35,863 21,814 24,488 17,892 32,075Gadwall 136,621 71,072 129,079 116,749 138,305 129,771 152,979 370,233 489,898 554,810 228,952Wigeon 32,444 27,396 214,920 45,670 55,936 60,856 66,863 81,744 175,581 155,411 91,682G-W Teal 280,257 81,307 722,935 327,341 156,102 2,205,886 260,638 449,524 381,897 494,256 536,014BW/CIN Teal 1,112 760 5,065 3,948 3,252 15,949 1,317 6,928 2,784 15,106 5,622Shoveler 85,945 41,682 54,154 59,683 142,284 77,357 68,113 77,396 83,302 110,886 80,080Pintail 589,250 97,190 905,320 319,120 431,924 721,753 317,173 505,419 612,712 992,064 549,193Wood Duck 405 900 2,109 3,038 1,927 10,085 595 16,772 19,444 5,915 6,119Whistling Duck 100 100 1,500 16,300 735 899 545 1,000 3,510 2,796 2,749
Total Dabblers 2,448,239 1,123,435 3,517,369 1,535,800 1,724,597 4,126,543 1,823,898 2,859,238 3,696,067 4,907,343 2,776,253 Redhead 193,608 213,347 236,326 313,557 231,067 565,268 262,530 296,567 251,866 293,855 285,799Canvasback 32,934 5,250 17,935 6,746 15,072 57,077 22,676 9,424 14,177 40,470 22,176Scaup 36,683 12,667 24,737 57,012 92,990 51,886 76,855 55,550 74,713 131,968 61,506Ringneck 41,304 8,163 45,232 28,936 18,954 13,847 12,068 61,576 186,004 202,481 61,857Goldeneye 18,217 12,446 18,398 12,839 17,092 24,633 18,055 17,296 17,450 22,464 17,889Bufflehead 4,839 3,811 7,620 24,688 13,899 12,192 11,029 7,041 16,499 16,665 11,828Ruddy Duck 2,720 1,369 2,899 14,040 5,558 24,527 5,501 4,190 1,316 3,169 6,529
Total Divers 330,305 257,053 353,147 457,818 394,632 749,430 408,714 451,644 562,025 711,072 467,584 Scoter 2 0 0 0 0 0 0 0 0 0 0Long-tailed Duck 1 0 0 0 0 0 0 0 0 0 0Mergansers 134,073 124,543 131,322 93,361 105,802 65,783 122,796 90,481 66,516 89,148 102,383Unident. Ducks 438,525 13,937 8,881 17,446 4,293 5,357 18,773 701,689 704,765 407,522 232,119 TOTAL DUCKS 3,351,145 1,518,968 4,010,719 2,104,425 2,229,324 4,947,113 2,374,181 4,103,052 5,029,373 6,115,085 3,578,339 Brant 0 0 0 0 0 0 0 0 0 0 0Snow/Blue Goose 699,988 904,504 996,258 941,096 1,100,043 1,349,746 928,619 1,330,006 1,162,207 1,344,173 1,075,664Ross' Goose 5,772 0 6,576 4,116White-fronted Goose 90,830 155,211 85,881 158,625 188,878 194,845 154,519 215,254 356,531 200,391 180,097Canada goose 1,170,027 1,648,529 1,779,685 1,028,518 1,017,592 1,316,206 1,333,912 1,311,092 1,390,837 1,640,852 1,363,725 TOTAL GEESE 1,960,845 2,708,244 2,861,824 2,128,239 2,306,513 2,860,797 2,417,050 2,862,124 2,909,575 3,191,992 2,620,720 Tundra Swan 3 10 1 1 0 32 8 3 9 2 7Trumpeter Swan 170 203 166 161 252 234 227 177 270 139 200Mute Swan 0 2 0 0 1 2 0 0 0 0 1Unident. Swans 0 0 0 12 3 5 0 0 7 26 5 TOTAL SWANS 173 215 167 174 256 273 235 180 286 167 213 Coot 273,221 75,155 127,631 98,390 153,174 289,636 246,531 135,878 658,349 443,535 250,150 GRAND TOTAL 5,585,384 4,302,582 7,000,341 4,331,228 4,689,267 8,097,819 5,037,997 7,101,234 8,597,583 9,750,779 6,449,421
FILE S:\CF_D\Projects\Monitoring\MWS\CFMWS\CFMWSALL.xlsx
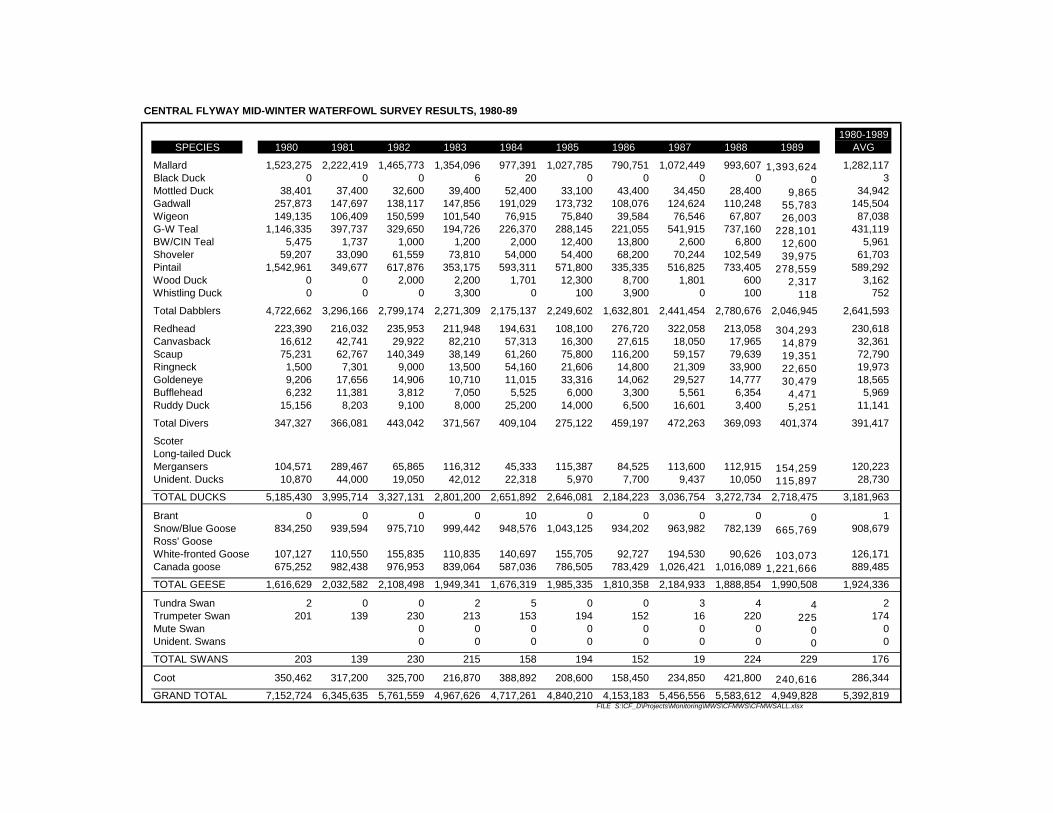
CENTRAL FLYWAY MID-WINTER WATERFOWL SURVEY RESULTS, 1980-89
1980-1989SPECIES 1980 1981 1982 1983 1984 1985 1986 1987 1988 1989 AVG
Mallard 1,523,275 2,222,419 1,465,773 1,354,096 977,391 1,027,785 790,751 1,072,449 993,607 1,393,624 1,282,117Black Duck 0 0 0 6 20 0 0 0 0 0 3Mottled Duck 38,401 37,400 32,600 39,400 52,400 33,100 43,400 34,450 28,400 9,865 34,942Gadwall 257,873 147,697 138,117 147,856 191,029 173,732 108,076 124,624 110,248 55,783 145,504Wigeon 149,135 106,409 150,599 101,540 76,915 75,840 39,584 76,546 67,807 26,003 87,038G-W Teal 1,146,335 397,737 329,650 194,726 226,370 288,145 221,055 541,915 737,160 228,101 431,119BW/CIN Teal 5,475 1,737 1,000 1,200 2,000 12,400 13,800 2,600 6,800 12,600 5,961Shoveler 59,207 33,090 61,559 73,810 54,000 54,400 68,200 70,244 102,549 39,975 61,703Pintail 1,542,961 349,677 617,876 353,175 593,311 571,800 335,335 516,825 733,405 278,559 589,292Wood Duck 0 0 2,000 2,200 1,701 12,300 8,700 1,801 600 2,317 3,162Whistling Duck 0 0 0 3,300 0 100 3,900 0 100 118 752
Total Dabblers 4,722,662 3,296,166 2,799,174 2,271,309 2,175,137 2,249,602 1,632,801 2,441,454 2,780,676 2,046,945 2,641,593 Redhead 223,390 216,032 235,953 211,948 194,631 108,100 276,720 322,058 213,058 304,293 230,618Canvasback 16,612 42,741 29,922 82,210 57,313 16,300 27,615 18,050 17,965 14,879 32,361Scaup 75,231 62,767 140,349 38,149 61,260 75,800 116,200 59,157 79,639 19,351 72,790Ringneck 1,500 7,301 9,000 13,500 54,160 21,606 14,800 21,309 33,900 22,650 19,973Goldeneye 9,206 17,656 14,906 10,710 11,015 33,316 14,062 29,527 14,777 30,479 18,565Bufflehead 6,232 11,381 3,812 7,050 5,525 6,000 3,300 5,561 6,354 4,471 5,969Ruddy Duck 15,156 8,203 9,100 8,000 25,200 14,000 6,500 16,601 3,400 5,251 11,141
Total Divers 347,327 366,081 443,042 371,567 409,104 275,122 459,197 472,263 369,093 401,374 391,417 Scoter Long-tailed Duck Mergansers 104,571 289,467 65,865 116,312 45,333 115,387 84,525 113,600 112,915 154,259 120,223Unident. Ducks 10,870 44,000 19,050 42,012 22,318 5,970 7,700 9,437 10,050 115,897 28,730 TOTAL DUCKS 5,185,430 3,995,714 3,327,131 2,801,200 2,651,892 2,646,081 2,184,223 3,036,754 3,272,734 2,718,475 3,181,963 Brant 0 0 0 0 10 0 0 0 0 0 1 Snow/Blue Goose 834,250 939,594 975,710 999,442 948,576 1,043,125 934,202 963,982 782,139 665,769 908,679 Ross' Goose White-fronted Goose 107,127 110,550 155,835 110,835 140,697 155,705 92,727 194,530 90,626 103,073 126,171 Canada goose 675,252 982,438 976,953 839,064 587,036 786,505 783,429 1,026,421 1,016,089 1,221,666 889,485 TOTAL GEESE 1,616,629 2,032,582 2,108,498 1,949,341 1,676,319 1,985,335 1,810,358 2,184,933 1,888,854 1,990,508 1,924,336 Tundra Swan 2 0 0 2 5 0 0 3 4 4 2Trumpeter Swan 201 139 230 213 153 194 152 16 220 225 174Mute Swan 0 0 0 0 0 0 0 0 0Unident. Swans 0 0 0 0 0 0 0 0 0 TOTAL SWANS 203 139 230 215 158 194 152 19 224 229 176 Coot 350,462 317,200 325,700 216,870 388,892 208,600 158,450 234,850 421,800 240,616 286,344 GRAND TOTAL 7,152,724 6,345,635 5,761,559 4,967,626 4,717,261 4,840,210 4,153,183 5,456,556 5,583,612 4,949,828 5,392,819
FILE S:\CF_D\Projects\Monitoring\MWS\CFMWS\CFMWSALL.xlsx
JANUARY 2018 MID-WINTER WATERFOWL SURVEY - CENTRAL FLYWAY 1
SPECIES ND MT SD WY CO NE KS OK NM TX TOTAL
Mallard 16,387 16,146 63,378 16,210 169,227 163,072 513,639 334,677 36,667 366,420 1,695,823Black Duck 0 0 0 0 0 0 0 0 0 0 0Mottled Duck 0 0 0 0 0 0 0 0 0 14,653 14,653Gadwall 0 0 24 32 356 12 1,503 10,910 915 850,565 864,317Wigeon 0 0 13 107 642 15 729 1,923 8,629 272,847 284,905G-W Teal 0 0 0 80 534 0 3,633 8,496 11,766 329,519 354,028BW/CIN Teal 0 0 0 0 0 14 0 56 1 60,374 60,445Shoveler 0 0 0 0 2,238 50 563 2,823 2,644 97,323 105,641Pintail 0 0 0 6 371 0 3,593 4,358 34,956 176,871 220,155Wood Duck 0 0 3 0 6 95 53 1,272 10 64,364 65,803Whistling Ducks 0 0 0 0 0 0 0 0 0 37,790 37,790Total Dabblers 16,387 16,146 63,418 16,435 173,374 163,258 523,713 364,515 95,588 2,270,726 3,703,560
Redhead 0 0 0 0 262 0 167 264 747 86,530 87,970Canvasback 0 0 0 0 122 0 107 695 178 29,517 30,619Scaup 0 0 0 0 152 105 362 748 199 150,558 152,124Ringnecked duck 0 0 84 0 335 5 1,326 4,782 443 262,231 269,206Goldeneyes 300 509 635 2,513 1,441 663 13,098 2,653 10 1,948 23,770Bufflehead 0 0 22 0 347 8 1,149 5,895 656 6,241 14,318Ruddy Duck 0 0 0 0 66 0 126 56 170 4,437 4,855
Total Divers 300 509 741 2,513 2,725 781 16,335 15,093 2,403 541,462 582,862
Scoters 0 0 0 0 0 0 0 0 0 0 0Long-tailed Ducks 0 0 0 0 0 0 1 0 0 0 1Mergansers 2,466 56 106 878 1,663 1,439 6,215 15,312 16,647 24,878 69,660Unident. Ducks 0 0 0 0 10,391 0 5,898 4,219 0 193,035 213,543
Total Ducks 19,153 16,711 64,265 19,826 188,153 165,478 552,162 399,139 114,638 3,030,101 4,569,626
Brant 0 0 0 0 0 0 0 0 0 0 0Snow/Blue Goose 1 0 58 3 223,157 378 1,085,135 129,466 17,750 341,302 1,797,250Ross's Goose 0 0 0 0 0 0 0 11,319 0 0 11,319Whitefront 0 0 0 0 23 0 4,008 8,055 0 98,486 110,572Canada Goose 134,793 79,222 154,821 64,952 540,578 265,972 435,322 354,490 26,020 378,596 2,434,766
Total Geese 134,794 79,222 154,879 64,955 763,758 266,350 1,524,465 503,330 43,770 818,384 4,353,907
Tundra Swan 0 5 0 0 4 0 0 6 0 0 15Trumpeter Swan 0 0 51 66 0 1,157 44 0 0 0 1,318Mute Swan 0 0 0 0 0 0 0 0 0 0 0Unident. Swans 0 0 0 0 3 0 46 9 0 0 58
Total Swans 0 5 51 66 7 1,157 90 15 0 0 1,391
Coot 0 0 20 31 768 0 1,337 5,023 13,593 203,621 224,393
Grand Total 153,947 95,938 219,215 84,878 952,686 432,985 2,078,054 907,507 172,001 4,052,106 9,149,317S:\CF_D\PROJECTS\monitoring\MWS\CFMWS\CFMWS2010s.XLS
*In TX, SGP and TGP counts (CFAN beginning in 2014) based on cruise surveys. Traditional Mid Dec. coastal cruise count completed for MC Light/WFG geese, Jan count in High and Rolling Plains also included in Light/WFG count but transect numbers in the other survey zones not included (used actual counts).
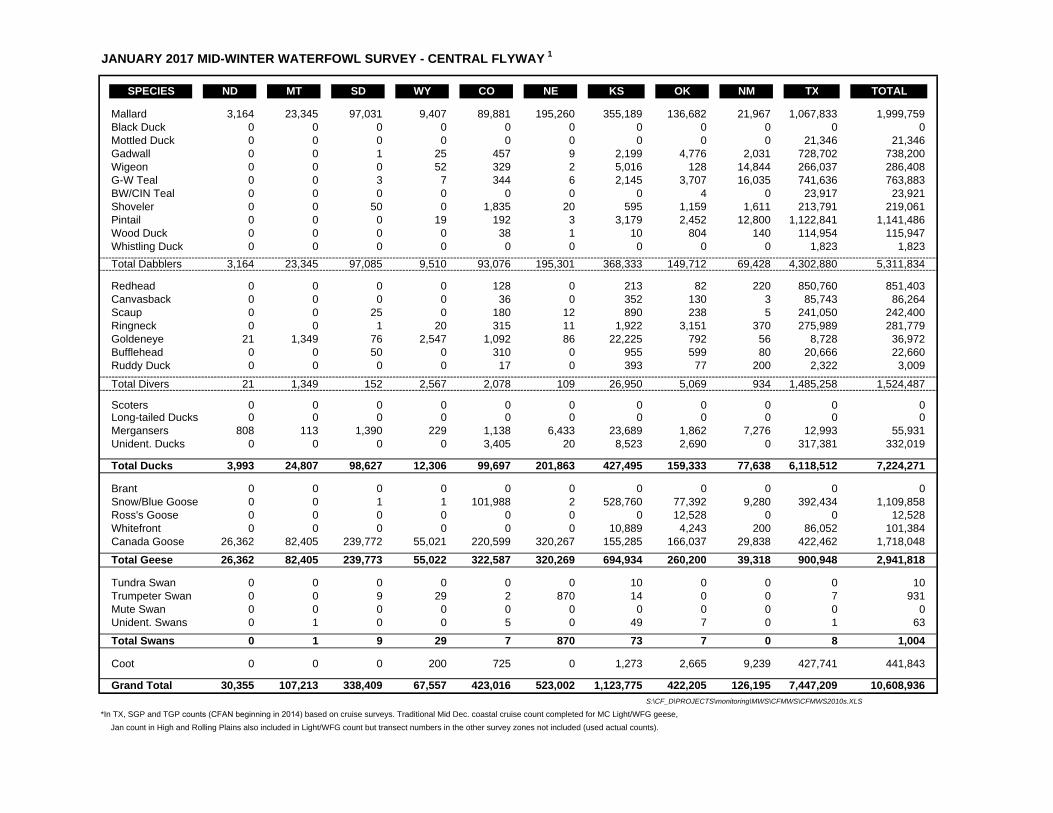
JANUARY 2017 MID-WINTER WATERFOWL SURVEY - CENTRAL FLYWAY 1
SPECIES ND MT SD WY CO NE KS OK NM TX TOTAL
Mallard 3,164 23,345 97,031 9,407 89,881 195,260 355,189 136,682 21,967 1,067,833 1,999,759Black Duck 0 0 0 0 0 0 0 0 0 0 0Mottled Duck 0 0 0 0 0 0 0 0 0 21,346 21,346Gadwall 0 0 1 25 457 9 2,199 4,776 2,031 728,702 738,200Wigeon 0 0 0 52 329 2 5,016 128 14,844 266,037 286,408G-W Teal 0 0 3 7 344 6 2,145 3,707 16,035 741,636 763,883BW/CIN Teal 0 0 0 0 0 0 0 4 0 23,917 23,921Shoveler 0 0 50 0 1,835 20 595 1,159 1,611 213,791 219,061Pintail 0 0 0 19 192 3 3,179 2,452 12,800 1,122,841 1,141,486Wood Duck 0 0 0 0 38 1 10 804 140 114,954 115,947Whistling Duck 0 0 0 0 0 0 0 0 0 1,823 1,823Total Dabblers 3,164 23,345 97,085 9,510 93,076 195,301 368,333 149,712 69,428 4,302,880 5,311,834
Redhead 0 0 0 0 128 0 213 82 220 850,760 851,403Canvasback 0 0 0 0 36 0 352 130 3 85,743 86,264Scaup 0 0 25 0 180 12 890 238 5 241,050 242,400Ringneck 0 0 1 20 315 11 1,922 3,151 370 275,989 281,779Goldeneye 21 1,349 76 2,547 1,092 86 22,225 792 56 8,728 36,972Bufflehead 0 0 50 0 310 0 955 599 80 20,666 22,660Ruddy Duck 0 0 0 0 17 0 393 77 200 2,322 3,009
Total Divers 21 1,349 152 2,567 2,078 109 26,950 5,069 934 1,485,258 1,524,487
Scoters 0 0 0 0 0 0 0 0 0 0 0Long-tailed Ducks 0 0 0 0 0 0 0 0 0 0 0Mergansers 808 113 1,390 229 1,138 6,433 23,689 1,862 7,276 12,993 55,931Unident. Ducks 0 0 0 0 3,405 20 8,523 2,690 0 317,381 332,019
Total Ducks 3,993 24,807 98,627 12,306 99,697 201,863 427,495 159,333 77,638 6,118,512 7,224,271
Brant 0 0 0 0 0 0 0 0 0 0 0Snow/Blue Goose 0 0 1 1 101,988 2 528,760 77,392 9,280 392,434 1,109,858Ross's Goose 0 0 0 0 0 0 0 12,528 0 0 12,528Whitefront 0 0 0 0 0 0 10,889 4,243 200 86,052 101,384Canada Goose 26,362 82,405 239,772 55,021 220,599 320,267 155,285 166,037 29,838 422,462 1,718,048
Total Geese 26,362 82,405 239,773 55,022 322,587 320,269 694,934 260,200 39,318 900,948 2,941,818
Tundra Swan 0 0 0 0 0 0 10 0 0 0 10Trumpeter Swan 0 0 9 29 2 870 14 0 0 7 931Mute Swan 0 0 0 0 0 0 0 0 0 0 0Unident. Swans 0 1 0 0 5 0 49 7 0 1 63
Total Swans 0 1 9 29 7 870 73 7 0 8 1,004
Coot 0 0 0 200 725 0 1,273 2,665 9,239 427,741 441,843
Grand Total 30,355 107,213 338,409 67,557 423,016 523,002 1,123,775 422,205 126,195 7,447,209 10,608,936S:\CF_D\PROJECTS\monitoring\MWS\CFMWS\CFMWS2010s.XLS
*In TX, SGP and TGP counts (CFAN beginning in 2014) based on cruise surveys. Traditional Mid Dec. coastal cruise count completed for MC Light/WFG geese, Jan count in High and Rolling Plains also included in Light/WFG count but transect numbers in the other survey zones not included (used actual counts).
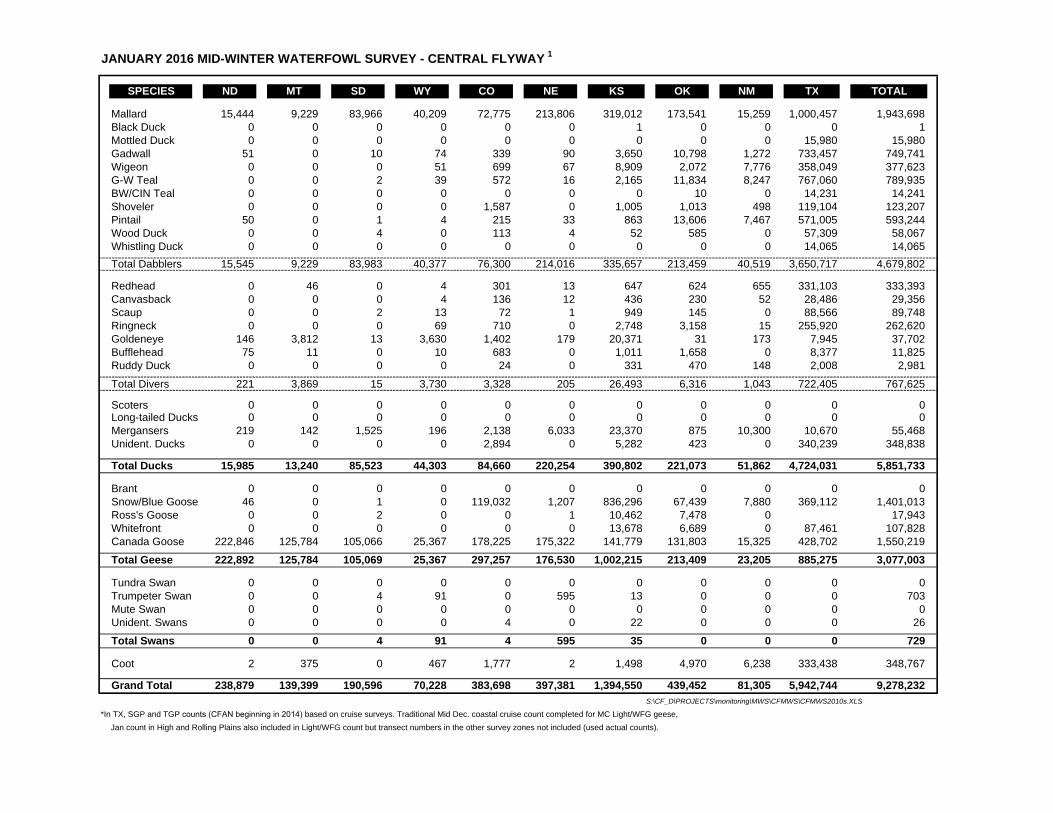
JANUARY 2016 MID-WINTER WATERFOWL SURVEY - CENTRAL FLYWAY 1
SPECIES ND MT SD WY CO NE KS OK NM TX TOTAL
Mallard 15,444 9,229 83,966 40,209 72,775 213,806 319,012 173,541 15,259 1,000,457 1,943,698Black Duck 0 0 0 0 0 0 1 0 0 0 1Mottled Duck 0 0 0 0 0 0 0 0 0 15,980 15,980Gadwall 51 0 10 74 339 90 3,650 10,798 1,272 733,457 749,741Wigeon 0 0 0 51 699 67 8,909 2,072 7,776 358,049 377,623G-W Teal 0 0 2 39 572 16 2,165 11,834 8,247 767,060 789,935BW/CIN Teal 0 0 0 0 0 0 0 10 0 14,231 14,241Shoveler 0 0 0 0 1,587 0 1,005 1,013 498 119,104 123,207Pintail 50 0 1 4 215 33 863 13,606 7,467 571,005 593,244Wood Duck 0 0 4 0 113 4 52 585 0 57,309 58,067Whistling Duck 0 0 0 0 0 0 0 0 0 14,065 14,065Total Dabblers 15,545 9,229 83,983 40,377 76,300 214,016 335,657 213,459 40,519 3,650,717 4,679,802
Redhead 0 46 0 4 301 13 647 624 655 331,103 333,393Canvasback 0 0 0 4 136 12 436 230 52 28,486 29,356Scaup 0 0 2 13 72 1 949 145 0 88,566 89,748Ringneck 0 0 0 69 710 0 2,748 3,158 15 255,920 262,620Goldeneye 146 3,812 13 3,630 1,402 179 20,371 31 173 7,945 37,702Bufflehead 75 11 0 10 683 0 1,011 1,658 0 8,377 11,825Ruddy Duck 0 0 0 0 24 0 331 470 148 2,008 2,981
Total Divers 221 3,869 15 3,730 3,328 205 26,493 6,316 1,043 722,405 767,625
Scoters 0 0 0 0 0 0 0 0 0 0 0Long-tailed Ducks 0 0 0 0 0 0 0 0 0 0 0Mergansers 219 142 1,525 196 2,138 6,033 23,370 875 10,300 10,670 55,468Unident. Ducks 0 0 0 0 2,894 0 5,282 423 0 340,239 348,838
Total Ducks 15,985 13,240 85,523 44,303 84,660 220,254 390,802 221,073 51,862 4,724,031 5,851,733
Brant 0 0 0 0 0 0 0 0 0 0 0Snow/Blue Goose 46 0 1 0 119,032 1,207 836,296 67,439 7,880 369,112 1,401,013Ross's Goose 0 0 2 0 0 1 10,462 7,478 0 17,943Whitefront 0 0 0 0 0 0 13,678 6,689 0 87,461 107,828Canada Goose 222,846 125,784 105,066 25,367 178,225 175,322 141,779 131,803 15,325 428,702 1,550,219
Total Geese 222,892 125,784 105,069 25,367 297,257 176,530 1,002,215 213,409 23,205 885,275 3,077,003
Tundra Swan 0 0 0 0 0 0 0 0 0 0 0Trumpeter Swan 0 0 4 91 0 595 13 0 0 0 703Mute Swan 0 0 0 0 0 0 0 0 0 0 0Unident. Swans 0 0 0 0 4 0 22 0 0 0 26
Total Swans 0 0 4 91 4 595 35 0 0 0 729
Coot 2 375 0 467 1,777 2 1,498 4,970 6,238 333,438 348,767
Grand Total 238,879 139,399 190,596 70,228 383,698 397,381 1,394,550 439,452 81,305 5,942,744 9,278,232S:\CF_D\PROJECTS\monitoring\MWS\CFMWS\CFMWS2010s.XLS
*In TX, SGP and TGP counts (CFAN beginning in 2014) based on cruise surveys. Traditional Mid Dec. coastal cruise count completed for MC Light/WFG geese, Jan count in High and Rolling Plains also included in Light/WFG count but transect numbers in the other survey zones not included (used actual counts).
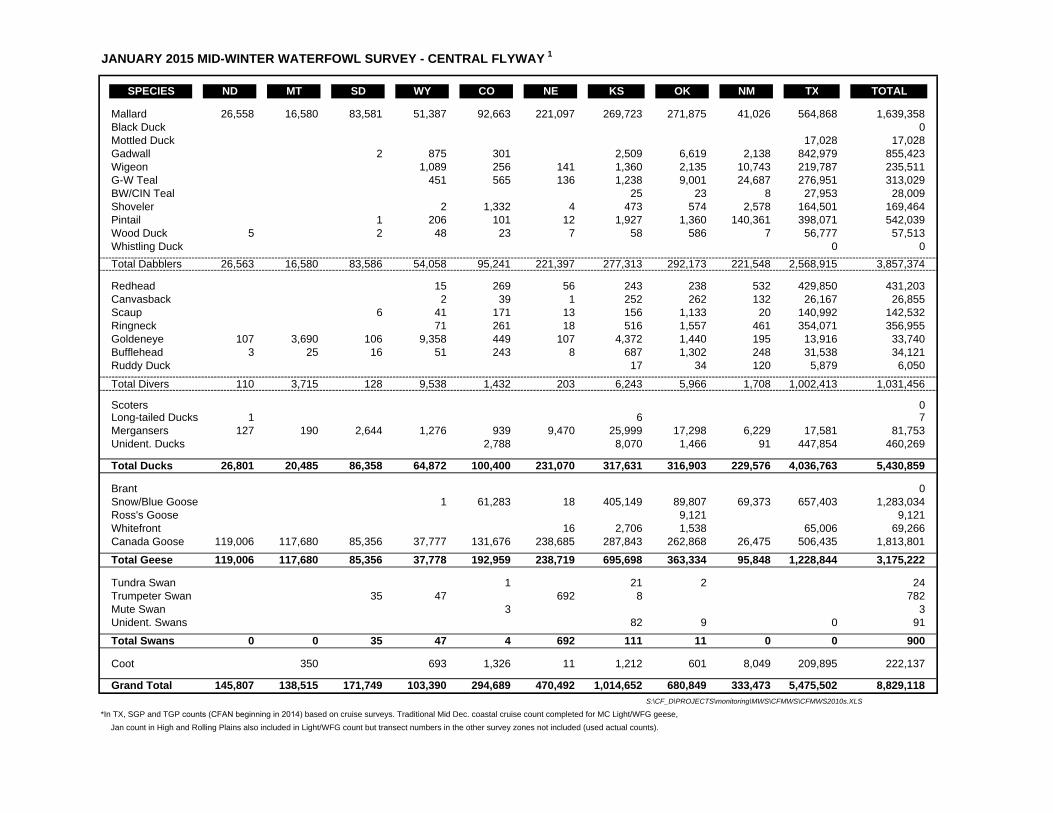
JANUARY 2015 MID-WINTER WATERFOWL SURVEY - CENTRAL FLYWAY 1
SPECIES ND MT SD WY CO NE KS OK NM TX TOTAL
Mallard 26,558 16,580 83,581 51,387 92,663 221,097 269,723 271,875 41,026 564,868 1,639,358Black Duck 0Mottled Duck 17,028 17,028Gadwall 2 875 301 2,509 6,619 2,138 842,979 855,423Wigeon 1,089 256 141 1,360 2,135 10,743 219,787 235,511G-W Teal 451 565 136 1,238 9,001 24,687 276,951 313,029BW/CIN Teal 25 23 8 27,953 28,009Shoveler 2 1,332 4 473 574 2,578 164,501 169,464Pintail 1 206 101 12 1,927 1,360 140,361 398,071 542,039Wood Duck 5 2 48 23 7 58 586 7 56,777 57,513Whistling Duck 0 0Total Dabblers 26,563 16,580 83,586 54,058 95,241 221,397 277,313 292,173 221,548 2,568,915 3,857,374
Redhead 15 269 56 243 238 532 429,850 431,203Canvasback 2 39 1 252 262 132 26,167 26,855Scaup 6 41 171 13 156 1,133 20 140,992 142,532Ringneck 71 261 18 516 1,557 461 354,071 356,955Goldeneye 107 3,690 106 9,358 449 107 4,372 1,440 195 13,916 33,740Bufflehead 3 25 16 51 243 8 687 1,302 248 31,538 34,121Ruddy Duck 17 34 120 5,879 6,050
Total Divers 110 3,715 128 9,538 1,432 203 6,243 5,966 1,708 1,002,413 1,031,456
Scoters 0Long-tailed Ducks 1 6 7Mergansers 127 190 2,644 1,276 939 9,470 25,999 17,298 6,229 17,581 81,753Unident. Ducks 2,788 8,070 1,466 91 447,854 460,269
Total Ducks 26,801 20,485 86,358 64,872 100,400 231,070 317,631 316,903 229,576 4,036,763 5,430,859
Brant 0Snow/Blue Goose 1 61,283 18 405,149 89,807 69,373 657,403 1,283,034Ross's Goose 9,121 9,121Whitefront 16 2,706 1,538 65,006 69,266Canada Goose 119,006 117,680 85,356 37,777 131,676 238,685 287,843 262,868 26,475 506,435 1,813,801
Total Geese 119,006 117,680 85,356 37,778 192,959 238,719 695,698 363,334 95,848 1,228,844 3,175,222
Tundra Swan 1 21 2 24Trumpeter Swan 35 47 692 8 782Mute Swan 3 3Unident. Swans 82 9 0 91
Total Swans 0 0 35 47 4 692 111 11 0 0 900
Coot 350 693 1,326 11 1,212 601 8,049 209,895 222,137
Grand Total 145,807 138,515 171,749 103,390 294,689 470,492 1,014,652 680,849 333,473 5,475,502 8,829,118S:\CF_D\PROJECTS\monitoring\MWS\CFMWS\CFMWS2010s.XLS
*In TX, SGP and TGP counts (CFAN beginning in 2014) based on cruise surveys. Traditional Mid Dec. coastal cruise count completed for MC Light/WFG geese, Jan count in High and Rolling Plains also included in Light/WFG count but transect numbers in the other survey zones not included (used actual counts).
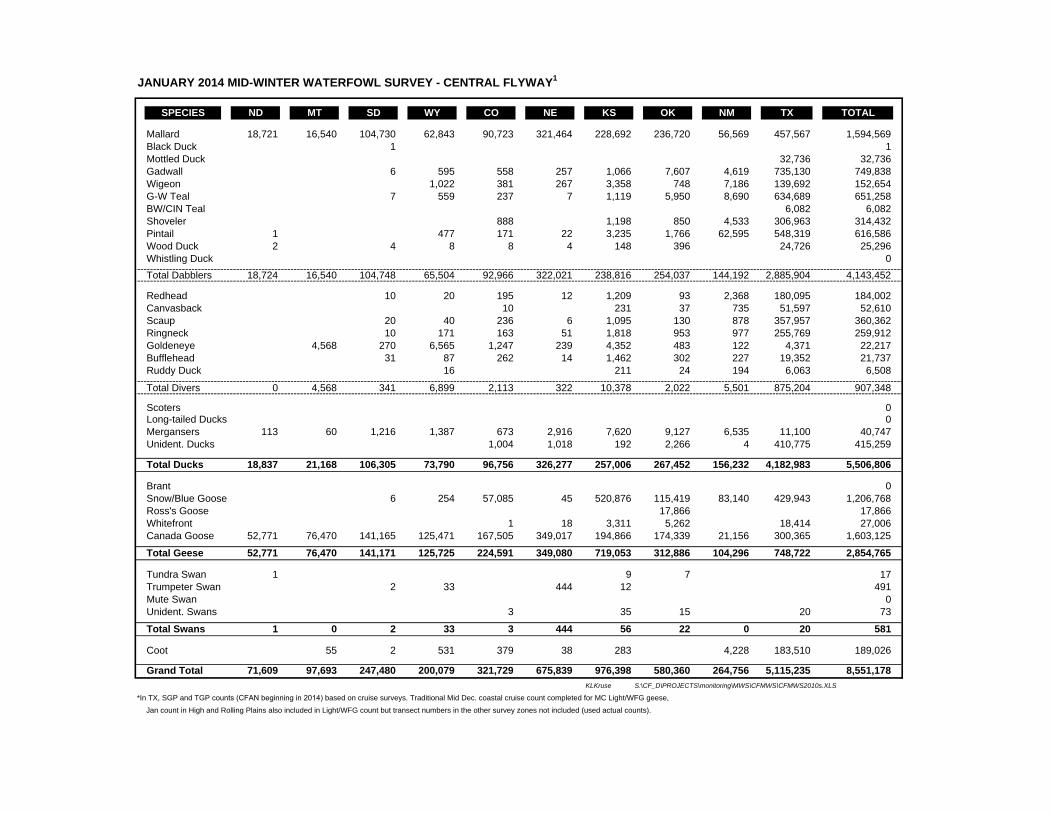
JANUARY 2014 MID-WINTER WATERFOWL SURVEY - CENTRAL FLYWAY 1
SPECIES ND MT SD WY CO NE KS OK NM TX TOTAL
Mallard 18,721 16,540 104,730 62,843 90,723 321,464 228,692 236,720 56,569 457,567 1,594,569Black Duck 1 1Mottled Duck 32,736 32,736Gadwall 6 595 558 257 1,066 7,607 4,619 735,130 749,838Wigeon 1,022 381 267 3,358 748 7,186 139,692 152,654G-W Teal 7 559 237 7 1,119 5,950 8,690 634,689 651,258BW/CIN Teal 6,082 6,082Shoveler 888 1,198 850 4,533 306,963 314,432Pintail 1 477 171 22 3,235 1,766 62,595 548,319 616,586Wood Duck 2 4 8 8 4 148 396 24,726 25,296Whistling Duck 0Total Dabblers 18,724 16,540 104,748 65,504 92,966 322,021 238,816 254,037 144,192 2,885,904 4,143,452
Redhead 10 20 195 12 1,209 93 2,368 180,095 184,002Canvasback 10 231 37 735 51,597 52,610Scaup 20 40 236 6 1,095 130 878 357,957 360,362Ringneck 10 171 163 51 1,818 953 977 255,769 259,912Goldeneye 4,568 270 6,565 1,247 239 4,352 483 122 4,371 22,217Bufflehead 31 87 262 14 1,462 302 227 19,352 21,737Ruddy Duck 16 211 24 194 6,063 6,508
Total Divers 0 4,568 341 6,899 2,113 322 10,378 2,022 5,501 875,204 907,348
Scoters 0Long-tailed Ducks 0Mergansers 113 60 1,216 1,387 673 2,916 7,620 9,127 6,535 11,100 40,747Unident. Ducks 1,004 1,018 192 2,266 4 410,775 415,259
Total Ducks 18,837 21,168 106,305 73,790 96,756 326,277 257,006 267,452 156,232 4,182,983 5,506,806
Brant 0Snow/Blue Goose 6 254 57,085 45 520,876 115,419 83,140 429,943 1,206,768Ross's Goose 17,866 17,866Whitefront 1 18 3,311 5,262 18,414 27,006Canada Goose 52,771 76,470 141,165 125,471 167,505 349,017 194,866 174,339 21,156 300,365 1,603,125
Total Geese 52,771 76,470 141,171 125,725 224,591 349,080 719,053 312,886 104,296 748,722 2,854,765
Tundra Swan 1 9 7 17Trumpeter Swan 2 33 444 12 491Mute Swan 0Unident. Swans 3 35 15 20 73
Total Swans 1 0 2 33 3 444 56 22 0 20 581
Coot 55 2 531 379 38 283 4,228 183,510 189,026
Grand Total 71,609 97,693 247,480 200,079 321,729 675,839 976,398 580,360 264,756 5,115,235 8,551,178KLKruse S:\CF_D\PROJECTS\monitoring\MWS\CFMWS\CFMWS2010s.XLS
*In TX, SGP and TGP counts (CFAN beginning in 2014) based on cruise surveys. Traditional Mid Dec. coastal cruise count completed for MC Light/WFG geese, Jan count in High and Rolling Plains also included in Light/WFG count but transect numbers in the other survey zones not included (used actual counts).
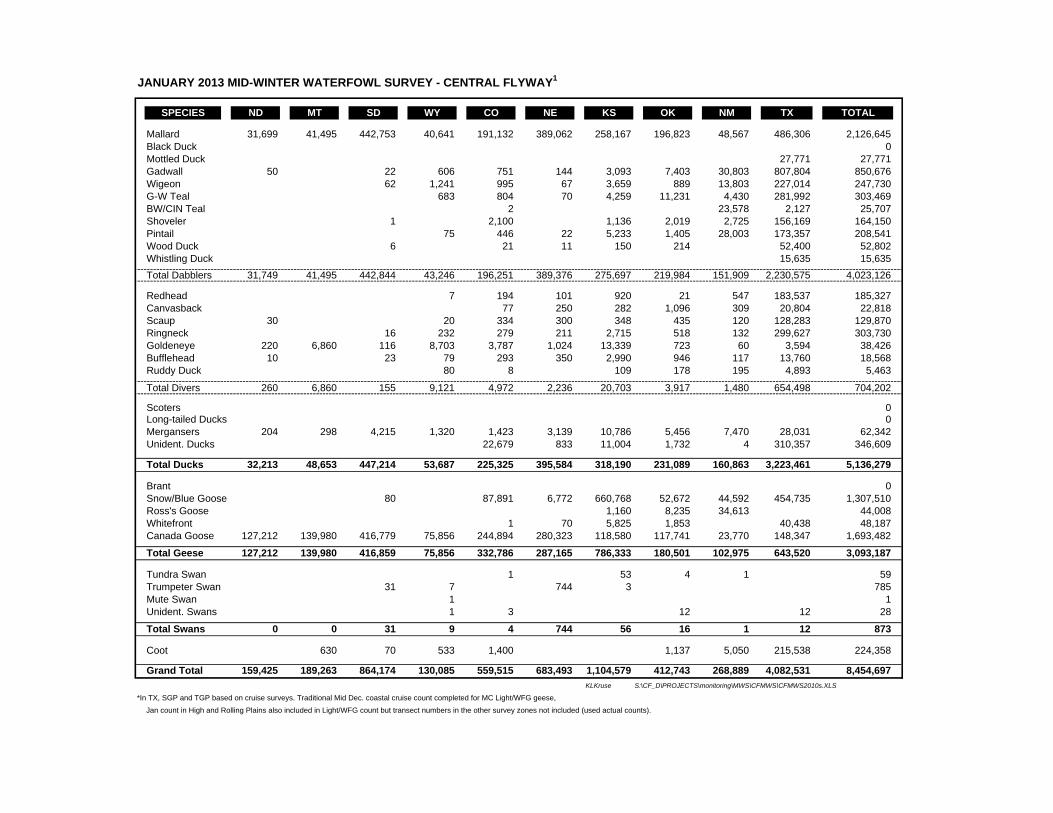
JANUARY 2013 MID-WINTER WATERFOWL SURVEY - CENTRAL FLYWAY 1
SPECIES ND MT SD WY CO NE KS OK NM TX TOTAL
Mallard 31,699 41,495 442,753 40,641 191,132 389,062 258,167 196,823 48,567 486,306 2,126,645Black Duck 0Mottled Duck 27,771 27,771Gadwall 50 22 606 751 144 3,093 7,403 30,803 807,804 850,676Wigeon 62 1,241 995 67 3,659 889 13,803 227,014 247,730G-W Teal 683 804 70 4,259 11,231 4,430 281,992 303,469BW/CIN Teal 2 23,578 2,127 25,707Shoveler 1 2,100 1,136 2,019 2,725 156,169 164,150Pintail 75 446 22 5,233 1,405 28,003 173,357 208,541Wood Duck 6 21 11 150 214 52,400 52,802Whistling Duck 15,635 15,635Total Dabblers 31,749 41,495 442,844 43,246 196,251 389,376 275,697 219,984 151,909 2,230,575 4,023,126
Redhead 7 194 101 920 21 547 183,537 185,327Canvasback 77 250 282 1,096 309 20,804 22,818Scaup 30 20 334 300 348 435 120 128,283 129,870Ringneck 16 232 279 211 2,715 518 132 299,627 303,730Goldeneye 220 6,860 116 8,703 3,787 1,024 13,339 723 60 3,594 38,426Bufflehead 10 23 79 293 350 2,990 946 117 13,760 18,568Ruddy Duck 80 8 109 178 195 4,893 5,463
Total Divers 260 6,860 155 9,121 4,972 2,236 20,703 3,917 1,480 654,498 704,202
Scoters 0Long-tailed Ducks 0Mergansers 204 298 4,215 1,320 1,423 3,139 10,786 5,456 7,470 28,031 62,342Unident. Ducks 22,679 833 11,004 1,732 4 310,357 346,609
Total Ducks 32,213 48,653 447,214 53,687 225,325 395,584 318,190 231,089 160,863 3,223,461 5,136,279
Brant 0Snow/Blue Goose 80 87,891 6,772 660,768 52,672 44,592 454,735 1,307,510Ross's Goose 1,160 8,235 34,613 44,008Whitefront 1 70 5,825 1,853 40,438 48,187Canada Goose 127,212 139,980 416,779 75,856 244,894 280,323 118,580 117,741 23,770 148,347 1,693,482
Total Geese 127,212 139,980 416,859 75,856 332,786 287,165 786,333 180,501 102,975 643,520 3,093,187
Tundra Swan 1 53 4 1 59Trumpeter Swan 31 7 744 3 785Mute Swan 1 1Unident. Swans 1 3 12 12 28
Total Swans 0 0 31 9 4 744 56 16 1 12 873
Coot 630 70 533 1,400 1,137 5,050 215,538 224,358
Grand Total 159,425 189,263 864,174 130,085 559,515 683,493 1,104,579 412,743 268,889 4,082,531 8,454,697KLKruse S:\CF_D\PROJECTS\monitoring\MWS\CFMWS\CFMWS2010s.XLS
*In TX, SGP and TGP based on cruise surveys. Traditional Mid Dec. coastal cruise count completed for MC Light/WFG geese, Jan count in High and Rolling Plains also included in Light/WFG count but transect numbers in the other survey zones not included (used actual counts).

JANUARY 2012 MID-WINTER WATERFOWL SURVEY - CENTRAL FLYWAY 1
SPECIES ND MT SD WY CO NE KS OK NM TX TOTAL
Mallard 88,698 43,489 419,307 57,687 129,547 319,183 220,503 230,444 35,199 574,828 2,118,885Black Duck 0Mottled Duck 30,624 30,624Gadwall 8 1,143 338 118 13,420 13,823 6,763 886,618 922,231Wigeon 10 1,161 619 520 8,986 3,242 12,043 164,554 191,135G-W Teal 1 327 753 52 2,798 12,245 16,021 359,984 392,181BW/CIN Teal 2 0 45 30 5,136 14,028 19,241Shoveler 200 2,031 87 5,964 3,977 1,435 175,012 188,706Pintail 1 18 281 852 107 2,586 9,842 46,435 290,563 350,685Wood Duck 15 24 22 903 733 16,562 18,259Whistling Duck 0Total Dabblers 88,899 43,489 419,344 60,614 134,166 320,089 255,205 274,336 123,032 2,512,773 4,231,947
Redhead 8 10 339 39 1,651 57 116 316,406 318,626Canvasback 0 73 69 72 375 286 28,394 29,269Scaup 25 197 73 356 1,138 764 268,301 270,854Ringneck 1 446 502 34 4,025 3,701 983 159,320 169,012Goldeneye 123 4,986 68 18,839 721 1,438 2,411 146 76 10,860 39,668Bufflehead 1 111 25 96 374 95 690 122 143 32,431 34,088Ruddy Duck 2 25 36 139 107 127 1,208 1,644
Total Divers 125 5,105 95 19,441 2,242 1,748 9,344 5,646 2,495 816,920 863,161
Scoters 0Long-tailed Ducks 1 1Mergansers 112 202 316 3,734 726 7,198 5,894 6,344 4,351 8,226 37,103Unident. Ducks 41,622 575 3,205 6,849 59 102,173 154,483
Total Ducks 89,136 48,796 419,755 83,790 178,756 329,610 273,648 293,175 129,937 3,440,092 5,286,695
Brant 0Snow/Blue Goose 19 17 1,896 17 51,409 30,126 183,159 94,964 36,396 382,543 780,546Ross's Goose 2 11,956 29,254 41,212Whitefront 35 9,910 1,523 67,344 78,812Canada Goose 190,197 170,210 306,625 51,611 225,048 185,021 65,385 255,663 22,166 237,029 1,708,955
Total Geese 190,216 170,227 308,521 51,628 276,457 215,182 258,456 364,106 87,816 686,916 2,609,525
Tundra Swan 2 19 11 32Trumpeter Swan 41 8 753 3 3 808Mute Swan 8 8Unident. Swans 3 2 9 14
Total Swans 0 0 41 8 5 753 30 5 11 9 862
Coot 164 643 1,736 1,755 3,108 1,532 5,082 61,791 75,811
Grand Total 279,352 219,187 728,317 136,069 456,954 547,300 535,242 658,818 222,846 4,188,808 7,972,893KLKruse S:\CF_D\PROJECTS\monitoring\MWS\CFMWS\CFMWS2010s.XLS
*In TX, SGP and TGP based on cruise surveys. Traditional Mid Dec. coastal cruise count completed for MC Light/WFG geese, Jan count in High and Rolling Plains also included in Light/WFG count but transect numbers in the other survey zones not included (used actual counts).

JANUARY 2011 MID-WINTER WATERFOWL SURVEY - CENTRAL FLYWAY 1
SPECIES ND MT SD WY CO NE KS OK NM TX TOTAL
Mallard 5,334 22,973 35,378 46,092 105,265 310,257 196,098 230,992 37,152 582,587 1,572,128Black Duck 0Mottled Duck 39,458 39,458Gadwall 1 10 1,074 144 350 2,016 6,717 7,566 745,037 762,915Wigeon 1 53 1,485 377 118 2,261 1,377 9,762 207,996 223,430G-W Teal 2 293 215 52 1,193 7,029 14,136 287,234 310,154BW/CIN Teal 11 2 1,160 75,707 76,880Shoveler 2,505 20 393 1,718 3,120 130,459 138,215Pintail 1 3 117 236 9 776 1,953 28,784 418,810 450,689Wood Duck 4 28 51 23 155 361 10 56,890 57,522Whistling Duck 0Total Dabblers 5,339 22,973 35,448 49,089 108,804 310,829 202,894 250,147 101,690 2,544,178 3,631,391
Redhead 29 35 117 1,558 289 174 206,919 209,121Canvasback 23 1 25 367 128 32,892 33,436Scaup 20 126 88 130 1,156 556 584 213,523 216,183Ringneck 30 83 154 100 1,415 1,473 965 273,913 278,133Goldeneye 38 8,086 414 9,148 930 1,211 2,693 446 88 1,614 24,668Bufflehead 42 122 342 85 628 464 518 11,417 13,618Ruddy Duck 3 102 554 338 2,192 3,189
Total Divers 38 8,086 535 9,514 1,654 1,530 7,577 4,149 2,795 742,470 778,348
Scoters 0Long-tailed Ducks 0Mergansers 76 340 668 1,740 1,016 2,426 11,253 16,907 8,081 15,440 57,947Unident. Ducks 945 14,306 10 79,043 7,332 56 249,836 351,528
Total Ducks 5,453 31,399 37,596 60,343 125,780 314,795 300,767 278,535 112,622 3,551,924 4,819,214
Brant 0Snow/Blue Goose 12 6 59,768 9 229,886 144,385 36,319 752,988 1,223,373Ross's Goose 51 24,887 6,555 31,493Whitefront 32 4,168 10,700 10 113,261 128,171Canada Goose 7,319 70,585 98,064 91,501 196,507 312,374 141,188 324,769 19,783 278,257 1,540,347
Total Geese 7,319 70,585 98,076 91,507 256,275 312,415 375,293 504,741 62,667 1,144,506 2,923,384
Tundra Swan 0Trumpeter Swan 7 22 761 790Mute Swan 0Unident. Swans 7 2 9 7 14 36 75
Total Swans 0 0 14 22 2 761 9 7 14 36 865
Coot 14 687 1,259 357 612 3,135 9,492 576,663 592,219
Grand Total 12,772 101,984 135,700 152,559 383,316 628,328 676,681 786,418 184,795 5,273,129 8,335,682D.E. SHARP File S:\CF_D\PROJECTS\survey\MWS\CFMWS\CFMWS20 04/25/11
*In TX, SGP and TGP based on cruise surveys. Traditional Mid Dec. coastal cruise count completed for MC Light/WFG geese, Jan count in High and Rolling Plains also included in Light/WFG count but transect numbers in the other survey zones not included (used actual counts).

JANUARY 2010 MID-WINTER WATERFOWL SURVEY - CENTRAL FLYWAY 1
SPECIES ND MT SD WY CO NE KS OK NM TX TOTAL
Mallard 9,392 19,250 66,000 45,586 148,284 141,986 80,343 261,395 30,196 666,575 1,469,007Black Duck 0 0 0 0Mottled Duck 0 0 23,314 23,314Gadwall 9 393 259 217 2,052 7,278 1,956 774,911 787,075Wigeon 3 574 370 29 10,219 2,086 7,547 402,468 423,296G-W Teal 264 285 75 100 5,033 3,958 351,054 360,769BW/CIN Teal 0 9 0 5 0 25,910 25,924Shoveler 1 0 2,019 570 798 1,262 190,805 195,455Pintail 24 78 134 1 292 13,130 19,823 387,526 421,008Wood Duck 6 22 38 7 38 407 1 11,590 12,109Whistling Duck 0 0 0 0 0 280 280Total Dabblers 9,392 19,250 66,043 46,917 151,398 142,315 93,614 290,132 64,743 2,834,433 3,718,237
Redhead 23 67 160 28 18 124 704 35,846 36,970Canvasback 0 85 35 0 907 458 35,001 36,486Scaup 1 8 135 203 57 646 1,162 503 417,090 419,805Ringneck 1 123 355 53 511 2,676 336 275,761 279,816Goldeneye 250 6,924 1,238 10,230 610 480 1,189 1,676 47 13,041 35,685Bufflehead 12 40 218 446 38 183 1,019 296 32,258 34,510Ruddy Duck 19 0 10 285 321 1,965 2,600
Total Divers 263 6,924 1,310 10,792 1,859 691 2,557 7,849 2,665 810,962 845,872
Scoters 0Oldsquaw 1 1 0 2Mergansers 140 154 2,148 1,314 829 708 2,076 28,524 7,754 10,478 54,125Unident. Ducks 1 0 29,596 19 657 8,562 168,189 207,024
Total Ducks 9,796 26,328 69,503 59,023 183,682 143,733 98,904 335,067 75,162 3,824,062 4,825,260
Brant 0 0Snow/Blue Goose 3 101,652 7 112,215 53,354 49,378 523,733 840,342Ross's Goose 0 2 8,323 8,211 16,536Whitefront 0 1 46,118 18,383 0 96,617 161,119Canada Goose 25,617 65,456 76,913 54,542 173,716 243,341 163,309 319,482 29,008 294,378 1,445,762
Total Geese 25,617 65,456 76,913 54,545 275,369 243,348 321,644 399,542 86,597 914,728 2,463,759
Tundra Swan 0 10 12 22Trumpeter Swan 5 44 543 592Mute Swan 0 0Unident. Swans 2 0 2 12 47 63
Total Swans 0 0 7 44 2 543 12 57 12 0 677
Coot 21 290 28 12 34 4,595 5,350 449,970 460,300
Grand Total 35,413 91,784 146,444 113,902 459,081 387,636 420,594 739,261 167,121 5,188,760 7,749,996D.E. SHARP File S:\CF_D\PROJECTS\survey\MWS\CFMWS\CFMWS20 07/17/10
*In TX, SGP and TGP based on cruise surveys. Traditional Mid Dec. coastal cruise count completed for MC Light/WFG geese, Jan count in High and Rolling Plains also included in Light/WFG count but transect numbers in the other survey zones not included (used actual counts).
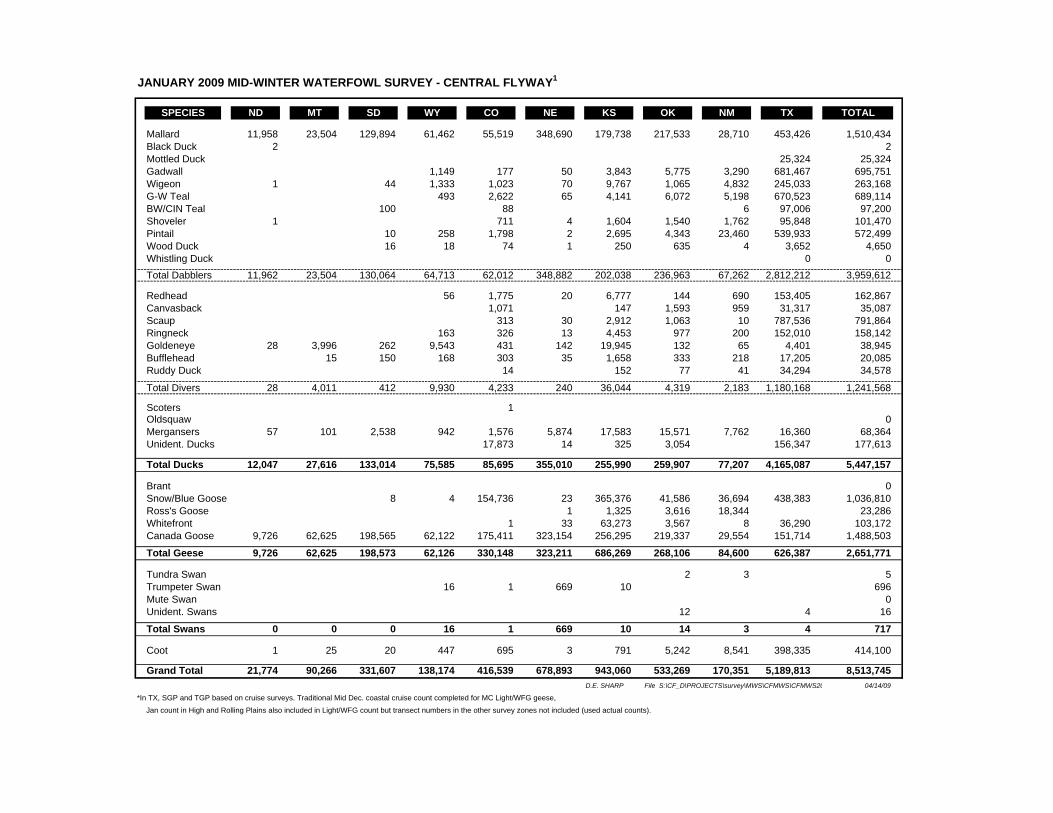
JANUARY 2009 MID-WINTER WATERFOWL SURVEY - CENTRAL FLYWAY 1
SPECIES ND MT SD WY CO NE KS OK NM TX TOTAL
Mallard 11,958 23,504 129,894 61,462 55,519 348,690 179,738 217,533 28,710 453,426 1,510,434Black Duck 2 2Mottled Duck 25,324 25,324Gadwall 1,149 177 50 3,843 5,775 3,290 681,467 695,751Wigeon 1 44 1,333 1,023 70 9,767 1,065 4,832 245,033 263,168G-W Teal 493 2,622 65 4,141 6,072 5,198 670,523 689,114BW/CIN Teal 100 88 6 97,006 97,200Shoveler 1 711 4 1,604 1,540 1,762 95,848 101,470Pintail 10 258 1,798 2 2,695 4,343 23,460 539,933 572,499Wood Duck 16 18 74 1 250 635 4 3,652 4,650Whistling Duck 0 0Total Dabblers 11,962 23,504 130,064 64,713 62,012 348,882 202,038 236,963 67,262 2,812,212 3,959,612
Redhead 56 1,775 20 6,777 144 690 153,405 162,867Canvasback 1,071 147 1,593 959 31,317 35,087Scaup 313 30 2,912 1,063 10 787,536 791,864Ringneck 163 326 13 4,453 977 200 152,010 158,142Goldeneye 28 3,996 262 9,543 431 142 19,945 132 65 4,401 38,945Bufflehead 15 150 168 303 35 1,658 333 218 17,205 20,085Ruddy Duck 14 152 77 41 34,294 34,578
Total Divers 28 4,011 412 9,930 4,233 240 36,044 4,319 2,183 1,180,168 1,241,568
Scoters 1Oldsquaw 0Mergansers 57 101 2,538 942 1,576 5,874 17,583 15,571 7,762 16,360 68,364Unident. Ducks 17,873 14 325 3,054 156,347 177,613
Total Ducks 12,047 27,616 133,014 75,585 85,695 355,010 255,990 259,907 77,207 4,165,087 5,447,157
Brant 0Snow/Blue Goose 8 4 154,736 23 365,376 41,586 36,694 438,383 1,036,810Ross's Goose 1 1,325 3,616 18,344 23,286Whitefront 1 33 63,273 3,567 8 36,290 103,172Canada Goose 9,726 62,625 198,565 62,122 175,411 323,154 256,295 219,337 29,554 151,714 1,488,503
Total Geese 9,726 62,625 198,573 62,126 330,148 323,211 686,269 268,106 84,600 626,387 2,651,771
Tundra Swan 2 3 5Trumpeter Swan 16 1 669 10 696Mute Swan 0Unident. Swans 12 4 16
Total Swans 0 0 0 16 1 669 10 14 3 4 717
Coot 1 25 20 447 695 3 791 5,242 8,541 398,335 414,100
Grand Total 21,774 90,266 331,607 138,174 416,539 678,893 943,060 533,269 170,351 5,189,813 8,513,745D.E. SHARP File S:\CF_D\PROJECTS\survey\MWS\CFMWS\CFMWS20 04/14/09
*In TX, SGP and TGP based on cruise surveys. Traditional Mid Dec. coastal cruise count completed for MC Light/WFG geese, Jan count in High and Rolling Plains also included in Light/WFG count but transect numbers in the other survey zones not included (used actual counts).
MID-WINTER GOOSE SURVEYCENTRAL FLYWAY
S:\WKFILES\MWS\MWSTITLE\MWSTITLS.123

RESULTS OF 2018 WINTER GOOSE SURVEYS IN THE CENTRAL FLYWAY¹
January 2018 Mid-winter Waterfowl Survey
CANADA GEESE LIGHT GEESE
State Hi-LineWest Tier CFAN 3
East Tier CFAN 3 EPP WP/GP RMP Unclass. Total W-CF M-C W-F TOTAL
Montana 77,722 1,500 0 0 0 0 0 79,222 0 0 0 79,222No. Dakota 0 0 0 0 134,793 0 0 134,793 0 1 0 134,794So. Dakota 0 0 9,872 24,000 120,949 0 0 154,821 0 58 0 154,879Wyoming 45,393 4,593 0 0 0 14,966 0 64,952 3 0 0 64,955Nebraska 2,234 0 0 0 263,738 0 0 265,972 0 378 0 266,350Colorado 373,538 167,040 0 0 0 0 0 540,578 223,157 0 23 763,758Kansas 0 8,200 5,079 665 46,010 0 375,368 435,322 0 1,085,135 4,008 1,524,465N. Mexico 6,962 18,385 0 0 0 0 673 26,020 17,750 0 0 43,770Oklahoma 0 0 342,812 0 11,678 0 0 354,490 0 140,785 8,055 503,330Texas 0 353,309 25,287 0 0 0 0 378,596 70,420 270,882 98,486 818,384
*In TX, CFAN based on cruise surveys. Traditional Mid Dec. coastal cruise count completed for MC Light/WFG geese.
Central Flyway Goose Population Survey Results²
CANADA GEESE LIGHT GEESE
Year Hi-LineWest Tier
CFANEast Tier
CFAN EPP WP/GP RMP Unclass. Total W-CF M-C W-F TOTAL
2018 505,849 553,027 383,050 24,665 577,168 14,966 376,041 2,434,766 311,330 1,497,239 110,572 4,353,9072017 286,753 468,094 222,882 30 608,739 13,659 117,891 1,718,048 214,185 908,201 101,384 2,941,8182016 280,194 452,913 172,297 1,523 538,160 9,172 95,960 1,550,219 236,557 1,182,399 107,828 3,077,0032015 238,844 547,700 280,438 15,200 455,846 13,384 262,389 1,813,801 243,253 1,048,902 69,266 3,175,2222014 281,324 379,214 188,068 900 568,818 37,894 146,907 1,603,125 264,836 959,798 27,006 2,854,7652013 341,302 256,268 263,271 2,375 768,818 23,617 37,831 1,693,482 225,936 1,125,582 48,187 3,093,1872012 339,436 292,795 450,786 34,343 555,355 9,111 27,129 1,708,955 205,331 616,427 78,812 2,609,5252011 273,025 310,657 427,063 675 499,029 16,418 13,479 1,540,346 196,013 1,058,853 128,171 2,923,3832010 239,617 290,724 417,044 9,500 462,794 10,294 15,790 1,445,763 238,084 618,794 161,119 2,463,7602009 222,071 221,590 309,909 20,900 627,977 15,798 70,260 1,488,505 284,446 775,650 103,172 2,651,7732008 269,289 212,421 402,718 50 669,524 9,188 21,789 1,584,979 188,515 627,426 82,936 2,483,8562007 180,215 190,531 680,301 43,700 445,959 19,512 37,413 1,597,631 170,642 1,076,557 243,081 3,087,9112006 247,265 234,737 499,801 2,160 444,410 6,883 13,435 1,448,691 140,587 808,508 304,093 2,701,8792005 207,401 177,195 400,766 50,000 415,131 15,849 5,175 1,271,517 142,974 877,917 147,783 2,440,1912004 215,586 203,586 458,680 26,000 622,100 13,228 69,595 1,608,775 135,373 726,999 79,389 2,550,5362003 205,939 156,661 611,842 40,500 561,049 5,119 24,907 1,606,017 105,900 826,981 213,343 2,752,2412002 217,145 160,873 504,708 8,100 710,260 7,396 16,873 1,625,355 99,875 675,453 260,849 2,661,5322001 257,929 164,084 149,090 900 677,729 13,327 18,329 1,281,388 105,754 751,928 141,189 2,280,2592000 270,730 199,493 295,540 13,050 599,292 9,801 11,860 1,399,766 137,535 1,057,042 145,219 2,739,5621999 119,460 403,197 548,206 45,000 467,137 5,298 52,554 1,640,852 236,365 1,114,384 200,391 3,191,992
1997-98 190,985 339,552 331,863 1,200 482,290 44,947 1,390,837 103,522 1,058,685 356,531 2,909,5751996-97 148,527 406,838 262,864 0 453,358 39,505 1,311,092 127,172 1,208,606 215,254 2,862,1241995-96 167,524 414,829 263,996 20,800 403,318 66,445 1,336,912 93,054 835,565 154,519 2,420,0501994-95 173,752 481,951 244,988 27,500 352,495 35,520 1,316,206 80,127 1,203,360 194,845 2,794,5381993-94 164,334 312,855 224,200 1,800 272,487 41,916 1,017,592 84,874 1,015,169 188,878 2,306,5131992-93 117,294 270,495 235,328 26,600 318,029 60,622 1,028,368 45,145 895,951 158,625 2,128,0891991-92 136,950 558,756 276,329 0 305,861 47,624 1,325,520 87,885 908,373 85,881 2,407,6591990-91 116,643 512,162 305,117 13,500 328,710 372,398 1,648,530 104,624 799,880 155,211 2,708,2451989-90 101,840 375,283 136,091 11,000 216,034 329,779 1,170,027 38,686 661,302 90,830 1,960,8451988-89 99,934 284,168 215,799 0 245,891 375,874 1,221,666 67,637 598,132 103,073 1,990,5081987-88 65,512 147,322 306,735 0 272,050 224,470 1,016,089 46,217 735,922 90,626 1,888,8541986-87 117,409 193,318 159,007 0 174,355 382,332 1,026,421 63,545 900,437 194,530 2,184,9331985-86 68,792 180,824 189,360 0 36,534 307,919 783,429 96,591 837,611 92,727 1,810,3581984-85 76,111 179,120 197,240 0 160,640 173,394 786,505 62,905 980,220 155,705 1,985,3351983-84 39,779 143,382 260,650 0 91,450 51,775 587,036 43,038 905,538 140,697 1,676,309
¹ Mid-December Goose Surveys were discontinued after December, 1997. S:\CF_D\Projects\Monitoring\MWS\GOOSESURVEY\GSESUM2010s.XLS 3/5/18
² Yearly totals from 1983-84 to 1997-98 reflect Mid-December counts (when available) for TGP, EPP, and WP/GP Canada geese, W-CF and M-C light geese, and W-F geese; totals for Hi-line and SGP populations reflect Mid-winter Survey data. Counts from these time periods were designated as official counts by respective Management Plans.
3 Starting in 2014, SGP and TGP populations have been combined into one population: Central Flyway Arctic Nesting (CFAN) Canada Geese. For the MWS they will be split out by West Tier and East Tier segments.
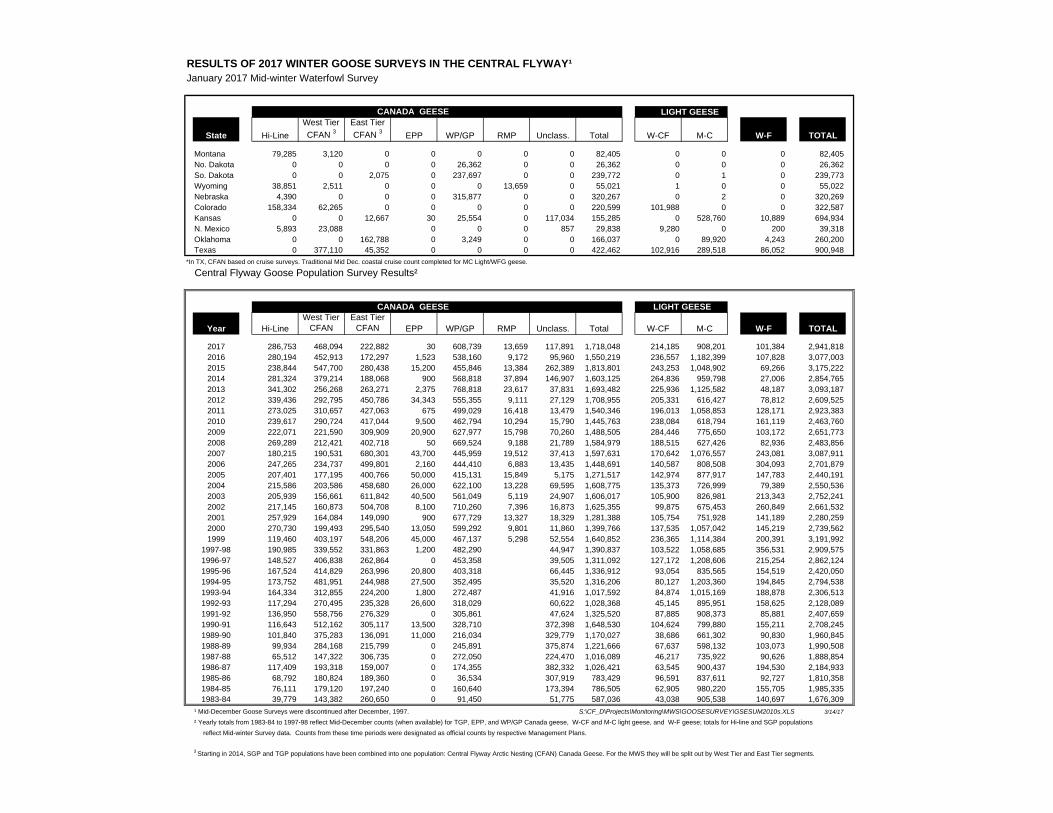
RESULTS OF 2017 WINTER GOOSE SURVEYS IN THE CENTRAL FLYWAY¹
January 2017 Mid-winter Waterfowl Survey
CANADA GEESE LIGHT GEESE
State Hi-LineWest Tier CFAN 3
East Tier CFAN 3 EPP WP/GP RMP Unclass. Total W-CF M-C W-F TOTAL
Montana 79,285 3,120 0 0 0 0 0 82,405 0 0 0 82,405No. Dakota 0 0 0 0 26,362 0 0 26,362 0 0 0 26,362So. Dakota 0 0 2,075 0 237,697 0 0 239,772 0 1 0 239,773Wyoming 38,851 2,511 0 0 0 13,659 0 55,021 1 0 0 55,022Nebraska 4,390 0 0 0 315,877 0 0 320,267 0 2 0 320,269Colorado 158,334 62,265 0 0 0 0 0 220,599 101,988 0 0 322,587Kansas 0 0 12,667 30 25,554 0 117,034 155,285 0 528,760 10,889 694,934N. Mexico 5,893 23,088 0 0 0 857 29,838 9,280 0 200 39,318Oklahoma 0 0 162,788 0 3,249 0 0 166,037 0 89,920 4,243 260,200Texas 0 377,110 45,352 0 0 0 0 422,462 102,916 289,518 86,052 900,948
*In TX, CFAN based on cruise surveys. Traditional Mid Dec. coastal cruise count completed for MC Light/WFG geese.
Central Flyway Goose Population Survey Results²
CANADA GEESE LIGHT GEESE
Year Hi-LineWest Tier
CFANEast Tier
CFAN EPP WP/GP RMP Unclass. Total W-CF M-C W-F TOTAL
2017 286,753 468,094 222,882 30 608,739 13,659 117,891 1,718,048 214,185 908,201 101,384 2,941,8182016 280,194 452,913 172,297 1,523 538,160 9,172 95,960 1,550,219 236,557 1,182,399 107,828 3,077,0032015 238,844 547,700 280,438 15,200 455,846 13,384 262,389 1,813,801 243,253 1,048,902 69,266 3,175,2222014 281,324 379,214 188,068 900 568,818 37,894 146,907 1,603,125 264,836 959,798 27,006 2,854,7652013 341,302 256,268 263,271 2,375 768,818 23,617 37,831 1,693,482 225,936 1,125,582 48,187 3,093,1872012 339,436 292,795 450,786 34,343 555,355 9,111 27,129 1,708,955 205,331 616,427 78,812 2,609,5252011 273,025 310,657 427,063 675 499,029 16,418 13,479 1,540,346 196,013 1,058,853 128,171 2,923,3832010 239,617 290,724 417,044 9,500 462,794 10,294 15,790 1,445,763 238,084 618,794 161,119 2,463,7602009 222,071 221,590 309,909 20,900 627,977 15,798 70,260 1,488,505 284,446 775,650 103,172 2,651,7732008 269,289 212,421 402,718 50 669,524 9,188 21,789 1,584,979 188,515 627,426 82,936 2,483,8562007 180,215 190,531 680,301 43,700 445,959 19,512 37,413 1,597,631 170,642 1,076,557 243,081 3,087,9112006 247,265 234,737 499,801 2,160 444,410 6,883 13,435 1,448,691 140,587 808,508 304,093 2,701,8792005 207,401 177,195 400,766 50,000 415,131 15,849 5,175 1,271,517 142,974 877,917 147,783 2,440,1912004 215,586 203,586 458,680 26,000 622,100 13,228 69,595 1,608,775 135,373 726,999 79,389 2,550,5362003 205,939 156,661 611,842 40,500 561,049 5,119 24,907 1,606,017 105,900 826,981 213,343 2,752,2412002 217,145 160,873 504,708 8,100 710,260 7,396 16,873 1,625,355 99,875 675,453 260,849 2,661,5322001 257,929 164,084 149,090 900 677,729 13,327 18,329 1,281,388 105,754 751,928 141,189 2,280,2592000 270,730 199,493 295,540 13,050 599,292 9,801 11,860 1,399,766 137,535 1,057,042 145,219 2,739,5621999 119,460 403,197 548,206 45,000 467,137 5,298 52,554 1,640,852 236,365 1,114,384 200,391 3,191,992
1997-98 190,985 339,552 331,863 1,200 482,290 44,947 1,390,837 103,522 1,058,685 356,531 2,909,5751996-97 148,527 406,838 262,864 0 453,358 39,505 1,311,092 127,172 1,208,606 215,254 2,862,1241995-96 167,524 414,829 263,996 20,800 403,318 66,445 1,336,912 93,054 835,565 154,519 2,420,0501994-95 173,752 481,951 244,988 27,500 352,495 35,520 1,316,206 80,127 1,203,360 194,845 2,794,5381993-94 164,334 312,855 224,200 1,800 272,487 41,916 1,017,592 84,874 1,015,169 188,878 2,306,5131992-93 117,294 270,495 235,328 26,600 318,029 60,622 1,028,368 45,145 895,951 158,625 2,128,0891991-92 136,950 558,756 276,329 0 305,861 47,624 1,325,520 87,885 908,373 85,881 2,407,6591990-91 116,643 512,162 305,117 13,500 328,710 372,398 1,648,530 104,624 799,880 155,211 2,708,2451989-90 101,840 375,283 136,091 11,000 216,034 329,779 1,170,027 38,686 661,302 90,830 1,960,8451988-89 99,934 284,168 215,799 0 245,891 375,874 1,221,666 67,637 598,132 103,073 1,990,5081987-88 65,512 147,322 306,735 0 272,050 224,470 1,016,089 46,217 735,922 90,626 1,888,8541986-87 117,409 193,318 159,007 0 174,355 382,332 1,026,421 63,545 900,437 194,530 2,184,9331985-86 68,792 180,824 189,360 0 36,534 307,919 783,429 96,591 837,611 92,727 1,810,3581984-85 76,111 179,120 197,240 0 160,640 173,394 786,505 62,905 980,220 155,705 1,985,3351983-84 39,779 143,382 260,650 0 91,450 51,775 587,036 43,038 905,538 140,697 1,676,309
¹ Mid-December Goose Surveys were discontinued after December, 1997. S:\CF_D\Projects\Monitoring\MWS\GOOSESURVEY\GSESUM2010s.XLS 3/14/17
² Yearly totals from 1983-84 to 1997-98 reflect Mid-December counts (when available) for TGP, EPP, and WP/GP Canada geese, W-CF and M-C light geese, and W-F geese; totals for Hi-line and SGP populations reflect Mid-winter Survey data. Counts from these time periods were designated as official counts by respective Management Plans.
3 Starting in 2014, SGP and TGP populations have been combined into one population: Central Flyway Arctic Nesting (CFAN) Canada Geese. For the MWS they will be split out by West Tier and East Tier segments.
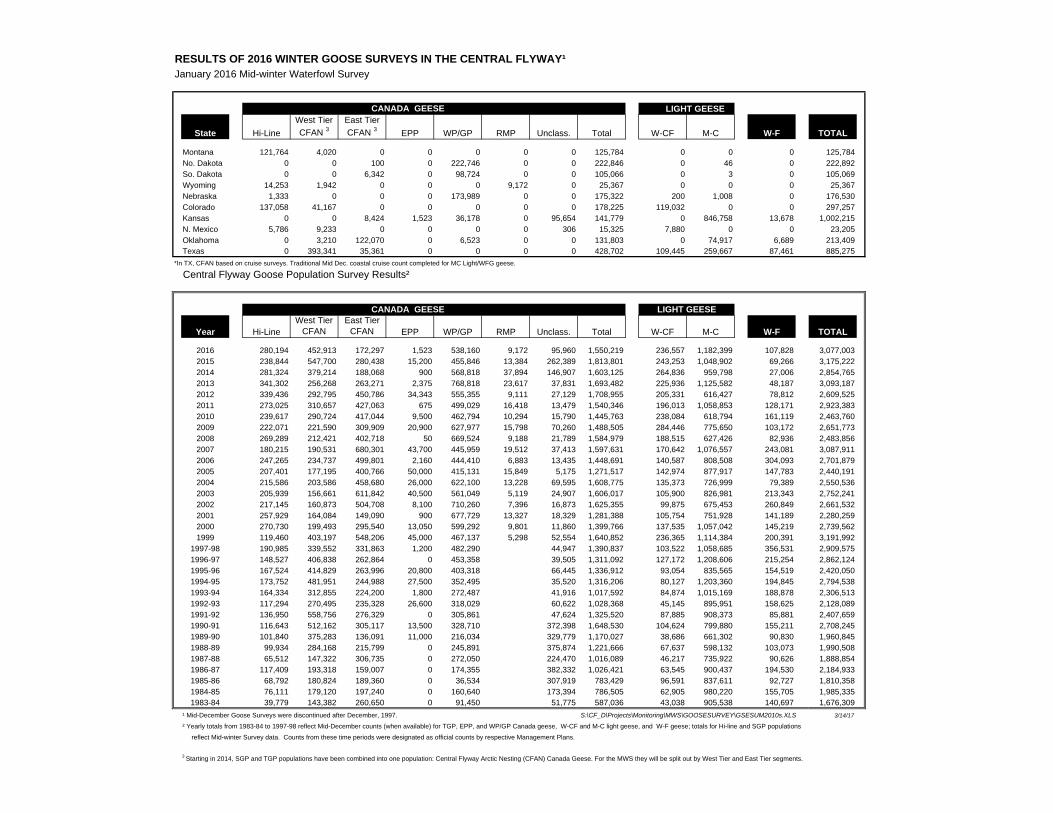
RESULTS OF 2016 WINTER GOOSE SURVEYS IN THE CENTRAL FLYWAY¹
January 2016 Mid-winter Waterfowl Survey
CANADA GEESE LIGHT GEESE
State Hi-LineWest Tier CFAN 3
East Tier CFAN 3 EPP WP/GP RMP Unclass. Total W-CF M-C W-F TOTAL
Montana 121,764 4,020 0 0 0 0 0 125,784 0 0 0 125,784No. Dakota 0 0 100 0 222,746 0 0 222,846 0 46 0 222,892So. Dakota 0 0 6,342 0 98,724 0 0 105,066 0 3 0 105,069Wyoming 14,253 1,942 0 0 0 9,172 0 25,367 0 0 0 25,367Nebraska 1,333 0 0 0 173,989 0 0 175,322 200 1,008 0 176,530Colorado 137,058 41,167 0 0 0 0 0 178,225 119,032 0 0 297,257Kansas 0 0 8,424 1,523 36,178 0 95,654 141,779 0 846,758 13,678 1,002,215N. Mexico 5,786 9,233 0 0 0 0 306 15,325 7,880 0 0 23,205Oklahoma 0 3,210 122,070 0 6,523 0 0 131,803 0 74,917 6,689 213,409Texas 0 393,341 35,361 0 0 0 0 428,702 109,445 259,667 87,461 885,275
*In TX, CFAN based on cruise surveys. Traditional Mid Dec. coastal cruise count completed for MC Light/WFG geese.
Central Flyway Goose Population Survey Results²
CANADA GEESE LIGHT GEESE
Year Hi-LineWest Tier
CFANEast Tier
CFAN EPP WP/GP RMP Unclass. Total W-CF M-C W-F TOTAL
2016 280,194 452,913 172,297 1,523 538,160 9,172 95,960 1,550,219 236,557 1,182,399 107,828 3,077,0032015 238,844 547,700 280,438 15,200 455,846 13,384 262,389 1,813,801 243,253 1,048,902 69,266 3,175,2222014 281,324 379,214 188,068 900 568,818 37,894 146,907 1,603,125 264,836 959,798 27,006 2,854,7652013 341,302 256,268 263,271 2,375 768,818 23,617 37,831 1,693,482 225,936 1,125,582 48,187 3,093,1872012 339,436 292,795 450,786 34,343 555,355 9,111 27,129 1,708,955 205,331 616,427 78,812 2,609,5252011 273,025 310,657 427,063 675 499,029 16,418 13,479 1,540,346 196,013 1,058,853 128,171 2,923,3832010 239,617 290,724 417,044 9,500 462,794 10,294 15,790 1,445,763 238,084 618,794 161,119 2,463,7602009 222,071 221,590 309,909 20,900 627,977 15,798 70,260 1,488,505 284,446 775,650 103,172 2,651,7732008 269,289 212,421 402,718 50 669,524 9,188 21,789 1,584,979 188,515 627,426 82,936 2,483,8562007 180,215 190,531 680,301 43,700 445,959 19,512 37,413 1,597,631 170,642 1,076,557 243,081 3,087,9112006 247,265 234,737 499,801 2,160 444,410 6,883 13,435 1,448,691 140,587 808,508 304,093 2,701,8792005 207,401 177,195 400,766 50,000 415,131 15,849 5,175 1,271,517 142,974 877,917 147,783 2,440,1912004 215,586 203,586 458,680 26,000 622,100 13,228 69,595 1,608,775 135,373 726,999 79,389 2,550,5362003 205,939 156,661 611,842 40,500 561,049 5,119 24,907 1,606,017 105,900 826,981 213,343 2,752,2412002 217,145 160,873 504,708 8,100 710,260 7,396 16,873 1,625,355 99,875 675,453 260,849 2,661,5322001 257,929 164,084 149,090 900 677,729 13,327 18,329 1,281,388 105,754 751,928 141,189 2,280,2592000 270,730 199,493 295,540 13,050 599,292 9,801 11,860 1,399,766 137,535 1,057,042 145,219 2,739,5621999 119,460 403,197 548,206 45,000 467,137 5,298 52,554 1,640,852 236,365 1,114,384 200,391 3,191,992
1997-98 190,985 339,552 331,863 1,200 482,290 44,947 1,390,837 103,522 1,058,685 356,531 2,909,5751996-97 148,527 406,838 262,864 0 453,358 39,505 1,311,092 127,172 1,208,606 215,254 2,862,1241995-96 167,524 414,829 263,996 20,800 403,318 66,445 1,336,912 93,054 835,565 154,519 2,420,0501994-95 173,752 481,951 244,988 27,500 352,495 35,520 1,316,206 80,127 1,203,360 194,845 2,794,5381993-94 164,334 312,855 224,200 1,800 272,487 41,916 1,017,592 84,874 1,015,169 188,878 2,306,5131992-93 117,294 270,495 235,328 26,600 318,029 60,622 1,028,368 45,145 895,951 158,625 2,128,0891991-92 136,950 558,756 276,329 0 305,861 47,624 1,325,520 87,885 908,373 85,881 2,407,6591990-91 116,643 512,162 305,117 13,500 328,710 372,398 1,648,530 104,624 799,880 155,211 2,708,2451989-90 101,840 375,283 136,091 11,000 216,034 329,779 1,170,027 38,686 661,302 90,830 1,960,8451988-89 99,934 284,168 215,799 0 245,891 375,874 1,221,666 67,637 598,132 103,073 1,990,5081987-88 65,512 147,322 306,735 0 272,050 224,470 1,016,089 46,217 735,922 90,626 1,888,8541986-87 117,409 193,318 159,007 0 174,355 382,332 1,026,421 63,545 900,437 194,530 2,184,9331985-86 68,792 180,824 189,360 0 36,534 307,919 783,429 96,591 837,611 92,727 1,810,3581984-85 76,111 179,120 197,240 0 160,640 173,394 786,505 62,905 980,220 155,705 1,985,3351983-84 39,779 143,382 260,650 0 91,450 51,775 587,036 43,038 905,538 140,697 1,676,309
¹ Mid-December Goose Surveys were discontinued after December, 1997. S:\CF_D\Projects\Monitoring\MWS\GOOSESURVEY\GSESUM2010s.XLS 3/14/17
² Yearly totals from 1983-84 to 1997-98 reflect Mid-December counts (when available) for TGP, EPP, and WP/GP Canada geese, W-CF and M-C light geese, and W-F geese; totals for Hi-line and SGP populations
reflect Mid-winter Survey data. Counts from these time periods were designated as official counts by respective Management Plans.
3 Starting in 2014, SGP and TGP populations have been combined into one population: Central Flyway Arctic Nesting (CFAN) Canada Geese. For the MWS they will be split out by West Tier and East Tier segments.

RESULTS OF 2015 WINTER GOOSE SURVEYS IN THE CENTRAL FLYWAY¹
January 2015 Mid-winter Waterfowl Survey
CANADA GEESE LIGHT GEESE
State Hi-LineWest Tier CFAN 3
East Tier CFAN 3 EPP WP/GP RMP Unclass. Total W-CF M-C W-F TOTAL
Montana 111,883 5,797 117,680 117,680No. Dakota 119,006 119,006 119,006So. Dakota 1,300 5,200 78,856 85,356 85,356Wyoming 22,858 1,535 13,384 37,777 1 37,778Nebraska 1,769 200 236,716 238,685 1 17 16 238,719Colorado 95,574 36,102 131,676 61,283 192,959Kansas 3,290 10,000 12,825 261,728 287,843 405,149 2,706 695,698N. Mexico 6,760 19,054 661 26,475 69,373 95,848Oklahoma 254,425 8,443 262,868 98,928 1,538 363,334Texas 485,212 21,223 506,435 112,595 544,808 65,006 1,228,844
*In TX, CFAN based on cruise surveys. Traditional Mid Dec. coastal cruise count completed for MC Light/WFG geese.
Central Flyway Goose Population Survey Results²
CANADA GEESE LIGHT GEESE
Year Hi-LineWest Tier
CFANEast Tier
CFAN EPP WP/GP RMP Unclass. Total W-CF M-C W-F TOTAL
2015 238,844 547,700 280,438 15,200 455,846 13,384 262,389 1,813,801 243,253 1,048,902 69,266 3,175,2222014 281,324 379,214 188,068 900 568,818 37,894 146,907 1,603,125 264,836 959,798 27,006 2,854,7652013 341,302 256,268 263,271 2,375 768,818 23,617 37,831 1,693,482 225,936 1,125,582 48,187 3,093,1872012 339,436 292,795 450,786 34,343 555,355 9,111 27,129 1,708,955 205,331 616,427 78,812 2,609,5252011 273,025 310,657 427,063 675 499,029 16,418 13,479 1,540,346 196,013 1,058,853 128,171 2,923,3832010 239,617 290,724 417,044 9,500 462,794 10,294 15,790 1,445,763 238,084 618,794 161,119 2,463,7602009 222,071 221,590 309,909 20,900 627,977 15,798 70,260 1,488,505 284,446 775,650 103,172 2,651,7732008 269,289 212,421 402,718 50 669,524 9,188 21,789 1,584,979 188,515 627,426 82,936 2,483,8562007 180,215 190,531 680,301 43,700 445,959 19,512 37,413 1,597,631 170,642 1,076,557 243,081 3,087,9112006 247,265 234,737 499,801 2,160 444,410 6,883 13,435 1,448,691 140,587 808,508 304,093 2,701,8792005 207,401 177,195 400,766 50,000 415,131 15,849 5,175 1,271,517 142,974 877,917 147,783 2,440,1912004 215,586 203,586 458,680 26,000 622,100 13,228 69,595 1,608,775 135,373 726,999 79,389 2,550,5362003 205,939 156,661 611,842 40,500 561,049 5,119 24,907 1,606,017 105,900 826,981 213,343 2,752,2412002 217,145 160,873 504,708 8,100 710,260 7,396 16,873 1,625,355 99,875 675,453 260,849 2,661,5322001 257,929 164,084 149,090 900 677,729 13,327 18,329 1,281,388 105,754 751,928 141,189 2,280,2592000 270,730 199,493 295,540 13,050 599,292 9,801 11,860 1,399,766 137,535 1,057,042 145,219 2,739,5621999 119,460 403,197 548,206 45,000 467,137 5,298 52,554 1,640,852 236,365 1,114,384 200,391 3,191,992
1997-98 190,985 339,552 331,863 1,200 482,290 44,947 1,390,837 103,522 1,058,685 356,531 2,909,5751996-97 148,527 406,838 262,864 0 453,358 39,505 1,311,092 127,172 1,208,606 215,254 2,862,1241995-96 167,524 414,829 263,996 20,800 403,318 66,445 1,336,912 93,054 835,565 154,519 2,420,0501994-95 173,752 481,951 244,988 27,500 352,495 35,520 1,316,206 80,127 1,203,360 194,845 2,794,5381993-94 164,334 312,855 224,200 1,800 272,487 41,916 1,017,592 84,874 1,015,169 188,878 2,306,5131992-93 117,294 270,495 235,328 26,600 318,029 60,622 1,028,368 45,145 895,951 158,625 2,128,0891991-92 136,950 558,756 276,329 0 305,861 47,624 1,325,520 87,885 908,373 85,881 2,407,6591990-91 116,643 512,162 305,117 13,500 328,710 372,398 1,648,530 104,624 799,880 155,211 2,708,2451989-90 101,840 375,283 136,091 11,000 216,034 329,779 1,170,027 38,686 661,302 90,830 1,960,8451988-89 99,934 284,168 215,799 0 245,891 375,874 1,221,666 67,637 598,132 103,073 1,990,5081987-88 65,512 147,322 306,735 0 272,050 224,470 1,016,089 46,217 735,922 90,626 1,888,8541986-87 117,409 193,318 159,007 0 174,355 382,332 1,026,421 63,545 900,437 194,530 2,184,9331985-86 68,792 180,824 189,360 0 36,534 307,919 783,429 96,591 837,611 92,727 1,810,3581984-85 76,111 179,120 197,240 0 160,640 173,394 786,505 62,905 980,220 155,705 1,985,3351983-84 39,779 143,382 260,650 0 91,450 51,775 587,036 43,038 905,538 140,697 1,676,309
¹ Mid-December Goose Surveys were discontinued after December, 1997. S:\CF_D\Projects\Monitoring\MWS\GOOSESURVEY\GSESUM2010s.XLS 3/24/16
² Yearly totals from 1983-84 to 1997-98 reflect Mid-December counts (when available) for TGP, EPP, and WP/GP Canada geese, W-CF and M-C light geese, and W-F geese; totals for Hi-line and SGP populations reflect Mid-winter Survey data. Counts from these time periods were designated as official counts by respective Management Plans.
3 Starting in 2014, SGP and TGP populations have been combined into one population: Central Flyway Arctic Nesting (CFAN) Canada Geese. For the MWS they will be split out by West Tier and East Tier segments.
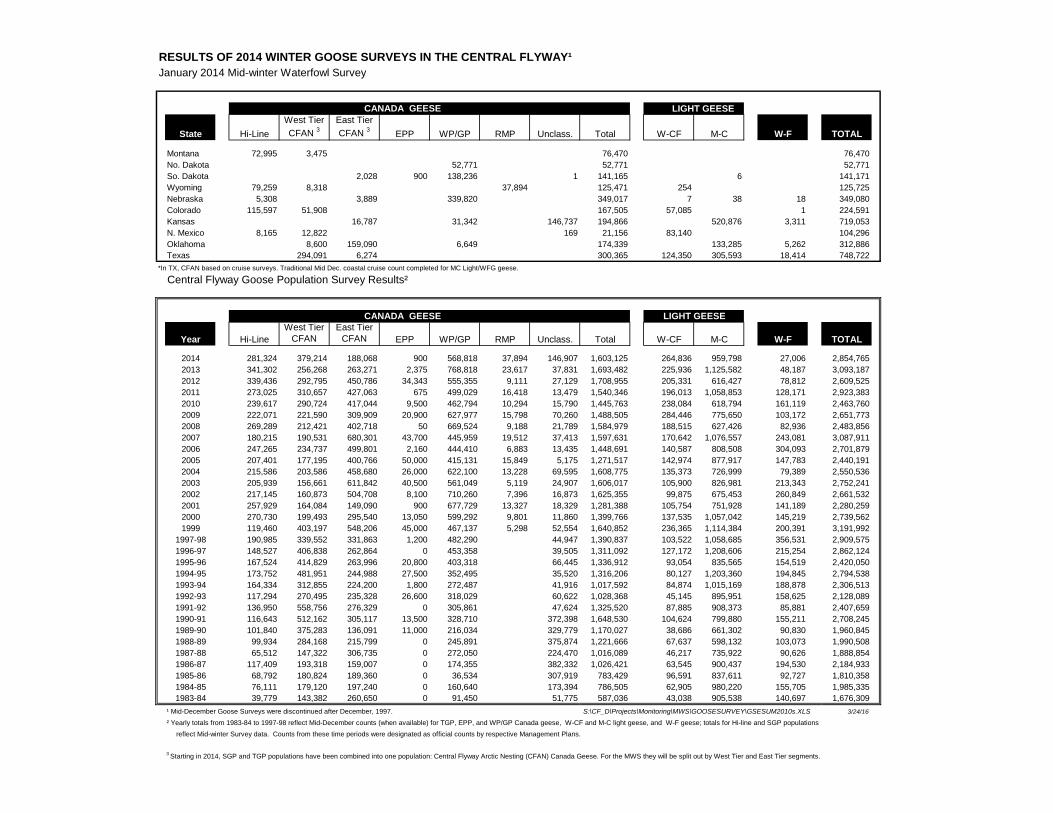
RESULTS OF 2014 WINTER GOOSE SURVEYS IN THE CENTRAL FLYWAY¹
January 2014 Mid-winter Waterfowl Survey
CANADA GEESE LIGHT GEESE
State Hi-LineWest Tier CFAN 3
East Tier CFAN 3 EPP WP/GP RMP Unclass. Total W-CF M-C W-F TOTAL
Montana 72,995 3,475 76,470 76,470No. Dakota 52,771 52,771 52,771So. Dakota 2,028 900 138,236 1 141,165 6 141,171Wyoming 79,259 8,318 37,894 125,471 254 125,725Nebraska 5,308 3,889 339,820 349,017 7 38 18 349,080Colorado 115,597 51,908 167,505 57,085 1 224,591Kansas 16,787 31,342 146,737 194,866 520,876 3,311 719,053N. Mexico 8,165 12,822 169 21,156 83,140 104,296Oklahoma 8,600 159,090 6,649 174,339 133,285 5,262 312,886Texas 294,091 6,274 300,365 124,350 305,593 18,414 748,722
*In TX, CFAN based on cruise surveys. Traditional Mid Dec. coastal cruise count completed for MC Light/WFG geese.
Central Flyway Goose Population Survey Results²
CANADA GEESE LIGHT GEESE
Year Hi-LineWest Tier
CFANEast Tier
CFAN EPP WP/GP RMP Unclass. Total W-CF M-C W-F TOTAL
2014 281,324 379,214 188,068 900 568,818 37,894 146,907 1,603,125 264,836 959,798 27,006 2,854,7652013 341,302 256,268 263,271 2,375 768,818 23,617 37,831 1,693,482 225,936 1,125,582 48,187 3,093,1872012 339,436 292,795 450,786 34,343 555,355 9,111 27,129 1,708,955 205,331 616,427 78,812 2,609,5252011 273,025 310,657 427,063 675 499,029 16,418 13,479 1,540,346 196,013 1,058,853 128,171 2,923,3832010 239,617 290,724 417,044 9,500 462,794 10,294 15,790 1,445,763 238,084 618,794 161,119 2,463,7602009 222,071 221,590 309,909 20,900 627,977 15,798 70,260 1,488,505 284,446 775,650 103,172 2,651,7732008 269,289 212,421 402,718 50 669,524 9,188 21,789 1,584,979 188,515 627,426 82,936 2,483,8562007 180,215 190,531 680,301 43,700 445,959 19,512 37,413 1,597,631 170,642 1,076,557 243,081 3,087,9112006 247,265 234,737 499,801 2,160 444,410 6,883 13,435 1,448,691 140,587 808,508 304,093 2,701,8792005 207,401 177,195 400,766 50,000 415,131 15,849 5,175 1,271,517 142,974 877,917 147,783 2,440,1912004 215,586 203,586 458,680 26,000 622,100 13,228 69,595 1,608,775 135,373 726,999 79,389 2,550,5362003 205,939 156,661 611,842 40,500 561,049 5,119 24,907 1,606,017 105,900 826,981 213,343 2,752,2412002 217,145 160,873 504,708 8,100 710,260 7,396 16,873 1,625,355 99,875 675,453 260,849 2,661,5322001 257,929 164,084 149,090 900 677,729 13,327 18,329 1,281,388 105,754 751,928 141,189 2,280,2592000 270,730 199,493 295,540 13,050 599,292 9,801 11,860 1,399,766 137,535 1,057,042 145,219 2,739,5621999 119,460 403,197 548,206 45,000 467,137 5,298 52,554 1,640,852 236,365 1,114,384 200,391 3,191,992
1997-98 190,985 339,552 331,863 1,200 482,290 44,947 1,390,837 103,522 1,058,685 356,531 2,909,5751996-97 148,527 406,838 262,864 0 453,358 39,505 1,311,092 127,172 1,208,606 215,254 2,862,1241995-96 167,524 414,829 263,996 20,800 403,318 66,445 1,336,912 93,054 835,565 154,519 2,420,0501994-95 173,752 481,951 244,988 27,500 352,495 35,520 1,316,206 80,127 1,203,360 194,845 2,794,5381993-94 164,334 312,855 224,200 1,800 272,487 41,916 1,017,592 84,874 1,015,169 188,878 2,306,5131992-93 117,294 270,495 235,328 26,600 318,029 60,622 1,028,368 45,145 895,951 158,625 2,128,0891991-92 136,950 558,756 276,329 0 305,861 47,624 1,325,520 87,885 908,373 85,881 2,407,6591990-91 116,643 512,162 305,117 13,500 328,710 372,398 1,648,530 104,624 799,880 155,211 2,708,2451989-90 101,840 375,283 136,091 11,000 216,034 329,779 1,170,027 38,686 661,302 90,830 1,960,8451988-89 99,934 284,168 215,799 0 245,891 375,874 1,221,666 67,637 598,132 103,073 1,990,5081987-88 65,512 147,322 306,735 0 272,050 224,470 1,016,089 46,217 735,922 90,626 1,888,8541986-87 117,409 193,318 159,007 0 174,355 382,332 1,026,421 63,545 900,437 194,530 2,184,9331985-86 68,792 180,824 189,360 0 36,534 307,919 783,429 96,591 837,611 92,727 1,810,3581984-85 76,111 179,120 197,240 0 160,640 173,394 786,505 62,905 980,220 155,705 1,985,3351983-84 39,779 143,382 260,650 0 91,450 51,775 587,036 43,038 905,538 140,697 1,676,309
¹ Mid-December Goose Surveys were discontinued after December, 1997. S:\CF_D\Projects\Monitoring\MWS\GOOSESURVEY\GSESUM2010s.XLS 3/24/16
² Yearly totals from 1983-84 to 1997-98 reflect Mid-December counts (when available) for TGP, EPP, and WP/GP Canada geese, W-CF and M-C light geese, and W-F geese; totals for Hi-line and SGP populations reflect Mid-winter Survey data. Counts from these time periods were designated as official counts by respective Management Plans.
3 Starting in 2014, SGP and TGP populations have been combined into one population: Central Flyway Arctic Nesting (CFAN) Canada Geese. For the MWS they will be split out by West Tier and East Tier segments.
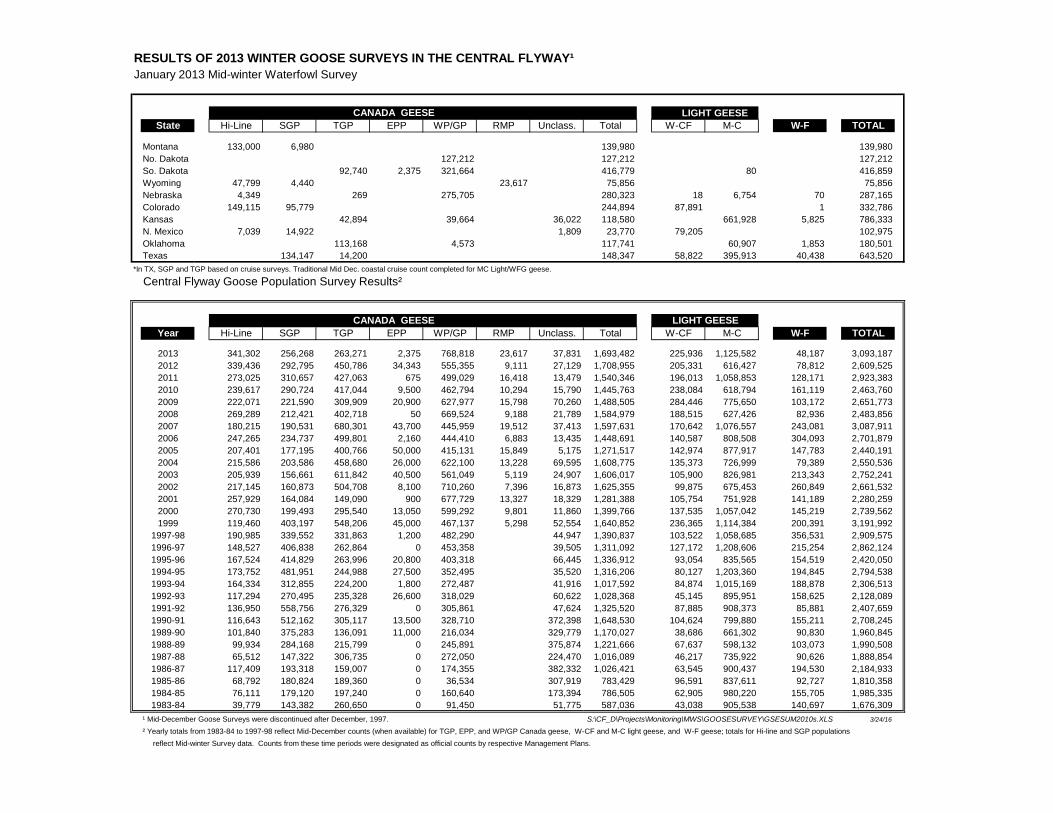
RESULTS OF 2013 WINTER GOOSE SURVEYS IN THE CENTRAL FLYWAY¹
January 2013 Mid-winter Waterfowl Survey
CANADA GEESE LIGHT GEESEState Hi-Line SGP TGP EPP WP/GP RMP Unclass. Total W-CF M-C W-F TOTAL
Montana 133,000 6,980 139,980 139,980No. Dakota 127,212 127,212 127,212So. Dakota 92,740 2,375 321,664 416,779 80 416,859Wyoming 47,799 4,440 23,617 75,856 75,856Nebraska 4,349 269 275,705 280,323 18 6,754 70 287,165Colorado 149,115 95,779 244,894 87,891 1 332,786Kansas 42,894 39,664 36,022 118,580 661,928 5,825 786,333N. Mexico 7,039 14,922 1,809 23,770 79,205 102,975Oklahoma 113,168 4,573 117,741 60,907 1,853 180,501Texas 134,147 14,200 148,347 58,822 395,913 40,438 643,520
*In TX, SGP and TGP based on cruise surveys. Traditional Mid Dec. coastal cruise count completed for MC Light/WFG geese.
Central Flyway Goose Population Survey Results²
CANADA GEESE LIGHT GEESEYear Hi-Line SGP TGP EPP WP/GP RMP Unclass. Total W-CF M-C W-F TOTAL
2013 341,302 256,268 263,271 2,375 768,818 23,617 37,831 1,693,482 225,936 1,125,582 48,187 3,093,1872012 339,436 292,795 450,786 34,343 555,355 9,111 27,129 1,708,955 205,331 616,427 78,812 2,609,5252011 273,025 310,657 427,063 675 499,029 16,418 13,479 1,540,346 196,013 1,058,853 128,171 2,923,3832010 239,617 290,724 417,044 9,500 462,794 10,294 15,790 1,445,763 238,084 618,794 161,119 2,463,7602009 222,071 221,590 309,909 20,900 627,977 15,798 70,260 1,488,505 284,446 775,650 103,172 2,651,7732008 269,289 212,421 402,718 50 669,524 9,188 21,789 1,584,979 188,515 627,426 82,936 2,483,8562007 180,215 190,531 680,301 43,700 445,959 19,512 37,413 1,597,631 170,642 1,076,557 243,081 3,087,9112006 247,265 234,737 499,801 2,160 444,410 6,883 13,435 1,448,691 140,587 808,508 304,093 2,701,8792005 207,401 177,195 400,766 50,000 415,131 15,849 5,175 1,271,517 142,974 877,917 147,783 2,440,1912004 215,586 203,586 458,680 26,000 622,100 13,228 69,595 1,608,775 135,373 726,999 79,389 2,550,5362003 205,939 156,661 611,842 40,500 561,049 5,119 24,907 1,606,017 105,900 826,981 213,343 2,752,2412002 217,145 160,873 504,708 8,100 710,260 7,396 16,873 1,625,355 99,875 675,453 260,849 2,661,5322001 257,929 164,084 149,090 900 677,729 13,327 18,329 1,281,388 105,754 751,928 141,189 2,280,2592000 270,730 199,493 295,540 13,050 599,292 9,801 11,860 1,399,766 137,535 1,057,042 145,219 2,739,5621999 119,460 403,197 548,206 45,000 467,137 5,298 52,554 1,640,852 236,365 1,114,384 200,391 3,191,992
1997-98 190,985 339,552 331,863 1,200 482,290 44,947 1,390,837 103,522 1,058,685 356,531 2,909,5751996-97 148,527 406,838 262,864 0 453,358 39,505 1,311,092 127,172 1,208,606 215,254 2,862,1241995-96 167,524 414,829 263,996 20,800 403,318 66,445 1,336,912 93,054 835,565 154,519 2,420,0501994-95 173,752 481,951 244,988 27,500 352,495 35,520 1,316,206 80,127 1,203,360 194,845 2,794,5381993-94 164,334 312,855 224,200 1,800 272,487 41,916 1,017,592 84,874 1,015,169 188,878 2,306,5131992-93 117,294 270,495 235,328 26,600 318,029 60,622 1,028,368 45,145 895,951 158,625 2,128,0891991-92 136,950 558,756 276,329 0 305,861 47,624 1,325,520 87,885 908,373 85,881 2,407,6591990-91 116,643 512,162 305,117 13,500 328,710 372,398 1,648,530 104,624 799,880 155,211 2,708,2451989-90 101,840 375,283 136,091 11,000 216,034 329,779 1,170,027 38,686 661,302 90,830 1,960,8451988-89 99,934 284,168 215,799 0 245,891 375,874 1,221,666 67,637 598,132 103,073 1,990,5081987-88 65,512 147,322 306,735 0 272,050 224,470 1,016,089 46,217 735,922 90,626 1,888,8541986-87 117,409 193,318 159,007 0 174,355 382,332 1,026,421 63,545 900,437 194,530 2,184,9331985-86 68,792 180,824 189,360 0 36,534 307,919 783,429 96,591 837,611 92,727 1,810,3581984-85 76,111 179,120 197,240 0 160,640 173,394 786,505 62,905 980,220 155,705 1,985,3351983-84 39,779 143,382 260,650 0 91,450 51,775 587,036 43,038 905,538 140,697 1,676,309
¹ Mid-December Goose Surveys were discontinued after December, 1997. S:\CF_D\Projects\Monitoring\MWS\GOOSESURVEY\GSESUM2010s.XLS 3/24/16
² Yearly totals from 1983-84 to 1997-98 reflect Mid-December counts (when available) for TGP, EPP, and WP/GP Canada geese, W-CF and M-C light geese, and W-F geese; totals for Hi-line and SGP populations reflect Mid-winter Survey data. Counts from these time periods were designated as official counts by respective Management Plans.

RESULTS OF 2012 WINTER GOOSE SURVEYS IN THE CENTRAL FLYWAY¹
January 2012 Mid-winter Waterfowl Survey
CANADA GEESE LIGHT GEESEState Hi-Line SGP TGP EPP WP/GP RMP Unclass. Total W-CF M-C W-F TOTAL
Montana 161,700 8,510 170,210 17 170,227No. Dakota 19,387 170,410 400 190,197 19 190,216So. Dakota 101,575 30,588 174,462 306,625 1,896 308,521Wyoming 38,762 3,738 9,111 51,611 17 51,628Nebraska 1,623 1,200 4,441 177,757 185,021 33 30,093 35 215,182Colorado 131,080 93,968 225,048 51,409 276,457Kansas 7,952 3,755 27,173 26,505 65,385 183,161 9,910 258,456N. Mexico 6,271 15,671 224 22,166 65,650 87,816Oklahoma 250,110 5,553 255,663 106,920 1,523 364,106Texas 169,708 67,321 237,029 88,205 294,338 67,344 686,916
*In TX, SGP and TGP based on cruise surveys. Traditional Mid Dec. coastal cruise count completed for MC Light/WFG geese.
Central Flyway Goose Population Survey Results²
CANADA GEESE LIGHT GEESEYear Hi-Line SGP TGP EPP WP/GP RMP Unclass. Total W-CF M-C W-F TOTAL
2012 339,436 292,795 450,786 34,343 555,355 9,111 27,129 1,708,955 205,331 616,427 78,812 2,609,5252011 273,025 310,657 427,063 675 499,029 16,418 13,479 1,540,346 196,013 1,058,853 128,171 2,923,3832010 239,617 290,724 417,044 9,500 462,794 10,294 15,790 1,445,763 238,084 618,794 161,119 2,463,7602009 222,071 221,590 309,909 20,900 627,977 15,798 70,260 1,488,505 284,446 775,650 103,172 2,651,7732008 269,289 212,421 402,718 50 669,524 9,188 21,789 1,584,979 188,515 627,426 82,936 2,483,8562007 180,215 190,531 680,301 43,700 445,959 19,512 37,413 1,597,631 170,642 1,076,557 243,081 3,087,9112006 247,265 234,737 499,801 2,160 444,410 6,883 13,435 1,448,691 140,587 808,508 304,093 2,701,8792005 207,401 177,195 400,766 50,000 415,131 15,849 5,175 1,271,517 142,974 877,917 147,783 2,440,1912004 215,586 203,586 458,680 26,000 622,100 13,228 69,595 1,608,775 135,373 726,999 79,389 2,550,5362003 205,939 156,661 611,842 40,500 561,049 5,119 24,907 1,606,017 105,900 826,981 213,343 2,752,2412002 217,145 160,873 504,708 8,100 710,260 7,396 16,873 1,625,355 99,875 675,453 260,849 2,661,5322001 257,929 164,084 149,090 900 677,729 13,327 18,329 1,281,388 105,754 751,928 141,189 2,280,2592000 270,730 199,493 295,540 13,050 599,292 9,801 11,860 1,399,766 137,535 1,057,042 145,219 2,739,5621999 119,460 403,197 548,206 45,000 467,137 5,298 52,554 1,640,852 236,365 1,114,384 200,391 3,191,992
1997-98 190,985 339,552 331,863 1,200 482,290 44,947 1,390,837 103,522 1,058,685 356,531 2,909,5751996-97 148,527 406,838 262,864 0 453,358 39,505 1,311,092 127,172 1,208,606 215,254 2,862,1241995-96 167,524 414,829 263,996 20,800 403,318 66,445 1,336,912 93,054 835,565 154,519 2,420,0501994-95 173,752 481,951 244,988 27,500 352,495 35,520 1,316,206 80,127 1,203,360 194,845 2,794,5381993-94 164,334 312,855 224,200 1,800 272,487 41,916 1,017,592 84,874 1,015,169 188,878 2,306,5131992-93 117,294 270,495 235,328 26,600 318,029 60,622 1,028,368 45,145 895,951 158,625 2,128,0891991-92 136,950 558,756 276,329 0 305,861 47,624 1,325,520 87,885 908,373 85,881 2,407,6591990-91 116,643 512,162 305,117 13,500 328,710 372,398 1,648,530 104,624 799,880 155,211 2,708,2451989-90 101,840 375,283 136,091 11,000 216,034 329,779 1,170,027 38,686 661,302 90,830 1,960,8451988-89 99,934 284,168 215,799 0 245,891 375,874 1,221,666 67,637 598,132 103,073 1,990,5081987-88 65,512 147,322 306,735 0 272,050 224,470 1,016,089 46,217 735,922 90,626 1,888,8541986-87 117,409 193,318 159,007 0 174,355 382,332 1,026,421 63,545 900,437 194,530 2,184,9331985-86 68,792 180,824 189,360 0 36,534 307,919 783,429 96,591 837,611 92,727 1,810,3581984-85 76,111 179,120 197,240 0 160,640 173,394 786,505 62,905 980,220 155,705 1,985,3351983-84 39,779 143,382 260,650 0 91,450 51,775 587,036 43,038 905,538 140,697 1,676,309
¹ Mid-December Goose Surveys were discontinued after December, 1997. S:\CF_D\Projects\Monitoring\MWS\GOOSESURVEY\GSESUM2010s.XLS 3/24/16
² Yearly totals from 1983-84 to 1997-98 reflect Mid-December counts (when available) for TGP, EPP, and WP/GP Canada geese, W-CF and M-C light geese, and W-F geese; totals for Hi-line and SGP populations reflect Mid-winter Survey data. Counts from these time periods were designated as official counts by respective Management Plans.
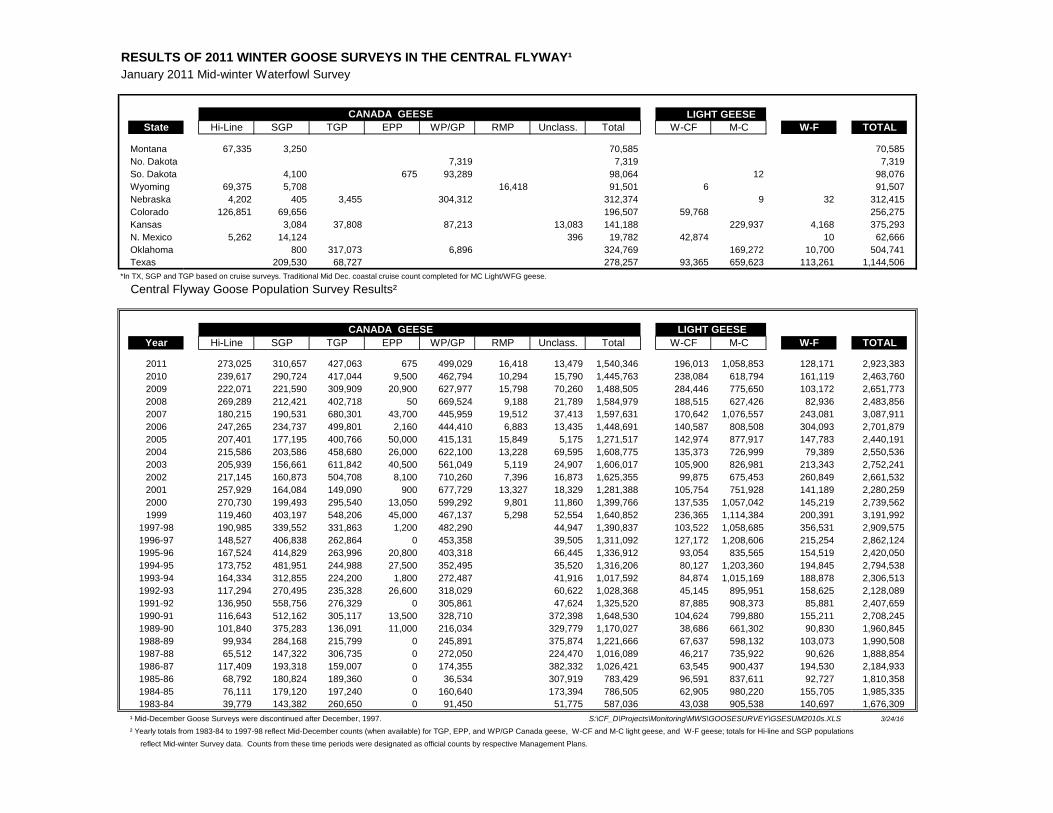
RESULTS OF 2011 WINTER GOOSE SURVEYS IN THE CENTRAL FLYWAY¹
January 2011 Mid-winter Waterfowl Survey
CANADA GEESE LIGHT GEESEState Hi-Line SGP TGP EPP WP/GP RMP Unclass. Total W-CF M-C W-F TOTAL
Montana 67,335 3,250 70,585 70,585No. Dakota 7,319 7,319 7,319So. Dakota 4,100 675 93,289 98,064 12 98,076Wyoming 69,375 5,708 16,418 91,501 6 91,507Nebraska 4,202 405 3,455 304,312 312,374 9 32 312,415Colorado 126,851 69,656 196,507 59,768 256,275Kansas 3,084 37,808 87,213 13,083 141,188 229,937 4,168 375,293N. Mexico 5,262 14,124 396 19,782 42,874 10 62,666Oklahoma 800 317,073 6,896 324,769 169,272 10,700 504,741Texas 209,530 68,727 278,257 93,365 659,623 113,261 1,144,506
*In TX, SGP and TGP based on cruise surveys. Traditional Mid Dec. coastal cruise count completed for MC Light/WFG geese.
Central Flyway Goose Population Survey Results²
CANADA GEESE LIGHT GEESEYear Hi-Line SGP TGP EPP WP/GP RMP Unclass. Total W-CF M-C W-F TOTAL
2011 273,025 310,657 427,063 675 499,029 16,418 13,479 1,540,346 196,013 1,058,853 128,171 2,923,3832010 239,617 290,724 417,044 9,500 462,794 10,294 15,790 1,445,763 238,084 618,794 161,119 2,463,7602009 222,071 221,590 309,909 20,900 627,977 15,798 70,260 1,488,505 284,446 775,650 103,172 2,651,7732008 269,289 212,421 402,718 50 669,524 9,188 21,789 1,584,979 188,515 627,426 82,936 2,483,8562007 180,215 190,531 680,301 43,700 445,959 19,512 37,413 1,597,631 170,642 1,076,557 243,081 3,087,9112006 247,265 234,737 499,801 2,160 444,410 6,883 13,435 1,448,691 140,587 808,508 304,093 2,701,8792005 207,401 177,195 400,766 50,000 415,131 15,849 5,175 1,271,517 142,974 877,917 147,783 2,440,1912004 215,586 203,586 458,680 26,000 622,100 13,228 69,595 1,608,775 135,373 726,999 79,389 2,550,5362003 205,939 156,661 611,842 40,500 561,049 5,119 24,907 1,606,017 105,900 826,981 213,343 2,752,2412002 217,145 160,873 504,708 8,100 710,260 7,396 16,873 1,625,355 99,875 675,453 260,849 2,661,5322001 257,929 164,084 149,090 900 677,729 13,327 18,329 1,281,388 105,754 751,928 141,189 2,280,2592000 270,730 199,493 295,540 13,050 599,292 9,801 11,860 1,399,766 137,535 1,057,042 145,219 2,739,5621999 119,460 403,197 548,206 45,000 467,137 5,298 52,554 1,640,852 236,365 1,114,384 200,391 3,191,992
1997-98 190,985 339,552 331,863 1,200 482,290 44,947 1,390,837 103,522 1,058,685 356,531 2,909,5751996-97 148,527 406,838 262,864 0 453,358 39,505 1,311,092 127,172 1,208,606 215,254 2,862,1241995-96 167,524 414,829 263,996 20,800 403,318 66,445 1,336,912 93,054 835,565 154,519 2,420,0501994-95 173,752 481,951 244,988 27,500 352,495 35,520 1,316,206 80,127 1,203,360 194,845 2,794,5381993-94 164,334 312,855 224,200 1,800 272,487 41,916 1,017,592 84,874 1,015,169 188,878 2,306,5131992-93 117,294 270,495 235,328 26,600 318,029 60,622 1,028,368 45,145 895,951 158,625 2,128,0891991-92 136,950 558,756 276,329 0 305,861 47,624 1,325,520 87,885 908,373 85,881 2,407,6591990-91 116,643 512,162 305,117 13,500 328,710 372,398 1,648,530 104,624 799,880 155,211 2,708,2451989-90 101,840 375,283 136,091 11,000 216,034 329,779 1,170,027 38,686 661,302 90,830 1,960,8451988-89 99,934 284,168 215,799 0 245,891 375,874 1,221,666 67,637 598,132 103,073 1,990,5081987-88 65,512 147,322 306,735 0 272,050 224,470 1,016,089 46,217 735,922 90,626 1,888,8541986-87 117,409 193,318 159,007 0 174,355 382,332 1,026,421 63,545 900,437 194,530 2,184,9331985-86 68,792 180,824 189,360 0 36,534 307,919 783,429 96,591 837,611 92,727 1,810,3581984-85 76,111 179,120 197,240 0 160,640 173,394 786,505 62,905 980,220 155,705 1,985,3351983-84 39,779 143,382 260,650 0 91,450 51,775 587,036 43,038 905,538 140,697 1,676,309
¹ Mid-December Goose Surveys were discontinued after December, 1997. S:\CF_D\Projects\Monitoring\MWS\GOOSESURVEY\GSESUM2010s.XLS 3/24/16
² Yearly totals from 1983-84 to 1997-98 reflect Mid-December counts (when available) for TGP, EPP, and WP/GP Canada geese, W-CF and M-C light geese, and W-F geese; totals for Hi-line and SGP populations reflect Mid-winter Survey data. Counts from these time periods were designated as official counts by respective Management Plans.
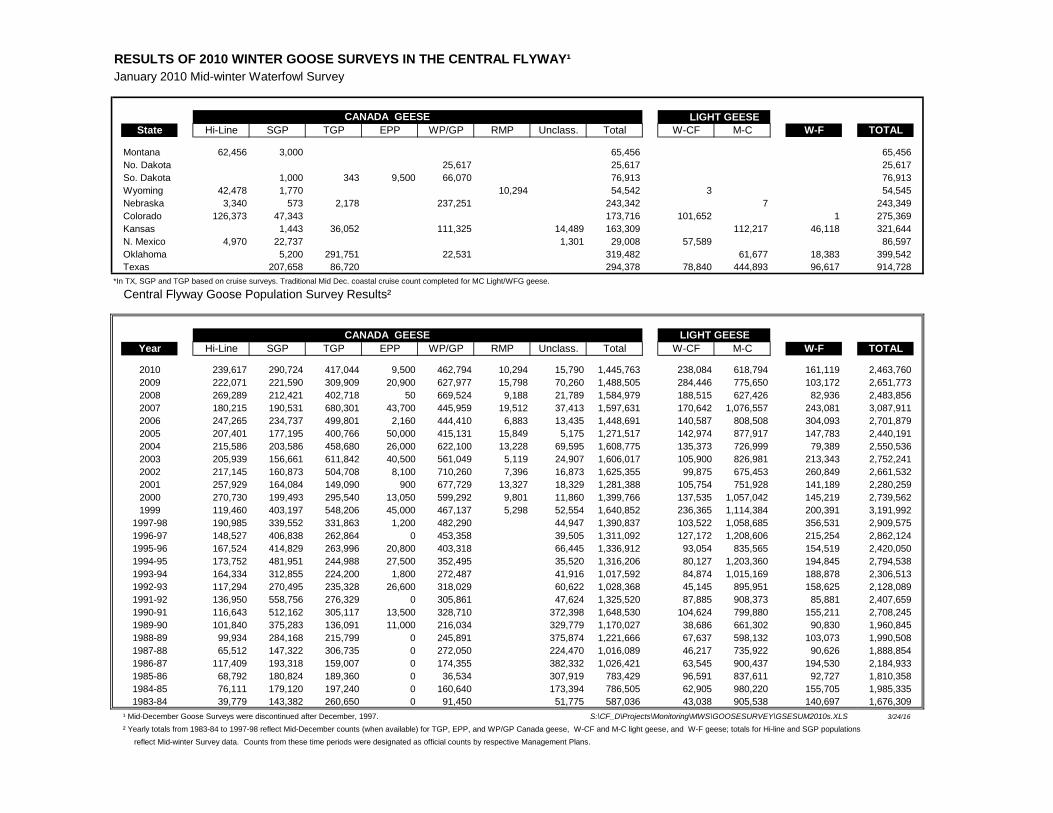
RESULTS OF 2010 WINTER GOOSE SURVEYS IN THE CENTRAL FLYWAY¹
January 2010 Mid-winter Waterfowl Survey
CANADA GEESE LIGHT GEESEState Hi-Line SGP TGP EPP WP/GP RMP Unclass. Total W-CF M-C W-F TOTAL
Montana 62,456 3,000 65,456 65,456No. Dakota 25,617 25,617 25,617So. Dakota 1,000 343 9,500 66,070 76,913 76,913Wyoming 42,478 1,770 10,294 54,542 3 54,545Nebraska 3,340 573 2,178 237,251 243,342 7 243,349Colorado 126,373 47,343 173,716 101,652 1 275,369Kansas 1,443 36,052 111,325 14,489 163,309 112,217 46,118 321,644N. Mexico 4,970 22,737 1,301 29,008 57,589 86,597Oklahoma 5,200 291,751 22,531 319,482 61,677 18,383 399,542Texas 207,658 86,720 294,378 78,840 444,893 96,617 914,728
*In TX, SGP and TGP based on cruise surveys. Traditional Mid Dec. coastal cruise count completed for MC Light/WFG geese.
Central Flyway Goose Population Survey Results²
CANADA GEESE LIGHT GEESEYear Hi-Line SGP TGP EPP WP/GP RMP Unclass. Total W-CF M-C W-F TOTAL
2010 239,617 290,724 417,044 9,500 462,794 10,294 15,790 1,445,763 238,084 618,794 161,119 2,463,7602009 222,071 221,590 309,909 20,900 627,977 15,798 70,260 1,488,505 284,446 775,650 103,172 2,651,7732008 269,289 212,421 402,718 50 669,524 9,188 21,789 1,584,979 188,515 627,426 82,936 2,483,8562007 180,215 190,531 680,301 43,700 445,959 19,512 37,413 1,597,631 170,642 1,076,557 243,081 3,087,9112006 247,265 234,737 499,801 2,160 444,410 6,883 13,435 1,448,691 140,587 808,508 304,093 2,701,8792005 207,401 177,195 400,766 50,000 415,131 15,849 5,175 1,271,517 142,974 877,917 147,783 2,440,1912004 215,586 203,586 458,680 26,000 622,100 13,228 69,595 1,608,775 135,373 726,999 79,389 2,550,5362003 205,939 156,661 611,842 40,500 561,049 5,119 24,907 1,606,017 105,900 826,981 213,343 2,752,2412002 217,145 160,873 504,708 8,100 710,260 7,396 16,873 1,625,355 99,875 675,453 260,849 2,661,5322001 257,929 164,084 149,090 900 677,729 13,327 18,329 1,281,388 105,754 751,928 141,189 2,280,2592000 270,730 199,493 295,540 13,050 599,292 9,801 11,860 1,399,766 137,535 1,057,042 145,219 2,739,5621999 119,460 403,197 548,206 45,000 467,137 5,298 52,554 1,640,852 236,365 1,114,384 200,391 3,191,992
1997-98 190,985 339,552 331,863 1,200 482,290 44,947 1,390,837 103,522 1,058,685 356,531 2,909,5751996-97 148,527 406,838 262,864 0 453,358 39,505 1,311,092 127,172 1,208,606 215,254 2,862,1241995-96 167,524 414,829 263,996 20,800 403,318 66,445 1,336,912 93,054 835,565 154,519 2,420,0501994-95 173,752 481,951 244,988 27,500 352,495 35,520 1,316,206 80,127 1,203,360 194,845 2,794,5381993-94 164,334 312,855 224,200 1,800 272,487 41,916 1,017,592 84,874 1,015,169 188,878 2,306,5131992-93 117,294 270,495 235,328 26,600 318,029 60,622 1,028,368 45,145 895,951 158,625 2,128,0891991-92 136,950 558,756 276,329 0 305,861 47,624 1,325,520 87,885 908,373 85,881 2,407,6591990-91 116,643 512,162 305,117 13,500 328,710 372,398 1,648,530 104,624 799,880 155,211 2,708,2451989-90 101,840 375,283 136,091 11,000 216,034 329,779 1,170,027 38,686 661,302 90,830 1,960,8451988-89 99,934 284,168 215,799 0 245,891 375,874 1,221,666 67,637 598,132 103,073 1,990,5081987-88 65,512 147,322 306,735 0 272,050 224,470 1,016,089 46,217 735,922 90,626 1,888,8541986-87 117,409 193,318 159,007 0 174,355 382,332 1,026,421 63,545 900,437 194,530 2,184,9331985-86 68,792 180,824 189,360 0 36,534 307,919 783,429 96,591 837,611 92,727 1,810,3581984-85 76,111 179,120 197,240 0 160,640 173,394 786,505 62,905 980,220 155,705 1,985,3351983-84 39,779 143,382 260,650 0 91,450 51,775 587,036 43,038 905,538 140,697 1,676,309
¹ Mid-December Goose Surveys were discontinued after December, 1997. S:\CF_D\Projects\Monitoring\MWS\GOOSESURVEY\GSESUM2010s.XLS 3/24/16
² Yearly totals from 1983-84 to 1997-98 reflect Mid-December counts (when available) for TGP, EPP, and WP/GP Canada geese, W-CF and M-C light geese, and W-F geese; totals for Hi-line and SGP populations reflect Mid-winter Survey data. Counts from these time periods were designated as official counts by respective Management Plans.

RESULTS OF 2009 WINTER GOOSE SURVEYS IN THE CENTRAL FLYWAY¹
January 2009 Mid-winter Waterfowl Survey
CANADA GEESE LIGHT GEESEState Hi-Line SGP TGP EPP WP/GP RMP Unclass. Total W-CF M-C W-F TOTAL
Montana 59,765 2,860 62,625 62,625No. Dakota 9,726 9,726 9,726So. Dakota 3,300 5,410 18,500 171,355 198,565 8 198,573Wyoming 42,157 4,169 15,798 62,124 4 62,128Nebraska 5,491 115 2,722 314,826 323,154 24 33 323,211Colorado 108,462 66,949 175,411 154,736 1 330,148Kansas 5,501 65,470 2,400 114,273 68,651 256,295 366,701 63,273 686,269N. Mexico 6,196 21,749 1,609 29,554 55,038 8 84,600Oklahoma 201,540 17,797 219,337 45,202 3,567 268,106Texas 116,947 34,767 151,714 74,668 363,715 36,290 626,387
*In TX, SGP and TGP based on cruise surveys. Traditional Mid Dec. coastal cruise count completed for MC Light/WFG geese.
Central Flyway Goose Population Survey Results²
CANADA GEESE LIGHT GEESEYear Hi-Line SGP TGP EPP WP/GP RMP Unclass. Total W-CF M-C W-F TOTAL
2009 222,071 221,590 309,909 20,900 627,977 15,798 70,260 1,488,505 284,446 775,650 103,172 2,651,7732008 269,289 212,421 402,718 50 669,524 9,188 21,789 1,584,979 188,515 627,426 82,936 2,483,8562007 180,215 190,531 680,301 43,700 445,959 19,512 37,413 1,597,631 170,642 1,076,557 243,081 3,087,9112006 247,265 234,737 499,801 2,160 444,410 6,883 13,435 1,448,691 140,587 808,508 304,093 2,701,8792005 207,401 177,195 400,766 50,000 415,131 15,849 5,175 1,271,517 142,974 877,917 147,783 2,440,1912004 215,586 203,586 458,680 26,000 622,100 13,228 69,595 1,608,775 135,373 726,999 79,389 2,550,5362003 205,939 156,661 611,842 40,500 561,049 5,119 24,907 1,606,017 105,900 826,981 213,343 2,752,2412002 217,145 160,873 504,708 8,100 710,260 7,396 16,873 1,625,355 99,875 675,453 260,849 2,661,5322001 257,929 164,084 149,090 900 677,729 13,327 18,329 1,281,388 105,754 751,928 141,189 2,280,2592000 270,730 199,493 295,540 13,050 599,292 9,801 11,860 1,399,766 137,535 1,057,042 145,219 2,739,5621999 119,460 403,197 548,206 45,000 467,137 5,298 52,554 1,640,852 236,365 1,114,384 200,391 3,191,992
1997-98 190,985 339,552 331,863 1,200 482,290 44,947 1,390,837 103,522 1,058,685 356,531 2,909,5751996-97 148,527 406,838 262,864 0 453,358 39,505 1,311,092 127,172 1,208,606 215,254 2,862,1241995-96 167,524 414,829 263,996 20,800 403,318 66,445 1,336,912 93,054 835,565 154,519 2,420,0501994-95 173,752 481,951 244,988 27,500 352,495 35,520 1,316,206 80,127 1,203,360 194,845 2,794,5381993-94 164,334 312,855 224,200 1,800 272,487 41,916 1,017,592 84,874 1,015,169 188,878 2,306,5131992-93 117,294 270,495 235,328 26,600 318,029 60,622 1,028,368 45,145 895,951 158,625 2,128,0891991-92 136,950 558,756 276,329 0 305,861 47,624 1,325,520 87,885 908,373 85,881 2,407,6591990-91 116,643 512,162 305,117 13,500 328,710 372,398 1,648,530 104,624 799,880 155,211 2,708,2451989-90 101,840 375,283 136,091 11,000 216,034 329,779 1,170,027 38,686 661,302 90,830 1,960,8451988-89 99,934 284,168 215,799 0 245,891 375,874 1,221,666 67,637 598,132 103,073 1,990,5081987-88 65,512 147,322 306,735 0 272,050 224,470 1,016,089 46,217 735,922 90,626 1,888,8541986-87 117,409 193,318 159,007 0 174,355 382,332 1,026,421 63,545 900,437 194,530 2,184,9331985-86 68,792 180,824 189,360 0 36,534 307,919 783,429 96,591 837,611 92,727 1,810,3581984-85 76,111 179,120 197,240 0 160,640 173,394 786,505 62,905 980,220 155,705 1,985,3351983-84 39,779 143,382 260,650 0 91,450 51,775 587,036 43,038 905,538 140,697 1,676,309
¹ Mid-December Goose Surveys were discontinued after December, 1997. S:\CF_D\projects\Monitoring\MWS\GOOSESURVEY\GSESUM2000s.XLS 3/24/16
² Yearly totals from 1983-84 to 1997-98 reflect Mid-December counts (when available) for TGP, EPP, and WP/GP Canada geese, W-CF and M-C light geese, and W-F geese; totals for Hi-line and SGP populations reflect Mid-winter Survey data. Counts from these time periods were designated as official counts by respective Management Plans.