Embed Size (px)
Citation preview
v . .
ELSEVIER Information & Management 31 (1997) 303-317
Research
Centralization/decentralization cycles in computing: Market evidence a *
D . A . P e a k ' , M.H. A z a d m a n e s h b
" Center for Management of Information Technology and Department of Information Systems and Quantitative Analysis. University of Nebraska at Omaha, Omaha, NE 68182, USA
b Center for Management of Information Technology and Department of Computer Science. Universi~" of Nebraska at Omaha, Omaha, NE 68182. USA
Abstract
Strategies concerning centralized and decentralized commercial computing have been major issues for more than two decades. Using longitudinal sales data consolidated into three major computer categories (mainframes, minicomputers, and microcomputers), we investigate whether historical market data show evidence of centralization and decentralization. Our finding of cyclic behavior leads us to conclude that computing sales data exhibits broadly cyclic characteristics. We suggest that computing strategies oscillate unevenly between domination of centralization and decentralization, and that commercial computing has already experienced two centralization/decentralization cycles. Currently, computing is nearing the end Of the second cycle's decentralization period and is at the threshold of centralization in a third cycle. (C 1997 Elsevier Science B.V.
Keywords." Centralized computing; Centralization; Decentralization; Cyclic behavior; Computer sales; Computer markets; Client/server
1. Introduct ion
Strategies concerning centralized and decentralized commercial computing have been major issues for managers, professionals, and researchers for more than two decades. Commercial computing began in the late 1950s as a centralized phenomenon that exclusively featured large, expensive mainframe com- puter systems. In the 1970s, computer manufacturers were marketing smaller, more inexpensive minicom- puters that could be networked with each other or with mainframes [25]. Employing a new, decentralized strategy called Distributed Data Processing (DDP),
*Corresponding author. Tel.: 0014025543975; fax: 001402/ 5543747; e-mail: [email protected].
0378-7206/97/$17.00 ~ 1997 Elsevier Science B.V. All rights reserved PH S-0378-7206(97)00002-5
companies often found it desirable to place minicom- puters in district locations while retaining a central computer at the main site [2]. Since then, interest in centralized strategies that support enterprise databases [13, 23, 35], in decentralized client-server computing [37], and in mixed concepts such as Information Resource Management [34] have been prominent topics in both the trade and academic computing literature.
This paper uses the terms 'computer centralization' and 'computer decentralization' to denote the centra- lization and decentralization, respectively, of the broad spectrum of computing resources. Computing resources include human computer resources, compu- ters of all kinds, associated secondary storage devices, information resources, and communications.
304 D.A. Peak, M.H. Azadmanesh /Information & Management 31 (1997) 303-317
A large number of activities and concerns confront- ing IT managers either directly or indirectly involve aspects of centralization and decentralization. MIS literature documents the importance of these issues, but also appears to emphasize centralization and decentralization issues during different periods. Examples include the many flavors of end-user com- puting [1, 20], control and security issues [3, 9, 27], financial and cost-control issues [26, 31], and infra- structure issues [5, 30]. While we chose not to count the number of centralization-related IS articles, we readily observed that centralization emphasis shifts based on changes in technology. We also noticed that the trade publications respond more quickly to new developments than do the refereed, research-oriented journals.
Market information may also contain evidence of centralization and decentralization trends in addition to shifts in emphasis. Analysis and interpretation of market information is essential to business viability in a free-market economy [ 11, 24]. Using the market as an efficient information source has been firmly estab- lished as the basis for contemporary financial analysis [17, 19]. There is a strong support confirming that managerial decisions are both influenced by market information and can be measured using market infor- mation [16, 22]. Based on these principles, we inves- tigated whether historical market information - specifically computer sales information - comple- ments the computing literature regarding issues of centralization and decentralization. We speculated that since both the historical trade publications and the MIS literature appear to emphasize centralization and decentralization issues at different times, that trends and shifts in emphasis - i.e. dominance - may also be mirrored in the computer market infor- mation.
2. Methodology
We examined data concerning computer product sales and market share. Sales growth and market share are indicators of product demand. Relative increases in both sales and market share of competing industry product areas characterize the viability of the product and its relative predominance over competing pro- ducts [38]. We collected historical U.S. computer sales
data and estimates of the past 36 years for a variety of computer types, seeking trends and other indicators of market performance. Computer types include: (1) supercomputers, (2) mainframe computers, (3) mini- computers, (4) microcomputers, (5) desktop worksta- tions, (6) word-processing computers, and others. Our sources cover a wide variety of period books dealing with the computer markets, industrial survey publica- tions, information from trade publications, and infor- mation from subscribed consulting services [18]. We also collected historical information on sales of com- puting services, such as information services, tele- communications services, and networking services.
Next, we combined the data into categories, con- structing a consolidated time series for three major computer types: mainframe computers, minicompu- ters, and microcomputers. Extended, quality, long- itudinal sales information suitable for this study was found only in these three categories. In the specialized supercomputer area, historical sales information is uneven in quality, is discontinuous, and represents a comparatively small share of the computer market, so we were forced to omit it from the 36-year time series to avoid unnecessary inconsistencies. In addition, we found information on mid-range, minicomputers, and super-minicomputers occasionally reported separately or in various combinations, so we report them as the group: minicomputers. Similarly, workstations, perso- nal computers, microcomputers, and word processors are also frequently categorized and reported ambigu- ously, so we report them as the group: microcompu- ters.
For the time series analysis, we sought information consistency where computers were divided by class and where researchers collected information by con- sistent methods. Primary sources of information included the U.S. Industrial Outlook (USIO) [36] and the Computer and Business Equipment Industry Marketing Book Association (CBEMA) [6, 7]. The CBEMA information contained the more internally consistent measures of sales categories, while the USIO offered the more contemporaneous insight into emerging computer categories and the better explana- tions of sales information. We used selected proprie- tary information from the Gartner Group, in addition to numerous other sources, as discussed later.
During our examination of the computer sales data, it became evident that industry researchers experi-
D.A. Peak, M.H. Azadmanesh/lnformation & Management 31 (1997) 303-317 305
enced difficulty in determining just what to measure as they collected technology-related information. For example, the USIO unevenly reports computer ship- ments of various kinds over the past three and half decades. During the 1960s and 1970s, USIO combined reports of computing with electronics products. Elec- tronic calculators were once a major computer classi- fication during the early 1980s - but no more. Similarly, word processing computers of the middle 1980s now have lost their identity as a computer category, having been absorbed into the personal computer classification. Finally, because information on sales of information services has been collected and reported only within the last 10 years, we did not directly include it as a separate series in the 36-year series set. Networking products present a similar problem. However, we do account for these effects in our findings and conclusions.
Preparing computer sales information for analysis posed challenges. Computer sales information col- lected and reported by multiple agencies could vary by as much as 40 percent. To fill in voids and/or tie data from different agencies together, we collected overlapping information from multiple sources and adjusted the time series using CBEMA and USIO figures as baseline. The data were analyzed using standard statistical tools available with Microsoft Excel 7.0 for Windows 95.
In the three categories, we interpret the rapid growth of computer sales and relatively large computer market share to indicate high industry importance (dominance), whereas flat or declining growth and share indicate neutral or lower impor- tance (non-dominance). We analyze both the growth trends of the sales series (e.g. regression line slope) and the trends within the series (e.g. residual behavior) using piecewise Ordinary Least Squares linear regression. Within the series, analysis of resi- duals may reveal trends, but it also filters out the overall growth rate of that series. Therefore, we 'add" the growth (regression line slope) to the residual trends later.
We began our analysis by examining both nominal sales data and adjusted sales data. The nominal data provide a useful beginning for the analysis, but even more insightful is sales information that we adjusted to constant-dollar valuation using the Consumer Price Index (CPI). The CPI measures changes in prices for a
market basket of over 400 goods and services sampled from 56 cities throughout the US. The CPI is calcu- lated and reported by the U.S. Council of Economic Advisors. Over time, it is one of the most reliable sources of price information available [24]. We chose the CPI over indices and inflation measures for a number of reasons. First, there was no significant difference in effect when applying the CPI or other economic measures over the 36-year period. Second, the CPI measures changes in prices of services, as well as goods. In addition to these reasons, because com- puter services are now an important part of the com- puter market considered in this paper and because microcomputers are important consumer items, we use the CPI as the standard inflator/deflator over the 36-year period.
By adjusting for inflation, we obtain a near-equal basis for comparing sales data from different periods. Adjusting sales with the CPI provides a benchmark view of dollar amounts with many inflationary trends filtered out. We adjust sales by using the historical mid-year CPI for all items, not seasonally-adjusted, as reported by the Federal Reserve Bank of Chicago. CPI information can be found in the Economic Indicators section of the Federal Reserve Bank of Chicago on the lnternet I101.
The Chicago Fed reports the CPI from 1945. The initially reported January 1945 CPI rate is 17.8, the November 1995 rate is 153.6, while the December 1982 rate is set to the benchmark 100 representing 100 percent valuation. Historical dollar amounts are CPI adjusted by: ( 1 ) dividing the historical CPI by 100, and (2) dividing the historical dollar amount by the frac- tional CPI. This method inflates pre-1982 amounts to 1982 levels and deflates post-1982 amounts to 1982 levels, respectively.
We regressed the CPl-adjusted sales data and exam- ined both the linear growth trends and the residuals. It was clear from the initial results that the U.S. com- puter market had experienced a fundamental eco- nomic change around 1977. At some point between 1975 and 1979, the trend in mainframe sales shifted from an extended, monotonically-increasing rate of growth to an equally-extended trend of no growth. Having recognized the two distinct trend series, we split the 36-year time series into two parts at 1977, examining the trends and residuals of each part sepa- rately and then combining the CPI- and trend-adjusted
306 D.A. Peak, M.H. Azadmanesh/lnformation & Management 31 (1997) 303-317
Table 1 Refinement and analysis of computer market data
Analytic objective Refinement technique
I. Observe changes in raw sales patterns
2. Filter changes in prices of goods and services 3. Adjust for changes in growth within a single series 4. Observe changes in broad market trends
5. Adjust for changes in growth across multiple series categories
OLS regression - analyzing the standard residuals of a time series Examine the residuals Adjust to 1982 constant dollars using the CPI Partition the time series for additional OLS regression analysis Plot and examine trends of the adjusted residuals of mainframe and minicomputer sales Combine residual plots for mainframe and minicomputer sales Add in growth trends (regression line slopes) Add in the microcomputer sales growth
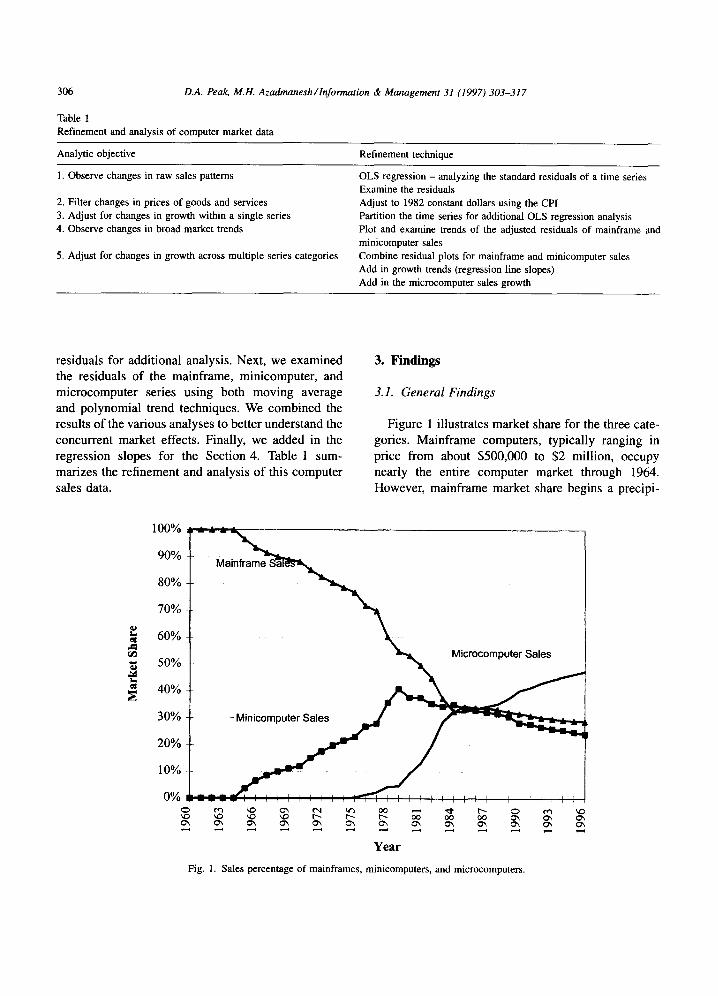
residuals for additional analysis. Next, we examined the residuals of the mainframe, minicomputer, and microcomputer series using both moving average and polynomial trend techniques. We combined the results of the various analyses to better understand the concurrent market effects. Finally, we added in the regression slopes for the Section 4. Table 1 sum- marizes the refinement and analysis of this computer sales data.
3. Findings
3.1. General Findings
Figure 1 illustrates market share for the three cate- gories. Mainframe computers, typically ranging in price from about $500,000 to $2 million, occupy nearly the entire computer market through 1964. However, mainframe market share begins a precipi-
t...,
r-,
100%
90%
80%
70%
60%
50%
40%
30%
20%
10%
0% _--=: : ' , , , , , , , ,,, ,, , , , , , r , , , ~:) ~ kO O'~ t-q it3 oc ',D kO ~ ',D r--- I'--- r--- oo o~ oo G'~ o~
Year
Fig. 1. Sales percentage of mainframes, minicomputers, and microcomputers.
D.A. Peak, M.H. Azadmanesh/ lnformation & Management 31 (1997) 303-317 307
tous and consistent decline following the introduction of commercial minicomputers in 1965. Examples of these first minis include Digital Equipment Corpor- ation's PDP-8, which sold for about $25,000, and the IBM SDS-92, a small scientific machine [4]. Mini- computer market share continues to expand until microcomputer sales begin to accelerate about 1978, then declines.
Perhaps the most interesting feature is the conver- gence of the three computer categories into near-equal market shares about 1984. This convergence is also observable in unadjusted and CPI-adjusted sales. Fol- lowing the introduction of microcomputers in the mid- 1970s, micro sales appear to permanently reverse minicomputer market growth and to at least tempora- rily usher the decline of the mainframe market. In the following time the three categories briefly converge, microcomputers continue to gain market share, while minis and mainframes continue to lose share. How- ever, minis lose share more rapidly than mainframe computers.
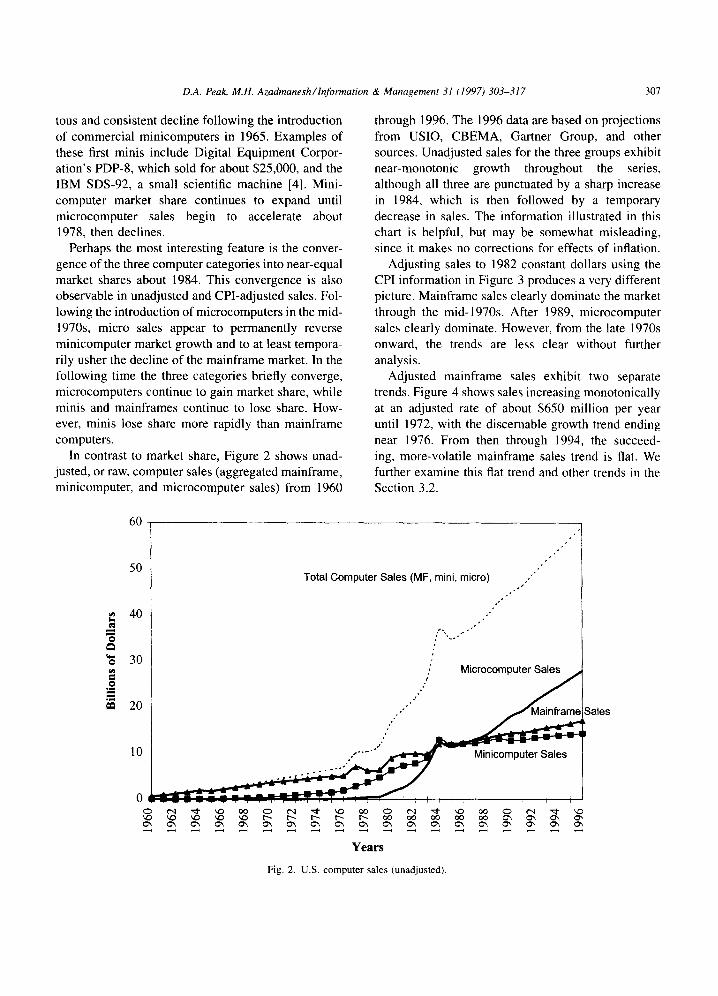
In contrast to market share, Figure 2 shows unad- justed, or raw, computer sales (aggregated mainframe, minicomputer, and microcomputer sales) from 1960
through 1996. The 1996 data are based on projections from USIO, CBEMA, Gartner Group, and other sources. Unadjusted sales for the three groups exhibit near-monotonic growth throughout the series, although all three are punctuated by a sharp increase in 1984, which is then followed by a temporary decrease in sales. The information illustrated in this chart is helpful, but may be somewhat misleading, since it makes no corrections for effects of inflation.
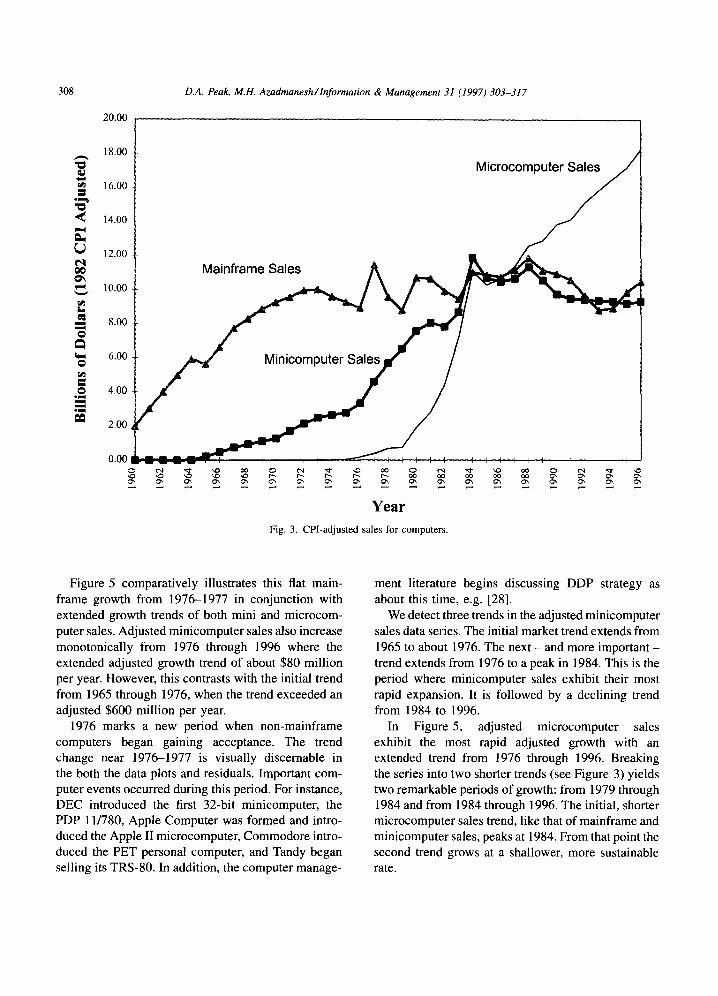
Adjusting sales to 1982 constant dollars using the CPI information in Figure 3 produces a very different picture. Mainframe sales clearly dominate the market through the mid-1970s. After 1989, microcomputer sales clearly dominate. However, from the late 1970s onward, the trends are less clear without further analysis.
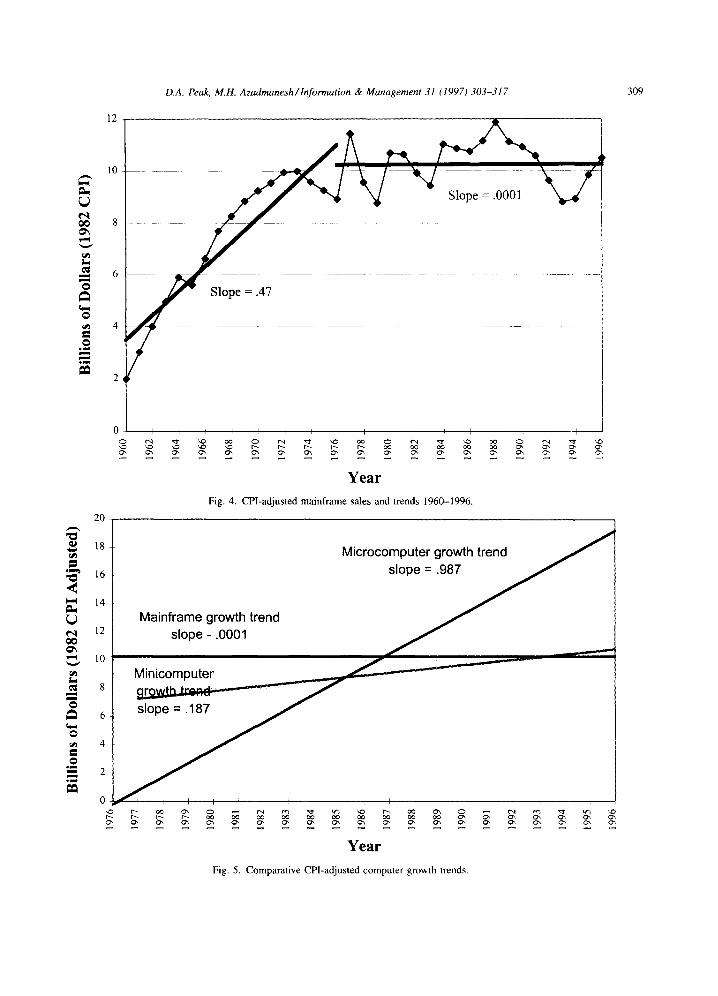
Adjusted mainframe sales exhibit two separate trends. Figure 4 shows sales increasing monotonically at an adjusted rate of about $650 million per year until 1972, with the discernable growth trend ending near 1976. From then through 1994, the succeed- ing, more-volatile mainframe sales trend is flat. We further examine this fiat trend and other trends in the Section 3.2.
o
°11
60
50
40
30
20
10
0 .
'43
Total Computer Sales (MF, mini, micro)
• ..: M i c r o c o m p u t e r ,
Minicomputer Sales
Sales
Years
Fig, 2. U.S. computer sales (unadjusted).
308 D.A. Peak, M.H. Azadmanesh /lnformation & Management 31 (1997) 303-317
20.00
r ~
eq
r ~ x...
o
o
o e~
eJl
18.00
16.00
14.00
12.00
10.00
8.00
6.00
4.00
2.00
0.00
o~
Mainframe Sales
Minicomputer Sales
Year
Fig. 3. CPl-adjusted sales for computers.
Microcomputer Sales
Figure 5 comparatively illustrates this fiat main- frame growth from 1976--1977 in conjunction with extended growth trends of both mini and microcom- puter sales. Adjusted minicomputer sales also increase monotonically from 1976 through 1996 where the extended adjusted growth trend of about $80 million per year. However, this contrasts with the initial trend from 1965 through 1976, when the trend exceeded an adjusted $600 million per year.
1976 marks a new period when non-mainframe computers began gaining acceptance. The trend change near 1976-1977 is visually discernable in the both the data plots and residuals. Important com- puter events occurred during this period. For instance, DEC introduced the first 32-bit minicomputer, the PDP 11/780, Apple Computer was formed and intro- duced the Apple II microcomputer, Commodore intro- duced the PET personal computer, and Tandy began selling its TRS-80. In addition, the computer manage-
ment literature begins discussing DDP strategy as about this time, e.g. [28].
We detect three trends in the adjusted minicomputer sales data series. The initial market trend extends from 1965 to about 1976. The next - and more important - trend extends from 1976 to a peak in 1984. This is the period where minicomputer sales exhibit their most rapid expansion. It is followed by a declining trend from 1984 to 1996.
In Figure 5, adjusted microcomputer sales exhibit the most rapid adjusted growth with an extended trend from 1976 through 1996. Breaking the series into two shorter trends (see Figure 3) yields two remarkable periods of growth: from 1979 through 1984 and from 1984 through 1996. The initial, shorter microcomputer sales trend, like that of mainframe and minicomputer sales, peaks at 1984. From that point the second trend grows at a shallower, more sustainable rate.
D.A. Peak, M.H. Azadmanesh/Information & Management 31 (1997) 303-317 309
12
Slope = .0001
~ 8 -
L.,
0 Slope = .47
0
. ~
. ~
0 I I I I : I i ~ I I [ ! I I I
Year
20
Fig. 4. CPI-adjusted mainframe sales and trends 1960-1996.
rA~
oo
rd~ t..,
m
O
O
g l
O
°1.1~
18
16
14
12
10
8
6
4
2
0 ,i
Mainframe growth trend slope - .0001
Microcomputer growth trend J
Minicomputer
' L
Year
Fig. 5. Comparative CPl-adjusted computer growth trends.
310 D.A. Peak, M.H. Azadmanesh/Information & Management 31 (1997) 303-317
0
L "0
2 1
°"1 "/./ k:\ "'/1 i - - i i '
-0.5 i
I' R~ 0.5722 * . ,,[ ° , ° "
-2
Polynomial Fit
3 per. Mov. Avg, (Combined Residuals
Year
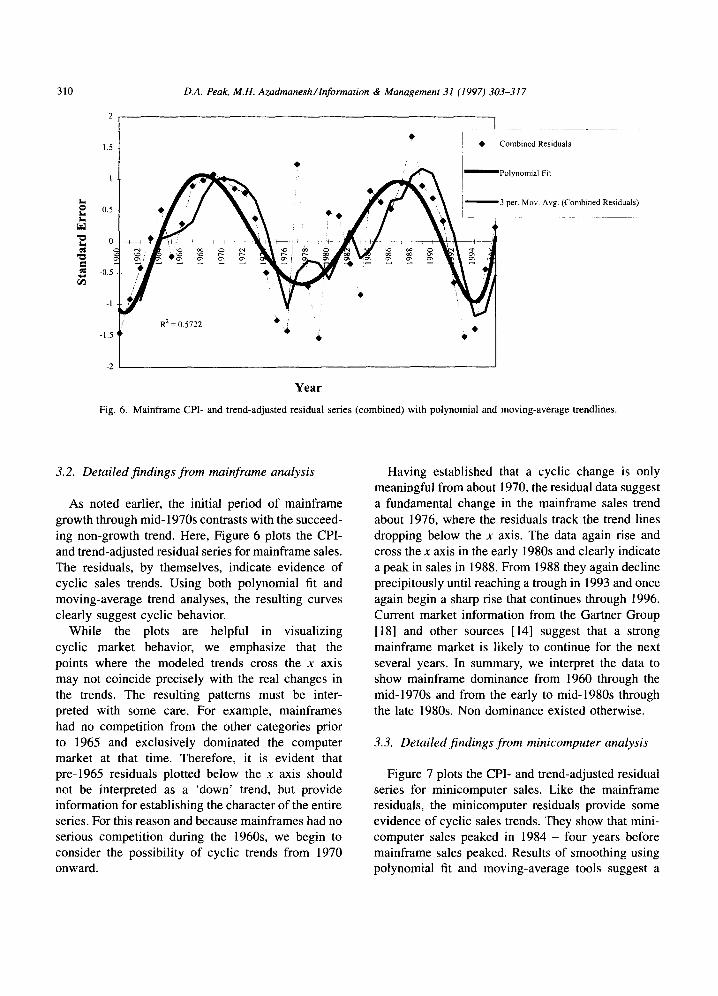
Fig. 6. Mainframe CPI- and trend-adjusted residual series (combined) with polynomial and moving-average trendlines.
3.2. Detailed findings from mainframe analysis
As noted earlier, the initial period of mainframe growth through mid-1970s contrasts with the succeed- ing non-growth trend. Here, Figure 6 plots the CPI- and trend-adjusted residual series for mainframe sales. The residuals, by themselves, indicate evidence of cyclic sales trends. Using both polynomial fit and moving-average trend analyses, the resulting curves clearly suggest cyclic behavior.
While the plots are helpful in visualizing cyclic market behavior, we emphasize that the points where the modeled trends cross the x axis may not coincide precisely with the real changes in the trends. The resulting patterns must be inter- preted with some care. For example, mainframes had no competition from the other categories prior to 1965 and exclusively dominated the computer market at that time. Therefore, it is evident that pre-1965 residuals plotted below the x axis should not be interpreted as a 'down' trend, but provide information for establishing the character of the entire series. For this reason and because mainframes had no serious competition during the 1960s, we begin to consider the possibility of cyclic trends from 1970 onward.
Having established that a cyclic change is only meaningful from about 1970, the residual data suggest a fundamental change in the mainframe sales trend about 1976, where the residuals track the trend lines dropping below the x axis. The data again rise and cross the x axis in the early 1980s and clearly indicate a peak in sales in 1988. From 1988 they again decline precipitously until reaching a trough in 1993 and once again begin a sharp rise that continues through 1996. Current market information from the Gartner Group [18] and other sources [14] suggest that a strong mainframe market is likely to continue for the next several years. In summary, we interpret the data to show mainframe dominance from 1960 through the mid-1970s and from the early to mid-1980s through the late 1980s. Non dominance existed otherwise.
3.3. Detailed findings from minicomputer analysis
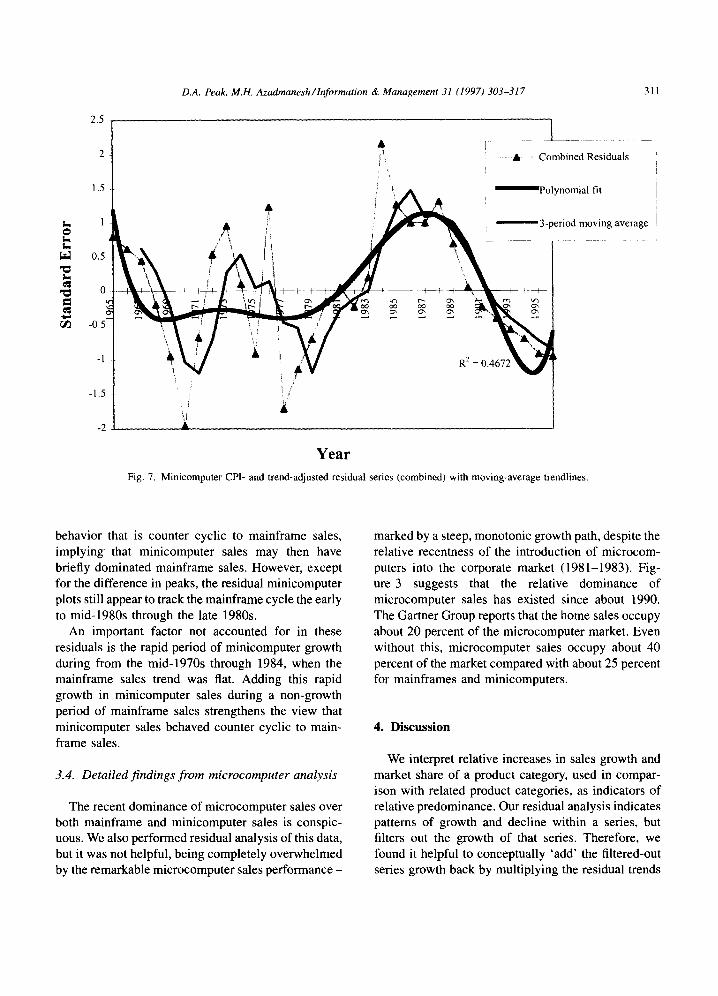
Figure 7 plots the CPI- and trend-adjusted residual series for minicomputer sales. Like the mainframe residuals, the minicomputer residuals provide some evidence of cyclic sales trends. They show that mini- computer sales peaked in 1984 - four years before mainframe sales peaked. Results of smoothing using polynomial fit and moving-average tools suggest a
D.A. Peak, M.H. Azadmanesh /Information & Management 31 (1997) 303-317 311
0
x _
. ¢ j e~
2.5
2
1,5
l!
0.5
0
-0.5"-
-1
-1.5
-2
! 'i /
A L _ _ _ , '~ A .... Combined Residuals
,: / ~ , Polynomial fit
_ 3-period moving average
R 2
Year
Fig. 7. Minicomputer CPI- and trend-adjusted residual series (combined) with moving-average trendlines.
behavior that is counter cyclic to mainframe sales, implying that minicomputer sales may then have briefly dominated mainframe sales. However, except for the difference in peaks, the residual minicomputer plots still appear to track the mainframe cycle the early to mid-1980s through the late 1980s.
An important factor not accounted for in these residuals is the rapid period of minicomputer growth during from the mid-1970s through 1984, when the mainframe sales trend was flat. Adding this rapid growth in minicomputer sales during a non-growth period of mainframe sales strengthens the view that minicomputer sales behaved counter cyclic to main- frame sales.
3.4. Detailed findings from microcomputer analysis
The recent dominance of microcomputer sales over both mainframe and minicomputer sales is conspic- uous. We also performed residual analysis of this data, but it was not helpful, being completely overwhelmed by the remarkable microcomputer sales performance -
marked by a steep, monotonic growth path, despite the relative recentness of the introduction of microcom- puters into the corporate market (1981-1983). Fig- ure 3 suggests that the relative dominance of microcomputer sales has existed since about 1990. The Gartner Group reports that the home sales occupy about 20 percent of the microcomputer market. Even without this, microcomputer sales occupy about 40 percent of the market compared with about 25 percent for mainframes and minicomputers.
4. Discussion
We interpret relative increases in sales growth and market share of a product category, used in compar- ison with related product categories, as indicators of relative predominance. Our residual analysis indicates patterns of growth and decline within a series, but filters out the growth of that series. Therefore, we found it helpful to conceptually 'add' the filtered-out series growth back by multiplying the residual trends
312 D.A. Peak, M.H. Azadmanesh/lnformation & Management 31 (1997) 303-317
8
0 Z
! Mainframe period Mainframe period /
/ M croco puter ~ ~ o o ~ ~ + ~ i ~ . , , , ~ ~ i n i c o m p u t e r period + ~ , . . ~ d ~
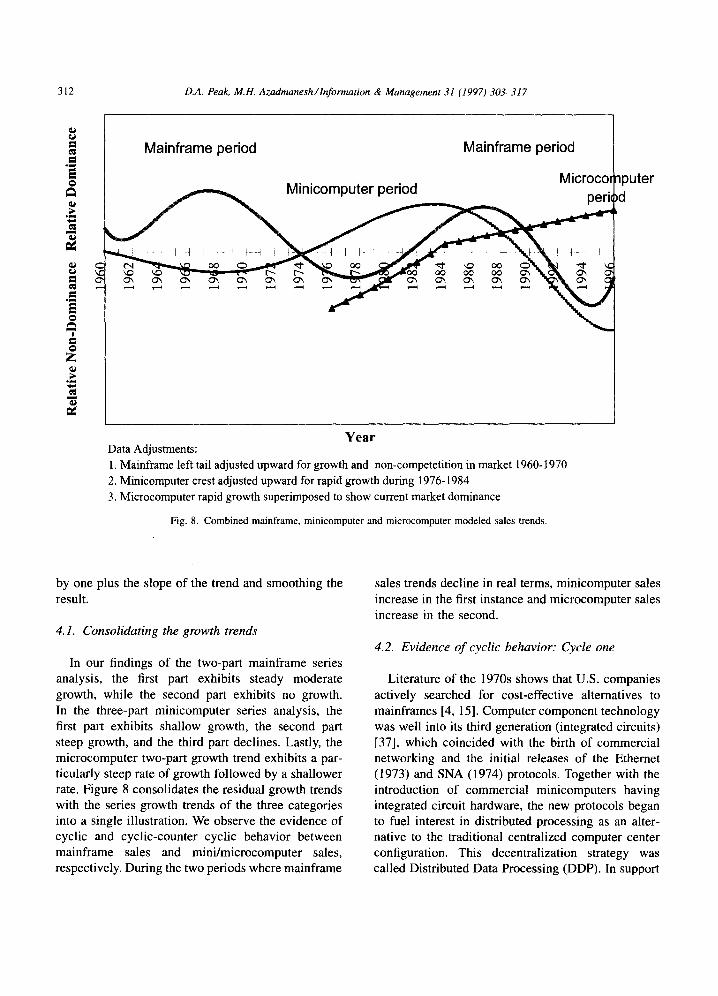
Year Data Adjustments: 1. Mainframe left tail adjusted upward for growth and non-competetition in market 1960-1970 2. Minicomputer crest adjusted upward for rapid growth during 1976-1984 3. Microcomputer rapid growth superimposed to show current market dominance
Fig. 8. Combined mainframe, minicomputer and microcomputer modeled sales trends.
by one plus the slope of the trend and smoothing the result.
4.1. Consolidating the growth trends
In our findings of the two-part mainframe series analysis, the first part exhibits steady moderate growth, while the second part exhibits no growth. In the three-part minicomputer series analysis, the first part exhibits shallow growth, the second part steep growth, and the third part declines. Lastly, the microcomputer two-part growth trend exhibits a par- ticularly steep rate of growth followed by a shallower rate. Figure 8 consolidates the residual growth trends with the series growth trends of the three categories into a single illustration. We observe the evidence of cyclic and cyclic-counter cyclic behavior between mainframe sales and mini/microcomputer sales, respectively. During the two periods where mainframe
sales trends decline in real terms, minicomputer sales increase in the first instance and microcomputer sales increase in the second.
4.2. Evidence of cyclic behavior: Cycle one
Literature of the 1970s shows that U.S. companies actively searched for cost-effective alternatives to mainframes [4, 15]. Computer component technology was well into its third generation (integrated circuits) [37], which coincided with the birth of commercial networking and the initial releases of the Ethernet (1973) and SNA (1974) protocols. Together with the introduction of commercial minicomputers having integrated circuit hardware, the new protocols began to fuel interest in distributed processing as an alter- native to the traditional centralized computer center configuration. This decentralization strategy was called Distributed Data Processing (DDP). In support
D.A. Peak, M.H. Azadmanesh /lnformation & Management 31 (1997)303-317 313
of DDP concepts, Digital Equipment introduced its powerful 32-bit PDP-11/780 in 1977 bundled with the new DECNET bus communications architecture. Weil, in a contemporary reference to DDP and IBM's maturing SNA products, flatly stated that commercial networking of computers was "now possible." He noted that SNA offered a new collection of standar- dized protocols for various types of IBM computers and also increased communication bandwidth: "... from small (4331/4341s) to large (3033) processors, and the concomitant maturing of SNA, the company's sophisticated data network architecture, has changed (the computer industry). Now a coordinated, compa- tible approach to DDP is practical...[38]."
4.3. Evidence of cyclic behavior: Cycle two
Mainframe sales trends began to rise once again in the early 1980s, while minicomputer sales flattened and then declined from 1984 onward. Computer com- ponent technology had transitioned into its fourth generation with Very Large Scale Integration (VLSI). During the early 1980s, large computer users became interested in enterprise-scale databases. This interest soon sparked a demand for large relational databases such as DB2 that required large centralized environ- ments and disk storage farms to operate effectively. Large site requirements alone precluded most mini- computers from consideration as enterprise database processors. At the same time, industry frustration over proprietary, non-standardized protocols among man- ufacturers served to dampen enthusiasm for DDP. Hence, we observe the contemporaneous rise of main- frame computers sales, where mainframes accommo- dated the large databases and provided processing power not provided by DDP. We interpret this rise in mainframe sales to represent the beginning of a second brief period of mainframe predominance.
The second mainframe wave crested in 1988. July 25, 1988 marked the first of a stampede of large data- center outsourcing transactions, when Kodak announced it would turn over virtually all of its data and information center operations to IBM. Numerous and ever-larger outsourcing transactions have contin- ued to follow, resulting in a estimated $50 billion in outsourcing transactions worldwide by 1996. The new IT outsourcing market that began in 1988 signaled a massive corporate restructuring trend of IT-related
units, severely limiting the market for large mainframe computers.
However, even during the mainframe dominance period that preceded the 1988 peak in sales, companies still purchased distributed computing capabilities. Although minicomputer sales continued in decline from 1984, the decentralizing alternative declared by market sales was the microcomputer. Microcom- puter sales continued to grow from the early 1980s and, together with standardized networking media and protocols, stood ready to substitute more seemingly cost-effective alternatives for large mainframe capital. Expansion of Ethernet and Token Ring strategies [8] helped standardize LAN computing capabilities. In addition, PC LANs moved from file-sharing to client- server technologies together with massive increases in processing power and increasingly user-friendly inter- faces. Global connectivity has continued to expand the market for microcomputers with a world growth rate of approximately 30 percent per year (Table 2).
Figure 9 shows the continued near-exponential growth in computers connected to the Internet, of which over 95 percent are microcomputers. This is the period of distributed processing that we currently find today.
4.4. Evidence of cyclic behavior- Cycle three
While microcomputer sales trend upward and minicomputer sales trend downward, mainframe sales have experienced a sharp upward reversal in sales trend. Market literature has noted that this reversal is evidence of industry's realization that main- frame computers have a definite purpose in the contemporary computer services economy, both as traditional systems providers [33] and as enterprise servers [21]. Moreover, stories of problems in client-server systems providers are becoming more prevalent [28].
Table 2 Installed base of microcomputers and microcomputer sales [ 18]
Worldwide US Total US homes
Installed microcomputers 200 Million 100 Million 35 Million 1994 micro sales 51 Million 18 Million 9 Million 1995 micro sales 66 Million 24 Million 12 Million
314
10,000,000
D.A. Peak, M.H. Azadmanesh /lnformation & Management 31 (1997) 303-317
t .
o
o t _ ID
E Z
1,000,000
100,000
10,000
1,000
100
1983 1984 1985 1986 1987 1988 1989 1990 1991
Y e a r
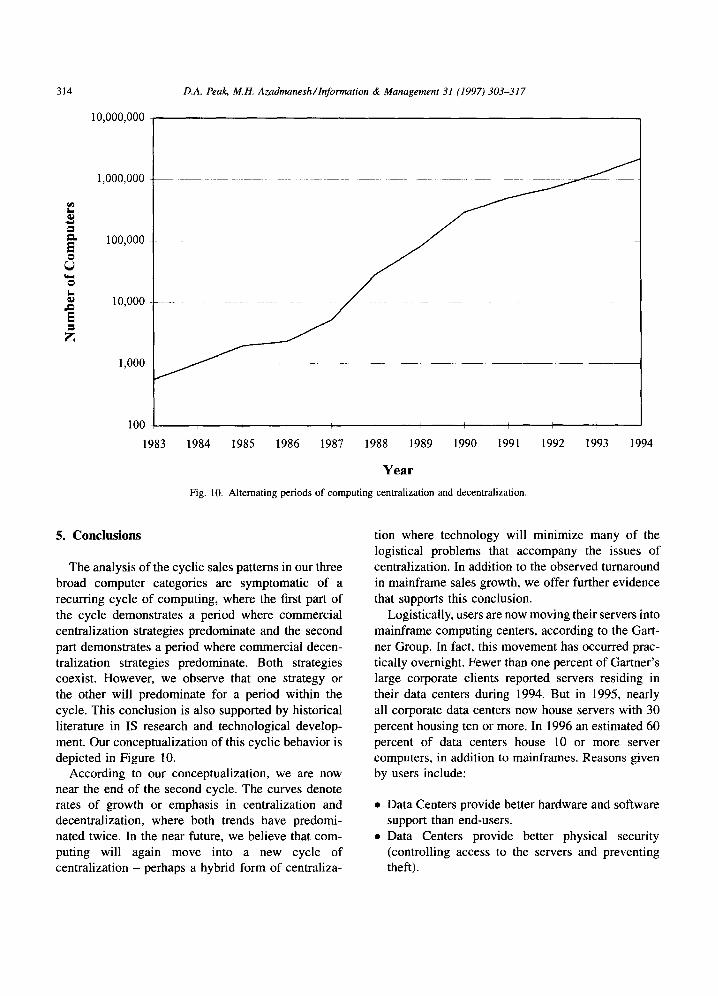
Fig. 10. Alternating periods of computing centralization and decentralization.
1992 1993 1994
5. Conclusions
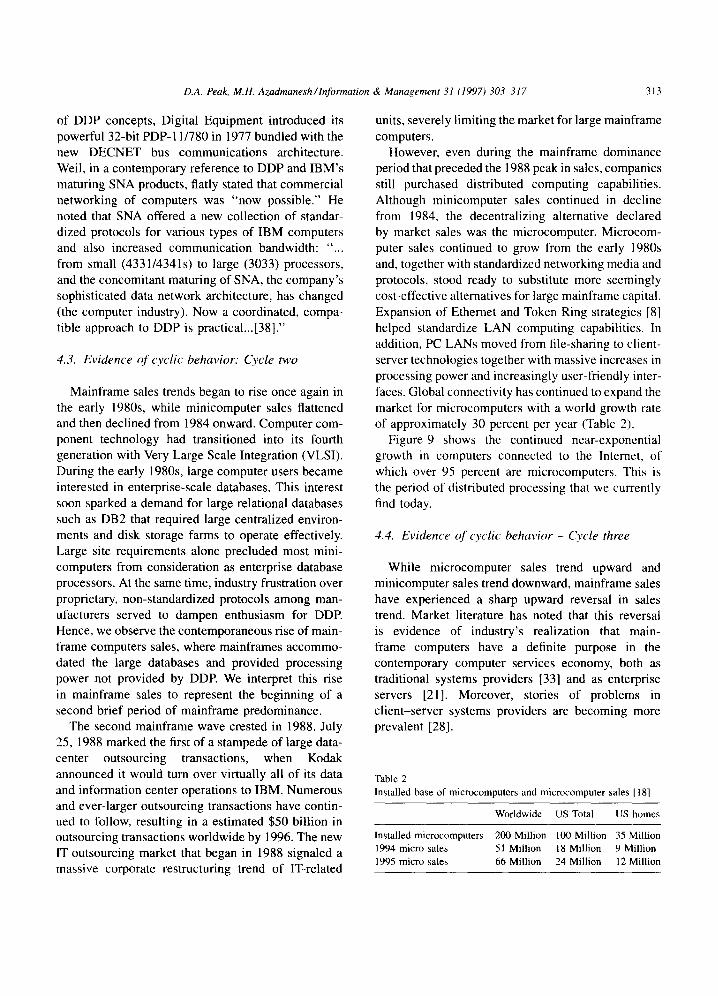
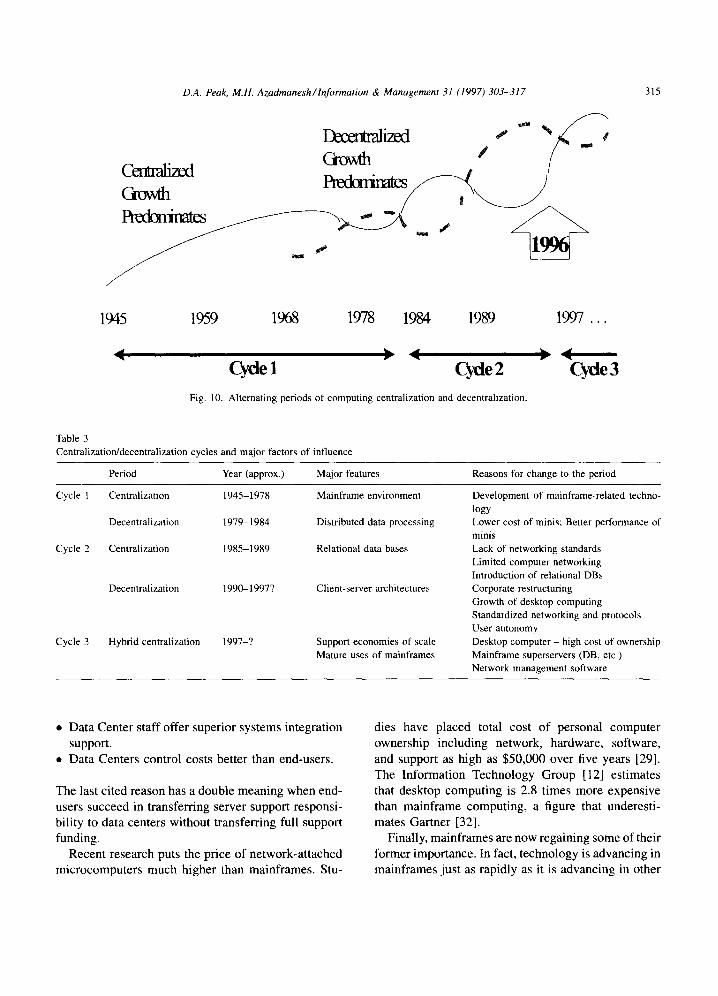
The analysis of the cyclic sales pattems in our three broad computer categories are symptomatic of a recurring cycle of computing, where the first part of the cycle demonstrates a period where commercial centralization strategies predominate and the second part demonstrates a period where commercial decen- tralization strategies predominate. Both strategies coexist. However, we observe that one strategy or the other will predominate for a period within the cycle. This conclusion is also supported by historical literature in IS research and technological develop- ment. Our conceptualization of this cyclic behavior is depicted in Figure 10.
According to our conceptualization, we are now near the end of the second cycle. The curves denote rates of growth or emphasis in centralization and decentralization, where both trends have predomi- nated twice. In the near future, we believe that com- puting will again move into a new cycle of centralization - perhaps a hybrid form of centraliza-
tion where technology will minimize many of the logistical problems that accompany the issues of centralization. In addition to the observed turnaround in mainframe sales growth, we offer further evidence that supports this conclusion.
Logistically, users are now moving their servers into mainframe computing centers, according to the Gart- ner Group. In fact, this movement has occurred prac- tically overnight. Fewer than one percent of Gartner's large corporate clients reported servers residing in their data centers during 1994. But in 1995, nearly all corporate data centers now house servers with 30 percent housing ten or more. In 1996 an estimated 60 percent of data centers house 10 or more server computers, in addition to mainframes. Reasons given by users include:
• Data Centers provide better hardware and software support than end-users.
• Data Centers provide better physical security (controlling access to the servers and preventing theft).
D.A. Peak, M.H. Azadmanesh / ln/'ormation & Management 31 (1997) 303-317
Crovsh / /
1945 1959 1968 1978 1984 1989 1997 ...
Cycle 1 Cycle 2 Cycle 3 Fig. 10. Alternating periods of computing centralization and decentralization.
315
Table 3 Centralization/decentralization cycles and major factors of influence
Period Year (approx.) Major features Reasons for change to the period
Cycle 1 Centralization 1945-1978
Decentralization 1979-1984
Cycle 2 Centralization 1985-1989
Decentralization 1990-1997?
Cycle 3 Hybrid centralization 1997-?
Mainframe environment
Distributed data processing
Relational data bases
Client-server architectures
Support economies of scale Mature uses of mainframes
Development of mainframe-related techno- logy Lower cost of minis; Better performance of minis Lack of networking standards Limited computer networking Introduction of relational DBs Corporate restructuring Growth of desktop computing Standardized networking and protocols User autonomy Desktop computer - high cost of ownership Mainframe superservers (DB, etc.) Network management software
• Data Center staff offer superior systems integration support.
• Data Centers control costs better than end-users.
The last cited reason has a double meaning when end- users succeed in transferring server support responsi- bility to data centers without transferring full support funding.
Recent research puts the price of network-attached microcomputers much higher than mainframes. Stu-
dies have placed total cost of personal computer ownership including network, hardware, software, and support as high as $50,000 over five years [29]. The Information Technology Group [12] estimates that desktop computing is 2.8 times more expensive than mainframe computing, a figure that underesti- mates Gartner [32].
Finally, mainframes are now regaining some of their former importance. In fact, technology is advancing in mainframes just as rapidly as it is advancing in other
316 D.A. Peak, M.H. Azadmanesh/lnformation & Management 31 (1997) 303-317
areas of the computer market. Smaller, more efficient CMOS technologies that are common in micropro- cessors are rapidly replacing the older mainframe Bipolar circuitry. In addition, according to the Meta Group, mainframe MIPS demand will grow 45 percent annually through the year 2000. They estimate that by 2004, mainframes will comprise approximately 44 percent of the scalable-server MIPS in the market- place, while Unix systems will provide 39 percent and NT servers will provide about 17 percent.
Evidence of cyclic behavior in the computer sales data, when considered with historical documentation of trends in computing, leads us to conclude that computing is broadly cyclic, oscillating unevenly between domination of centralization and decentrali- zation. Computing has already experienced two cen- tralization/decentralization cycles, and is currently in the latter stages of the second cycles's decentralization period. Based on market evidence that is supported by current trends in computing, we also predict that computing is at the threshold of the centralization period of a third cycle where the mainframe computer, together with microprocessor (specifically, client-ser- ver) technology, will play a significant role. Since the nature of computing has changed over time, the complexion of that centralization will be very different from previous periods. We suggest that it will be a hybrid containing elements of both centralization and decentralization, as suggested in Table 3.
References
[1] M. Alavi and I.R. Weiss, "Managing the risks associated with end-user computing," Journal of Management Informa- tion Systems, 2(3), Winter 1985-86, pp. 5-20..
[2] L.M. Beach, "Distributed data processing," Information Management, 18(11), Nov 1984, pp. 20-21, 31.
[3] A.C. Boynton and R.W. Zmud, "Information technology planning in the 1990's: Directions for practice and research," MIS Quarterly, 11(1), Mar 1987, pp. 59-71.
[4] G. Brock, The U.S. Computer lndustry: 1954-1973, Ballinger Publishing, Cambridge, MA, 1975.
[5] T.D. Clark, "Corporate systems management: An overview and research perspective." Communications of the ACM, 35(2), Feb 1992, pp. 60-76.
[6] Computer and business equipment industry marketing data book, prepared by the Industry Marketing Statistics Program, Computer and Business Equipment Manufacturers Associa- tion, Washington, D.C., 1993.
[7] Computer and business equipment industry marketing data book, prepared by the Industry Marketing Statistics Program, Computer and Business Equipment Manufacturers Associa- tion, Washington, D.C., 1983.
[8] Computer Industry Almanac, Computer Industry Almanac, Dallas, TX, 1987-1995.
[9] L. Corman, "Data integrity and security of the corporate data base: The dilemma of end-user computing," Data Base, Fall/ Winter 1988, pp. 1-5.
[ 10] "Consumer price index, current, historical," Federal Reserve Bank of Chicago Gopher, gopher://gopher.great-lakes.- net:2200/11/partners/ChicagoFed.
[11] T.C. Copeland and J.E Weston, Financial Theory and Corporate Policy, 3rd edn. Addison-Wesley Publishing Company, Reading, MA, 1988.
[12] Cost of Computing: Comparative Study of Mainframe and PC/LAN Installations, International Technology Group, 1995.
[13] C.J. Date, A Guide to DB2, 2nd edn., Addison-Wesley Publishing, Reading, MA, 1988.
[14] B. Depompa, "Mainframes: Rising from the ashes," Information Week, 581, 27 May 1996, pp. 44-50.
[15] T.A. Dolotta, M.I. Bernstein, R.S. Dickson, Jr., N.A. France, B.A. Rosenblatt, D.M. Smith and T,B. Steel Jr., Data Proces- sing in 1980-1985, John Wiley and Sons, New York, 1976.
[16] B.L. Dos Santos, K. Peffers and D. C. Mauer, "The impact of information technology announcements on the market value of the firm," Information Systems Research, 4(1 ), March 1993, pp. 1-23.
[17] E.E Fama, "Efficient capital markets: A review of theory and empirical work," Journal of Finance, May 1970, pp. 383-417.
[18] Gartner Group consulting notes, lists, and reports. These represent a wide range of materials, from single-sheet faxes, to full research reports. Material is proprietary, but lists will be provided upon request, 1995-1996.
[19] S.J. Grossman and J. Stiglitz, "Information and competitive price systems," American Economic Review, May 1976, 246--253.
[20] R. Hackathorn, "End-user computing by top executives," Data Base, 19(1), Fall/Winter 1987-1988, pp. 1-9.
[21] "HourGlass 2000; Mainware Inc's mainframe Year 2000 testing software," Enterprise Systems Journal, 11(2), February 1996, p. 52.
[221 M.C. Jenson and W.H. Meckling, "Theory of the firm, managerial behavior, agency costs and ownership structure," Journal of Financial Economics, October 1976, pp. 305-360.
[23] P. Jowlett and M. Rothwell, The Economics of Information Technology, St. Martin's Press, New York, 1986.
[24] D.A. Kidwell and R.L. Petersen, Financial Institutions, Markets, and Money, The Dryden Press, Chicago, IL, 1987.
[25] K. Kobayashi, "Man and computers and communications: Concepts and perspectives," International Institute of Communications Annual Conference, 1982.
[26] M.C, Lacity and R. Hirschheimn, "The information systems outsourcing bandwagon, look before you leap." Sloan Management Review, 35(1), Fall 1993, pp. 73-86.
D.A. Peak, M.H. Azadmanesh/ lnformation & Management 31 (1997) 303-317 317
[271 R.L. Leitheiser and J.C. Wetherbe, "Service support levels: An organized approach to end-user computing," MIS Quarterly, 10(4), Dec 1986, pp. 336-349.
[281 L. Marion, "At your service; expanding services industry," PC Week, 13(2), 15 January 1996, p. AI.
[291 L. Musthaler, "Shift toward desktop mgmt. brings PC ownership costs in line," Network World, 12(16), 17 April 1995, p. 36.
[30] B. Niederman, R. Brancheau, and J.C. Wetherbe, "informa- tion systems management issues for the 1990's." M1S Quarterly, 15(4), Dec 1991, pp. 474-500.
[311 D.A. Peak, The risks and effects of information systems outsourcing on the IS function and the firm. Doctoral Dissertation, The University of North Texas, May, 1994.
[321 A. Pang, "DMI aims to reduce cost of PC ownership," Computer Reseller News, 683, 13 May 1996, pp. 131-142.
[331 E. Schuman, "Mainframes live on, study says," Commu- nications Week, 15 January 1996, p. 19.
1341 P.L. Tom, Managing Information as a Corporate Resource, HarperCollins, New York, 1991.
135] J.D. Ullman, Principles of Database and Knowledge-Base Systems, Volume 1: Classical Database Systems, Computer Science Press, Rockville, MD, 1988.
1361 U.S. Industrial Outlook, U.S. Dept. of Commerce, Bureau of Industrial Economics, Washington, D.C., 1965-1994.
137] U. Weil, Information Systems in the 80"s: Products, Markets, and Vendors, Prentice-Hall, Englewood Cliffs, NJ , 1982.
1381 D.B. Yoffie, Strategic Management in Information Technol- ogy, Prentice Hall, Englewood Cliffs, N J, 1995.
Daniel A. Peak (Dan) is an assistant professor at the University of Nebras- ka at Omaha (http://ww.unomaha.e- du), and holds dual appointments in the Department of Information Sys- tems and Quantitative Analysis and in the Center for Management of In- formation Technology (CMIT). Dan has extensive industry experience as an IT specialist, consultant, trainer,
and planner. He received an M.M. in Music, an M.B.A. in Information Systems, and a Ph.D. in Computer Information Systems and in Finance from the University of North Texas in Denton, Texas. His research interests include client/server computing, multimedia, outsourcing, and computing trends.
M.H. Azadmanesh (Azad) is an assistant professor at the University of Nebraska at Omaha (http://www.u- nomaha.edu), and holds dual appoint- ments in Department of Computer Science and the Center for Manage- ment of Information Technology (CMIT). He received M.S. and Ph.D. degrees in Computer Science from Iowa State University and Uni- versity of Nebraska-Lincoln in 1982
and 1993, respectively. His research interests include fault-tolerant distributed systems, client/server computing, real time systems, and network communications. Azad is a member of the ACM and the IEEE Computer and Reliability societies.