Embed Size (px)
Citation preview

December 2013
Ever Higher Government spending on Canada’s Aboriginals since 1947
by Mark Milke
Centre for Aboriginal
Policy Studies

fraserinstitute.org
fraserinstitute.org / i
Contents
Executive summary / iii
Introduction / 1
1. Spending on Canada’s Aboriginals: the rhetoric / 3
2. Spending on Canada’s Aboriginals: the reality / 6
3. Summary look at selected government spending on Aboriginal Canadians / 24
Conclusion / 27
References / 28
About the author / 33
Acknowledgments / 33
Publishing information / 34
Supporting the Fraser Institute / 35
Purpose, funding, & independence / 36
About the Fraser Institute / 37
Editorial Advisory Board / 38

fraserinstitute.org

fraserinstitute.org / iii
Executive summary
This study provides a fact-based look at the oft-heard claim that public spend-ing on Canada’s Aboriginal population is forever inadequate. It does so by examining actual spending on Aboriginal Canadians, using four sources: the federal department of Aboriginal Affairs and Northern Development Canada, Health Canada, Employment and Social Development Canada, and provincial governments. The three federal departments were chosen because reference to First Nations spending is clearly identified in the Public Accounts. Dozens of other federal departments, as well as federal and provincial agencies and municipalities, were excluded. Thus, the estimates herein are extremely conservative. They do not capture all government spending in Canada on Aboriginal Canadians—be they First Nations, Inuit or Métis.
Aboriginal Affairs and Northern Development Canada
Λ The first set of data is the spending incurred by the federal department of Aboriginal Affairs and Northern Development Canada (AANDC), known for most of its history as the Department of Indian Affairs and Northern Development. Some incomplete data exists dating back to Confederation, but in order to compare spending on Aboriginal matters with total federal program spending, the data in this report begins in 1946/47 and continues to 2011/12. Per person comparisons date from 1949/50, given the first relevant census year of 1949.
Λ The increase in spending on Canada’s Aboriginal peoples has been significant. In real terms, department spending on Canada’s Aboriginal peoples rose from $79 million annually in 1946/47 to almost $7.9 billion in 2011/12.
Λ Using census data and adjusting for population, Aboriginal/Indian Affairs spending increased from $922 per registered First Nation individual in 1949/50 to $9,056 in 2011/12. That constitutes an 882 percent rise in spending per First Nations person.

iv / Ever-higher: Government spending on Canada’s Aboriginals since 1947
fraserinstitute.org
Λ In comparison, total federal program spending per person on all Canadians rose by 387 percent, from $1,504 in 1949/50 to $7,316 in 2011/12
Employment and Skills Development Canada
Λ The federal department of Employment and Skills Development Canada (ESDC), formerly known as Human Resources and Skills Development Canada, spends money annually on housing on First Nations reserves across Canada.
Λ Prior to 2007/08, housing support data was not broken down separately in the Public Accounts. However, since that year, annual on-reserve housing programs funded through ESDC averaged $242 million in annual expenditures. In comparison, ESDC’s subsidy expenditures for non-reserve housing averaged just over $1.3 billion annually during that period.
Λ In 2011/12, ESDC’s on-reserve program equated to $479 per Aboriginal person on reserve. ESDC spending on housing programs for all Canadians amounted to $51 per person in that year.
Health Canada
Λ The third set of data is also federal, from Health Canada tax dollars specifically spent on Aboriginal matters. The data here dates from 1994/95 (the earliest year available) to 2011/12.
Λ In inflation-adjusted terms, Health Canada spending on First Nations/Inuit health care has jumped from just under $1.3 billion in 1994/95 to $2.4 billion as of 2011/12.
Λ The amount spent by Health Canada per First Nations/Inuit person rose from $2,055 in 1994/95 to $2,626 in 2011/12.
Λ Included in the above $2.4 billion figure for 2011/12 is the $1.1 billion cost of supplementary health care benefits for 896,624 First Nations and Inuit peoples, the Non-Insured Health Benefits Program (NIHB). This Health Canada program delivers health care benefits to First Nations and Inuit peoples for which other Canadians must normally purchase extra insurance, or purchase out-of-pocket. In 2011/12, eligible First Nations and Inuit enrollees had access to the following extra services:• Vision care (expenditures of $29.8 million);• Dental care ($219.1 million);• Medical transportation ($333.3 million); • Pharmaceuticals ($459.4 million);

Ever-higher: Government spending on Canada’s Aboriginals since 1947 / v
fraserinstitute.org
• Other health care including medical supplies and equipment, short-term crisis intervention, and mental health counselling;
• Monthly health care premiums in the province of British Columbia for Indians/Inuit which normally cost a British Columbian between $798 (for an individual) or $1,596 (for a family of three or more) annually.
Provincial governments since the mid-1990s
Λ Another set of statistics is derived from the 10 provinces. Here, the start year for each province varies widely, but the first year for this survey is 1993/94 and the data runs up to 2011/12.
Λ In total, and adjusted for inflation, provincial spending on Aboriginals rose from just $42 million in 1993/94 to $711 million per year by 2011/12.
Λ The provinces, combined, spent $75 per registered First Nations person in 1993/94, compared with $819 per person in 2011/12, an increase of 985 percent.
Λ In comparison, total provincial spending per person on all Canadians in the provinces rose from $7,340 in 1993/94 to $9,205 in 2011/12, an increase of 25 percent.
SummaryCertain expenditures, such as on primary and secondary education, are examples of “parallel” spending. AANDC education expenses would, if not incurred by the federal government, be incurred by provincial governments on education spending for First Nations children. Prior to 2005/06, the Public Accounts did not detail annual education spending as a separately identified expenditure. However, since that year, education spending in that department has accounted for an annual average of one-quarter of the depart-ment’s annual budget. Thus those latter, particular expenditures are not an additional “benefit” beyond that available to the general Canadian popula-tion, but should be seen as a routine expenditure by government that would always and anyway be delivered.
However, other expenditures on Aboriginal Canadians serve as addi-tional and exclusive government benefits to eligible First Nations persons. Examples include ESDC housing expenses and Health Canada’s Non-Insured Health program benefits, the costs of which are normally borne privately through out-of-pocket costs or insurance.
The numbers herein are conservative. Federally, only three depart-ments were examined for spending on Aboriginals—AANDC (since 1946/47 to 2011/12), ESDC (2007/08 to 2011/12), and Health Canada (1994/95 to

vi / Ever-higher: Government spending on Canada’s Aboriginals since 1947
fraserinstitute.org
2011/12). In addition, provincial sources were chronicled but there may well have been additional expenditures not explicitly identified and thus missed. Municipal and territorial spending was not analyzed.
Still, from the limited data available and from the noted sources, just under $235 billion has been spent on Aboriginals. This includes:
Λ AANDC Aboriginal-specific spending between 1946/47 and 2011/12 ($193.1 billion);
Λ Health Canada spending from 1994/95 to 2011/12 ($33.8 billion);
Λ Provincial government spending through 2011/12 with various start years over the past two decades ($6.8 billion);
Λ ESDC expenditures on on-reserve housing between 2007/08 and 2011/12 ($1.2 billion).
Overall, this partial look at three federal departments and provincial government spending reveals spending on Canada’s Aboriginal population that has risen substantially in real (after-inflation) terms, whether measured in spending in the particular department, in comparison with overall gov-ernment program spending (federal or provincial), or in relevant per-person comparisons in each example.

fraserinstitute.org / 1
Introduction: North America’s first settlers, assumptions, and language
The relationship between North America’s first settlers and later immigrants is one that often dominates policy and political discussions in Canada, and is evident both in debates over government spending priorities and even in debates over language. On the latter, the nature of the first settler relation-ship to subsequent waves of immigrants is evident in the labels used for the modern-day descendants of such first settlers. Over time, the labels have moved from the historically erroneous but still used legal term of “Indian” (as in Indian Act), to “Aboriginal,” “native,” “indigenous peoples,” or “First Nations.” The terms used variously describe a narrow cohort (i.e., status or registered Indians) or the wider group (Aboriginal, native, or indigenous). Terms also vary depending on the politics behind a description. Some use “First Nations” to signify a claim to a sovereign political unit and the pursuit of an oft-claimed government-to-government relationship.
Thus, as a preface, it may be helpful for readers to understand why I choose certain language. In this study, I will use the term “Aboriginal” when discussing the larger cohort (which includes status and non-status First Nations, Inuit, and Métis). On occasion, legal, historical, and census terms are used (i.e., registered Indian). Also, where a narrow cohort is discussed, I will the use the more recent and popular terms for that specific group, i.e., First Nations, Métis, or Inuit.
In the case of the First Nations moniker, I use it to facilitate transition from sources and authors cited in this study who use it—under mild protest, since it may not be accurate to identify a particular sect as “first” in a particu-lar locale as other Aboriginal groups may claim the same territory. Further, the word “nation” is problematic as that concept is normally understood by the general public to mean nation-state. I am aware that some will argue that
“First Nations” is indeed accurate, given that some Aboriginal groups assert that they have never given up their sovereignty, and assert nation-state status. However, to label a collective of 300 or 3,000 people a nation or nation-state, when collective or cohort is more accurate, is to make language opaque and undercut its purpose. I side with Aristotle and George Orwell, who asserted

2 / Ever-higher: Government spending on Canada’s Aboriginals since 1947
fraserinstitute.org
that one purpose of language is to clarify, not to confuse, proper conceptions. Still, “First Nations” is the term most often used in recent discourse so it will also be used here.
The outline of this study is as follows. First, it will provide a brief over-view of the oft-heard claims that spending on Canada’s Aboriginal population is perpetually inadequate. Second, actual spending on Aboriginal Canadians is detailed, using the following sources: the federal department of Aboriginal Affairs and Northern Development Canada, Health Canada, and spending incurred by the provinces. One other department, Employment and Skills Development Canada, is also profiled for its spending on housing on reserve, though broken-out data there only available for the most recent five years.
Finally, a summary of the data is discussed, albeit without specific policy recommendations other than this obvious one: any debates over the
“proper” amount of taxpayer dollars to be spent on Aboriginals should take into account existing spending levels, and these are at historically elevated levels, as I will show. This paper is thus contextual more than advisory, beyond that basic flagging of facts not previously quantified.
This paper will not investigate whether all expenditures noted herein have been properly or efficiently spent; to do so is beyond its scope, and would anyway need to be done on a program-by-program or even band-by-band basis.
Do Canada’s governments spend enough on Aboriginal peoples? “Enough” is a value-laden term, impossible to quantify empirically. What is clear from the data is that, over the decades, governments have increas-ingly spent more in real terms on Aboriginal populations. This is so whether measured in overall spending, in comparison to overall government spending increases, or in real per-person comparisons. First, though, a look at some of the rhetoric that surrounds taxpayer transfers to Aboriginals in Canada.

fraserinstitute.org / 3
1. Spending on Canada’s Aboriginals: The rhetoric
Calls for more spending on Canada’s Aboriginal population—either as individuals, or on the cohort at large—are routine. In 2005, at a meeting of Canada’s then-premiers, Dalton McGuinty (Ontario) asserted that it was time for Canada’s political leaders to move beyond treating Aboriginal issues
“as the political equivalent of the weather—where we all talk about it, but none of us ever really do anything about it.” At the same meeting, Gordon Campbell (British Columbia) argued that “Aboriginal people in this country
… have been left behind for the entire history of Canada.” Campbell asserted that Canada “has been in denial about Aboriginal and First Nations people for 138 years” (a reference to Confederation in 1867). Meanwhile, Ralph Klein (Alberta) argued that the drive to better the lives of Aboriginal people was dependent upon political and financial support from Ottawa: “[w]e can’t get into details because so much of what we discussed is contingent on the fed-eral government acting” (Fekete, 2005: A4).
Writing in 2006, Assembly of First Nations (AFN) National Chief Phil Fontaine, along with Clement Chartier and Jose Kusugak, argued that Aboriginal Canadians received just $6,500 per person compared to other Canadians who received “more than $15,000 in services from their federal, provincial and municipal governments;” any “argument that enough money is already being spent must be regarded as thoroughly uninformed or worse, shockingly mean-spirited,” wrote the trio.1 They asserted that the $5.1 billion
1. It is not clear whence the authors derived the $6,500 v. $15,000 comparison, but the claim was misleading: Canadian Aboriginals have access to a full suite of programs and services in the manner as does any Canadian, i.e., they have access to the results of the money spent on the population at large. While some programs for Aboriginals are parallel programs, not amounts spent in addition to what every Canadian is eligible to benefit from—e.g., education spending, which would need to be funded in addition to existing provincial education budgets if First Nations children were enrolled in prov-incial schools—other federal health and housing spending does provide benefits to some Aboriginal Canadians that other Canadians must pay for out of pocket. Beyond specific exceptions on both sides of the ledger, every Canadian is eligible to benefit from

4 / Ever-higher: Government spending on Canada’s Aboriginals since 1947
fraserinstitute.org
in funding commitments in the promised Kelowna Accord (2005) between Aboriginal leaders and then-Prime Minister Paul Martin would have helped “close the gap between Aboriginal and non-Aboriginal Canadians in key qual-ity-of-life indicators” (Fontaine, Chartier, and Kusugak, 2006: A15).
In a 2008 interview, Fontaine again argued that a lack of federal and provincial transfers to Aboriginals was the reason for Aboriginal poverty, implying that implementation of the 19th-century treaties had been flawed.
“There is absolutely no reason that in a country as rich as this, our peoples should be as poor as we are,” said Fontaine. “Our treaties were not designed to have one party impoverish the other party to the agreement. Sadly, that has been our history” (Huber, 2008: A8).
In another example, when Theresa Spence, a northern Ontario native leader, thrust herself into the national spotlight over problems on her reserve in late 2011, and again in 2012, she reignited a debate over the state of native collectives. The Attawapiskat Chief blamed the federal government for under-funding housing on her reserve, and words of support came from various political leaders.2 Bob Rae, interim Liberal leader at the time, asserted that a lack of money was the problem. “There is a diamond mine nearby,” said Rae, with reference to the Attawapiskat reserve. “I think both the province and the federal government have to think a lot harder how we’re going to share the resource revenue and make sure the people who are living here are get-ting some part of that” (Chung, 2011). Former Prime Minister Paul Martin claimed that had the extra $5 billion he promised to native leaders on behalf of the federal government in the Kelowna Accord been implemented, such crises would be less likely (Clibbon, 2013).
The AFN, under various national chiefs beyond Phil Fontaine, has long asserted that taxpayers do not pay enough to Aboriginals, either directly to individuals or through programs for that cohort as a whole. Consider just the two most recent AFN conventions where policy was discussed. In 2012, at the AFN’s Special Chiefs Assembly, 22 out of 47 approved policy resolutions asserted inadequate funding, called for additional funding, and/or called for exemptions from payments and taxes normally due. Resolutions included matters such as funding for tribal councils, education, higher education, fish-eries, policing, First Nations veterans, Aboriginal film, nutrition, gaming, and injury prevention (AFN, 2012). In 2013, at the AFN’s annual general assembly,
government spending in some fashion (albeit sometimes depending on factors such as need, location, age, and other factors unrelated to ancestral background).2. The accounting firm Deloitte was commissioned by Aboriginal Affairs and Northern Development Canada to examine Attawapiskat finances. In 2012, it found incomplete, questionable, or no supporting documentation in 80 percent of the 400 transactions analyzed between 2005 and 2011, calling into question how money on the reserve was in fact spent (Deloitte, 2012).

Ever-higher: Government spending on Canada’s Aboriginals since 1947 / 5
fraserinstitute.org
fully 11 of 19 approved policy resolutions complained of inadequate fund-ing, called for additional funding, and/or called for exemptions from pay-ments normally due. Resolutions touched on everything from palliative care, pay equity, trapping, and harvesting to education, housing, financial officers training, aboriginal broadcasting, and the 2014 Indigenous Games (AFN, 2013).
Over the years, some of the rhetoric has originated in claims of his-toric wrongdoing or ignored land claims, this despite the existence of his-toric treaties that cover much of Canada with the exception of parts of British Columbia (Morris, 2000). Thus, in 2006, Labrador Innu relaunched a lawsuit with an $11-billion claim against the federal and provincial governments and the Quebec Crown Corporation, Hydro-Quebec. The Pessamit Innu asserted that the band’s ancestral rights were violated when thirteen hydroelectric dams were built during the 1950s and 1960s on territory they claim as their own. (The band originally filed a $500-million lawsuit with Quebec Superior Court in 1998, but put it aside for four years to pursue negotiations with the Quebec government.) Innu chief Raphael Picard said that “[t]hese dams have brought nothing to the Innu community of Pessamit.” The $11-billion figure was based on the benefits that the Innu claimed Quebec society had reaped from the development of what the band claimed was their land (St. Arnaud, 2006: A5).3
Most notably, British Columbia has been tied up for two decades by land claims, based on assertions that the latter were not extinguished in the colonial period. The Supreme Court of Canada agreed in Delgamuukw (1997), leading to a plethora of ongoing general and specific claims ever since (Milke, 2008). AFN national chief Shawn Atleo, writing in 2012 with reference to the proposed Northern Gateway pipeline from Alberta across British Columbia, asserted that it was “only one of many major projects planned or under way, projects worth hundreds of billions in economic activity … all these projects are located in or near First Nations’ traditional territories,” and thus such development “requires their consent” (Atleo, 2012). In essence, Atleo has asserted a de facto veto over development on land considered “traditional” territory, even if such land is outside of existing reserve boundaries.
More generally, additional claims for compensation originate in the notion that compensation must be forthcoming for “traditional” and “ances-tral” lands. Newer catch-all, expansive claims about ancestral lands have been on the rise (Gallagher, 2012). In light of the grand and overarching claims, a useful first matter to consider is the existing record of taxpayers, and the ongoing tax dollars spent on Canada’s Aboriginal peoples directly. Insofar as such expenses can be tracked, a natural question arises: does the record of payments from taxpayers to Aboriginal peoples show barely changed funding over the years and decades, or some other reality? To answer this question, we must turn to that historical record.
3. The claim was settled in 2011 (Seguin, 2011).

6 / fraserinstitute.org
2. Spending on Canada’s Aboriginals: The reality
This section details the tax dollars that have been spent on Canada’s Aboriginals, using four sources of data derived from (and limited to) avail-able online resources from the various governments. All figures are inflation-adjusted to 2013 dollars, in order to give an apples-to-apples comparison over the years.
The first set of data is the spending incurred by the federal department of Aboriginal Affairs and Northern Development Canada (AANDC), known for most of its history as the Department of Indian Affairs and Northern Development (Canada, 2013a, 2013b). Data for spending on Aboriginal mat-ters dates back to Confederation, though the data before the Second World War is incomplete and ad hoc. The data in this study dates from 1946/47 to 2011/12 (with the exception of the years 1967/68 and 1968/69, for which data was unavailable). Only the portion categorized as spent on direct transfers to or services for Aboriginals was counted. Spending on “northern affairs” was specifically excluded, for example. Per-person comparisons begin in 1949/50 to accommodate the 1949 census.
The second set of data is from the federal department of Employment and Skills Development Canada (ESDC) which expends money annually for housing on reserves across Canada. Housing support data was not broken down separately before 2007/08 in the Public Accounts. This glimpse at spending is limited to the 2007/08 to 2011/12 period.
The third set of statistics is derived from provincial sources among the ten provinces. Documents analyzed include the various Public Accounts, budgets and annual Estimates. Here, while I provide a total of all provin-cial spending, the start years for each province vary widely depending on the individual province and online availability of documents. The start year also depends on when a selected province began to spend on, or to identify selected spending as targeted to, Aboriginal priorities in particular, or under the moniker First Nations, Indian, native, Inuit, Métis, or some other descrip-tor. The overall comparison begins in 1993/94 and ends in 2011/12.

Ever-higher: Government spending on Canada’s Aboriginals since 1947 / 7
fraserinstitute.org
The fourth set of data is federal, from Health Canada, with only those tax dollars specifically spent on Aboriginal matters collated. The data here starts in 1994/95, the earliest year that online data is available (Canada, 2013b). The Non-Insured Health Benefits (NHIB) spending by Health Canada on First Nations and Inuit peoples is a particular example of a benefit available exclu-sively to those populations, one that is significant in terms of cost and by defin-ition and design unavailable to non-Aboriginal Canadians. The data here reveals that, despite the rhetoric Canadians hear, the recent record is one of generosity to registered First Nations and Inuit peoples with respect to health care.
The data totals: Partial, incomplete, and conservative
The reader should be aware that the estimates herein are partial, incomplete, and thus extremely conservative. The four sets of data are a long way from capturing all possible sources of data since Confederation, assuming full rec-ords exist in print form in the Library of Parliament, provincial legislatures, or elsewhere. Thus, the spending here, derived from available online sources, does not capture all government spending on Aboriginal Canadians, be they First Nations, Inuit, or Métis. Considerable spending has been omitted.
Federally, only spending in three departments—AANDC, Health Canada, and ESDC—were tracked, and thus other federal spending, such as it exists, is not recorded here in either the overall totals or the per-person breakdowns. The reason is straightforward: in these departments, spending on Aboriginal matters is clearly identified in the relevant sections of the Public Accounts and/or was available elsewhere, in online archives.
Others have compiled one-year snapshots of federal spending on Aboriginal Canadians that may give the reader a sense of what other data exists yet to be mined. In 2007, the Congress of Aboriginal Peoples (CAP) combed through the entire federal Public Accounts for 2006/07. In a 293-page report, the CAP found that “thirty-four separate agencies and depart-ments reported program expenditures targeted to Aboriginal people.” In addi-tion, the CAP noted that of $29 billion in grants and contributions managed by federal departments in 2006/07, “approximately one quarter [25 percent] of these expenditures are for approximately 4 percent of the Canadian popu-lation,” i.e., Aboriginals in Canada (CAP, 2007: 2). In other words, much money—far out of proportion to the Aboriginal population in Canada—was spent that year in grants and contributions. If this report attempted, for the 1945 period onward, to replicate the CAP report’s detail for just 2006/07, then the numbers herein would be significantly larger.4
4. Such earlier replication would be impossible because, as the CAP noted (2007: 4), 2006/07 was the first year in which detailed listings were available in the Public Accounts for all grants over $25,000.

8 / Ever-higher: Government spending on Canada’s Aboriginals since 1947
fraserinstitute.org
The numbers in this study are conservative for the additional reason that much of the money spent on administration in AANDC is excluded. That is because, in most years, internal administration spending was not attrib-uted to either Aboriginal or northern priorities. Similarly, and as noted above, spending on northern affairs was excluded even though some of that money would also have been spent on Aboriginal matters. Thus, rather than risk overestimating the spending on Canada’s Aboriginal peoples in AANDC, that department’s administration costs were excluded unless specifically noted in the various documents as attributable to Aboriginal matters. Also, ESDC spending on reserve housing before 2007/08 was not broken out separately in the Public Accounts.
The territories and cities were not surveyed, so if Canada’s urban centers and remote governments have dedicated envelopes for Aboriginal Canadians, such tax dollars are not recorded here.
The conservative nature of the estimates continues with regard to the provinces. At the provincial level, spending was only counted as designated for Aboriginal matters when a ministry was designated as such or where, within a ministry, such spending was clearly identified for an Aboriginal pro-gram or transfer. Even departments which may have contained the word
“Aboriginal” in the ministry title (i.e., the once-named B.C. Ministry of Community, Aboriginal, and Women’s Services), but which did not identify spending specific to Aboriginal matters, were thus not counted as Aboriginal spending.
Lastly, the numbers here are a significant underestimate for another reason: when land and resources are transferred to reserve governments, their value is normally not recorded as an expenditure in federal or provin-cial budgets or the public accounts, even in the departments tracked in this study. For example, in British Columbia, land transfers have occurred that are of significant value to the receiving band government. In my 2008 study on British Columbia’s treaties, I noted that the Vancouver-based Musqueam First Nation received two parcels of land that together could be worth $949 million if developed (Milke, 2008: 65). Another land transfer, seven acres in the Vancouver suburb of Richmond, also occurred in 2008, and while I gave no estimate of that value, those who live in greater Vancouver will know that land in Richmond is not inexpensive. The value of those and other properties transferred to various reserve governments across Canada has never been tallied up, but the value of such transfers would be in addition to the num-bers noted here.
In sum, the very conservative and cautious approach of this study means that much spending on matters pertaining to Aboriginals, and direct transfers to those populations, has been omitted. However, even a partial glimpse reveals some distinct trends: the reality of spending on Aboriginals in Canada is very different from the rhetoric.
Ever-higher: Government spending on Canada’s Aboriginals since 1947 / 9
fraserinstitute.org
First data set: Federal spending at Aboriginal Affairs and Northern Development Canada
The department of Aboriginal Affairs and Northern Development Canada, known for most of its history as the Department of Indian Affairs and Northern Development, is the main dispensary of tax dollars on Aboriginal matters. For example, in its 2011/12 fiscal year, the department expended money on educa-tion, social development, residential schools resolution, “managing individ-ual affairs,” treaty management, governance, economic development, federal administration of reserve land, Métis and non-status organizational capacity development, urban strategies, Métis rights, and internal services, with all of the foregoing including operating, capital, and transfer payments where applicable (Canada, 2013c: 15.2).5
The earliest data on spending on Aboriginal Canadians dates from Confederation, but only in isolated pieces of information. The most consist-ent data for AANDC and its predecessor departments dates from the Second World War. Data in this study dates from 1946/47, in order to correlate with overall federal government spending, where data is available from that latter year through the end of 2011/12 (Canada, 2013a, 2013b).6 Per-person com-parisons begin in 1949/50 to accommodate the 1949 census.
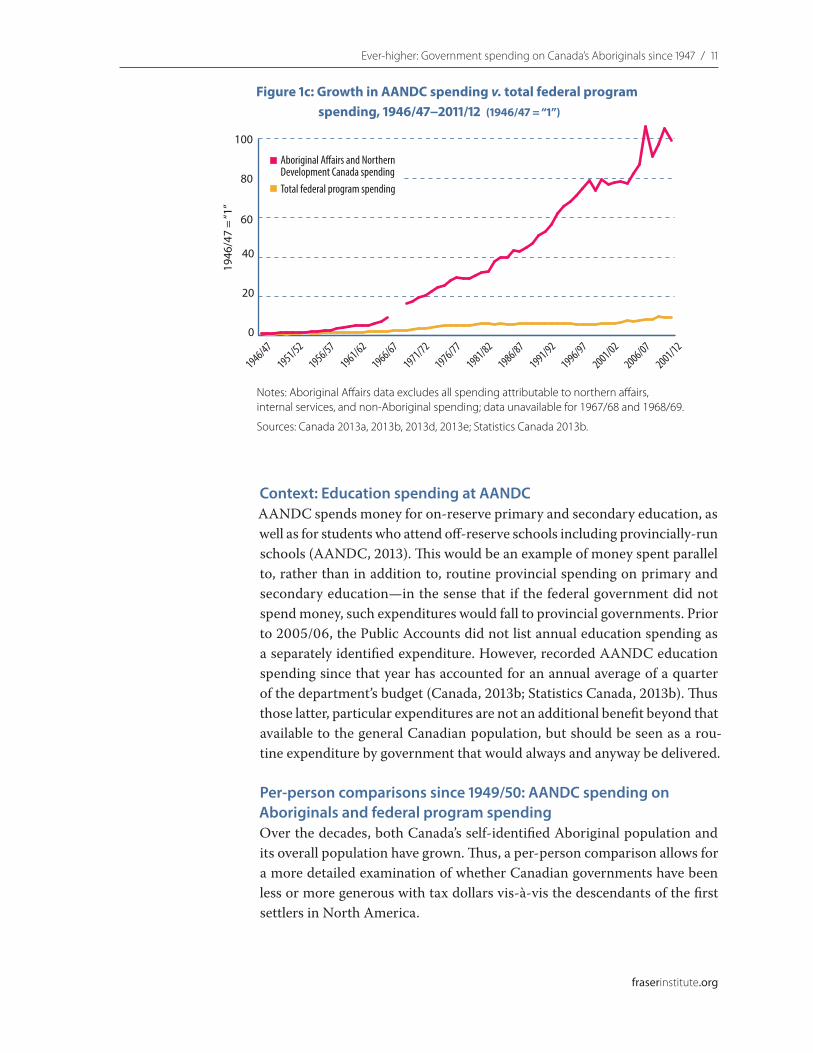
The increase in spending on Canada’s Aboriginal peoples has been significant, both in total dollars spent every year and per registered First Nations person. In real terms (adjusted for inflation to 2013 dollars), depart-ment spending on Aboriginal Canadians rose from $79 million annually in 1946/47 to almost $7.9 billion in 2011/12 (figures 1a, 1c).7 In real, inflation-adjusted terms, that is a 99-fold increase in department spending.
The increase in AANDC spending in real terms is not, of course, a suf-ficient comparison. All federal government spending increased during the period in question: from $27.7 billion in 1946/47 to $251.6 billion in 2011/12 (figure 1b). That is a nine-fold increase in real terms (figures 1b, 1c).
5. “Managing individual affairs” pertains to federal stewardship required under the Indian Act related to Estates, Band moneys, registration and Band membership, and selected other responsibilities (Canada, 2013c: 15.2).6. The exceptions in AANDC data are the 1967/68 and 1968/69 years, where no data was available in online archives.7. Note that department spending on northern affairs has been excluded, as has internal department spending which would have been spent on various department priorities and not just Aboriginal matters.

10 / Ever-higher: Government spending on Canada’s Aboriginals since 1947
fraserinstitute.org
2013
$ b
illio
ns
Figure 1a: Spending on Aboriginal matters by Aboriginal A�airs and Northern Development Canada, 1946/47−2011/12 (2013 $ billions)
Notes: Department spending on northern a�airs was excluded; only the department's spending on Aboriginal matters is included here. Data unavailable for 1967/68 and 1968/69. Spending is in�ation-adjusted to 2013 dollars.
Sources: Canada 2013a, 2013b; Statistics Canada 2013b. .
01
2
3
4
5
6
7
8
9
2001/12
2006/07
2001/02
1996/97
1991/92
1986/87
1981/82
1976/77
1971/72
1966/67
1961/62
1956/57
1951/52
1946/47
$ bi
llion
s
Figure 1b: Total federal program spending, 1946/47−2011/12 (2013 $ billions)
Sources: Canada 2013e, 2013f; Statistics Canada 2013b. .
0
50
100
150
200
250
300
2001/12
2006/07
2001/02
1996/97
1991/92
1986/87
1981/82
1976/77
1971/72
1966/67
1961/62
1956/57
1951/52
1946/47
Ever-higher: Government spending on Canada’s Aboriginals since 1947 / 11
fraserinstitute.org
Context: Education spending at AANDCAANDC spends money for on-reserve primary and secondary education, as well as for students who attend off-reserve schools including provincially-run schools (AANDC, 2013). This would be an example of money spent parallel to, rather than in addition to, routine provincial spending on primary and secondary education—in the sense that if the federal government did not spend money, such expenditures would fall to provincial governments. Prior to 2005/06, the Public Accounts did not list annual education spending as a separately identified expenditure. However, recorded AANDC education spending since that year has accounted for an annual average of a quarter of the department’s budget (Canada, 2013b; Statistics Canada, 2013b). Thus those latter, particular expenditures are not an additional benefit beyond that available to the general Canadian population, but should be seen as a rou-tine expenditure by government that would always and anyway be delivered.
Per-person comparisons since 1949/50: AANDC spending on Aboriginals and federal program spendingOver the decades, both Canada’s self-identified Aboriginal population and its overall population have grown. Thus, a per-person comparison allows for a more detailed examination of whether Canadian governments have been less or more generous with tax dollars vis-à-vis the descendants of the first settlers in North America.
1946
/47
= “1
”
Figure 1c: Growth in AANDC spending v. total federal program spending, 1946/47−2011/12 (1946/47 = “1”)
Notes: Aboriginal A�airs data excludes all spending attributable to northern a�airs, internal services, and non-Aboriginal spending; data unavailable for 1967/68 and 1968/69.
Sources: Canada 2013a, 2013b, 2013d, 2013e; Statistics Canada 2013b.
Aboriginal A�airs and Northern Development Canada spendingTotal federal program spending
0
20
40
60
80
100
2001/12
2006/07
2001/02
1996/97
1991/92
1986/87
1981/82
1976/77
1971/72
1966/67
1961/62
1956/57
1951/52
1946/47

12 / Ever-higher: Government spending on Canada’s Aboriginals since 1947
fraserinstitute.org
AANDC spends tax dollars on more than just the registered First Nations population in Canada. However, the following per-person compari-sons are calculated based on the registered First Nations population, for five reasons. First, the available historical population data that traces back to 1946/1947 only lists registered Indians in every year, and thus a full, year-by-year comparison since that start date is only possible using such data.8 Second, much of the Crown’s relationship with the continent’s first settlers has been in the context of treaties and the 19th-century Indian Act. The bulk of government spending results from that relationship, though much extra spending has occurred beyond that which was strictly required by treaties. Third, while AANDC has also spent money on Inuit and Métis over the years, spending there has been in relatively small amounts; and critically, until recent years, the historical documents did not break down spending by registered Indian/First Nations, Inuit, or Métis.9 Thus, to even produce a decades-long look at Aboriginal spending for recipients of such spending, registered First Nations as the baseline must suffice. Fourth, in the case of the Inuit cohort, readers should recall my previous note that the estimated AANDC spend-ing on Aboriginal matters is conservative, as the numbers gleaned from the documents exclude internal and northern affairs spending. This conservative approach was chosen even though expenditures in both envelopes support the delivery of programs and transfers to Inuit, as three quarters of Canada’s Inuit live in northern communities and thus benefit from such spending (Statistics Canada, 2013c: 5).
Finally, one could estimate AANDC spending spread across the entire Canadian population to arrive at a per-person estimate. However, such a com-parison would miss a central point: those who claim the Canadian state has not provided enough tax dollars to Aboriginals in Canada make an explicit per-person argument based on per-person Aboriginal spending. This is what Phil Fontaine et al. did in 2006, for example, when he and others compared Aboriginal-specific spending to per-person spending on the population at large (Fontaine, Chartier, and Kusugak, 2006: A15). That comparison, as
8. The 1949/50 year population is a reflection of an average of four quarter estimates beginning in the second quarter of 1949 and ending in the first quarter of 1950, averaged for 1949/50. First Nations population is taken from the calendar year 1949, as quarterly population estimates are not available to use as an average.9. In 2011/12, the department spent $16.3 million on Métis and non-status Indian “organ-izational and capacity development” and a further $9.3 million on “Métis rights manage-ment.” That $25.6 million represents just 0.3 percent of the department’s almost $7.9 bil-lion in spending on Aboriginal matters that year. In addition, readers should recall that I have not included the $362.6 million in “internal services” of the department and which would be partly incurred by each of the various programs, including the department’s largest program, for First Nations and Inuit (Canada, 2013c: 15.10).

Ever-higher: Government spending on Canada’s Aboriginals since 1947 / 13
fraserinstitute.org
noted earlier, is a claim about how such per-person Aboriginal amounts were and are spent in addition to the tax dollars spent on all Canadians.
In other words, a per-person measurement based on the registered First Nations population allows for necessary historical consistency in the comparison since 1949/50. It is also a conservative estimate, despite how some AANDC spending is directed towards Inuit and Métis, because inter-nal department and northern affairs spending are both excluded from the calculations. The per-person registered First Nations measurement thus is a defensible, informative, and useful measurement.
AANDC spending per registered First Nations individual increased from $922 in 1949/50 to $9,056 in 2011/12 (figure 1d). That is an 882 per-cent rise in real per-person terms. As for federal program spending on all Canadians during the same period, it too has risen on a per-person basis, from $1,504 in 1949/50 to $7,316 by 2011/12 (figure 1e). That is a 387 per-cent increase. The growth in federal program spending per person (which would include the spending on Aboriginal matters) has been half that of the direct spending on specific Aboriginal matters per registered First Nations person (figure 1f).
2013
$
Figure 1d: AANDC spending on Aboriginal matters per registered First Nations person, 1949/50−2011/12 (2013 $)
Notes: Excludes all spending attributable to northern a�airs, internal services, and non-Aboriginal spending. Data unavailable for 1967/68 and 1968/69. In�ation-adjusted to 2013 dollars.
Sources: Canada 2013a, 2013b, 2013d; Statistics Canada 2013b.
2011/12: $9,056
1949/50: $9220
2,000
4,000
6,000
8,000
10,000
12,000
2008/09
2003/04
1998/99
1993/94
1988/89
1983/84
1978/79
1973/74
1968/69
1961/62
1949/50

14 / Ever-higher: Government spending on Canada’s Aboriginals since 1947
fraserinstitute.org
2013
$
Figure 1e: Federal program spending per person on all Canadians, 1949/50−2011/12 (2013 $)
Sources: Canada, 2013e (1946/47 to 1965/66), 2013f (1966/67 to 2011/12);Statistics Canada, 2013b.
2011/12: $7,316
1949/50: $1,504
01,000
2,000
3,000
4,000
5,000
6,000
7,000
8,000
9,000
2011/12
2006/07
2001/02
1996/97
1991/92
1986/87
1981/82
1976/77
1971/72
1966/67
1961/62
1949/50
Figure 1f: Growth in federal program spending on all Canadians v. growth in AANDC spending on registered First Nations persons, 1949/50−2011/12
Notes: After in�ation adjustments. Aboriginal A�airs data excludes all spending attributable to northern a�airs, internal services, and non-Aboriginal spending.
Sources: Canada, 2013a, 2013b, 2013d, 2013e (1949/50 to 1965/66), 2013f (1966/67 to 2011/12); Statistics Canada, 2013b.
387%
882%
0
200
400
600
800
1000
1200
AANDCFederal

Ever-higher: Government spending on Canada’s Aboriginals since 1947 / 15
fraserinstitute.org
Summary of AANDC spendingOver the decades, inflation-adjusted AANDC spending, both in total and per registered First Nations individual, has grown significantly more than comparable general federal spending. AANDC spent increasing amounts on Canada’s Aboriginal peoples,—once inflation and per-person adjustments are made, and whether measured by the total amount spent every year, or calcu-lated per registered First Nations person or by on-reserve populations—rela-tive to growth in total federal spending.
Second data set: Employment and Social Development Canada expenditures on on-reserve housing
The federal department of Employment and Social Development Canada (ESDC) spends money annually on Aboriginal matters, specifically for hous-ing on reserves across Canada. Housing support data was not broken down separately before 2007/08 in the Public Accounts. However, since that year, on-reserve housing programs funded through ESDC has averaged $242 mil-lion annually (table 1a).
Government subsidies for housing on reserve, insofar as the housing stock is owned by the reserve government or the Crown, are in some cases additional to what most non-Aboriginal Canadians expect in this area. Most Canadians must buy or rent their shelter; it is not owned and maintained by government.
There are exceptions: the federal government, through ESDC, does also spend money on housing for other Canadians. Over the same five years, average assisted housing program expenditures were $1.3 billion annually.
In 2011/12, ESDC expenditures for reserve housing amounted to $479 per person on reserve reporting Aboriginal identity. In contrast, in ESDC’s assisted housing program, expenditures for all Canadians who do not live on reserve amounted to $51 per person (table 1b).

16 / Ever-higher: Government spending on Canada’s Aboriginals since 1947
fraserinstitute.org
Table 1b: Per-person spending comparisons, ESDC, 2011/12
PopulationTotal Aboriginal
identity
On-reserve housing programs
2013 $ billions
Housing expenditure per Aboriginal on reserve
2013 $
On-reserve 324,780 0.156 479
PopulationTotal Canada
off-reserve
Assisted housing programs
2013 $ billions
Housing expenditure per person off reserve
2013 $
Canada 31,451,635 1.61 51
Note: ESDC expends money for housing repair and improvement programs ($48 million in 2011/12), but the Public Accounts do not identify whether such spending is on reserve, off re-serve, or a combination of both.
Sources: Canada, 2013b; HRDC 14.12; Statistics Canada, 2013b.
Table 1a: ESDC on-reserve and non-reserve housing programs
On-reserve housing expenditure2013 $ billions
Assisted housing (non-reserve) expenditure2013 $ billions
2007/08 0.305 1.752008/09 0.301 1.7512009/10 0.221 1.7322010/11 0.227 1.6422011/12 0.156 1.61Total, 2007/08 to 2011/12 1.2 6.735Average annual expenditure 0.242 1.347
Sources: Canada, 2013a, 2013b; Statistics Canada, 2013b.

Ever-higher: Government spending on Canada’s Aboriginals since 1947 / 17
fraserinstitute.org
Third data set: Provincial spending on Aboriginals in Canada
The provinces have increasingly been drawn into spending on Aboriginal matters. From available online sources, identifiable spending on Aboriginals for many provinces began around the turn of millennium, though the data reported in this paper starts in 1993/94 with the available provincial data that does exist.10 Data for all provinces was gleaned from the Public Accounts, budgets and Annual Reports. Expenditures were included if there were specific ministries for Aboriginal priorities, and also if spending specific to Aboriginals was noted in other ministries.11
Total provincial spending on Aboriginal matters rose from $42 million in 1993/94 to $711 million by 2011/12 (figure 2a). Total provincial program spending in the same period rose from $210 billion in 1993/94 to $316 bil-lion 2011/12 (figure 2b).
10. The sources for this section are: Alberta, 2003 to 2013; British Columbia, 1995 to 2013; Manitoba, 1999 to 2012; Ontario, 1994 to 2012; New Brunswick, 2004 to 2012; Newfoundland and Labrador, 2002 to 2012; Nova Scotia, 1999 to 2012; Prince Edward Island, 2007 to 2013; Quebec, 2000 to 2012; Saskatchewan, 1999 to 2013.11. Some provinces, such as Ontario, have had a separate ministry of Aboriginal Affairs since at least 1993/94 (at least that can be traced through online documents). Online records from British Columbia show specific spending on Aboriginal matters back to 1994/95 from available online sources (British Columbia, 1995) and a specific ministry for that priority in subsequent years. However, the Aboriginal-specific ministry has under-gone various iterations, including being subsumed into other ministries for a time. In some years, money normally spent in that ministry (now known as Aboriginal Relations and Reconciliation) has been routed through the Attorney General’s office (in the early 2000s, for treaty negotiations, for example). The 1994/95 start date is based on what was available online (British Columbia, 1995 to British Columbia, 2013).
2013
$ m
illio
ns
Figure 2a: Provincial spending on Aboriginal people, 1993/94−2011/12 (2013 $ millions)
Sources: Statistics Canada, 2013b; provincial budgets, annual reports and Estimates.
2011/12: $711 million
1993/94: $42 million
0
100
200
300
400
500
600
700
800
2011/122009/102007/082005/062003/042001/021999/20001997/981995/961993/94

18 / Ever-higher: Government spending on Canada’s Aboriginals since 1947
fraserinstitute.org
2013
$ b
illio
ns
Figure 2b: Total program spending, all provinces, 1993/94−2011/12 (2013 $ billions)
Sources: Canada, 2013e; Statistics Canada, 2013b, 2013e.
2011/12: $316 bllion
1993/94: $210 billion
0
50
100
150
200
250
300
350
2011/122009/102007/082005/062003/042001/021999/20001997/981995/961993/94
1993
/94
= “1
”
Figure 2c: Provincial spending on Aboriginal matters v. total program spending, all provinces, 1993/94−2011/12 (1993/94 = “1”)
Sources: Statistics Canada, 2013b, 2013e; provincial budgets, annual reports and Estimates; Canada, 2013e .
02
4
6
8
10
12
14
16
18
20
2011/122009/102007/082005/062003/042001/021999/20001997/981995/961993/94
Provincial spending onAboriginal mattersTotal provincial program spending
To compare the two sets of data to a similar starting point, with 1993/94 as year one and with a base value of one, the growth in provincial spending on Aboriginal matters has propelled ahead by a factor of over 17. Total prov-incial program spending (including spending on Aboriginal matters) has risen by a factor of 1.5 (figure 2c).

Ever-higher: Government spending on Canada’s Aboriginals since 1947 / 19
fraserinstitute.org
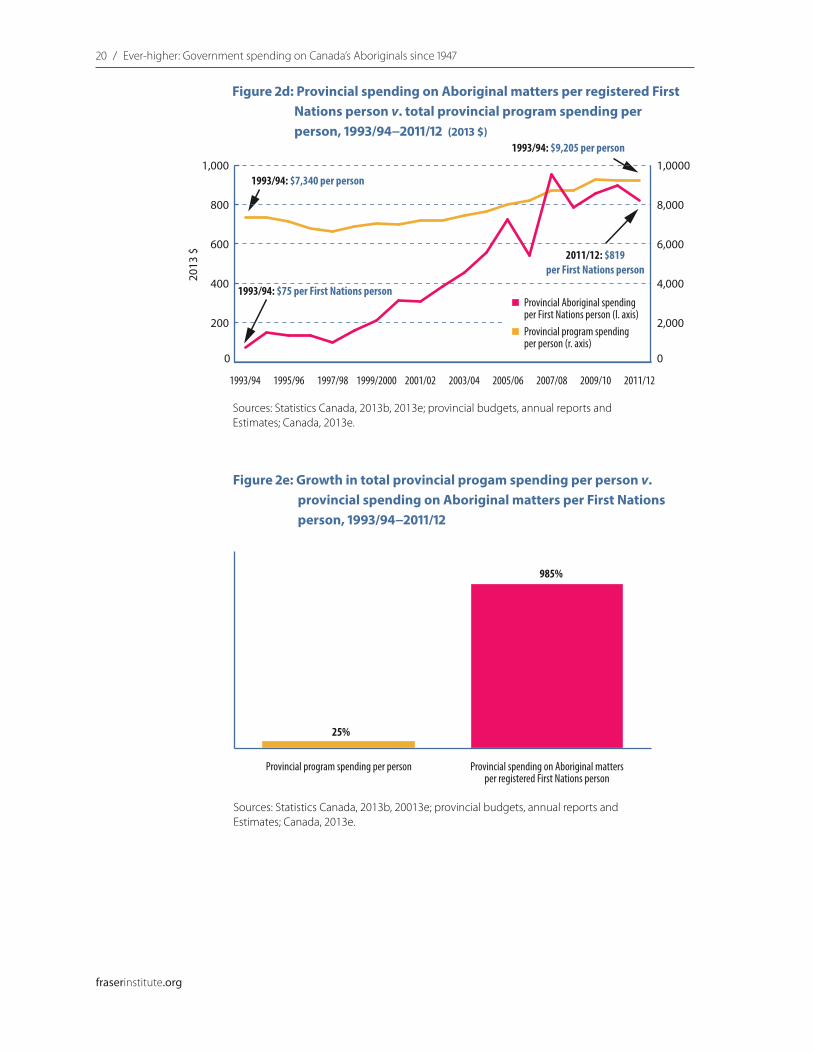
Per-person comparisonsGiven that populations have increased, per-person comparisons help further parse the trends in order to compare provincial spending on Aboriginal mat-ters with overall program spending. Per registered First Nations person, the provinces spent $75 in 1993/94, compared with $819 in 2011/12, a 985 per-cent increase. In comparison, provincial government program spending per person grew from $7,340 in 1993/94 to $9,205 by 2011/12, or by 25 percent (figures 2d, 2e).
What is clear from the data is that first, akin to the federal pattern, provincial spending has risen in real terms, and substantially so compared to the earliest years in the survey; second, per-person spending, as measured by registered First Nations person, is also up, and substantially so.
Selected provinces have increasingly spent more in part due to a ser-ies of court judgments over the years. In particular, British Columbia has been more attentive to Aboriginal issues since at least the early 1990s. This resulted from initial voluntary attempts to sign treaties in a province where they had not previously been signed. After 1997 in particular, the goal of signed treaties became more imperative after a Supreme Court decision, Delgamuukw, declared that Aboriginal title had not been extinguished, thus ensuring that already-begun negotiations took on yet more critical import-ance (Canada, 2000; Lippert et al., 2000). In addition, a series of court cases since Delgamuukw established a cross-country duty to consult and to accom-modate Aboriginal Canadians (UBC, undated; Canada, 2009), even if the precise meaning of those terms is at times unclear or disputed.
20 / Ever-higher: Government spending on Canada’s Aboriginals since 1947
fraserinstitute.org
2013
$
Figure 2d: Provincial spending on Aboriginal matters per registered First Nations person v. total provincial program spending per person, 1993/94−2011/12 (2013 $)
Sources: Statistics Canada, 2013b, 2013e; provincial budgets, annual reports and Estimates; Canada, 2013e.
2011/12: $819per First Nations person
1993/94: $75 per First Nations person
1993/94: $7,340 per person
1993/94: $9,205 per person
Provincial Aboriginal spending per First Nations person (l. axis)Provincial program spending per person (r. axis)
0
200
400
600
800
1,000
0
2,000
4,000
6,000
8,000
1,0000
2011/122009/102007/082005/062003/042001/021999/20001997/981995/961993/94
Figure 2e: Growth in total provincial progam spending per person v. provincial spending on Aboriginal matters per First Nations person, 1993/94−2011/12
Sources: Statistics Canada, 2013b, 20013e; provincial budgets, annual reports and Estimates; Canada, 2013e.
25%
985%
0
200
400
600
800
1000
1200
Provincial spending on Aboriginal mattersper registered First Nations person
Provincial program spending per person

Ever-higher: Government spending on Canada’s Aboriginals since 1947 / 21
fraserinstitute.org
Fourth data set: Health Canada spending
In any debate over whether the amount spent on Aboriginal Canadians is “fair” or “enough,” it is useful to be aware, first, of the transfers that already exist (catalogued in the previous two federal departments and in the provinces), and then of additional benefits provided exclusively to eligible First Nations and Inuit Canadians which are substantial in scope and in cost. Health Canada operates the Non-Insured Health Benefits Program (NIHB) for eligible First Nations and Inuit peoples (Health Canada, 2013a). 896,624 First Nations and Inuit peoples had access to the following extra services, in addition to those they could access at the provincial/territorial level.
• Vision care (expenditures of $29.8 million in 2011/12);• Dental care ($219.1 million);• Medical transportation ($333.3 million); • Pharmaceuticals ($459.4 million);12• Other health care including medical supplies and equipment, short-term
crisis intervention, and mental health counselling. • Monthly health care premiums in the province of British Columbia, which
normally cost between $798 (for an individual) and $1,596 (for a family of three or more) annually (Health Canada, 2013b: 5, 15, 25; British Columbia, undated: 3).
The NIHB website noted a cost in 2011/12 of almost $1.1 billion for these services alone (Health Canada, 2013b: 25). These are not constitution- or treaty-required expenditures. Indeed, the federal government maintains that “current health programs and services including Non-Insured Health Benefits are provided to First Nations and Inuit on the basis of national policy and not due to any constitutional or other legal obligations” (Health Canada, 2012: 2).
The NIHB benefit for First Nations/Inuit is in addition to what 33.7 mil-lion other Canadians have access to through their regular provincial cover-age; the latter must either buy insurance for such services and goods, or pay out of pocket (Statistics Canada, 2013a, 2013b).13
12. The NHIB program covers claims for “pharmacy benefits not covered by private, public or provincial/territorial health care plans” (Health Canada 2013b: 25).13. I have used the Statistics Canada estimate of Canada’s population for the last quarter of 2011 and subtracted the estimate of registered First Nation population for 2011, as nine months of 2011 are in the 2011/12 fiscal year.

22 / Ever-higher: Government spending on Canada’s Aboriginals since 1947
fraserinstitute.org
Total Health Canada spending on Aboriginal mattersTotal Health Canada spending on Canada’s First Nations/Inuit peoples is more than double that $1.1 billion NIHB figure, at $2.4 billion in 2011/12 (figure 3a). That larger number results from additional expenditures by Health Canada on the First Nations/Inuit population beyond just the NIHB program, and for selected primary care and infrastructure support (Canada, 2013c: 13.12). Some of that non-NHIB spending would be akin to provincial spending on health care (infrastructure support for hospitals, for example), which in the case of remote reserves is funded by the federal government. In such cases, the non-NHIB spending should not be considered as additional to services available to every Canadian, but instead as spending parallel to what a prov-incial government would spend on its populations for health services.
In inflation-adjusted terms, Health Canada spending on First Nations/Inuit health care has jumped to $2.4 billion as of 2011/12 from just under $1.3 billion in 1994/95 (figure 3a), a cumulative total of $33.8 billion across those years. On a per-person basis, the amount spent per First Nations/Inuit person was $2,626 in 2011/12, up from $2,055 in 1994/95 (figure 3b).14
14. Health Canada notes in its 2011/12 Annual Report summary that the NIHB program had 896,624 (855,009 First Nations and 41,615 Inuit) eligible clients that year (Health Canada, 2013c). However, for comparative purposes over a 20-year period, I have used a larger number of 972,651 (868,206 First Nations and 59,445 Inuit), as derived from the 2011 census (Statistics Canada, 2013c), because NIHB reports are not made publicly available before recent years and thus the data is not accessible, and because total Health Canada expenditures on Aboriginal Canadians does exist (i.e., the total $2.4 billion in 2011/12 and not just the $1.1 billion for NIHB). I have also used First Nation and Inuit census numbers from 1996, 2001, and 2006 for the same reason: to give the reader a sense of what overall Health Canada spending amounted to per registered First Nations/Inuit person, and an estimate of the numbers of people eligible though not necessarily enrolled in such services in those census years. In other words, by using the larger population cohort to calculate a per-person comparison, the result is a per-First Nations/Inuit-person result that is smaller than it would otherwise be—an underestimate, not an overestimate.

fraserinstitute.org / 23
2013
$ b
illio
ns
Figure 3a: Health Canada spending on First Nations and Inuit, 1994/95−2011/12 (2013 $ billions)
Sources: Canada, 2013b; Health Canada, 2013b; Statistics Canada, 2013b.
2011/12: $2.4 billion
1994/95: $1.3 billion
0.0
0.5
1.0
1.5
2.0
2.5
3.0
2010/112008/092006/072004/052002/032000/011998/991996/971994/95
2013
$
Figure 3b: Health Canada First Nations/Inuit spending per eligible First Nations/Inuit client (2013 $)
Sources: Canada, 2013b, 2013d; Health Canada, 2013b; Statistics Canada, 2001, 2006,2013b, 2013d.
$2,626
$2,055
$2,847
$2,222
02011/122006/072001/021996/97

24 / fraserinstitute.org
3. Summary look at selected government spending on Aboriginal Canadians
In some instances, money is spent on Aboriginal matters in parallel to what would have been spent had the priority in question been run by another level of government. The most obvious example here is education spending: on-reserve education spending would be money spent via provincial govern-ments, or partially by local ratepayers, if First Nations children were enrolled in provincial school systems. But in many cases, as in ESDC expenditures for on-reserve housing and Health Canada’s Non-Insured Health Benefits, Aboriginal Canadians benefit from spending that is exclusive of the major-ity of Canadians.
To be clear, beyond the examples given of parallel programs, every Canadian regardless of ancestry has the right to access federal, provincial, and municipal programs on the same basis as everyone else, though exclu-sions may exist for age (e.g., Old Age Security benefits) or income (provincial welfare cheques are collected by the poor and not the middle or high income earners). With the exception of programs specifically designed for designated groups—e.g., First Nations and Inuit access to certain programs—ancestry is not a disqualification for any government program, service, or benefit. Any Canadian, Aboriginal or non-Aboriginal, has the untrammeled legal right to arrive at a hospital and receive treatment. Canadians can also choose to reside in any village, town, or city, and to enroll their children in school. There are instances where access to such services may be difficult—for example, those who live on remote reserves may not be able to easily access a health care clinic or hospital in a major city, and parents will not be able to enroll their children in a town or city school if they live on a remote reserve. But such access problems are true of rural Canada in general (access is always more difficult the further one lives from a large population hub).
As noted at the start of this paper, the numbers herein are conserv-ative. Federally, only three departments were examined for spending on Aboriginals—AANDC (1946/47 to 2011/12), ESDC (2007/08 to 2011/12), and Health Canada (1994/95 to 2011/12). In addition, provincial sources were chronicled, but there may well have been additional expenditures not

Ever-higher: Government spending on Canada’s Aboriginals since 1947 / 25
fraserinstitute.org
explicitly noted and thus missed. Municipal and territorial spending was not analyzed.
Still, from the limited data utilized, just under $235 billion is found to have been spent on Aboriginals:
• AANDC Aboriginal-specific spending, 1946/47 through 2011/12 ($193.1 billion);
• Health Canada spending, 1994/95 through 2011/12 ($33.8 billion); • Provincial government spending with various start years over the past two
decades through 2011/12 ($6.8 billion);• ESDC expenditures on on-reserve housing, 2007/08 through 2011/12 ($1.2
billion).
Overall, this partial look at three federal departments and provin-cial government spending reveals inflation-adjusted spending on Canada’s Aboriginal population that has risen substantially, whether measured in spending in the particular department, in comparison with overall govern-ment program spending (federal or provincial), or in relevant per-person comparisons in each case.

26 / Ever-higher: Government spending on Canada’s Aboriginals since 1947
fraserinstitute.org
Table 2: Spending on Aboriginals—a limited look
2013 $ billions
Aboriginal Affairs and Northern Development Canada, 1946/47 to 2011/12
193.1
Health Canada, 1994/95 to 2011/12 33.8
Provincial governments, various start years (earliest is 1993/94, Ontario) to 2011/12
6.8
Employment and Social Development Canada, 2008/08 to 2011/12
1.2
Total for four measurements, various years 234.9
Notes: AANDC figures exclude spending on northern affairs, include only spending on Aboriginal peoples; data was unavailable for 1967/68 and 1968/69.
Sources: Canada, 2013a, 2013b; Statistics Canada, 2013b.
Table 3: Spending on individuals, 2011/12
2013 $
Aboriginal Affairs and Northern Development Canada, per registered First Nations individual
9,056
Health Canada, per registered First Nations individual and Inuit 2,626
Provincial governments, per registered First Nations individual 819
Employment and Social Development Canada, per Aboriginal identity individual on reserve
479
Notes: AANDC figures exclude spending on northern affairs, include only spending on Aboriginal peoples; data was unavailable for 1967/68 and 1968/69.
A per capita total here would not be consistent, as Health Canada spending is calculated per First Nations and Inuit cohort; AANDC and provincial government spending is per registered First Nations individuals; ESDC spending is calculated per First Nations person on reserve. The reason for the varying per-person comparisons is to relate the total expenditures in Table 2 in a manner con-sistent with the population most likely to be directly affected by the expenditure. In other words, it makes sense to calculate Health Canada spending relative to the recipients (First Nations and Inuit) while it also makes sense to apportion ESDC on-reserve housing expenditures relative to First Nations people who live on reserve, rather than the total First Nations cohort, a majority of whom live off-reserve (Canada 2013d).
Sources: Canada, 2013a, 2013b, 2013d; Statistics Canada, 2013b.

fraserinstitute.org / 27
Conclusion: Is existing spending “enough”?
As to whether such spending is “enough,” the question is unanswerable, given that an answer would revolve around whether government spending is the most effective way of helping Aboriginal Canadians (when such help is needed), whether such spending has some other, unintended effects, whether federal changes to Indian Act provisions on private property might be more useful in the promotion of prosperity and social indicators (see Alcantra and Flanagan, 2000; Flanagan and Beauregard, 2013), and whether other policy changes might be beneficial.
Such questions are worth further study. What the data in this report indicates is that, at minimum, significant and increasing amounts have been spent on Canada’s Aboriginal population over the decades, both in actual terms and per registered First Nations person. Any debate over the “proper” amount of taxpayer dollars to spend on Aboriginals should take into account existing spending levels—not previously quantified—which are at or near his-torically elevated levels, depending on the specific measurement.
Beyond the unanswerable question of whether existing government spending on Aboriginal Canadians is “enough,” excessive, or misdirected, a positive and useful question to investigate is: what will promote Aboriginal prosperity?15 That question is helpful to ponder in all discussions that sur-round existing government spending on Canada’s Aboriginal population.
15. Here, one need not reinvent the wheel. As the Fraser Institute’s Economic Freedom of the World index has demonstrated empirically, what matters to a jurisdiction’s prosperity is a moderate size of government, a well-functioning legal system including the exercise and protection of property rights, sound money, freedom to trade internationally, and sensible but not overweening regulation (Gwartney et al., 2013: 3-7). Getting the balance there right matters to desirable social outcomes. Greater economic freedom is positively correlated with higher economic growth, a greater share of income for the poorest, life expectancy, and civil and political rights (Gwartney et al., 2013: 2-23). Such positive approaches to governance with subsequent rising social indicators have been more or less adopted at various periods in the last two centuries (or even earlier, depending on the country) by jurisdictions as diverse as the United Kingdom, the United States, Canada, Australia, Hong Kong, Singapore, Taiwan, Chile, Israel, and South Korea, among many others (Gwartney et al., 2013: 8; Maddison, 2001).

28 / fraserinstitute.org
References
Alcantra, Christopher, and Tom Flanagan (2002). Individual Property Rights on Canadian Indian Reserves. Fraser Institute. <http://www.fraserinstitute.org/WorkArea/DownloadAsset.aspx?id=3083>
Assembly of First Nations (2012). Resolutions. Annual General Assembly, Whitehorse. <http://www.afn.ca/uploads/files/sca_2012_resolutions_web.pdf>
Assembly of First Nations (2013). Resolutions. Annual General Assembly, Whitehorse. <http://www.afn.ca/uploads/files/aga-res-2013.pdf>
Atleo, Shawn (2012). First Nations must be partners, not an afterthought. Globe and Mail. <http://www.theglobeandmail.com/commentary/first-nations-must-be-partners-not-an-afterthought/article4492344/>
Chung, Amy (2011, December 8). Attawapiskat ‘our Third World,’ interim Liberal leader says. Edmonton Journal. <http://www2.canada.com/edmontonjournal/news/story.html?id=3d345b5b-a21c-44f6-8513-5f698b5034ea>
Clibbon, Jennifer (2013, January 17). Paul Martin says Ottawa has ‘no understanding’ of native issues. CBC. <http://www.cbc.ca/news/canada/story/2013/01/16/f-idle-no-more-paul-martin.html>
Congress of Aboriginal Peoples [CAP] (2007). Where Does the Money Go? Proactive Disclosure of Grants and Contributions for Aboriginal People. <http://www.abo-peoples.org/wp-content/uploads/2013/01/where_moneygo.pdf>
Deloitte (2012). Specific auditing procedures relating to Attawapiskat First Nation. Report to the Chief Audit and Evaluation Executive—Aboriginal Affairs and Northern Development Canada. <http://www.aadnc-aandc.gc.ca/DAM/DAM-INTER-HQ-AEV/STAGING/texte-text/au_atw2_1351105081058_eng.pdf>
Websites retrievable as of November 10, 2013.
Ever-higher: Government spending on Canada’s Aboriginals since 1947 / 29
fraserinstitute.org
Fekete, Jason (2005, August 10). Premiers Commit to Helping Aboriginals: No Dollar Figure Set for 10-year Plan. Calgary Herald: A4.
Flanagan, Tom (2000). First Nations, Second Thoughts. Queen’s University Press.
Flanagan, Tom, and Katrine Beauregard (2013). The Wealth of First Nations: An Exploratory Study. Fraser Institute. <http://www.fraserinstitute.org/uploadedFiles/fraser-ca/Content/research-news/research/publications/wealth-of-first-nations.pdf>
Fontaine, Phil, Clement Chartier, and Jose Kusugak (2006, May 29). Behind and Beyond Kelowna. National Post: A15.
Gallagher, Bill (2012). Resource Rulers: Fortune and Folly on Canada’s Road to Resources. Bill Gallagher.
Gwartney, James, et al. (2013). Economic Freedom of the World: 2013 Annual Report. Fraser Institute. <http://www.freetheworld.com/2013/EFW2013-complete.pdf>
Huber, Jordana (2008, March 27). Fontaine: ‘Growing Frustration’; Native Leader Says new Protests to ‘Reach Out’. National Post: A8.
Lippert, Owen (ed.) (2000). Beyond the Nass Valley: National Implications of the Supreme Court’s Delgamuukw Decision. Fraser Institute. <http://www.fraserinstitute.org/publicationdisplay.aspx?id=12840&terms=Delgamuukw>
Maddison, Angus. (2001). The World Economy: A Millennial Perspective. Organisation for Economic Co-operation and Development.
Milke, Mark (2008). Incomplete, Illiberal, and Expensive: A Review of 15 Years of Treaty Negotiations in British Columbia and Proposals for Reform. Fraser Institute. <http://www.fraserinstitute.org/WorkArea/DownloadAsset.aspx?id=3078>
Morris, Alexander (2000). The Treaties of Canada with the Indians. Prospero Canadian Collection.
Seguin, Rheal. (2011). Innu Reach Deal with Hydro-Québec on $6.5-billion Project. Globe and Mail. <http://www.theglobeandmail.com/news/politics/innu-reach-deal-with-hydro-quebec-on-65-billion-project/article563320/>
St. Arnaud, Pierre (2006, June 28). Quebec Innu Suit Seeks $11-billion Over Dams. Globe and Mail: A5.

30 / Ever-higher: Government spending on Canada’s Aboriginals since 1947
fraserinstitute.org
Government sources
Aboriginal Affairs and Northern Development Canada [AANDC] (2013).Elementary/Secondary Education Programs. <http://www.aadnc-aandc.gc.ca/eng/1100100033676/1100100033677>
Alberta, Departments of Aboriginal Relations, Intergovernmental, International and Aboriginal Relations, Aboriginal Affairs, and Northern Development (2003–2013). Annual Reports. Government of Alberta.
British Columbia, Ministry of Health (undated). Medical Services Premiums. Government of British Columbia. <http://www.health.gov.bc.ca/msp/infoben/premium.html>
British Columbia, Department of Finance (1995). 1995 Budget Reports. Government of British Columbia. <http://www.fin.gov.bc.ca/archive/budget95/95rpt_b.htm#summary>
British Columbia, Departments of Aboriginal Affairs, Attorney General, Attorney General and Ministry Responsible for Treaty Negotiations, Aboriginal Relations and Reconciliation, Finance (1995–2013). Annual Reports, Budgets, and Estimates. Government of British Columbia.
Canada (2000). Aboriginal Title: The Supreme Court of Canada Decision in Delgamuukw v. British Columbia. Library of Parliament. <http://www.parl.gc.ca/content/lop/researchpublications/bp459-e.htm>
Canada (2009). Settling Comprehensive Land Claims. Library of Parliament. <http://www.parl.gc.ca/Content/LOP/ResearchPublications/prb0916-e.pdf>
Canada (2013a). Indian Affairs Annual Reports 1864-1990. Library and Archives Canada. <http://www.collectionscanada.gc.ca/databases/indianaffairs/001074-110.01-e.php?&interval=100&PHPSESSID=ej4dv41h4le5q2klqs12i69og4>
Canada (2013b). Public Accounts of Canada, 1990/91 to 1993/94 [in print], 1994/95 to 2011/12 [online]. Public Works and Government Services Canada. <http://epe.lac-bac.gc.ca/100/201/301/public_accounts_can/pdf/index.html>
Canada (2013c). Public Accounts of Canada 2011/12. Public Works and Government Services Canada. <http://www.tpsgc-pwgsc.gc.ca/recgen/cpc-pac/2012/pdf/2012-vol2-eng.pdf>

Ever-higher: Government spending on Canada’s Aboriginals since 1947 / 31
fraserinstitute.org
Canada (2103d). Data on registered First Nations on-reserve and off-reserve population from personal e-mail communication from Aboriginal Affairs and Northern Development Canada, October 3.
Canada (2013e). Fiscal Reference Tables, 2013. Department of Finance. <http://www.fin.gc.ca/frt-trf/2013/frt-trf-13-eng.xls>
Canada (2013f ). Fiscal Reference Tables, 1996. Department of Finance. <http://www.fin.gc.ca/toc/1996/frt_-eng.asp>
Health Canada (2012). Your Health Benefits: A Guide for First Nations to Access Non-Insured Health Benefits. <http://www.hc-sc.gc.ca/fniah-spnia/alt_formats/pdf/pubs/nihb-ssna/yhb-vss/nihb-ssna-yhb-vss-eng.pdf>
Health Canada (2013a). Non-insured health benefits program update. <http://www.hc-sc.gc.ca/fniah-spnia/nihb-ssna/benefit-prestation/newsletter-bulletin-eng.php#sept-1>
Health Canada (2013b). Non-Insured Health Benefits Program Annual Report 2011/2012. Sent by e-mail by the department, September 18.
Health Canada (2013c). Non-Insured Health Benefits Program Annual Report 2011/2012 (Summary). <http://www.hc-sc.gc.ca/fniah-spnia/pubs/nihb-ssna/2011_rpt/index-eng.php.>
Manitoba, Ministry of Finance (1999–2012). Annual Reports and Quarterly Reports 1999 to 2012. Government of Manitoba.
Ontario, Ministry of Finance (1994–2012). Public Accounts 1995 to 2012. Government of Ontario.
New Brunswick (2004–2012). Public Accounts 2004–2012. Government of New Brunswick.
Newfoundland and Labrador, Department of Labrador and Aboriginal Affairs (2002–2012). Annual Reports 2002–2012. Government of Newfoundland and Labrador.
Nova Scotia, Department of Finance (1999–2012). Public accounts, budgets, and supplementary estimates, 1999–2006, 2007–2008, 2012–2013. Government of Nova Scotia.
Prince Edward Island (2007–2013). Public Accounts 2007, 2009–2013. Government of Prince Edward Island.

32 / Ever-higher: Government spending on Canada’s Aboriginals since 1947
fraserinstitute.org
Quebec, Ministry of Finance (2000–2012). Public Accounts 2000, 2002-12. Government of Quebec.
Saskatchewan, Ministries of Government Relations, Finance, and First Nations and Métis Relations (1999–2013). Estimates 1998/99–2001/02; Public Accounts 2003/04–2012/13. Government of Saskatchewan.
Statistics Canada (2001). Census of population, 2001: Aboriginal Identity Population, 2001 Counts. <http://www12.statcan.ca/english/census01/products/highlight/Aboriginal/Page.cfm?Lang=E&Geo=PR&View=1a&Table=1&StartRec=1&Sort=2&B1=Counts01&B2=Total>
Statistics Canada (2006). Aboriginal Peoples in Canada, 2006. <http://www12.statcan.ca/census-recensement/2006/as-sa/97-558/pdf/97-558-XIE2006001.pdf>
Statistics Canada (2013a). Estimates of population, Canada, provinces and territories. Table 051-0005. <http://www5.statcan.gc.ca/cansim/a26?lang=eng&retrLang=eng&id=0510005&paSer=&pattern=&stByVal=1&p1=1&p2=31&tabMode=dataTable&csid=>
Statistics Canada (2013b). Consumer Price Index. CANSIM Table 326-0020.
Statistics Canada (2013c). Aboriginal peoples in Canada: First Nations People, Metis, and Inuit. National Household Survey, Catalogue no. 99-011-X2011001. <http://www12.statcan.gc.ca/nhs-enm/2011/as-sa/99-011-x/99-011-x2011001-eng.pdf>
Statistics Canada (2013d). Census of population, 2006.
Statistics Canada (2013e). Estimates of population, by age group and sex for July 1, Canada, provinces and territories, annual (persons unless otherwise noted). Table 051-0001. <http://www5.statcan.gc.ca/cansim/a47>

Ever-higher: Government spending on Canada’s Aboriginals since 1947 / 33
fraserinstitute.org
About the author
Mark MilkeDr. Mark Milke is a Senior Fellow at the Fraser Institute. He is the author of four books, including his most recent revised book, Tax Me I’m Canadian: A Taxpayer’s Guide to Your Money and How Politicians Spend It. His pub-lic policy papers include a comparison of oil-producing countries’ records on human rights, federal-provincial transfer payments, automobile insur-ance, taxpayer subsidies for political parties, the flat tax, corporate welfare, airline competition, and public sector pension plans. In addition, he has also published papers with Washington, D.C.-based institutes such as the American Enterprise Institute, the Competitive Enterprise Institute, and the Heritage Foundation. He has also published with the Brussels-based Centre for European Studies.
Dr. Milke’s columns have appeared Canada-wide in the National Post, Toronto Star, Globe and Mail, Ottawa Citizen, Montreal Gazette, Vancouver Sun, Winnipeg Free Press and Quebecor chain of newspapers. He is also chair-man of Canada’s Journal of Ideas—C2C Journal.ca, an occasional lecturer in Political Philosophy and International Relations at the University of Calgary, and a Saturday columnist for the Calgary Herald. Mark Milke has a Master’s degree from the University of Alberta where his M.A. thesis analyzed human rights in East Asia; he also has a Ph.D. from the University of Calgary where his doctoral dissertation analyzed the rhetoric of Canadian-American rela-tions. He lives in Calgary.
Acknowledgments
The author wishes to thank Ravina Bains, Jason MacDonald, Joel Emes, and the Department of Aboriginal and Northern Affairs Canada for their as-sistance. The author also wishes to thank several anonymous reviewers for their helpful comments. Any remaining errors or omissions are the author’s responsibility. The views expressed do not necessarily reflect those of the supporters, trustees, or staff of the Fraser Institute.

34 / Ever-higher: Government spending on Canada’s Aboriginals since 1947
fraserinstitute.org
Publishing information
DistributionThese publications are available from <http://www.fraserinstitute.org> in Portable Document Format (PDF) and can be read with Adobe Acrobat® or Adobe Reader®, versions 7 or later. Adobe Reader® XI, the most recent ver-sion, is available free of charge from Adobe Systems Inc. at <http://get.adobe.com/reader/>. Readers having trouble viewing or printing our PDF files us-ing applications from other manufacturers (e.g., Apple’s Preview) should use Reader® or Acrobat®.
Ordering publicationsTo order printed publications from the Fraser Institute, please contact the publications coordinator:
• e-mail: [email protected] • telephone: 604.688.0221 ext. 580 or, toll free, 1.800.665.3558 ext. 580 • fax: 604.688.8539.
MediaFor media enquiries, please contact our Communications Department:
• 604.714.4582 • e-mail: [email protected].
CopyrightCopyright © 2013 by the Fraser Institute. All rights reserved. No part of this publication may be reproduced in any manner whatsoever without written permission except in the case of brief passages quoted in critical articles and reviews.
Date of issueDecember 2013
ISBN978-0-88975-281-8
CitationMilke, Mark (2013). Ever-Higher: Government Spending on Canada’s Aboriginals Since 1947. Fraser Institute. <http://www.fraserinstitute.org>.
Cover designBill Ray
Cover images©Adreyuu, Bigstock® (“Mythological image eagle”)

Ever-higher: Government spending on Canada’s Aboriginals since 1947 / 35
fraserinstitute.org
Supporting the Fraser Institute
To learn how to support the Fraser Institute, please contact
• Development Department, Fraser Institute Fourth Floor, 1770 Burrard Street Vancouver, British Columbia, V6J 3G7 Canada
• telephone, toll-free: 1.800.665.3558 ext. 586
• e-mail: [email protected]
Lifetime patronsFor their long-standing and valuable support contributing to the success of the Fraser Institute, the following people have been recognized and inducted as Lifetime Patrons of the Fraser Institute.
Sonja Bata
Charles Barlow
Ev Berg
Art Grunder
Jim Chaplin
Serge Darkazanli
John Dobson
Raymond Heung
Bill Korol
Bill Mackness
Fred Mannix
Jack Pirie
Con Riley
Catherine Windels

36 / Ever-higher: Government spending on Canada’s Aboriginals since 1947
fraserinstitute.org
Purpose, funding, & independence
The Fraser Institute provides a useful public service. We report objective information about the economic and social effects of current public policies, and we offer evidence-based research and education about policy options that can improve the quality of life.
The Institute is a non-profit organization. Our activities are funded by charitable donations, unrestricted grants, ticket sales, and sponsorships from events, the licensing of products for public distribution, and the sale of publications.
All research is subject to rigorous review by external experts, and is conducted and published separately from the Institute’s Board of Trustees and its donors.
The opinions expressed by the authors are those of the individuals themselves, and do not necessarily reflect those of the Institute, its Board of Trustees, its donors and supporters, or its staff. This publication in no way implies that the Fraser Institute, its trustees, or staff are in favour of, or op-pose the passage of, any bill; or that they support or oppose any particular political party or candidate.
As a healthy part of public discussion among fellow citizens who de-sire to improve the lives of people through better public policy, the Institute welcomes evidence-focused scrutiny of the research we publish, including verification of data sources, replication of analytical methods, and intelligent debate about the practical effects of policy recommendations.

Ever-higher: Government spending on Canada’s Aboriginals since 1947 / 37
fraserinstitute.org
About the Fraser Institute
Our vision is a free and prosperous world where individuals benefit from greater choice, competitive markets, and personal responsibility. Our mission is to measure, study, and communicate the impact of competitive markets and government interventions on the welfare of individuals.
Founded in 1974, we are an independent Canadian research and edu-cational organization with locations throughout North America and interna-tional partners in over 85 countries. Our work is financed by tax-deductible contributions from thousands of individuals, organizations, and foundations. In order to protect its independence, the Institute does not accept grants from government or contracts for research.
Nous envisageons un monde libre et prospère, où chaque personne bénéfi-cie d’un plus grand choix, de marchés concurrentiels et de responsabilités individuelles. Notre mission consiste à mesurer, à étudier et à communiquer l’effet des marchés concurrentiels et des interventions gouvernementales sur le bien-être des individus.
Peer review —validating the accuracy of our researchThe Fraser Institute maintains a rigorous peer review process for its research. New research, major research projects, and substantively modified research conducted by the Fraser Institute are reviewed by experts with a recognized expertise in the topic area being addressed. Whenever possible, external review is a blind process. Updates to previously reviewed research or new editions of previously reviewed research are not reviewed unless the update includes substantive or material changes in the methodology.
The review process is overseen by the directors of the Institute’s re-search departments who are responsible for ensuring all research published by the Institute passes through the appropriate peer review. If a dispute about the recommendations of the reviewers should arise during the Institute’s peer review process, the Institute has an Editorial Advisory Board, a panel of scholars from Canada, the United States, and Europe to whom it can turn for help in resolving the dispute.

38 / Ever-higher: Government spending on Canada’s Aboriginals since 1947
fraserinstitute.org
Members
Past members
Editorial Advisory Board
* deceased; † Nobel Laureate
Prof. Terry L. Anderson
Prof. Robert Barro
Prof. Michael Bliss
Prof. Jean-Pierre Centi
Prof. John Chant
Prof. Bev Dahlby
Prof. Erwin Diewert
Prof. Stephen Easton
Prof. J.C. Herbert Emery
Prof. Jack L. Granatstein
Prof. Herbert G. Grubel
Prof. James Gwartney
Prof. Ronald W. Jones
Dr. Jerry Jordan
Prof. Ross McKitrick
Prof. Michael Parkin
Prof. Friedrich Schneider
Prof. Lawrence B. Smith
Dr. Vito Tanzi
Prof. Armen Alchian*
Prof. James M. Buchanan* †
Prof. Friedrich A. Hayek* †
Prof. H.G. Johnson*
Prof. F.G. Pennance*
Prof. George Stigler* †
Sir Alan Walters*
Prof. Edwin G. West*