Embed Size (px)
Citation preview
8/11/2019 Centre for Science and Environment Media Briefing on Mining Imact on Environment
http://slidepdf.com/reader/full/centre-for-science-and-environment-media-briefing-on-mining-imact-on-environment 1/12
01 MINING IN INDIA
M
I N I N G
I N
I N D I A
India is a mineral-rich country, with more than 20,000 mineral deposits. The country produces about 90 minerals,
which include four fuel, 10 metallic, 50 non-metallic, three atomic and 23 minor minerals. It is the second largest
producer of chromite, barytes and talc in the world, and ranks third in production of coal and lignite, and fourth in
production of iron ore, kyanite, andalusite and silimanite.
In 2010-11, the number of reporting mines in India was 2,628. Most of the country’s mining activities are
concentrated in the states of Gujarat, Andhra Pradesh, Jharkhand, Madhya Pradesh, Rajasthan, Karnataka, Odisha,
Tamil Nadu, Maharashtra, Chhattisgarh and West Bengal. Together, these 11 states account for 92 per cent of the
mines in the country.
Mineral wealth: a primer
Coal : Seven per cent of the world's proven coal reserves are in India. In 2010-11, the country produced 537
million tonnes (MT), an increase of 1 per cent over the previous year. The value of coal produced in 2010-11 stood
at Rs 49,012 crore. At present, more than 70 per cent of the coal produced in India is used in the power sector.
Chhattisgarh is the largest coal-producing state, with a share of 21 per cent, followed closely by Odisha and
Jharkhand with about 20 per cent each.
Bauxite: Bauxite production declined by four per cent to 13.4 MT in 2010-11, from 14 MT in 2009-10. The value
of bauxite production in 2010-11 was Rs 503 crore. The aluminium industry accounts for more than 85 per cent of
bauxite consumption in the country.
Iron ore: Hematite and magnetite are the most important iron ores in India. The production of iron ore in the
country stood at 212.6 MT in 2010-11, with a value of Rs 34,852 crore. Odisha (34 per cent), Karnataka (21 per
cent), Goa (15 per cent) and Chhattisgarh (14 per cent) are the leading producers. Close to 98 per cent of iron ore
consumed domestically is used by the iron and steel (including sponge iron) industry.
Limestone: Limestone production was 240 MT in 2010-11, with a value of Rs 3,220 crore. Limestone is mainly
used in the cement industry. Leading producer states include Andhra Pradesh, Rajasthan, Madhya Pradesh, Gujarat,
Tamil Nadu, Chhattisgarh and Karnataka.
Copper : India produced about 3 MT of copper in 2008-09. Rajasthan accounted for half of the production, while
the other half was accounted for by Madhya Pradesh and Jharkhand.
Production and value
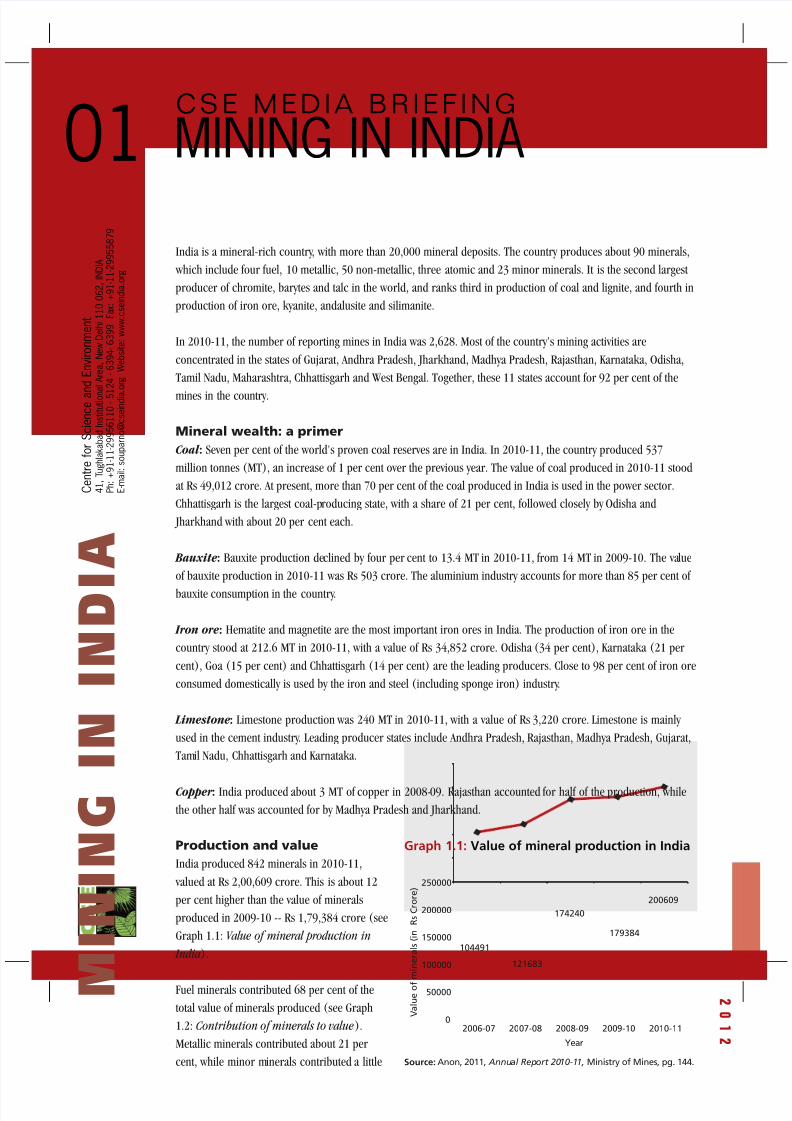
India produced 842 minerals in 2010-11,
valued at Rs 2,00,609 crore. This is about 12
per cent higher than the value of minerals
produced in 2009-10 -- Rs 1,79,384 crore (see
Graph 1.1: Value of mineral production in
India).
Fuel minerals contributed 68 per cent of the
total value of minerals produced (see Graph
1.2: Contribution of minerals to value).
Metallic minerals contributed about 21 per
cent, while minor minerals contributed a little
2
0
1
2
C e n t r e f o r S c i e n c e a n d E n v i r o n m e n t
4 1 ,
T u g h l a k a b a d I n s t i t u t i o n
a l A r e a ,
N e w D e l h i 1 1 0 0 6 2 ,
I N D I A
P h : + 9 1 - 1 1 - 2 9 9 5 6 1 1 0 - 5 1 2 4 - 6 3 9 4 - 6 3 9 9
F a x : + 9 1 - 1 1 - 2 9 9 5 5 8 7 9
E - m a i l : s o u p a r n o @ c s e i n d i a . o r g
W e b s i t e : w w w . c s e i n d i a . o r g
Graph 1.1: Value of mineral production in India
104491
121683
174240
179384
200609
0
50000
100000
150000
200000
250000
2006-07 2007-08 2008-09 2009-10 2010-11
Year
V a l u e o f
m i n e r a l s ( i n
R s C r o r e )
Source: Anon, 2011, Annual Report 2010-11, Ministry of Mines, pg. 144.
C S E M E D I A B R I E F I N G

8/11/2019 Centre for Science and Environment Media Briefing on Mining Imact on Environment
http://slidepdf.com/reader/full/centre-for-science-and-environment-media-briefing-on-mining-imact-on-environment 2/12
01
M
I N I N G
I N
I N D I A
2
0
1
2
C e n t r e f o r S c i e n c e a n d E n v i r o n m e n t
4 1 ,
T u g h l a k a b a d I n s t i t u t i o n
a l A r e a ,
N e w D e l h i 1 1 0 0 6 2 ,
I N D I A
P h : + 9 1 - 1 1 - 2 9 9 5 6 1 1 0 - 5 1 2 4 - 6 3 9 4 - 6 3 9 9
F a x : + 9 1 - 1 1 - 2 9 9 5 5 8 7 9
E - m a i l : s o u p a r n o @ c s e i n d i a . o r g
W e b s i t e : w w w . c s e i n d i a . o r g
over 9 per cent. Non-metallic and precious
minerals together accounted for the rest.
The mining and quarrying sector accounted
for 2.26 per cent of the total Gross DomesticProduct (GDP) (at constant prices) in 2010-
11; the previous year, its contribution had
stood at 2.5 per cent.
In India, a miner has to take a
Reconnaissance Permit (RP) to carry out
regional exploration, a Prospecting Licence
(PL) to identify a potential resource and a
Mining Lease (ML) for mining of a mineral. In
March 2009, there were about 9,400 MLs in India covering an area of half a million hectare (ha).
The private sector holds 95 per cent of the total number of MLs and 70 per cent area under MLs in the country. In
2010-11, Rajasthan had the maximum leases both in terms of numbers and area. Odisha came in second in terms
of area covered, followed by Karnataka and Andhra Pradesh. Limestone had the maximum number of MLs (1,733),
followed by quartz (1,434), iron ore (769) and felspar (667).
The total value of ores and minerals exported from India in 2008-09 was Rs 1,09,296 crore – this was 13 per cent
of the value of all exports from India in that year. Diamonds contributed more than 65 per cent of the export value.
These exports were to 193 countries, with the maximum exports to China followed by Hong Kong, the UAE, USA and
Belgium.
The total value of imports of minerals and ores in 2008-09 was Rs 5,14,509 crore; this was 37 per cent of the total value of imports in India. Petroleum was the largest import item with more than 65 per cent share in the total value
of imports. Minerals were imported from 134 countries with Saudi Arabia at the top, followed by the UAE, Iran,
Nigeria, Kuwait and Iraq.
Mining regulation in India
The Mines and Minerals (Development and Regulation) (MMDR) Act, 1948 was the first legal framework for
regulation and development of mines in independent India. Enacted in 1957 by the Parliament, two set of rules were
made under the Act – the Mineral Concession Rules (MCR) and the Mineral Conservation and Development Rules
(MCDR).
The MMDR Act has been amended four times since 1957. The first amendment came in 1972 which enhanced
government control over mining. The second amendment in 1986 further increased the Central government’s
control on mining and introduced the concept of an approved mining plan. In order to attract investments, the
procedure for granting mineral concessions was simplified by another amendment in 1994. This amendment also
introduced the concept of a Large Area Prospecting Licence (LAPL).
Another amendment to the MMDR came in 1999 after a committee reviewed the Act. This amendment comprised of
a number of changes – introduction of reconnaissance operations prior to prospecting and a Reconnaissance
Permit (RP), delegation of powers to the state government, liberalisation of area restrictions, etc.
Following the mid-term appraisal of the 10th Five-year Plan, the Planning Commission constituted a high-level
committee under its member Anwarul Hoda to recommend changes in the mining policy and laws to address issues
ranging from non-transparency in allocation of mineral resources and illegal mining to addressing the social and
environmental impacts of mining.
Graph 1.2: Contribution of minerals to value
68.0
21.02.0
9.0
Fuel minerals Metallic minerals Minor minerals
Non metallic and precious minerals
Source: Anon, 2011, Annual Report 2010-11, Ministry of Mines, pg. 144.
8/11/2019 Centre for Science and Environment Media Briefing on Mining Imact on Environment
http://slidepdf.com/reader/full/centre-for-science-and-environment-media-briefing-on-mining-imact-on-environment 3/12
01
M
I N I N G
I N
I N D I A
2
0
1
2
C e n t r e f o r S c i e n c e a n d E n v i r o n m e n t
4 1 ,
T u g h l a k a b a d I n s t i t u t i o n
a l A r e a ,
N e w D e l h i 1 1 0 0 6 2 ,
I N D I A
P h : + 9 1 - 1 1 - 2 9 9 5 6 1 1 0 - 5 1 2 4 - 6 3 9 4 - 6 3 9 9
F a x : + 9 1 - 1 1 - 2 9 9 5 5 8 7 9
E - m a i l : s o u p a r n o @ c s e i n d i a . o r g
W e b s i t e : w w w . c s e i n d i a . o r g
The Hoda Committee report was published in July 2006 with wide-ranging recommendations like institutionalising a
Sustainable Development Framework (SDF) to address social, economic and environmental issues arising out of
mining ( see box ). Based on the report, the government came out with a new National Mineral Policy (NMP) in
2008. Following this, the Union ministry of mines has framed a new Mines and Minerals (Development &
Regulation) Bill to replace the MMDR Act, 1957.
The Hoda reportThe committee aims at diluting the environmental clearance process to attract investment
In its mid-term appraisal of the 10th Five-Year Plan, the Planning Commission realised that the National
Mineral Policy (NMP), adopted in 1993 “for encouraging the flow of private investment in exploration and
mining”, had not lived up to its billing. The reason for believing the NMP had failed was laid out thus:
“[S]o far, the Central government has approved as many as 188 reconnaissance permits, involving an area
of 2,54,307.303 sq km… and the Foreign Investment Promotion Board has granted 73 approvals for FDI
(foreign direct investment) in the mining sector involving an investment of Rs 4,044 crore… there is no
successful case of a reconnaissance permit being converted into a mining lease so far (emphasis added).
…this is mainly due to procedural delays in various clearances at both the Central and state government
levels, especially in the case of mandatory environmental clearance and inadequate infrastructure.”
A ‘high-level committee’ was, therefore, constituted in September 2005 under Anwarul Hoda,
member, Planning Commission. The committee’s terms of reference were:
to review the NMP and the Mines and Minerals (Development and Regulation) Act, 1957 and suggest
the changes needed for encouraging investment
to review existing procedures for granting Reconnaissance Permits (RPs), Prospecting Licences (PLs),
and Mining Leases (MLs) and suggest ways for their streamlining and simplification
to review the procedures for according clearance to mineral exploration and mining projects under
the Forest (Conservation) Act, 1980 and Environment (Protection) Act, 1986, and suggest ways for
speeding them up
to prioritise critical infrastructure needs of the Indian mining sector and make recommendations on
ways to facilitate investment to meet these needs
to examine the implications of the policy of mineral-rich states to make value addition within the state
a condition for grant of mineral concession and make appropriate recommendations in this regard
to examine ways of augmenting state revenues from the mineral sector, and
to examine any other issue relevant for stimulating investment flows and inducting stateof-the-art
technology into the sector.The committee submitted its report in June 2006.
Blinkered vision
Between 1993-94 and 2005-06, the mineral sector had been growing at a rate of 10.7 per cent, but had also
caused massive environmental damage, economic marginalisation and social unrest. The NMP, which had
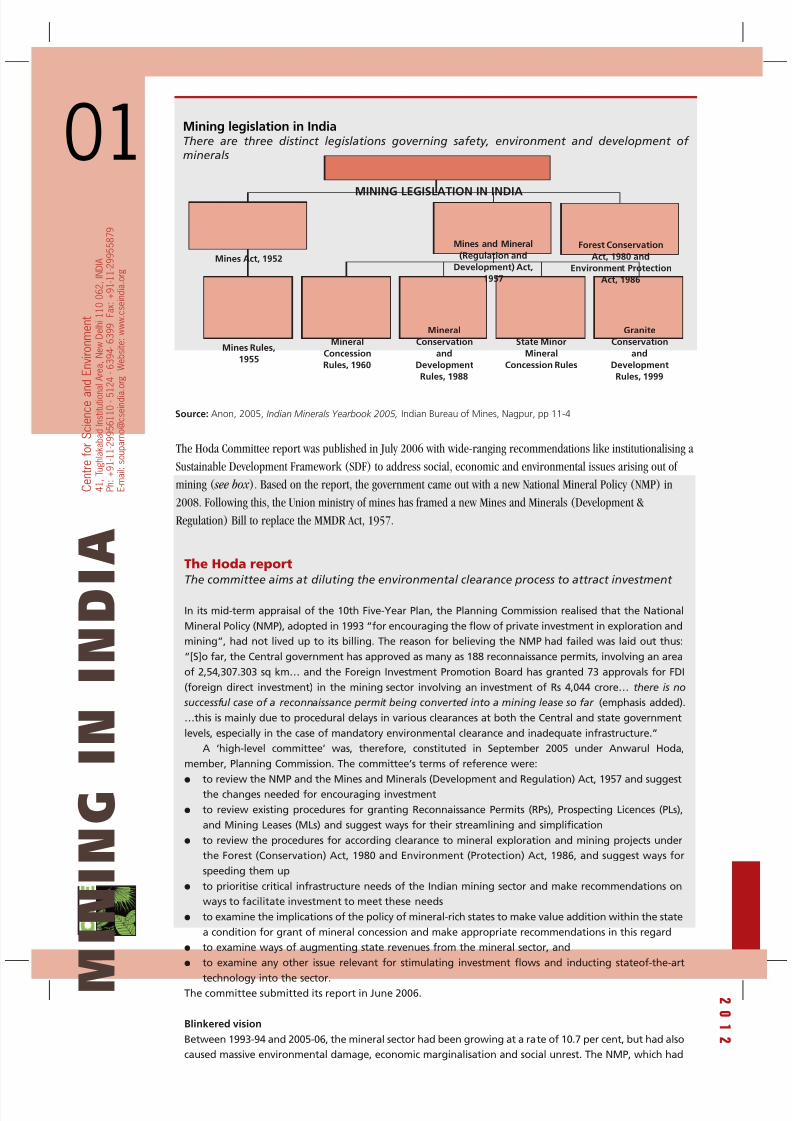
Source: Anon, 2005, Indian Minerals Yearbook 2005, Indian Bureau of Mines, Nagpur, pp 11-4
Mining legislation in IndiaThere are three distinct legislations governing safety, environment and development of minerals
Mines Rules,
1955
Mineral
Concession
Rules, 1960
Mineral
Conservation
and
Development
Rules, 1988
State Minor
Mineral
Concession Rules
Granite
Conservation
and
Development
Rules, 1999
Mines Act, 1952
Mines and Mineral
(Regulation and
Development) Act,
1957
Forest Conservation
Act, 1980 and
Environment Protection
Act, 1986
MINING LEGISLATION IN INDIA
8/11/2019 Centre for Science and Environment Media Briefing on Mining Imact on Environment
http://slidepdf.com/reader/full/centre-for-science-and-environment-media-briefing-on-mining-imact-on-environment 4/12
01
M
I N I N G
I N
I N D I A
2
0
1
2
C e n t r e f o r S c i e n c e a n d E n v i r o n m e n t
4 1 ,
T u g h l a k a b a d I n s t i t u t i o n
a l A r e a ,
N e w D e l h i 1 1 0 0 6 2 ,
I N D I A
P h : + 9 1 - 1 1 - 2 9 9 5 6 1 1 0 - 5 1 2 4 - 6 3 9 4 - 6 3 9 9
F a x : + 9 1 - 1 1 - 2 9 9 5 5 8 7 9
E - m a i l : s o u p a r n o @ c s e i n d i a . o r g
W e b s i t e : w w w . c s e i n d i a . o r g
emphasised on meeting the environmental and social challenges posed by mining rather than fast-tracking
private investment, failed to deliver on these fronts, a fact ignored while finalising the terms of reference
for the Hoda committee. The committee’s terms concentrated almost exclusively on streamlining
procedures to facilitate private investment without recognising the serious environmental and social issues.
This was reflected in the composition of the committee, which consisted solely of government and
business representatives. L P Sonkar, adviser (minerals), Planning Commission, and convener of the Hoda
committee, put things in perspective with a rhetorical question to Down To Earth: “Do you expect us to
call tribals to the committee?”
Apart from this built-in bias, there was a flawed presumption: the committee said that between
conservation and exploitation of forest resources, the government always favoured conservation, with
the judiciary’s intervention making mining clearance more difficult. But statistics say otherwise: the
speed and scale of clearances for mining has, in fact, been increasing over the years. Under the Forest
Conservation Act (FCA), 1980, forestry clearance was required from the Union ministry of environment
and forests (MoEF). In the 17 years (1980-1997) since FCA came into force, forest clearances were granted
on an average to roughly 20 mining projects, diverting 2,030 ha annually. Between 1998 and 2005, MoEF
cleared about 125 mining projects diverting 8,650 ha of forest land annually.
Private unlimited
To solve the social-environmental problems, the committee pinned its faith on two mechanisms – the
sustainable development framework and Global Reporting Initiative (GRI), a multi-stakeholder group based
in Amsterdam which develops reporting guidelines for corporates. Under fire for their poor environmental,social and human rights records in the developing world (see Box: Mine sharks), the world’s leading
multinational mining companies had decided in 2000 to initiate a project to examine the role of the sector
in contributing to sustainable development. Nine of these companies contracted the International Institute
for Environment and Development to undertake the Mining, Minerals and Sustainable Development
Project (MMSD), which came out with a wish list of sustainable development principles.
Meanwhile, in 2001, these mining companies also promoted the International Council on Mining and
Metals (ICMM) to improve their image. The MMSD’s sustainable development principles were then
converted into a framework by ICMM, to be implemented by all its members. It mandated an annual
report on social and environment performance to be verified by private auditors under GRI.
The problem with the framework was that it was no different from existing voluntary certification
systems. Its principles were so broad and vague – for example, contributing to social, economic and
institutional development of communities – that companies could claim they adhered to them without
doing much. The reporting and verification process was also farcical: companies could write what theywanted because verifiers were paid by them. In India, mining companies are supposed to submit annual
environmental audit reports and half-yearly progress reports on environment management plans. Given
that this mandatory system has failed, it is unlikely that a voluntary one will help make mining
sustainable. Not surprisingly, the committee believes if the framework is implemented, more forest land
can be opened to mining.
Mine sharksHoda committee lays the red carpet for MNCs
In 2006, each of the world’s top four mining companies posted net profits of over US $5 billion – the
largest, Australia’s BHP Billiton, earned US $10 billion. When operating in developing countries, these
companies are not above exploiting states with lax laws to circumvent environmental and social safety
nets.
BHP Billiton operated the OK Tedi mine from 1984-2002 in Papua New Guinea. It had to be hauled
up before the International Water Tribunal at The Hague in 1996 to force it to stop dumping 80,000-1,20,000 tonne of waste rock each day into local waters, drowning over 170 sq km of forest, destroying
the river’s ecology and displacing almost 50,000 people. Three years after reaching an estimated
US $500 million settlement that required BHP to reform its waste disposal practices and compensate
local communities, it announced that no waste disposal method could sufficiently mitigate the
environmental impacts of the mine.
US-based Newmont Mining Company is being held accountable by the Indonesian government for
the pollution of Buyat Bay. Between 1996 and 2004, the Newmont Minahasa Raya gold mine disposed
off its tailings into the bay. The tailings had mercury and arsenic levels much higher than the
government standards. Newmont reached an out-of-court case settlement of US $30 million with the
Indonesian government in February 2002. The company continues to dump 1,20,000 tonne of waste
every day into the Senunu Bay from another Indonesian mine.

8/11/2019 Centre for Science and Environment Media Briefing on Mining Imact on Environment
http://slidepdf.com/reader/full/centre-for-science-and-environment-media-briefing-on-mining-imact-on-environment 5/12
01
M
I N I N G
I N
I N D I A
2
0
1
2
C e n t r e f o r S c i e n c e a n d E n v i r o n m e n t
4 1 ,
T u g h l a k a b a d I n s t i t u t i o n
a l A r e a ,
N e w D e l h i 1 1 0 0 6 2 ,
I N D I A
P h : + 9 1 - 1 1 - 2 9 9 5 6 1 1 0 - 5 1 2 4 - 6 3 9 4 - 6 3 9 9
F a x : + 9 1 - 1 1 - 2 9 9 5 5 8 7 9
E - m a i l : s o u p a r n o @ c s e i n d i a . o r g
W e b s i t e : w w w . c s e i n d i a . o r g
Through the thicket
At the core of the Hoda committee’s recommendations on forest clearance are proposals to change laws
to assure prospectors they will get forest clearance if they find minerals.
Under existing FCA guidelines, permission to survey, explore or prospect for minerals in forest areas
does not imply leases will be granted. Before granting leases, detailed impact assessment has been
envisaged to protect ecologically sensitive areas.According to the Hoda committee, however, “such a stipulation militates against the seamless transfer
dispensation that the committee would like to promote to attract investment into mining”. It wants the
government to spell out in advance the conditions to be met during mining so that forest clearance can
be granted without a hitch. This recommendation is based on the belief that “the miner eventually leaves
the land and can recreate or even improve upon the forest as it existed before commencement of
operations”. But the 500-odd officially declared abandoned mines (there are thousands of unofficial ones)
belie this claim. International experience with mining rehabilitation hasn’t been great either.
Cosmetic change
The core of the committee’s recommendations for speeding up the forest clearance process is
outsourcing the responsibility of divisional forest officers (DFOs) and attenuating the MoEF’s role. It has
also proposed a coordination-cum-empowered committee (CCEC) at the Centre and in states to act as a
single-window clearance outpost. It has recommended that mine lease, forestry and environmental
clearance should be parallel rather than sequential processes. No major change has, however, been
proposed at the Central level; the committee has recommended that MoEF’s internal processes remain
unchanged – its decisions will be binding on the CCEC. The problem is that the committee has taken a
blinkered view of restructuring systems to minimise delays in granting of leases. Take the case of
renewing leases. The Hoda committee wants the clearance process for renewals to be a mere formality,
unless there are serious adverse effects on the forest and wildlife or environment in an area or violations
of stipulated conditions. But it has not specified a mechanism through which ‘serious adverse effects’ can
be identified and monitored.
The need for renewals arises to assess damage from actual mining operations and to then decide on
a future course of action. Industry cannot complain as cases of large mines being denied renewals on
ecological or environmental grounds are almost non-existent. Mines like the Sukinda chromite mines in
Jajpur, Orissa, should not have been granted renewals because of the extensive damage they caused;
they still got the green signal because regulators often reasoned that since the damage had already been
done, mining should continue!
So, while the Hoda committee’s proposals on renewals might not materially change the situation,
what should be put in place is a system in which ecological and environmental performance of mines are
periodically assessed and renewals granted on the basis of ground reports.
Public limited
The Hoda committee wants public hearings to be dispensed with for mining leases for areas less than 50
ha and for renewals of any leases. It also wants them to be limited to issues arising out of environmental
impact assessment (EIA) reports and to people, legislators or NGOs of areas concerned – complete
outsiders should not participate. Though the last suggestion is part of the new EIA clearance process, the
implications of the first two are disastrous. To say that 50-ha mining does not need public hearings is toimply it has no environmental impacts. However, the number of people a 50-ha mine can affect and the
environmental degradation it can cause has been witnessed across the land. The recommendation of the
committee to dump public hearings for renewals does not take into account the fact that these are the
only forums in which affected communities can express their opinions.
Another damaging recommendation, which, if accepted, could multiply environmental and social
problems many times relates to size. The Hoda committee wants the upper limit for a single mine lease
to go up from the existing 10 sq km (there are a few exceptions in the public sector) to 50-100 sq km to
develop “world-class ore bodies”. What it does not tell is how to deal with massive displacement,
especially given that the government can’t even deal with the current levels of displacement.
Clearly, for mining to remain a viable economic activity, a ‘social licence to operate’ must be
enshrined in future legislation. People will voluntarily accept change if they perceive an overall benefit.
But if impoverishment is the anticipated consequence of mining, people will resist. If people do not wantmining, then it can only happen with the help of the coercive power of the State, which will be
accompanied by large-scale human rights violations and social and economic dislocation. Hoda’s report
comes to the aid of this process of coercion.
Down To Earth, April 30, 2007
8/11/2019 Centre for Science and Environment Media Briefing on Mining Imact on Environment
http://slidepdf.com/reader/full/centre-for-science-and-environment-media-briefing-on-mining-imact-on-environment 6/12
01
M
I N I N G
I N
I N D I A
2
0
1
2
C e n t r e f o r S c i e n c e a n d E n v i r o n m e n t
4 1 ,
T u g h l a k a b a d I n s t i t u t i o n
a l A r e a ,
N e w D e l h i 1 1 0 0 6 2 ,
I N D I A
P h : + 9 1 - 1 1 - 2 9 9 5 6 1 1 0 - 5 1 2 4 - 6 3 9 4 - 6 3 9 9
F a x : + 9 1 - 1 1 - 2 9 9 5 5 8 7 9
E - m a i l : s o u p a r n o @ c s e i n d i a . o r g
W e b s i t e : w w w . c s e i n d i a . o r g
Pollution standards for miningLax and minimal
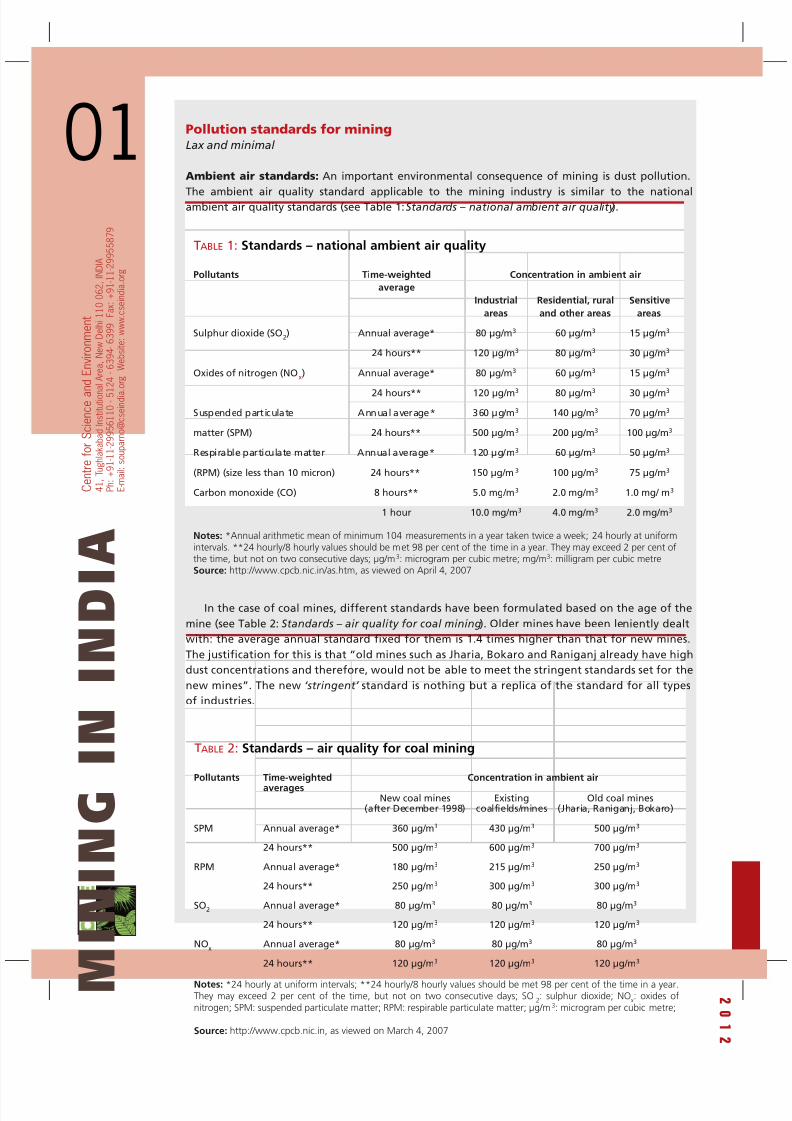
Ambient air standards: An important environmental consequence of mining is dust pollution.
The ambient air quality standard applicable to the mining industry is similar to the nationalambient air quality standards (see Table 1: Standards – national ambient air quality ).
In the case of coal mines, different standards have been formulated based on the age of the
mine (see Table 2: Standards – air quality for coal mining). Older mines have been leniently dealt
with: the average annual standard fixed for them is 1.4 times higher than that for new mines.
The justification for this is that “old mines such as Jharia, Bokaro and Raniganj already have high
dust concentrations and therefore, would not be able to meet the stringent standards set for the
new mines”. The new ‘stringent’ standard is nothing but a replica of the standard for all types
of industries.
Pollutants Time-weighted Concentration in ambient air
average
Industrial Residential, rural Sensitive
areas and other areas areas
Sulphur dioxide (SO2) Annual average* 80 µg/m3 60 µg/m3 15 µg/m3
24 hours** 120 µg/m3 80 µg/m3 30 µg/m3
Oxides of nitrogen (NOx) Annual average* 80 µg/m3 60 µg/m3 15 µg/m3
24 hours** 120 µg/m3 80 µg/m3 30 µg/m3
Suspended particulate Annual average* 360 µg/m3 140 µg/m3 70 µg/m3
matter (SPM) 24 hours** 500 µg/m3 200 µg/m3 100 µg/m3
Respirable particulate matter Annual average* 120 µg/m3 60 µg/m3 50 µg/m3
(RPM) (size less than 10 micron) 24 hours** 150 µg/m3 100 µg/m3 75 µg/m3
Carbon monoxide (CO) 8 hours** 5.0 mg/m3 2.0 mg/m3 1.0 mg/ m3
1 hour 10.0 mg/m3 4.0 mg/m3 2.0 mg/m3
Notes: *Annual arithmetic mean of minimum 104 measurements in a year taken twice a week; 24 hourly at uniformintervals. **24 hourly/8 hourly values should be met 98 per cent of the time in a year. They may exceed 2 per cent ofthe time, but not on two consecutive days; µg/m3: microgram per cubic metre; mg/m3: milligram per cubic metreSource: http://www.cpcb.nic.in/as.htm, as viewed on April 4, 2007
TABLE 1: Standards – national ambient air quality
Pollutants Time-weighted Concentration in ambient air
averagesNew coal mines Existing Old coal mines
(after December 1998) coalfields/mines (Jharia, Raniganj, Bokaro)
SPM Annual average* 360 µg/m3 430 µg/m3 500 µg/m3
24 hours** 500 µg/m3 600 µg/m3 700 µg/m3
RPM Annual average* 180 µg/m3 215 µg/m3 250 µg/m3
24 hours** 250 µg/m3 300 µg/m3 300 µg/m3
SO2 Annual average* 80 µg/m3 80 µg/m3 80 µg/m3
24 hours** 120 µg/m3 120 µg/m3 120 µg/m3
NOx
Annual average* 80 µg/m3 80 µg/m3 80 µg/m3
24 hours** 120 µg/m3 120 µg/m3 120 µg/m3
Notes: *24 hourly at uniform intervals; **24 hourly/8 hourly values should be met 98 per cent of the time in a year.They may exceed 2 per cent of the time, but not on two consecutive days; SO
2: sulphur dioxide; NO
x: oxides of
nitrogen; SPM: suspended particulate matter; RPM: respirable particulate matter; µg/m3: microgram per cubic metre;
Source: http://www.cpcb.nic.in, as viewed on March 4, 2007
TABLE 2: Standards – air quality for coal mining
8/11/2019 Centre for Science and Environment Media Briefing on Mining Imact on Environment
http://slidepdf.com/reader/full/centre-for-science-and-environment-media-briefing-on-mining-imact-on-environment 7/12
01
M
I N I N G
I N
I N D I A
2
0
1
2
C e n t r e f o r S c i e n c e a n d E n v i r o n m e n t
4 1 ,
T u g h l a k a b a d I n s t i t u t i o n
a l A r e a ,
N e w D e l h i 1 1 0 0 6 2 ,
I N D I A
P h : + 9 1 - 1 1 - 2 9 9 5 6 1 1 0 - 5 1 2 4 - 6 3 9 4 - 6 3 9 9
F a x : + 9 1 - 1 1 - 2 9 9 5 5 8 7 9
E - m a i l : s o u p a r n o @ c s e i n d i a . o r g
W e b s i t e : w w w . c s e i n d i a . o r g
Standards for work environment dust
levels: The dust level at workplace has been
specified under the Metalliferous Mines
Regulations (MMR), 1961 and the Coal Mine
Regulations, 1957. Respirable dust
concentration in the workplace should notexceed five milligram per cubic metre for
manganese; for all other types of mines,
including coal, it should not exceed the value
which is arrived at by dividing the figure of
15 with the percentage of free respirable
silica present in the sample. The MMR, 1961
has specifically dealt with asbestos and states
that respirable asbestos fibres should not
exceed two fibres per mililitre of air sampled
by an open membrane filter.
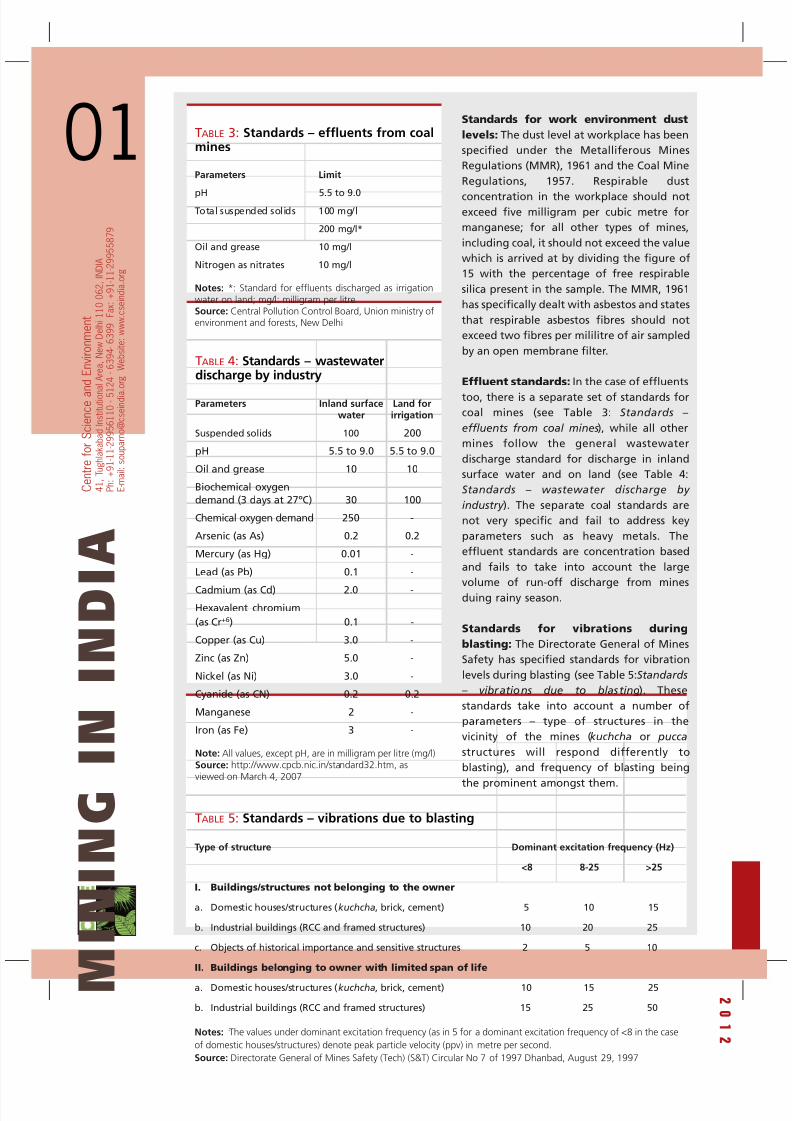
Effluent standards: In the case of effluents
too, there is a separate set of standards for
coal mines (see Table 3: Standards –
effluents from coal mines), while all other
mines follow the general wastewater
discharge standard for discharge in inland
surface water and on land (see Table 4:
Standards – wastewater discharge by
industry ). The separate coal standards are
not very specific and fail to address key
parameters such as heavy metals. The
effluent standards are concentration based
and fails to take into account the large
volume of run-off discharge from mines
duing rainy season.
Standards for vibrations during
blasting: The Directorate General of Mines
Safety has specified standards for vibration
levels during blasting (see Table 5:Standards
– vibrations due to blasting). These
standards take into account a number of
parameters – type of structures in the
vicinity of the mines (kuchcha or pucca
structures will respond differently to
blasting), and frequency of blasting being
the prominent amongst them.
Parameters Limit
pH 5.5 to 9.0Total suspended solids 100 mg/l
200 mg/l*
Oil and grease 10 mg/l
Nitrogen as nitrates 10 mg/l
Notes: *: Standard for effluents discharged as irrigationwater on land; mg/l: milligram per litreSource: Central Pollution Control Board, Union ministry ofenvironment and forests, New Delhi
Parameters Inland surface Land forwater irrigation
Suspended solids 100 200
pH 5.5 to 9.0 5.5 to 9.0
Oil and grease 10 10
Biochemical oxygen
demand (3 days at 27ºC) 30 100
Chemical oxygen demand 250 -
Arsenic (as As) 0.2 0.2
Mercury (as Hg) 0.01 -
Lead (as Pb) 0.1 -
Cadmium (as Cd) 2.0 -
Hexavalent chromium
(as Cr+6) 0.1 -
Copper (as Cu) 3.0 -
Zinc (as Zn) 5.0 -
Nickel (as Ni) 3.0 -
Cyanide (as CN) 0.2 0.2
Manganese 2 -
Iron (as Fe) 3 -
Note: All values, except pH, are in milligram per litre (mg/l)Source: http://www.cpcb.nic.in/standard32.htm, asviewed on March 4, 2007
TABLE 4: Standards – wastewaterdischarge by industry
TABLE 3: Standards – effluents from coalmines
Type of structure Dominant excitation frequency (Hz)
<8 8-25 >25
I. Buildings/structures not belonging to the owner
a. Domestic houses/structures (kuchcha, brick, cement) 5 10 15
b. Industrial buildings (RCC and framed structures) 10 20 25
c. Objects of historical importance and sensitive structures 2 5 10
II. Buildings belonging to owner with limited span of life
a. Domestic houses/structures (kuchcha, brick, cement) 10 15 25
b. Industrial buildings (RCC and framed structures) 15 25 50
Notes: ‘ The values under dominant excitation frequency (as in 5 for a dominant excitation frequency of <8 in the case
of domestic houses/structures) denote peak particle velocity (ppv) in metre per second.
Source: Directorate General of Mines Safety (Tech) (S&T) Circular No 7 of 1997 Dhanbad, August 29, 1997
TABLE 5: Standards – vibrations due to blasting
8/11/2019 Centre for Science and Environment Media Briefing on Mining Imact on Environment
http://slidepdf.com/reader/full/centre-for-science-and-environment-media-briefing-on-mining-imact-on-environment 8/12
01
M
I N I N G
I N
I N D I A
2
0
1
2
C e n t r e f o r S c i e n c e a n d E n v i r o n m e n t
4 1 ,
T u g h l a k a b a d I n s t i t u t i o n
a l A r e a ,
N e w D e l h i 1 1 0 0 6 2 ,
I N D I A
P h : + 9 1 - 1 1 - 2 9 9 5 6 1 1 0 - 5 1 2 4 - 6 3 9 4 - 6 3 9 9
F a x : + 9 1 - 1 1 - 2 9 9 5 5 8 7 9
E - m a i l : s o u p a r n o @ c s e i n d i a . o r g
W e b s i t e : w w w . c s e i n d i a . o r g
The ministry had put out a draft of the Bill in the public domain in June 2010. A Group of Ministers (GoM) was
constituted under Pranab Mukherjee, the then minister of finance, to consider the draft Bill and give
recommendations on various issues -- including one on sharing profits from mining with the local community. The
GoM recommendations were included in a new draft in 2011 ( see attached note on the new draft ). The Bill has
not yet progressed from its draft stage.
Mineral Concession Rules, 1960: The Mineral Concession Rules (MCR) outline the procedures and conditions
for obtaining a prospecting license and mining lease. These rules also stipulate that a ‘mining plan’ shall
incorporate, among others, a plan of the area indicating water sources, limits of forest areas, density of tress, impact
of mining activity on forest, land surface and environment including air and water pollution; scheme for restoration
of the area by afforestation, adoption of pollution control devices and such measures as may be directed by
concerned Central and state government agencies. Environmental management plans, it follows, are part of the
mining plans.
Mineral Conservation and Development Rules, 1988: The Mineral Conservation and Development Rules
(MCDR) lay down guidelines for ensuring mining on a scientific basis, while conserving the environment at the sametime. The MCDR also govern the specifications in terms of submission and reporting in case of reconnaissance
operations, prospecting or applying for a mining plan. These rules also specify the operation and working of open-
cast and underground mines, procedures to follow in case of abandonment or temporary closure of mines, and
beneficiation studies.
Environmental legislation: Environmental legislation has to cover many areas, including comprehensive
environmental impact analysis to ensure that projects that are ecologically destructive are not allowed, identification
of ‘no-go’ areas, effective forest and wildlife acts to protect biodiversity, and regulations governing mine closure and
mine restoration. There are five main environmental acts that impact the mining industry in India:
• The Water (Prevention and Control of Pollution) Act, 1974 (amended in 1988)
• The Air (Prevention and Control of Pollution) Act, 1981 (amended in 1988)• The Environment (Protection) Act, 1986 (with rules 1986 and 1987) (EPA)
• The Forest (Conservation) Act, 1980 (amended in 1988)
• The Wildlife (Protection) Act, 1972 (amended in 1991)
Impacts of mining
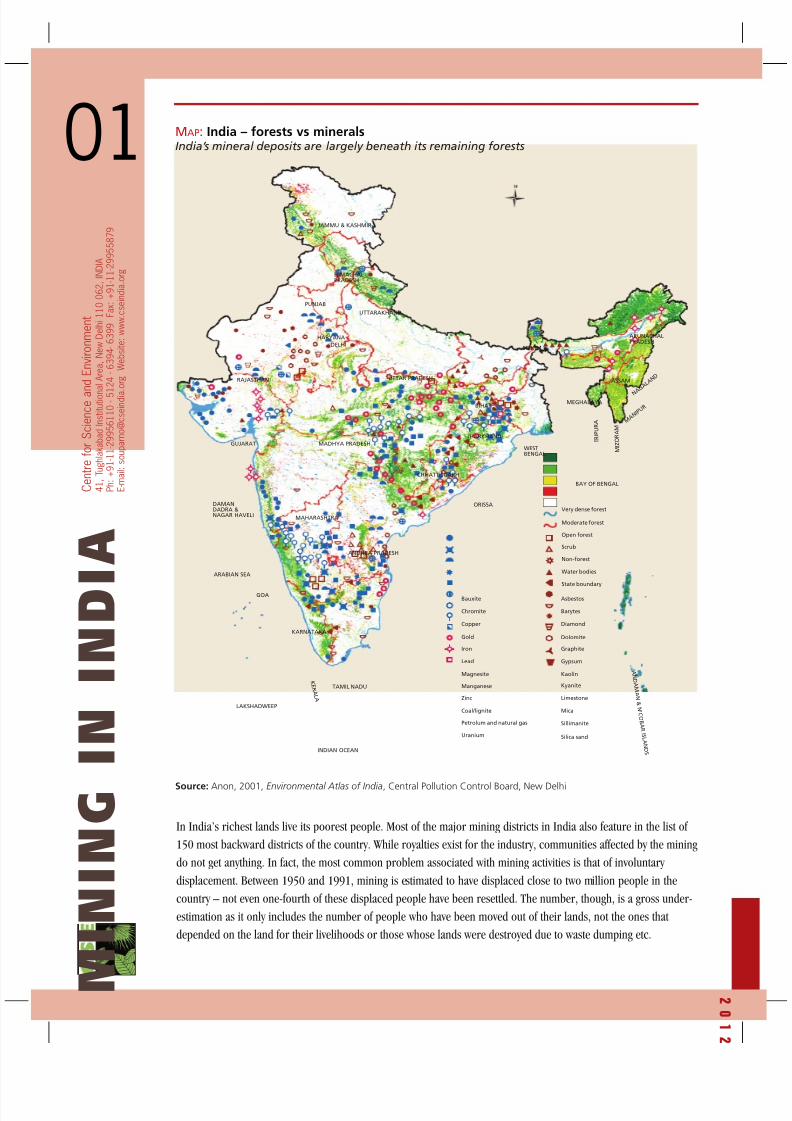
Almost all of India’s minerals are located in regions that also hold most of its forests, tribal population and major
river systems ( see map). Forest land has constantly been getting diverted for the purpose of mining and for other
developmental projects. The average forest cover of the 50 major mineral-producing districts in the country stands
at 28 per cent. During 1980-2005, close to 0.1 million ha of land was diverted across India to make way for 1,200
mines. This diversion has destroyed ecosystems as well as livelihoods.
Most of India's iron ore reserves are along the courses and watersheds of rivers like Indravati, Baitarani,
Tungabhadra and Mandovi. Most of the coal reserves of the country are also located within river basins – Damodar,
Godavari, Son, Kanhan and Mahanadi-Brahmani. The mining sector gobbles up a lot of water, largely because of the
huge amounts of minerals that are extracted. In addition to using massive quantities of water, mining also depletes
groundwater. Mines release the pumped out water into nearby water-courses, causing flooding and water pollution.
Mine waste can cause multiple pollution problems such as acid mine drainage, heavy metal pollution, pollution
from processing chemicals and erosion and sedimentation. Tailings generated during beneficiation and processing
are toxic; in summers, these become air-borne while during monsoons, they could leach into water bodies. Mining
of some minerals like marble also generates specific wastes like marble slurry which if dumped on land, adversely
affects productivity. Mines, waste dumps and mineral transportation generate a lot of fugitive dust – mining dust can
lead to health problems like silicosis, asbestosis, cataract and pneumoconiosis. Mine workers are also prone to
hearing impairment, skin and eye diseases, metal and radiation poisoning, etc.
Deaths and accidents occur during mining because of fire, blasting, drilling, flooding and land subsidence. In
underground mining, carbon monoxide (CO) poisoning is also a reason for a number of fatalities.
8/11/2019 Centre for Science and Environment Media Briefing on Mining Imact on Environment
http://slidepdf.com/reader/full/centre-for-science-and-environment-media-briefing-on-mining-imact-on-environment 9/12
01
M
I N I N G
I N
I N D I A
2
0
1
2
C e n t r e f o r S c i e n c e a n d E n v i r o n m e n t
4 1 ,
T u g h l a k a b a d I n s t i t u t i o n
a l A r e a ,
N e w D e l h i 1 1 0 0 6 2 ,
I N D I A
P h : + 9 1 - 1 1 - 2 9 9 5 6 1 1 0 - 5 1 2 4 - 6 3 9 4 - 6 3 9 9
F a x : + 9 1 - 1 1 - 2 9 9 5 5 8 7 9
E - m a i l : s o u p a r n o @ c s e i n d i a . o r g
W e b s i t e : w w w . c s e i n d i a . o r g
In India’s richest lands live its poorest people. Most of the major mining districts in India also feature in the list of
150 most backward districts of the country. While royalties exist for the industry, communities affected by the mining
do not get anything. In fact, the most common problem associated with mining activities is that of involuntary
displacement. Between 1950 and 1991, mining is estimated to have displaced close to two million people in the
country – not even one-fourth of these displaced people have been resettled. The number, though, is a gross under-
estimation as it only includes the number of people who have been moved out of their lands, not the ones that
depended on the land for their livelihoods or those whose lands were destroyed due to waste dumping etc.
HARYANA
MADHYA PRADESH
UTTAR PRADESHRAJASTHAN
JAMMU & KASHMIR
HIMACHALPRADESH
PUNJAB
UTTARAKHAND
DELHI
BIHAR
WESTBENGAL
MEGHALAYA
ASSAM
ARUNACHALPRADESH
N A
G A L A N D
M A N I P U
R
M I Z O R A M
T R I P U R A
SIKKIM
CHHATTISGARH
GUJARAT
MAHARASHTRA
ANDHRA PRADESH
KARNATAKA
GOA
K E R A L A
TAMIL NADU
JHARKHAND
ORISSADAMANDADRA &NAGAR HAVELI
LAKSHADWEEP
A N D A M A N & N I C O B A R I S L A N D S
BAY OF BENGAL
ARABIAN SEA
INDIAN OCEAN
State boundary
Water bodies
Non-forest
Scrub
Open forest
Moderate forest
Very dense forest
Lead
Manganese
Petrolum and natural gas
Limestone
Silica sand
Coal/lignite
Chromite
Copper
Gold
Iron
Magnesite
Bauxite
Zinc
Uranium
Asbestos
Barytes
Diamond
Dolomite
Graphite
Gypsum
Kaolin
Kyanite
Mica
Sillimanite
Source: Anon, 2001, Environmental Atlas of India, Central Pollution Control Board, New Delhi
MAP: India – forests vs mineralsIndia’s mineral deposits are largely beneath its remaining forests

8/11/2019 Centre for Science and Environment Media Briefing on Mining Imact on Environment
http://slidepdf.com/reader/full/centre-for-science-and-environment-media-briefing-on-mining-imact-on-environment 10/12
01
M
I N I N G
I N
I N D I A
2
0
1
2
C e n t r e f o r S c i e n c e a n d E n v i r o n m e n t
4 1 ,
T u g h l a k a b a d I n s t i t u t i o n
a l A r e a ,
N e w D e l h i 1 1 0 0 6 2 ,
I N D I A
P h : + 9 1 - 1 1 - 2 9 9 5 6 1 1 0 - 5 1 2 4 - 6 3 9 4 - 6 3 9 9
F a x : + 9 1 - 1 1 - 2 9 9 5 5 8 7 9
E - m a i l : s o u p a r n o @ c s e i n d i a . o r g
W e b s i t e : w w w . c s e i n d i a . o r g
The findings of the Shah CommissionThe final report of the MB Shah Commission and the Action Taken Report by the Ministry of
Mines:
1. Nature of illegalities – mining without a licence, mining outside lease area, raising of minerals
without paying royalty, mining in contravention to the mining plan, transporting minerals illegally,
etc.
2. Measures suggested for the above-
a. to place lease information on department websites (for which the Commission has
suggested a detailed format)
b. regular inspection of mines by IBM and mines department
c. change in procedure for grant of lease/renewal
3. Violation of a number of laws – Wildlife (Protection) Act 1972, Water (Prevention and Control of
Pollution) Act 1974, Air (Prevention and Control of Pollution) Act 1981, Forest (Conservation) Act
1980, Environment (Protection) Act 1986, etc.
4. Problems in procedure of renewal – misuse of Rule 24A of MCR 1960 which states that the renewal
application is to be made to the state government a year before expiry of the mining lease (with prior
Central approval in certain cases). The report states that the pattern followed in the renewal process
amounts to favouring certain companies. In many cases central approvals were not taken even when
they should have been.
5. Section 38 of the MCR 1960 was also violated. This section states that amalgamation of two adjoining
mine leases maybe approved with prior central approval (in certain cases) and also when the mining
period remains unaffected (is co-terminus).
The Commission visited the area and held a public meeting on September 17, 2011. In the course of
the meeting the dominant view was that 'illegal mining should be allowed to continue' and 'illegal
mining should be regularised'. The reasons given were: illegal mining serving as livelihood source for
a number of families, also serving as a livelihood source for a large number of truck owners and
mining being the mainstay of economy especially in terms of providing employment.
The report refers to the Bombay High Court order dated July 18, 2003 directing that no new place
for dumping overburden, waste, etc, to be obtained without permission/approval as under the
MCDR, 1988. The order also directed that a permission under the Goa Irrigation Act, 1973 is also to
be obtained. It further laid down a condition that the permission is to be granted keeping in mind
that there should be a minimum distance between the mine rejects and canals under the Irrigation
Act. The report mentions that there has been blatant violation of this order. The Ministry of Mines
has advised state government of Goa to ensure proper accounting of dumps and to ensure that
transit passes are issued only to people registered with IBM. Also, ministry recommends that for dump
handling prior EC should be a prerequisite.
The Commission states that the Director General of Mines (DGM) has not inspected since the last five
years the mines as per the MMDR Act 1957 (Section 24). Barring some cases where they inspected a
mine after receiving a complaint from locals.
The Commission states that there is lack of harmony between the Department of Mines and the Goa
State Pollution Control Board. An example is where in one of the reports filed by these departments
individually states that a particular mine is working while the other department report says it is not.
These discrepancies are due to lack of any actual field visit. In such a case a mine lease holder may
take undue advantage of law in the absence of correct information available. These discrepancies are
more visible for lessees like Sesa Goa, Damodar, Dempo, Salgaonkar, Timblo, Chowgule, etc. Out of a
list of 28 such mine leases, the mines department has said that 13 leases are working and 15 are not-working. For the same list, the figures submitted by the GSPCB are the opposite. Ministry of Mines
(MoM) states that IBM will reconcile the list of working and non working mines with the state
directorate within 3 months.
8/11/2019 Centre for Science and Environment Media Briefing on Mining Imact on Environment
http://slidepdf.com/reader/full/centre-for-science-and-environment-media-briefing-on-mining-imact-on-environment 11/12
01
M
I N I N G
I N
I N D I A
2
0
1
2
C e n t r e f o r S c i e n c e a n d E n v i r o n m e n t
4 1 ,
T u g h l a k a b a d I n s t i t u t i o n
a l A r e a ,
N e w D e l h i 1 1 0 0 6 2 ,
I N D I A
P h : + 9 1 - 1 1 - 2 9 9 5 6 1 1 0 - 5 1 2 4 - 6 3 9 4 - 6 3 9 9
F a x : + 9 1 - 1 1 - 2 9 9 5 5 8 7 9
E - m a i l : s o u p a r n o @ c s e i n d i a . o r g
W e b s i t e : w w w . c s e i n d i a . o r g
From 2008 onwards, the Commission found large quantity difference between production permitted
and that actually produced (with the later being way higher). This extra has been referred to as “ore
retrieved from the old dumps”. The Commission states that this excess production is being extracted
on proxy from the running mines but portrayed as dump handling. This shows lack of inspection and
monitoring.
Non-compliance of EC conditions, mining laws and lease agreements are other visible issues. The
Commission states that there is air and water pollution beyond tolerance limits especially in areas
where mine clusters are present.
Report refers to the 2009-10 Special Task Force of IBM inspection in the state. It states that this report
was not proper and the exercise was a mere eye-wash. Number of complaints received about illegal
mining but no action taken. Report suggests that action should be initiated against officers
responsible for their misconduct and dereliction of duties under Conduct Rules.
Suggested procedure for grant/renewal of lease: a committee consisting of secretaries of mines,
revenue, forest and environment department is to be formed. Also, leasehold rights for mining
should be granted by public auction.
Encroachment: This is a major problem mainly because mining is being carried out by people who do
not actually have the mine lease in their name. There is encroachment on main rivers/nallahs, etc., as
these are used for transportation of ores. On analysing with google maps, the Commission has found
a large extent of encroachment. For this purpose, any area which did not have the mine lease has
been defined as encroachment. As is the agricultural land where mining is happening but revenue
records have not been regularised as 'for non-agricultural use”. GPS handsets were used to mark out
all the boundary pillars for the leases. Total encroachment identified is 2796.24 ha out of which
578.42 ha is used for illegally extracting mineral (Table on Pg. 5 of Chapter 1A). During survey it was
observed that most lease holders have not erected boundary pillars or these are wooden instead of
permanent. Also, at many places miners have extracted minerals from outside lease area (502.21 ha
and an estimated amount of 127.2574 tonnes and a loss of Rs349359.288 million). Forest area of
76.21 ha has also been encroached by unknown people without any mine lease. Mining from this 578
ha of area is to be considered as theft of iron ore. The Commission recommends deterrent
punishment by filing criminal cases against the lessees for their criminal misconduct.
Recommendation is also made to take action against the concerned officials of the Mines and Forest
Department.
The Commission recommends that the State Government should take immediate action to recover
market cost of the iron ore illegally extracted after having proven estimation from outside the
leased areas with exemplary penalty along with criminal cases to be filed against the lessees and
department officials. The cost incurred due to estimation should be recovered from the extractors.
The Commission refers to a communication dated February 5, 2002 from MoEF to Chief Wildlife
Warden, Goa. In this communication, the MoEF requested the State Government to list out such areasand furnish detailed proposal for their notification as eco–sensitive areas under the Environment
(Protection) Act, 1986. This has not been done till date which has allowed mines to operate. The
MoEF sent many reminders after that for the same purpose.
The Commission refers to a Supreme Court order dated December 4, 2006 to not allow any Temporary
Working Permits for mining in Goa without compliance with the environmental laws, in particular,
the permission under the Forest (Conservation) Act, 1980. Also, the MoEF was directed to refer to the
Standing Committee of the National Board for Wild Life, under Sections 5 (b) and 5 (c) (ii) of the Wild
Life (Protection) Act, the cases where environment clearance has already been granted where
activities are within 10 km. Zone. In February 2007, MoEF has asked states for such mine leases
granted clearance since January 2004 which fall under this condition. Based on responses received, a
list of 74 mine leases should have been placed before the NBWL but the MoEF has not taken any
decision on this matter which remains pending even today. After the 2006 order, 98 EC approvals
have been granted in Goa out of which 5 are for expansion. 61 EC approvals out of these need to be
referred to the NBWL Standing Committee but since this was not done, Commission recommends
that the production should be brought down equivalent to the year 2000 to 2001 to mitigate the
impact of cluster mining on the protected area. Also, these mines are to stop operation and their
8/11/2019 Centre for Science and Environment Media Briefing on Mining Imact on Environment
http://slidepdf.com/reader/full/centre-for-science-and-environment-media-briefing-on-mining-imact-on-environment 12/12
01
M
I N I N G
I N
I N D I A
2
0
1
2
C e n t r e f o r S c i e n c e a n d E n v i r o n m e n t
4 1 ,
T u g h l a k a b a d I n s t i t u t i o n
a l A r e a ,
N e w D e l h i 1 1 0 0 6 2 ,
I N D I A
P h : + 9 1 - 1 1 - 2 9 9 5 6 1 1 0 - 5 1 2 4 - 6 3 9 4 - 6 3 9 9
F a x : + 9 1 - 1 1 - 2 9 9 5 5 8 7 9
E - m a i l : s o u p a r n o @ c s e i n d i a . o r g
W e b s i t e : w w w . c s e i n d i a . o r g
clearance is to be kept in abeyance till the time the necessary approval is received. In 6 EC approvals
it is alleged that NBWL approval is present. But records state no such approvals of NBWL is taken in
any of the mining lease. It is suggested that action be taken against such lessees and concerned
officials.
The Commission has observed that Rule 10 of the MCDR, 1988 has been misused. This rule allows for
a revision in the mining plan subject to certain conditions. The mining plan is to lay down the limit
of annual production of the mineral. The conditions laid down are: in the interest of scientific mining,
conservation of minerals or for protection of environment. In Goa, most of the revisions by IBM has
been to increase production ignoring the conditions. For 69 mine leases, production limit was
increased from 19.916 million tonnes to 37.742 million tonnes based on such revisions. This has
resulted in production of about 65.692 million tonnes from Goa . The commission states that nobody
has assessedimpact on environment by increasing production. Thus, the concerned authorities have
totally failed in discharge of their duties. If mining is allowed at this rate, the Commission stipulates
reserve in Goa would last for 9 years only. If 30 million tones is taken as average production per year,
the iron ore would last for 20 years only. The Commission recommends planning and conservation
of iron ore for at least 50 years is required to be undertaken for the State of Goa. This can be
achieved only by lowering the permission and extraction should not exceed more than 12.5 milliontones per year for quality grades. The MoM calls the cap introduced by the Commission as
'impracticable' for various reasons – incomplete geological information, unpredictable market forces,
change in anticipated mining depth during operation, etc. The revision issue has also not gone down
well with MoM which states that with successive mining, useable resources maybe discovered which
requires a revision on the mining plan. The revision may also be necessary in case there is a change
in the method of mining, reduction inproduction due to reduced demand, etc.
All those mine leases which are working under deemed extension without any justification for the
delay in either filing for renewal, not granting of renewal within the stipulated time, etc., are to be
declared void and state government is to take action on the same. The iron ore extracted and
dispatched from these mining leases should be considered as illegal/irregular and unlawful and
amount at market/export rate thereof should be recovered. Penal action should be initiated against
all responsible in this act of hatching conspiracy for approval of leases. The Commission recommends
that all such leases which are presently working and if felt necessary to continue, should be canceled
and then auctioned.
The mines, which are not yet effectively started or have not still reached at the stage of actual extraction
of minerals should be kept reserved at least for 15 to 20 years for future.
The crux of the report is that no regard to environment and forest clearance procedures and conditions
have been meted out by miners and state authorities in Goa. The grant of clearances and mining
permissions have been arbitrary with an aim to favour certain companies/individuals. Mineral rules and
laws have also been disregarded in the state.
Notes:1. Assuming in situ specific gravity of Goan iron ore = 2.2, average working depth = 10 meters, and export cost @US $ 60 per
tonne of iron ore with a conversion rate of Rs 47.
2. For other leases, production limit has remained 27.95 million tonnes.
This publication is supported by Jamsetji Tata Trust