Embed Size (px)
Citation preview
Chief Executive Officer and General Manager’s Report and Recommendation on
Rates and Services
March 21, 2019 • Volume 1
Powering forward. Together.®
0281-19
Chief Executive Officer & General Manager's Report and Recommendation on
Rates and Services
Volume 1
Residential, Agricultural, Commercial and Lighting Rate Changes Miscellaneous Rate Changes
March 21, 2019
A Sacramento Municipal Utility District Publication
Chief Executive Officer & General Manager’s Report and Recommendation on Rates and Services
March 21, 2019
Prepared by: Sacramento Municipal Utility District’s
Pricing Division of Planning, Pricing and Enterprise Performance
Under the direction of: Arlen Orchard, CEO & General Manager
For additional copies of this volume, or for information on issues included in the report, call SMUD at: 1-855-736-7655
Table of Contents List of Figures ...............................................................................................................................6
List of Tables .................................................................................................................................8
Rate Requirements and Recommendations .............................................................................10
Executive Summary ..........................................................................................................10
Board Strategic Direction .................................................................................................13
Rate Increase Drivers ........................................................................................................14
Competitive Position ........................................................................................................21
Background on Rates ........................................................................................................24
Workshops and Community Participation ........................................................................31
Revenue Requirement ................................................................................................................33
Summary of Changes ........................................................................................................33
Changes to NEM .........................................................................................................................34
Net Energy Metering ........................................................................................................34
Changes to Residential Rates .....................................................................................................46
Rate Increase for Residential Rates ..................................................................................46
TOD Transition and NEM Updates for Rate Schedule R .................................................48
TOD Transition and NEM Updates for Rate Schedule R-TOD .......................................50
Miscellaneous Residential Updates ..................................................................................52
Miscellaneous Residential Time-of-Day Updates ............................................................53
Residential Power Theft ...................................................................................................54
Changes to Commercial Rates ...................................................................................................55
Rate Increase for Agriculture and Commercial Rates ......................................................55
Restructure of Commercial Rates .....................................................................................55
Changes to Street, Traffic and Lighting Rates ........................................................................75
Rate Increase for Street/Traffic/Lighting Rates ................................................................75
Traffic Control Intersection Lighting Service ..................................................................75
Miscellaneous Rate Changes ......................................................................................................77
List of Figures 4
NEM Rate Schedule References .......................................................................................77
Discontinuance of Service ................................................................................................77
Proration Language ...........................................................................................................78
Hydro Generation Adjustment (HGA) .............................................................................79
Power Factor Waiver ........................................................................................................80
Greenergy .........................................................................................................................80
Changes to Rules and Regulations ............................................................................................82
Rule 1 – Definitions ..........................................................................................................82
Rule 11 – Discontinuance and Restoration of Service .....................................................82
Rule 16 – Extension of Facilities to Non-Residential Premises .......................................83
Rule 21 – Interconnection Requirements .........................................................................85
Detail of Rate Changes ...............................................................................................................89
Residential Rates ..............................................................................................................89
Agricultural Rates .............................................................................................................91
Small Commercial Rates (0-299 kW) ...............................................................................92
Small Commercial TOU Rates (300-499 kW) .................................................................93
Medium Commercial TOU Rates (500-999 kW) .............................................................94
Large Commercial TOU (1000+ KW) .............................................................................95
Temperature Dependent Pricing Rate (TDP) ...................................................................96
Combined Heat & Power (CHP) Distributed Generation .................................................96
Distributed Wheeling Service ...........................................................................................96
Miscellaneous Commercial Charges ................................................................................96
Outdoor Street and Traffic Lighting Rates .......................................................................97
Information on SMUD Performance ........................................................................................98
Customer Satisfaction .......................................................................................................98
System Average Interruption ............................................................................................99
Customer Contacts ..........................................................................................................100
Other Customer Service Information ..............................................................................101
Environmental Assessment ......................................................................................................102
SMUD Programs and Web Links ...........................................................................................104
Strategic Direction ....................................................................................................................105
Compliance ................................................................................................................................113
List of Figures 5
Introduction .....................................................................................................................113
Proposition 26 Does Not Apply to SMUD Rates ...........................................................113
Cost-Justified Fees for Benefits and Services ................................................................113
Proposed Adjustments ....................................................................................................113
Non-Cost-Justified Fees for Use of SMUD Property; Fines and Penalties ....................115
Glossary .....................................................................................................................................116
Unaudited Financial Statistics .................................................................................................122
SMUD Retail Energy Sales Forecast ..............................................................................122
Pro Forma Tables ............................................................................................................124
Annual Sales Data Tables ...............................................................................................127
Audited Financial Statements ..................................................................................................131
December 31, 2018 and 2017 .........................................................................................131
Appendix I .................................................................................................................................132
NERA Marginal Cost Study Review Letter – NEM 2.0 Proposal .................................132
Appendix II................................................................................................................................133
NERA Marginal Cost Study Review Letter – Commercial Restructure ........................133
Appendix III ..............................................................................................................................134
Expert Rate Strategy and Recommendation Opinion Letter ..........................................134
Appendix IV ..............................................................................................................................135
Commercial Restructure Details .....................................................................................135
List of Figures 6
List of Figures Figure 1 – Capital Expenditures 2017-2021 (Millions) ...........................................................16
Figure 2 – Capital Program Funding (Millions) ......................................................................17
Figure 3 – Cost Breakout (Millions)..........................................................................................18
Figure 4 – Projected Cost of SMUD Natural Gas and Biogas ................................................18
Figure 5 – Projected Cost of SMUD Renewable Resources ....................................................19
Figure 6 – Existing Bond Debt Service Payments (Millions) ..................................................20
Figure 7 – Annual Rate Increase vs. Consumer Price Index ..................................................21
Figure 8 – SMUD vs. PG&E System Average Rates ...............................................................22
Figure 9 – California Utilities System Average Rates ($/kWh) ..............................................22
Figure 10 – Changing Electricity Needs ...................................................................................25
Figure 11 – SMUD’s Electrical System .....................................................................................26
Figure 12 – Breakdown of Costs by Rate Component ............................................................28
Figure 13 – Fixed and Variable Costs in Budget and Rate Design ........................................29
Figure 14 – Electricity Flow to and from a House with Solar Photovoltaic (PV) .................34
Figure 15 – Example of Flow of Electricity with a PV System and the Grid ........................35
Figure 16 – Creation of Cost Shift .............................................................................................36
Figure 17 – NEM Rate Schedule Applicability ........................................................................42
Figure 18 – Rate Increase Monthly Bill Impacts for Standard Rate Customers 2020-2021 .....................................................................................................................................47
Figure 19 – Rate Increase Monthly Bill Impacts for EAPR 2020- 2021 ................................47
Figure 20 – Rate Increase Monthly Bill Impacts for MED 2020-2021 ..................................48
Figure 21 – Day-Ahead Market Price Index ............................................................................58
Figure 22 – Current Commercial Time Periods (for customers ≥ 300 kW) ..........................59
Figure 23 – Current Commercial Time Periods (for customers < 300 kW)..........................60
Figure 24 – Proposed Summer Time Periods for Commercial Classes with Average Annual Customer Use by Size ...................................................................................................63
Figure 25 – Proposed Non-Summer Time Periods for Commercial Classes with Average Annual Customer Use by Size ...................................................................................................64
List of Figures 7
Figure 26 – Customer Satisfaction Survey Results ..................................................................98
Figure 27 – J.D. Power 2018 Residential Satisfaction Index ..................................................99
Figure 28 – J.D. Power 2018 Business Satisfaction Index .......................................................99
Figure 29 – SMUD Outage Duration and Frequency by Year .............................................100
Figure 30 – Customer Calls and Chats answered by Year ...................................................101
Figure 31 – Self-Service Transactions versus the CSR Channel in 2018.............................101
List of Tables 8
List of Tables Table 1 – Forecast of Selected Financial and Rate Information ............................................20
Table 2 – SMUD vs. PG&E Comparison Class Average Rates ($/kWh) ..............................23
Table 3 – SMUD Forecasted Revenue after Proposed Rate Increase* (Millions) ................33
Table 4 – Illustration of Bill Impact from NEM Installation .................................................37
Table 5 – Proposed Per kW Grid Access Charge (Solar) ($/kW-month) ..............................40
Table 6 – EAPR & EAPR/MED Discount for the Grid Access Charge ................................41
Table 7 – Residential Bill Impacts with High and Low Daytime Usage with Full Service, NEM 1.0 and NEM 2.0 ...............................................................................................................41
Table 8 – GSS_T Bill Impacts with Full Service, NEM 1.0 and NEM 2.0 .............................42
Table 9 – Grandfathering Provisions for Approved Installations prior to Jan. 1, 2018 ......43
Table 10 – Grandfathering Provisions for Applications for Interconnection Submitted Between Jan 1. 2018 and Mar. 31, 2019 ....................................................................................44
Table 11 – Rate Schedule NEM2 Details ..................................................................................45
Table 12 – EAPR Maximum Monthly Discounts.....................................................................46
Table 13 – SMUD Commercial Rate Class Descriptions ........................................................57
Table 14 – Current Commercial Rate Structures ...................................................................61
Table 15 – Proposed Commercial Rate Structures .................................................................65
Table 16 – Proposed Commercial Rate Price Changes, Secondary Service Voltage ...........66
Table 17 – Proposed Commercial Rate Price Changes, Primary and Subtransmission Service Voltage ............................................................................................................................66
Table 18 – Proposed Transition Period ....................................................................................67
Table 19 – GSN_T (<20kW) Bill Impacts .................................................................................69
Table 20 – GSS_T (20-299kW) Bill Impacts ............................................................................69
Table 21 – GUS_S (300-499kW) Bill Impacts ..........................................................................69
Table 22 – GUS_M (500-999kW) Bill Impacts.........................................................................69
Table 23 – GUS_L (1000+ kW) Bill Impacts ............................................................................70
Table 24 – GUP_S (300-499kW) Bill Impacts ..........................................................................70
Table 25 – GUP_M (500-999kW) Bill Impacts ........................................................................70
List of Tables 9
Table 26 – GUP_L (1000+ kW) Bill Impacts ...........................................................................70
Table 27 – GUT_L (1000+ kW) Bill Impacts ...........................................................................71
Table 28 – Updated General Service Rate Schedule Names ...................................................71
Table 29 – Proposed Rate Schedule GS (0-299kW) Restructuring ........................................72
Table 30 – Proposed Rate Schedule GS-TOD3 (300-499kW) Restructuring ........................72
Table 31 – Proposed Rate Schedule GS-TOD2 (500-999kW) Restructuring ........................73
Table 32 – Proposed Rate Schedule GS-TOD1 (1000+ kW) Restructuring ..........................73
Table 33 – Proposed Time Periods ............................................................................................74
Table 34 – Rule and Regulation 21 Details ...............................................................................86
Table 35 – 2020 Non-Bypassable Cost Components by Time Period ($/kWh) used to Determine Residential Grid Access Charges in $/kW .............................................................87
Table 36 – 2020 Non-Bypassable Cost Components by Time Period ($/kWh) used to Determine Non-Residential Grid Access Charges in $/kW ....................................................87
Table 37 – 2021 Non-Bypassable Cost Components by Time Period ($/kWh) used to Determine Residential Grid Access Charges in $/kW .............................................................88
Table 38 – 2021 Non-Bypassable Cost Components by Time Period ($/kWh) used to Determine Non-Residential Grid Access Charges in $/kW ....................................................88
Table 39 – SMUD Retail Energy Sales Forecast ....................................................................123
Table 40 – Pro Forma Consolidated Income Statement .......................................................124
Table 41 – Pro Forma Capital Expenditures .........................................................................125
Table 42 – Pro Forma Consolidated Sources and Uses of Cash ...........................................126
Table 43 – Annual Sales Data by Rate Schedule – 2017 .......................................................127
Table 44 – Annual Sales Data by Rate Schedule – 2018 .......................................................129
Table 45 – Proposed Rate Schedule GS (0-299kW) Restructuring ......................................135
Table 46 – Proposed Rate Schedule GS-TOD3 (300-499kW) Restructuring ......................135
Table 47 – Proposed Rate Schedule GS (500-999kW) Restructuring ..................................136
Table 48 – Proposed Rate Schedule GS (1000+kW) Restructuring .....................................136
Rate Requirements and Recommendations 10
Rate Requirements and Recommendations Executive Summary This Chief Executive Officer & General Manager’s Report and Recommendation on Rates and Services (Report) explains staff’s proposed changes to SMUD Rates, Rules and Regulations.
The evolution of energy markets and the utility industry continues to accelerate. Advances in technology, public policy mandates and changes in customers’ expectations mean electricity production and customers’ energy use is very different than it was less than a decade ago. These changes have created challenges for utilities’ pricing structures, which no longer accurately reflect the cost to serve. Utilities across the country are evolving their pricing structures to better align rates with costs, send accurate price signals to customers, encourage shifting of energy away from hours of peak demand to hours when energy is abundant, and adoption of distributed energy resources such as solar, electric vehicles and energy storage. If utilities like SMUD do not evolve price structures, it will result in more significant increases in rates in the future and further exacerbate cost shifting among customers. The imperative for SMUD to ensure rate structures evolve with business and market changes is far greater than ever before.
Using the Board’s guidance as provided in Strategic Direction 2 (SD-2), Competitive Rates, SMUD developed a pricing road map, laying out a strategy to adjust our rates to better reflect the cost of service and minimize unfair cost shifting among customers. The proposed changes are the next step in SMUD’s pricing road map and continue the evolution of the pricing structures, which build on past successful rate adjustments and restructures, including the phased elimination of tiered rates, the phased restructuring of the residential System Infrastructure Fixed Charge (SIFC), the overhaul of our Energy Assistance Program Rate (EAPR) and the introduction of Time-of-Day (TOD) Rates as the standard rate for all residential customers. SMUD’s Board of Directors approved the transition to TOD Rates for residential customers in 2017. The transition to TOD Rates will be completed by the end of this year.
SMUD’s rates are among the lowest in California, and continued focus on operational excellence and efficiency across SMUD’s operations has reduced the size of future rate increases needed to meet customers’ expectations for safe, reliable, affordable and environmentally responsible energy amid a rapidly-changing industry.
SMUD staff recommends a rate increase of 4.75% in 2020 and 4.50% in 2021 for residential and non-residential customers. These increases are driven largely by external factors and are needed to cover planned spending on investment towards reaching Integrated Resource Plan (IRP) carbon reduction goals, ability to meet maximum customer use in the summer and integrate customer owned resources into the local grid. The increases would also cover new investments in technology, additional wildfire mitigation and cost increases for materials, goods, and services. The proposed rate increases take into account permanent cost reductions achieved through an enterprise-wide focus on operational efficiencies which avoids an extra 2.0% rate increase that otherwise would have been needed.
Rate Requirements and Recommendations 11
The proposed rate increase would be applied equally to all rate components as detailed in the rate schedules included in Volume 2 of this Report. With these changes, SMUD electric rates would continue to meet the benchmarks set in the SMUD Board’s policy on rates (SD-2, Competitive Rates) and still remain among the lowest in California.
This Report also proposes a change to the rate structure for 10 of our commercial categories. SMUD currently has 12 commercial rate categories or “classes,” each with different structures which have been in place since the early 2000’s. Over time, changes in the commodity market and a broader evolution in our industry have created the following issues:
• Revenue collection does not match costs. Much of our fixed costs are collected through per kWhrates, which means increased adoption by customers of energy efficiency measures or self-generation challenge our ability to recover fixed costs across commercial rate classes whichincreases cost shifting to other customers.
• Our current rate structure sends incorrect price signals which can lead to suboptimal investmentdecisions for SMUD and our customers.
• Driven largely by increases in solar generation throughout the state, current time periods in thecommercial TOD rate structure no longer align with commodity market prices. It means we arecurrently charging customers peak pricing when we are not experiencing peak demand and highprices for electricity, and not promoting load growth and shifting usage to when market pricesare low or negative.
• Commercial rates (components and actual charges) are inconsistent across classes. It means ifcustomers use energy differently, causing them to move from one class to another, they canexperience rate shock and rate volatility, creating a poor customer experience.
Together, these discrepancies create revenue collection vulnerability and, the ability for customers to “jump” between rates when system value is not created, which increases the cost shift and subsidies within the rate classes. The differences between the 10 rate categories staff is recommended changing make it hard to explain to customers how and why these rates were developed, as there is not a lot of consistency between the different rate structures. As pricing has become a strategic function, we are looking more holistically, to ensure overall rates reflect costs and provide consistency for a better customer experience.
Staff’s recommendations to ensure adequate revenue collection and correct discrepancies between commercial rate classes include:
• Increase the fixed charges to improve cost recovery for fixed infrastructure and operating costs.
• Reduce the per kWh energy charges to offset the increase in fixed charges (this is the sameapproach we took with residential customers when we adjusted the SIFC).
• Align commercial Time-of-Day time periods with energy market prices, to send accurate pricesignals to customers and collect revenue that’s aligned to the cost of supply.
• Improve rate consistency across small to large commercial rate schedules.
o Add a summer peak demand charge where missing (except for the smallest commercialcustomers).
Rate Requirements and Recommendations 12
o Adjust demand charges to be more consistent across rate classes.
o Add a small demand charge to the smallest commercial customers.
• Mitigate bill impacts with a phased implementation of the commercial rate changes.
These changes will better align rates with the cost of service and continue to give customers control over their bills while providing more accurate price signals for future investments. This structural change to rates will also help incentivize electrification of buildings and vehicles by lowering the per kilowatt hour charge for energy, which supports a lower-carbon future.
Industry experts from NERA Economic Consulting (NERA) and Utility Financial Solutions concluded that the proposed rate design offers more efficient and accurate price signals and is an improvement over the existing commercial rate structure.
Staff also recommends a new Net Energy Metering (NEM) successor tariff – NEM2. Customers with self-generation (NEM customers) use the grid in different ways than non-NEM customers – by selling their surplus power into the grid on sunny days and buying power from SMUD when the sun is not shining. Because our self-generation customers continue to rely on the SMUD grid, SMUD must size its system to meet the electricity demand of NEM customers to the same extent as non-NEM customers. In other words, we need to be prepared to fully meet their electricity needs at all times, regardless of their on-site generation. Because of the current rate structure, where we recover a significant portion of our fixed costs in the electricity usage charge (cents/kWh), NEM customers are not paying their fair share of many of SMUD’s fixed costs, such as fixed grid costs, cyber security, public goods (including assistance for low income customers), wildfire mitigation and compliance. It means our NEM customers avoid their fair share of these costs and shift the financial burden to non-NEM customers. The number of customers not paying their fair share continues to grow with each new NEM customer we connect to the grid (approximately 400 – 500 every month), which increases the burden on other customers on a daily basis.
Effective as early as January 1, 2020 and no later than May 31, 2020, customers who move into a home or building after March 31, 2019 with on-site solar or other eligible renewable generating facilities, or submit an application for interconnection of a new on-site solar or eligible renewable generating system to SMUD after March 31, 2019, will be subject to a new NEM tariff. The new NEM tariff includes a fixed monthly charge – called a Grid Access Charge - based on the size of the customer’s generating system to recover SMUD’s fixed non-bypassable cost components. At this time, SMUD has developed a specific charge applicable to solar generating systems due to the prevalence of this technology as a customer resource, but also proposes a methodology to determine the applicable charge for all types of technology (e.g. wind, biomass, etc.) in the event customers install other resources1. This change will apply to all residential and non-residential customers with solar or other renewable generation. The proposed changes include assistance for low-income EAPR NEM customers. NEM customers will continue to receive full retail compensation by time period for any excess energy sold back to SMUD.
1 The new monthly charge applies to any customer that interconnects a distributed generating resource under SMUD’s Rule and Regulation 21 Interconnection Requirements, whether or not the resource qualifies for NEM.
Rate Requirements and Recommendations 13
Solar or other on-site customer-owned renewable generating facilities that submitted an application for interconnection to SMUD on or before March 31, 2019 will be grandfathered under the existing NEM tariff (NEM1) for up to 20 years from the interconnection date, depending on when they installed their generation facility or moved in or transferred service.
• Customers who established service at their premises prior to January 1, 2018 and have a renewable electrical generation facility2 on their premises that was approved for installation prior to January 1, 2018 are exempt from the Grid Access Charge for 20 years from the date of the first billing cycle after initial facility interconnection date. This exemption period will not end any earlier than 2023, unless the customer moves out or transfers service.
• Customers who established service at their premises between January 1, 2018 and March 31, 2019 or have a renewable electrical generation facility on their premises which had an application for interconnection received by SMUD on or prior to March 31, 2019 are exempt from the Grid Access Charge for 10 years from the date of the first billing cycle after initial facility interconnection date, unless the customer moves out or transfers service.
• Customers who established service at their premises after March 31, 2019 or have a renewable electrical generation facility on their premises which had an application for interconnection received by SMUD after March 31, 2019 will be assessed the Grid Access Charge from the date of the first billing cycle after initial facility interconnection date.
Other proposals covered in this Report include smaller modifications. Staff recommends, for example, updating the Greenergy® language in each tariff to allow for more frequent updates as legislation and the renewable product market change, updating the language in the residential tariffs to reflect the completed transition to TOD, clarifying language regarding the Power Factor Waiver and amending language to certain Rules and Regulations as specified in Volume 2 of this Report.
SMUD invites customers and the community to learn more about the rate proposals and share feedback. Public workshops will be held at SMUD offices on April 23, 2019 at 10 a.m. and May 9, 2019 at 6 p.m. For more information, turn to the Workshops and Community participation section on page 32.
Board Strategic Direction SMUD’s Board established 18 Strategic Directions (SDs) to guide business decisions and SMUD’s operations. The full description of all SDs can be found in the Strategic Direction section in this Report and at smud.org/Board. The recommendations in this Report are driven by the Board’s Competitive Rates Strategic Direction 2 (SD-2), which includes the following objectives:
• Establish a rate target 18% below Pacific Gas and Electric (PG&E) and at least 10% below PG&E’s published rates for each customer class.
• Reflect the cost of energy when it is used.
2 See the CEC’s most current Renewable Portfolio Standard Eligibility Guidebook for the purposes of providing the technical definition of a renewable electrical generation facility.
Rate Requirements and Recommendations 14
• Reduce use of energy during peak periods.
• Encourage energy efficiency and conservation.
• Minimize “sticker” shock in the transition from one rate design to another.
• Offer flexibility and options.
• Be simple and easy to understand.
• Meet the needs of people with fixed low incomes and severe medical conditions.
• Equitably allocate costs across and within customer classes.
In addition to these rate design objectives, the proposed rate changes would help meet SMUD’s financial targets and other strategic directions by:
• Maintaining cash coverage of all debt service payments (fixed charge ratio) of at least 1.50.
• Maintaining days cash on hand of at least 130 days.
• Maintaining access to credit markets.
• Maintaining SMUD’s credit rating, which reduces borrowing costs and related rate increases.
• Achieving the State’s and SMUD’s energy efficiency, renewable energy and greenhouse gas emissions targets.
• Meeting the Board’s reliability targets while making funds available to increase efforts to support system upgrades and preventive and corrective maintenance of aging infrastructure, which is critical to the safe and reliable operation of the transmission and distribution systems.
• Providing SMUD with the resources to invest in customer support tools necessary to maintain a high level of reliability, customer satisfaction and confidence.
Rate Increase Drivers Large strategic investments such as supporting our environmental leadership goals, meeting new compliance and risk mitigation requirements and technology and grid investments to support the utility of the future are significant, putting upward pressure on rates. SMUD balances keeping rates low with the need to ensure SMUD maintains strong financial metrics which are measures of SMUD’s financial health. SMUD’s financial viability is imperative to be able to deliver on SMUD’s vision and purpose as set out in the Board’s Strategic Directions.
Based on current forecasts, the proposal includes a 4.75% rate increase in 2020 and a 4.50% rate increase in 2021. These increases translate into approximately a $5.40 increase to the average residential customer’s monthly bill in 2020 and approximately an additional $5.40 per month in 2021. The forecasted rate increases are driven largely by external factors and industry changes, including:
• Wildfire mitigation, including the increased cost of fire insurance and additional vegetation management.
Rate Requirements and Recommendations 15
• Additional load serving capability to ensure we can reliably serve customers’ energy needs during times of peak demand.
• New and enhanced technology solutions to support cyber security, customer experience, improved reliability and distributed energy resources.
• Increases for labor and non-labor costs (e.g., supplies, materials and services).
• Our newly adopted Integrated Resource Plan (IRP) to fund initiatives to reduce carbon emissions through transportation and building electrification, investment in renewable energy and increased energy efficiency.
While staff works hard to contain costs and operate more efficiently to mitigate cost increases, many of the increases are large and outside of SMUD’s control. The drivers listed above contribute roughly equally to the proposed rate increases for 2020 and 2021. In addition, the rate increases approved during the two previous years were about half of the rate of inflation, as measured by the Consumer Price Index; another factor contributed the current cost pressures. Rate increases to meet our IRP goals are expected to result in an annual rate increase of approximately 1.75% for the next decade just to fund achievement of the IRP’s aggressive carbon reduction goals. This will be in addition to rate increases driven by other business requirements.
Utility operations are complex. SMUD is required to meet a wide range of mandates, regulations and requirements such as environmental mandates, cyber security and wildfire mitigation while ensuring reliability and safety. Moreover, as a community-owned business, SMUD adds new programs, services and initiatives each year to ensure we are meeting our customers’ expectations and advancing our leadership position in the industry. Our goal is to absorb cost increases and new program costs within existing budgets wherever possible, and recent sustained operational savings have helped offset the cost of some new programs. One example is our annual Shine Community Development Awards which provide up to $400,000 to support worthwhile community projects. These awards have been completely paid for by creating operational cost savings.
SMUD adopted a robust enterprise-wide approach to Operational Excellence (OpEx) in 2016. Since then, OpEx has become engrained in SMUD’s operations. Employees across SMUD have built OpEx into their daily jobs and have been empowered to find better and more efficient ways to work. Small efforts have delivered significant, sustainable savings that create permanent cost reductions. We created $28 million in annual permanent cost reductions through OpEx efforts. By starting our OpEx efforts early, we were able to offset some of the required rate increase. Together, savings realized to date prevent the need for an additional 2% rate increase, which means rate increases are primarily for new initiatives that will deliver value to our customers and community.
Additionally, SMUD has taken advantage of the favorable market conditions to refund debt to lower interest costs. In 2018, SMUD refunded $165.5 million in bonds, saving customers approximately $39 million net present value. Staff continues to seek approaches to reduce the cost of borrowing by adjusting the debt strategy to include the use of variable rate debt and short-term products that lower interest rates.
It’s important to note that community-owned utilities, and specifically SMUD, are viewed positively by credit rating agencies. In addition to superior risk management, sustainable levels of debt issuance and prudent cash reserves, rating agencies cite the Board’s willingness to act decisively and set rates necessary to ensure financial sustainability and meet targets and goals. While the independent ability to
Rate Requirements and Recommendations 16
set rates has always been an advantage, Fitch and Moody’s both recognized it as a factor that helps keep community-owned utilities’ credit ratings relatively higher, which lowers borrowing costs and helps minimize overall rate increases. Staff estimates that our current credit rating of AA saves SMUD customers approximately $200,000 annually for every $100 million borrowed, over an A rating, adding up to a significant amount over the life of a 20 to 30-year bond issuance. Additionally, SMUD’s higher credit rating reduces letter of credit expense, reduces collateral posting requirements, gives SMUD additional options for types of variable rate debt, and helps to negotiate better power purchase agreement prices.
Capital Expenditure Forecast
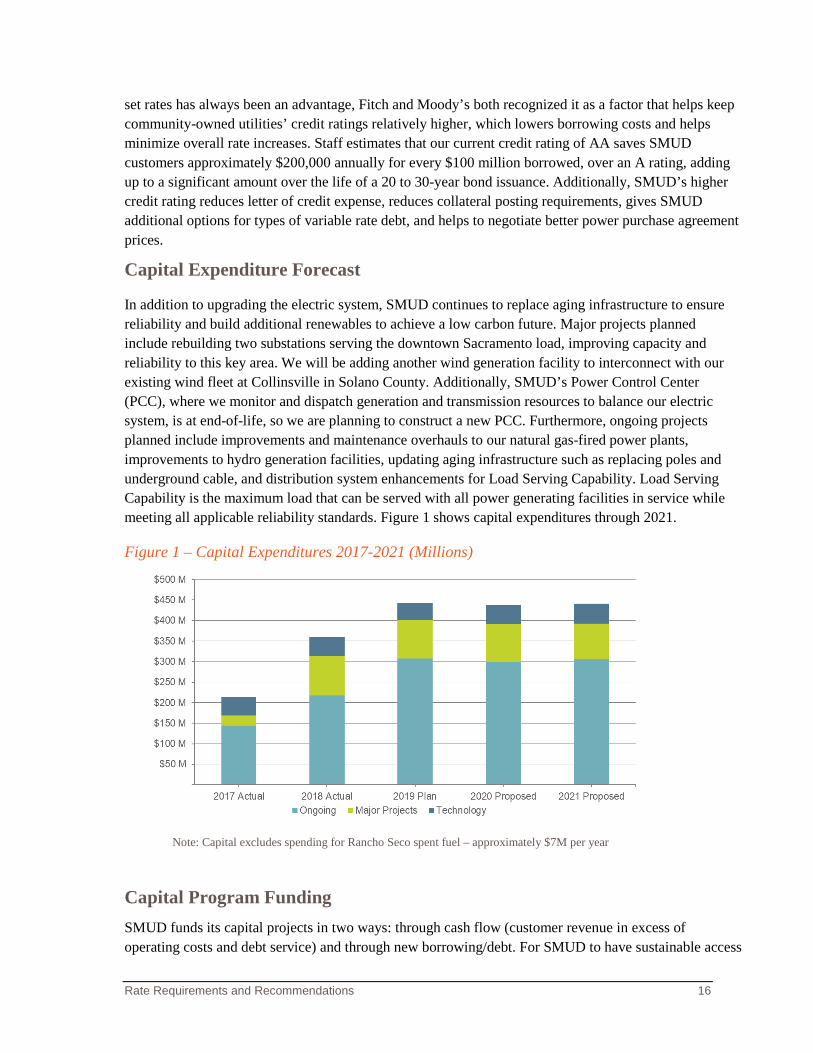
In addition to upgrading the electric system, SMUD continues to replace aging infrastructure to ensure reliability and build additional renewables to achieve a low carbon future. Major projects planned include rebuilding two substations serving the downtown Sacramento load, improving capacity and reliability to this key area. We will be adding another wind generation facility to interconnect with our existing wind fleet at Collinsville in Solano County. Additionally, SMUD’s Power Control Center (PCC), where we monitor and dispatch generation and transmission resources to balance our electric system, is at end-of-life, so we are planning to construct a new PCC. Furthermore, ongoing projects planned include improvements and maintenance overhauls to our natural gas-fired power plants, improvements to hydro generation facilities, updating aging infrastructure such as replacing poles and underground cable, and distribution system enhancements for Load Serving Capability. Load Serving Capability is the maximum load that can be served with all power generating facilities in service while meeting all applicable reliability standards. Figure 1 shows capital expenditures through 2021.
Figure 1 – Capital Expenditures 2017-2021 (Millions)
Note: Capital excludes spending for Rancho Seco spent fuel – approximately $7M per year
Capital Program Funding SMUD funds its capital projects in two ways: through cash flow (customer revenue in excess of operating costs and debt service) and through new borrowing/debt. For SMUD to have sustainable access
Rate Requirements and Recommendations 17
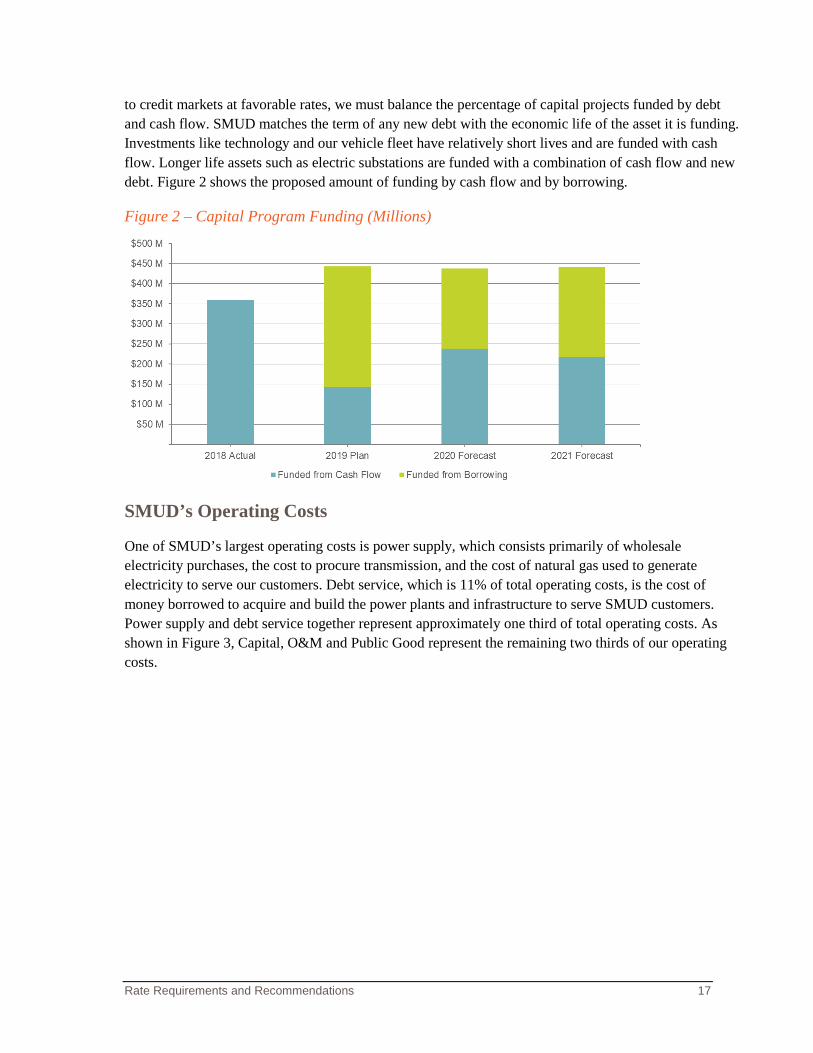
to credit markets at favorable rates, we must balance the percentage of capital projects funded by debt and cash flow. SMUD matches the term of any new debt with the economic life of the asset it is funding. Investments like technology and our vehicle fleet have relatively short lives and are funded with cash flow. Longer life assets such as electric substations are funded with a combination of cash flow and new debt. Figure 2 shows the proposed amount of funding by cash flow and by borrowing.
Figure 2 – Capital Program Funding (Millions)
SMUD’s Operating Costs
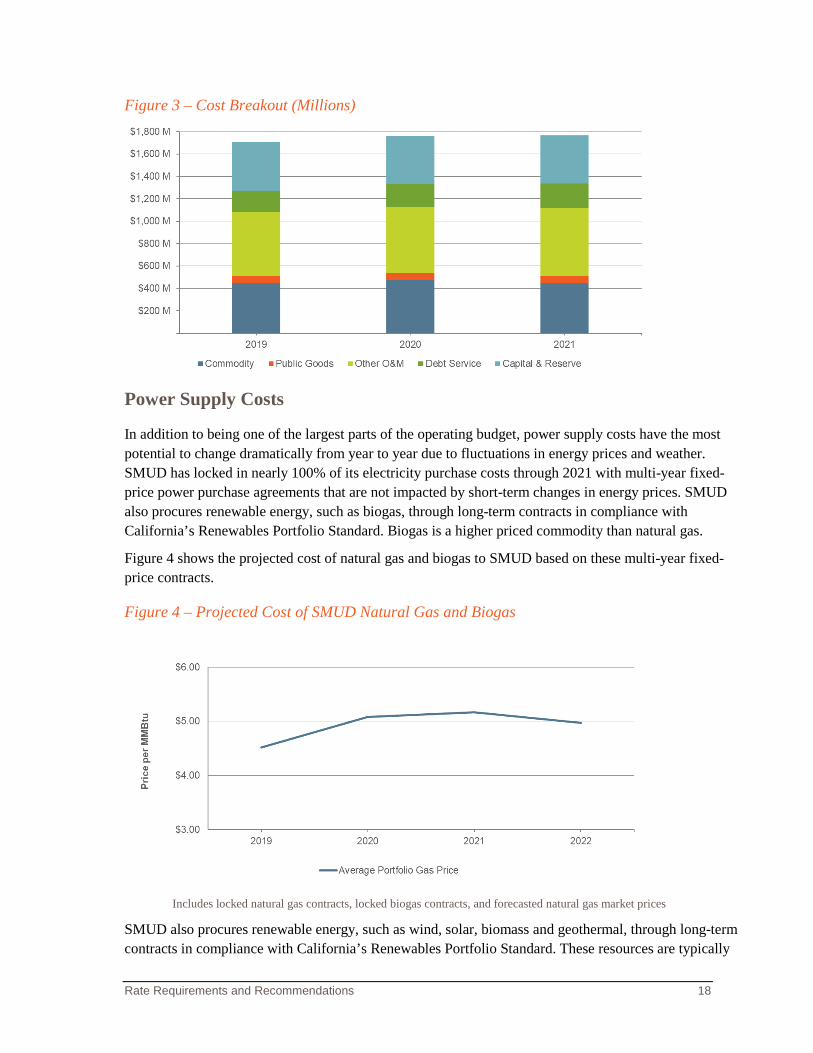
One of SMUD’s largest operating costs is power supply, which consists primarily of wholesale electricity purchases, the cost to procure transmission, and the cost of natural gas used to generate electricity to serve our customers. Debt service, which is 11% of total operating costs, is the cost of money borrowed to acquire and build the power plants and infrastructure to serve SMUD customers. Power supply and debt service together represent approximately one third of total operating costs. As shown in Figure 3, Capital, O&M and Public Good represent the remaining two thirds of our operating costs.
Rate Requirements and Recommendations 18
Figure 3 – Cost Breakout (Millions)
Power Supply Costs
In addition to being one of the largest parts of the operating budget, power supply costs have the most potential to change dramatically from year to year due to fluctuations in energy prices and weather. SMUD has locked in nearly 100% of its electricity purchase costs through 2021 with multi-year fixed-price power purchase agreements that are not impacted by short-term changes in energy prices. SMUD also procures renewable energy, such as biogas, through long-term contracts in compliance with California’s Renewables Portfolio Standard. Biogas is a higher priced commodity than natural gas.
Figure 4 shows the projected cost of natural gas and biogas to SMUD based on these multi-year fixed-price contracts.
Figure 4 – Projected Cost of SMUD Natural Gas and Biogas
Includes locked natural gas contracts, locked biogas contracts, and forecasted natural gas market prices
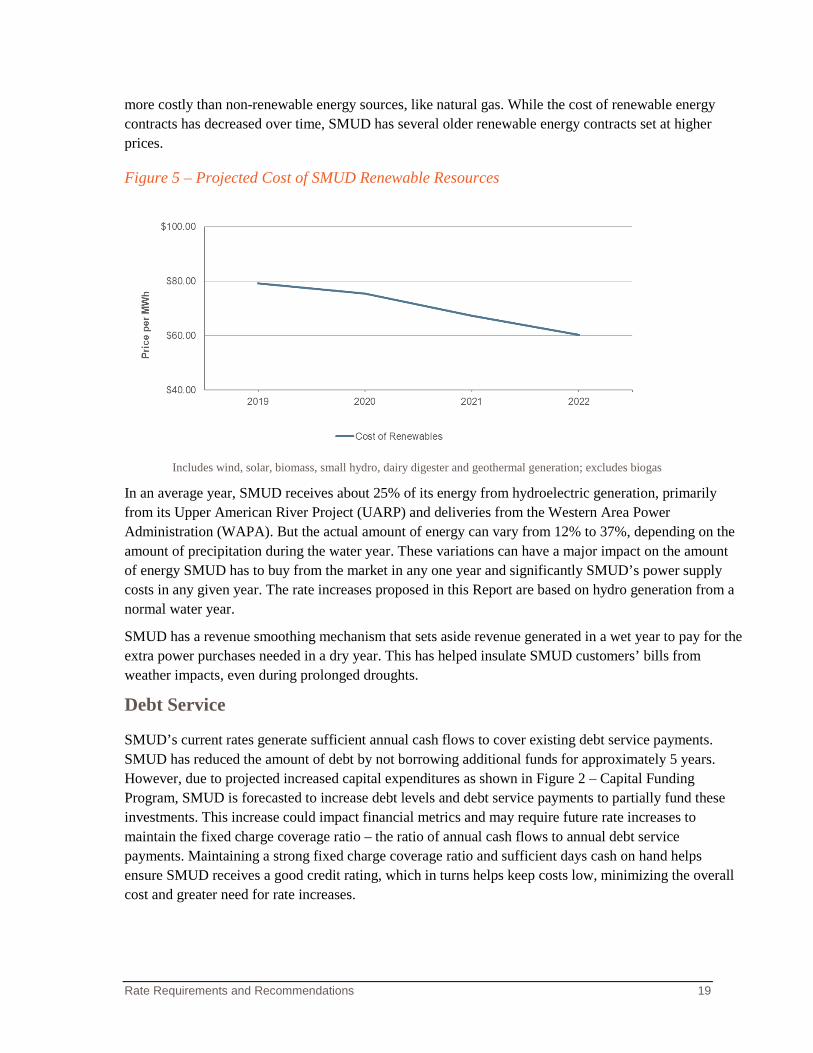
SMUD also procures renewable energy, such as wind, solar, biomass and geothermal, through long-term contracts in compliance with California’s Renewables Portfolio Standard. These resources are typically
Rate Requirements and Recommendations 19
more costly than non-renewable energy sources, like natural gas. While the cost of renewable energy contracts has decreased over time, SMUD has several older renewable energy contracts set at higher prices.
Figure 5 – Projected Cost of SMUD Renewable Resources
Includes wind, solar, biomass, small hydro, dairy digester and geothermal generation; excludes biogas
In an average year, SMUD receives about 25% of its energy from hydroelectric generation, primarily from its Upper American River Project (UARP) and deliveries from the Western Area Power Administration (WAPA). But the actual amount of energy can vary from 12% to 37%, depending on the amount of precipitation during the water year. These variations can have a major impact on the amount of energy SMUD has to buy from the market in any one year and significantly SMUD’s power supply costs in any given year. The rate increases proposed in this Report are based on hydro generation from a normal water year.
SMUD has a revenue smoothing mechanism that sets aside revenue generated in a wet year to pay for the extra power purchases needed in a dry year. This has helped insulate SMUD customers’ bills from weather impacts, even during prolonged droughts.
Debt Service
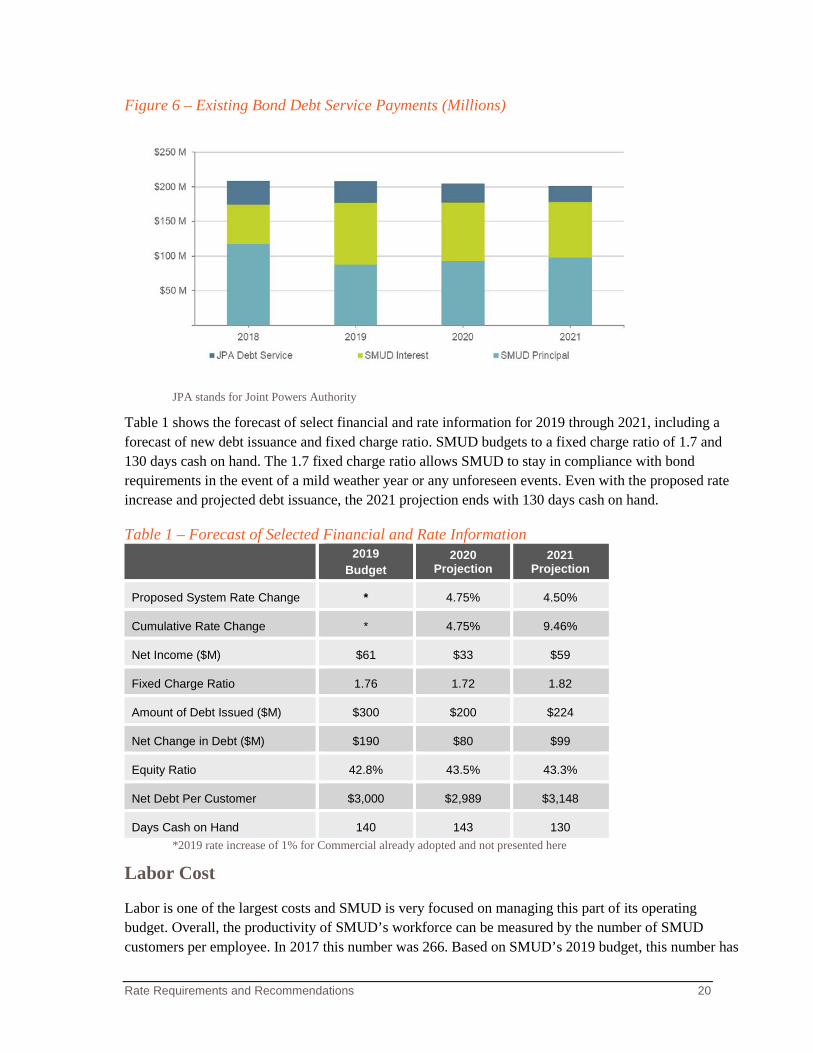
SMUD’s current rates generate sufficient annual cash flows to cover existing debt service payments. SMUD has reduced the amount of debt by not borrowing additional funds for approximately 5 years. However, due to projected increased capital expenditures as shown in Figure 2 – Capital Funding Program, SMUD is forecasted to increase debt levels and debt service payments to partially fund these investments. This increase could impact financial metrics and may require future rate increases to maintain the fixed charge coverage ratio – the ratio of annual cash flows to annual debt service payments. Maintaining a strong fixed charge coverage ratio and sufficient days cash on hand helps ensure SMUD receives a good credit rating, which in turns helps keep costs low, minimizing the overall cost and greater need for rate increases.
Rate Requirements and Recommendations 20
Figure 6 – Existing Bond Debt Service Payments (Millions)
JPA stands for Joint Powers Authority
Table 1 shows the forecast of select financial and rate information for 2019 through 2021, including a forecast of new debt issuance and fixed charge ratio. SMUD budgets to a fixed charge ratio of 1.7 and 130 days cash on hand. The 1.7 fixed charge ratio allows SMUD to stay in compliance with bond requirements in the event of a mild weather year or any unforeseen events. Even with the proposed rate increase and projected debt issuance, the 2021 projection ends with 130 days cash on hand.
Table 1 – Forecast of Selected Financial and Rate Information
2019 Budget
2020 Projection
2021 Projection
Proposed System Rate Change * 4.75% 4.50%
Cumulative Rate Change * 4.75% 9.46%
Net Income ($M) $61 $33 $59
Fixed Charge Ratio 1.76 1.72 1.82
Amount of Debt Issued ($M) $300 $200 $224
Net Change in Debt ($M) $190 $80 $99
Equity Ratio 42.8% 43.5% 43.3%
Net Debt Per Customer $3,000 $2,989 $3,148
Days Cash on Hand 140 143 130 *2019 rate increase of 1% for Commercial already adopted and not presented here
Labor Cost
Labor is one of the largest costs and SMUD is very focused on managing this part of its operating budget. Overall, the productivity of SMUD’s workforce can be measured by the number of SMUD customers per employee. In 2017 this number was 266. Based on SMUD’s 2019 budget, this number has

Rate Requirements and Recommendations 21
decreased to 257. The lower number of employees per customer reflects increased employee productivity.
SMUD has several initiatives that are expected to further improve the productivity of its workforce over the next three years. One example is a set of projects within Power Generation and Grid Assets to implement new tools to help employees do their jobs more efficiently, including a mobile application and mobile devices for managing planned work, and a scheduling tool to help schedule work more efficiently for our field forces. The new mobile tool will give employees access to data and information in the field, including customer access information and work completed previously for a specific customer on an asset.
Competitive Position Strategic Direction 2, Competitive Rates
SD-2 establishes guidelines for SMUD’s rates compared to neighboring utilities. SMUD has consistently met or exceeded SD-2 guidelines. Over the last 25 years, SMUD’s system average rate (revenue divided by kilowatt-hour (kWh) sold) has increased at or below the general inflation rate, as measured by the Consumer Price Index (CPI), shown in Figure 7. As a result, electric service in the Sacramento area has remained affordable.
Figure 7 – Annual Rate Increase vs. Consumer Price Index
Source: EIA 826 survey through 2017, revenue forecasts for 2018 and 2019 data. CPI data from Bureau of Labor Statistics. 2019 CPI data assumed to be the same as 2018.
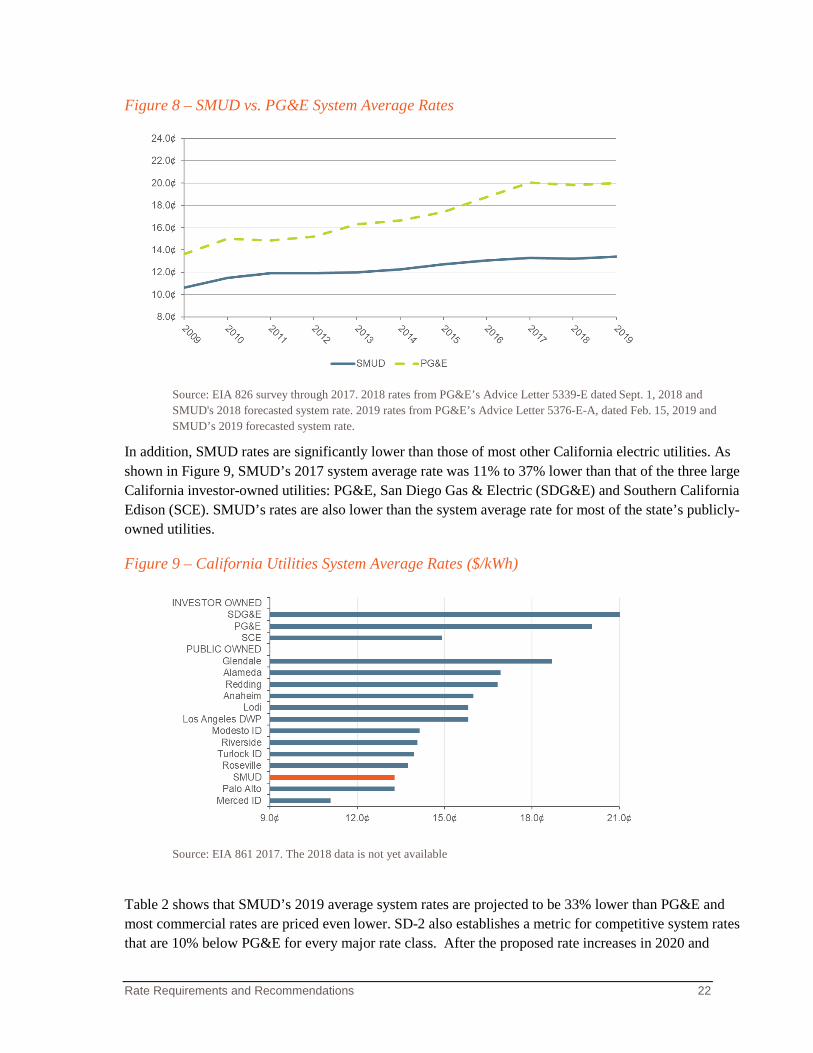
The Board’s SD-2 specifies that SMUD will maintain its system average rate at a level that’s at least 18% below that of PG&E. SMUD’s projected 2019 system average rate is 13.40 cents per kWh, which is 33% lower than PG&E’s projected system average rate for the same year. As shown in Figure 8, SMUD’s rates have been significantly below PG&E’s rates for the last decade.
Rate Requirements and Recommendations 22
Figure 8 – SMUD vs. PG&E System Average Rates
Source: EIA 826 survey through 2017. 2018 rates from PG&E’s Advice Letter 5339-E dated Sept. 1, 2018 and SMUD's 2018 forecasted system rate. 2019 rates from PG&E’s Advice Letter 5376-E-A, dated Feb. 15, 2019 and SMUD’s 2019 forecasted system rate.
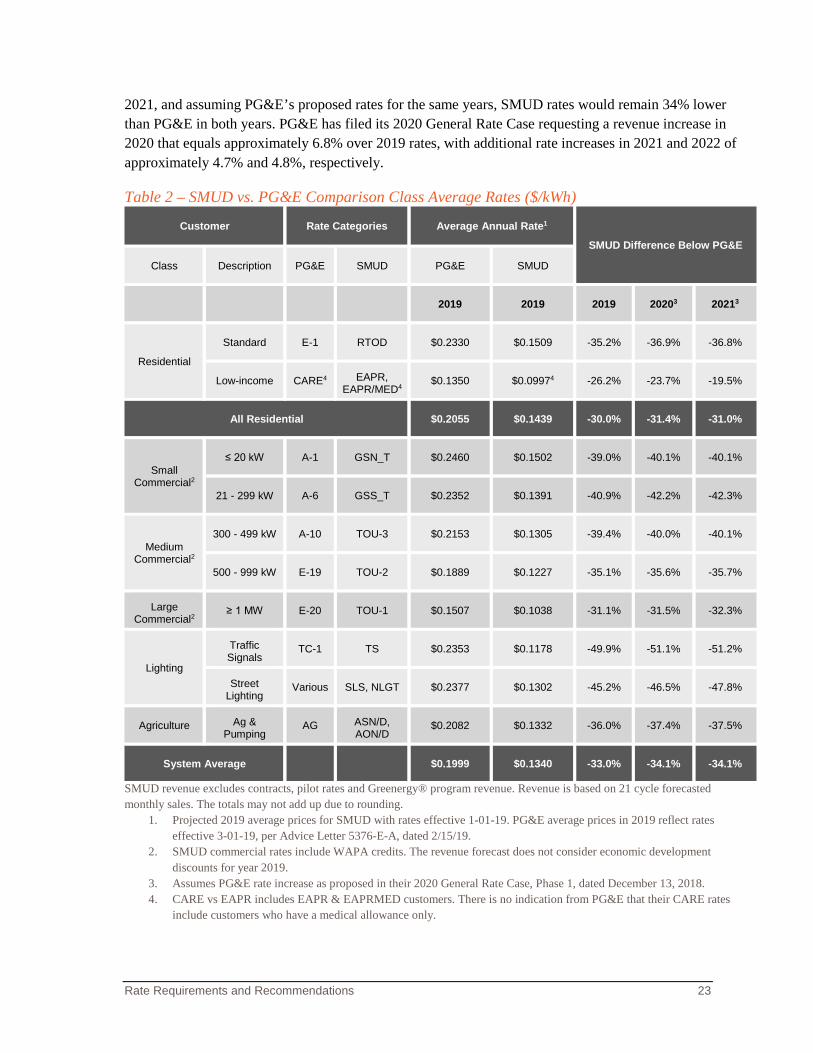
In addition, SMUD rates are significantly lower than those of most other California electric utilities. As shown in Figure 9, SMUD’s 2017 system average rate was 11% to 37% lower than that of the three large California investor-owned utilities: PG&E, San Diego Gas & Electric (SDG&E) and Southern California Edison (SCE). SMUD’s rates are also lower than the system average rate for most of the state’s publicly-owned utilities.
Figure 9 – California Utilities System Average Rates ($/kWh)
Source: EIA 861 2017. The 2018 data is not yet available
Table 2 shows that SMUD’s 2019 average system rates are projected to be 33% lower than PG&E and most commercial rates are priced even lower. SD-2 also establishes a metric for competitive system rates that are 10% below PG&E for every major rate class. After the proposed rate increases in 2020 and
Rate Requirements and Recommendations 23
2021, and assuming PG&E’s proposed rates for the same years, SMUD rates would remain 34% lower than PG&E in both years. PG&E has filed its 2020 General Rate Case requesting a revenue increase in 2020 that equals approximately 6.8% over 2019 rates, with additional rate increases in 2021 and 2022 of approximately 4.7% and 4.8%, respectively.
Table 2 – SMUD vs. PG&E Comparison Class Average Rates ($/kWh)
Customer Rate Categories Average Annual Rate1
SMUD Difference Below PG&E
Class Description PG&E SMUD PG&E SMUD
2019 2019 2019 20203 20213
Residential
Standard E-1 RTOD $0.2330 $0.1509 -35.2% -36.9% -36.8%
Low-income CARE4 EAPR, EAPR/MED4
$0.1350 $0.09974 -26.2% -23.7% -19.5%
All Residential $0.2055 $0.1439 -30.0% -31.4% -31.0%
Small Commercial2
≤ 20 kW A-1 GSN_T $0.2460 $0.1502 -39.0% -40.1% -40.1%
21 - 299 kW A-6 GSS_T $0.2352 $0.1391 -40.9% -42.2% -42.3%
Medium Commercial2
300 - 499 kW A-10 TOU-3 $0.2153 $0.1305 -39.4% -40.0% -40.1%
500 - 999 kW E-19 TOU-2 $0.1889 $0.1227 -35.1% -35.6% -35.7%
Large Commercial2
≥ 1 MW E-20 TOU-1 $0.1507 $0.1038 -31.1% -31.5% -32.3%
Lighting
Traffic Signals
TC-1 TS $0.2353 $0.1178 -49.9% -51.1% -51.2%
Street Lighting
Various SLS, NLGT $0.2377 $0.1302 -45.2% -46.5% -47.8%
Agriculture Ag & Pumping
AG ASN/D, AON/D
$0.2082 $0.1332 -36.0% -37.4% -37.5%
System Average $0.1999 $0.1340 -33.0% -34.1% -34.1%
SMUD revenue excludes contracts, pilot rates and Greenergy® program revenue. Revenue is based on 21 cycle forecasted monthly sales. The totals may not add up due to rounding.
1. Projected 2019 average prices for SMUD with rates effective 1-01-19. PG&E average prices in 2019 reflect rates effective 3-01-19, per Advice Letter 5376-E-A, dated 2/15/19.
2. SMUD commercial rates include WAPA credits. The revenue forecast does not consider economic development discounts for year 2019.
3. Assumes PG&E rate increase as proposed in their 2020 General Rate Case, Phase 1, dated December 13, 2018. 4. CARE vs EAPR includes EAPR & EAPRMED customers. There is no indication from PG&E that their CARE rates
include customers who have a medical allowance only.
Rate Requirements and Recommendations 24
Background on Rates As a not-for-profit community-owned utility, SMUD offers some of the most competitive rates in California. Electric rates are designed to collect enough revenue to pay for the cost to serve electricity, such as the cost to procure and generate electricity, transmit that energy across large distances, and distribute that energy to customers’ homes and businesses. Electric rates also cover the costs necessary to provide customer service, including the contact center and technologies such as our website and mobile app that allow customers to manage their bills digitally.
However, technology and energy markets have changed over the last decade and utilities must adapt their rate structures in response. Today, electricity rates serve other purposes in addition to collecting revenue – they inform customers when it costs more or less to use electricity to help customers manage energy use and save money. By charging lower rates during some hours and higher rates in other hours to reflect market prices, customers can control their bill by choosing when they use electricity. Electric rates also inform customers when investing in new technologies, such as distributed generation, is cost effective. Distributed energy resources (DERs) are any resources that are connected to the utility’s distribution system (69kV and below), such as solar, energy storage, energy efficiency, load flexibility and electric vehicles. Most DERs in SMUD’s territory are installed and operated by our customers.
Historically, electric utilities have either generated electricity themselves or purchased electricity on the open wholesale market from third parties to meet customers’ anticipated energy consumption, which was fairly easy to estimate. Now, however, customers may purchase DERs for their homes or businesses, and serve a portion of their energy needs themselves. Those DERs change how much energy electric utilities need to supply and when it needs to be supplied. For example, solar panels produce energy when the sun is shining. Batteries store energy for use at a different time, typically enough to power a customer’s home for two to four hours, depending on the customer’s needs. However, electric utilities must be ready to provide for all electricity needs at any time – not just once the sun goes down, but also when a cloud passes overhead or when the temperatures are in the triple digits and customers are using more energy than their DER can produce.
Prices for electricity in the open market follow the principles of supply and demand – the more electricity there is available to purchase relative to demand, the lower the price. As utilities and more customers install solar, more electricity is produced during the day when the sun is shining. Since there is no corresponding increase in usage during the day, the price of electricity drops. Not all renewable generation is available consistently – solar power is only produced while the sun is shining, and wind generation is only produced when the wind blows. Customers need their power to be on when they want it, independent of the weather or time of day. However, as the sun sets each day, solar stops producing electricity. This supply of electricity drops at about the same time most residential customers come home from work and use more energy, which drives the price of energy up significantly. To accommodate that shift, SMUD is in the process of switching to Time-of-Day rates for residential customers to help send better price signals for when to use and when to reduce electricity usage. Commercial customers have been on Time-of-Day rates for years (between 8 and 20 years depending on the rate category). This proposal includes changes to commercial Time-of-Day time periods as well to reflect changes in energy costs since time-of-day rates were last set for commercial customers.
Rate Requirements and Recommendations 25
For simplicity, the terms “Time-of-Day” and “Time-of-Use” are used interchangeably, as are the terms “Winter” and “Non-Summer.”
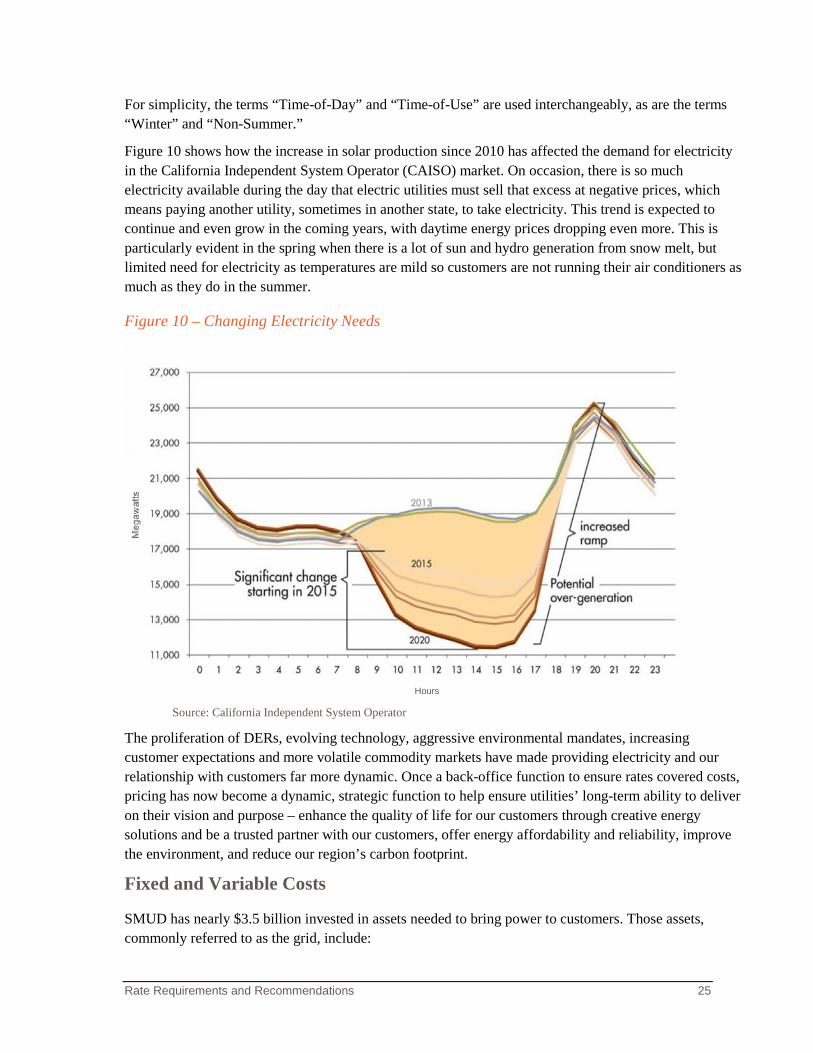
Figure 10 shows how the increase in solar production since 2010 has affected the demand for electricity in the California Independent System Operator (CAISO) market. On occasion, there is so much electricity available during the day that electric utilities must sell that excess at negative prices, which means paying another utility, sometimes in another state, to take electricity. This trend is expected to continue and even grow in the coming years, with daytime energy prices dropping even more. This is particularly evident in the spring when there is a lot of sun and hydro generation from snow melt, but limited need for electricity as temperatures are mild so customers are not running their air conditioners as much as they do in the summer.
Figure 10 – Changing Electricity Needs
Hours
Source: California Independent System Operator
The proliferation of DERs, evolving technology, aggressive environmental mandates, increasing customer expectations and more volatile commodity markets have made providing electricity and our relationship with customers far more dynamic. Once a back-office function to ensure rates covered costs, pricing has now become a dynamic, strategic function to help ensure utilities’ long-term ability to deliver on their vision and purpose – enhance the quality of life for our customers through creative energy solutions and be a trusted partner with our customers, offer energy affordability and reliability, improve the environment, and reduce our region’s carbon footprint.
Fixed and Variable Costs
SMUD has nearly $3.5 billion invested in assets needed to bring power to customers. Those assets, commonly referred to as the grid, include:
Rate Requirements and Recommendations 26
• Power plants • Transmission lines • Bulk substations • Distribution lines • Distribution transformers • Capacitor banks • Poles, conductors and safety equipment
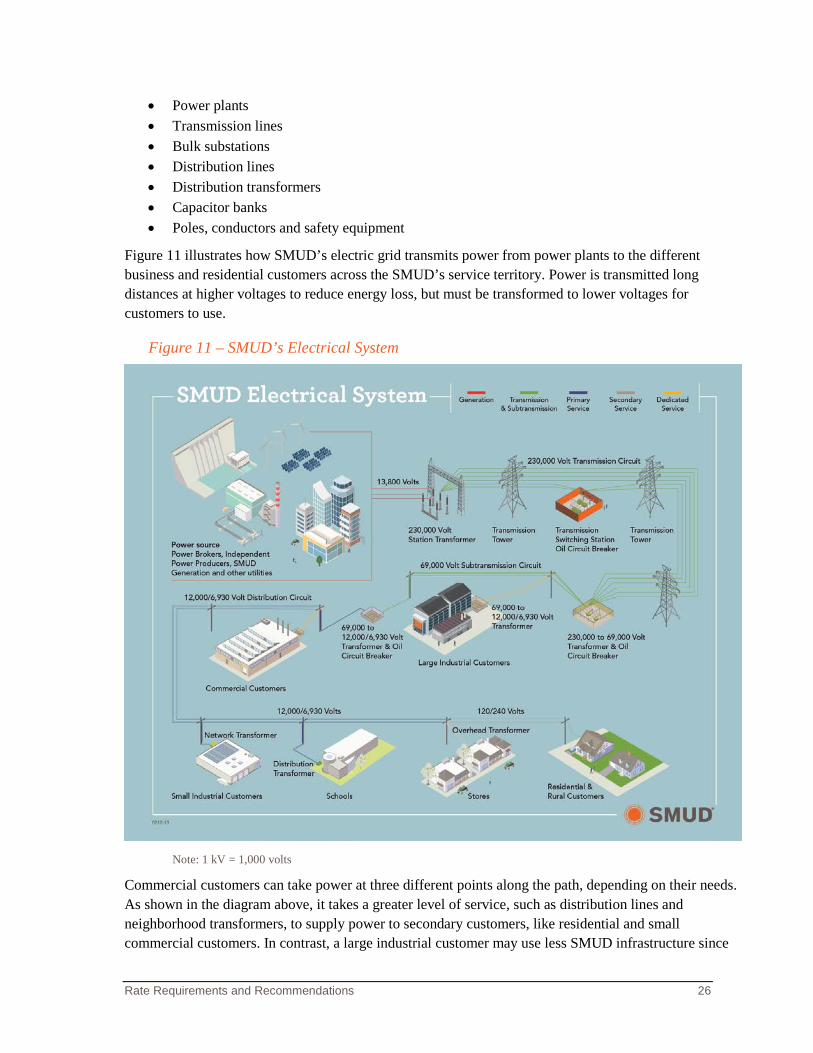
Figure 11 illustrates how SMUD’s electric grid transmits power from power plants to the different business and residential customers across the SMUD’s service territory. Power is transmitted long distances at higher voltages to reduce energy loss, but must be transformed to lower voltages for customers to use.
Figure 11 – SMUD’s Electrical System
Note: 1 kV = 1,000 volts
Commercial customers can take power at three different points along the path, depending on their needs. As shown in the diagram above, it takes a greater level of service, such as distribution lines and neighborhood transformers, to supply power to secondary customers, like residential and small commercial customers. In contrast, a large industrial customer may use less SMUD infrastructure since
Rate Requirements and Recommendations 27
they can take power directly from SMUD’s high-voltage subtransmission (69kV) or primary (12kV) system. The lower the voltage a customer requires, the more of the grid they use. SMUD must provide the equipment to transmit and transform the power to a voltage that the customer can use. Customers need to pay their fair share of the infrastructure they are relying on every hour of every day to supply their energy needs.
Commercial customers taking power at the subtransmission and primary service voltage levels provide their own equipment to transform the power to levels they can use. The grid must be sized to meet the needs of all SMUD customers at any given time to provide reliable service.
Fixed Costs A utility defines fixed costs as costs that do not vary based on how much electricity a customer uses. Costs such as operations and maintenance, and investments in transmission lines, poles, substations, transformers meters and maintenance of buildings are considered fixed costs because those costs tend to not change regardless of how much electricity customers use. SMUD also has wholesale renewable power purchase agreements and contracts for generation capacity that are fixed over the term of the contract (approximately 2/3 of the portfolio must be comprised of contracts of at least 10 years in order to meet regulatory mandates), and accordingly SMUD has the obligation to pay such contracts. Non-infrastructure costs such as the operation of the Contact Center, metering data management, billing, etc., are also fixed. These items help ensure SMUD provides reliable energy so when a customer flips their switch, the lights turn on, or if a customer calls about their bill they can get their questions answered. SMUD still must incur these costs, regardless of how much power individual customers use. SMUD has taken measures to reduce fixed costs, such as investing in technology to create lower-cost channels to communicate with our customers and having a staffing strategy that fluctuates, and thus lowers costs, depending on the amount of work.
Variable Costs Some costs are variable and will increase or decrease as customers’ electricity use varies. If customers need more power, more electricity must be produced or purchased. SMUD generates power from its own power plants or purchases power from the market when needed. Producing electricity in a natural gas power plant like the Cosumnes Power Plant requires natural gas. Fuel costs like natural gas are typically considered a variable cost. SMUD may enter into long-term agreements to lock in the price of natural gas for a number of years. Some of these contracts help manage risk and protect customers against sudden price changes in the market, but also require SMUD to become liable for the amount of such contracts. If customers reduce their electricity needs, the total cost to provide power tends to decrease, but there are certain costs in gas contracts that may become stranded.
Changes in the Market Before the proliferation of DERs and a more dynamic energy market, it was not as important whether utility revenue was collected through a fixed charge or variable charge. Now, however, because of the changes in technology and energy markets, it has become an increasingly relevant and important issue that utilities nation-wide are addressing to maintain long-term financial viability as the industry evolves. Delivering power requires large, expensive infrastructure investments, whether customers use a small or large amount of electricity. Due to these changes, if the pricing structure doesn’t evolve with the
Rate Requirements and Recommendations 28
changing utility business to accurately reflect costs, then costs will shift among customers, with some customers not paying their fair share. It is important that customers pay their fair share of costs.
SMUD’s residential and non-demand commercial rates consist of the System Infrastructure Fixed Charge (SIFC) and a per kWh energy charge. The SIFC collects only a portion of the fixed costs necessary to provide energy to customers, while the rest is collected in the per kWh energy charge which depends on usage (variable charge).
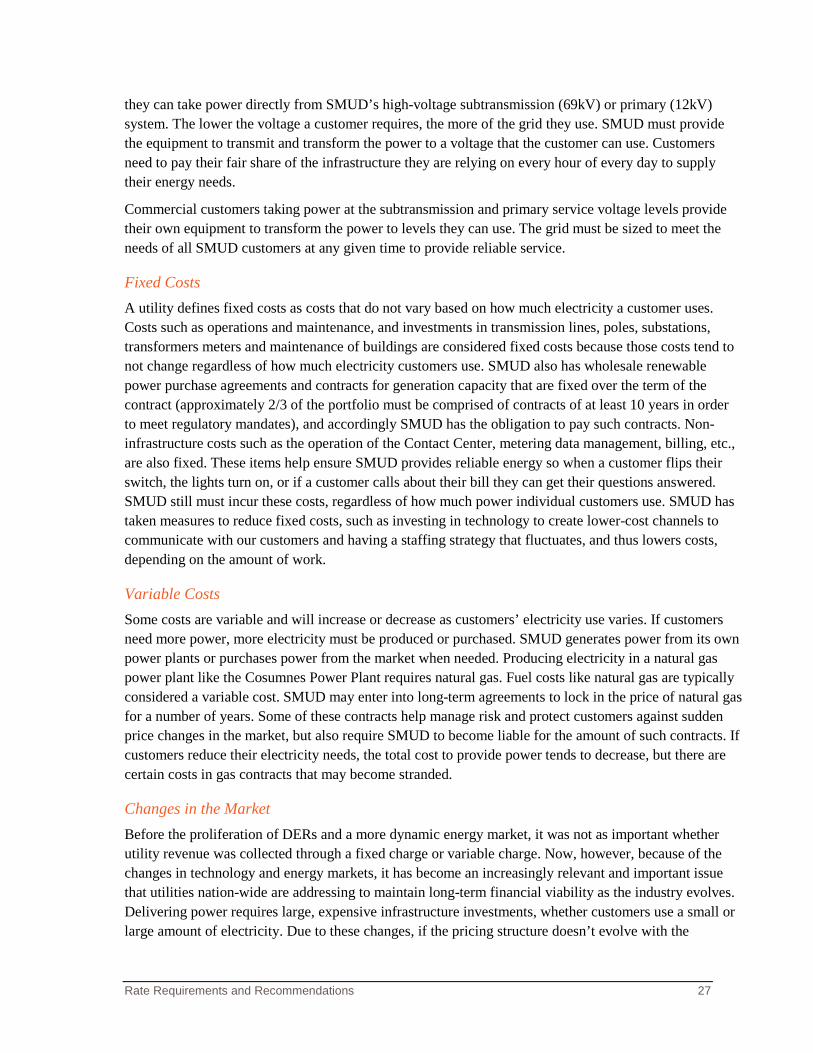
SMUD’s current commercial customers with demand rates have four different bill components – the monthly SIFC, the Site Infrastructure Charge (SIC) demand charge, Summer Super-Peak Demand Charge, and per kWh energy charges. The SIC demand and Summer Super-Peak Demand Charge are both demand charges recovering different components of SMUD’s infrastructure costs. SMUD follows the marginal cost approach from NERA and industry best practice rate principles to determine how much it costs to provide service to customers. Once costs are identified, they are then assigned to either the monthly SIFC, a demand charge, or the energy rate. NERA performed a review of SMUD’s marginal cost and recommended rate components for all commercial classes. For details, please see Appendix 1 in this document. As shown in Figure 12, a properly designed rate structure would include the following rate components:
Figure 12 – Breakdown of Costs by Rate Component
The growing prevalence of DERs can benefit the electrical grid, customers and utilities. However, with the current rate structures in place, any benefit is over shadowed by the lower fixed cost collection and cost shifting between customers due to reduced kWh sales. Currently, there is misalignment between SMUD’s fixed cost to serve and our fixed revenue collection component in a customer’s bill. Realignment of these fixed costs components with SMUD’s cost to serve requires a more complete separation of fixed costs from per kWh energy charges. Separating revenue collection of fixed charges from energy charges will help reduce upward rate pressure by preventing unfair cost shifting from customers that have adopted DERs to those that have not.
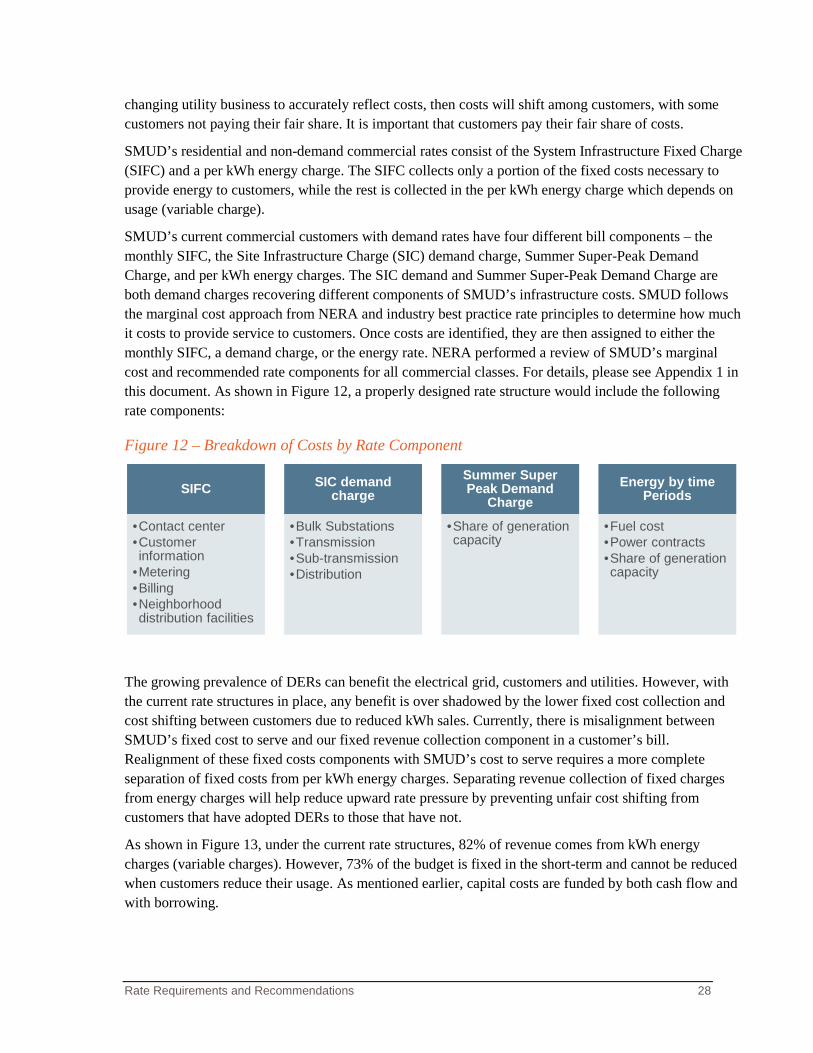
As shown in Figure 13, under the current rate structures, 82% of revenue comes from kWh energy charges (variable charges). However, 73% of the budget is fixed in the short-term and cannot be reduced when customers reduce their usage. As mentioned earlier, capital costs are funded by both cash flow and with borrowing.
SIFC
•Contact center•Customer information
•Metering•Billing•Neighborhood distribution facilities
SIC demand charge
•Bulk Substations•Transmission•Sub-transmission•Distribution
Summer Super Peak Demand
Charge
•Share of generation capacity
Energy by time Periods
•Fuel cost•Power contracts•Share of generation capacity
Rate Requirements and Recommendations 29
Figure 13 – Fixed and Variable Costs in Budget and Rate Design
*Excludes pilot rates.
Integrated Resource Plan
In 2018, SMUD’s Board adopted a new IRP through a comprehensive public process. SMUD’s IRP serves two purposes:
1. To adopt more aggressive carbon reduction goals than are currently expressed in SMUD’s Strategic Direction 9, Resource Planning policy goal; and
2. To meet the California Energy Resources Conservation and Development Commission’s (CEC) IRP reporting guidelines as required for certain publicly-owned utilities per Senate Bill 350 (SB350 2015).
SMUD’s Board-adopted IRP expands its greenhouse gas (GHG) reduction goals while focusing on local benefits in the communities we serve, including those in disadvantaged communities. In focusing on local benefits, SMUD considered cost and customer rate impacts, reliability and the desire to continue its environmental leadership position. GHG emissions reduction from transportation and buildings became a central focus of the plan since together these two sectors are the largest contributors to GHG emissions and air quality challenges in the Sacramento region. To greatly reduce GHG emissions from transportation and buildings, SMUD’s IRP focused on electricity conservation and electrification in these sectors, while also maximizing local renewable generation. So, SMUD’s IRP focused on aggressive electrification in the Sacramento region through programs and incentives, supporting the State’s policy goal of 80x50 (80% reduction of economy-wide GHG emissions below 1990 level by 2050), in which there is a lack of long-term local programs to achieve these goals. Electrification means customers switching to electric options, such as heat pumps, electric water heaters and electric vehicles, instead of alternatives that require non-renewable fuel sources, such as gasoline and natural gas.
The four key strategies in the 2018 IRP are energy efficiency, transportation and building electrification, low-carbon energy and fuels (solar, wind, geothermal, biomass, etc.) and mitigation of other GHG sources such as those from agriculture and industry. As a result of SMUD’s efforts in these areas, the key findings and goals of SMUD’s 2018 IRP are:
Rate Requirements and Recommendations 30
• Reduce GHG emissions from SMUD’s energy supply by more than 60% by 2030 relative to 1990 levels, and a goal of Net Zero emissions by 2040, due, in part to a significant investment in electrification;
• Reduce GHG emissions in the Sacramento region by almost 65% relative to 2020 levels through aggressive electrification, energy efficiency and renewable energy procurement;
• Load grows significantly between 2030 and 2040 as the Sacramento region increasingly electrifies its transportation and buildings, replacing fossil fuels;
• Continue meeting or exceeding the State RPS goals, including the 60% RPS by 2030 recently enacted in 2018 under SB100;
• More than tripling of SMUD’s current renewable portfolio capacity by 2040, with a preference for local resources;
• A 30% increase in reliability assets by 2040, including over 550 MW of battery storage, as well as contributions from renewables and other resources; and
• Based on current technology, continued use of SMUD’s existing thermal natural gas-fired plants, with a significant reduction in utilization and associated GHG emissions by 2040, due to these assets continuing to be the best technology available to provide customers with cost-effective reliable electricity throughout the forecast period.
SMUD is to file its 2018 IRP with the CEC by April 30, 2019 pursuant to the CEC’s IRP guidelines.
Net Energy Metering
Net Energy Metering (NEM) was established by the State in the late 1990s to help the nascent solar industry grow and accelerate customer adoption of solar. The regulation requires electric utilities to buy back all surplus electricity generated by a NEM customer at the full retail value and crediting that value towards the utility-supplied (when the NEM facility is not producing energy) on the customer’s monthly bill. Eligible renewable electrical generating facilities are defined by the CEC, but to date, solar has been the dominant renewable technology used by customers. A reason for this is that the incentives adopted by the State were focused on promoting and supporting the new solar industry. For example, Senate Bill 1 (SB-1) required utilities to charge a small amount to every customer and use those funds to promote solar adoption by subsidizing the installation cost of customers’ PV systems.
Over the course of approximately 10 years, SMUD collected $130 million from customers as a result of SB-1 to subsidize the cost of customer installations of 125MW of solar in the SMUD service area. SMUD’s SB-1 obligation was fulfilled in 2017. The Federal government also adopted mechanisms to promote solar through the federal tax credit known as investment tax credit (ITC) to reduce the cost of installing solar energy systems. Thanks to the combination of these policies, solar technology has become the dominant renewable technology for net metering customers.
Under the NEM mandates, utilities were required to provide NEM until their customers’ renewable generation reached 5% of a utility’s peak load. For SMUD, the 5% NEM cap is 150 MW, and we reached and exceeded that capacity in June 2017. SMUD continues to offer NEM despite reaching the regulatory cap, and customers’ installed solar capacity in SMUD’s service territory reached 188 MW on
Rate Requirements and Recommendations 31
Dec. 31, 2018. Customer-installed generation capacity continues to grow every day as additional customers adopt on-site generation.
Additionally, in May 2018, the CEC unanimously adopted its 2019 Building Efficiency Standards, putting in place new minimum efficiency levels for new homes and buildings constructed after 2019. The 2019 standards include a mandated level of solar photovoltaic (PV) generation on each new single family or low-rise residential home, with some exceptions, beginning in 2020. In Sacramento (CEC Climate Zone 12), a 2,000-square foot home would be required to have at least 2.5 kW of solar PV.
Purpose of Report
SMUD’s current commercial rates were adopted approximately 20 years ago (rates for smallest commercial customers were adopted approximately 8 years ago). Since that time, new and various DER technologies have become more readily available and affordable to customers, which has encouraged significant DER adoption. SMUD’s load growth has stayed stagnant over the past 10 years due to the increase in energy efficiency and DER adoption. These technologies have fundamentally changed the electric industry and have resulted in pricing structures that no longer reflect the true cost to supply energy and serve customers, making changes to electric rates essential.
This Report recommends changes to better align SMUD’s rates with the cost to serve. SMUD aims to ensure customers are paying their fair share of fixed costs, and send accurate price signals to help customers make sound investment decisions.
Workshops and Community Participation SMUD will hold two public rate workshops and a final public hearing at SMUD on the dates outlined on the next page. At these meetings, staff will present details about the proposed rate changes and provide additional information on the expected impacts to individual customer classes.
SMUD invites customers and the community at large to attend these public forums to learn more about the proposed changes, offer comments and ask questions. These forums will also provide valuable feedback for SMUD Board members who will consider the proposed measures at the public hearing. The public hearing on June 4, 2019 will provide the last opportunity for public discussion before the Board vote later in the summer.
In addition, SMUD will communicate with hundreds of community groups and organizations to provide information about the proposals in this Report through in-person presentations, newsletter articles, videos and other channels to most effectively reach the organizations’ members and constituents.
Customers and other interested parties may also provide input or ask questions by contacting SMUD at 1-855-736-7655 or [email protected].

Rate Requirements and Recommendations 32
Workshops and Public Hearing Schedule
Date & Time Event Location Address April 23, 2019 10 a.m.
Public Workshop
SMUD Customer Service Center Rubicon Room
6301 S Street, Sacramento
May 9, 2019 6 p.m.
Public Workshop
SMUD Customer Service Center Rubicon Room
6301 S Street, Sacramento
June 4, 2019 6 p.m. Public Hearing SMUD Customer Service Center
Rubicon Room 6301 S Street, Sacramento
Revenue Requirement 33
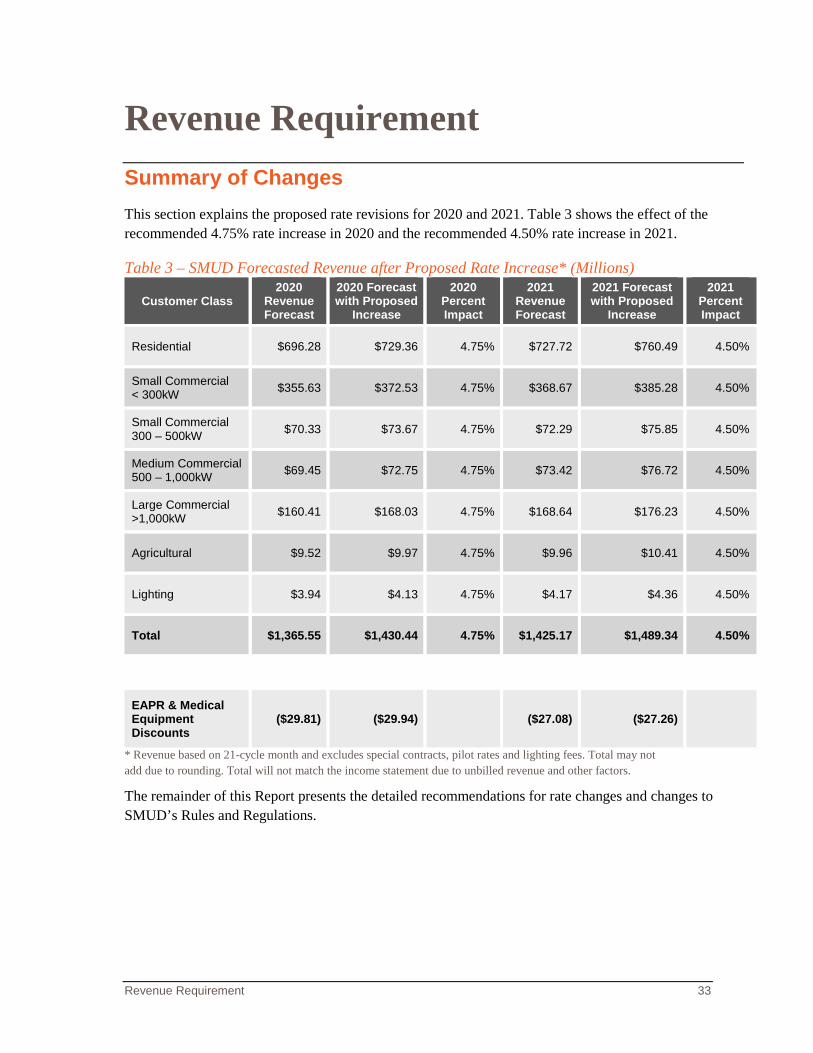
Revenue Requirement Summary of Changes This section explains the proposed rate revisions for 2020 and 2021. Table 3 shows the effect of the recommended 4.75% rate increase in 2020 and the recommended 4.50% rate increase in 2021.
Table 3 – SMUD Forecasted Revenue after Proposed Rate Increase* (Millions)
Customer Class 2020
Revenue Forecast
2020 Forecast with Proposed
Increase
2020 Percent Impact
2021 Revenue Forecast
2021 Forecast with Proposed
Increase
2021 Percent Impact
Residential $696.28 $729.36 4.75% $727.72 $760.49 4.50%
Small Commercial < 300kW $355.63 $372.53 4.75% $368.67 $385.28 4.50%
Small Commercial 300 – 500kW $70.33 $73.67 4.75% $72.29 $75.85 4.50%
Medium Commercial 500 – 1,000kW $69.45 $72.75 4.75% $73.42 $76.72 4.50%
Large Commercial >1,000kW $160.41 $168.03 4.75% $168.64 $176.23 4.50%
Agricultural $9.52 $9.97 4.75% $9.96 $10.41 4.50%
Lighting $3.94 $4.13 4.75% $4.17 $4.36 4.50%
Total $1,365.55 $1,430.44 4.75% $1,425.17 $1,489.34 4.50%
EAPR & Medical Equipment Discounts
($29.81) ($29.94) ($27.08) ($27.26)
* Revenue based on 21-cycle month and excludes special contracts, pilot rates and lighting fees. Total may not add due to rounding. Total will not match the income statement due to unbilled revenue and other factors.
The remainder of this Report presents the detailed recommendations for rate changes and changes to SMUD’s Rules and Regulations.
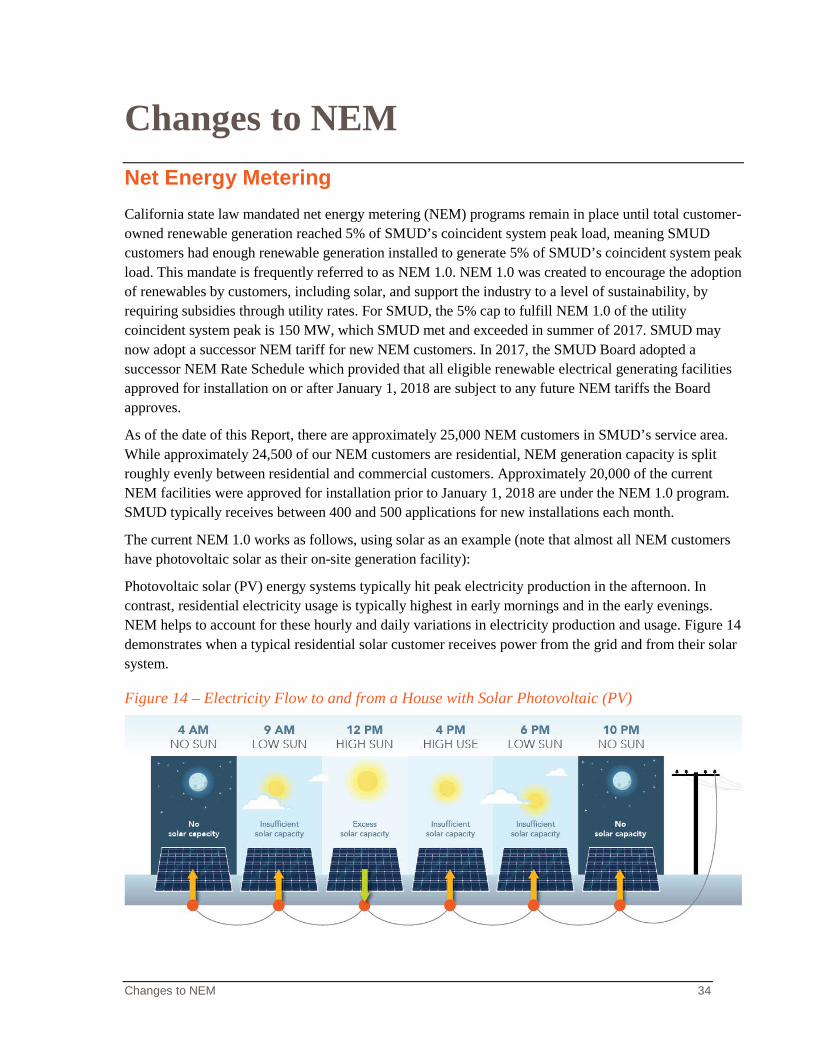
Changes to NEM 34
Changes to NEM Net Energy Metering California state law mandated net energy metering (NEM) programs remain in place until total customer-owned renewable generation reached 5% of SMUD’s coincident system peak load, meaning SMUD customers had enough renewable generation installed to generate 5% of SMUD’s coincident system peak load. This mandate is frequently referred to as NEM 1.0. NEM 1.0 was created to encourage the adoption of renewables by customers, including solar, and support the industry to a level of sustainability, by requiring subsidies through utility rates. For SMUD, the 5% cap to fulfill NEM 1.0 of the utility coincident system peak is 150 MW, which SMUD met and exceeded in summer of 2017. SMUD may now adopt a successor NEM tariff for new NEM customers. In 2017, the SMUD Board adopted a successor NEM Rate Schedule which provided that all eligible renewable electrical generating facilities approved for installation on or after January 1, 2018 are subject to any future NEM tariffs the Board approves.
As of the date of this Report, there are approximately 25,000 NEM customers in SMUD’s service area. While approximately 24,500 of our NEM customers are residential, NEM generation capacity is split roughly evenly between residential and commercial customers. Approximately 20,000 of the current NEM facilities were approved for installation prior to January 1, 2018 are under the NEM 1.0 program. SMUD typically receives between 400 and 500 applications for new installations each month.
The current NEM 1.0 works as follows, using solar as an example (note that almost all NEM customers have photovoltaic solar as their on-site generation facility):
Photovoltaic solar (PV) energy systems typically hit peak electricity production in the afternoon. In contrast, residential electricity usage is typically highest in early mornings and in the early evenings. NEM helps to account for these hourly and daily variations in electricity production and usage. Figure 14 demonstrates when a typical residential solar customer receives power from the grid and from their solar system.
Figure 14 – Electricity Flow to and from a House with Solar Photovoltaic (PV)
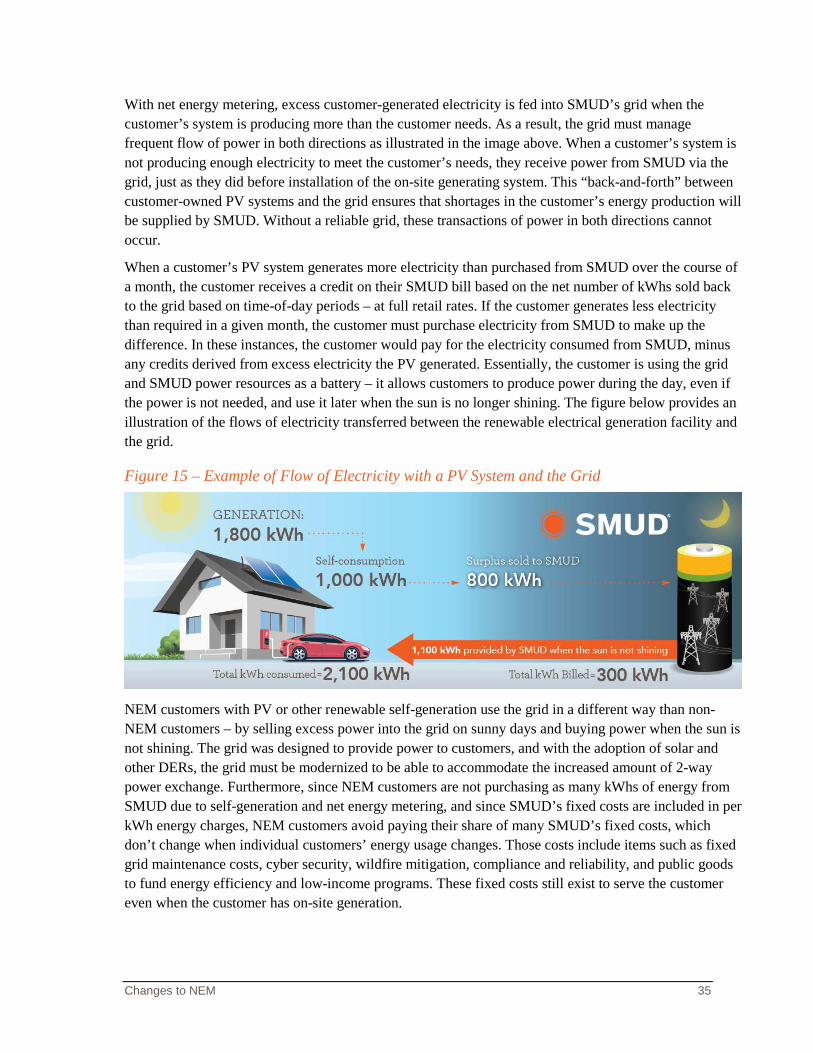
Changes to NEM 35
With net energy metering, excess customer-generated electricity is fed into SMUD’s grid when the customer’s system is producing more than the customer needs. As a result, the grid must manage frequent flow of power in both directions as illustrated in the image above. When a customer’s system is not producing enough electricity to meet the customer’s needs, they receive power from SMUD via the grid, just as they did before installation of the on-site generating system. This “back-and-forth” between customer-owned PV systems and the grid ensures that shortages in the customer’s energy production will be supplied by SMUD. Without a reliable grid, these transactions of power in both directions cannot occur.
When a customer’s PV system generates more electricity than purchased from SMUD over the course of a month, the customer receives a credit on their SMUD bill based on the net number of kWhs sold back to the grid based on time-of-day periods – at full retail rates. If the customer generates less electricity than required in a given month, the customer must purchase electricity from SMUD to make up the difference. In these instances, the customer would pay for the electricity consumed from SMUD, minus any credits derived from excess electricity the PV generated. Essentially, the customer is using the grid and SMUD power resources as a battery – it allows customers to produce power during the day, even if the power is not needed, and use it later when the sun is no longer shining. The figure below provides an illustration of the flows of electricity transferred between the renewable electrical generation facility and the grid.
Figure 15 – Example of Flow of Electricity with a PV System and the Grid
NEM customers with PV or other renewable self-generation use the grid in a different way than non-NEM customers – by selling excess power into the grid on sunny days and buying power when the sun is not shining. The grid was designed to provide power to customers, and with the adoption of solar and other DERs, the grid must be modernized to be able to accommodate the increased amount of 2-way power exchange. Furthermore, since NEM customers are not purchasing as many kWhs of energy from SMUD due to self-generation and net energy metering, and since SMUD’s fixed costs are included in per kWh energy charges, NEM customers avoid paying their share of many SMUD’s fixed costs, which don’t change when individual customers’ energy usage changes. Those costs include items such as fixed grid maintenance costs, cyber security, wildfire mitigation, compliance and reliability, and public goods to fund energy efficiency and low-income programs. These fixed costs still exist to serve the customer even when the customer has on-site generation.
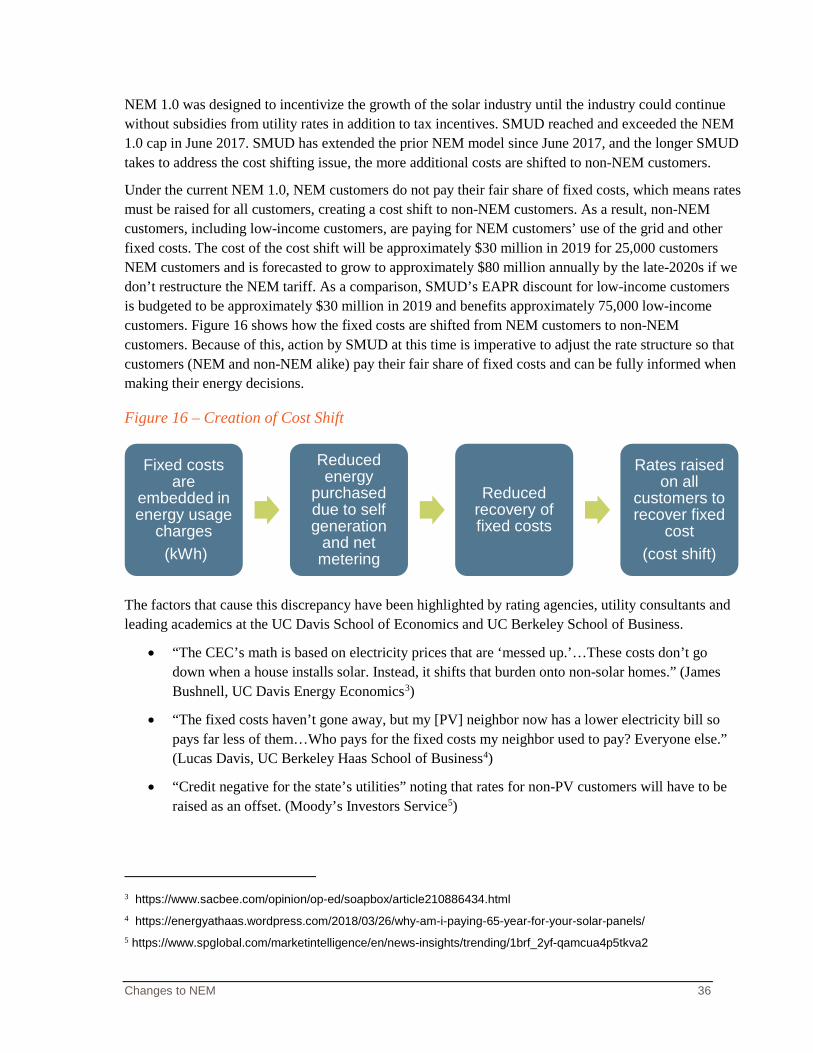
Changes to NEM 36
NEM 1.0 was designed to incentivize the growth of the solar industry until the industry could continue without subsidies from utility rates in addition to tax incentives. SMUD reached and exceeded the NEM 1.0 cap in June 2017. SMUD has extended the prior NEM model since June 2017, and the longer SMUD takes to address the cost shifting issue, the more additional costs are shifted to non-NEM customers.
Under the current NEM 1.0, NEM customers do not pay their fair share of fixed costs, which means rates must be raised for all customers, creating a cost shift to non-NEM customers. As a result, non-NEM customers, including low-income customers, are paying for NEM customers’ use of the grid and other fixed costs. The cost of the cost shift will be approximately $30 million in 2019 for 25,000 customers NEM customers and is forecasted to grow to approximately $80 million annually by the late-2020s if we don’t restructure the NEM tariff. As a comparison, SMUD’s EAPR discount for low-income customers is budgeted to be approximately $30 million in 2019 and benefits approximately 75,000 low-income customers. Figure 16 shows how the fixed costs are shifted from NEM customers to non-NEM customers. Because of this, action by SMUD at this time is imperative to adjust the rate structure so that customers (NEM and non-NEM alike) pay their fair share of fixed costs and can be fully informed when making their energy decisions.
Figure 16 – Creation of Cost Shift
The factors that cause this discrepancy have been highlighted by rating agencies, utility consultants and leading academics at the UC Davis School of Economics and UC Berkeley School of Business.
• “The CEC’s math is based on electricity prices that are ‘messed up.’…These costs don’t go down when a house installs solar. Instead, it shifts that burden onto non-solar homes.” (James Bushnell, UC Davis Energy Economics3)
• “The fixed costs haven’t gone away, but my [PV] neighbor now has a lower electricity bill so pays far less of them…Who pays for the fixed costs my neighbor used to pay? Everyone else.” (Lucas Davis, UC Berkeley Haas School of Business4)
• “Credit negative for the state’s utilities” noting that rates for non-PV customers will have to be raised as an offset. (Moody’s Investors Service5)
3 https://www.sacbee.com/opinion/op-ed/soapbox/article210886434.html 4 https://energyathaas.wordpress.com/2018/03/26/why-am-i-paying-65-year-for-your-solar-panels/ 5 https://www.spglobal.com/marketintelligence/en/news-insights/trending/1brf_2yf-qamcua4p5tkva2
Fixed costs are
embedded in energy usage
charges(kWh)
Reduced energy
purchased due to self generation
and net metering
Reduced recovery of fixed costs
Rates raised on all
customers to recover fixed
cost (cost shift)
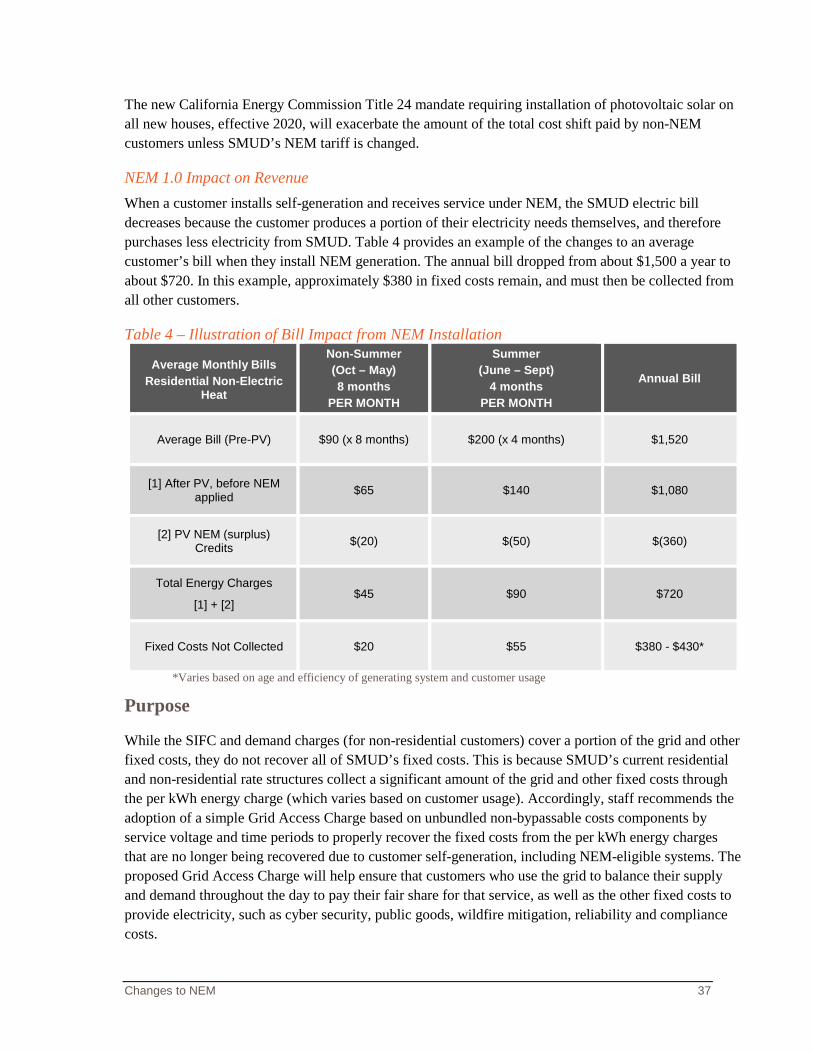
Changes to NEM 37
The new California Energy Commission Title 24 mandate requiring installation of photovoltaic solar on all new houses, effective 2020, will exacerbate the amount of the total cost shift paid by non-NEM customers unless SMUD’s NEM tariff is changed.
NEM 1.0 Impact on Revenue When a customer installs self-generation and receives service under NEM, the SMUD electric bill decreases because the customer produces a portion of their electricity needs themselves, and therefore purchases less electricity from SMUD. Table 4 provides an example of the changes to an average customer’s bill when they install NEM generation. The annual bill dropped from about $1,500 a year to about $720. In this example, approximately $380 in fixed costs remain, and must then be collected from all other customers.
Table 4 – Illustration of Bill Impact from NEM Installation
Average Monthly Bills Residential Non-Electric
Heat
Non-Summer (Oct – May) 8 months
PER MONTH
Summer (June – Sept)
4 months PER MONTH
Annual Bill
Average Bill (Pre-PV) $90 (x 8 months) $200 (x 4 months) $1,520
[1] After PV, before NEM applied $65 $140 $1,080
[2] PV NEM (surplus) Credits $(20) $(50) $(360)
Total Energy Charges
[1] + [2] $45 $90 $720
Fixed Costs Not Collected $20 $55 $380 - $430*
*Varies based on age and efficiency of generating system and customer usage
Purpose
While the SIFC and demand charges (for non-residential customers) cover a portion of the grid and other fixed costs, they do not recover all of SMUD’s fixed costs. This is because SMUD’s current residential and non-residential rate structures collect a significant amount of the grid and other fixed costs through the per kWh energy charge (which varies based on customer usage). Accordingly, staff recommends the adoption of a simple Grid Access Charge based on unbundled non-bypassable costs components by service voltage and time periods to properly recover the fixed costs from the per kWh energy charges that are no longer being recovered due to customer self-generation, including NEM-eligible systems. The proposed Grid Access Charge will help ensure that customers who use the grid to balance their supply and demand throughout the day to pay their fair share for that service, as well as the other fixed costs to provide electricity, such as cyber security, public goods, wildfire mitigation, reliability and compliance costs.
Changes to NEM 38
SMUD Board Policy SD-2 provides guidelines to balance and achieve several goals, including that rates shall be simple and easy to understand. With this policy in mind, staff’s approach uses the non-bypassable cost components as the basis to calculate the proposed Grid Access Charge based on the size of the customer’s generating system (CEC-AC) to balance customer experience, be easy to implement and be in line with SD-2 policy objectives. Staff also recommends publishing the proposed Grid Access Charge for solar systems until 2025 to provide rate predictability to customers and the industry.
The monthly Grid Access Charge will be assessed based on the size (in kW of CEC-AC rating) of the generating system installed for customers meeting the following criteria (NEM 2.0 customers):
• Moved in or transferred service after March 31, 2019 to a premises with an eligible generating facility; or
• Have an eligible generating facility where the application to SMUD for interconnection was submitted after March 31, 2019.
A Grid Access Charge ensures all customers pay their fair share of fixed costs, while offering additional benefits to customers and SMUD, including encouraging customers’ adoption of energy storage and right-sizing their NEM systems based on the energy required on-site. NEM 2.0 customers will continue to receive full retail credit value by time period per kWh for excess generation exported to SMUD’s grid in the time periods when the energy is generated.
NEM 1.0 Customer Grandfathering Installation of an eligible renewable generation facility Pre-2018
SMUD Board Policy SD-2 provides direction to balance and achieve several goals, which include the requirement to minimize “sticker” shock in the transition from one rate design to another. Staff has considered this directive in the development of the following grandfathering policies.
NEM 1.0 customers will be grandfathered under the existing NEM 1.0 rate schedule for 20 years if:
• The customer moved into or transferred service to a home or building with an eligible renewable generation facility prior to January 1, 2018; and
• The customer received approval from SMUD for installation of an eligible renewable generation facility by January 1, 2018.
The grandfathering period will start with the first billing cycle of the customer’s settlement month, but no earlier than 2003. At the end of the grandfathering period, NEM 1.0 customers will be subject to NEM 2.0 or the successor rate. If a NEM 1.0 customer moves from or transfers service from their home or building, the new owner or resident will be subject to NEM 2.0. A NEM 1.0 customer will be subject to NEM 2.0 if they move to a home or building after March 31, 2019, and that premises has an eligible renewable generation facility.
Installation of an eligible renewable generation facility in 2018 and until Mar 31, 2019
NEM 1.0 customers will be grandfathered under the NEM 1.0 rate schedule for 10 years if:
• They moved into or transferred service to a home or building with an eligible renewable generation facility between January 1, 2018 and March 31, 2019; or
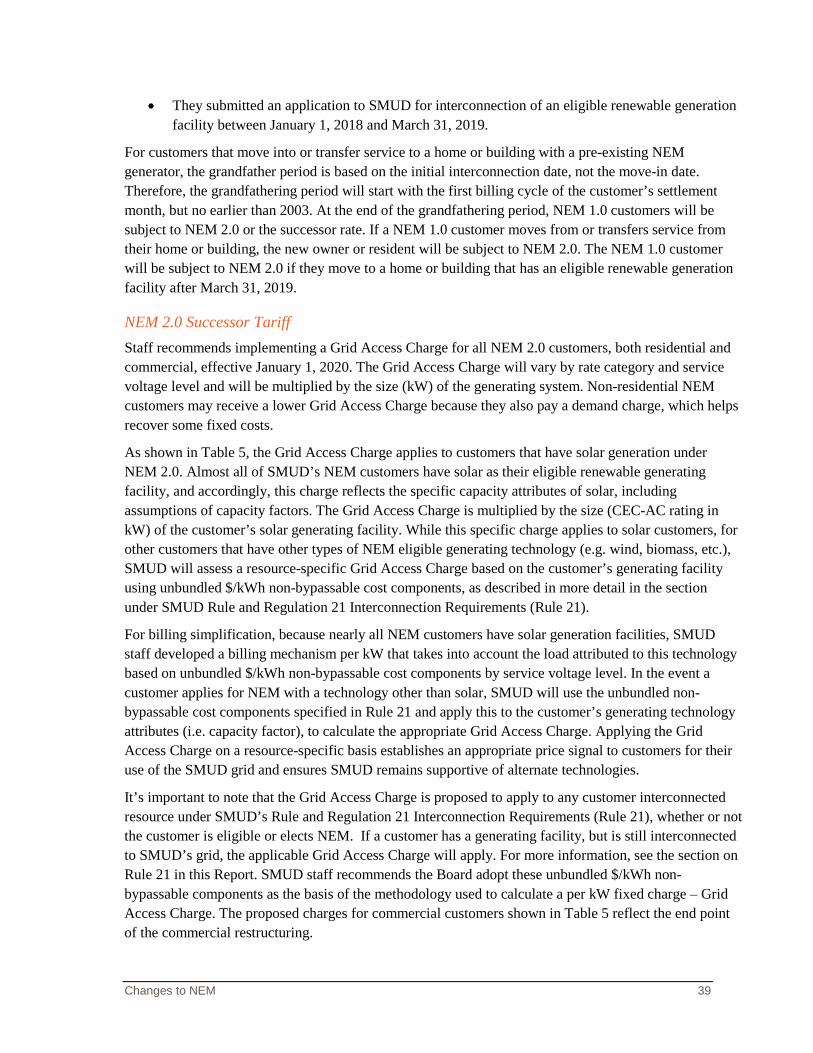
Changes to NEM 39
• They submitted an application to SMUD for interconnection of an eligible renewable generation facility between January 1, 2018 and March 31, 2019.
For customers that move into or transfer service to a home or building with a pre-existing NEM generator, the grandfather period is based on the initial interconnection date, not the move-in date. Therefore, the grandfathering period will start with the first billing cycle of the customer’s settlement month, but no earlier than 2003. At the end of the grandfathering period, NEM 1.0 customers will be subject to NEM 2.0 or the successor rate. If a NEM 1.0 customer moves from or transfers service from their home or building, the new owner or resident will be subject to NEM 2.0. The NEM 1.0 customer will be subject to NEM 2.0 if they move to a home or building that has an eligible renewable generation facility after March 31, 2019.
NEM 2.0 Successor Tariff Staff recommends implementing a Grid Access Charge for all NEM 2.0 customers, both residential and commercial, effective January 1, 2020. The Grid Access Charge will vary by rate category and service voltage level and will be multiplied by the size (kW) of the generating system. Non-residential NEM customers may receive a lower Grid Access Charge because they also pay a demand charge, which helps recover some fixed costs.
As shown in Table 5, the Grid Access Charge applies to customers that have solar generation under NEM 2.0. Almost all of SMUD’s NEM customers have solar as their eligible renewable generating facility, and accordingly, this charge reflects the specific capacity attributes of solar, including assumptions of capacity factors. The Grid Access Charge is multiplied by the size (CEC-AC rating in kW) of the customer’s solar generating facility. While this specific charge applies to solar customers, for other customers that have other types of NEM eligible generating technology (e.g. wind, biomass, etc.), SMUD will assess a resource-specific Grid Access Charge based on the customer’s generating facility using unbundled $/kWh non-bypassable cost components, as described in more detail in the section under SMUD Rule and Regulation 21 Interconnection Requirements (Rule 21).
For billing simplification, because nearly all NEM customers have solar generation facilities, SMUD staff developed a billing mechanism per kW that takes into account the load attributed to this technology based on unbundled $/kWh non-bypassable cost components by service voltage level. In the event a customer applies for NEM with a technology other than solar, SMUD will use the unbundled non-bypassable cost components specified in Rule 21 and apply this to the customer’s generating technology attributes (i.e. capacity factor), to calculate the appropriate Grid Access Charge. Applying the Grid Access Charge on a resource-specific basis establishes an appropriate price signal to customers for their use of the SMUD grid and ensures SMUD remains supportive of alternate technologies.
It’s important to note that the Grid Access Charge is proposed to apply to any customer interconnected resource under SMUD’s Rule and Regulation 21 Interconnection Requirements (Rule 21), whether or not the customer is eligible or elects NEM. If a customer has a generating facility, but is still interconnected to SMUD’s grid, the applicable Grid Access Charge will apply. For more information, see the section on Rule 21 in this Report. SMUD staff recommends the Board adopt these unbundled $/kWh non-bypassable components as the basis of the methodology used to calculate a per kW fixed charge – Grid Access Charge. The proposed charges for commercial customers shown in Table 5 reflect the end point of the commercial restructuring.
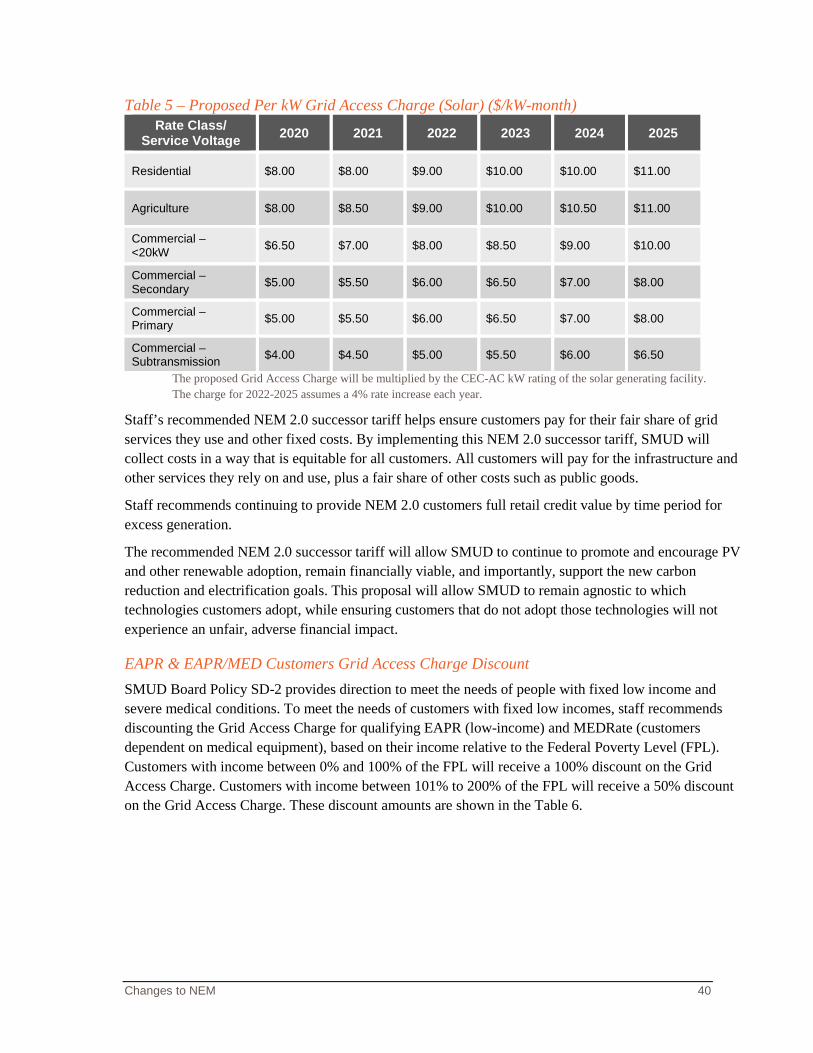
Changes to NEM 40
Table 5 – Proposed Per kW Grid Access Charge (Solar) ($/kW-month) Rate Class/
Service Voltage 2020 2021 2022 2023 2024 2025
Residential $8.00 $8.00 $9.00 $10.00 $10.00 $11.00
Agriculture $8.00 $8.50 $9.00 $10.00 $10.50 $11.00
Commercial – <20kW $6.50 $7.00 $8.00 $8.50 $9.00 $10.00
Commercial – Secondary $5.00 $5.50 $6.00 $6.50 $7.00 $8.00
Commercial – Primary $5.00 $5.50 $6.00 $6.50 $7.00 $8.00
Commercial – Subtransmission $4.00 $4.50 $5.00 $5.50 $6.00 $6.50
The proposed Grid Access Charge will be multiplied by the CEC-AC kW rating of the solar generating facility. The charge for 2022-2025 assumes a 4% rate increase each year.
Staff’s recommended NEM 2.0 successor tariff helps ensure customers pay for their fair share of grid services they use and other fixed costs. By implementing this NEM 2.0 successor tariff, SMUD will collect costs in a way that is equitable for all customers. All customers will pay for the infrastructure and other services they rely on and use, plus a fair share of other costs such as public goods.
Staff recommends continuing to provide NEM 2.0 customers full retail credit value by time period for excess generation.
The recommended NEM 2.0 successor tariff will allow SMUD to continue to promote and encourage PV and other renewable adoption, remain financially viable, and importantly, support the new carbon reduction and electrification goals. This proposal will allow SMUD to remain agnostic to which technologies customers adopt, while ensuring customers that do not adopt those technologies will not experience an unfair, adverse financial impact.
EAPR & EAPR/MED Customers Grid Access Charge Discount SMUD Board Policy SD-2 provides direction to meet the needs of people with fixed low income and severe medical conditions. To meet the needs of customers with fixed low incomes, staff recommends discounting the Grid Access Charge for qualifying EAPR (low-income) and MEDRate (customers dependent on medical equipment), based on their income relative to the Federal Poverty Level (FPL). Customers with income between 0% and 100% of the FPL will receive a 100% discount on the Grid Access Charge. Customers with income between 101% to 200% of the FPL will receive a 50% discount on the Grid Access Charge. These discount amounts are shown in the Table 6.
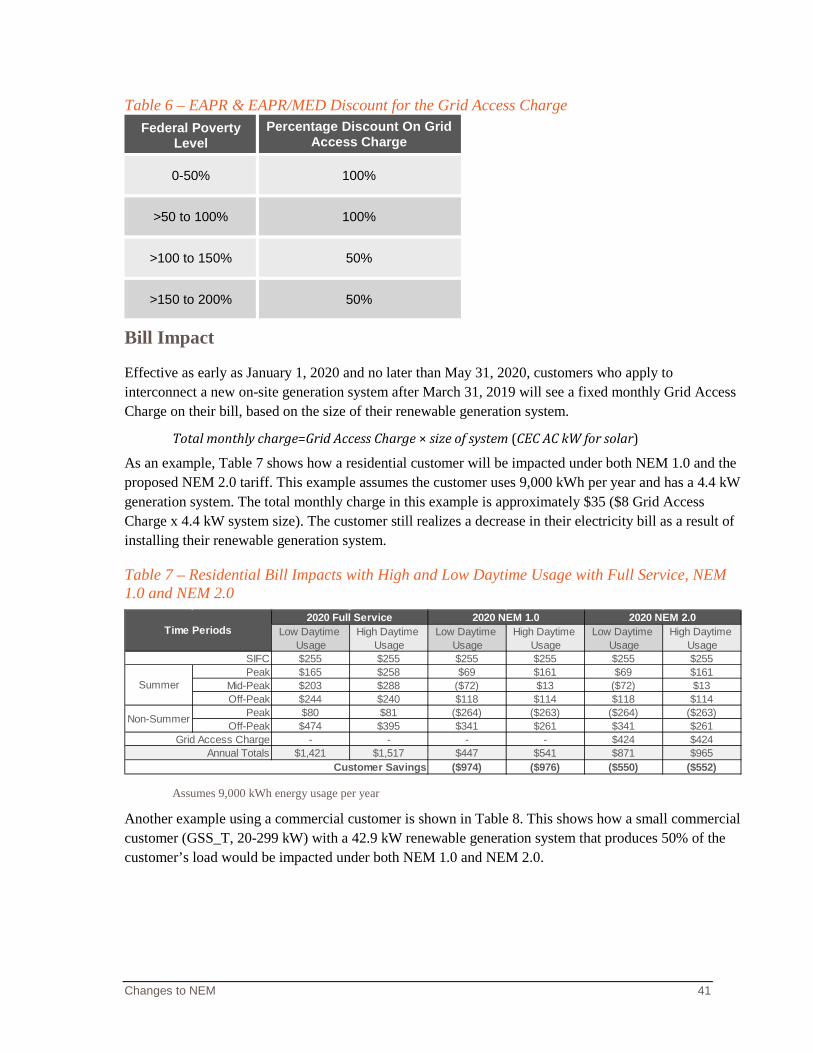
Changes to NEM 41
Table 6 – EAPR & EAPR/MED Discount for the Grid Access Charge Federal Poverty
Level Percentage Discount On Grid
Access Charge
0-50% 100%
>50 to 100% 100%
>100 to 150% 50%
>150 to 200% 50%
Bill Impact
Effective as early as January 1, 2020 and no later than May 31, 2020, customers who apply to interconnect a new on-site generation system after March 31, 2019 will see a fixed monthly Grid Access Charge on their bill, based on the size of their renewable generation system.
Total monthly charge=Grid Access Charge × size of system (CEC AC kW for solar)
As an example, Table 7 shows how a residential customer will be impacted under both NEM 1.0 and the proposed NEM 2.0 tariff. This example assumes the customer uses 9,000 kWh per year and has a 4.4 kW generation system. The total monthly charge in this example is approximately $35 ($8 Grid Access Charge x 4.4 kW system size). The customer still realizes a decrease in their electricity bill as a result of installing their renewable generation system.
Table 7 – Residential Bill Impacts with High and Low Daytime Usage with Full Service, NEM 1.0 and NEM 2.0
Assumes 9,000 kWh energy usage per year
Another example using a commercial customer is shown in Table 8. This shows how a small commercial customer (GSS_T, 20-299 kW) with a 42.9 kW renewable generation system that produces 50% of the customer’s load would be impacted under both NEM 1.0 and NEM 2.0.
Low Daytime Usage
High Daytime Usage
Low Daytime Usage
High Daytime Usage
Low Daytime Usage
High Daytime Usage
$255 $255 $255 $255 $255 $255 Peak $165 $258 $69 $161 $69 $161
Mid-Peak $203 $288 ($72) $13 ($72) $13 Off-Peak $244 $240 $118 $114 $118 $114
Peak $80 $81 ($264) ($263) ($264) ($263)Off-Peak $474 $395 $341 $261 $341 $261
- - - - $424 $424 $1,421 $1,517 $447 $541 $871 $965
($974) ($976) ($550) ($552)
Non-Summer
2020 NEM 1.0 2020 NEM 2.0
Annual TotalsCustomer Savings
2020 Full ServiceTime Periods
SIFC
Grid Access Charge
Summer
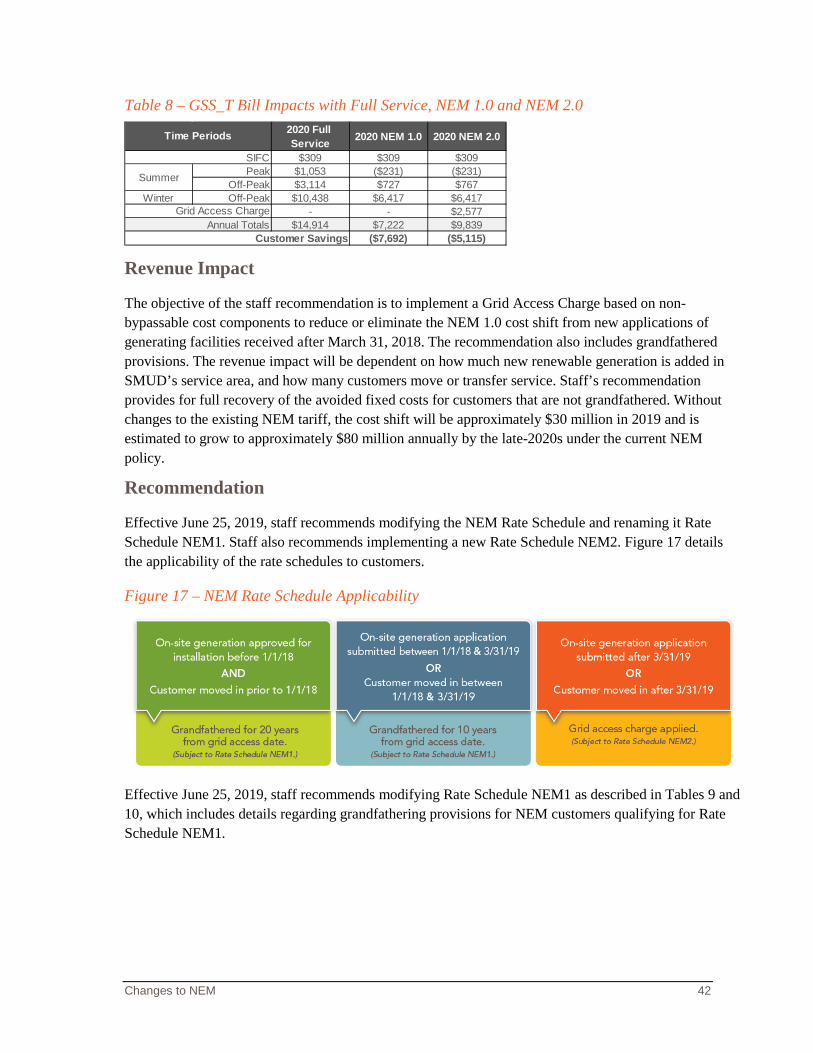
Changes to NEM 42
Table 8 – GSS_T Bill Impacts with Full Service, NEM 1.0 and NEM 2.0
Revenue Impact
The objective of the staff recommendation is to implement a Grid Access Charge based on non-bypassable cost components to reduce or eliminate the NEM 1.0 cost shift from new applications of generating facilities received after March 31, 2018. The recommendation also includes grandfathered provisions. The revenue impact will be dependent on how much new renewable generation is added in SMUD’s service area, and how many customers move or transfer service. Staff’s recommendation provides for full recovery of the avoided fixed costs for customers that are not grandfathered. Without changes to the existing NEM tariff, the cost shift will be approximately $30 million in 2019 and is estimated to grow to approximately $80 million annually by the late-2020s under the current NEM policy.
Recommendation
Effective June 25, 2019, staff recommends modifying the NEM Rate Schedule and renaming it Rate Schedule NEM1. Staff also recommends implementing a new Rate Schedule NEM2. Figure 17 details the applicability of the rate schedules to customers.
Figure 17 – NEM Rate Schedule Applicability
Effective June 25, 2019, staff recommends modifying Rate Schedule NEM1 as described in Tables 9 and 10, which includes details regarding grandfathering provisions for NEM customers qualifying for Rate Schedule NEM1.
2020 Full Service 2020 NEM 1.0 2020 NEM 2.0
$309 $309 $309 Peak $1,053 ($231) ($231)
Off-Peak $3,114 $727 $767 Winter Off-Peak $10,438 $6,417 $6,417
- - $2,577 $14,914 $7,222 $9,839
($7,692) ($5,115)Annual Totals
Customer Savings
Summer
SIFC
Grid Access Charge
Time Periods
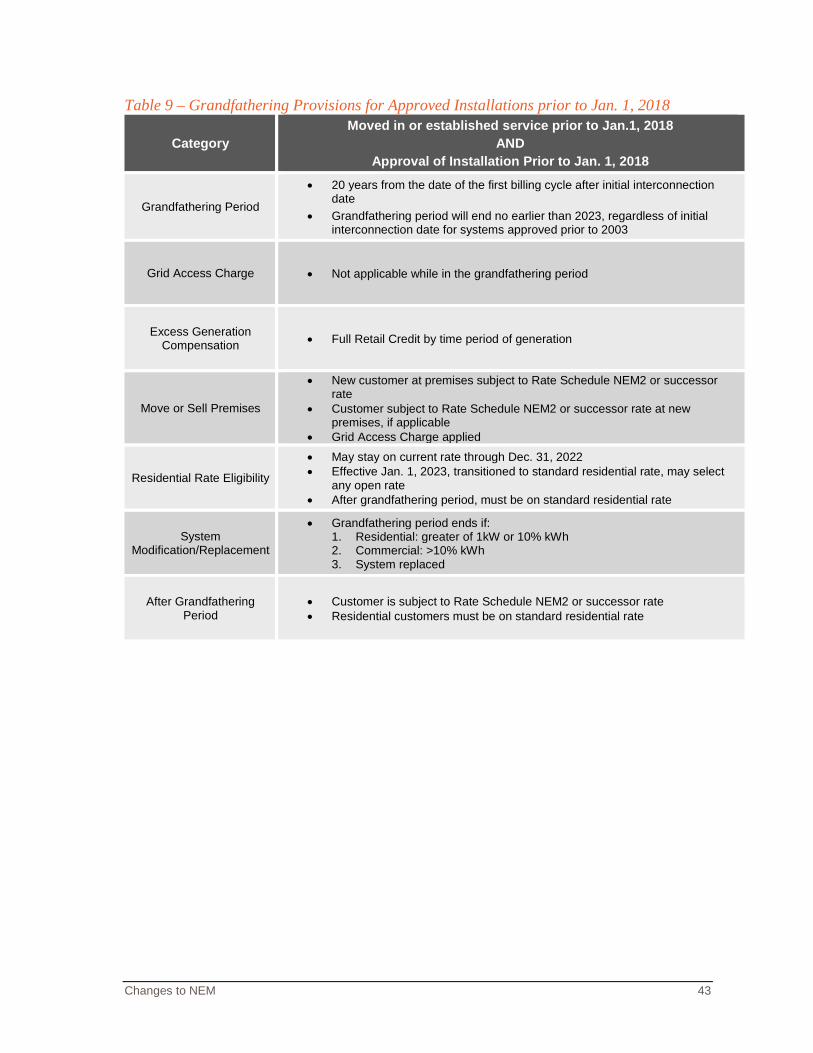
Changes to NEM 43
Table 9 – Grandfathering Provisions for Approved Installations prior to Jan. 1, 2018
Category Moved in or established service prior to Jan.1, 2018
AND Approval of Installation Prior to Jan. 1, 2018
Grandfathering Period • 20 years from the date of the first billing cycle after initial interconnection
date • Grandfathering period will end no earlier than 2023, regardless of initial
interconnection date for systems approved prior to 2003
Grid Access Charge • Not applicable while in the grandfathering period
Excess Generation Compensation • Full Retail Credit by time period of generation
Move or Sell Premises
• New customer at premises subject to Rate Schedule NEM2 or successor rate
• Customer subject to Rate Schedule NEM2 or successor rate at new premises, if applicable
• Grid Access Charge applied
Residential Rate Eligibility
• May stay on current rate through Dec. 31, 2022 • Effective Jan. 1, 2023, transitioned to standard residential rate, may select
any open rate • After grandfathering period, must be on standard residential rate
System Modification/Replacement
• Grandfathering period ends if: 1. Residential: greater of 1kW or 10% kWh 2. Commercial: >10% kWh 3. System replaced
After Grandfathering Period
• Customer is subject to Rate Schedule NEM2 or successor rate • Residential customers must be on standard residential rate
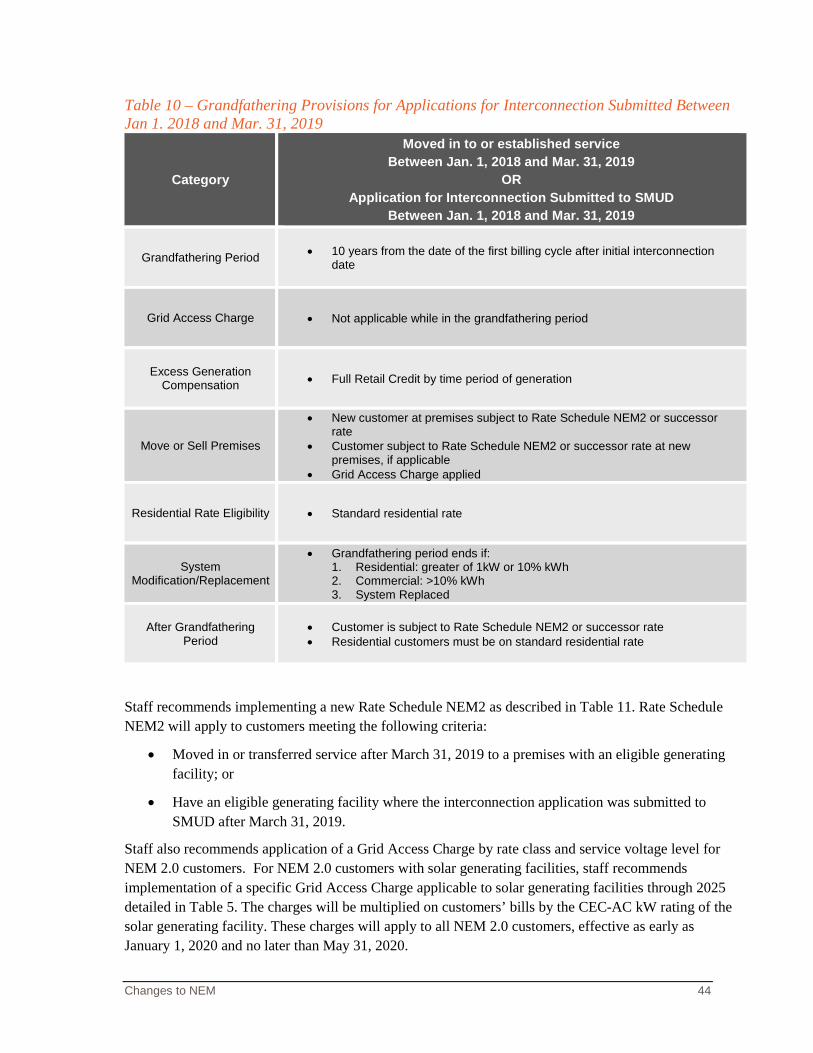
Changes to NEM 44
Table 10 – Grandfathering Provisions for Applications for Interconnection Submitted Between Jan 1. 2018 and Mar. 31, 2019
Category
Moved in to or established service Between Jan. 1, 2018 and Mar. 31, 2019
OR Application for Interconnection Submitted to SMUD
Between Jan. 1, 2018 and Mar. 31, 2019
Grandfathering Period • 10 years from the date of the first billing cycle after initial interconnection date
Grid Access Charge • Not applicable while in the grandfathering period
Excess Generation Compensation • Full Retail Credit by time period of generation
Move or Sell Premises
• New customer at premises subject to Rate Schedule NEM2 or successor rate
• Customer subject to Rate Schedule NEM2 or successor rate at new premises, if applicable
• Grid Access Charge applied
Residential Rate Eligibility • Standard residential rate
System Modification/Replacement
• Grandfathering period ends if: 1. Residential: greater of 1kW or 10% kWh 2. Commercial: >10% kWh 3. System Replaced
After Grandfathering Period
• Customer is subject to Rate Schedule NEM2 or successor rate • Residential customers must be on standard residential rate
Staff recommends implementing a new Rate Schedule NEM2 as described in Table 11. Rate Schedule NEM2 will apply to customers meeting the following criteria:
• Moved in or transferred service after March 31, 2019 to a premises with an eligible generating facility; or
• Have an eligible generating facility where the interconnection application was submitted to SMUD after March 31, 2019.
Staff also recommends application of a Grid Access Charge by rate class and service voltage level for NEM 2.0 customers. For NEM 2.0 customers with solar generating facilities, staff recommends implementation of a specific Grid Access Charge applicable to solar generating facilities through 2025 detailed in Table 5. The charges will be multiplied on customers’ bills by the CEC-AC kW rating of the solar generating facility. These charges will apply to all NEM 2.0 customers, effective as early as January 1, 2020 and no later than May 31, 2020.
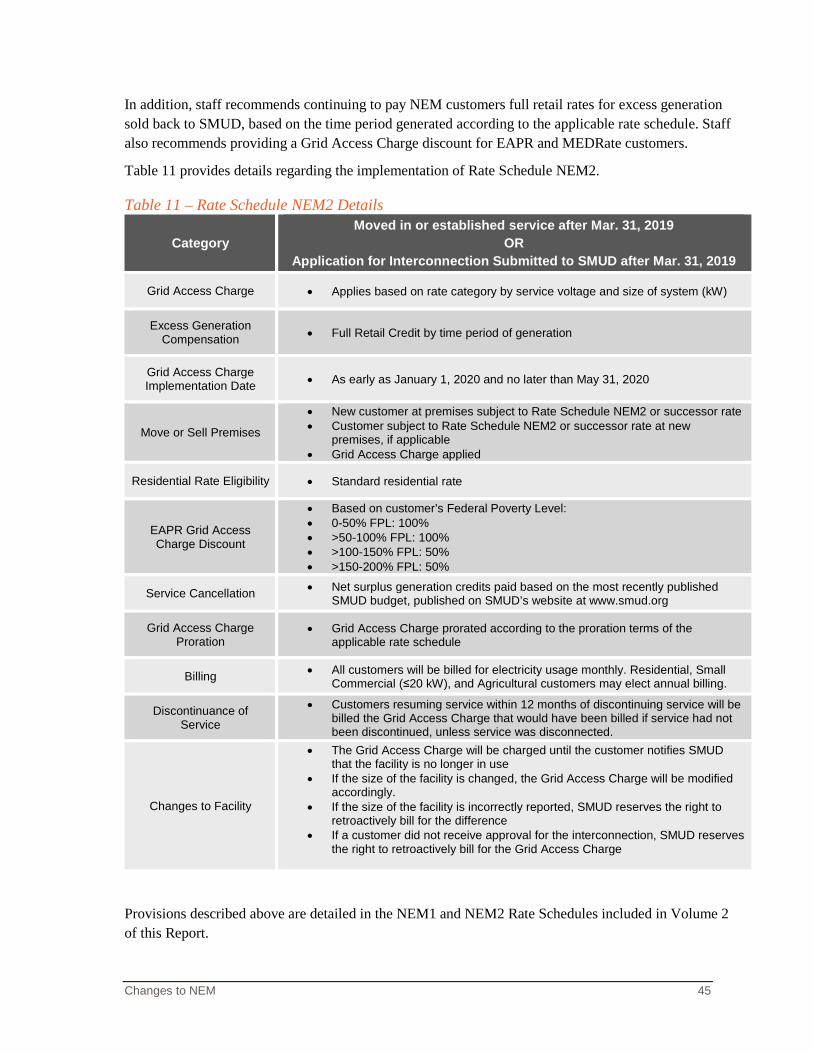
Changes to NEM 45
In addition, staff recommends continuing to pay NEM customers full retail rates for excess generation sold back to SMUD, based on the time period generated according to the applicable rate schedule. Staff also recommends providing a Grid Access Charge discount for EAPR and MEDRate customers.
Table 11 provides details regarding the implementation of Rate Schedule NEM2.
Table 11 – Rate Schedule NEM2 Details
Category Moved in or established service after Mar. 31, 2019
OR Application for Interconnection Submitted to SMUD after Mar. 31, 2019
Grid Access Charge • Applies based on rate category by service voltage and size of system (kW)
Excess Generation Compensation • Full Retail Credit by time period of generation
Grid Access Charge Implementation Date • As early as January 1, 2020 and no later than May 31, 2020
Move or Sell Premises
• New customer at premises subject to Rate Schedule NEM2 or successor rate • Customer subject to Rate Schedule NEM2 or successor rate at new
premises, if applicable • Grid Access Charge applied
Residential Rate Eligibility • Standard residential rate
EAPR Grid Access Charge Discount
• Based on customer’s Federal Poverty Level: • 0-50% FPL: 100% • >50-100% FPL: 100% • >100-150% FPL: 50% • >150-200% FPL: 50%
Service Cancellation • Net surplus generation credits paid based on the most recently published SMUD budget, published on SMUD’s website at www.smud.org
Grid Access Charge Proration
• Grid Access Charge prorated according to the proration terms of the applicable rate schedule
Billing • All customers will be billed for electricity usage monthly. Residential, Small Commercial (≤20 kW), and Agricultural customers may elect annual billing.
Discontinuance of Service
• Customers resuming service within 12 months of discontinuing service will be billed the Grid Access Charge that would have been billed if service had not been discontinued, unless service was disconnected.
Changes to Facility
• The Grid Access Charge will be charged until the customer notifies SMUD that the facility is no longer in use
• If the size of the facility is changed, the Grid Access Charge will be modified accordingly.
• If the size of the facility is incorrectly reported, SMUD reserves the right to retroactively bill for the difference
• If a customer did not receive approval for the interconnection, SMUD reserves the right to retroactively bill for the Grid Access Charge
Provisions described above are detailed in the NEM1 and NEM2 Rate Schedules included in Volume 2 of this Report.
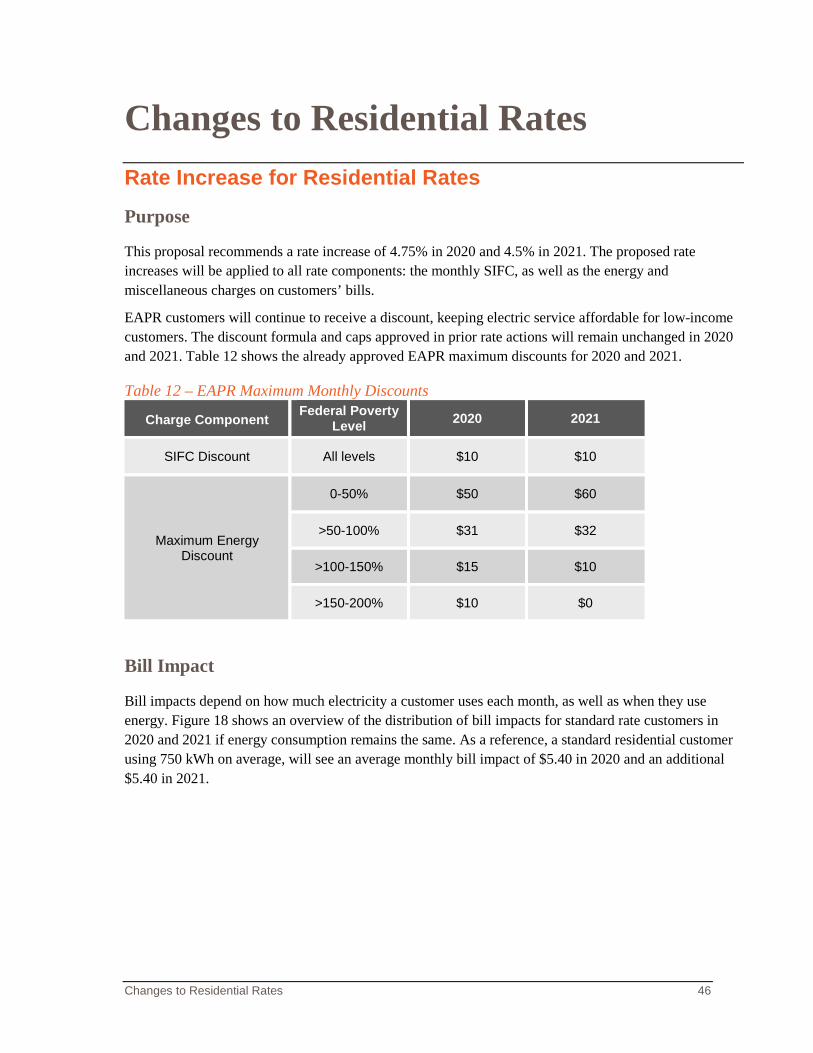
Changes to Residential Rates 46
Changes to Residential Rates Rate Increase for Residential Rates Purpose
This proposal recommends a rate increase of 4.75% in 2020 and 4.5% in 2021. The proposed rate increases will be applied to all rate components: the monthly SIFC, as well as the energy and miscellaneous charges on customers’ bills.
EAPR customers will continue to receive a discount, keeping electric service affordable for low-income customers. The discount formula and caps approved in prior rate actions will remain unchanged in 2020 and 2021. Table 12 shows the already approved EAPR maximum discounts for 2020 and 2021.
Table 12 – EAPR Maximum Monthly Discounts
Charge Component Federal Poverty Level 2020 2021
SIFC Discount All levels $10 $10
Maximum Energy Discount
0-50% $50 $60
>50-100% $31 $32
>100-150% $15 $10
>150-200% $10 $0
Bill Impact
Bill impacts depend on how much electricity a customer uses each month, as well as when they use energy. Figure 18 shows an overview of the distribution of bill impacts for standard rate customers in 2020 and 2021 if energy consumption remains the same. As a reference, a standard residential customer using 750 kWh on average, will see an average monthly bill impact of $5.40 in 2020 and an additional $5.40 in 2021.
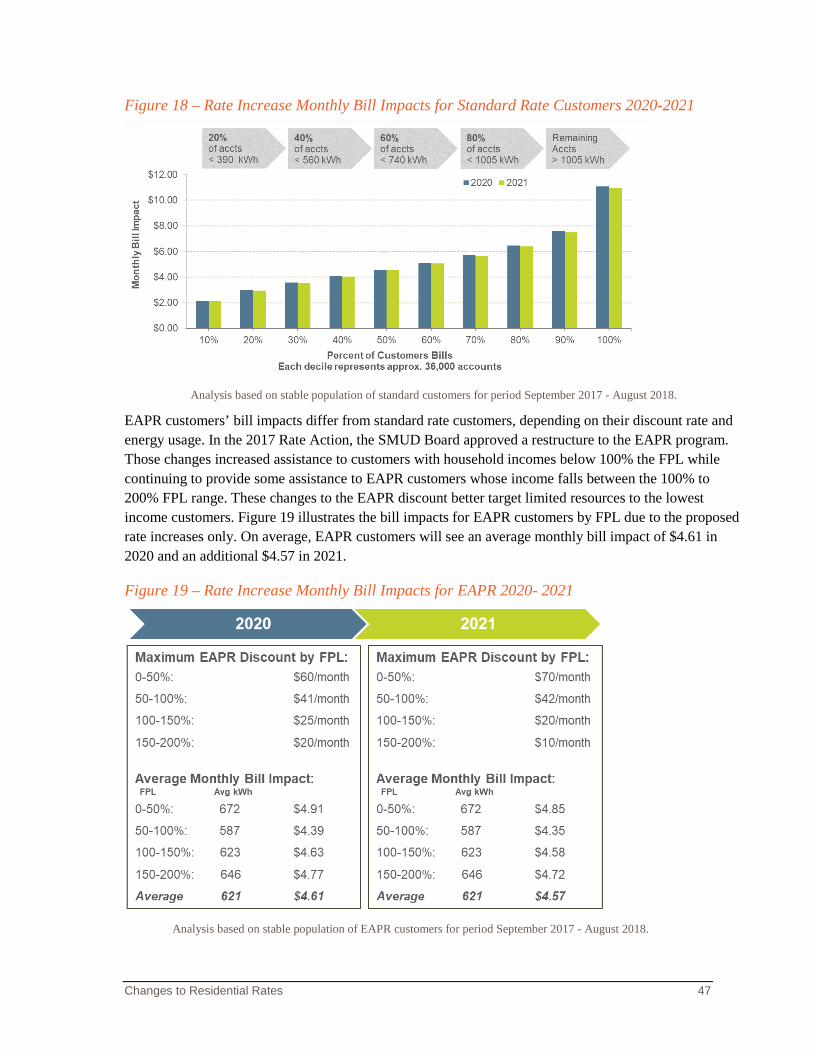
Changes to Residential Rates 47
Figure 18 – Rate Increase Monthly Bill Impacts for Standard Rate Customers 2020-2021
Analysis based on stable population of standard customers for period September 2017 - August 2018.
EAPR customers’ bill impacts differ from standard rate customers, depending on their discount rate and energy usage. In the 2017 Rate Action, the SMUD Board approved a restructure to the EAPR program. Those changes increased assistance to customers with household incomes below 100% the FPL while continuing to provide some assistance to EAPR customers whose income falls between the 100% to 200% FPL range. These changes to the EAPR discount better target limited resources to the lowest income customers. Figure 19 illustrates the bill impacts for EAPR customers by FPL due to the proposed rate increases only. On average, EAPR customers will see an average monthly bill impact of $4.61 in 2020 and an additional $4.57 in 2021.
Figure 19 – Rate Increase Monthly Bill Impacts for EAPR 2020- 2021
Analysis based on stable population of EAPR customers for period September 2017 - August 2018.
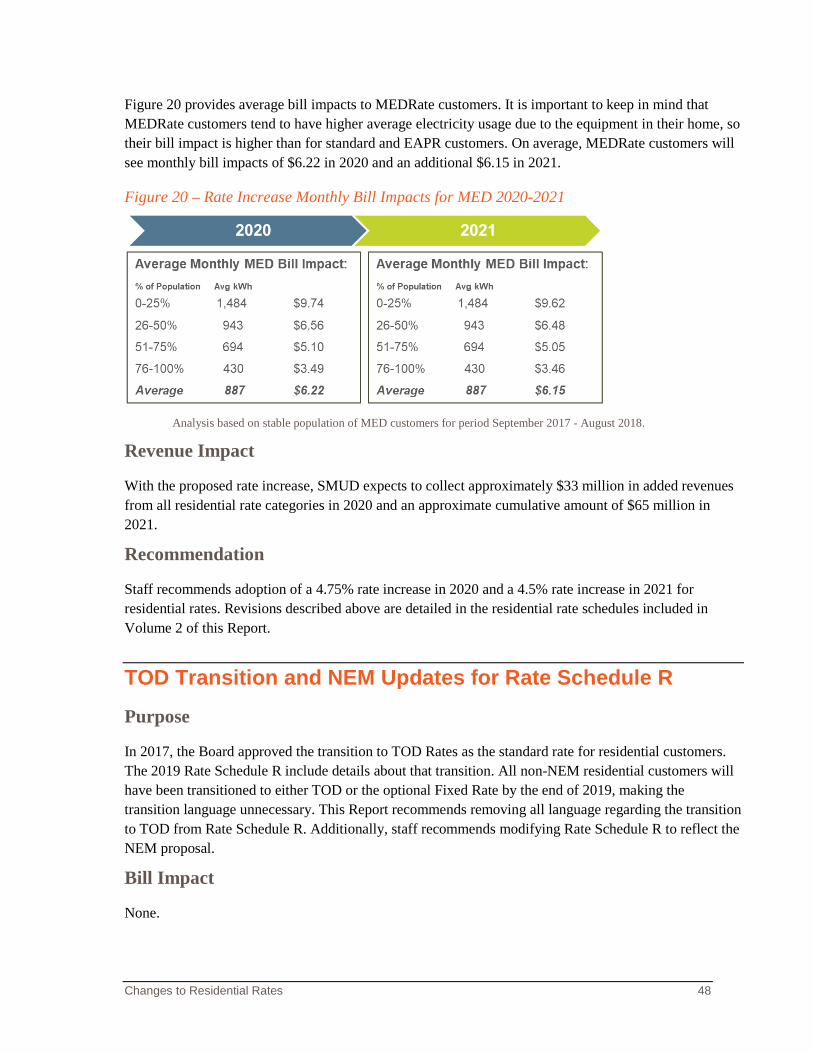
Changes to Residential Rates 48
Figure 20 provides average bill impacts to MEDRate customers. It is important to keep in mind that MEDRate customers tend to have higher average electricity usage due to the equipment in their home, so their bill impact is higher than for standard and EAPR customers. On average, MEDRate customers will see monthly bill impacts of $6.22 in 2020 and an additional $6.15 in 2021.
Figure 20 – Rate Increase Monthly Bill Impacts for MED 2020-2021
Analysis based on stable population of MED customers for period September 2017 - August 2018.
Revenue Impact
With the proposed rate increase, SMUD expects to collect approximately $33 million in added revenues from all residential rate categories in 2020 and an approximate cumulative amount of $65 million in 2021.
Recommendation
Staff recommends adoption of a 4.75% rate increase in 2020 and a 4.5% rate increase in 2021 for residential rates. Revisions described above are detailed in the residential rate schedules included in Volume 2 of this Report.
TOD Transition and NEM Updates for Rate Schedule R Purpose
In 2017, the Board approved the transition to TOD Rates as the standard rate for residential customers. The 2019 Rate Schedule R include details about that transition. All non-NEM residential customers will have been transitioned to either TOD or the optional Fixed Rate by the end of 2019, making the transition language unnecessary. This Report recommends removing all language regarding the transition to TOD from Rate Schedule R. Additionally, staff recommends modifying Rate Schedule R to reflect the NEM proposal.
Bill Impact
None.
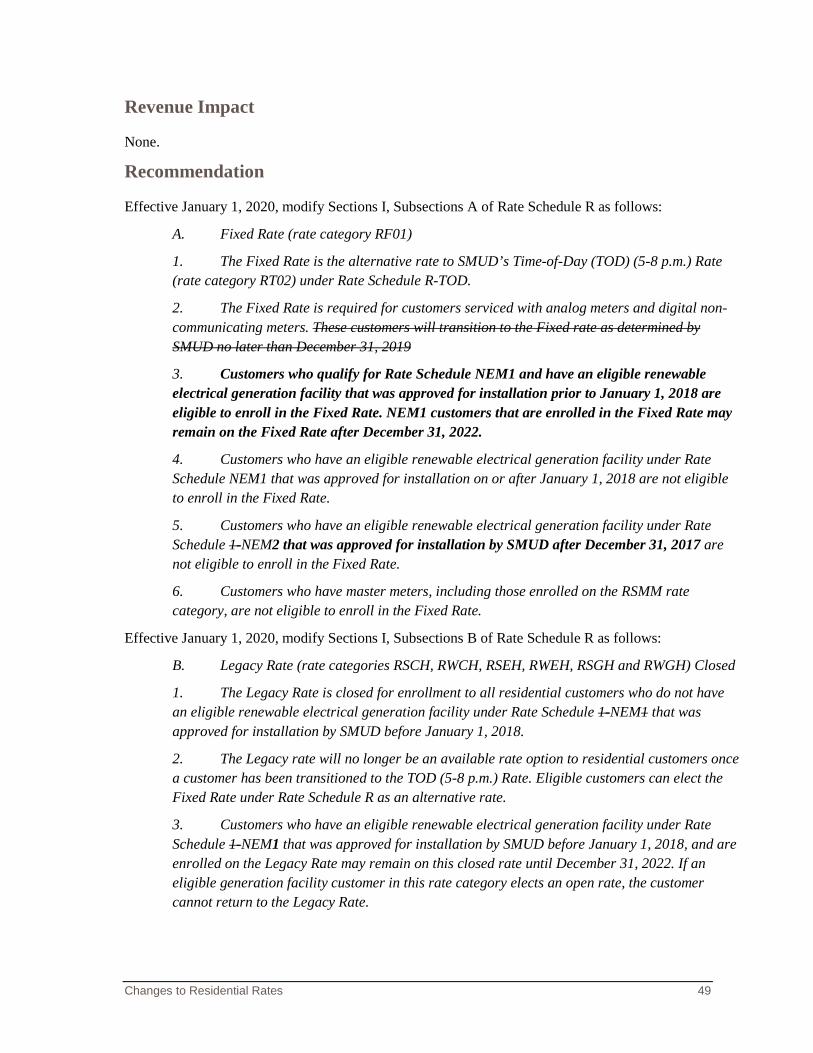
Changes to Residential Rates 49
Revenue Impact
None.
Recommendation
Effective January 1, 2020, modify Sections I, Subsections A of Rate Schedule R as follows:
A. Fixed Rate (rate category RF01)
1. The Fixed Rate is the alternative rate to SMUD’s Time-of-Day (TOD) (5-8 p.m.) Rate (rate category RT02) under Rate Schedule R-TOD.
2. The Fixed Rate is required for customers serviced with analog meters and digital non-communicating meters. These customers will transition to the Fixed rate as determined by SMUD no later than December 31, 2019
3. Customers who qualify for Rate Schedule NEM1 and have an eligible renewable electrical generation facility that was approved for installation prior to January 1, 2018 are eligible to enroll in the Fixed Rate. NEM1 customers that are enrolled in the Fixed Rate may remain on the Fixed Rate after December 31, 2022.
4. Customers who have an eligible renewable electrical generation facility under Rate Schedule NEM1 that was approved for installation on or after January 1, 2018 are not eligible to enroll in the Fixed Rate.
5. Customers who have an eligible renewable electrical generation facility under Rate Schedule 1-NEM2 that was approved for installation by SMUD after December 31, 2017 are not eligible to enroll in the Fixed Rate.
6. Customers who have master meters, including those enrolled on the RSMM rate category, are not eligible to enroll in the Fixed Rate.
Effective January 1, 2020, modify Sections I, Subsections B of Rate Schedule R as follows:
B. Legacy Rate (rate categories RSCH, RWCH, RSEH, RWEH, RSGH and RWGH) Closed
1. The Legacy Rate is closed for enrollment to all residential customers who do not have an eligible renewable electrical generation facility under Rate Schedule 1-NEM1 that was approved for installation by SMUD before January 1, 2018.
2. The Legacy rate will no longer be an available rate option to residential customers once a customer has been transitioned to the TOD (5-8 p.m.) Rate. Eligible customers can elect the Fixed Rate under Rate Schedule R as an alternative rate.
3. Customers who have an eligible renewable electrical generation facility under Rate Schedule 1-NEM1 that was approved for installation by SMUD before January 1, 2018, and are enrolled on the Legacy Rate may remain on this closed rate until December 31, 2022. If an eligible generation facility customer in this rate category elects an open rate, the customer cannot return to the Legacy Rate.
Changes to Residential Rates 50
4. The Legacy Rate will terminate for customers with an eligible renewable electrical generation facility under Rate Schedule NEM1 on their first billing cycle that closes in 2023, and customers will then transition to SMUD’s standard residential rate.
4. Customers in the Legacy Rate who do not have an eligible renewable electrical generation facility under Rate Schedule 1-NEM, will gradually transition as determined by SMUD to the TOD (5-8 p.m.) Rate (rate category RT02) under Rate Schedule R-TOD, if eligible, as early as September 1, 2018, and no later than December 31, 2019.
5. All other existing customers not eligible for Rate Schedule R-TOD will transition to the alternative Fixed Rate under this Rate Schedule R no later than December 31, 2019.
6. Customers with wells will begin transitioning to Rate Schedule R-TOD in January 2019.
Effective January 1, 2020, remove the following language from Section I, Subsections C of Rate Schedule R:
3. Master metered customers on the Legacy Rate (rate categories RSCH, RWCH, RSEH, RWEH, RSGH and RWGH) will be transitioned to the new rate category RSMM no later than December 31, 2019.
Effective January 1, 2020, remove all references to the Smart Pricing Pilot rate in Rate Schedule R.
Effective January 1, 2020, modify Section V in Rate Schedule R as follows:
KWh usage may be prorated for nonstandard billing periods, when billing period spans a price change, and/or when the billing period spans more than one season. Effective as early as June 1, 2019 and no later than December 31, 2019, tThe monthly SIFC will be prorated when the bill period is shorter than 27 days. The following table shows the basis for the proration in these circumstances. The monthly System Infrastructure Fixed Charge is determined by the billing period end date.
Revisions described above are detailed in Rate Schedules R and R-TOD included in Volume 2 of this Report.
TOD Transition and NEM Updates for Rate Schedule R-TOD Purpose
In 2017, the Board approved the transition to TOD Rates as the standard rate for residential customers. The 2019 Rate Schedule R-TOD include details about that transition. All non-NEM residential customers will have been transitioned to either TOD or the Fixed Rate by the end of 2019, making the transition language unnecessary. This Report recommends removing all language regarding the transition to TOD from Rate Schedule R-TOD. Additionally, staff recommends modifying Rate Schedule R-TOD to reflect the NEM proposal.
Bill Impact
None.
Changes to Residential Rates 51
Revenue Impact
None.
Recommendation
Effective January 1, 2020, modify Sections I, Subsections A of Rate Schedule R-TOD as follows:
A. Time-of-Day (5-8 p.m.) Rate (rate category RT02)
1. The TOD (5-8 p.m.) Rate is the standard rate for SMUD’s residential customers. Eligible customers can elect the Fixed Rate under Rate Schedule R as an alternative rate.
2. Customers who have an eligible renewable electrical generation facility under Rate Schedule 1-NEM NEM1 that was approved for installation by SMUD after December 31, 2017, must be on the TOD (5-8 p.m.) Rate.
3. Customers who have an eligible renewable electrical generation facility under Rate Schedule NEM2 must be on the TOD (5-8 p.m.) Rate.
2. Existing eligible customers on the Legacy Rate, with rate categories RSCH, RWCH, RSEH, RWEH, RSGH and RWGH under Rate Schedule R, will gradually transition as determined by SMUD to the TOD (5-8 p.m.) Rate beginning the first full billing cycle in January 2019, and complete transition no later than December 31, 2019.
3. After being transitioned to the TOD (5-8 p.m.) Rate, eligible customers can elect the Fixed Rate under Rate Schedule R as an alternative rate.
4. Customers who move-in or transfer service to premises with an eligible renewable electrical generation facility after December 31, 2017 must be on the TOD (5-8 p.m.) Rate.
Effective January 1, 2020, modify Sections I, Subsections B of Rate Schedule R-TOD as follows:
B. Optional Time-of-Day (4-7 p.m.) Rate (rate category RT01) Closed
1. The TOD (4-7 p.m.) Rate is closed for enrollment to residential customers who did not have an eligible renewable electrical generation facility under Rate Schedule 1-NEM that was approved for installation by SMUD before January 1, 2018.
2. Customers who have an eligible renewable electrical generation facility under Rate Schedule 1-NEM1 that was approved for installation by SMUD before January 1, 2018, and are enrolled on the TOD (4-7 p.m.) Rate may remain on this closed rate until December 31, 2022.
3. The TOD (4-7 p.m.) Rate will terminate for customers with an eligible renewable electrical generation facility under Rate Schedule 1-NEM1 on their first full billing cycle that closes in 2023, and customers will then transition to SMUD’s residential standard residential rate.
4. If a customer with an eligible renewable electrical generation facility under Rate Schedule 1-NEM on this rate category elects an open rate, the customer cannot return to the TOD (4-7 p.m.) Rate.
Changes to Residential Rates 52
5. Existing customers who have an eligible renewable electrical generation facility under Rate Schedule 1-NEM1 that was approved for installation by SMUD before January 1, 2018 may enroll in the TOD (5-8 p.m.) Rate or any open rate at any time; however, once enrolled in the TOD (5-8 p.m.) Rate or any open rate, the customer cannot return to the TOD (4-7 p.m.) Rate.
6. Existing customers on the TOD (4-7 p.m.) Rate who do not have an eligible renewable electrical generation facility under Rate Schedule 1-NEM will transition as determined by SMUD to the TOD (5-8 p.m.) Rate no later than December 31, 2019 and will no longer be eligible for the TOD (4-7 p.m.) Rate.
Effective January 1, 2020, modify Section VI in Rate Schedule R-TOD as follows:
KWh usage may be prorated for nonstandard billing periods, when billing period spans a price change, and/or when the billing period spans more than one season. Effective as early as June 1, 2019 and no later than December 31, 2019, tThe monthly SIFC will be prorated when the bill period is shorter than 27 days. The following table shows the basis for the proration in these circumstances. The monthly System Infrastructure Fixed Charge and Grid Access Charge is determined by the billing period end date.
Effective January 1, 2020, modify the following sentence to Section VI, Subsection A of Rate Schedule R-TOD as follows:
The monthly System Infrastructure Fixed Charge and Grid Access Charge are is determined by the billing period end date.
Revisions described above are detailed in Rate Schedule R-TOD included in Volume 2 of this Report.
Miscellaneous Residential Updates Purpose
With the introduction of Rate Schedule NEM2, Rate Schedule R needs to be updated to include references to the new NEM2 Rate Schedule and correctly identify which rates customers may enroll in.
Additionally, staff recommends adding back language regarding the SIFC that was inadvertently removed in the 2018 Rate Action.
Bill Impact
None.
Revenue Impact
None.
Recommendation
Effective June 25, 2019, replace all references to Rate Schedule NEM with Rate Schedule NEM1 in Rate Schedule R.
Changes to Residential Rates 53
Effective June 25, 2019 add the following language to Section I, Subsection A of Rate Schedule R:
4. Customers who have an eligible renewable electrical generation facility under Rate Schedule NEM2 are not eligible to enroll in the Fixed Rate.
Effective June 25, 2019, modify Section IV, Subsection E and F in Rate Schedule R by replacing “Rate Schedule NEM” with “Rate Schedules NEM1 and NEM2.”
Effective June 25, 2019, add the following sentence to Section V of Rate Schedule R:
The monthly System Infrastructure Fixed Charge is determined by the billing period end date.
Revisions described above are detailed in Rate Schedule R included in Volume 2 of this Report.
Miscellaneous Residential Time-of-Day Updates Purpose
With the introduction of Rate Schedule NEM2, Rate Schedule R-TOD needs to be updated to include references to the new NEM2 Rate Schedule and correctly identify which rates customers may enroll in.
Additionally, staff recommends adding back language regarding the SIFC that was inadvertently removed in the 2018 Rate Action.
Bill Impact
None.
Revenue Impact
None.
Recommendation
Effective June 25, 2019, replace all references to Rate Schedule NEM with Rate Schedule NEM1 in Rate Schedule R-TOD.
Effective June 25, 2019 add the following language to Section I, Subsection A of Rate Schedule R-TOD:
2. Customers who have an eligible renewable electrical generation facility under Rate Schedule NEM2 must be on the TOD (5-8 p.m.) Rate.
Effective June 25, 2019, modify Section IV, Subsection D and E in Rate Schedule R-TOD by replacing “Rate Schedule NEM” with “Rate Schedules NEM1 and NEM2.”
Effective June 25, 2019, add the following sentence to Section VI, Subsection A of Rate Schedule R-TOD:
The monthly System Infrastructure Fixed Charge is determined by the billing period end date.
Revisions described above are detailed in Rate Schedule R-TOD included in Volume 2 of this Report.
Changes to Residential Rates 54
Residential Power Theft Purpose
The implementation of new revenue protection applications has given SMUD the ability to leverage its Meter Data Management System to analyze data and identify usage anomalies that can be correlated with residential and commercial theft of electric service. The ability to use technology to detect and identify energy theft has created an opportunity to collect lost revenue, but the process is currently very time consuming. To simplify the process and reduce administrative expenses, staff is recommending using the Fixed Rate (RF01) to bill for the collection of revenue associated with all residential theft of electric service, regardless of the date or time of theft.
Bill Impact
None.
Revenue Impact
Using the Fixed Rate for power theft calculations is not expected to make a significant impact to revenue.
Recommendation
Effective June 25, 2019, add the following language to Section I, Subsection A of the 2019 Rate Schedule R:
7. The Fixed Rate will be used for the collection of revenue associated with unauthorized use of residential electric service regardless of the date(s) or time(s) in which the use occurred.
Revisions described above are detailed in Rate Schedule R included in Volume 2 of this Report.
Changes to Commercial Rates 55
Changes to Commercial Rates Rate Increase for Agriculture and Commercial Rates Purpose
The proposed 4.75% rate increase in 2020 and 4.50% in 2021 will be applied equally to all rate components of SMUD’s commercial and agricultural rates. These rate components include the following:
• Energy charges;
• System Infrastructure Fixed Charge;
• Summer Super Peak Demand Charge (effective in 2020);
• Summer Peak Demand Charge (effective in 2021);
• Site Infrastructure Charge;
• Generator Standby Charge; and
• Power Factor and Other Miscellaneous Charges.
Bill Impact
On average, SMUD’s commercial and agricultural customers will see an increase on their annual bill of 4.75% in 2020 and 4.50% in 2021.
Revenue Impact
With the proposed rate increase, SMUD expects to collect an added revenue of approximately $0.45 million in 2020 and a cumulative amount of $0.90 million in 2021 from all agricultural classes. The estimated added revenue from all commercial classes is approximately $31 million in 2020 and an approximate cumulative amount of $62 million in 2021.
Recommendation
Staff recommends adoption of the 4.75% rate increase in 2020 and the 4.50% rate increase in 2021 for all agriculture and commercial rates. Revisions described above are detailed in the AG, GS, GS-TOU1, GS-TOU2, GS-TOU3, and GS-TDP rate schedules included in Volume 2 of this Report.
Restructure of Commercial Rates The California electric utility industry is facing unprecedented change as technology, increased adoption of DERs, aggressive environmental mandates and more volatile commodity/energy markets transform utility operations and customers’ energy preferences and usage. Utilities across the country face similar challenges – declining consumption, rate structures that reflect cost-based misalignment, little incentive
Changes to Commercial Rates 56
for electrification, customer interest in “green rates,” growth of energy efficiency, proliferation of solar, aging infrastructure and the need to maintain adequate bond ratings.
With the Board’s guidance, SMUD has made significant progress to help ensure SMUD’s financial viability and continued leadership position among national public power utilities, while maintaining strong customer satisfaction ratings. Recent rate restructure decisions have focused on the residential customer class, and include the overhaul of the SIFC, restructure of EAPR, and the implementation of TOD Rates as the standard for all residential customers. The board also adopted a very simple time-of-use rate for the smallest commercial class to move away from tiered rates. In 2018, the Board adopted a new IRP with aggressive electrification goals to achieve significant carbon reduction.
While residential rates were most recently overhauled through the 2017 Rate Process, SMUD’s current medium and large commercial rates have not been updated since the early 2000s. Over time, the commercial pricing structures have become out of step with business imperatives due to significant industry change, including advances in technology, public policy mandates and changes in how customers use energy. Pricing must quickly become a dynamic, strategic function to help ensure utilities’ long-term viability and ability to deliver on their vision and purpose. This Report includes recommendations to address three major issues– misalignment of time periods with the cost to provide energy, inaccurate collection of fixed costs, and inconsistent rates across classes.
The current rates are broken down by customer size and service voltage at which the customer takes electric service. As discussed earlier, the more SMUD transforms the voltage of electricity for customer use, the more it costs to serve that customer. There are three different types of service voltage available to commercial customers – Secondary, Primary, and Subtransmission. SMUD’s Rule and Regulation 2 provides details of the standard voltages that SMUD provides. Table 13 describes the sizes and different voltage levels for each rate category, along with examples of the types of businesses typically seen in each rate category.
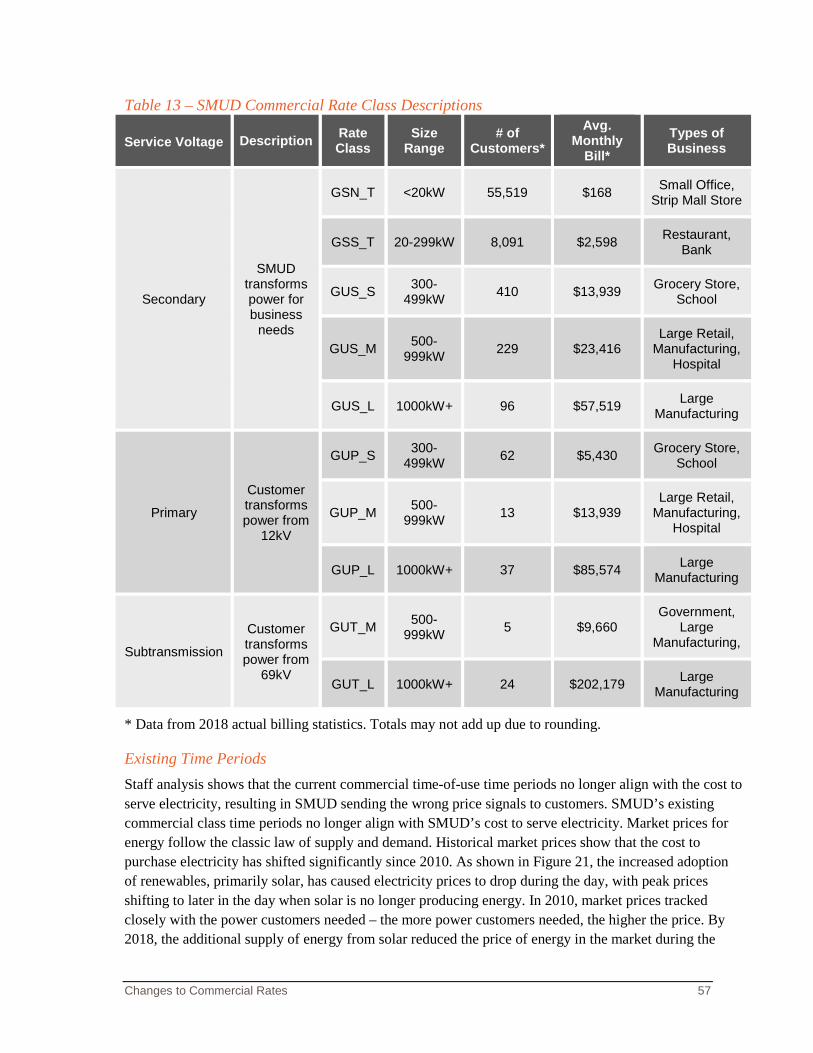
Changes to Commercial Rates 57
Table 13 – SMUD Commercial Rate Class Descriptions
Service Voltage Description Rate Class
Size Range
# of Customers*
Avg. Monthly
Bill* Types of Business
Secondary
SMUD transforms power for business
needs
GSN_T <20kW 55,519 $168 Small Office, Strip Mall Store
GSS_T 20-299kW 8,091 $2,598 Restaurant, Bank
GUS_S 300-499kW 410 $13,939 Grocery Store,
School
GUS_M 500-999kW 229 $23,416
Large Retail, Manufacturing,
Hospital
GUS_L 1000kW+ 96 $57,519 Large Manufacturing
Primary
Customer transforms power from
12kV
GUP_S 300-499kW 62 $5,430 Grocery Store,
School
GUP_M 500-999kW 13 $13,939
Large Retail, Manufacturing,
Hospital
GUP_L 1000kW+ 37 $85,574 Large Manufacturing
Subtransmission
Customer transforms power from
69kV
GUT_M 500-999kW 5 $9,660
Government, Large
Manufacturing,
GUT_L 1000kW+ 24 $202,179 Large Manufacturing
* Data from 2018 actual billing statistics. Totals may not add up due to rounding.
Existing Time Periods Staff analysis shows that the current commercial time-of-use time periods no longer align with the cost to serve electricity, resulting in SMUD sending the wrong price signals to customers. SMUD’s existing commercial class time periods no longer align with SMUD’s cost to serve electricity. Market prices for energy follow the classic law of supply and demand. Historical market prices show that the cost to purchase electricity has shifted significantly since 2010. As shown in Figure 21, the increased adoption of renewables, primarily solar, has caused electricity prices to drop during the day, with peak prices shifting to later in the day when solar is no longer producing energy. In 2010, market prices tracked closely with the power customers needed – the more power customers needed, the higher the price. By 2018, the additional supply of energy from solar reduced the price of energy in the market during the
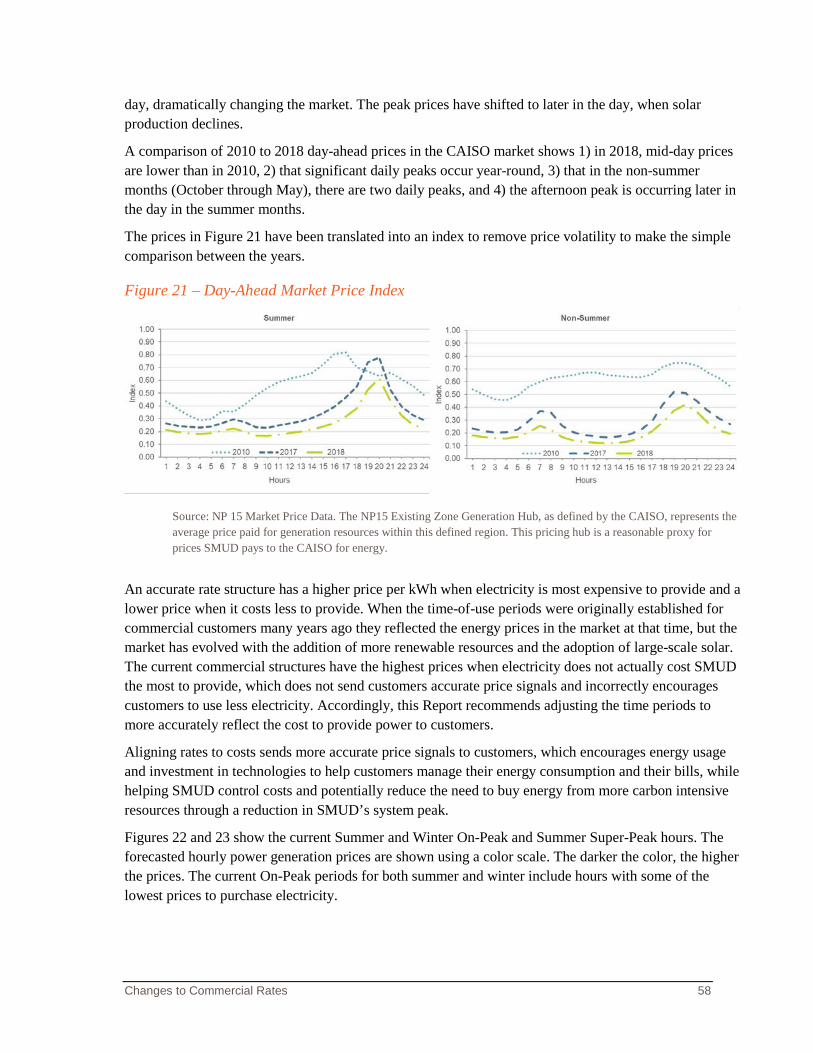
Changes to Commercial Rates 58
day, dramatically changing the market. The peak prices have shifted to later in the day, when solar production declines.
A comparison of 2010 to 2018 day-ahead prices in the CAISO market shows 1) in 2018, mid-day prices are lower than in 2010, 2) that significant daily peaks occur year-round, 3) that in the non-summer months (October through May), there are two daily peaks, and 4) the afternoon peak is occurring later in the day in the summer months.
The prices in Figure 21 have been translated into an index to remove price volatility to make the simple comparison between the years.
Figure 21 – Day-Ahead Market Price Index
Source: NP 15 Market Price Data. The NP15 Existing Zone Generation Hub, as defined by the CAISO, represents the average price paid for generation resources within this defined region. This pricing hub is a reasonable proxy for prices SMUD pays to the CAISO for energy.
An accurate rate structure has a higher price per kWh when electricity is most expensive to provide and a lower price when it costs less to provide. When the time-of-use periods were originally established for commercial customers many years ago they reflected the energy prices in the market at that time, but the market has evolved with the addition of more renewable resources and the adoption of large-scale solar. The current commercial structures have the highest prices when electricity does not actually cost SMUD the most to provide, which does not send customers accurate price signals and incorrectly encourages customers to use less electricity. Accordingly, this Report recommends adjusting the time periods to more accurately reflect the cost to provide power to customers.
Aligning rates to costs sends more accurate price signals to customers, which encourages energy usage and investment in technologies to help customers manage their energy consumption and their bills, while helping SMUD control costs and potentially reduce the need to buy energy from more carbon intensive resources through a reduction in SMUD’s system peak.
Figures 22 and 23 show the current Summer and Winter On-Peak and Summer Super-Peak hours. The forecasted hourly power generation prices are shown using a color scale. The darker the color, the higher the prices. The current On-Peak periods for both summer and winter include hours with some of the lowest prices to purchase electricity.
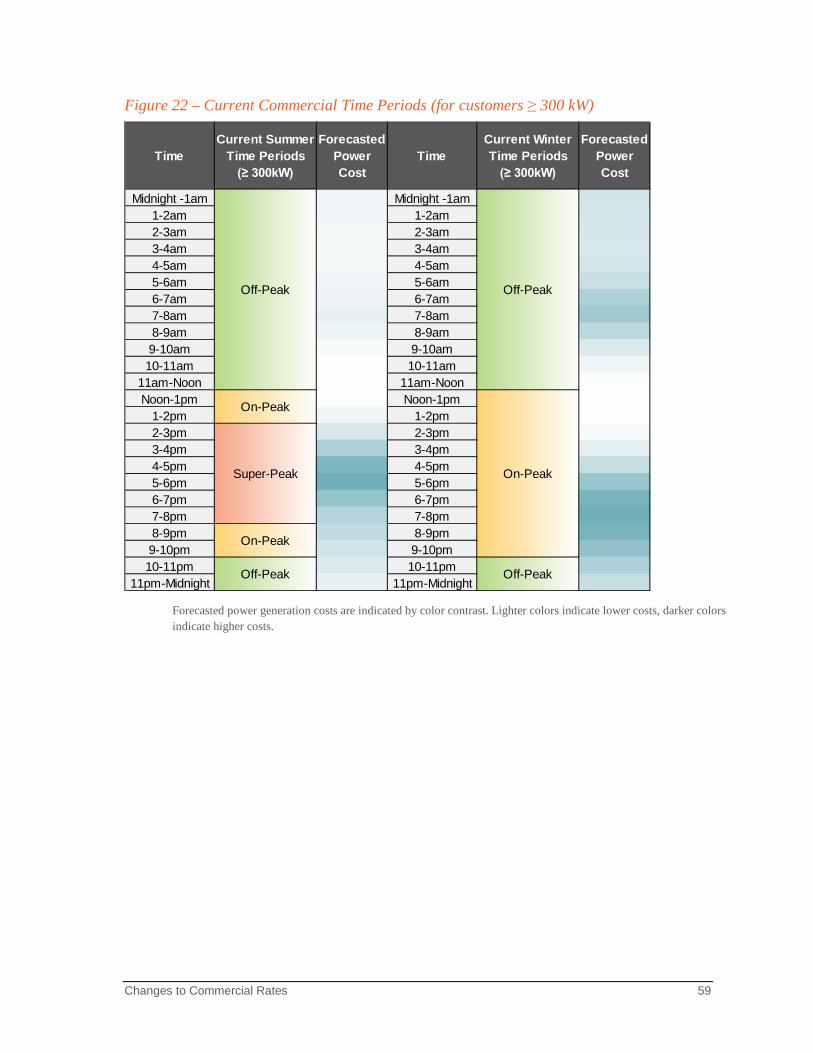
Changes to Commercial Rates 59
Figure 22 – Current Commercial Time Periods (for customers ≥ 300 kW)
Forecasted power generation costs are indicated by color contrast. Lighter colors indicate lower costs, darker colors indicate higher costs.
TimeCurrent Summer
Time Periods (≥ 300kW)
Forecasted Power Cost
TimeCurrent Winter Time Periods
(≥ 300kW)
Forecasted Power Cost
Midnight -1am Midnight -1am 1-2am 1-2am 2-3am 2-3am 3-4am 3-4am 4-5am 4-5am 5-6am 5-6am 6-7am 6-7am 7-8am 7-8am 8-9am 8-9am 9-10am 9-10am 10-11am 10-11am
11am-Noon 11am-Noon Noon-1pm Noon-1pm
1-2pm 1-2pm 2-3pm 2-3pm 3-4pm 3-4pm 4-5pm 4-5pm 5-6pm 5-6pm 6-7pm 6-7pm 7-8pm 7-8pm 8-9pm 8-9pm 9-10pm 9-10pm 10-11pm 10-11pm
11pm-Midnight 11pm-Midnight
Off-Peak
On-Peak
Super-Peak
On-Peak
Off-Peak
Off-Peak
On-Peak
Off-Peak
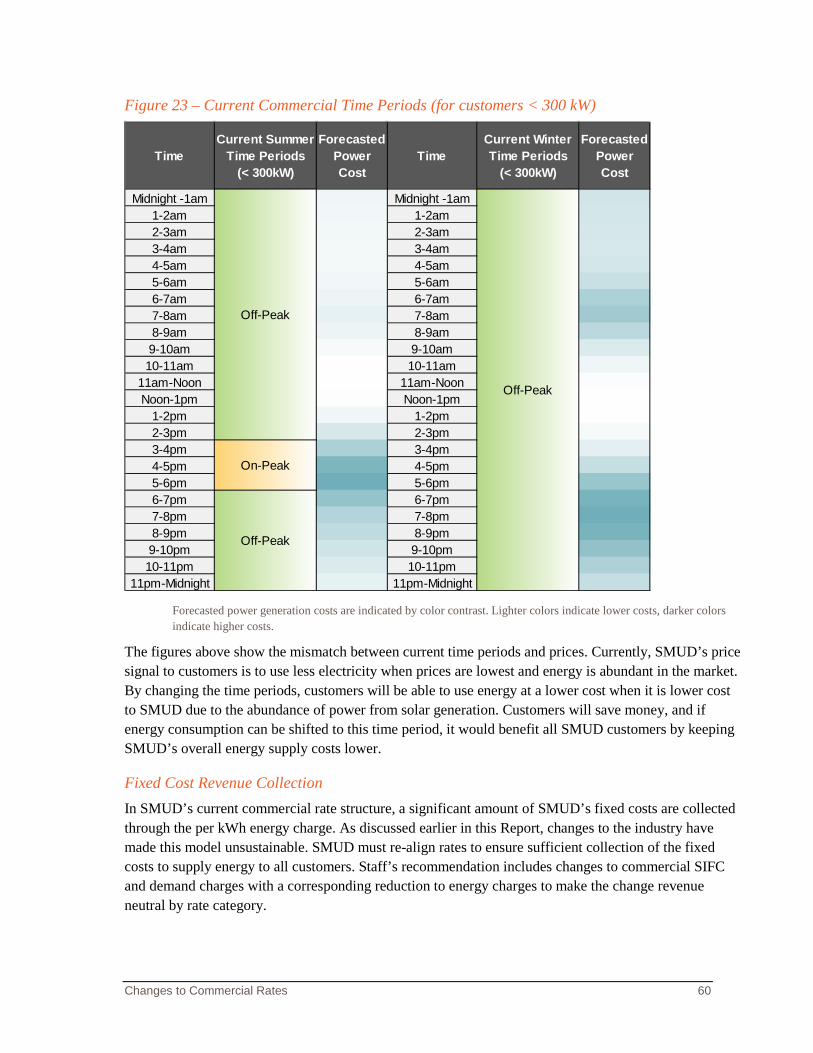
Changes to Commercial Rates 60
Figure 23 – Current Commercial Time Periods (for customers < 300 kW)
Forecasted power generation costs are indicated by color contrast. Lighter colors indicate lower costs, darker colors indicate higher costs.
The figures above show the mismatch between current time periods and prices. Currently, SMUD’s price signal to customers is to use less electricity when prices are lowest and energy is abundant in the market. By changing the time periods, customers will be able to use energy at a lower cost when it is lower cost to SMUD due to the abundance of power from solar generation. Customers will save money, and if energy consumption can be shifted to this time period, it would benefit all SMUD customers by keeping SMUD’s overall energy supply costs lower.
Fixed Cost Revenue Collection In SMUD’s current commercial rate structure, a significant amount of SMUD’s fixed costs are collected through the per kWh energy charge. As discussed earlier in this Report, changes to the industry have made this model unsustainable. SMUD must re-align rates to ensure sufficient collection of the fixed costs to supply energy to all customers. Staff’s recommendation includes changes to commercial SIFC and demand charges with a corresponding reduction to energy charges to make the change revenue neutral by rate category.
TimeCurrent Summer
Time Periods(< 300kW)
Forecasted Power Cost
TimeCurrent Winter Time Periods
(< 300kW)
Forecasted Power Cost
Midnight -1am Midnight -1am 1-2am 1-2am 2-3am 2-3am 3-4am 3-4am 4-5am 4-5am 5-6am 5-6am 6-7am 6-7am 7-8am 7-8am 8-9am 8-9am 9-10am 9-10am 10-11am 10-11am
11am-Noon 11am-Noon Noon-1pm Noon-1pm
1-2pm 1-2pm 2-3pm 2-3pm 3-4pm 3-4pm 4-5pm 4-5pm 5-6pm 5-6pm 6-7pm 6-7pm 7-8pm 7-8pm 8-9pm 8-9pm 9-10pm 9-10pm 10-11pm 10-11pm
11pm-Midnight 11pm-Midnight
Off-Peak
Off-Peak
Off-Peak
On-Peak
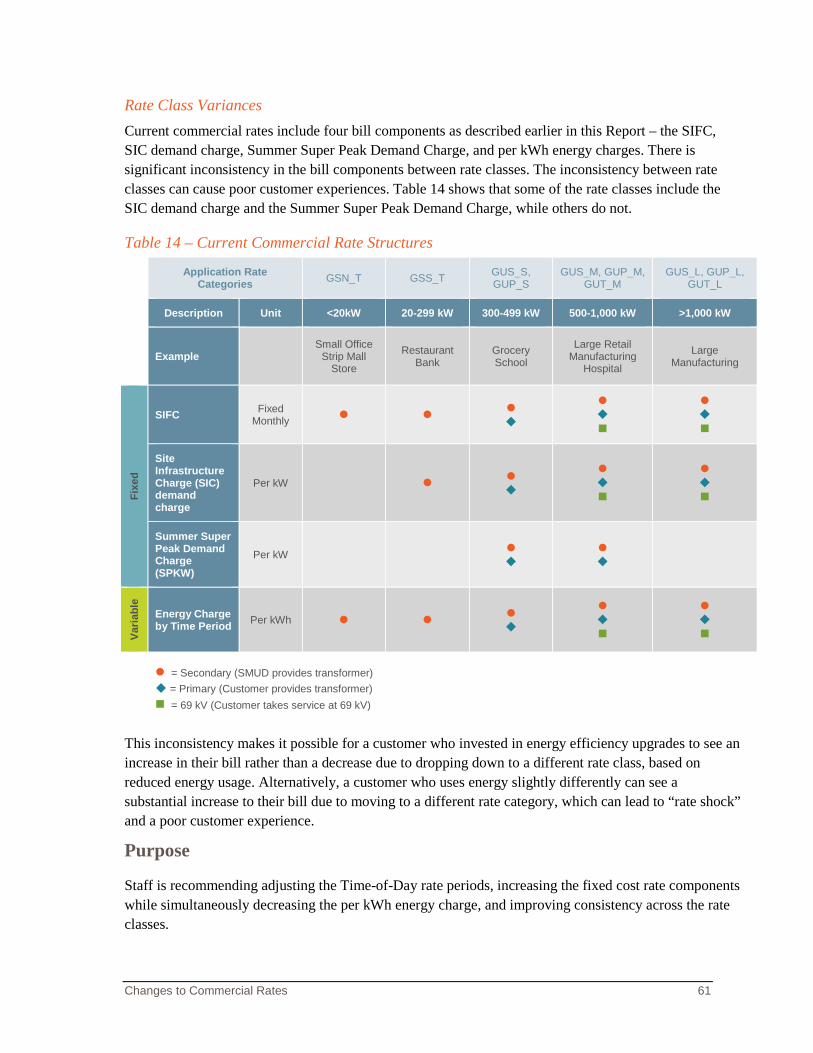
Changes to Commercial Rates 61
Rate Class Variances Current commercial rates include four bill components as described earlier in this Report – the SIFC, SIC demand charge, Summer Super Peak Demand Charge, and per kWh energy charges. There is significant inconsistency in the bill components between rate classes. The inconsistency between rate classes can cause poor customer experiences. Table 14 shows that some of the rate classes include the SIC demand charge and the Summer Super Peak Demand Charge, while others do not.
Table 14 – Current Commercial Rate Structures
This inconsistency makes it possible for a customer who invested in energy efficiency upgrades to see an increase in their bill rather than a decrease due to dropping down to a different rate class, based on reduced energy usage. Alternatively, a customer who uses energy slightly differently can see a substantial increase to their bill due to moving to a different rate category, which can lead to “rate shock” and a poor customer experience.
Purpose
Staff is recommending adjusting the Time-of-Day rate periods, increasing the fixed cost rate components while simultaneously decreasing the per kWh energy charge, and improving consistency across the rate classes.
Application Rate Categories GSN_T GSS_T GUS_S,
GUP_S GUS_M, GUP_M,
GUT_M GUS_L, GUP_L,
GUT_L
Description Unit <20kW 20-299 kW 300-499 kW 500-1,000 kW >1,000 kW
Example Small Office
Strip Mall Store
Restaurant Bank
Grocery School
Large Retail Manufacturing
Hospital
Large Manufacturing
Fixe
d
SIFC Fixed Monthly
Site Infrastructure Charge (SIC) demand charge
Per kW
Summer Super Peak Demand Charge (SPKW)
Per kW
Varia
ble
Energy Charge by Time Period Per kWh
= Secondary (SMUD provides transformer) = Primary (Customer provides transformer) = 69 kV (Customer takes service at 69 kV)

Changes to Commercial Rates 62
Proposed Time Periods Staff is recommending adjusting the time periods for all commercial rate classes to better reflect the cost of energy supply, as follows:
- Create two time periods in the summer months, June through September – Peak and Off-Peak.
- Create three time periods for the non-summer months, October through May – Peak, Off-Peak, and Off-Peak Saver.
- The Peak time period will be 4 p.m. to 9 p.m. year-round to simplify the rate structure and make it easy for customers to understand.
- The non-summer Off-Peak Saver time period reflects the impact of significant solar on the market, offering lower prices during the day.
As the recommended Summer Super-Peak time period will be replaced with the Summer Peak time period, staff recommends updating the name of the Summer Super-Peak Demand Charge to the Summer Peak Demand Charge.
Re-aligning the time periods will generally have a positive effect on customers, as most day time hours (which are peak hours of operations for many businesses) will become Off-Peak or Off-Peak Saver for energy pricing. Figures 24 and 25 detail the recommended time periods for all rate classes as well as how much energy each customer class uses on average per day. Note that the forecasted power cost index is a graphic illustration of forecasted electricity power generation market prices. The average annual loads are shown using a color scale. The darker the color, the higher the load (MWh).
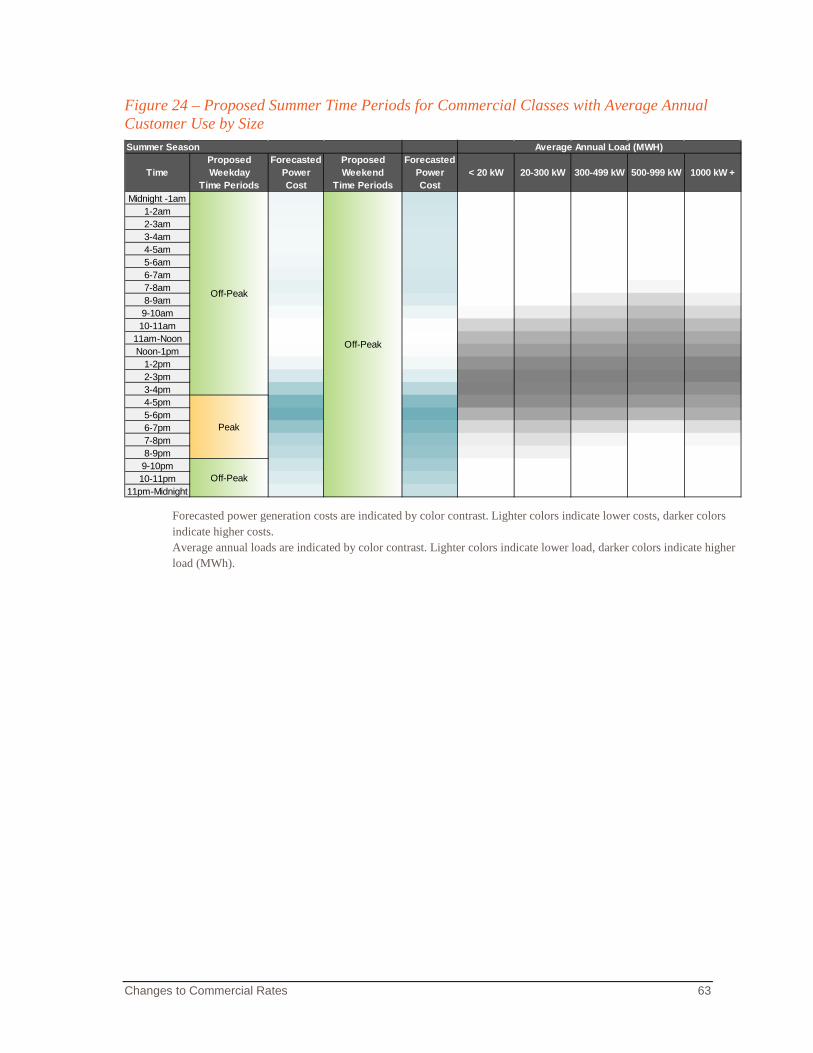
Changes to Commercial Rates 63
Figure 24 – Proposed Summer Time Periods for Commercial Classes with Average Annual Customer Use by Size
Forecasted power generation costs are indicated by color contrast. Lighter colors indicate lower costs, darker colors indicate higher costs. Average annual loads are indicated by color contrast. Lighter colors indicate lower load, darker colors indicate higher load (MWh).
TimeProposed Weekday
Time Periods
Forecasted Power Cost
Proposed Weekend
Time Periods
Forecasted Power Cost
< 20 kW 20-300 kW 300-499 kW 500-999 kW 1000 kW +
Midnight -1am 1-2am 2-3am 3-4am 4-5am 5-6am 6-7am 7-8am 8-9am 9-10am 10-11am
11am-Noon Noon-1pm
1-2pm 2-3pm 3-4pm 4-5pm 5-6pm 6-7pm 7-8pm 8-9pm 9-10pm 10-11pm
11pm-Midnight
Average Annual Load (MWH)
Off-Peak
Summer Season
Off-Peak
Peak
Off-Peak

Changes to Commercial Rates 64
Figure 25 – Proposed Non-Summer Time Periods for Commercial Classes with Average Annual Customer Use by Size
Forecasted power generation costs are indicated by color contrast. Lighter colors indicate lower costs, darker colors indicate higher costs. Average annual loads are indicated by color contrast. Lighter colors indicate lower load, darker colors indicate higher load (MWh).
Proposed Fixed Cost Alignment and Improved Consistency Staff is recommending the following changes:
- Increase the total fixed cost charges (the SIFC, SIC demand charge and the Summer Peak Demand Charge) and decrease the per kWh energy charges to make the recommendation revenue neutral by rate category.
- Add the Summer Peak Demand Charge to several rate categories (GSS_T, GUT_M, GUS_L, GUP_L, GUT_L), improving the consistency and customer experience when moving between classes.
- Align the SIC demand charge and Summer Peak Demand Charge across service voltages, where possible, to improve consistency and customer experience when moving between classes.
- Gradually introduce a monthly demand charge to the smallest commercial customers (GSN_T) starting in 2024, based on maximum monthly demand.
These changes will help SMUD transition to pricing that more accurately reflects the cost to provide electricity to customers and allow for a better customer experience when transitioning between rate categories.
Table 15 shows the bill components staff recommends adding to some rate categories, shown with stars.
TimeProposed Weekday
Time Periods
Forecasted Power Cost
Proposed Weekend
Time Periods
Forecasted Power Cost
< 20 kW 20-300 kW 300-499 kW 500-999 kW 1000 kW +
Midnight -1am 1-2am 2-3am 3-4am 4-5am 5-6am 6-7am 7-8am 8-9am 9-10am 10-11am
11am-Noon Noon-1pm
1-2pm 2-3pm 3-4pm 4-5pm 5-6pm 6-7pm 7-8pm 8-9pm 9-10pm 10-11pm
11pm-Midnight
Average Annual Load (MWH)
Off-Peak
Non- Summer Season
Off-Peak
Off-Peak
Off-Peak Saver
Peak
Off-Peak
Off-Peak Saver
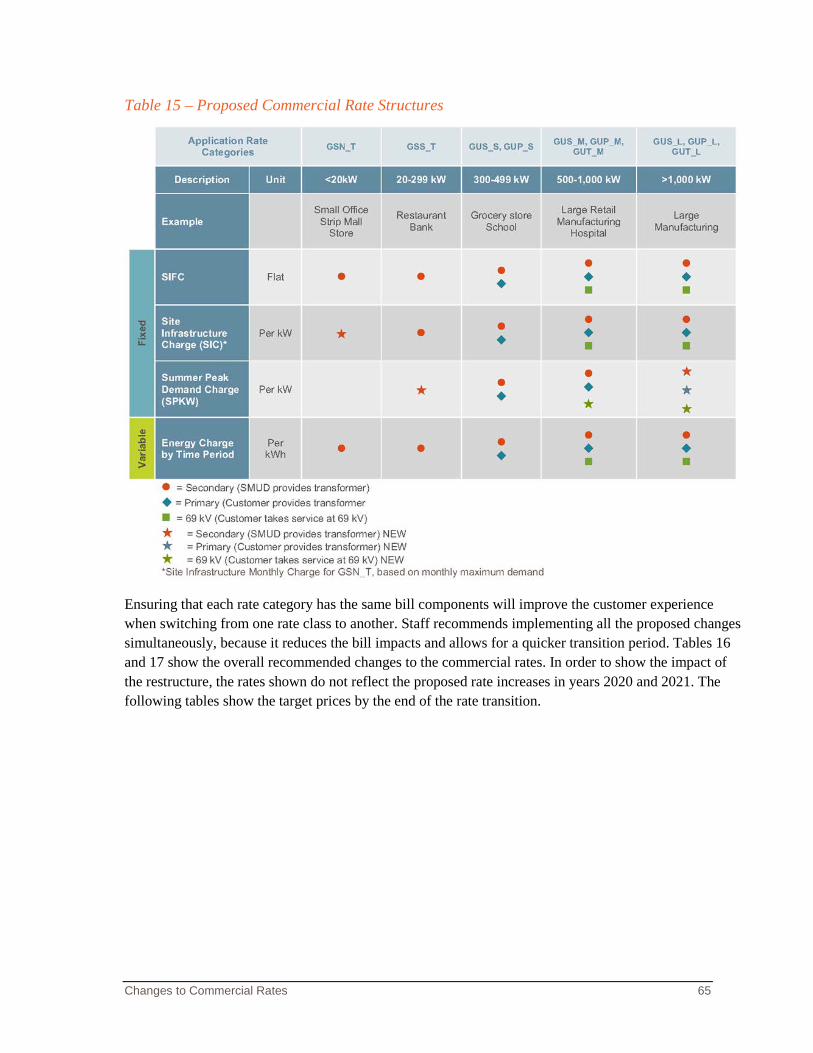
Changes to Commercial Rates 65
Table 15 – Proposed Commercial Rate Structures
Ensuring that each rate category has the same bill components will improve the customer experience when switching from one rate class to another. Staff recommends implementing all the proposed changes simultaneously, because it reduces the bill impacts and allows for a quicker transition period. Tables 16 and 17 show the overall recommended changes to the commercial rates. In order to show the impact of the restructure, the rates shown do not reflect the proposed rate increases in years 2020 and 2021. The following tables show the target prices by the end of the rate transition.
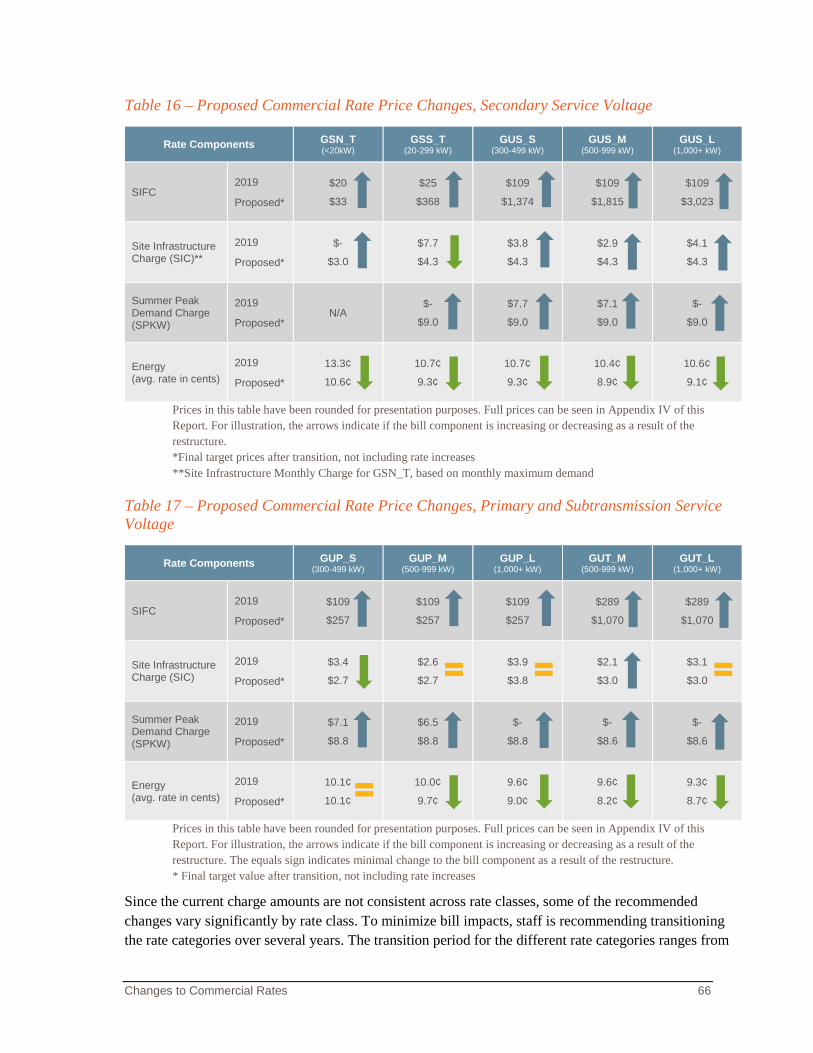
Changes to Commercial Rates 66
Table 16 – Proposed Commercial Rate Price Changes, Secondary Service Voltage
Prices in this table have been rounded for presentation purposes. Full prices can be seen in Appendix IV of this Report. For illustration, the arrows indicate if the bill component is increasing or decreasing as a result of the restructure. *Final target prices after transition, not including rate increases **Site Infrastructure Monthly Charge for GSN_T, based on monthly maximum demand
Table 17 – Proposed Commercial Rate Price Changes, Primary and Subtransmission Service Voltage
Prices in this table have been rounded for presentation purposes. Full prices can be seen in Appendix IV of this Report. For illustration, the arrows indicate if the bill component is increasing or decreasing as a result of the restructure. The equals sign indicates minimal change to the bill component as a result of the restructure. * Final target value after transition, not including rate increases
Since the current charge amounts are not consistent across rate classes, some of the recommended changes vary significantly by rate class. To minimize bill impacts, staff is recommending transitioning the rate categories over several years. The transition period for the different rate categories ranges from
Rate Components GSN_T (<20kW)
GSS_T (20-299 kW)
GUS_S (300-499 kW)
GUS_M (500-999 kW)
GUS_L (1,000+ kW)
SIFC 2019
Proposed*
$20
$33
$25
$368
$109
$1,374
$109
$1,815
$109
$3,023
Site Infrastructure Charge (SIC)**
2019
Proposed*
$-
$3.0
$7.7
$4.3
$3.8
$4.3
$2.9
$4.3
$4.1
$4.3
Summer Peak Demand Charge (SPKW)
2019
Proposed* N/A
$-
$9.0
$7.7
$9.0
$7.1
$9.0
$-
$9.0
Energy (avg. rate in cents)
2019
Proposed*
13.3¢
10.6¢
10.7¢
9.3¢
10.7¢
9.3¢
10.4¢
8.9¢
10.6¢
9.1¢
Rate Components GUP_S (300-499 kW)
GUP_M (500-999 kW)
GUP_L (1,000+ kW)
GUT_M (500-999 kW)
GUT_L (1,000+ kW)
SIFC 2019
Proposed*
$109
$257
$109
$257
$109
$257
$289
$1,070
$289
$1,070
Site Infrastructure Charge (SIC)
2019
Proposed*
$3.4
$2.7
$2.6
$2.7
$3.9
$3.8
$2.1
$3.0
$3.1
$3.0
Summer Peak Demand Charge (SPKW)
2019
Proposed*
$7.1
$8.8
$6.5
$8.8
$-
$8.8
$-
$8.6
$-
$8.6
Energy (avg. rate in cents)
2019
Proposed*
10.1¢
10.1¢
10.0¢
9.7¢
9.6¢
9.0¢
9.6¢
8.2¢
9.3¢
8.7¢
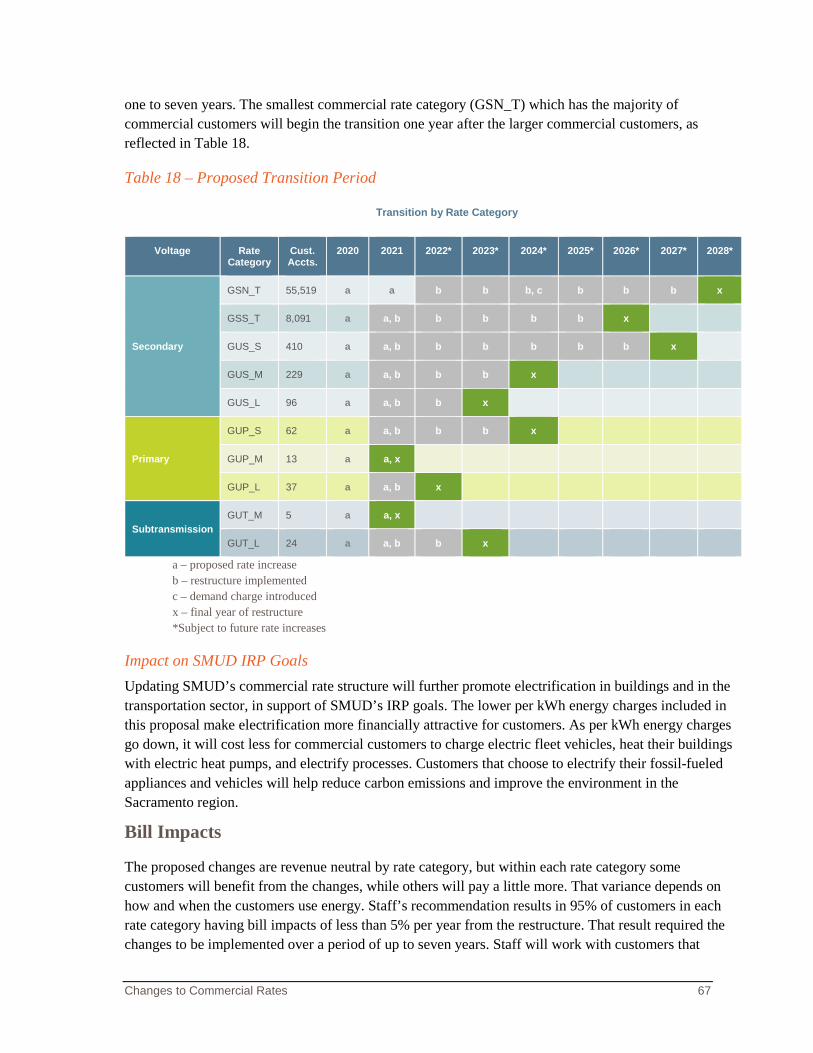
Changes to Commercial Rates 67
one to seven years. The smallest commercial rate category (GSN_T) which has the majority of commercial customers will begin the transition one year after the larger commercial customers, as reflected in Table 18.
Table 18 – Proposed Transition Period
Transition by Rate Category
Voltage Rate Category
Cust. Accts.
2020 2021 2022* 2023* 2024* 2025* 2026* 2027* 2028*
Secondary
GSN_T 55,519 a a b b b, c b b b x
GSS_T 8,091 a a, b b b b b x
GUS_S 410 a a, b b b b b b x
GUS_M 229 a a, b b b x
GUS_L 96 a a, b b x
Primary
GUP_S 62 a a, b b b x
GUP_M 13 a a, x
GUP_L 37 a a, b x
Subtransmission GUT_M 5 a a, x
GUT_L 24 a a, b b x
a – proposed rate increase b – restructure implemented c – demand charge introduced x – final year of restructure *Subject to future rate increases
Impact on SMUD IRP Goals Updating SMUD’s commercial rate structure will further promote electrification in buildings and in the transportation sector, in support of SMUD’s IRP goals. The lower per kWh energy charges included in this proposal make electrification more financially attractive for customers. As per kWh energy charges go down, it will cost less for commercial customers to charge electric fleet vehicles, heat their buildings with electric heat pumps, and electrify processes. Customers that choose to electrify their fossil-fueled appliances and vehicles will help reduce carbon emissions and improve the environment in the Sacramento region.
Bill Impacts
The proposed changes are revenue neutral by rate category, but within each rate category some customers will benefit from the changes, while others will pay a little more. That variance depends on how and when the customers use energy. Staff’s recommendation results in 95% of customers in each rate category having bill impacts of less than 5% per year from the restructure. That result required the changes to be implemented over a period of up to seven years. Staff will work with customers that
Changes to Commercial Rates 68
experience bill impacts greater than 5% individually and assist those customers through energy efficiency programs and/or education on energy use.
The exception to the 5% bill impact goal is the smallest commercial class (GSN_T). A 5% bill impact can be a very small amount in nominal dollars, and the transition would have required more years than is feasible. In 2022 and 2023, 95% of small commercial customers will see bill impacts of less than an average of $5.05 per month in each year. In 2024-2028, 95% of small commercial customers are projected to see less than an average of $4.00 per month in each year. Customers that are in the smallest commercial class as a result of extremely low energy usage, but have a higher maximum demand, will see bills gradually going up with the introduction of the demand charge to better reflect the cost to serve them.
The main factors that could determine a specific customer’s bill impact are:
• Overall energy usage, measured in kWh.
• Proportion of energy usage in the Summer and Non-Summer Peak time periods, measure in kWh.
• The maximum amount of demand required, measured in kW (SIC).
• The maximum amount of demand required during the Summer Peak time period, measured in kW (Summer Peak Demand Charge).
A customer that uses a lot of energy but has a relatively consistent maximum demand requirement (high load factor) will generally see a decrease in their bill. However, a customer that has a high maximum -demand requirement but uses very little energy (low load factor), will generally see their bill increase.
A customer that has a low load factor would typically be one that only turns on their equipment, such as a water pump, for short periods of time. The necessary infrastructure must be provided by SMUD for this customer’s maximum demand, even if they use very little energy.
The proposed rate adjustments will improve cost allocation between customers. If a customer’s bill decreases, it is because that customer costs less to serve than SMUD’s rates are currently collecting. Conversely, if a customer’s bill increases, it is because that customer costs more to serve than SMUD’s rates are currently collecting. Customers should be paying their fair share of costs to avoid shifting those costs on to other customers. It is possible for a customer with a large bill impact to reduce their bill impact through altering their usage. If the customer can shift their energy usage from Peak to Off-Peak or Off-Peak Saver, or manage their equipment use to reduce their demand, they could potentially save money.
Average Bill Impacts for Commercial Customers Tables 19 through 27 show the average year-over-year bill impacts for each rate category. Bill impacts are shown without the recommended rate increase in order to show the full impact of the restructure. Bill impacts are based on the stable population (customers with 12 months of billing data) and exclude contracts and SMUD facilities. The full rate details without the rate increase can be found in Appendix IV.
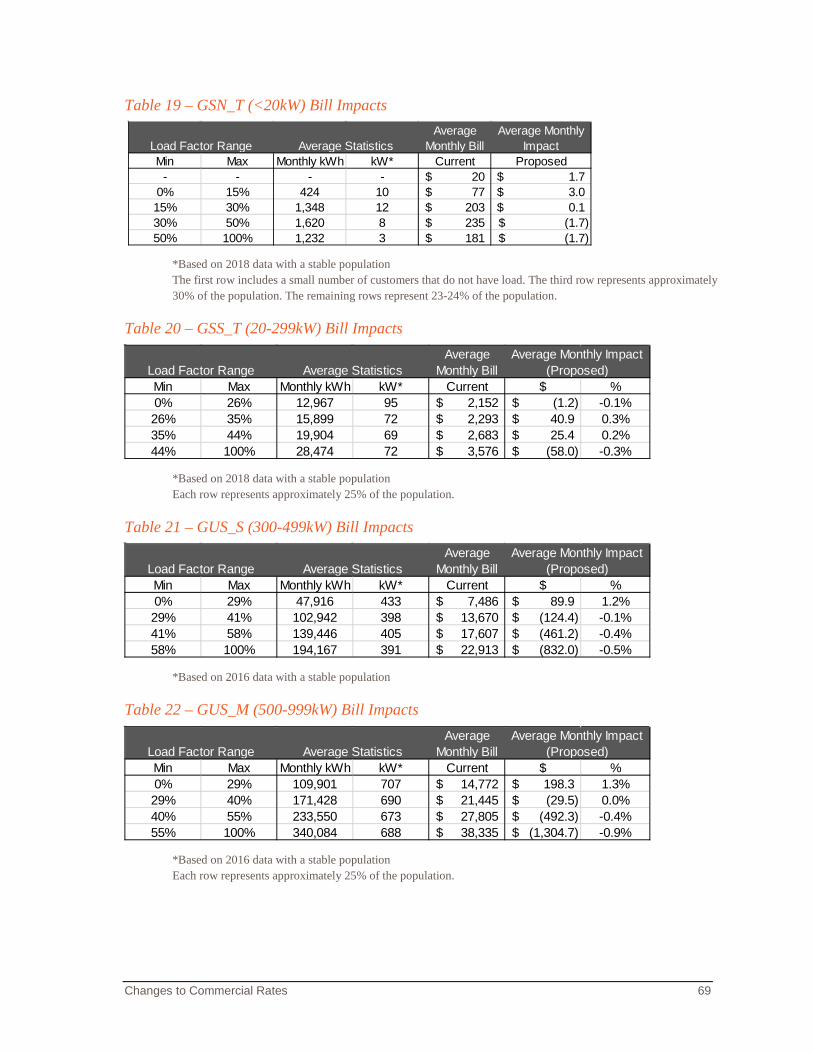
Changes to Commercial Rates 69
Table 19 – GSN_T (<20kW) Bill Impacts
*Based on 2018 data with a stable population The first row includes a small number of customers that do not have load. The third row represents approximately 30% of the population. The remaining rows represent 23-24% of the population.
Table 20 – GSS_T (20-299kW) Bill Impacts
*Based on 2018 data with a stable population Each row represents approximately 25% of the population.
Table 21 – GUS_S (300-499kW) Bill Impacts
*Based on 2016 data with a stable population
Table 22 – GUS_M (500-999kW) Bill Impacts
*Based on 2016 data with a stable population Each row represents approximately 25% of the population.
Load Factor Range Average StatisticsAverage
Monthly BillAverage Monthly
ImpactMin Max Monthly kWh kW* Current Proposed
- - - - 20$ 1.7$ 0% 15% 424 10 77$ 3.0$ 15% 30% 1,348 12 203$ 0.1$ 30% 50% 1,620 8 235$ (1.7)$ 50% 100% 1,232 3 181$ (1.7)$
Load Factor Range Average StatisticsAverage
Monthly BillAverage Monthly Impact
(Proposed)Min Max Monthly kWh kW* Current $ %0% 26% 12,967 95 2,152$ (1.2)$ -0.1%26% 35% 15,899 72 2,293$ 40.9$ 0.3%35% 44% 19,904 69 2,683$ 25.4$ 0.2%44% 100% 28,474 72 3,576$ (58.0)$ -0.3%
Load Factor Range Average StatisticsAverage
Monthly BillAverage Monthly Impact
(Proposed)Min Max Monthly kWh kW* Current $ %0% 29% 47,916 433 7,486$ 89.9$ 1.2%29% 41% 102,942 398 13,670$ (124.4)$ -0.1%41% 58% 139,446 405 17,607$ (461.2)$ -0.4%58% 100% 194,167 391 22,913$ (832.0)$ -0.5%
Load Factor Range Average StatisticsAverage
Monthly BillAverage Monthly Impact
(Proposed)Min Max Monthly kWh kW* Current $ %0% 29% 109,901 707 14,772$ 198.3$ 1.3%29% 40% 171,428 690 21,445$ (29.5)$ 0.0%40% 55% 233,550 673 27,805$ (492.3)$ -0.4%55% 100% 340,084 688 38,335$ (1,304.7)$ -0.9%
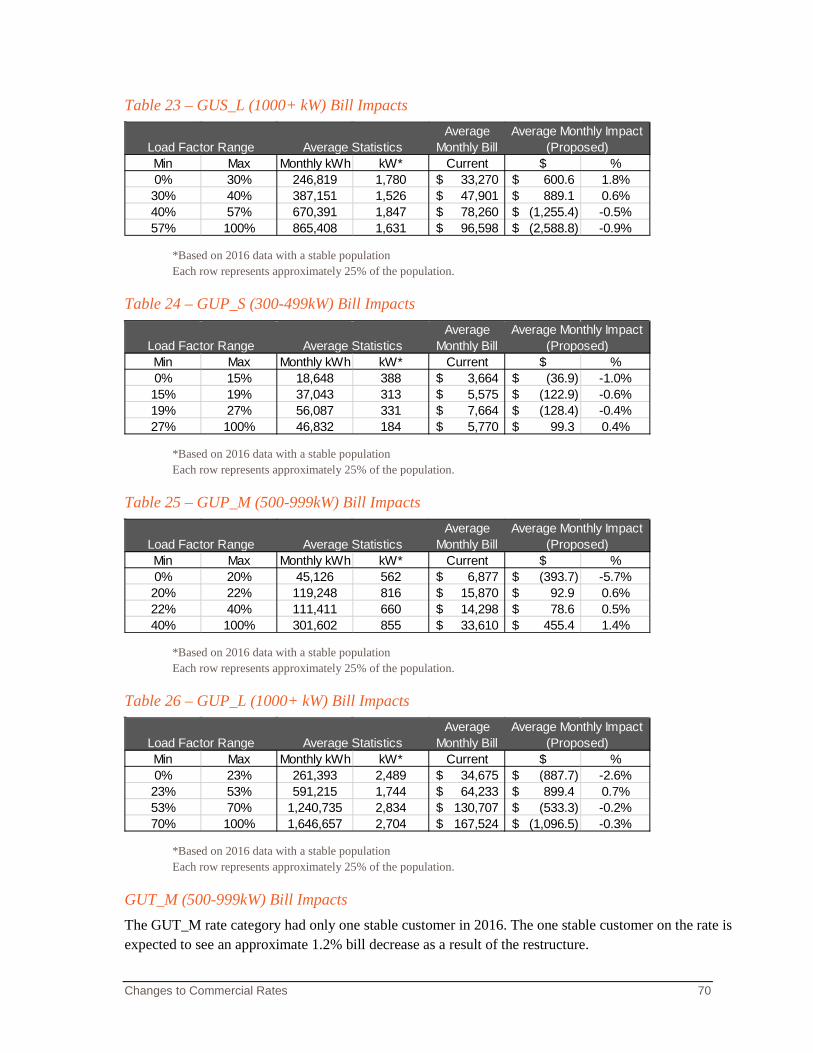
Changes to Commercial Rates 70
Table 23 – GUS_L (1000+ kW) Bill Impacts
*Based on 2016 data with a stable population Each row represents approximately 25% of the population.
Table 24 – GUP_S (300-499kW) Bill Impacts
*Based on 2016 data with a stable population Each row represents approximately 25% of the population.
Table 25 – GUP_M (500-999kW) Bill Impacts
*Based on 2016 data with a stable population Each row represents approximately 25% of the population.
Table 26 – GUP_L (1000+ kW) Bill Impacts
*Based on 2016 data with a stable population Each row represents approximately 25% of the population.
GUT_M (500-999kW) Bill Impacts The GUT_M rate category had only one stable customer in 2016. The one stable customer on the rate is expected to see an approximate 1.2% bill decrease as a result of the restructure.
Load Factor Range Average StatisticsAverage
Monthly BillAverage Monthly Impact
(Proposed)Min Max Monthly kWh kW* Current $ %0% 30% 246,819 1,780 33,270$ 600.6$ 1.8%30% 40% 387,151 1,526 47,901$ 889.1$ 0.6%40% 57% 670,391 1,847 78,260$ (1,255.4)$ -0.5%57% 100% 865,408 1,631 96,598$ (2,588.8)$ -0.9%
Load Factor Range Average StatisticsAverage
Monthly BillAverage Monthly Impact
(Proposed)Min Max Monthly kWh kW* Current $ %0% 15% 18,648 388 3,664$ (36.9)$ -1.0%15% 19% 37,043 313 5,575$ (122.9)$ -0.6%19% 27% 56,087 331 7,664$ (128.4)$ -0.4%27% 100% 46,832 184 5,770$ 99.3$ 0.4%
Load Factor Range Average StatisticsAverage
Monthly BillAverage Monthly Impact
(Proposed)Min Max Monthly kWh kW* Current $ %0% 20% 45,126 562 6,877$ (393.7)$ -5.7%20% 22% 119,248 816 15,870$ 92.9$ 0.6%22% 40% 111,411 660 14,298$ 78.6$ 0.5%40% 100% 301,602 855 33,610$ 455.4$ 1.4%
Load Factor Range Average StatisticsAverage
Monthly BillAverage Monthly Impact
(Proposed)Min Max Monthly kWh kW* Current $ %0% 23% 261,393 2,489 34,675$ (887.7)$ -2.6%23% 53% 591,215 1,744 64,233$ 899.4$ 0.7%53% 70% 1,240,735 2,834 130,707$ (533.3)$ -0.2%70% 100% 1,646,657 2,704 167,524$ (1,096.5)$ -0.3%
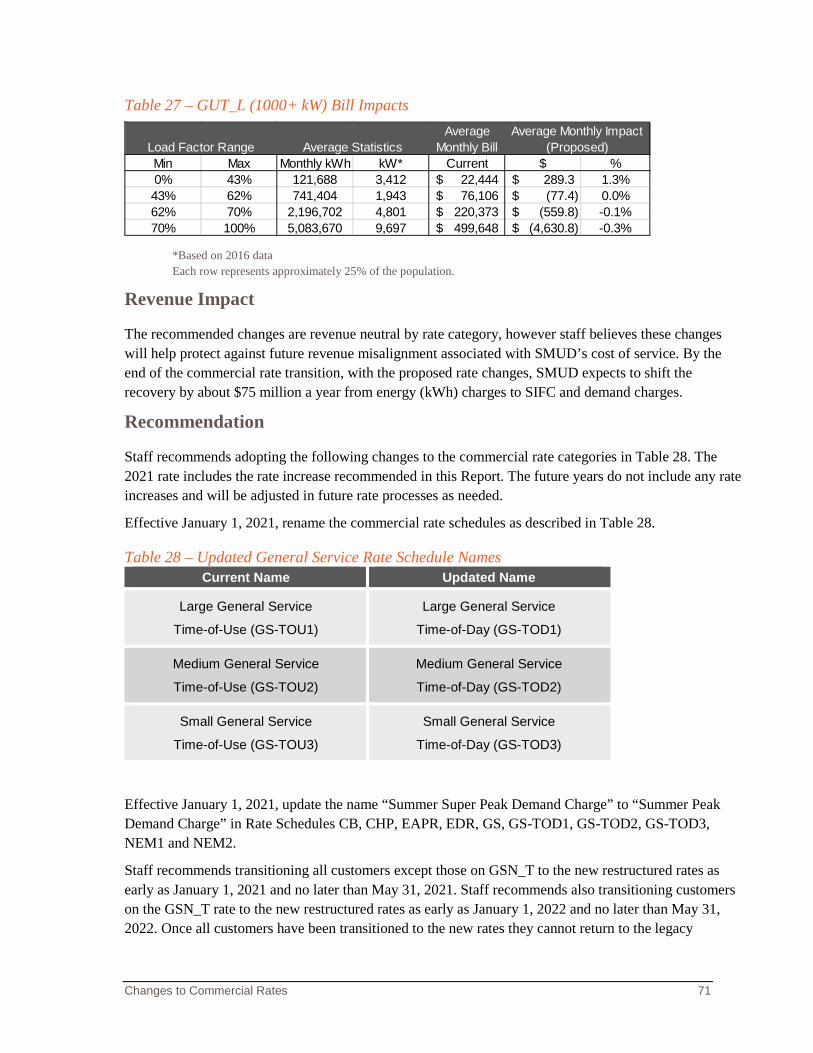
Changes to Commercial Rates 71
Table 27 – GUT_L (1000+ kW) Bill Impacts
*Based on 2016 data Each row represents approximately 25% of the population.
Revenue Impact
The recommended changes are revenue neutral by rate category, however staff believes these changes will help protect against future revenue misalignment associated with SMUD’s cost of service. By the end of the commercial rate transition, with the proposed rate changes, SMUD expects to shift the recovery by about $75 million a year from energy (kWh) charges to SIFC and demand charges.
Recommendation
Staff recommends adopting the following changes to the commercial rate categories in Table 28. The 2021 rate includes the rate increase recommended in this Report. The future years do not include any rate increases and will be adjusted in future rate processes as needed.
Effective January 1, 2021, rename the commercial rate schedules as described in Table 28.
Table 28 – Updated General Service Rate Schedule Names Current Name Updated Name
Large General Service
Time-of-Use (GS-TOU1)
Large General Service
Time-of-Day (GS-TOD1)
Medium General Service
Time-of-Use (GS-TOU2)
Medium General Service
Time-of-Day (GS-TOD2)
Small General Service
Time-of-Use (GS-TOU3)
Small General Service
Time-of-Day (GS-TOD3)
Effective January 1, 2021, update the name “Summer Super Peak Demand Charge” to “Summer Peak Demand Charge” in Rate Schedules CB, CHP, EAPR, EDR, GS, GS-TOD1, GS-TOD2, GS-TOD3, NEM1 and NEM2.
Staff recommends transitioning all customers except those on GSN_T to the new restructured rates as early as January 1, 2021 and no later than May 31, 2021. Staff recommends also transitioning customers on the GSN_T rate to the new restructured rates as early as January 1, 2022 and no later than May 31, 2022. Once all customers have been transitioned to the new rates they cannot return to the legacy
Load Factor Range Average StatisticsAverage
Monthly BillAverage Monthly Impact
(Proposed)Min Max Monthly kWh kW* Current $ %0% 43% 121,688 3,412 22,444$ 289.3$ 1.3%43% 62% 741,404 1,943 76,106$ (77.4)$ 0.0%62% 70% 2,196,702 4,801 220,373$ (559.8)$ -0.1%70% 100% 5,083,670 9,697 499,648$ (4,630.8)$ -0.3%
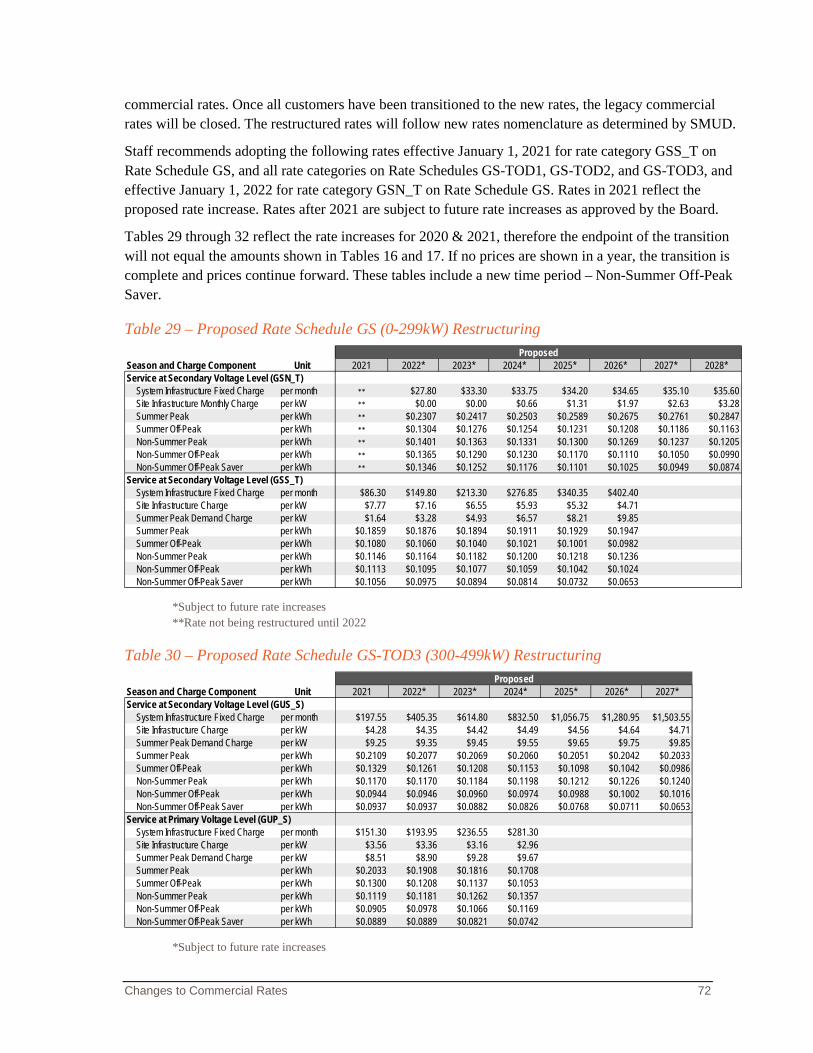
Changes to Commercial Rates 72
commercial rates. Once all customers have been transitioned to the new rates, the legacy commercial rates will be closed. The restructured rates will follow new rates nomenclature as determined by SMUD.
Staff recommends adopting the following rates effective January 1, 2021 for rate category GSS_T on Rate Schedule GS, and all rate categories on Rate Schedules GS-TOD1, GS-TOD2, and GS-TOD3, and effective January 1, 2022 for rate category GSN_T on Rate Schedule GS. Rates in 2021 reflect the proposed rate increase. Rates after 2021 are subject to future rate increases as approved by the Board.
Tables 29 through 32 reflect the rate increases for 2020 & 2021, therefore the endpoint of the transition will not equal the amounts shown in Tables 16 and 17. If no prices are shown in a year, the transition is complete and prices continue forward. These tables include a new time period – Non-Summer Off-Peak Saver.
Table 29 – Proposed Rate Schedule GS (0-299kW) Restructuring
*Subject to future rate increases **Rate not being restructured until 2022
Table 30 – Proposed Rate Schedule GS-TOD3 (300-499kW) Restructuring
*Subject to future rate increases
Season and Charge Component Unit 2021 2022* 2023* 2024* 2025* 2026* 2027* 2028*Service at Secondary Voltage Level (GSN_T)
System Infrastructure Fixed Charge per month ** $27.80 $33.30 $33.75 $34.20 $34.65 $35.10 $35.60Site Infrastructure Monthly Charge per kW ** $0.00 $0.00 $0.66 $1.31 $1.97 $2.63 $3.28Summer Peak per kWh ** $0.2307 $0.2417 $0.2503 $0.2589 $0.2675 $0.2761 $0.2847Summer Off-Peak per kWh ** $0.1304 $0.1276 $0.1254 $0.1231 $0.1208 $0.1186 $0.1163Non-Summer Peak per kWh ** $0.1401 $0.1363 $0.1331 $0.1300 $0.1269 $0.1237 $0.1205Non-Summer Off-Peak per kWh ** $0.1365 $0.1290 $0.1230 $0.1170 $0.1110 $0.1050 $0.0990Non-Summer Off-Peak Saver per kWh ** $0.1346 $0.1252 $0.1176 $0.1101 $0.1025 $0.0949 $0.0874
Service at Secondary Voltage Level (GSS_T)System Infrastructure Fixed Charge per month $86.30 $149.80 $213.30 $276.85 $340.35 $402.40Site Infrastructure Charge per kW $7.77 $7.16 $6.55 $5.93 $5.32 $4.71Summer Peak Demand Charge per kW $1.64 $3.28 $4.93 $6.57 $8.21 $9.85Summer Peak per kWh $0.1859 $0.1876 $0.1894 $0.1911 $0.1929 $0.1947Summer Off-Peak per kWh $0.1080 $0.1060 $0.1040 $0.1021 $0.1001 $0.0982Non-Summer Peak per kWh $0.1146 $0.1164 $0.1182 $0.1200 $0.1218 $0.1236Non-Summer Off-Peak per kWh $0.1113 $0.1095 $0.1077 $0.1059 $0.1042 $0.1024Non-Summer Off-Peak Saver per kWh $0.1056 $0.0975 $0.0894 $0.0814 $0.0732 $0.0653
Proposed
Season and Charge Component Unit 2021 2022* 2023* 2024* 2025* 2026* 2027*Service at Secondary Voltage Level (GUS_S)
System Infrastructure Fixed Charge per month $197.55 $405.35 $614.80 $832.50 $1,056.75 $1,280.95 $1,503.55Site Infrastructure Charge per kW $4.28 $4.35 $4.42 $4.49 $4.56 $4.64 $4.71Summer Peak Demand Charge per kW $9.25 $9.35 $9.45 $9.55 $9.65 $9.75 $9.85Summer Peak per kWh $0.2109 $0.2077 $0.2069 $0.2060 $0.2051 $0.2042 $0.2033Summer Off-Peak per kWh $0.1329 $0.1261 $0.1208 $0.1153 $0.1098 $0.1042 $0.0986Non-Summer Peak per kWh $0.1170 $0.1170 $0.1184 $0.1198 $0.1212 $0.1226 $0.1240Non-Summer Off-Peak per kWh $0.0944 $0.0946 $0.0960 $0.0974 $0.0988 $0.1002 $0.1016Non-Summer Off-Peak Saver per kWh $0.0937 $0.0937 $0.0882 $0.0826 $0.0768 $0.0711 $0.0653
Service at Primary Voltage Level (GUP_S)System Infrastructure Fixed Charge per month $151.30 $193.95 $236.55 $281.30Site Infrastructure Charge per kW $3.56 $3.36 $3.16 $2.96Summer Peak Demand Charge per kW $8.51 $8.90 $9.28 $9.67Summer Peak per kWh $0.2033 $0.1908 $0.1816 $0.1708Summer Off-Peak per kWh $0.1300 $0.1208 $0.1137 $0.1053Non-Summer Peak per kWh $0.1119 $0.1181 $0.1262 $0.1357Non-Summer Off-Peak per kWh $0.0905 $0.0978 $0.1066 $0.1169Non-Summer Off-Peak Saver per kWh $0.0889 $0.0889 $0.0821 $0.0742
Proposed
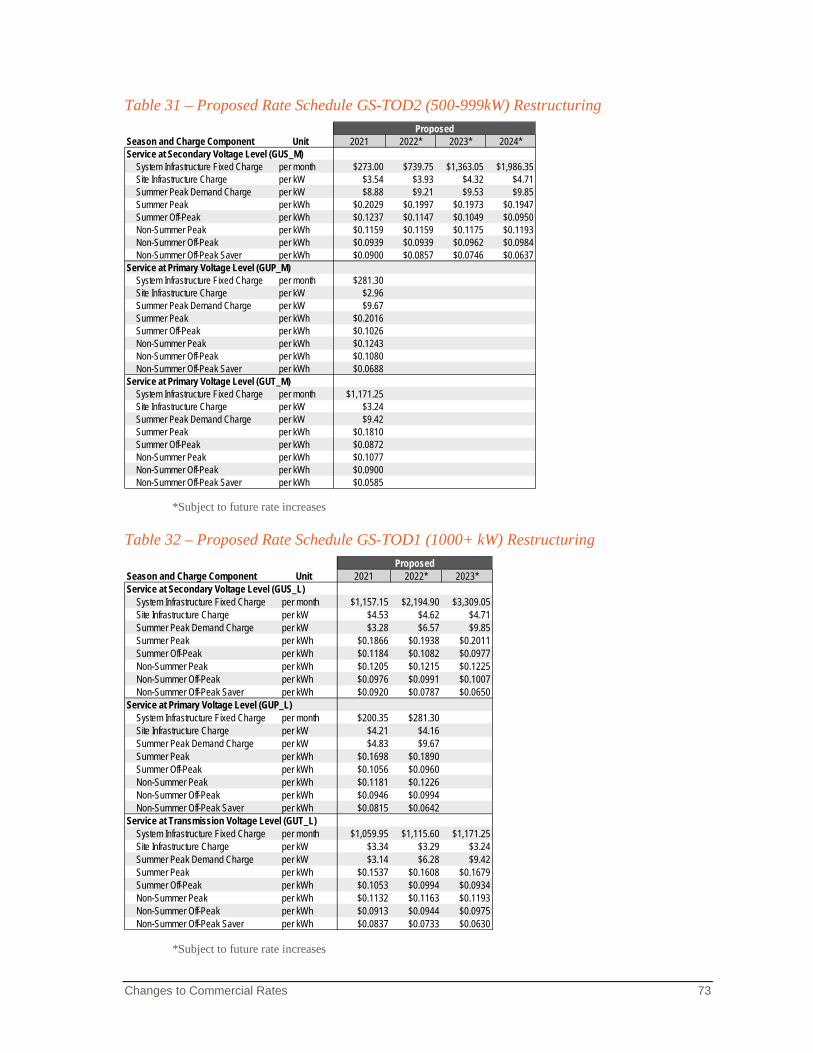
Changes to Commercial Rates 73
Table 31 – Proposed Rate Schedule GS-TOD2 (500-999kW) Restructuring
*Subject to future rate increases
Table 32 – Proposed Rate Schedule GS-TOD1 (1000+ kW) Restructuring
*Subject to future rate increases
Season and Charge Component Unit 2021 2022* 2023* 2024*Service at Secondary Voltage Level (GUS_M)
System Infrastructure Fixed Charge per month $273.00 $739.75 $1,363.05 $1,986.35Site Infrastructure Charge per kW $3.54 $3.93 $4.32 $4.71Summer Peak Demand Charge per kW $8.88 $9.21 $9.53 $9.85Summer Peak per kWh $0.2029 $0.1997 $0.1973 $0.1947Summer Off-Peak per kWh $0.1237 $0.1147 $0.1049 $0.0950Non-Summer Peak per kWh $0.1159 $0.1159 $0.1175 $0.1193Non-Summer Off-Peak per kWh $0.0939 $0.0939 $0.0962 $0.0984Non-Summer Off-Peak Saver per kWh $0.0900 $0.0857 $0.0746 $0.0637
Service at Primary Voltage Level (GUP_M)System Infrastructure Fixed Charge per month $281.30Site Infrastructure Charge per kW $2.96Summer Peak Demand Charge per kW $9.67Summer Peak per kWh $0.2016Summer Off-Peak per kWh $0.1026Non-Summer Peak per kWh $0.1243Non-Summer Off-Peak per kWh $0.1080Non-Summer Off-Peak Saver per kWh $0.0688
Service at Primary Voltage Level (GUT_M)System Infrastructure Fixed Charge per month $1,171.25Site Infrastructure Charge per kW $3.24Summer Peak Demand Charge per kW $9.42Summer Peak per kWh $0.1810Summer Off-Peak per kWh $0.0872Non-Summer Peak per kWh $0.1077Non-Summer Off-Peak per kWh $0.0900Non-Summer Off-Peak Saver per kWh $0.0585
Proposed
Season and Charge Component Unit 2021 2022* 2023*Service at Secondary Voltage Level (GUS_L)
System Infrastructure Fixed Charge per month $1,157.15 $2,194.90 $3,309.05Site Infrastructure Charge per kW $4.53 $4.62 $4.71Summer Peak Demand Charge per kW $3.28 $6.57 $9.85Summer Peak per kWh $0.1866 $0.1938 $0.2011Summer Off-Peak per kWh $0.1184 $0.1082 $0.0977Non-Summer Peak per kWh $0.1205 $0.1215 $0.1225Non-Summer Off-Peak per kWh $0.0976 $0.0991 $0.1007Non-Summer Off-Peak Saver per kWh $0.0920 $0.0787 $0.0650
Service at Primary Voltage Level (GUP_L)System Infrastructure Fixed Charge per month $200.35 $281.30Site Infrastructure Charge per kW $4.21 $4.16Summer Peak Demand Charge per kW $4.83 $9.67Summer Peak per kWh $0.1698 $0.1890Summer Off-Peak per kWh $0.1056 $0.0960Non-Summer Peak per kWh $0.1181 $0.1226Non-Summer Off-Peak per kWh $0.0946 $0.0994Non-Summer Off-Peak Saver per kWh $0.0815 $0.0642
Service at Transmission Voltage Level (GUT_L)System Infrastructure Fixed Charge per month $1,059.95 $1,115.60 $1,171.25Site Infrastructure Charge per kW $3.34 $3.29 $3.24Summer Peak Demand Charge per kW $3.14 $6.28 $9.42Summer Peak per kWh $0.1537 $0.1608 $0.1679Summer Off-Peak per kWh $0.1053 $0.0994 $0.0934Non-Summer Peak per kWh $0.1132 $0.1163 $0.1193Non-Summer Off-Peak per kWh $0.0913 $0.0944 $0.0975Non-Summer Off-Peak Saver per kWh $0.0837 $0.0733 $0.0630
Proposed
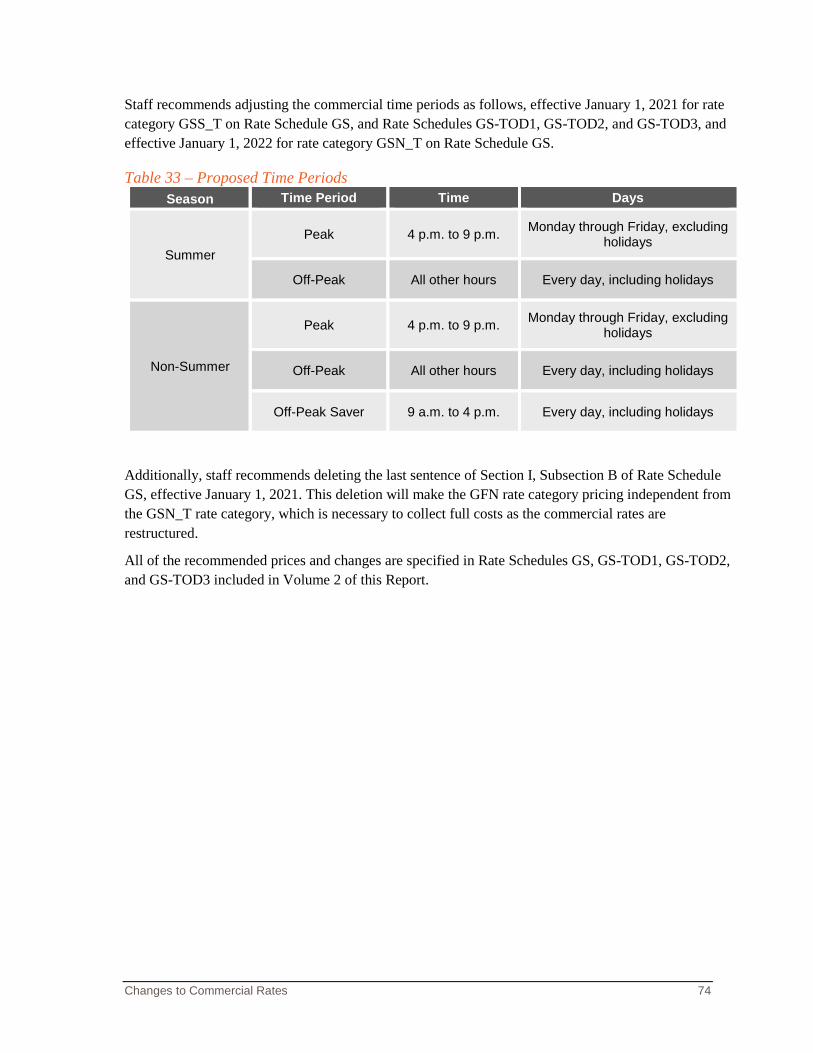
Changes to Commercial Rates 74
Staff recommends adjusting the commercial time periods as follows, effective January 1, 2021 for rate category GSS_T on Rate Schedule GS, and Rate Schedules GS-TOD1, GS-TOD2, and GS-TOD3, and effective January 1, 2022 for rate category GSN_T on Rate Schedule GS.
Table 33 – Proposed Time Periods Season Time Period Time Days
Summer Peak 4 p.m. to 9 p.m. Monday through Friday, excluding
holidays
Off-Peak All other hours Every day, including holidays
Non-Summer
Peak 4 p.m. to 9 p.m. Monday through Friday, excluding holidays
Off-Peak All other hours Every day, including holidays
Off-Peak Saver 9 a.m. to 4 p.m. Every day, including holidays
Additionally, staff recommends deleting the last sentence of Section I, Subsection B of Rate Schedule GS, effective January 1, 2021. This deletion will make the GFN rate category pricing independent from the GSN_T rate category, which is necessary to collect full costs as the commercial rates are restructured.
All of the recommended prices and changes are specified in Rate Schedules GS, GS-TOD1, GS-TOD2, and GS-TOD3 included in Volume 2 of this Report.
Changes to Street, Traffic and Lighting Rates 75
Changes to Street, Traffic and Lighting Rates Rate Increase for Street/Traffic/Lighting Rates Purpose
The proposed 4.75% rate increase in 2020 and 4.50% rate increase in 2021 will be applied to the SIFC, the Electricity and Switching Charge, the Electricity Usage Charge, and Monthly Charges of the Lighting Schedules. The rate increases will not apply to monthly leasing and maintenance charges for street lighting lamps and fixtures. SMUD reviews the street lighting fees annually and posts them separately on its website, www.smud.org.
Bill Impact
On average, SMUD’s street lighting, traffic lighting and night lighting customers will see an increase on their annual bill of 4.75% in 2020 and 4.50% in 2021.
Revenue Impact
With the proposed rate increase SMUD expects to collect added revenue of approximately $190,000 in 2020 and a cumulative amount of approximately $380,000 in 2021 from all lighting classes. This increase does not apply to lighting fees.
Recommendation
Staff recommends adoption of the 4.75% rate increase in 2020 and the 4.50% rate increase in 2021 for Street/Traffic/Lighting Rates. Revisions described above are detailed in the NLGT, SLS, and TSS rate schedules included in Volume 2 of this Report.
Traffic Control Intersection Lighting Service Purpose
This rate was designed in support of government agencies for traffic safety and management purposes. Modernizing the transportation sector for a future which will include autonomous (driverless) vehicles, may require the installation of monitoring devices on utility equipment. As more modernized facilities are adopted or installed by private entities on public agency facilities, those devices that support private entity usage will need to be on a different commercial rate and potentially metered separately from the public agency’s other accounts.
This Report includes proposed language to clarify the applicability of this rate to cities, counties, and other public agencies and business partners monitoring traffic safety and management for the benefit of these public agencies.
Changes to Street, Traffic and Lighting Rates 76
Bill Impact
None.
Revenue Impact
None.
Recommendation
Effective January 1, 2020, amend Section I of Rate Schedule TC ILS as follows:
I. Applicability
This Rate Schedule TC ILS applies to electric service for the benefit of cities, counties, and other public agencies for pedestrian and vehicular traffic signal units, together with related control devices for the purpose of traffic safety and management and associated intersection lighting where the mounting, standards, control supports, signal equipment, and luminaires are owned and maintained by the customer.
For the purposes of the following prices a "month" is considered to be a single billing period of 27 to 34 days.
Revisions described above are detailed in Rate Schedule TC ILS included in Volume 2 of this Report.
Miscellaneous Rate Changes 77
Miscellaneous Rate Changes NEM Rate Schedule References Purpose
Staff recommends renaming Rate Schedule NEM to NEM1 and introducing a new Rate Schedule NEM2, as described above in this Report. Rate Schedules AG, GS, GS-TOD1, GS-TOD2, and GS-TOD3 each refer to Rate Schedule NEM. Staff recommends replacing each reference to Rate Schedule NEM with Rate Schedules NEM1 and NEM2.
Bill Impact
None.
Revenue Impact
None.
Recommendation
Effective June 25, 2019, modify Rate Schedules AG, GS, GS-TOD1, GS-TOD2, GS-TOD3 by replacing all references to “Rate Schedule NEM” with “Rate Schedules NEM1 and NEM2.”
Revisions described above are detailed in Rate Schedules AG, GS, GS-TOD1, GS-TOD2, and GS-TOD3 included in Volume 2 of this Report.
Discontinuance of Service Purpose
Staff recommends updating the language regarding Discontinuance of Service in each commercial rate schedule to reflect current technology. Historically, when a customer disconnected their service, a technician would have to physically shut off power and then put a lock on the meter so that no one could turn it back on without SMUD knowledge. New technology allows SMUD to disconnect customers remotely, making the current language no longer relevant.
Bill Impact
None.
Revenue Impact
None.
Miscellaneous Rate Changes 78
Recommendation
Effective January 1, 2020, modify Section VI, Subsection D of Rate Schedules GS, GS-TDP, GS-TOD1, GS-TOD2, GS-TOD3 as follows:
D. Discontinuance of Service
Any customer resuming service at the same premises within 12 months after discontinuing service will be required to pay the System Infrastructure Fixed Charges and Site Infrastructure Charges that would have been billed if service had not been discontinued, except when service has been disconnecteda customer agrees to lock out service during the full period. The System Infrastructure Fixed Charge and Site Infrastructure Charge will be waived during each of those months. Retroactive billing shall be at SMUD’s sole discretion.
Effective January 1, 2020, modify Section VI, Subsection D of Rate Schedule AG as follows:
D. Discontinuance of Service
Any customer resuming service at the same premises within 12 months after discontinuing service will be required to pay the System Infrastructure Fixed Charges and Site Infrastructure Charges that would have been billed if service had not been discontinued, except when service has been disconnecteda customer agrees to lock out service during the full period of June through September. The System Infrastructure Fixed Charge and Site Infrastructure Charge will be waived during each of those months. Retroactive billing shall be at SMUD’s sole discretion.
Revisions described above are detailed in Rate Schedules AG, GS, GS-TDP, GS-TOD1, GS-TOD2, and GS-TOD3 included in Volume 2 of this Report.
Proration Language Purpose
Staff recommends updating the proration language in each non-residential rate schedule to accurately reflect current billing practices. The following charges are prorated when billing cycles are less than 27 days and greater than 34 days as detailed in the appropriate rate schedules:
- System Infrastructure Fixed Charge
- Site Infrastructure Charge
- Site Infrastructure Monthly Charge (in 2024)
- Summer Super Peak Demand Charge (in 2020)
- Summer Peak Demand Charge (in 2021)
- Grid Access Charge
- Electricity Usage Charge
Miscellaneous Rate Changes 79
Bill Impact
None.
Revenue Impact
None.
Recommendation
Effective January 1, 2020, update the Proration of Charges in the respective section of each Rate Schedule to accurately list the charges applicable to each Rate Schedule.
Revisions described above are detailed in Rate Schedules AG, CB, GS, GS-TDP, GS-TOD1, GS-TOD2, GS-TOD3, and SLS included in Volume 2 of this Report.
Hydro Generation Adjustment (HGA) Purpose
The Board approved changes to the HGA Rate Schedule in September 2018. Staff recommends clarifying language in the HGA Rate Schedule to specify that the transfer discussed in Section VI Subsection C is from Operating Revenues.
Bill Impact
None.
Revenue Impact
None.
Recommendation
Effective January 1, 2020, amend Section VI, Subsection C of Rate Schedule HGA as follows:
C. If the Calculated HRSF is > 6 percent of budgeted annual gross retail revenue:
The Accountant will transfer the negative BI into the HRSF from Operating Revenues up to 6 percent of budgeted annual gross retail revenue. The Board may authorize the HGA or direct the funds for another purpose. At the Board’s direction, the HGA will be set at:
– (Calculated HRSF – 6% of budgeted annual gross retail revenue) = HGA Budgeted annual retail kWh sales
Revisions described above are detailed in Rate Schedule HGA included in Volume 2 of this Report.
Miscellaneous Rate Changes 80
Power Factor Waiver Purpose
To promote an efficient supply of electricity, commercial customers are charged a Power Factor Adjustment if their monthly power factor falls below 95 percent. Commercial customers may apply for a Power Factor Waiver which is a monthly fee equivalent to their lease of a share of a distribution capacitor bank that would correct their Power Factor to 95 percent. If a customer applies for a waiver, SMUD may install capacitors to alleviate the impact of the power factor. However, SMUD cannot install the significantly larger 69kV capacitors on poles along the circuit, as they do on 12kV and 21kV distribution circuits. Therefore, staff is recommending that the Power Factor Waiver be limited to customers connecting at the secondary and primary service voltage.
Bill Impact
None.
Revenue Impact
None.
Recommendation
Effective January 1, 2020, modify Section V. Conditions of Service, Subsection C.2. in Rate Schedules AG, GS, GS-TDP, GS-TOD1, GS-TOD2, GS-TOD3 as follows:
Customers may apply for a power factor waiver contract that compensates SMUD for the power factor correction for the portion that is covered under the contract. The power factor waiver is not available to customers taking service at the subtransmission service voltage level. The waiver amount per month is calculated:
Revisions described above are detailed in Rate Schedules AG, GS, GS-TDP, GS-TOD1, GS-TOD2, GS-TOD3 included in Volume 2 of this Report.
Greenergy Purpose
SMUD offers a program, for an additional fee, that allows customers to receive up to 100 percent of their energy from renewable resources. The program has historically provided a blend of lower cost renewables (from non-California generators), but legislative and regulatory changes along with shifting customer preferences, have necessitated changes to the program that will require higher cost renewables (from California generators). For instance, AB 162 requires green pricing programs to list all power from non-California generators as non-renewable on SMUD’s power source disclosure, and AB 1110 requires that green pricing sales from all non-California generators sales be disclosed as having no carbon effect.
Miscellaneous Rate Changes 81
Staff recommends simplifying the language in the rate schedules to direct customers to SMUD’s web site, www.smud.org, for details on the program, which will allow staff to update the program in a more timely manner to satisfy changing legislative and regulatory requirements. Staff believes the redesigned program will appeal to more customers by giving them more tailored options for renewable power.
Bill Impact
None.
Revenue Impact
None.
Recommendation
Effective January 1, 2020, replace the language in the Green Pricing Options in the respective section of each Rate Schedule with the following language:
SMUD Renewable Energy Option
SMUD offers optional programs that allow customers to receive renewable energy for an additional charge, detailed on www.smud.org.
Revisions described above are detailed in Rate Schedules AG, GS, GS-TDP, GS-TOD1, GS-TOD2, GS-TOD3, R, R-TOD included in Volume 2 of this Report.
Changes to Rules and Regulations 82
Changes to Rules and Regulations Rule 1 – Definitions Purpose
The industry standard term “multiplier” is undefined in SMUD’s Rules and Regulations. Staff is recommending adding “multiplier” to the definitions in Rule and Regulation 1 to improve clarity for customers.
In addition, the Rate Changes definition includes a definition for “Maximum Demand Charge,” which is an outdated term. Staff recommends updating the term to “Summer Super Peak Demand Charge.”
Bill Impact
None.
Revenue Impact
None.
Recommendation
Effective June 25, 2019, add the following definition for “multiplier” in Rule and Regulation 1.
Multiplier
A meter multiplier is applied for locations which have electrical load that is too large for a meter to measure its total usage. In these situations, current and potential transformers are installed allowing a portion of the total usage to be measured. The measured usage is then multiplied by the appropriate amount (the multiplier) to determine the actual kWh used for billing purposes.
Effective June 25, 2019, add the term “Summer Super Peak Demand Charge” in Rule and Regulation 1 with the following language:
That portion of the charge which varies with the billing demand in accordance with the rate.
Revisions described above are detailed in Rule and Regulation 1 included in Volume 2 of this Report.
Rule 11 – Discontinuance and Restoration of Service Purpose
Currently, SMUD could be viewed as being limited in assisting local building officials by shutting off power only if the customer’s wiring or equipment is either unsafe or in violation of the law. However, local building officials can request SMUD disconnect a customer’s power for various reasons, not just wiring or equipment safety issues. Staff recommends enabling SMUD to work more effectively with city
Changes to Rules and Regulations 83
and county building officials by allowing service to be disconnected at the direction of a local government building official.
Bill Impact
None.
Revenue Impact
None.
Recommendation
Effective June 25, 2019, amend Section C in Rule and Regulation 11 as follows:
SMUD may discontinue or refuse service if any part of customer’s wiring or equipment, or use thereof, is either unsafe or in violation of law, until such apparatus shall have been placed in a safe condition or the violation remedied, or if a local government building official directs SMUD to disconnect power. If, in SMUD’s judgment, operation of customer’s equipment constitutes a dangerous condition or if SMUD is so directed by a local government building official, SMUD may discontinue service without notice.
Revisions described above are detailed in Rule and Regulation 11 included in Volume 2 of this Report.
Rule 16 – Extension of Facilities to Non-Residential Premises Purpose
In 2018, SMUD staff recommended the implementation of a demand-based offset as part of SMUD’s Rule 16, later referred to as the “Development Fee Offset Program.” The program was approved by the Board, and officially took effect on September 21, 2018. The Development Fee Offset Program provides, for those loads of 300kW or greater, a Per kW Offset Amount for any/all commercial, industrial and mixed-use development projects throughout SMUD’s service territory to promote economic growth.
Since the program’s implementation, staff has identified improvements to the program. Staff believes the Per kW Offset Amount is an effective method of promoting regional economic development; however, some projects do not provide as much benefit as others if significant energy sales will not materialize or they do not provide long-term economic growth. In calculating the Per kW Offset Amount, staff assumed a payback period of three to six years in energy sales. However, not all projects will be able to meet that time frame based on the level of usage at the site. It therefore justifies determining the Per kW Offset Amount on the diversified load of the project, instead of just the demand of the project.
Additionally, some public infrastructure projects may provide only short-term benefits, but cannot offer long term benefits to the regional economy. If a SMUD investment in electric facilities is made to serve the new load, but that load does not last long term (e.g. a few years), the full cost of the facilities may not be adequately recovered, resulting in a cost shift to other SMUD customers.
Changes to Rules and Regulations 84
Staff also recommends clarifying Section V to specify that the per kW offset is available only for new load and/or service upgrade portion for service at secondary voltage.
Bill Impact
None.
Revenue Impact
The recommended changes will reduce the revenue impact by providing the per kW offset only to projects that will stimulate the local economy long-term.
Recommendation
Effective June 25, 2019, modify Section V of Rule and Regulation 16, as follows:
V. Fee Offset – SMUD Cost for Distribution Systems
The developer of a non-residential development with an estimated new diversified load demand of at least 300kW, as determined by SMUD, may be is eligible for certain offsets of costs in accordance with the following specifications:
a. Based on Section IV(D), SMUD will supply, install, own, and maintain all conductors, transformers, and related equipment for the secondary and primary distribution system.
b. SMUD will apply a Per kW Offset Amount to offset the developer Cost for the SMUD-installed facilities and distribution system.
c. The estimated kW demand for the Per kW Offset Amount will be determined by SMUD based on diversified load.
d. The developer furnished and installed underground duct system (including necessary conduits, ducts, manholes, vaults, equipment, pads, and concrete encasement of conduit where required), are not eligible for the Per kW Offset Amount.
e. The developer will not receive an Per kW oOffset Amount of not more than 100% of the SMUD total cost, minus the nonrefundable design fee, for the SMUD-installed facilities and distribution system.
f. The Per kW Offset Amount is determined by SMUD annually based on system impact and budget.
g. The developer will not receive the Per kW Offset Amount for service at primary or subtransmission voltage, as defined under SMUD service voltages.
h. SMUD reserves the right to not offer the Per kW Offset Amount for public infrastructure projects that it deems, in its sole discretion, do not stimulate the regional economy long term.
i. SMUD reserves the right to not offer the Per kW Offset Amount to developers for projects that it deems, in its sole discretion, will not provide sufficient retail revenue to recover the Per kW Offset Amount within 5 years.
Changes to Rules and Regulations 85
j. On service upgrades, the Per kW Offset is determined by the net new load amount after diversification.
k. Rule 2 special facility projects are not eligible for the Per kW Offset.
Revisions described above are detailed in Rule and Regulation 16 included in Volume 2 of this Report.
Rule 21 – Interconnection Requirements Purpose
SMUD customers that have a generation or storage resource at their premises interconnect to SMUD’s distribution grid under Rule 21, which establishes requirements for customers interconnecting and operating any customer-sited resources. Rule 21 applies not just to NEM customers, but also non-NEM customers, and to any resource regardless of technology type. To ensure adequate recovery of SMUD’s fixed costs and that interconnected customers (including NEM customers) pay their fair share of costs, staff proposes adoption of a Grid Access Charge in $/kW to apply to any customer generating facility, except those customers grandfathered under NEM1. This charge is also discussed in the NEM section of this Report where, there, it is proposed to adopt a specific Grid Access Charge for solar NEM resources only. Accordingly, updates to Rule 21 are necessary to ensure that all interconnection customers with self-generation are billed the Grid Access Charge.
Staff recommends implementing a Grid Access Charge for all interconnecting customers with a generating resource, both residential and commercial effective January 1, 2020. The Grid Access Charge will vary by rate category and service voltage level and will be applied based on the size of the generating system (CEC-AC for solar facilities). Storage-only resources are not billed the charge; however, a customer with storage and generation resources will be assessed the Grid Access Charge based on the size and technology of the generation resource (not storage). Applying the Grid Access Charge on a resource-specific basis establishes an appropriate price signal to customers for their use of the SMUD grid and ensures SMUD is technology agnostic. This methodology will ensure equity between customers and recovery of SMUD’s fixed grid costs.
To determine the applicable Grid Access Charge for a customer interconnecting a generating facility, staff proposes to use the unbundled $/kWh non-bypassable components by rate class and voltage level, and apply this to the customer’s generating technology attributes (i.e. capacity factor), to calculate the appropriate Grid Access Charge. The non-bypassable cost components by rate class and voltage level, shown with the proposed rate increases, are included in Tables 35, 36, 37 and 38 below. Specifically, the Grid Access Charge is calculated based on a methodology using the non-bypassable cost component ($/kWh) times the system size (CEC – AC kW) times the capacity factory of the generation resource times the number of hours per year (8,760), as shown in the formula below:
Non-bypassable cost component x kW x capacity factor x 8,760 = Annual Charge
Annual Charge / 12 billing cycles = Grid Access Charge
SMUD staff recommends the Board adopt the unbundled $/kWh non-bypassable cost components in Tables 35, 36, 37 and 38 and the methodology used to determine the Grid Access Charge for any interconnected generating resource.
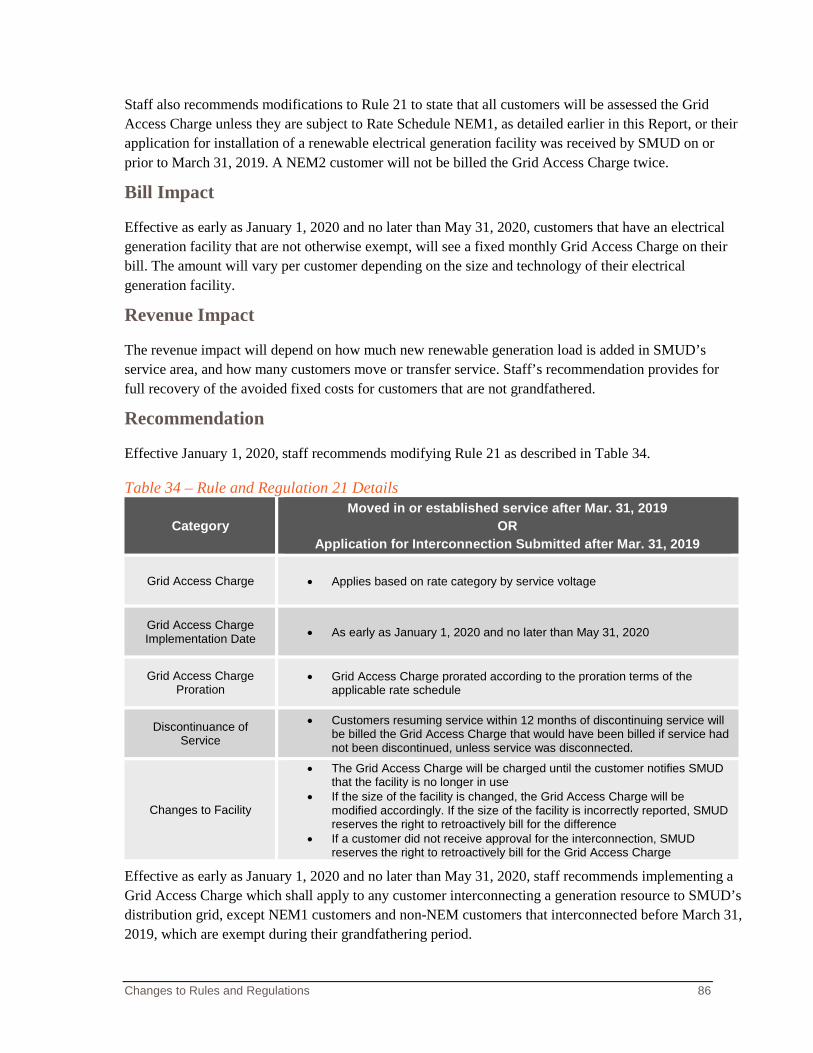
Changes to Rules and Regulations 86
Staff also recommends modifications to Rule 21 to state that all customers will be assessed the Grid Access Charge unless they are subject to Rate Schedule NEM1, as detailed earlier in this Report, or their application for installation of a renewable electrical generation facility was received by SMUD on or prior to March 31, 2019. A NEM2 customer will not be billed the Grid Access Charge twice.
Bill Impact
Effective as early as January 1, 2020 and no later than May 31, 2020, customers that have an electrical generation facility that are not otherwise exempt, will see a fixed monthly Grid Access Charge on their bill. The amount will vary per customer depending on the size and technology of their electrical generation facility.
Revenue Impact
The revenue impact will depend on how much new renewable generation load is added in SMUD’s service area, and how many customers move or transfer service. Staff’s recommendation provides for full recovery of the avoided fixed costs for customers that are not grandfathered.
Recommendation
Effective January 1, 2020, staff recommends modifying Rule 21 as described in Table 34.
Table 34 – Rule and Regulation 21 Details
Category Moved in or established service after Mar. 31, 2019
OR Application for Interconnection Submitted after Mar. 31, 2019
Grid Access Charge • Applies based on rate category by service voltage
Grid Access Charge Implementation Date • As early as January 1, 2020 and no later than May 31, 2020
Grid Access Charge Proration
• Grid Access Charge prorated according to the proration terms of the applicable rate schedule
Discontinuance of Service
• Customers resuming service within 12 months of discontinuing service will be billed the Grid Access Charge that would have been billed if service had not been discontinued, unless service was disconnected.
Changes to Facility
• The Grid Access Charge will be charged until the customer notifies SMUD that the facility is no longer in use
• If the size of the facility is changed, the Grid Access Charge will be modified accordingly. If the size of the facility is incorrectly reported, SMUD reserves the right to retroactively bill for the difference
• If a customer did not receive approval for the interconnection, SMUD reserves the right to retroactively bill for the Grid Access Charge
Effective as early as January 1, 2020 and no later than May 31, 2020, staff recommends implementing a Grid Access Charge which shall apply to any customer interconnecting a generation resource to SMUD’s distribution grid, except NEM1 customers and non-NEM customers that interconnected before March 31, 2019, which are exempt during their grandfathering period.
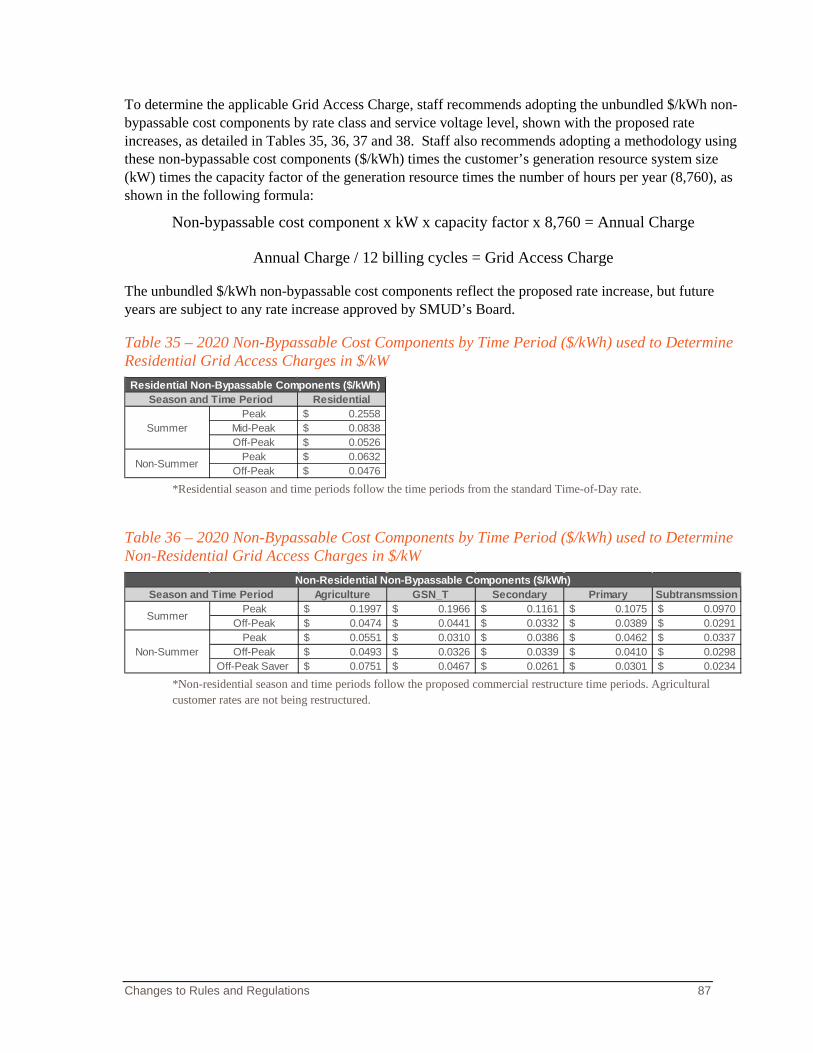
Changes to Rules and Regulations 87
To determine the applicable Grid Access Charge, staff recommends adopting the unbundled $/kWh non-bypassable cost components by rate class and service voltage level, shown with the proposed rate increases, as detailed in Tables 35, 36, 37 and 38. Staff also recommends adopting a methodology using these non-bypassable cost components ($/kWh) times the customer’s generation resource system size (kW) times the capacity factor of the generation resource times the number of hours per year (8,760), as shown in the following formula:
Non-bypassable cost component x kW x capacity factor x 8,760 = Annual Charge
Annual Charge / 12 billing cycles = Grid Access Charge
The unbundled $/kWh non-bypassable cost components reflect the proposed rate increase, but future years are subject to any rate increase approved by SMUD’s Board.
Table 35 – 2020 Non-Bypassable Cost Components by Time Period ($/kWh) used to Determine Residential Grid Access Charges in $/kW
*Residential season and time periods follow the time periods from the standard Time-of-Day rate.
Table 36 – 2020 Non-Bypassable Cost Components by Time Period ($/kWh) used to Determine Non-Residential Grid Access Charges in $/kW
*Non-residential season and time periods follow the proposed commercial restructure time periods. Agricultural customer rates are not being restructured.
Residential Peak 0.2558$
Mid-Peak 0.0838$ Off-Peak 0.0526$
Peak 0.0632$ Off-Peak 0.0476$
Residential Non-Bypassable Components ($/kWh)Season and Time Period
Summer
Non-Summer
Agriculture GSN_T Secondary Primary SubtransmssionPeak 0.1997$ 0.1966$ 0.1161$ 0.1075$ 0.0970$
Off-Peak 0.0474$ 0.0441$ 0.0332$ 0.0389$ 0.0291$ Peak 0.0551$ 0.0310$ 0.0386$ 0.0462$ 0.0337$
Off-Peak 0.0493$ 0.0326$ 0.0339$ 0.0410$ 0.0298$ Off-Peak Saver 0.0751$ 0.0467$ 0.0261$ 0.0301$ 0.0234$
Season and Time Period
Summer
Non-Summer
Non-Residential Non-Bypassable Components ($/kWh)
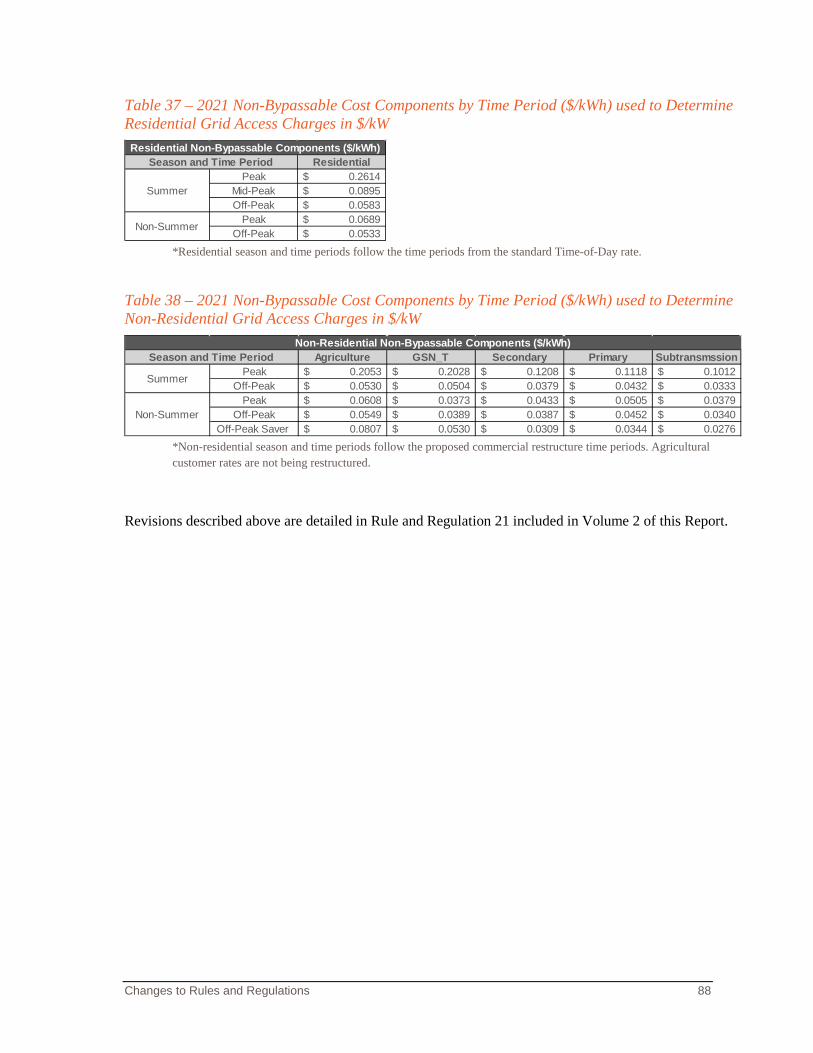
Changes to Rules and Regulations 88
Table 37 – 2021 Non-Bypassable Cost Components by Time Period ($/kWh) used to Determine Residential Grid Access Charges in $/kW
*Residential season and time periods follow the time periods from the standard Time-of-Day rate.
Table 38 – 2021 Non-Bypassable Cost Components by Time Period ($/kWh) used to Determine Non-Residential Grid Access Charges in $/kW
*Non-residential season and time periods follow the proposed commercial restructure time periods. Agricultural customer rates are not being restructured.
Revisions described above are detailed in Rule and Regulation 21 included in Volume 2 of this Report.
Residential Peak 0.2614$
Mid-Peak 0.0895$ Off-Peak 0.0583$
Peak 0.0689$ Off-Peak 0.0533$
Summer
Non-Summer
Residential Non-Bypassable Components ($/kWh)Season and Time Period
Agriculture GSN_T Secondary Primary SubtransmssionPeak 0.2053$ 0.2028$ 0.1208$ 0.1118$ 0.1012$
Off-Peak 0.0530$ 0.0504$ 0.0379$ 0.0432$ 0.0333$ Peak 0.0608$ 0.0373$ 0.0433$ 0.0505$ 0.0379$
Off-Peak 0.0549$ 0.0389$ 0.0387$ 0.0452$ 0.0340$ Off-Peak Saver 0.0807$ 0.0530$ 0.0309$ 0.0344$ 0.0276$
Non-Summer
Non-Residential Non-Bypassable Components ($/kWh)Season and Time Period
Summer
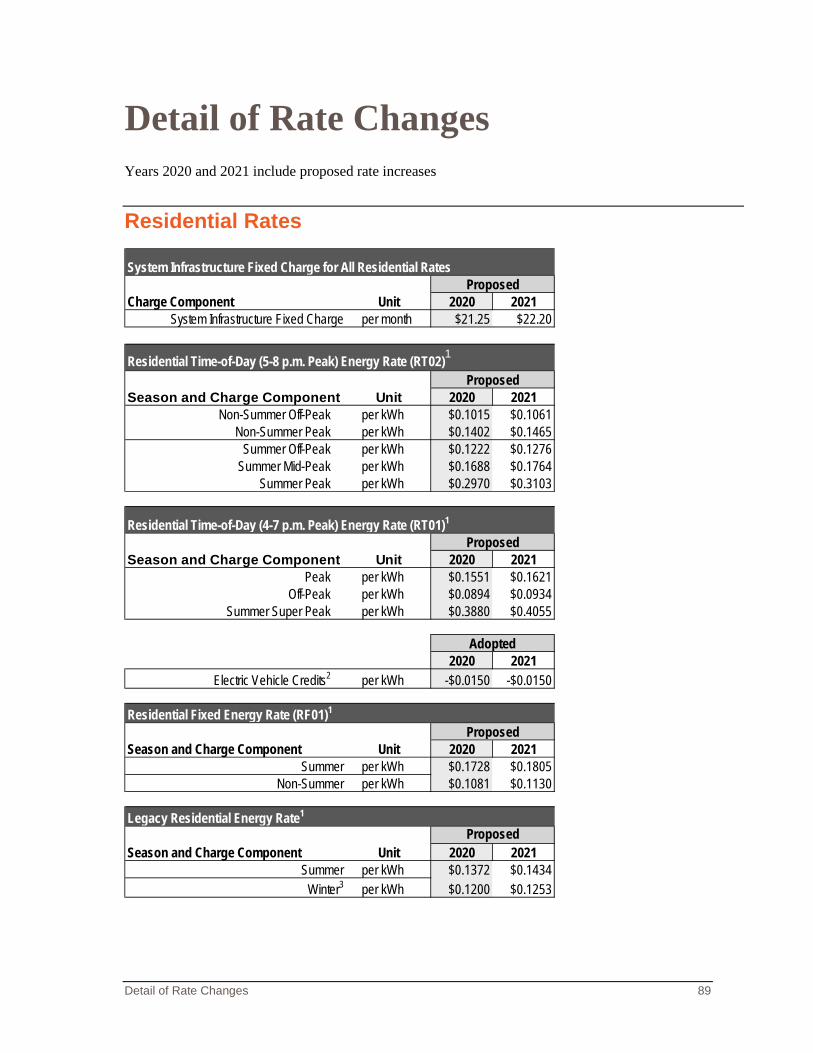
Detail of Rate Changes 89
Detail of Rate Changes Years 2020 and 2021 include proposed rate increases
Residential Rates
Charge Component Unit 2020 2021System Infrastructure Fixed Charge per month $21.25 $22.20
Season and Charge Component Unit 2020 2021Non-Summer Off-Peak per kWh $0.1015 $0.1061
Non-Summer Peak per kWh $0.1402 $0.1465Summer Off-Peak per kWh $0.1222 $0.1276
Summer Mid-Peak per kWh $0.1688 $0.1764Summer Peak per kWh $0.2970 $0.3103
Season and Charge Component Unit 2020 2021Peak per kWh $0.1551 $0.1621
Off-Peak per kWh $0.0894 $0.0934Summer Super Peak per kWh $0.3880 $0.4055
2020 2021Electric Vehicle Credits2 per kWh -$0.0150 -$0.0150
Season and Charge Component Unit 2020 2021Summer per kWh $0.1728 $0.1805
Non-Summer per kWh $0.1081 $0.1130
Season and Charge Component Unit 2020 2021Summer per kWh $0.1372 $0.1434
Winter3 per kWh $0.1200 $0.1253
ProposedLegacy Residential Energy Rate1
Proposed
Proposed
System Infrastructure Fixed Charge for All Residential Rates
Residential Time-of-Day (4-7 p.m. Peak) Energy Rate (RT01)1
Proposed
ProposedResidential Fixed Energy Rate (RF01)1
Adopted
Residential Time-of-Day (5-8 p.m. Peak) Energy Rate (RT02)1
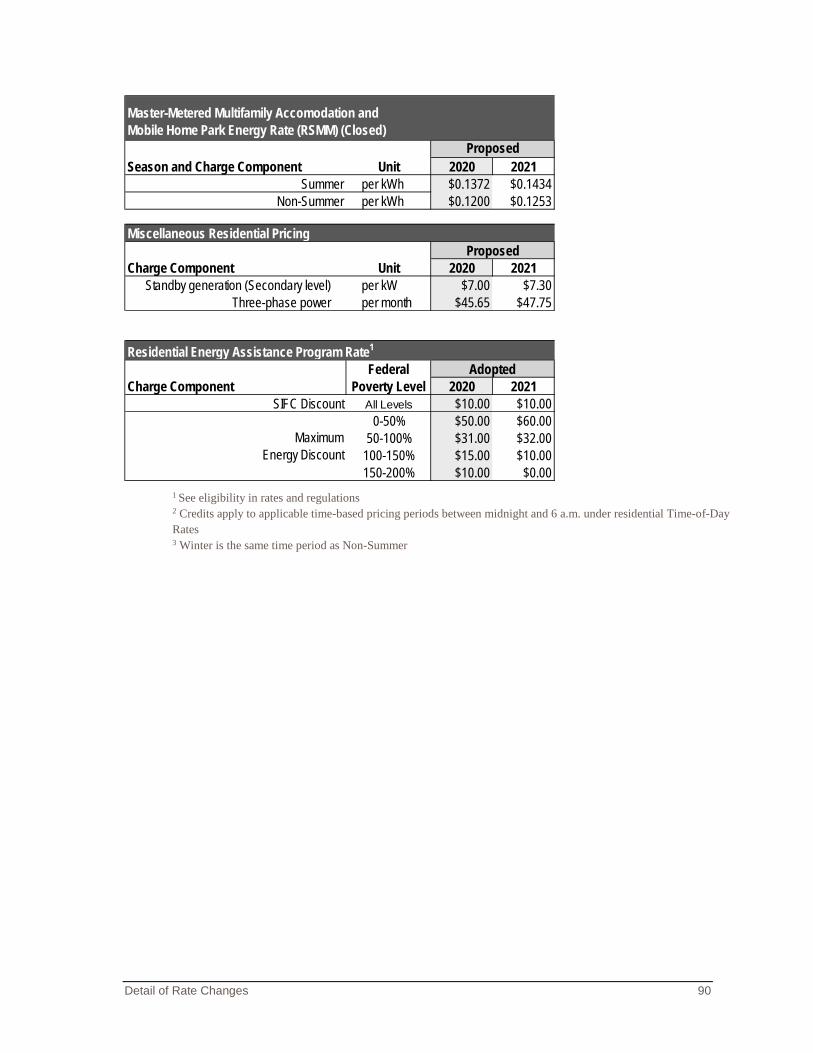
Detail of Rate Changes 90
1 See eligibility in rates and regulations 2 Credits apply to applicable time-based pricing periods between midnight and 6 a.m. under residential Time-of-Day Rates 3 Winter is the same time period as Non-Summer
Season and Charge Component Unit 2020 2021Summer per kWh $0.1372 $0.1434
Non-Summer per kWh $0.1200 $0.1253
Charge Component Unit 2020 2021Standby generation (Secondary level) per kW $7.00 $7.30
Three-phase power per month $45.65 $47.75
Charge Component 2020 2021SIFC Discount All Levels $10.00 $10.00
0-50% $50.00 $60.0050-100% $31.00 $32.00
100-150% $15.00 $10.00150-200% $10.00 $0.00
Federal Poverty Level
Proposed
Maximum Energy Discount
Master-Metered Multifamily Accomodation and Mobile Home Park Energy Rate (RSMM) (Closed)
Proposed
AdoptedResidential Energy Assistance Program Rate1
Miscellaneous Residential Pricing
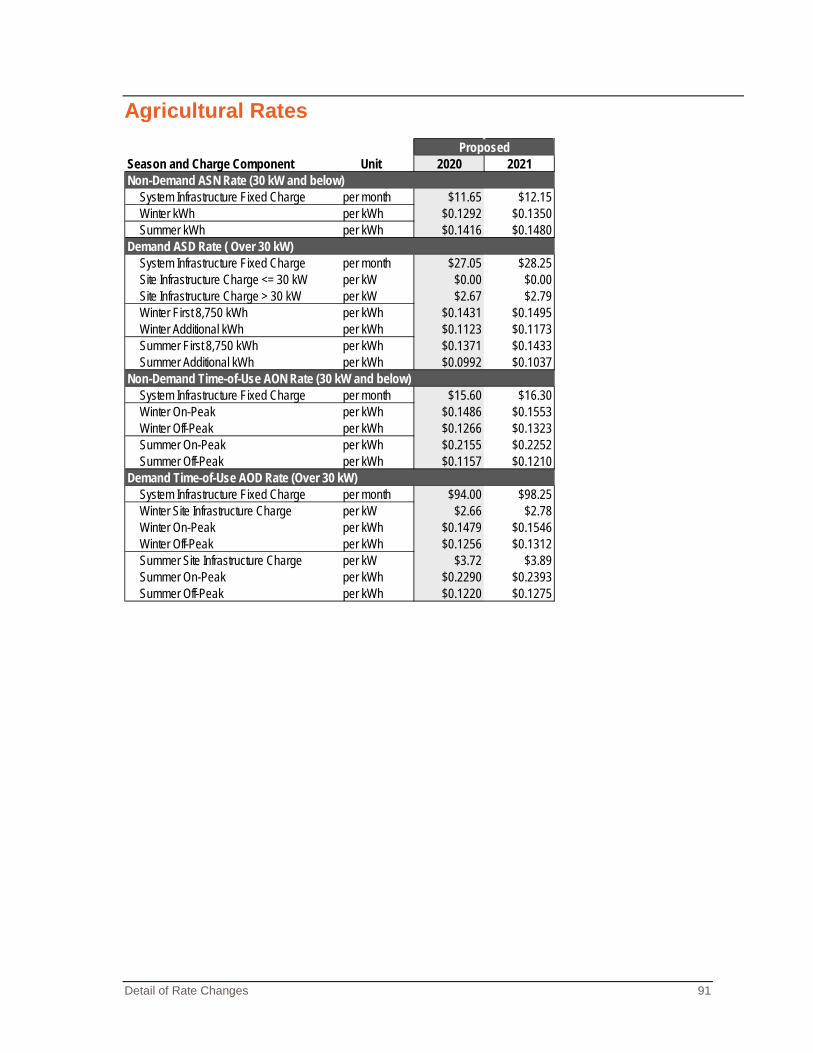
Detail of Rate Changes 91
Agricultural Rates
Season and Charge Component Unit 2020 2021
System Infrastructure Fixed Charge per month $11.65 $12.15Winter kWh per kWh $0.1292 $0.1350Summer kWh per kWh $0.1416 $0.1480
System Infrastructure Fixed Charge per month $27.05 $28.25Site Infrastructure Charge <= 30 kW per kW $0.00 $0.00Site Infrastructure Charge > 30 kW per kW $2.67 $2.79Winter First 8,750 kWh per kWh $0.1431 $0.1495Winter Additional kWh per kWh $0.1123 $0.1173Summer First 8,750 kWh per kWh $0.1371 $0.1433Summer Additional kWh per kWh $0.0992 $0.1037
System Infrastructure Fixed Charge per month $15.60 $16.30Winter On-Peak per kWh $0.1486 $0.1553Winter Off-Peak per kWh $0.1266 $0.1323Summer On-Peak per kWh $0.2155 $0.2252Summer Off-Peak per kWh $0.1157 $0.1210
System Infrastructure Fixed Charge per month $94.00 $98.25Winter Site Infrastructure Charge per kW $2.66 $2.78Winter On-Peak per kWh $0.1479 $0.1546Winter Off-Peak per kWh $0.1256 $0.1312Summer Site Infrastructure Charge per kW $3.72 $3.89Summer On-Peak per kWh $0.2290 $0.2393Summer Off-Peak per kWh $0.1220 $0.1275
Non-Demand Time-of-Use AON Rate (30 kW and below)
Demand Time-of-Use AOD Rate (Over 30 kW)
Proposed
Non-Demand ASN Rate (30 kW and below)
Demand ASD Rate ( Over 30 kW)
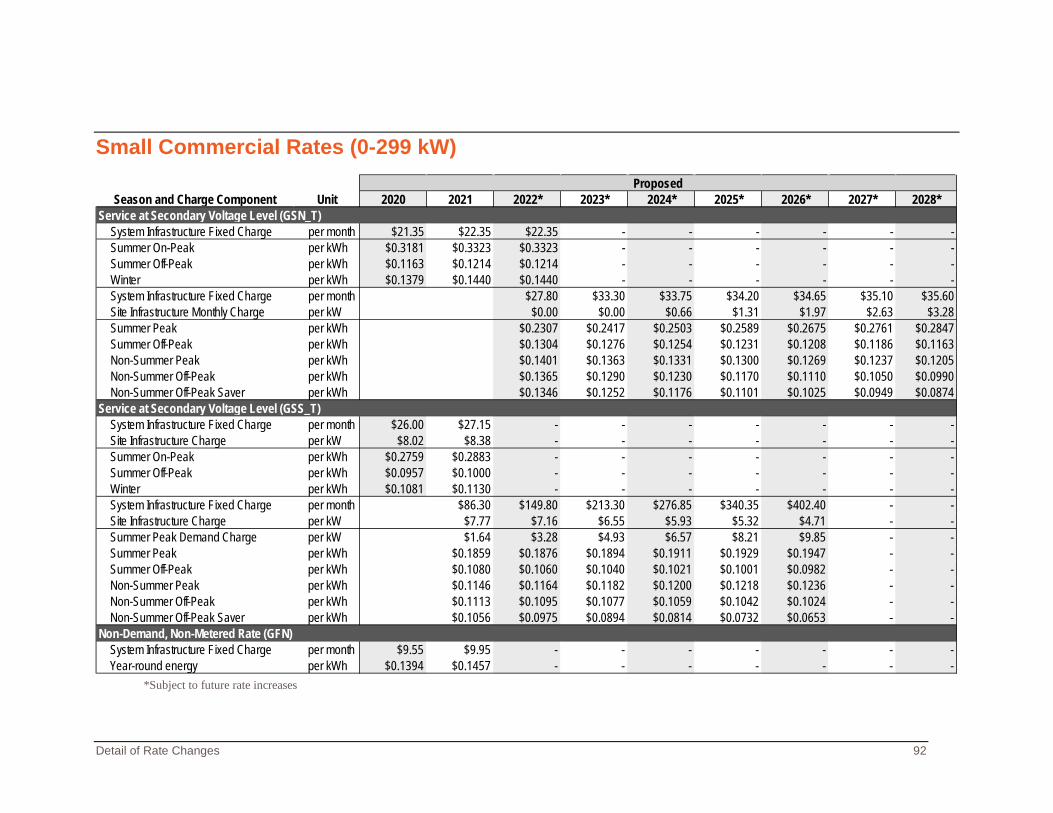
Detail of Rate Changes 92
Small Commercial Rates (0-299 kW)
*Subject to future rate increases
2020 2021 2022* 2023* 2024* 2025* 2026* 2027* 2028*
System Infrastructure Fixed Charge per month $21.35 $22.35 $22.35 - - - - - -Summer On-Peak per kWh $0.3181 $0.3323 $0.3323 - - - - - -Summer Off-Peak per kWh $0.1163 $0.1214 $0.1214 - - - - - -Winter per kWh $0.1379 $0.1440 $0.1440 - - - - - -System Infrastructure Fixed Charge per month $27.80 $33.30 $33.75 $34.20 $34.65 $35.10 $35.60Site Infrastructure Monthly Charge per kW $0.00 $0.00 $0.66 $1.31 $1.97 $2.63 $3.28Summer Peak per kWh $0.2307 $0.2417 $0.2503 $0.2589 $0.2675 $0.2761 $0.2847Summer Off-Peak per kWh $0.1304 $0.1276 $0.1254 $0.1231 $0.1208 $0.1186 $0.1163Non-Summer Peak per kWh $0.1401 $0.1363 $0.1331 $0.1300 $0.1269 $0.1237 $0.1205Non-Summer Off-Peak per kWh $0.1365 $0.1290 $0.1230 $0.1170 $0.1110 $0.1050 $0.0990Non-Summer Off-Peak Saver per kWh $0.1346 $0.1252 $0.1176 $0.1101 $0.1025 $0.0949 $0.0874
System Infrastructure Fixed Charge per month $26.00 $27.15 - - - - - - -Site Infrastructure Charge per kW $8.02 $8.38 - - - - - - -Summer On-Peak per kWh $0.2759 $0.2883 - - - - - - -Summer Off-Peak per kWh $0.0957 $0.1000 - - - - - - -Winter per kWh $0.1081 $0.1130 - - - - - - -System Infrastructure Fixed Charge per month $86.30 $149.80 $213.30 $276.85 $340.35 $402.40 - -Site Infrastructure Charge per kW $7.77 $7.16 $6.55 $5.93 $5.32 $4.71 - -Summer Peak Demand Charge per kW $1.64 $3.28 $4.93 $6.57 $8.21 $9.85 - -Summer Peak per kWh $0.1859 $0.1876 $0.1894 $0.1911 $0.1929 $0.1947 - -Summer Off-Peak per kWh $0.1080 $0.1060 $0.1040 $0.1021 $0.1001 $0.0982 - -Non-Summer Peak per kWh $0.1146 $0.1164 $0.1182 $0.1200 $0.1218 $0.1236 - -Non-Summer Off-Peak per kWh $0.1113 $0.1095 $0.1077 $0.1059 $0.1042 $0.1024 - -Non-Summer Off-Peak Saver per kWh $0.1056 $0.0975 $0.0894 $0.0814 $0.0732 $0.0653 - -
System Infrastructure Fixed Charge per month $9.55 $9.95 - - - - - - -Year-round energy per kWh $0.1394 $0.1457 - - - - - - -
ProposedSeason and Charge Component Unit
Service at Secondary Voltage Level (GSN_T)
Service at Secondary Voltage Level (GSS_T)
Non-Demand, Non-Metered Rate (GFN)
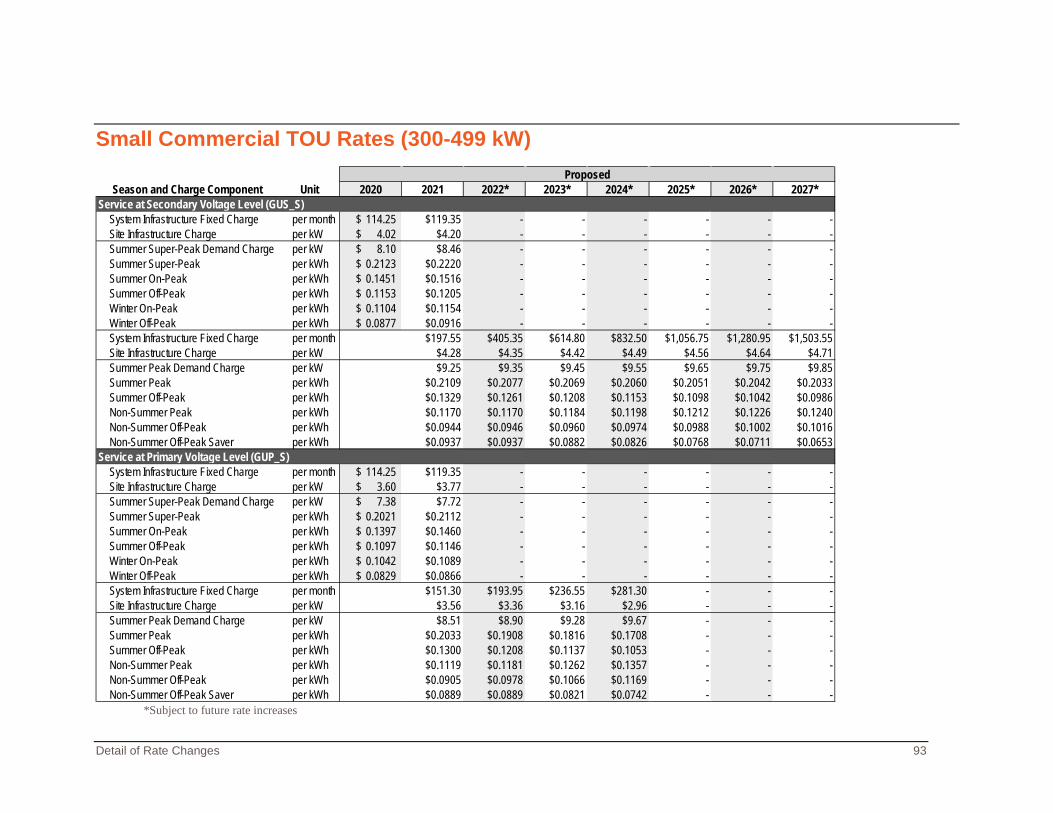
Detail of Rate Changes 93
Small Commercial TOU Rates (300-499 kW)
*Subject to future rate increases
2020 2021 2022* 2023* 2024* 2025* 2026* 2027*
System Infrastructure Fixed Charge per month 114.25$ $119.35 - - - - - -Site Infrastructure Charge per kW 4.02$ $4.20 - - - - - -Summer Super-Peak Demand Charge per kW 8.10$ $8.46 - - - - - -Summer Super-Peak per kWh 0.2123$ $0.2220 - - - - - -Summer On-Peak per kWh 0.1451$ $0.1516 - - - - - -Summer Off-Peak per kWh 0.1153$ $0.1205 - - - - - -Winter On-Peak per kWh 0.1104$ $0.1154 - - - - - -Winter Off-Peak per kWh 0.0877$ $0.0916 - - - - - -System Infrastructure Fixed Charge per month $197.55 $405.35 $614.80 $832.50 $1,056.75 $1,280.95 $1,503.55Site Infrastructure Charge per kW $4.28 $4.35 $4.42 $4.49 $4.56 $4.64 $4.71Summer Peak Demand Charge per kW $9.25 $9.35 $9.45 $9.55 $9.65 $9.75 $9.85Summer Peak per kWh $0.2109 $0.2077 $0.2069 $0.2060 $0.2051 $0.2042 $0.2033Summer Off-Peak per kWh $0.1329 $0.1261 $0.1208 $0.1153 $0.1098 $0.1042 $0.0986Non-Summer Peak per kWh $0.1170 $0.1170 $0.1184 $0.1198 $0.1212 $0.1226 $0.1240Non-Summer Off-Peak per kWh $0.0944 $0.0946 $0.0960 $0.0974 $0.0988 $0.1002 $0.1016Non-Summer Off-Peak Saver per kWh $0.0937 $0.0937 $0.0882 $0.0826 $0.0768 $0.0711 $0.0653
System Infrastructure Fixed Charge per month 114.25$ $119.35 - - - - - -Site Infrastructure Charge per kW 3.60$ $3.77 - - - - - -Summer Super-Peak Demand Charge per kW 7.38$ $7.72 - - - - - -Summer Super-Peak per kWh 0.2021$ $0.2112 - - - - - -Summer On-Peak per kWh 0.1397$ $0.1460 - - - - - -Summer Off-Peak per kWh 0.1097$ $0.1146 - - - - - -Winter On-Peak per kWh 0.1042$ $0.1089 - - - - - -Winter Off-Peak per kWh 0.0829$ $0.0866 - - - - - -System Infrastructure Fixed Charge per month $151.30 $193.95 $236.55 $281.30 - - -Site Infrastructure Charge per kW $3.56 $3.36 $3.16 $2.96 - - -Summer Peak Demand Charge per kW $8.51 $8.90 $9.28 $9.67 - - -Summer Peak per kWh $0.2033 $0.1908 $0.1816 $0.1708 - - -Summer Off-Peak per kWh $0.1300 $0.1208 $0.1137 $0.1053 - - -Non-Summer Peak per kWh $0.1119 $0.1181 $0.1262 $0.1357 - - -Non-Summer Off-Peak per kWh $0.0905 $0.0978 $0.1066 $0.1169 - - -Non-Summer Off-Peak Saver per kWh $0.0889 $0.0889 $0.0821 $0.0742 - - -
ProposedSeason and Charge Component Unit
Service at Secondary Voltage Level (GUS_S)
Service at Primary Voltage Level (GUP_S)
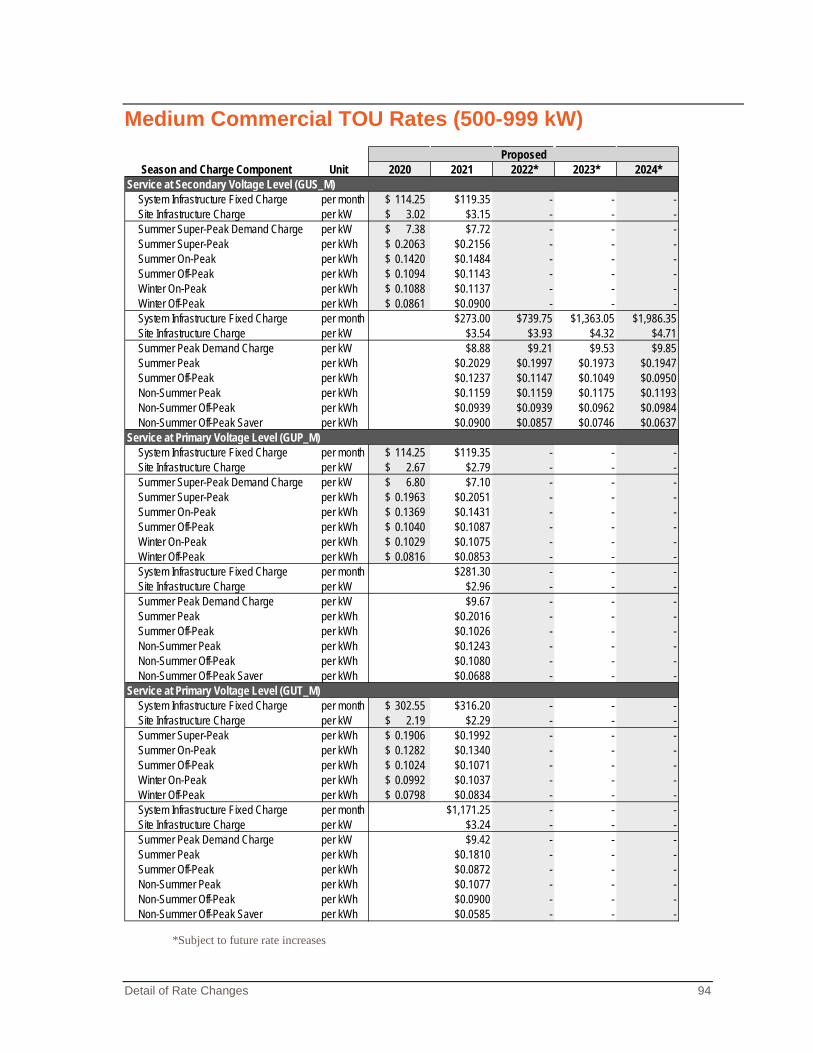
Detail of Rate Changes 94
Medium Commercial TOU Rates (500-999 kW)
*Subject to future rate increases
2020 2021 2022* 2023* 2024*
System Infrastructure Fixed Charge per month 114.25$ $119.35 - - -Site Infrastructure Charge per kW 3.02$ $3.15 - - -Summer Super-Peak Demand Charge per kW 7.38$ $7.72 - - -Summer Super-Peak per kWh 0.2063$ $0.2156 - - -Summer On-Peak per kWh 0.1420$ $0.1484 - - -Summer Off-Peak per kWh 0.1094$ $0.1143 - - -Winter On-Peak per kWh 0.1088$ $0.1137 - - -Winter Off-Peak per kWh 0.0861$ $0.0900 - - -System Infrastructure Fixed Charge per month $273.00 $739.75 $1,363.05 $1,986.35Site Infrastructure Charge per kW $3.54 $3.93 $4.32 $4.71Summer Peak Demand Charge per kW $8.88 $9.21 $9.53 $9.85Summer Peak per kWh $0.2029 $0.1997 $0.1973 $0.1947Summer Off-Peak per kWh $0.1237 $0.1147 $0.1049 $0.0950Non-Summer Peak per kWh $0.1159 $0.1159 $0.1175 $0.1193Non-Summer Off-Peak per kWh $0.0939 $0.0939 $0.0962 $0.0984Non-Summer Off-Peak Saver per kWh $0.0900 $0.0857 $0.0746 $0.0637
System Infrastructure Fixed Charge per month 114.25$ $119.35 - - -Site Infrastructure Charge per kW 2.67$ $2.79 - - -Summer Super-Peak Demand Charge per kW 6.80$ $7.10 - - -Summer Super-Peak per kWh 0.1963$ $0.2051 - - -Summer On-Peak per kWh 0.1369$ $0.1431 - - -Summer Off-Peak per kWh 0.1040$ $0.1087 - - -Winter On-Peak per kWh 0.1029$ $0.1075 - - -Winter Off-Peak per kWh 0.0816$ $0.0853 - - -System Infrastructure Fixed Charge per month $281.30 - - -Site Infrastructure Charge per kW $2.96 - - -Summer Peak Demand Charge per kW $9.67 - - -Summer Peak per kWh $0.2016 - - -Summer Off-Peak per kWh $0.1026 - - -Non-Summer Peak per kWh $0.1243 - - -Non-Summer Off-Peak per kWh $0.1080 - - -Non-Summer Off-Peak Saver per kWh $0.0688 - - -
System Infrastructure Fixed Charge per month 302.55$ $316.20 - - -Site Infrastructure Charge per kW 2.19$ $2.29 - - -Summer Super-Peak per kWh 0.1906$ $0.1992 - - -Summer On-Peak per kWh 0.1282$ $0.1340 - - -Summer Off-Peak per kWh 0.1024$ $0.1071 - - -Winter On-Peak per kWh 0.0992$ $0.1037 - - -Winter Off-Peak per kWh 0.0798$ $0.0834 - - -System Infrastructure Fixed Charge per month $1,171.25 - - -Site Infrastructure Charge per kW $3.24 - - -Summer Peak Demand Charge per kW $9.42 - - -Summer Peak per kWh $0.1810 - - -Summer Off-Peak per kWh $0.0872 - - -Non-Summer Peak per kWh $0.1077 - - -Non-Summer Off-Peak per kWh $0.0900 - - -Non-Summer Off-Peak Saver per kWh $0.0585 - - -
Season and Charge Component UnitProposed
Service at Secondary Voltage Level (GUS_M)
Service at Primary Voltage Level (GUP_M)
Service at Primary Voltage Level (GUT_M)
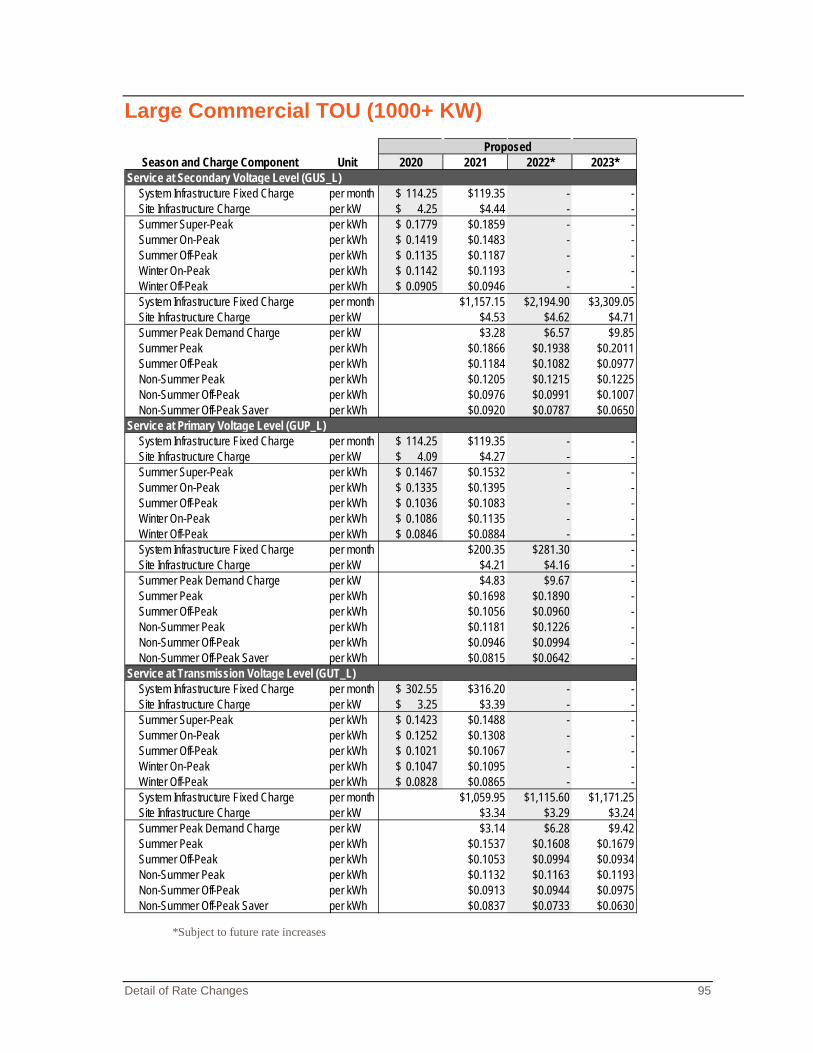
Detail of Rate Changes 95
Large Commercial TOU (1000+ KW)
*Subject to future rate increases
2020 2021 2022* 2023*
System Infrastructure Fixed Charge per month 114.25$ $119.35 - -Site Infrastructure Charge per kW 4.25$ $4.44 - -Summer Super-Peak per kWh 0.1779$ $0.1859 - -Summer On-Peak per kWh 0.1419$ $0.1483 - -Summer Off-Peak per kWh 0.1135$ $0.1187 - -Winter On-Peak per kWh 0.1142$ $0.1193 - -Winter Off-Peak per kWh 0.0905$ $0.0946 - -System Infrastructure Fixed Charge per month $1,157.15 $2,194.90 $3,309.05Site Infrastructure Charge per kW $4.53 $4.62 $4.71Summer Peak Demand Charge per kW $3.28 $6.57 $9.85Summer Peak per kWh $0.1866 $0.1938 $0.2011Summer Off-Peak per kWh $0.1184 $0.1082 $0.0977Non-Summer Peak per kWh $0.1205 $0.1215 $0.1225Non-Summer Off-Peak per kWh $0.0976 $0.0991 $0.1007Non-Summer Off-Peak Saver per kWh $0.0920 $0.0787 $0.0650
System Infrastructure Fixed Charge per month 114.25$ $119.35 - -Site Infrastructure Charge per kW 4.09$ $4.27 - -Summer Super-Peak per kWh 0.1467$ $0.1532 - -Summer On-Peak per kWh 0.1335$ $0.1395 - -Summer Off-Peak per kWh 0.1036$ $0.1083 - -Winter On-Peak per kWh 0.1086$ $0.1135 - -Winter Off-Peak per kWh 0.0846$ $0.0884 - -System Infrastructure Fixed Charge per month $200.35 $281.30 -Site Infrastructure Charge per kW $4.21 $4.16 -Summer Peak Demand Charge per kW $4.83 $9.67 -Summer Peak per kWh $0.1698 $0.1890 -Summer Off-Peak per kWh $0.1056 $0.0960 -Non-Summer Peak per kWh $0.1181 $0.1226 -Non-Summer Off-Peak per kWh $0.0946 $0.0994 -Non-Summer Off-Peak Saver per kWh $0.0815 $0.0642 -
System Infrastructure Fixed Charge per month 302.55$ $316.20 - -Site Infrastructure Charge per kW 3.25$ $3.39 - -Summer Super-Peak per kWh 0.1423$ $0.1488 - -Summer On-Peak per kWh 0.1252$ $0.1308 - -Summer Off-Peak per kWh 0.1021$ $0.1067 - -Winter On-Peak per kWh 0.1047$ $0.1095 - -Winter Off-Peak per kWh 0.0828$ $0.0865 - -System Infrastructure Fixed Charge per month $1,059.95 $1,115.60 $1,171.25Site Infrastructure Charge per kW $3.34 $3.29 $3.24Summer Peak Demand Charge per kW $3.14 $6.28 $9.42Summer Peak per kWh $0.1537 $0.1608 $0.1679Summer Off-Peak per kWh $0.1053 $0.0994 $0.0934Non-Summer Peak per kWh $0.1132 $0.1163 $0.1193Non-Summer Off-Peak per kWh $0.0913 $0.0944 $0.0975Non-Summer Off-Peak Saver per kWh $0.0837 $0.0733 $0.0630
Service at Transmission Voltage Level (GUT_L)
Season and Charge Component UnitProposed
Service at Secondary Voltage Level (GUS_L)
Service at Primary Voltage Level (GUP_L)
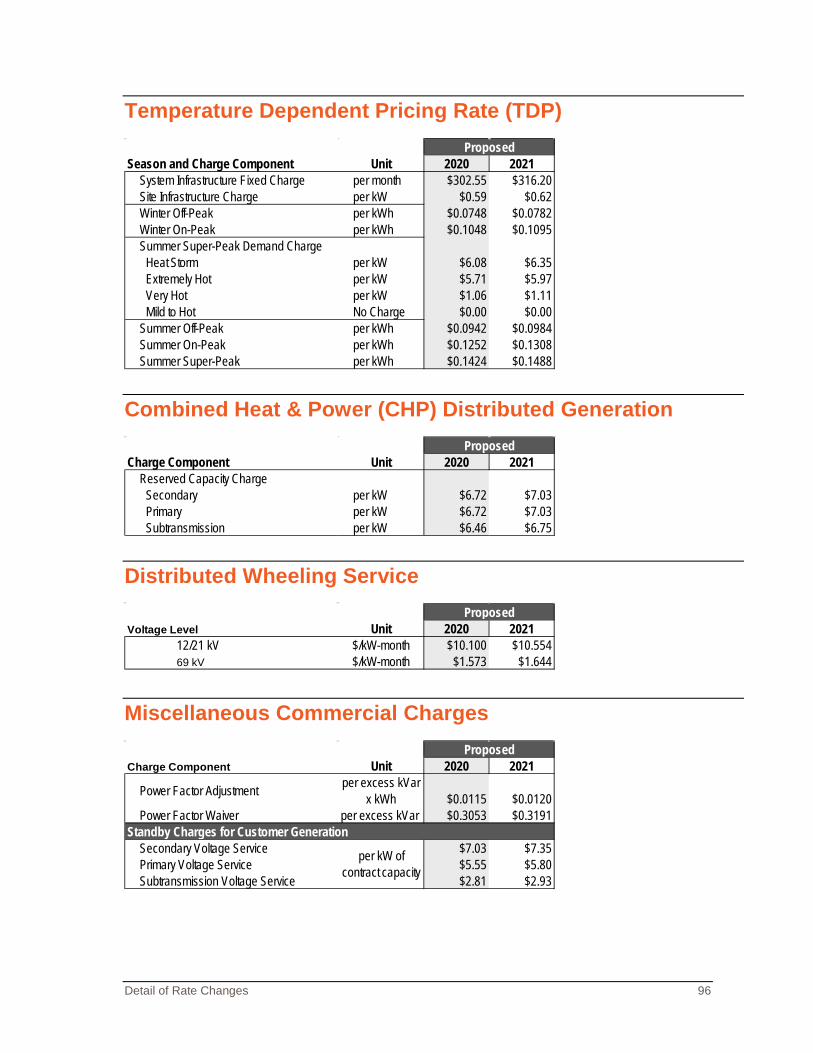
Detail of Rate Changes 96
Temperature Dependent Pricing Rate (TDP)
Combined Heat & Power (CHP) Distributed Generation
Distributed Wheeling Service
Miscellaneous Commercial Charges
Season and Charge Component Unit 2020 2021System Infrastructure Fixed Charge per month $302.55 $316.20Site Infrastructure Charge per kW $0.59 $0.62Winter Off-Peak per kWh $0.0748 $0.0782Winter On-Peak per kWh $0.1048 $0.1095Summer Super-Peak Demand Charge
Heat Storm per kW $6.08 $6.35Extremely Hot per kW $5.71 $5.97Very Hot per kW $1.06 $1.11Mild to Hot No Charge $0.00 $0.00
Summer Off-Peak per kWh $0.0942 $0.0984Summer On-Peak per kWh $0.1252 $0.1308Summer Super-Peak per kWh $0.1424 $0.1488
Proposed
Charge Component Unit 2020 2021Reserved Capacity Charge
Secondary per kW $6.72 $7.03Primary per kW $6.72 $7.03Subtransmission per kW $6.46 $6.75
Proposed
Voltage Level Unit 2020 202112/21 kV $/kW-month $10.100 $10.55469 kV $/kW-month $1.573 $1.644
Proposed
Charge Component Unit 2020 2021
Power Factor Adjustment per excess kVar x kWh $0.0115 $0.0120
Power Factor Waiver per excess kVar $0.3053 $0.3191
Secondary Voltage Service $7.03 $7.35Primary Voltage Service $5.55 $5.80Subtransmission Voltage Service $2.81 $2.93
Standby Charges for Customer Generation
Proposed
per kW of contract capacity
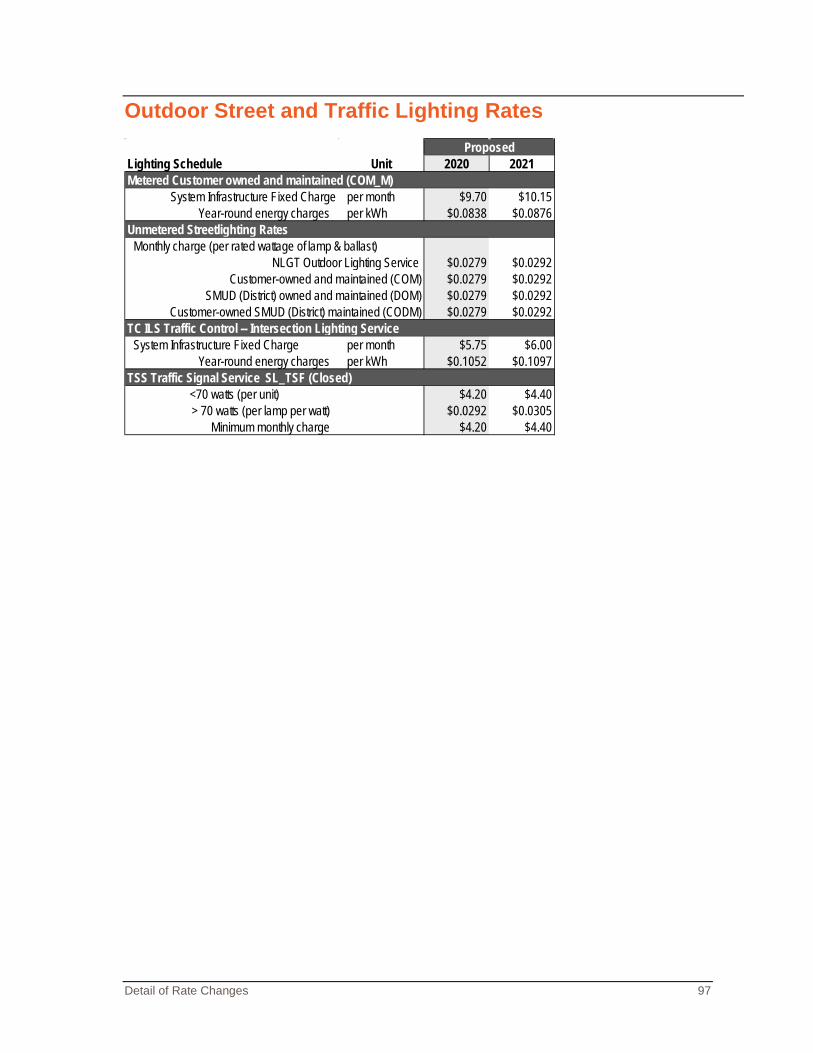
Detail of Rate Changes 97
Outdoor Street and Traffic Lighting Rates
Lighting Schedule Unit 2020 2021
System Infrastructure Fixed Charge per month $9.70 $10.15Year-round energy charges per kWh $0.0838 $0.0876
Monthly charge (per rated wattage of lamp & ballast)$0.0279 $0.0292$0.0279 $0.0292$0.0279 $0.0292$0.0279 $0.0292
System Infrastructure Fixed Charge per month $5.75 $6.00Year-round energy charges per kWh $0.1052 $0.1097
<70 watts (per unit) $4.20 $4.40> 70 watts (per lamp per watt) $0.0292 $0.0305
Minimum monthly charge $4.20 $4.40
Proposed
Metered Customer owned and maintained (COM_M)
NLGT Outdoor Lighting Service Customer-owned and maintained (COM)
Unmetered Streetlighting Rates
TC ILS Traffic Control -- Intersection Lighting Service
TSS Traffic Signal Service SL_TSF (Closed)
SMUD (District) owned and maintained (DOM)Customer-owned SMUD (District) maintained (CODM)
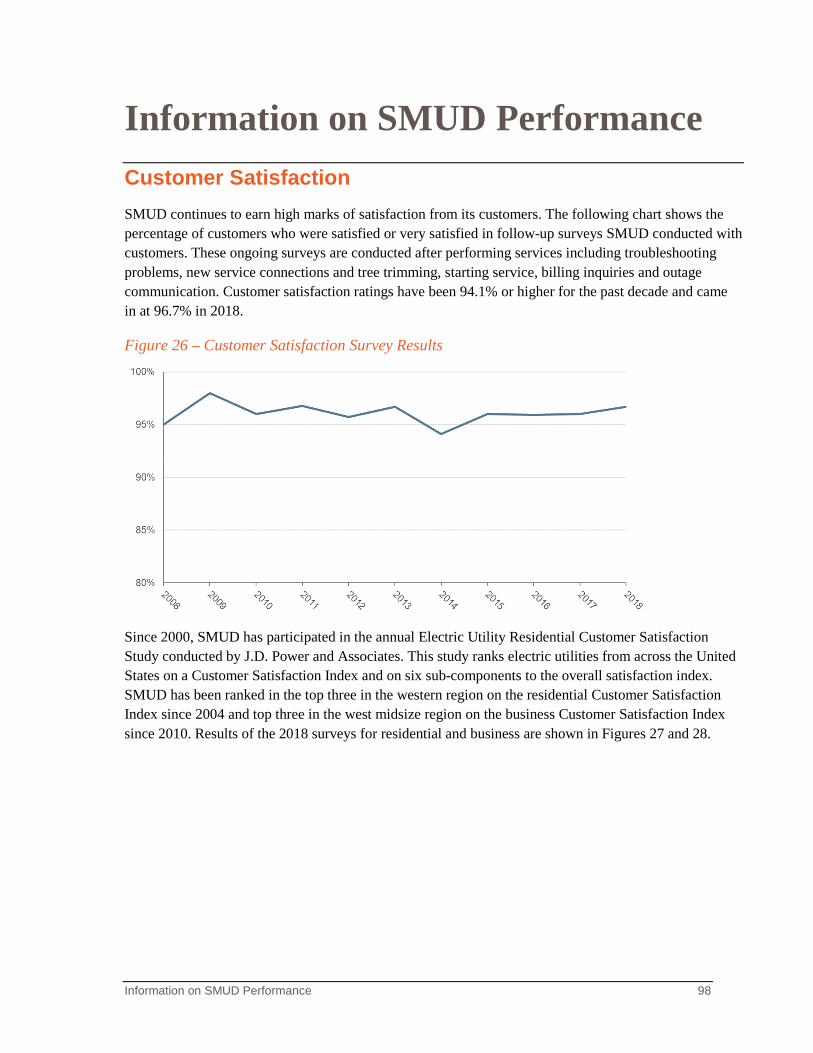
Information on SMUD Performance 98
Information on SMUD Performance Customer Satisfaction SMUD continues to earn high marks of satisfaction from its customers. The following chart shows the percentage of customers who were satisfied or very satisfied in follow-up surveys SMUD conducted with customers. These ongoing surveys are conducted after performing services including troubleshooting problems, new service connections and tree trimming, starting service, billing inquiries and outage communication. Customer satisfaction ratings have been 94.1% or higher for the past decade and came in at 96.7% in 2018.
Figure 26 – Customer Satisfaction Survey Results
Since 2000, SMUD has participated in the annual Electric Utility Residential Customer Satisfaction Study conducted by J.D. Power and Associates. This study ranks electric utilities from across the United States on a Customer Satisfaction Index and on six sub-components to the overall satisfaction index. SMUD has been ranked in the top three in the western region on the residential Customer Satisfaction Index since 2004 and top three in the west midsize region on the business Customer Satisfaction Index since 2010. Results of the 2018 surveys for residential and business are shown in Figures 27 and 28.
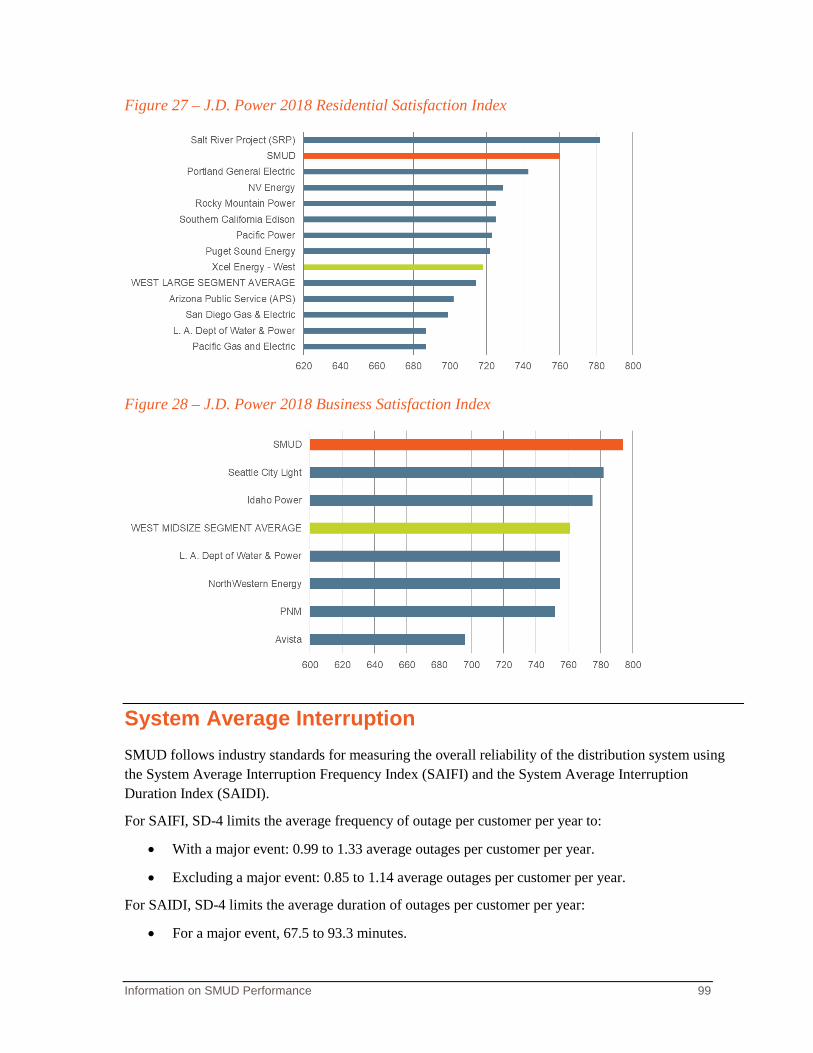
Information on SMUD Performance 99
Figure 27 – J.D. Power 2018 Residential Satisfaction Index
Figure 28 – J.D. Power 2018 Business Satisfaction Index
System Average Interruption SMUD follows industry standards for measuring the overall reliability of the distribution system using the System Average Interruption Frequency Index (SAIFI) and the System Average Interruption Duration Index (SAIDI).
For SAIFI, SD-4 limits the average frequency of outage per customer per year to:
• With a major event: 0.99 to 1.33 average outages per customer per year.
• Excluding a major event: 0.85 to 1.14 average outages per customer per year.
For SAIDI, SD-4 limits the average duration of outages per customer per year:
• For a major event, 67.5 to 93.3 minutes.
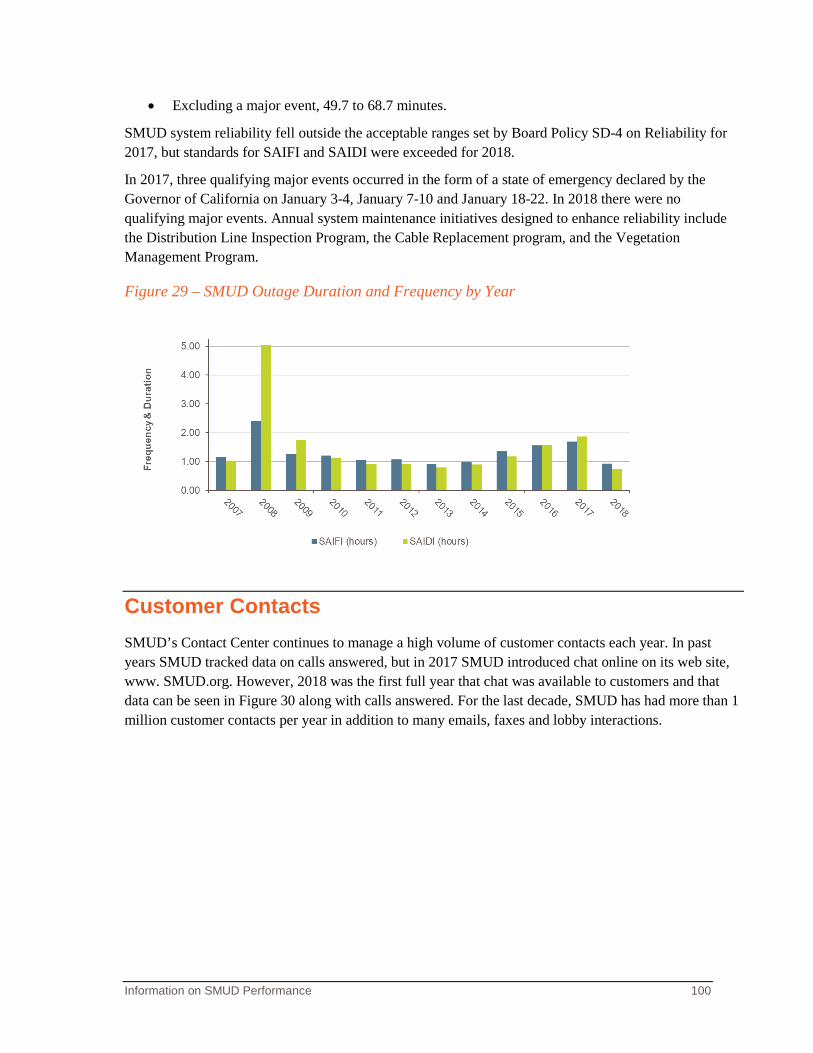
Information on SMUD Performance 100
• Excluding a major event, 49.7 to 68.7 minutes.
SMUD system reliability fell outside the acceptable ranges set by Board Policy SD-4 on Reliability for 2017, but standards for SAIFI and SAIDI were exceeded for 2018.
In 2017, three qualifying major events occurred in the form of a state of emergency declared by the Governor of California on January 3-4, January 7-10 and January 18-22. In 2018 there were no qualifying major events. Annual system maintenance initiatives designed to enhance reliability include the Distribution Line Inspection Program, the Cable Replacement program, and the Vegetation Management Program.
Figure 29 – SMUD Outage Duration and Frequency by Year
Customer Contacts SMUD’s Contact Center continues to manage a high volume of customer contacts each year. In past years SMUD tracked data on calls answered, but in 2017 SMUD introduced chat online on its web site, www. SMUD.org. However, 2018 was the first full year that chat was available to customers and that data can be seen in Figure 30 along with calls answered. For the last decade, SMUD has had more than 1 million customer contacts per year in addition to many emails, faxes and lobby interactions.
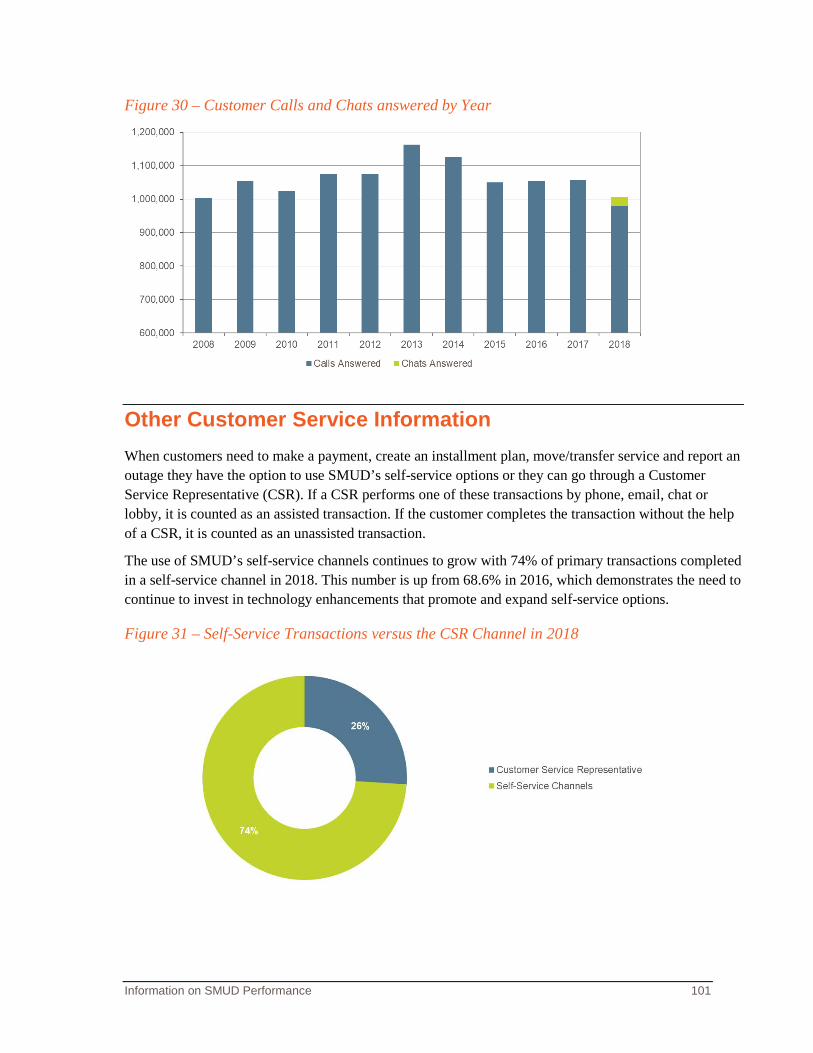
Information on SMUD Performance 101
Figure 30 – Customer Calls and Chats answered by Year
Other Customer Service Information When customers need to make a payment, create an installment plan, move/transfer service and report an outage they have the option to use SMUD’s self-service options or they can go through a Customer Service Representative (CSR). If a CSR performs one of these transactions by phone, email, chat or lobby, it is counted as an assisted transaction. If the customer completes the transaction without the help of a CSR, it is counted as an unassisted transaction.
The use of SMUD’s self-service channels continues to grow with 74% of primary transactions completed in a self-service channel in 2018. This number is up from 68.6% in 2016, which demonstrates the need to continue to invest in technology enhancements that promote and expand self-service options.
Figure 31 – Self-Service Transactions versus the CSR Channel in 2018
Environmental Assessment 102
Environmental Assessment 1.0 Section 21080(b)(8) of the California Public Resources Code and Section 15273 of the California
Environmental Quality Act (CEQA) Guidelines (California Code of Regulations, Title 14, Sections 15000, et seq.) provide that CEQA does not apply to the establishment, modification, structuring, restructuring, or approval of rates, tolls, fares, and other charges by public agencies which the public agency finds are for the purpose of:
(1) Meeting operating expenses, including employee wage rates and fringe benefits;
(2) Purchasing or leasing supplies, equipment, or materials;
(3) Meeting financial reserve needs and requirements;
(4) Obtaining funds for capital projects necessary to maintain service within existing service areas; or
(5) Obtaining funds that are necessary to maintain such intra-city transfers as are authorized by city charter. 2.0 Section 15061(b) (3) of the CEQA Guidelines provides that where it can be said with certainty that there
is no possibility that the activity in question may have a significant effect on the environment, the activity is not subject to CEQA.
3.0 The proposed action to modify the NEM program, including NEM1 and NEM 2 rate schedules, is for the purposes set forth in (1) through (4) of Section 1.0 of the Environmental Assessment. Therefore, this rate action is exempt from the requirements of CEQA.
4.0 The proposed action to increase rates of all customer classes by 4.75% in 2020 and 4.5% in 2021, is for the purposes set forth in (1) through (4) of Section 1.0 of the Environmental Assessment. Therefore, this rate action is exempt from the requirements of CEQA.
5.0 The proposed action to eliminate references to TOD in the R-TOD and Rate Schedules, is for the purposes set forth in (1) through (4) of Section 1.0 of the Environmental Assessment. Therefore, this rate action is exempt from the requirements of CEQA.
6.0 The proposed action to make miscellaneous residential TOD updates, is for the purposes set forth in (1) through (4) of Section 1.0 of the Environmental Assessment. Therefore, this rate action is exempt from the requirements of CEQA.
7.0 The proposed action to implement a new residential power theft billing process, is for the purposes set forth in (1) through (4) of Section 1.0 of the Environmental Assessment. Therefore, this rate action is exempt from the requirements of CEQA.
8.0 The proposed action to restructure commercial rates, including adjusting time periods, increasing the fixed cost rate component while decreasing the per kWh energy charge, and improving consistency in charge components across rate classes, is for the purposes set forth in (1) through (4) of Section 1.0 of the Environmental Assessment. Therefore, this rate action is exempt from the requirements of CEQA.
9.0 The proposed action to restructure commercial rates, is for the purposes set forth in (1) through (4) of Section 1.0 of the Environmental Assessment. Therefore, this rate action is exempt from the requirements of CEQA.
10.0 The proposed action to update the traffic control intersection lighting service rate to support public agencies, is for the purposes set forth in (1) through (4) of Section 1.0 of the Environmental Assessment. Therefore, this rate action is exempt from the requirements of CEQA.
12.0 The proposed action to make miscellaneous rate modifications, including changes to NEM rate schedule references, HGA Rate Schedule, Power Factor Waiver, Greenergy pricing options, is for the purposes set forth in (1) through (4) of Section 1.0 of the Environmental Assessment. Therefore, this rate action is exempt from the requirements of CEQA.
Environmental Assessment 103
12.0 The proposed action to add “multiplier” to Rule 1, is for the purposes set forth in (1) through (4) of Section 1.0 of the Environmental Assessment. Therefore, this rate action is exempt from the requirements of CEQA.
13.0 The proposed action to clarify Rule 11 to allow assistance of building officials, is for the purposes set forth in (1) through (4) of Section 1.0 of the Environmental Assessment. Therefore, this rate action is exempt from the requirements of CEQA.
14.0 The proposed action to modify the scope of the Development Fee Offset Program in Rule 16, is for the purposes set forth in (1) through (4) of Section 1.0 of the Environmental Assessment. Therefore, this rate action is exempt from the requirements of CEQA.
15.0 The proposed action to include a Bypassable Charge for interconnection customers under Rule 21, including the methodology used to calculate the charge, is for the purposes set forth in (1) through (4) of Section 1.0 of the Environmental Assessment. Therefore, this rate action is exempt from the requirements of CEQA.
SMUD Programs and Web Links 104
SMUD Programs and Web Links SMUD has information regarding a variety programs and bill assistance available to customers that can be found at the following links:
Rebates, Incentives and Financing
https://www.smud.org/en/residential/save-energy/rebates-incentives-financing/
Calculate Energy Consumption
https://www.smud.org/en/residential/save-energy/calculate-energy-consumption.htm
Learn About Energy Efficiency
https://www.smud.org/en/residential/save-energy/learn-energy-efficiency/index.htm
Payment Assistance Programs
https://www.smud.org/en/Customer-Support/Financial-assistance
Business Solutions and Rebates
https://www.smud.org/en/Business-Solutions-and-Rebates
Strategic Direction 105
Strategic Direction Our Strategic Direction guides us in the decisions we make about SMUD’s policies and operations. Our Board continually reviews and refines these guidelines to make sure we’ll meet customers’ energy needs, both now and in the future.
SD-1A SMUD is community-owned. Our purpose is to enhance the quality of life for our customers and community through creative energy solutions.
SD-1B SMUD’s vision is to be the trusted partner with our customers and community, providing innovative solutions to ensure energy affordability and reliability, improve the environment, reduce our region’s carbon footprint, and enhance the vitality of our community.
SD-2 Maintaining competitive rates is a core value of the District.
Therefore:
a) The Board establishes a rate target of 18 percent below Pacific Gas & Electric Company’s published rates on a system average basis. In addition, the Board establishes a rate target of at least 10 percent below PG&E’s published rates for each customer class.
b) SMUD’s rate of change for both rates and bills shall be competitive with other local utilities on a system average basis.
c) In addition, SMUD’s rates shall be designed to balance and achieve the following goals:
i) Reflect the cost of energy when it is used; ii) Reduce use on peak; iii) Encourage energy efficiency and conservation; iv) Minimize “sticker” shock in the transition from one rate design to another; v) Offer flexibility and options; vi) Be simple and easy to understand; vii) Meet the needs of people with fixed low incomes and severe medical conditions; and viii) Equitably allocate costs across and within customer classes.
SD-3 Maintaining access to credit is a core value of SMUD.
Therefore:
Strategic Direction 106
a) For SMUD’s annual budgets, the Board establishes a minimum target of cash coverage of all debt service payments (fixed charge ratio) of 1.5 times.
b) When making resource decisions, SMUD shall weigh the impacts on long-term revenue requirements, debt, financial risk and flexibility.
c) SMUD’s goal is to maintain at least an “A” rating with credit rating agencies.
SD-4 Meeting customer energy requirements is a core value of SMUD.
Therefore:
a) SMUD will assure all customer energy requirements are met. This will be accomplished through the use of: (i) its generation resources and purchase power portfolio 100 percent of the time; and (ii) its transmission assets to assure an overall availability of at least 99.99 percent.
b) SMUD will achieve distribution system reliability by:
Limiting the average frequency of outage per customer per year to:
• With major event: 0.99 – 1.33
• Excluding major event: 0.85 – 1.14
Limiting the average duration of outages per customer per year to:
• With major event: 67.5 – 93.3 minutes
• Excluding major event: 49.7 – 68.7 minutes
Ensuring that no individual circuits exceed these targets for more than two consecutive years. For circuits that exceed these targets for two consecutive years, a remedial action plan will be issued and completed within eighteen months.
c) SMUD will maintain the electric system in good repair and make the necessary upgrades to maintain load serving capability and meet regulatory standards.
SD-5 Maintaining a high level of customer relations is a core value of SMUD. Additionally, the Board sets a customer satisfaction target of 95 percent with no individual component measured falling below 85 percent. In addition, the Board establishes an overall customer experience “value for what you pay” target of 80 percent by the end of 2021, with neither the average commercial customer score falling below 69 percent nor the average residential customer score falling below 65 percent in any year.
As part of this policy:
a) SMUD customers shall be treated in a respectful, dignified and civil manner.
b) SMUD shall communicate a procedure for customers who believe they have not received fair treatment from SMUD to be heard.
Strategic Direction 107
SD-6 Creating a safe environment for employees and the public is a core value of SMUD.
Through continuous improvement, SMUD will be recognized as a leader in employee safety while also assuring the safety of the public related to SMUD operations and facilities. This includes a comprehensive approach to monitoring organizational and public safety performance.
Therefore, SMUD will continue to improve safety results to:
Workplace Safety
a) Reduce SMUD’s injury severity rate to 1.4 by 2020, as measured by OSHA’s Days Away Restricted Time (DART), a rate that demonstrates strong safety performance.
b) Provide timely, quality health care for injured employees that aids their recovery while maintaining positive financial performance of the workers’ compensation program.
Public Safety
a) Track and report injuries to the public related to SMUD operations or facilities.
b) Implement measures to protect the public from injuries related to SMUD operations or facilities.
SD-7 Environmental leadership is a core value of SMUD. The Board is committed to environmental leadership through community engagement, continuous improvement in pollution prevention, carbon reduction, energy efficiency, and conservation.
Therefore:
a) SMUD will conduct its business affairs and operations in a manner that reduces adverse environmental impacts, reduces pollution, and enhances resource conservation and stewardship.
b) SMUD will provide leadership in the reduction of the region’s total emissions of greenhouse gases through proactive programs in all SMUD activities and development and support of national, State, and regional climate change policies and initiatives.
c) SMUD will promote the efficient use of energy by its customer-owners.
d) SMUD will proactively engage its customer-owners and other stakeholders in meeting this directive.
SD-8 Developing and maintaining a high quality, inclusive workplace that engages and inspires employees to commit to SMUD’s purpose, vision and values is a core value of SMUD.
Therefore:
a) SMUD shall attract and retain a highly qualified workforce.
b) SMUD shall engage its workforce in personal and professional development.
Strategic Direction 108
c) SMUD shall maintain and communicate written policies that define procedures and expectations for staff and provide for effective handling of grievances.
d) SMUD’s percentage of engaged employees as measured through the Engagement Index shall exceed 80%.
e) Annually, and consistent with State and Federal law, the Board shall receive a report detailing the demographics of the SMUD workforce, the available workforce, and the Sacramento region. The report shall also provide information on veterans as a part of SMUD’s workforce.
SD-9 It is a core value of SMUD to provide its customer-owners with a sustainable power supply through the use of an integrated resource planning process. A sustainable power supply is defined as one that reduces SMUD’s net long-term greenhouse gas (GHG) emissions to serve retail customer load to Net Zero by 2040. Net Zero is achieved through investments in vehicle and building electrification, energy efficiency, clean distributed resources, RPS eligible renewables, large hydro, and biogas. SMUD shall assure reliability of the system, minimize environmental impacts on land, habitat, water quality, and air quality, and maintain a competitive position relative to other California electricity providers.
To guide SMUD in its resource evaluation and investment, the Board sets the following interim goal:
Year Net Greenhouse Gas Emissions (metric tons)
2020 2,318,000
2030 1,350,000
2040 Net Zero
2050 Net Zero
In keeping with this policy, SMUD shall also achieve the following:
a) SMUD’s goal is to achieve Energy Efficiency equal to 15% of retail load over the next 10-year period. On an annual basis, SMUD will achieve energy efficiency savings of 1.5% of the average annual retail energy sales over the three-year period ending with the current year.
To do this, SMUD will acquire as much cost effective and reliable energy efficiency as feasible through programs that optimize value across all customers. SMUD shall support additional energy efficiency acquisition by targeting one percent (1%) of retail revenues for above market costs associated with education, market transformation, and programs for hard to reach or higher cost customer segments. The market value of energy efficiency will include environmental attributes, local capacity value and other customer costs reduced by an efficiency measure.
b) Provide dependable renewable resources to meet 33% of SMUD’s retail sales by 2020, 44% by 2024, 52% by 2027, and 60% of its retail sales by 2030 and thereafter, excluding additional renewable energy acquired for certain customer programs.
c) In meeting GHG reduction goals, SMUD shall emphasize local and regional environmental benefits.
Strategic Direction 109
d) SMUD will continue exploring additional opportunities to accelerate and reduce carbon in our region beyond the GHG goals in this policy.
e) Promote cost effective, clean distributed generation through SMUD programs.
SD-10 Delivering innovative solutions, products and services to our customers is a core value. To assure our long-term competitiveness, SMUD shall invest in research and development projects that support its core and key values, and integrate emerging technologies and new business models into SMUD’s customer offerings in a way that balances risk and opportunity and benefit our customers and community.
SD-11 Supporting and strengthening the public power business model is a core value. Local decision making and flexibility are essential to effective and responsible local governance. Community-owned utilities are primarily accountable to customers, not stockholders. Community citizens have a direct voice in public power decisions.
Preservation of this business model is vital to ensure public power systems continue to provide innovative solutions tailored to best meet the needs of their customers and communities.
SD-12 Maintaining the public trust and confidence in the integrity and ethical conduct of the Board and SMUD employees is a core value. Therefore, to ensure the public interest is paramount in all official conduct, the Board shall adopt and update, as necessary: a Conflict of Interest Code as required by State law. SMUD shall also maintain and enforce a code of conduct applicable to all employees.
Among other things the code of conduct shall:
a) Require high ethical standards in all aspects of official conduct;
b) Establish clear guidelines for ethical standards and conduct by setting forth those acts that may be incompatible with the best interests of SMUD and the public;
c) Require disclosure and reporting of potential conflicts of interest; and
d) Provide a process for (i) reporting suspected violations of the code of conduct and policies through multiple channels, including an anonymous hotline, and (ii) investigating suspected violations.
SD-13 Promoting the economic vitality of our region and the growth of our customer base is a key value of SMUD. Therefore, SMUD shall exercise strategic leadership and actively participate in regional economic development.
Specifically:
a) SMUD shall promote innovation while maintaining rate affordability and balancing the other strategic directions.
Strategic Direction 110
b) SMUD shall align its economic development activities with regional economic development initiatives.
c) SMUD shall assist in retaining, recruiting and growing commercial and industrial rate-paying customers.
d) SMUD shall offer economic development rates and program incentives.
e) SMUD shall offer a contracting program for certified small businesses who are rate-paying customers.
SD-14 As a community-owned utility, SMUD recognizes that the relocation or underground placement of primary voltage power lines may be desirable to local jurisdictions to improve aesthetics, economic vitality, safety and disabled access. Therefore, it is a key value of SMUD to make selected distribution system enhancements, such as permanent relocation or underground placement of primary power lines below 69 kV.
a) SMUD will, at its expense and where technically feasible, permanently relocate or underground existing overhead distribution facilities provided the governing body of the city or county in which the electric facilities are and will be located has:
i) Identified, after consultation with SMUD, a specific system enhancement project; ii) Determined the project is in the public interest; iii) Ensured all existing overhead communication facilities related to the project will also be permanently relocated or placed underground; iv) Obtained and provided SMUD with all easements necessary for the project.
b) After achievement of core financial targets, SMUD will annually commit up to one-half of one percent of its annual gross electric sales revenue to system enhancements. The proposed projects will be subject to the SMUD’s annual budget approval process, and uncommitted funds from any given year will not be carried over to future years. Funding will be assigned to projects brought forward by local cities or counties based on applying the following criteria (not in order of preference):
i) Project scale and/or cost when measured against available SMUD resources. ii) Requesting entity has developed full scope, obtained all necessary easements, and development plan for customer service conversion from overhead to underground, as required. iii) Extent to which the costs are borne by others.
SD-15 Providing broad outreach and communication to SMUD’s customers and the community is a key value of SMUD.
Specifically:
Strategic Direction 111
a) SMUD shall provide its customers the information, education and tools they need to best manage their energy use according to their needs.
b) SMUD will use an integrated and consistent communication strategy that recognizes the unique customer segments that SMUD serves.
c) SMUD’s communication and community outreach activities shall reflect the diversity of the communities we serve. SMUD shall use a broad mix of communication channels to reach all customer segments. This communication shall be designed to ensure that all groups are aware of SMUD’s major decisions and programs.
SD-16 Proper management of cyber and physical information, as well as physical security, is a core value. Robust information management and physical security practices are critical to effective risk management and to ensure regulatory compliance, business resiliency and customer satisfaction. SMUD shall take prudent and reasonable measures to accomplish the following:
a) Information Security: SMUD will protect customer, employee and third party information, and SMUD information systems are protected from unauthorized access, use, disclosure, disruption, modification, or destruction.
b) Physical Security: SMUD will safeguard its employees while at work as well as customers and visitors at SMUD facilities. SMUD will also protect its facilities and functions that support the reliability of the electric system and overall operation of the organization from unauthorized access or disruption or business operations.
c) Customer Privacy: SMUD will annually notify customers about the collection, use and dissemination of sensitive and confidential customer information. Except as provided by law or for a business purpose, SMUD will not disseminate sensitive and confidential customer information to a third party for non-SMUD business purposes unless the customer first consents to the release of the information. Where sensitive and confidential information is disseminated for a business purpose, SMUD will ensure: (i) the third party has robust information practices to protect the sensitive and confidential customer information, and (ii) use of the information by the third party is limited to SMUD’s business purpose. SMUD will maintain a process that identifies the business purposes for which SMUD will collect, use and disseminate sensitive and confidential customer information.
d) Records Management: SMUD will maintain the efficient and systematic control of the creation, capture, identification, receipt, maintenance, use, disposition, and destruction of SMUD records, in accordance with legal requirements and Board policies.
SD-17 Effectively balancing and managing risk to further SMUD’s policies and business goals is a core value of SMUD.
Therefore:
SMUD will implement and maintain an integrated enterprise risk management process that identifies, assesses, prudently manages and mitigates a variety of risks facing SMUD, including financial, supply,
Strategic Direction 112
operational, physical and cyber security, climate change, legal, legislative and regulatory, and reputational risk.
SD-19 Broadening and diversifying the products and services that SMUD offers is a key value. The desired results are to: a) generate new revenues that contribute to SMUD’s long-term financial health; b) spur the creation of innovative products and services; c) capture the value of SMUD’s brand and intellectual property; d) better leverage and optimize SMUD’s assets; and e) enable SMUD to continue to attract and retain a talented workforce. Therefore:
a) SMUD shall broaden and diversify its lines of business, which may include:
i) Being an external service provider;
ii) Expanding wholesale energy market opportunities;
iii) Capitalizing on intellectual property and assets to develop products and services either solely or through strategic partnerships;
iv) Selling products and services aligned with SMUD’s purpose and Strategic Directions.
b) SMUD shall ensure any new lines of business:
i) Benefit SMUD’s customers and our community;
ii) Achieve a balanced, diversified portfolio of rewards and risks;
iii) Create economic value without compromising SMUD’s financial health;
iv) Do not pose unreasonable risk to SMUD’s reputation;
v) Align with, leverage, and optimize SMUD’s strengths, assets and expertise;
vi) Position SMUD for the future.
Compliance 113
Compliance Introduction California voters approved Proposition 26 in November 2010, and that measure provides that every “levy, charge, or exaction of any kind imposed by a local government” is treated as a tax subject to voter approval, with exceptions discussed below. (Cal. Const., art. XIII C, § 1, subd. (e).) Proposition 26 therefore applies only to charges that are “imposed” by local government. SMUD rates are not “imposed” on customers for purposes of Proposition 26, because that language requires some exercise of government force or authority, which is not involved when a public agency such as SMUD provides services to customers in a competitive market. SMUD customers pay only for the voluntary use of service, and they have meaningful alternatives to that service, such as self-generation with solar, hydro, fuel cell, wind and geothermal power.
Proposition 26 Does Not Apply to SMUD Rates Although Proposition 26 therefore does not govern SMUD electric rates, the rate structure developed for this Chief Executive Officer and General Manager’s Report and Recommendation on Rates and Services (“Report”) complies with Proposition 26, which includes seven exceptions that treat certain charges imposed by local government agencies as fees rather than taxes, four of which are relevant to SMUD charges.
Cost-Justified Fees for Benefits and Services First, charges for benefits conferred upon the payor, or for specific government services provided directly to the payor, are excepted under Cal. Const., art. XIII C, subdivisions (e)(1) and (e)(2), respectively, provided that the charge does not exceed the reasonable cost of providing that benefit or service. The proposed rate adjustments are based upon cost of service principles, because these adjustments bring charges closer to recovering the cost of service, and the extent to which they exceed cost is the result of grandfathered rate-making legislative choices that predate Proposition 26, which the measure does not disturb.
The cost-of-service analysis that demonstrates cost-justification for the proposed rates is the SMUD Rate Costing Study (March 2019) (“2019 Rate Study”) which is incorporated herein by this reference.
Proposed Adjustments The rate proposals in this Report include: 1) a rate increase that applies to all customer classes, 2) NEM restructuring to include a per kW monthly charge (“Grid Access Charge”) in order to bring interconnection customers connected to the SMUD grid closer to the cost of service, with grandfathering
Compliance 114
provisions for certain customers, 3) waiver or limited waiver of the Grid Access Charge for low income EAPR customers 4) restructuring of commercial charges to better reflect the cost of service.
1) Rate Increases for All Customer Classes
SMUD has determined that current rates are not sufficient to recover SMUD’s cost of service for any customer class and therefore recommends rate increases for each customer class in order to align with the cost of service. The proposed rate increases are based on cost of service principles, because the primary cost-drivers of this rate increase are increased costs for wildfire mitigation, reliability compliance, technology solutions, materials and O&M, and IRP implementation. As noted above, charges for services and benefits that reasonably reflect the cost of providing those services or benefits is excepted under Cal. Const., art. XIII C, subdivisions e(1) and e(2). The proposed rate increases therefore comply with Proposition 26.
2) Grid Access Charge for Interconnection Customers
Interconnection customers, including those taking NEM service, currently pay only for energy supplied by SMUD, net of energy returned to SMUD from the customer’s interconnected generation facility. These customers do not currently pay their full cost of service, because the variable kWh commodity charge for electricity includes a large portion of fixed cost recovery for SMUD. Accordingly, a customer that self-generates and receives less energy supplied by SMUD is forgoing its fair share of paying fixed costs to serve that customer.
This lack of a grid access charge pre-dates Proposition 26 and is therefore grandfathered by the measure. Thus, SMUD may continue to offer this discount to interconnected customers, or it may discontinue or phase out the rate structure in order to bring these customers closer to the cost of service. The Grid Access Charge, which becomes effective between January 1, 2020 and May 31, 2020, is designed to recover costs allocated interconnected customers that are not currently funded by the kWh commodity charges and SIFC or demand charges, and therefore bring these customers closer to the cost of service, as permitted under Proposition 26.
Note that certain interconnected customers will qualify for continued grandfathering under this proposal. First, customers with an interconnected generation facility approved for installation prior to January 1, 2018 will be grandfathered until 20 years after the date of interconnection was established, while those with generating facilities installed between January 1, 2018 and March 31, 2019 will be grandfathered for 10 years after their interconnection date. Customers that apply for interconnection after March 31, 2019 will not be grandfathered and will be billed for the Grid Access Charge after the January 1, 2020- May 31, 2020 effective date.
Because SMUD is permitted to continue grandfathering the rate structure indefinitely for each of these groups, a phase-out to bring these rates closer to the cost of service is also allowed.
3) Waiver of Grid Access Charge for Low Income Customers
SMUD offers a discounted Energy Assistance Program Rate (“EAPR”) to qualified low income customers, and this discount is grandfathered under Proposition 26. EAPR customers are also eligible to install self-generation on site and interconnect the facility to SMUD. Like all other interconnected customers (including NEM customers), these low-income customers have not
Compliance 115
been historically required to pay the full cost of service, but have instead benefitted from a rate structure that requires payment only for net energy use.
Like other interconnected customers (including NEM customers), EAPR customers will be grandfathered and therefore not required to pay the Grid Access Charge, depending on the date of interconnection. However, SMUD will waive the Grid Access Charge for EAPR customers with household income at or below 100% of the federal poverty level, and it will waive 50% of the Grid Access Charge for customers with household income more than 100%, but no greater than 200%, of the federal poverty level.
As discussed above, the current rate structure is grandfathered under Proposition 26, which means that SMUD could continue the lack of a grid access charge indefinitely for all interconnected customers, including customers qualified for the EAPR discount. Under these circumstances, SMUD is permitted to continue the discount indefinitely for customers at or below the federal poverty level, while bringing those between 100% and 200% of the federal poverty level closer to the cost of service with a 50% waiver.
The waiver and partial waiver for EAPR customers is therefore permitted under Proposition 26.
4) Restructuring of Commercial Charges
The proposed rates also include new time parameters for commercial TOU energy rates, and a new demand charge for small commercial customers that have not historically paid a demand charge. Both of these changes bring commercial TOU rates and small commercial customer rates closer to the cost of service, and this restructuring of commercial rates therefore complies with Proposition 26.
Non-Cost-Justified Fees for Use of SMUD Property; Fines and Penalties In addition to the exceptions applicable to grandfathering and charges for benefits and services, Proposition 26 also provides exceptions for the following categories of charges, which are not treated as taxes subject to voter approval: (1) charges for the use of government property and (2) fines and penalties. (Cal. Const., art XIII C, § 1, subdivisions (e)(4) and (e)(5).) Unlike charges for benefits and services, which cannot exceed the reasonable cost of providing those benefits and services, Proposition 26 does not limit charges for use of property and fines and penalties to the cost of service. Therefore, to the extent that SMUD’s charges are for the use of SMUD property (such as wholesale rates) or fines and penalties (such as late-payment charges), those charges would comply with Proposition 26 if it applied (which, as explained above, it does not) even without a showing that such charges are limited to SMUD’s costs.
Glossary 116
Glossary Analog and digital non-communicating meters
Analog meters have mechanical dials that a utility worker has to read each month to measure a customer’s power usage. Digital non-communicating meters incorporate digital sensors and do not have communication capabilities for automatic monitoring, control and two-way communication through a wireless mesh network.
California Public Utilities Commission (CPUC)
An agency that regulates investor-owned utilities in the state of California.
Capacity Factor
The ratio of actual energy output over a period of time to the potential maximum output of energy in the same period of time, usually expressed as a percentage. This ratio can be expressed in a formula as follows:
(total kWh generated) / (8,760 hours * kW rating of the generator)
Consumer Price Index (CPI)
Government-produced monthly data on changes in the prices paid by urban consumers for a representative basket of goods and services.
Core values
SMUD’s core values are part of the Board’s Strategic Direction and are a component of all solutions for meeting customers’ electrical needs. SMUD core values include competitive rates, access to credit markets, reliability, customer relations, safety, environmental leadership, employee relations, resource planning, public power business model, ethics, information management and security, enterprise risk management, and emerging technologies.
Credit Markets
A financial market where participants buy and sell debt securities, usually in the form of bonds.
Days Cash on Hand
A financial metric that indicates the number of days of operating expenses that could be paid with the current cash available.
Digital Communicating Meter
A computerized meter that incorporates digital sensors and communication capabilities for automatic monitoring, control and two-way communication through a wireless mesh network.
Distributed Generation
Glossary 117
Distributed generation, also called on-site generation or decentralized generation, typically generates electricity from either sunlight or natural gas combustion. Distributed generation systems are small-scale power generation technologies (typically in the range of 3 to 10,000 kW) that may provide electricity directly for customer use onsite, or deliver electricity back into the distribution grid.
Diversified Demand
The estimated amount of power/load that a customer will use for a given project. Typically, the actual total demand in kW is less than the total connected load. Based on that, SMUD diversifies, or reduces the estimated amount of power required for a given project. The per kW offset in rule 16 will be applied to the total estimated diversified load in kW that a customer will require to operate their business as determined by SMUD.
Energy Assistance Program Rate (EAPR)
A SMUD program that offers eligible low-income customers a discount on their monthly energy bills.
Energy Information Administration (EIA)
An independent agency within the U.S. Department of Energy that develops surveys, collects energy data, and analyzes and models energy issues.
Equity Ratio
SMUD equity divided by SMUD debt and equity — this percentage shows the value of SMUD assets relative to SMUD’s financial leverage.
Federal Poverty Level (FPL)
A measure of income issued every year by the United States Department of Health and Human Services. Federal poverty levels are used to determine eligibility for certain programs and benefits.
Fixed Charge Coverage or Fixed Charge Ratio
The fixed charge ratio is a measure of cash flow available for debt service payments.
Fixed Rate
The SMUD rate with fixed energy prices; one price for all kWh usage in summer, and one price for all kWh usage in non-summer months. Prices are subject to rate changes during a public rate process.
Greenhouse Gases (GHG)
Gases such as carbon dioxide, methane and nitrous oxides that trap heat in the atmosphere. Because of fossil fuel use and other human activity, greenhouse gases have been concentrating at higher levels, leading to general climate warming. SMUD produces greenhouse gases primarily through its operation of natural gas-fired power plants. SMUD is committed to reducing its GHG emissions through the use of renewable power and other means. SMUD’s goal is to reduce its greenhouse gas emissions to only 10% of its 1990 level by 2050.
Grid Access Date
The date of the first billing cycle after initial facility interconnection date.

Glossary 118
Holidays
Weekend pricing shall apply during the following holidays:
Holiday Month Date New Year’s Day January 1
Martin Luther King Jr. Day January Third Monday
Lincoln’s Birthday February 12
Presidents Day February Third Monday
Memorial Day May Last Monday
Independence Day July 4
Labor Day September First Monday
Columbus Day October Second Monday
Veterans Day November 11
Thanksgiving Day November Fourth Thursday
Christmas Day December 25
Integrated Resource Plan (IRP)
A plan to detail how utilities will meet their customer resource needs, reduce GHG’s, and ramp up the deployment of clean energy resources.
J.D Power and Associates
J.D. Power and Associates is a global marketing information services company providing forecasting, performance improvement, social media and customer satisfaction insights and solutions.
Key Values
Key Values, part of the Board’s Strategic Direction, define SMUD’s course of action regarding research and development, economic development, system enhancement, and outreach and communication.
Legacy Commercial Rates
SMUD’s commercial rates in effect on January 1, 2020. The legacy commercial rates will be closed upon the transition of all customers to the new restructured Time-of-Day rates, no later than May 31, 2021 for rate GSS_T on Rate Schedule GS, and Rate Schedules GS-TOD1, GS-TOD2 and GS-TOD3, and May 31, 2022 for GSN_T on Rate Schedule GS.
Legacy Rate
SMUD’s flat residential rate in effect on January 1, 2017. For eligible customers, this rate will be subject to rate adjustments in future rate processes through December 31, 2022.
Load
The amount of power carried by a utility system or subsystem, or the amount of power consumed by an electric device, at a specified time. Load may also be referred to as demand.
Glossary 119
Load Serving Capability
The maximum demand that can be served with all facilities in service while meeting all applicable reliability standards.
Low-income household
For SMUD program eligibility, households with income that is less than or equal to twice the federal poverty level.
Marginal Cost
The economic concept of the change in total costs that result when output is increased or decreased by a single unit.
Net Debt per Customer
A metric that measures the amount of debt outstanding, minus cash on hand, divided by the number of customers.
Net Energy Metering (NEM)
Customers who have qualifying renewable energy technologies, as defined by the NEM1 and NEM2 rate schedules, are charged for the energy SMUD delivers to them, and credited for the energy they export to SMUD (for example, solar). The amount of energy remaining after the deduction of any energy generation from metered energy consumption. SMUD’s NEM pricing, rules and regulations are described in Rate Schedules NEM1 and NEM2.
Non-Bypassable Cost Components
The fixed costs currently collected in the retail electric rates (per kWh) that will be used in the basis of the Grid Access Charge. These fixed costs include generation capacity for the Time-of-Day Summer Peak period, ancillary services, transmission and distribution, distribution facilities, public goods, and contributions to budget. The recovery of these non-bypassable cost components in the form of a Grid Access Charge make sure each customer is paying their fair share for their use of the grid.
Peak periods
Hours when SMUD experiences its highest seasonal system peak and electricity is more expensive. In its time-based rates, SMUD charges higher prices for energy during the peak periods to reflect the cost of service.
Photovoltaic (PV)
Photovoltaic is a generation technology that uses semiconductors to convert solar radiation into electricity.
Plug-in Electric Vehicle (PEV)
A passenger vehicle powered by battery packs that can be recharged from an external source of electricity. Plug-in hybrid electric vehicles also have an internal combustion engine.
Glossary 120
Power Factor
The fraction of power actually used by a customer’s electrical equipment, compared to the total apparent power supplied, usually expressed as a percentage.
Rates book
A legal document that codifies prices and fees for SMUD electric rates.
Standard Customer Bill
Refers to customers who are on the standard residential rate and are not receiving any Energy Assistance Program Rate (EAPR) discount or the Medical Equipment Discount (MED).
Strategic Direction (SD)
Guidelines used by SMUD’s Board of Directors in the decisions made about SMUD’s policies and operations. The Board continually reviews and refines these guidelines to make sure SMUD will meet customer’s energy needs, both now and in the future.
System Average Interruption Duration Index (SAIDI)
SAIDI is an index of electric system reliability that measures the average length of time for electric service outages per customer on an annual basis. Board Policy SD-4 on Reliability sets the SAIDI, excluding major events, at between 49.7 to 68.7 minutes.
System Average Interruption Frequency Index (SAIFI)
SAIFI is an index of electric system reliability that measures the frequency of electric service outages per customer on an annual basis. Board Policy SD-4 on Reliability sets the SAIFI, excluding major events, at between .85 to 1.14 outages per customer per year.
System Average Rate
Total retail revenue divided by the total kilowatt-hours sold.
System Infrastructure Fixed Charge (SIFC)
A fixed monthly charge that helps cover the cost of infrastructure, including poles, lines, transformers, service drop and meter equipment, as well as billing and customer service expenses such as the Contact Center.
Tariff
A schedule of prices and fees including terms, conditions, rules and regulations for any given electric service rate or electric rule. Tariff sheets are listed in the rates book, which is available on www.smud.org.
Time-of-Day (TOD) Rate
SMUD name for a residential time-based rate that charges different prices based on the time-of-day electricity is used. With time-based rates such as the TOD (5-8 p.m. Peak) Rate, the price charged per kilowatt-hour depends on the time of day and reflects energy supply and demand. Power is typically most expensive between 5 and 8 p.m. on weekdays, especially in the summer, when heavy air-conditioning use causes spikes in electricity consumption.

Glossary 121
Time-of-Use (TOU)
Rates in which energy prices vary by season and time of day to better reflect costs. TOU is an acronym widely used in the electric utility industry that refers to electric rates that charges different prices by time period to reflect cost of providing service. At SMUD, for residential customers, it is called Time-of-Day.
Unaudited Financial Statistics 122
Unaudited Financial Statistics SMUD Retail Energy Sales Forecast
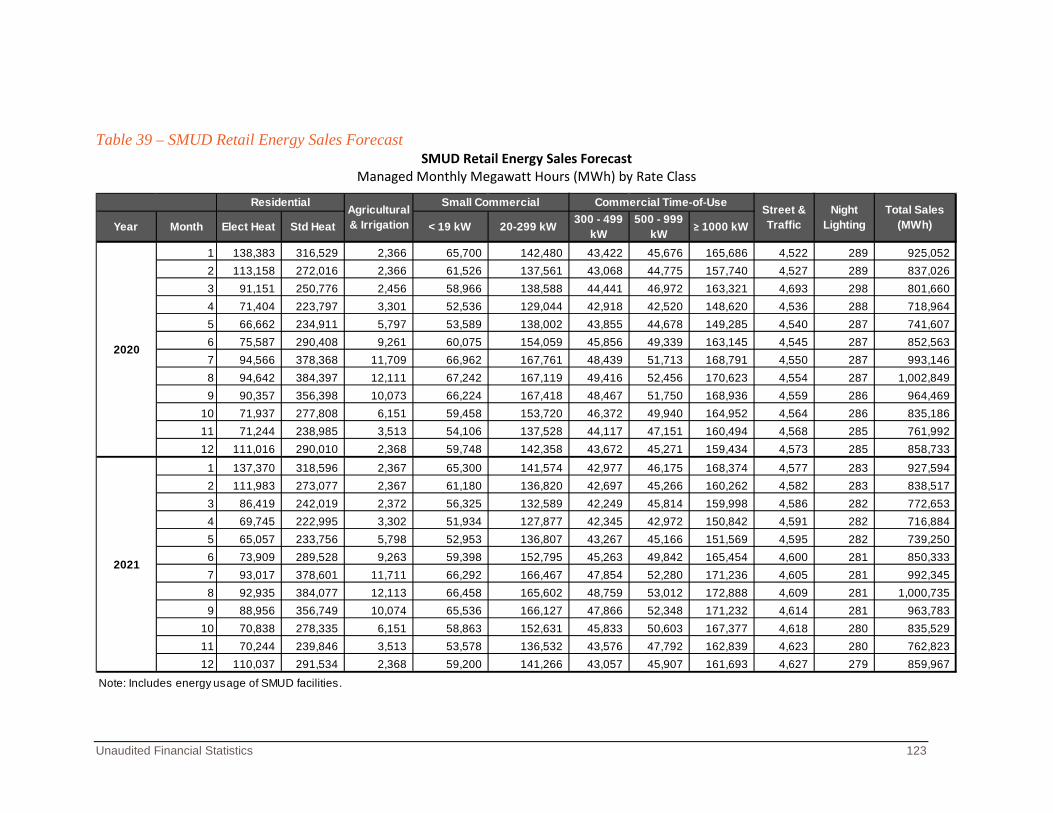
Unaudited Financial Statistics 123
Table 39 – SMUD Retail Energy Sales Forecast SMUD Retail Energy Sales Forecast
Managed Monthly Megawatt Hours (MWh) by Rate Class
Year Month Elect Heat Std Heat < 19 kW 20-299 kW 300 - 499 kW
500 - 999 kW ≥ 1000 kW
1 138,383 316,529 2,366 65,700 142,480 43,422 45,676 165,686 4,522 289 925,052 2 113,158 272,016 2,366 61,526 137,561 43,068 44,775 157,740 4,527 289 837,026 3 91,151 250,776 2,456 58,966 138,588 44,441 46,972 163,321 4,693 298 801,660 4 71,404 223,797 3,301 52,536 129,044 42,918 42,520 148,620 4,536 288 718,964 5 66,662 234,911 5,797 53,589 138,002 43,855 44,678 149,285 4,540 287 741,607 6 75,587 290,408 9,261 60,075 154,059 45,856 49,339 163,145 4,545 287 852,563 7 94,566 378,368 11,709 66,962 167,761 48,439 51,713 168,791 4,550 287 993,146 8 94,642 384,397 12,111 67,242 167,119 49,416 52,456 170,623 4,554 287 1,002,849 9 90,357 356,398 10,073 66,224 167,418 48,467 51,750 168,936 4,559 286 964,469
10 71,937 277,808 6,151 59,458 153,720 46,372 49,940 164,952 4,564 286 835,186 11 71,244 238,985 3,513 54,106 137,528 44,117 47,151 160,494 4,568 285 761,992 12 111,016 290,010 2,368 59,748 142,358 43,672 45,271 159,434 4,573 285 858,733
1 137,370 318,596 2,367 65,300 141,574 42,977 46,175 168,374 4,577 283 927,594 2 111,983 273,077 2,367 61,180 136,820 42,697 45,266 160,262 4,582 283 838,517 3 86,419 242,019 2,372 56,325 132,589 42,249 45,814 159,998 4,586 282 772,653 4 69,745 222,995 3,302 51,934 127,877 42,345 42,972 150,842 4,591 282 716,884 5 65,057 233,756 5,798 52,953 136,807 43,267 45,166 151,569 4,595 282 739,250 6 73,909 289,528 9,263 59,398 152,795 45,263 49,842 165,454 4,600 281 850,333 7 93,017 378,601 11,711 66,292 166,467 47,854 52,280 171,236 4,605 281 992,345 8 92,935 384,077 12,113 66,458 165,602 48,759 53,012 172,888 4,609 281 1,000,735 9 88,956 356,749 10,074 65,536 166,127 47,866 52,348 171,232 4,614 281 963,783
10 70,838 278,335 6,151 58,863 152,631 45,833 50,603 167,377 4,618 280 835,529 11 70,244 239,846 3,513 53,578 136,532 43,576 47,792 162,839 4,623 280 762,823 12 110,037 291,534 2,368 59,200 141,266 43,057 45,907 161,693 4,627 279 859,967
Note: Includes energy usage of SMUD facilities.
2020
2021
Residential Agricultural & Irrigation
Small Commercial Commercial Time-of-Use Street & Traffic
Night Lighting
Total Sales (MWh)
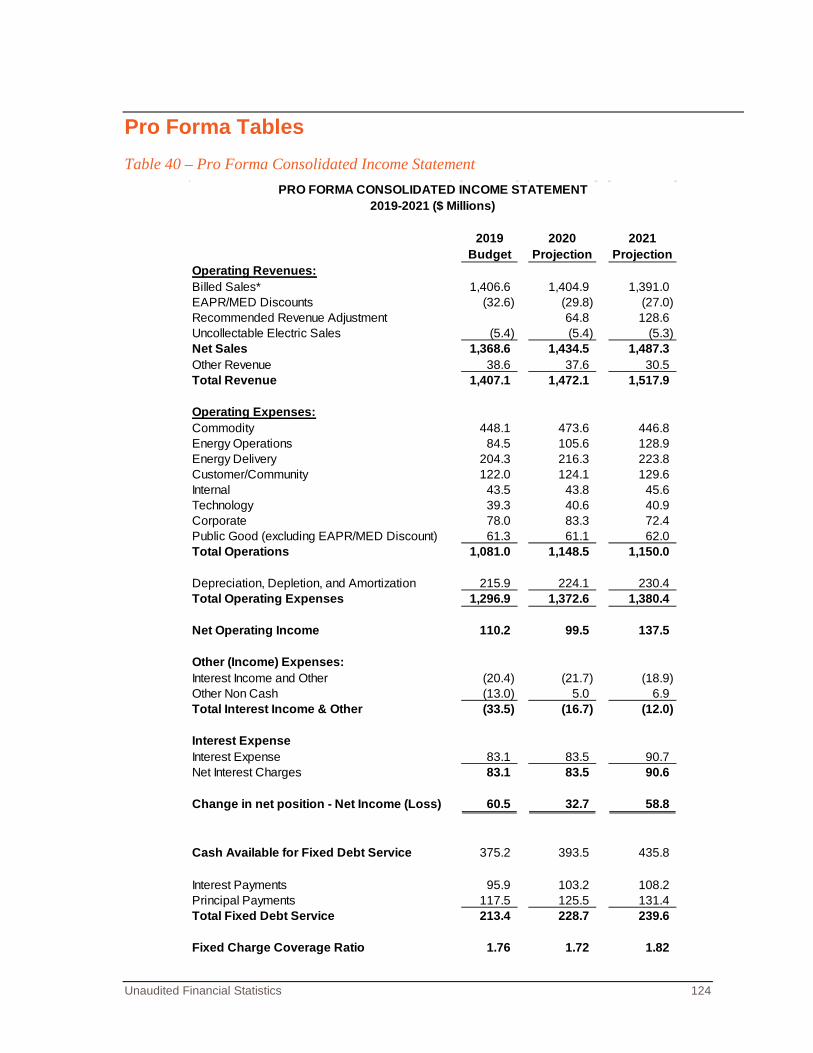
Unaudited Financial Statistics 124
Pro Forma Tables Table 40 – Pro Forma Consolidated Income Statement
2019 2020 2021Budget Projection Projection
Operating Revenues:Billed Sales* 1,406.6 1,404.9 1,391.0 EAPR/MED Discounts (32.6) (29.8) (27.0) Recommended Revenue Adjustment 64.8 128.6 Uncollectable Electric Sales (5.4) (5.4) (5.3) Net Sales 1,368.6 1,434.5 1,487.3 Other Revenue 38.6 37.6 30.5 Total Revenue 1,407.1 1,472.1 1,517.9
Operating Expenses:Commodity 448.1 473.6 446.8 Energy Operations 84.5 105.6 128.9 Energy Delivery 204.3 216.3 223.8 Customer/Community 122.0 124.1 129.6 Internal 43.5 43.8 45.6 Technology 39.3 40.6 40.9 Corporate 78.0 83.3 72.4 Public Good (excluding EAPR/MED Discount) 61.3 61.1 62.0 Total Operations 1,081.0 1,148.5 1,150.0
Depreciation, Depletion, and Amortization 215.9 224.1 230.4 Total Operating Expenses 1,296.9 1,372.6 1,380.4
Net Operating Income 110.2 99.5 137.5
Other (Income) Expenses:Interest Income and Other (20.4) (21.7) (18.9) Other Non Cash (13.0) 5.0 6.9 Total Interest Income & Other (33.5) (16.7) (12.0)
Interest ExpenseInterest Expense 83.1 83.5 90.7 Net Interest Charges 83.1 83.5 90.6
Change in net position - Net Income (Loss) 60.5 32.7 58.8
Cash Available for Fixed Debt Service 375.2 393.5 435.8
Interest Payments 95.9 103.2 108.2 Principal Payments 117.5 125.5 131.4 Total Fixed Debt Service 213.4 228.7 239.6
Fixed Charge Coverage Ratio 1.76 1.72 1.82
PRO FORMA CONSOLIDATED INCOME STATEMENT2019-2021 ($ Millions)
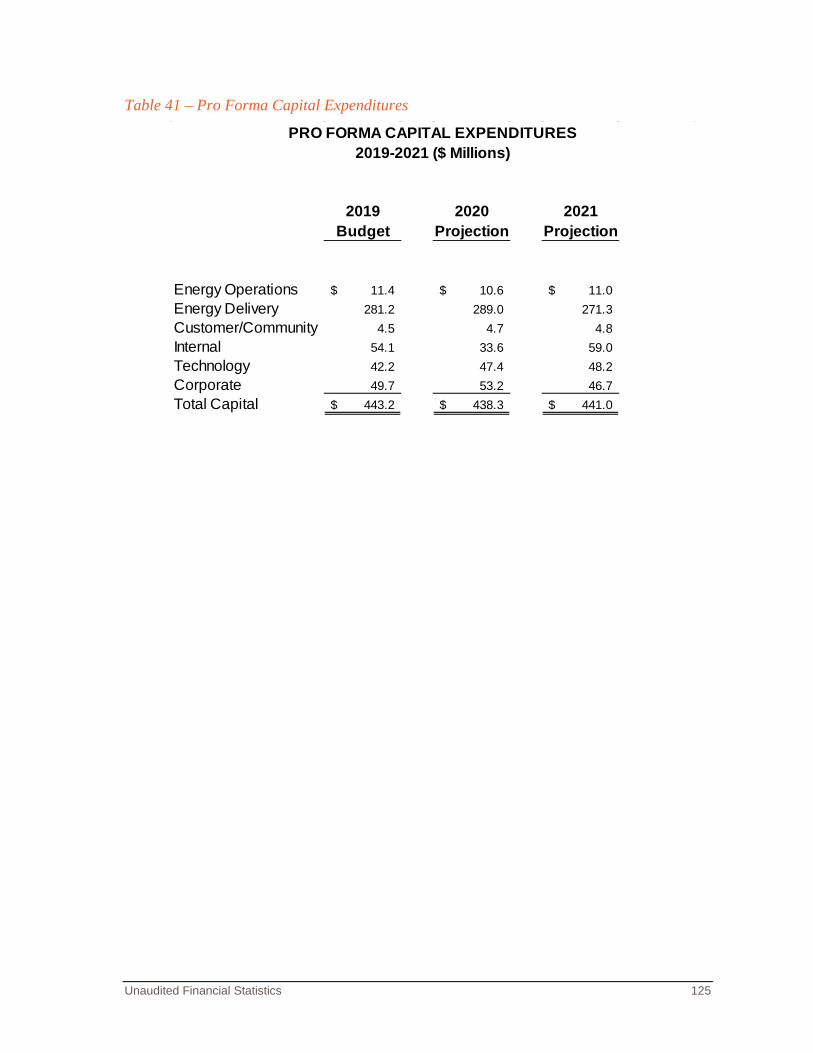
Unaudited Financial Statistics 125
Table 41 – Pro Forma Capital Expenditures
2019 2020 2021Budget Projection Projection
Energy Operations 11.4$ 10.6$ 11.0$ Energy Delivery 281.2 289.0 271.3 Customer/Community 4.5 4.7 4.8 Internal 54.1 33.6 59.0 Technology 42.2 47.4 48.2 Corporate 49.7 53.2 46.7 Total Capital 443.2$ 438.3$ 441.0$
PRO FORMA CAPITAL EXPENDITURES2019-2021 ($ Millions)
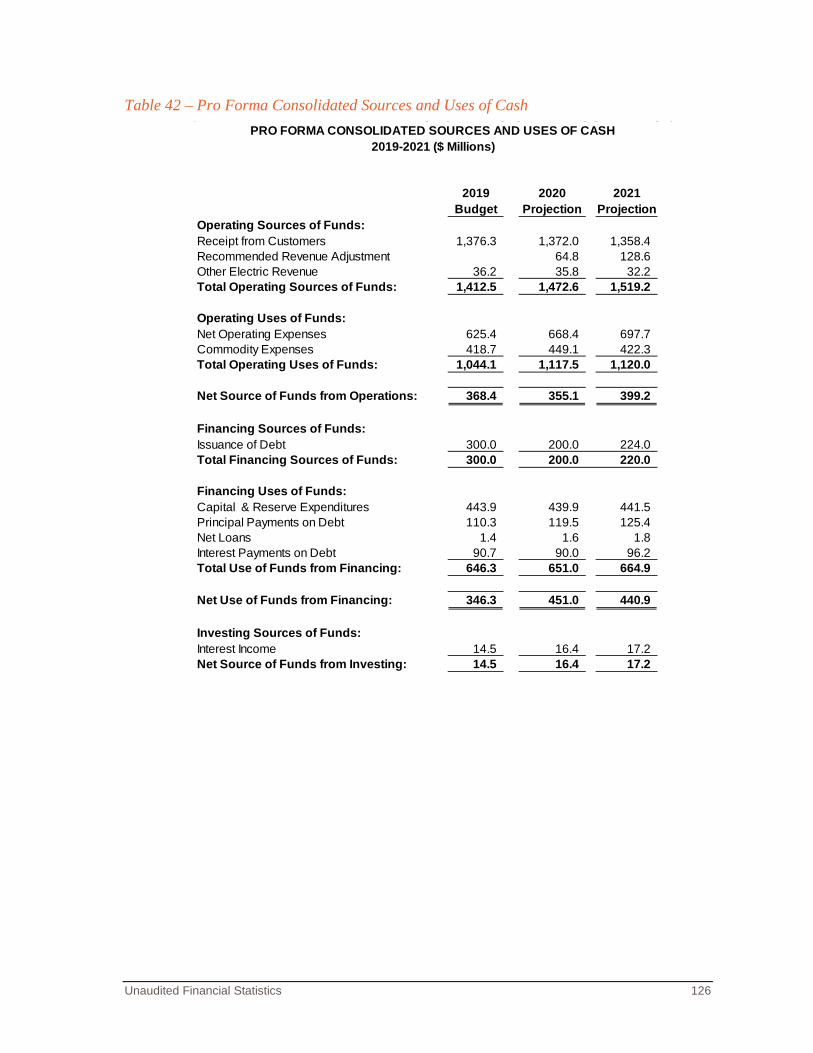
Unaudited Financial Statistics 126
Table 42 – Pro Forma Consolidated Sources and Uses of Cash
2019 2020 2021Budget Projection Projection
Operating Sources of Funds:Receipt from Customers 1,376.3 1,372.0 1,358.4 Recommended Revenue Adjustment 64.8 128.6 Other Electric Revenue 36.2 35.8 32.2 Total Operating Sources of Funds: 1,412.5 1,472.6 1,519.2
Operating Uses of Funds:Net Operating Expenses 625.4 668.4 697.7 Commodity Expenses 418.7 449.1 422.3 Total Operating Uses of Funds: 1,044.1 1,117.5 1,120.0
Net Source of Funds from Operations: 368.4 355.1 399.2
Financing Sources of Funds:Issuance of Debt 300.0 200.0 224.0 Total Financing Sources of Funds: 300.0 200.0 220.0
Financing Uses of Funds:Capital & Reserve Expenditures 443.9 439.9 441.5 Principal Payments on Debt 110.3 119.5 125.4 Net Loans 1.4 1.6 1.8 Interest Payments on Debt 90.7 90.0 96.2 Total Use of Funds from Financing: 646.3 651.0 664.9
Net Use of Funds from Financing: 346.3 451.0 440.9
Investing Sources of Funds:Interest Income 14.5 16.4 17.2 Net Source of Funds from Investing: 14.5 16.4 17.2
PRO FORMA CONSOLIDATED SOURCES AND USES OF CASH2019-2021 ($ Millions)
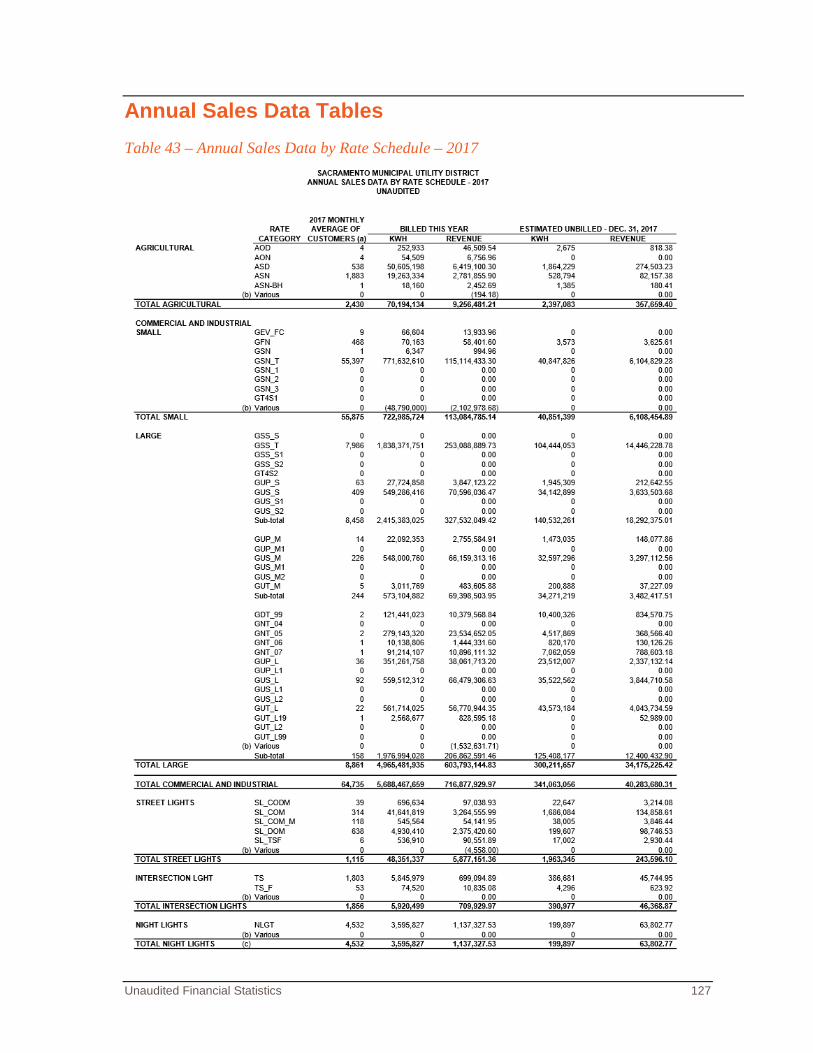
Unaudited Financial Statistics 127
Annual Sales Data Tables Table 43 – Annual Sales Data by Rate Schedule – 2017
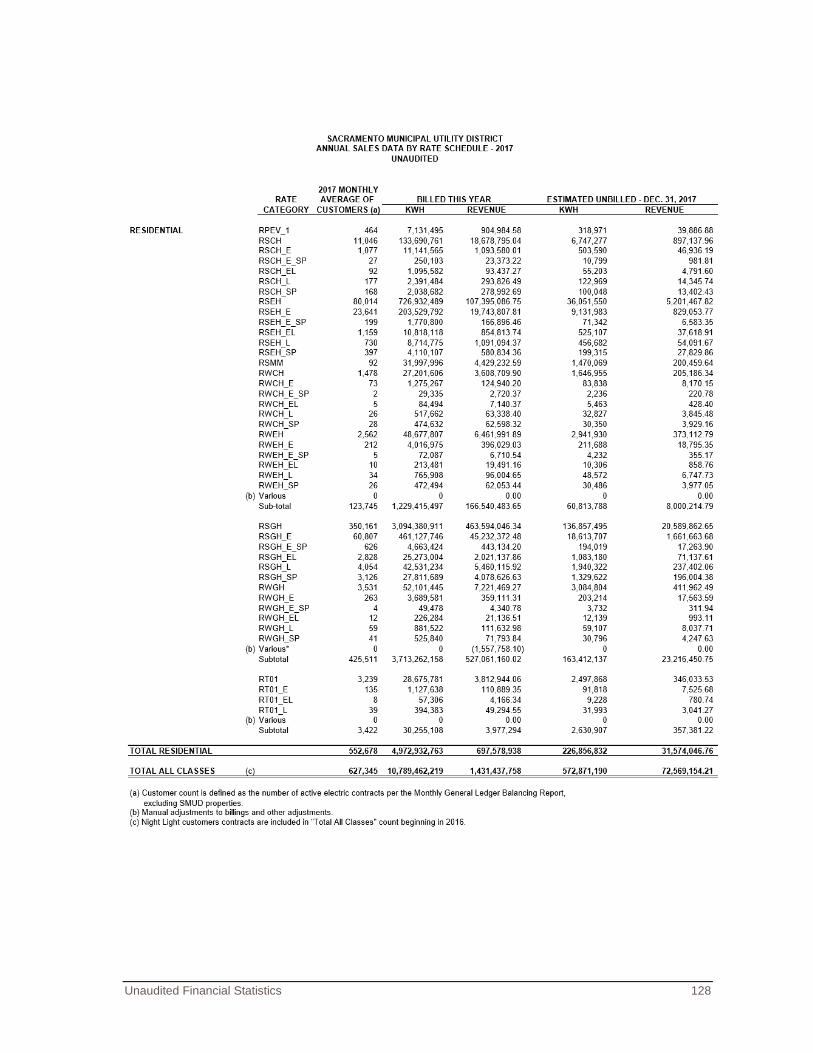
Unaudited Financial Statistics 128
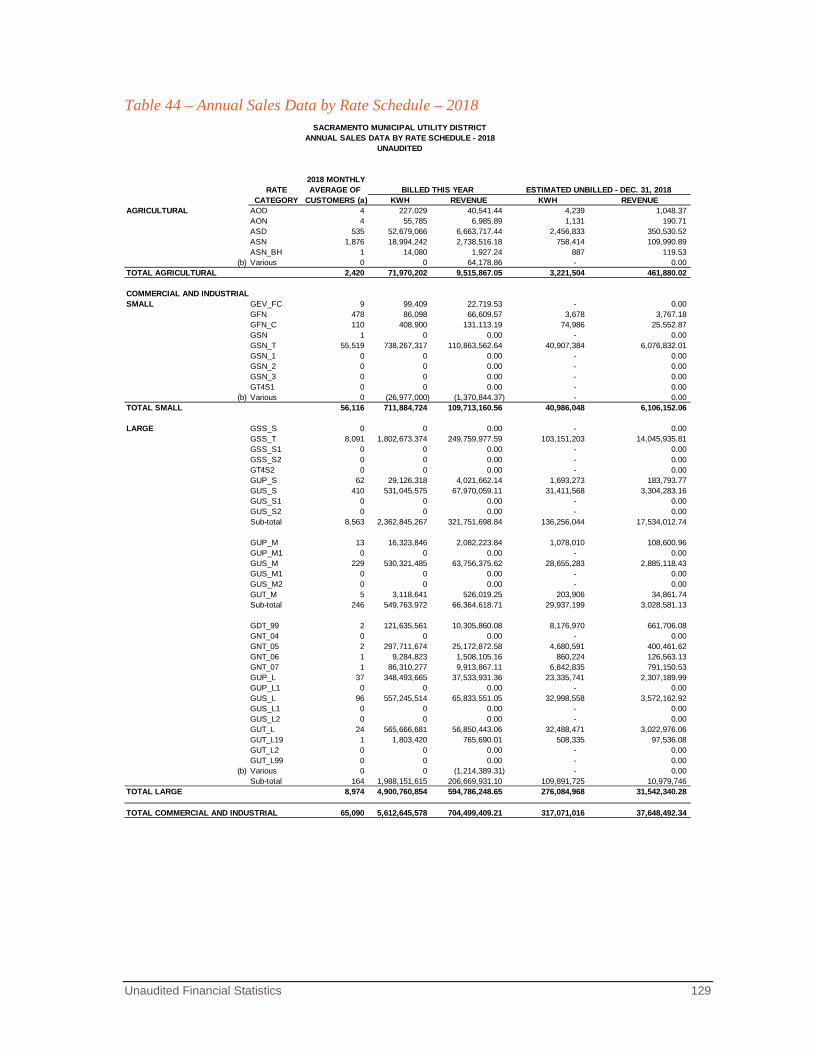
Unaudited Financial Statistics 129
Table 44 – Annual Sales Data by Rate Schedule – 2018
SACRAMENTO MUNICIPAL UTILITY DISTRICTANNUAL SALES DATA BY RATE SCHEDULE - 2018
UNAUDITED
2018 MONTHLYRATE AVERAGE OF
CATEGORY CUSTOMERS (a) KWH REVENUE KWH REVENUEAGRICULTURAL AOD 4 227,029 40,541.44 4,239 1,048.37
AON 4 55,785 6,985.89 1,131 190.71ASD 535 52,679,066 6,663,717.44 2,456,833 350,530.52ASN 1,876 18,994,242 2,738,516.18 758,414 109,990.89ASN_BH 1 14,080 1,927.24 887 119.53
(b) Various_1 0 0 64,178.86 - 0.00TOTAL AGRICULTURAL 2,420 71,970,202 9,515,867.05 3,221,504 461,880.02
COMMERCIAL AND INDUSTRIALSMALL GEV_FC 9 99,409 22,719.53 - 0.00
GFN 478 86,098 66,609.57 3,678 3,767.18GFN_C 110 408,900 131,113.19 74,986 25,552.87GSN 1 0 0.00 - 0.00GSN_T 55,519 738,267,317 110,863,562.64 40,907,384 6,076,832.01GSN_1 0 0 0.00 - 0.00GSN_2 0 0 0.00 - 0.00GSN_3 0 0 0.00 - 0.00GT4S1 0 0 0.00 - 0.00
(b) Various_2 0 (26,977,000) (1,370,844.37) - 0.00TOTAL SMALL 56,116 711,884,724 109,713,160.56 40,986,048 6,106,152.06
LARGE GSS_S 0 0 0.00 - 0.00GSS_T 8,091 1,802,673,374 249,759,977.59 103,151,203 14,045,935.81GSS_S1 0 0 0.00 - 0.00GSS_S2 0 0 0.00 - 0.00GT4S2 0 0 0.00 - 0.00GUP_S 62 29,126,318 4,021,662.14 1,693,273 183,793.77GUS_S 410 531,045,575 67,970,059.11 31,411,568 3,304,283.16GUS_S1 0 0 0.00 - 0.00GUS_S2 0 0 0.00 - 0.00Sub-total 8,563 2,362,845,267 321,751,698.84 136,256,044 17,534,012.74
GUP_M 13 16,323,846 2,082,223.84 1,078,010 108,600.96GUP_M1 0 0 0.00 - 0.00GUS_M 229 530,321,485 63,756,375.62 28,655,283 2,885,118.43GUS_M1 0 0 0.00 - 0.00GUS_M2 0 0 0.00 - 0.00GUT_M 5 3,118,641 526,019.25 203,906 34,861.74Sub-total 246 549,763,972 66,364,618.71 29,937,199 3,028,581.13
GDT_99 2 121,635,561 10,305,860.08 8,176,970 661,706.08GNT_04 0 0 0.00 - 0.00GNT_05 2 297,711,674 25,172,872.58 4,680,591 400,461.62GNT_06 1 9,284,823 1,508,105.16 860,224 126,563.13GNT_07 1 86,310,277 9,913,867.11 6,842,835 791,150.53GUP_L 37 348,493,665 37,533,931.36 23,335,741 2,307,189.99GUP_L1 0 0 0.00 - 0.00GUS_L 96 557,245,514 65,833,551.05 32,998,558 3,572,162.92GUS_L1 0 0 0.00 - 0.00GUS_L2 0 0 0.00 - 0.00GUT_L 24 565,666,681 56,850,443.06 32,488,471 3,022,976.06GUT_L19 1 1,803,420 765,690.01 508,335 97,536.08GUT_L2 0 0 0.00 - 0.00GUT_L99 0 0 0.00 - 0.00
(b) Various_3 0 0 (1,214,389.31) - 0.00Sub-total 164 1,988,151,615 206,669,931.10 109,891,725 10,979,746
TOTAL LARGE 8,974 4,900,760,854 594,786,248.65 276,084,968 31,542,340.28
TOTAL COMMERCIAL AND INDUSTRIAL 65,090 5,612,645,578 704,499,409.21 317,071,016 37,648,492.34
BILLED THIS YEAR ESTIMATED UNBILLED - DEC. 31, 2018
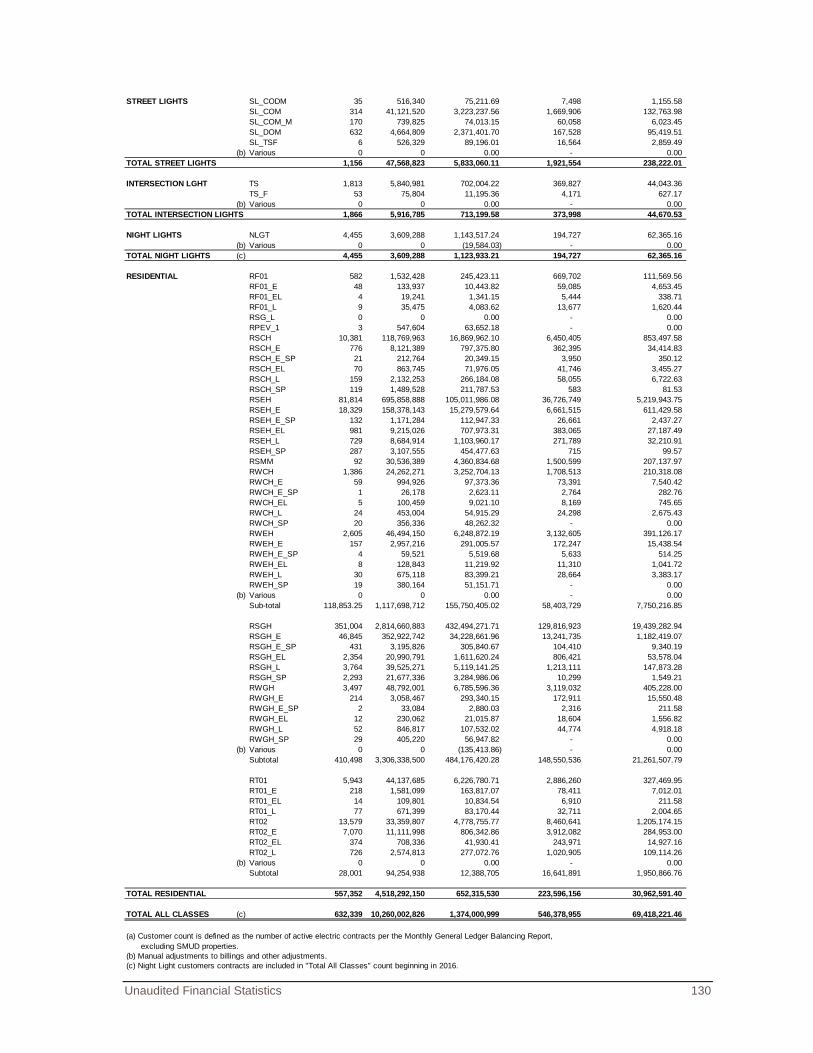
Unaudited Financial Statistics 130
STREET LIGHTS SL_CODM 35 516,340 75,211.69 7,498 1,155.58SL_COM 314 41,121,520 3,223,237.56 1,669,906 132,763.98SL_COM_M 170 739,825 74,013.15 60,058 6,023.45SL_DOM 632 4,664,809 2,371,401.70 167,528 95,419.51SL_TSF 6 526,329 89,196.01 16,564 2,859.49
(b) Various_4 0 0 0.00 - 0.00TOTAL STREET LIGHTS 1,156 47,568,823 5,833,060.11 1,921,554 238,222.01
INTERSECTION LGHT TS 1,813 5,840,981 702,004.22 369,827 44,043.36
TS_F 53 75,804 11,195.36 4,171 627.17(b) Various_5 0 0 0.00 - 0.00
TOTAL INTERSECTION LIGHTS 1,866 5,916,785 713,199.58 373,998 44,670.53
NIGHT LIGHTS NLGT 4,455 3,609,288 1,143,517.24 194,727 62,365.16(b) Various_6 0 0 (19,584.03) - 0.00
TOTAL NIGHT LIGHTS (c) 4,455 3,609,288 1,123,933.21 194,727 62,365.16
RESIDENTIAL RF01 582 1,532,428 245,423.11 669,702 111,569.56RF01_E 48 133,937 10,443.82 59,085 4,653.45RF01_EL 4 19,241 1,341.15 5,444 338.71RF01_L 9 35,475 4,083.62 13,677 1,620.44RSG_L 0 0 0.00 - 0.00RPEV_1 3 547,604 63,652.18 - 0.00RSCH 10,381 118,769,963 16,869,962.10 6,450,405 853,497.58RSCH_E 776 8,121,389 797,375.80 362,395 34,414.83RSCH_E_SP 21 212,764 20,349.15 3,950 350.12RSCH_EL 70 863,745 71,976.05 41,746 3,455.27RSCH_L 159 2,132,253 266,184.08 58,055 6,722.63RSCH_SP 119 1,489,528 211,787.53 583 81.53RSEH 81,814 695,858,888 105,011,986.08 36,726,749 5,219,943.75RSEH_E 18,329 158,378,143 15,279,579.64 6,661,515 611,429.58RSEH_E_SP 132 1,171,284 112,947.33 26,661 2,437.27RSEH_EL 981 9,215,026 707,973.31 383,065 27,187.49RSEH_L 729 8,684,914 1,103,960.17 271,789 32,210.91RSEH_SP 287 3,107,555 454,477.63 715 99.57RSMM 92 30,536,389 4,360,834.68 1,500,599 207,137.97RWCH 1,386 24,262,271 3,252,704.13 1,708,513 210,318.08RWCH_E 59 994,926 97,373.36 73,391 7,540.42RWCH_E_SP 1 26,178 2,623.11 2,764 282.76RWCH_EL 5 100,459 9,021.10 8,169 745.65RWCH_L 24 453,004 54,915.29 24,298 2,675.43RWCH_SP 20 356,336 48,262.32 - 0.00RWEH 2,605 46,494,150 6,248,872.19 3,132,605 391,126.17RWEH_E 157 2,957,216 291,005.57 172,247 15,438.54RWEH_E_SP 4 59,521 5,519.68 5,633 514.25RWEH_EL 8 128,843 11,219.92 11,310 1,041.72RWEH_L 30 675,118 83,399.21 28,664 3,383.17RWEH_SP 19 380,164 51,151.71 - 0.00
(b) Various_7 0 0 0.00 - 0.00Sub-total 118,853.25 1,117,698,712 155,750,405.02 58,403,729 7,750,216.85
RSGH 351,004 2,814,660,883 432,494,271.71 129,816,923 19,439,282.94RSGH_E 46,845 352,922,742 34,228,661.96 13,241,735 1,182,419.07RSGH_E_SP 431 3,195,826 305,840.67 104,410 9,340.19RSGH_EL 2,354 20,990,791 1,611,620.24 806,421 53,578.04RSGH_L 3,764 39,525,271 5,119,141.25 1,213,111 147,873.28RSGH_SP 2,293 21,677,336 3,284,986.06 10,299 1,549.21RWGH 3,497 48,792,001 6,785,596.36 3,119,032 405,228.00RWGH_E 214 3,058,467 293,340.15 172,911 15,550.48RWGH_E_SP 2 33,084 2,880.03 2,316 211.58RWGH_EL 12 230,062 21,015.87 18,604 1,556.82RWGH_L 52 846,817 107,532.02 44,774 4,918.18RWGH_SP 29 405,220 56,947.82 - 0.00
(b) Various_8 0 0 (135,413.86) - 0.00Subtotal 410,498 3,306,338,500 484,176,420.28 148,550,536 21,261,507.79
RT01 5,943 44,137,685 6,226,780.71 2,886,260 327,469.95RT01_E 218 1,581,099 163,817.07 78,411 7,012.01RT01_EL 14 109,801 10,834.54 6,910 211.58RT01_L 77 671,399 83,170.44 32,711 2,004.65RT02 13,579 33,359,807 4,778,755.77 8,460,641 1,205,174.15RT02_E 7,070 11,111,998 806,342.86 3,912,082 284,953.00RT02_EL 374 708,336 41,930.41 243,971 14,927.16RT02_L 726 2,574,813 277,072.76 1,020,905 109,114.26
(b) Various_9 0 0 0.00 - 0.00Subtotal 28,001 94,254,938 12,388,705 16,641,891 1,950,866.76
TOTAL RESIDENTIAL 557,352 4,518,292,150 652,315,530 223,596,156 30,962,591.40
TOTAL ALL CLASSES (c) 632,339 10,260,002,826 1,374,000,999 546,378,955 69,418,221.46
(a) Customer count is defined as the number of active electric contracts per the Monthly General Ledger Balancing Report, excluding SMUD properties.(b) Manual adjustments to billings and other adjustments.(c) Night Light customers contracts are included in "Total All Classes" count beginning in 2016.

Audited Financial Statements 131
Audited Financial Statements December 31, 2018 and 2017

THIS PAGE INTENTIONALLY LEFT BLANK
0156+-19
Consolidated Financial Statements
Report of Independent Auditors
December 31, 2018 and 2017
SACRAMENTO MUNICIPAL UTILITY DISTRICT TABLE OF CONTENTS
As of and for the Years Ended December 31, 2018 and 2017
Report of Independent Auditors 1 Management’s Discussion and Analysis - Unaudited 3 Consolidated Financial Statements 16 Notes to Consolidated Financial Statements Note 1. Organization 21 Note 2. Summary of Significant Accounting Policies 21 Note 3. Accounting Change 30 Note 4. Utility Plant 32 Note 5. Investment in Joint Powers Authority 33 Note 6. Component Units 35 Note 7. Cash, Cash Equivalents, and Investments 39 Note 8. Regulatory Deferrals 42 Note 9. Derivative Financial Instruments 44 Note 10. Long-term Debt 49 Note 11. Commercial Paper Notes 54 Note 12. Fair Value Measurement 55 Note 13. Rancho Seco Decommissioning Liability 57 Note 14. Pension Plans 58 Note 15. Other Postemployment Benefits 64 Note 16. Insurance Programs and Claims 68 Note 17. Commitments 69 Note 18. Claims and Contingencies 70 Required Supplementary Information - Unaudited 72

THIS PAGE INTENTIONALLY LEFT BLANK
1
INDEPENDENT AUDITORS’ REPORT
To the Board of Directors of Sacramento Municipal Utility District Sacramento, California
Report on the Financial Statements
We have audited the accompanying consolidated financial statements of Sacramento Municipal Utility District and its blended component units, which comprise the Consolidated Statements of Net Position as of December 31, 2018 and 2017, and the related Consolidated Statements of Revenues, Expenses and Changes in Net Position, and Consolidated Statements of Cash Flows for the years then ended and the related notes to the consolidated financial statements.
Management’s Responsibility for the Financial Statements
Management is responsible for the preparation and fair presentation of these consolidated financial statements in accordance with accounting principles generally accepted in the United States of America; this includes the design, implementation, and maintenance of internal control relevant to the preparation and fair presentation of the consolidated financial statements that are free from material misstatement, whether due to fraud or error.
Auditors’ Responsibility
Our responsibility is to express an opinion on these consolidated financial statements based on our audits. We conducted our audits in accordance with auditing standards generally accepted in the United States of America and the standards applicable to financial audits contained in Government Auditing Standards issued by the Comptroller General of the United States. Those standards require that we plan and perform the audit to obtain reasonable assurance about whether the consolidated financial statements are free from material misstatement.
An audit involves performing procedures to obtain audit evidence about the amounts and disclosures in the consolidated financial statements. The procedures selected depend on the auditors’ judgment, including the assessment of the risks of material misstatement of the consolidated financial statements, whether due to fraud or error. In making those risk assessments, the auditor considers internal control over financial reporting relevant to the Sacramento Municipal Utility District’s preparation and fair presentation of the consolidated financial statements in order to design audit procedures that are appropriate in the circumstances, but not for the purpose of expressing an opinion on the effectiveness of the Sacramento Municipal Utility District’s internal control. Accordingly, we express no such opinion. An audit also includes evaluating the appropriateness of accounting policies used and the reasonableness of significant accounting estimates made by management, as well as evaluating the overall presentation of the consolidated financial statements.
We believe that the audit evidence we have obtained is sufficient and appropriate to provide a basis for our audit opinion.
Baker Tilly Virchow Krause, LLP trading as Baker Tilly is a member of the global network of Baker Tilly International Ltd., the members of which are separate and independent legal entities. © 2018 Baker Tilly Virchow Krause, LLP
2
Opinion In our opinion, the consolidated financial statements referred to above present fairly, in all material respects, the financial position of Sacramento Municipal Utility District and its blended component units at December 31, 2018 and 2017, and the respective changes in their financial position and their cash flows thereof for the years then ended, in accordance with accounting principles generally accepted in the United States of America. Emphasis of Matter As discussed in Note 3 to the financial statements, the Sacramento Municipal Utility District has adopted the provisions of Governmental Accounting Standards Board Statement No. 75 – Accounting and Financial reporting for Postemployment Benefits Other Than Pensions effective January 1, 2017. Accordingly, the accounting changes have been retroactively applied to prior periods presented. Our opinion is not modified with respect to this matter. Other Matter Accounting principles generally accepted in the United States of America require that the Management's Discussion and Analysis and Schedule of Funding Progress information as listed in the table of contents be presented to supplement the consolidated financial statements. Such information, although not a part of the consolidated financial statements, is required by the Governmental Accounting Standards Board who considers it to be an essential part of financial reporting for placing the consolidated financial statements in an appropriate operational, economic, or historical context. We have applied certain limited procedures to the required supplementary information in accordance with auditing standards generally accepted in the United States of America, which consisted of inquiries of management about the methods of preparing the information and comparing the information for consistency with management's responses to our inquiries, the consolidated financial statements, and other knowledge we obtained during our audit of the consolidated financial statements. We do not express an opinion or provide any assurance on the information because the limited procedures do not provide us with sufficient evidence to express an opinion or provide any assurance. Other Reporting Required by Government Auditing Standards In accordance with Government Auditing Standards, we will also issue a report on our consideration of Sacramento Municipal Utility District’s internal control over financial reporting and on our tests of its compliance with certain provisions of laws, regulations, contracts, grant agreements, and other matters. The purpose of that report is to describe the scope of our testing of internal control over financial reporting and compliance and the results of that testing, and not to provide an opinion on the internal control over financial reporting or on compliance. That report is an integral part of an audit performed in accordance with Government Auditing Standards in considering Sacramento Municipal Utility District’s internal control over financial reporting and compliance.
Madison, Wisconsin February 15, 2019
3
Sacramento Municipal Utility District Management’s Discussion and Analysis - Unaudited For the Years Ended December 31, 2018 and 2017
Using this Financial Report This annual financial report for Sacramento Municipal Utility District (SMUD) consists of management’s discussion and analysis and the consolidated financial statements, including notes to consolidated financial statements. The Consolidated Financial Statements consist of the Statements of Net Position, the Statements of Revenue, Expenses and Changes in Net Position and the Statements of Cash Flows. SMUD maintains its accounting records in accordance with Generally Accepted Accounting Principles for proprietary funds as prescribed by the Governmental Accounting Standards Board (GASB). SMUD’s accounting records generally follow the Uniform System of Accounts for Public Utilities and Licensees prescribed by the Federal Energy Regulatory Commission (FERC), except as it relates to accounting for contributions of utility property in aid of construction. Overview of the Financial Statements The following discussion and analysis of the financial performance of SMUD provides an overview of the financial activities for the years ended December 31, 2018 and 2017. This discussion and analysis should be read in conjunction with the consolidated financial statements and accompanying notes, which follow this section. The Consolidated Statements of Net Position provide information about the nature and amount of resources and obligations at a specific point in time. The Consolidated Statements of Revenues, Expenses and Changes in Net Position report all of SMUD’s revenues and expenses for the periods shown. The Consolidated Statements of Cash Flows report the cash provided and used by operating activities, as well as other cash sources, such as investment income and debt financing, and other cash uses such as payments for debt service and capital additions. The Notes to Consolidated Financial Statements provide additional detailed information to support the financial statements. Nature of Operations Under provisions of California’s Municipal Utility District Act, the citizens of Sacramento voted in 1923 to form their own electric utility – SMUD. The independently run community-owned utility began operations on December 31, 1946 and is not subject to regulation or oversight by the California Public Utilities Commission. It is now the sixth largest community-owned electric utility in the nation. Governed by an elected board of directors (Board), SMUD has the rights and powers to fix rates and charges for commodities and services it furnishes, incur indebtedness, and issue bonds or other obligations. SMUD is responsible for the acquisition, generation, transmission and distribution of electric power to its service area with a population of approximately 1.5 million – most of Sacramento County and small adjoining portions of Placer and Yolo Counties. Its purpose is to enhance the quality of life for its customers and community through creative energy solutions. The Board has independent authority to set SMUD’s rates and charges. Changes in rates require a public hearing and formal action by the Board. In July 2015, the Board approved a 2.5 percent rate increase for both 2016 and 2017 to allow for additional investments in technology and infrastructure and declared its intent to make time-of-day (TOD) rates the default rate for
4
residential customers in 2018. In July 2017, the Board approved a 1 percent rate increase in both 2018 and 2019 for commercial customers and a 1.5 percent rate increase in 2018 for residential customers and approved the TOD rate as the standard rate for residential customers in 2019. In 2018, SMUD began rolling out the transition to TOD rates, as well as changes to its Energy Assistance Program Rate (EAPR), which supports low-income customers. TOD rates better align with the cost of providing electricity, send more accurate price signals to customers, and give customers the opportunity to better manage their electricity bills by shifting usage to lower-cost time periods. Changes to EAPR help ensure SMUD provides the greatest support to customers most in need, to save energy and money through a combination of rate design, energy-efficiency investments, pilot programs and education. The 2018 Rate Action also changed the Economic development rate and Rule 16 fees, which will help spur regional economic development, support job creation, and provide incentives to businesses located in disadvantaged communities. Even with these increases, SMUD’s rates continue to remain amongst the lowest in the state. In 2018, the average system rate was 33 percent below the average rate of the nearest investor owned utility. SMUD’s vision is to be the trusted partner with its customers and the community, providing innovative solutions to ensure energy affordability and reliability, improve the environment, reduce the region’s carbon footprint, and enhance the vitality of the community. SMUD’s business strategy focuses on serving its customers in a progressive, forward looking manner, addressing current regulatory and legislative issues and potential competitive forces. This includes ensuring financial stability by establishing rates that provide acceptable cash coverage of all fixed charges on a consolidated basis, taking into consideration the impact of capital expenditures and other factors on cash flow. Financial & Operational Highlights In 2018, SMUD updated its 5-Year Strategic plan to ensure work is aligned with fulfilling the Board’s Strategic Directions and customers’ expectations for safe, reliable, affordable and environmentally responsible energy, while adapting to a rapidly changing industry, technology advances and growing customer expectations. The Board adopted aggressive carbon reduction goals as part of the new Integrated Resource Plan. The plan sets a greenhouse gas (GHG) target of net zero by 2040, which SMUD will achieve through a commitment to procuring local renewable energy whenever feasible, and significant investment in electrification of the local building and transportation sectors. Together, these efforts are expected to reduce GHG emissions in the Sacramento region by 64%, delivering significant benefits to the community and regional economy. SMUD continued to maintain its strong bond ratings of AA by two of the three major rating agencies and has consistently exceeded the Board’s policy for a minimum fixed charge coverage ratio of 1.50 times of annual budgets for the last ten years. In addition, approximately 30% of contract dollars were awarded to small, local businesses and $15.0 million was deposited in local community banks as a participant in the new Responsible Investments for a Stronger Economy (RISE) program.
SMUD received two industry awards for the EAPR restructure in 2018 and was also recognized by its residential customers as the top California utility by J.D. Power and was ranked second highest in the West region for commercial customers. SMUD received an industry community service award for several of its significant campaigns: SMUD Cares, 70 years Bright, Shine awards, and Powering Futures Scholarships. SMUD continued its partnership with Habitat for Humanity by completing rooftop repairs for solar installations, as well as installed solar kits on tiny homes. Building electrification programs resulted in a partnership with D.R. Horton to build more than 100 new all-electric homes. Its 28-year partnership with the Sacramento Tree Foundation resulted in an additional 10,000 trees planted in 2018. The Large Commercial SolarShares® program increased to about 150 MW, making it one of the largest programs of its kind in the nation. This program also received a 2018 Green California Summit Leadership award. Through its economic development program, SMUD played a key role in the attraction, retention and expansion of several companies in its service territory which led to the creation of over 2,700 jobs. In July 2014, FERC issued a fifty year license for the Upper American River Project (UARP) which consists of three relatively large storage reservoirs and eight powerhouses containing eleven turbines. The UARP is one of SMUD’s lowest cost power sources. In addition to providing clean hydroelectric power and operational flexibility, it provides habitat for fish and wildlife and a variety of recreational opportunities, including camping, fishing, boating, hiking, horseback riding,
5
mountain biking, and cross-country skiing. The combined capacity of the UARP is approximately 673 MW and represents about 15 percent of SMUD’s average annual retail energy requirements. SMUD’s other power generation facilities include a 3 MW of solar photovoltaic installations, a 102 MW Solano Wind Project, and five local gas-fired power plants with total capacity of approximately 1,012 MW. Also, in April 2018, SMUD exercised its option to repurchase the Solano Wind Phase 3 plant consisting of 128 MW. In addition, SMUD has entered into several power purchase agreements to help meet its remaining power requirements. As part of the hydro relicensing process, SMUD entered into long-term contracts to provide certain services to four different government agencies – U.S. Department of Interior Bureau of Land Management, U.S. Department of Agriculture Forest Service, El Dorado County, and the California Department of Parks and Recreation. At December 31, 2018 and 2017, the liability for these contract payments was $58.8 million and $57.8 million, respectively. As of September 2018, SMUD’s total reservoir storage in the UARP was about 67 percent of capacity, approximately 1% below the historical average for this date. SMUD manages its reservoirs to maximize water storage going into the summer season and thereby preserving generating capacity during SMUD’s high load months. Although reservoir levels in the UARP are only slightly below historical averages, there remains the potential for wide swings in precipitation from year to year and dry conditions could return again in any year. In years with below average rainfall, SMUD may have to generate or purchase replacement energy at additional cost. A Hydro Rate Stabilization Fund (HRSF) was established to help absorb higher energy costs when hydroelectric production is down and to serve as a buffer against unexpected financial developments. In April 2018, $1.7 million was transferred into the HRSF due to above average precipitation. The balance in the HRSF at December 31, 2018 and 2017 was $64.1 million and $62.4 million, respectively. SMUD also has a long-term agreement with the Western Area Power Administration (WAPA) to purchase power generated by the Central Valley Project, a series of federal hydroelectric facilities operated by the U.S. Bureau of Reclamation. SMUD uses a Rate Stabilization Fund (RSF) to offset any excess or deficits in WAPA energy deliveries. Due to deficits in deliveries by WAPA, $4.9 million was transferred from the RSF in 2018 and excess deliveries in 2017 resulted in a $12.3 million transfer to the RSF in 2017. At December 31, 2018 and 2017, the balance of the RSF was $32.6 million and $37.5 million, respectively. Decommissioning SMUD has made significant progress toward completing the Decommissioning Plan for its Rancho Seco nuclear facility, which was shut down in 1989. The plan consists of two phases that allow SMUD to terminate its possession-only license. Phase I of the decommissioning was completed at the end of 2008. Phase II consists of a storage period for the Class B and Class C radioactive waste overseen by the existing facility staff, followed by shipment of the waste for disposal, and then complete termination of the possession-only license. SMUD also established and funded an external decommissioning trust fund as part of its assurance to the Nuclear Regulatory Commission (NRC) to pay for the cost of decommissioning. Shipment of the previously stored Class B and Class C radioactive waste was completed in November 2014 to a low-level radioactive waste facility located in Andrews, Texas. The remaining Phase II decommissioning activities required for termination of the possession-only license commenced in 2015. In September 2017, SMUD formally requested the termination of the possession-only license and termination of the possession-only license was completed in 2018. The Accrued Decommissioning balance in the Consolidated Statements of Net Position includes $156.5 million and $149.8 million for costs related to Rancho Seco as of December 31, 2018 and 2017, respectively. As part of the Decommissioning Plan, the nuclear fuel and Greater Than Class C (GTCC) radioactive waste is being stored in a dry storage facility constructed by SMUD and licensed separately by the NRC. The U.S. Department of Energy (DOE), under the Nuclear Waste Policy Act of 1982, was responsible for permanent disposal of used nuclear fuel and GTCC radioactive waste and SMUD contracted with the DOE for removal and disposal of that waste. The DOE has yet to fulfill its contractual obligation to provide a permanent waste disposal site. SMUD has filed a series of successful lawsuits against the
6
federal government for recovery of the past spent fuel costs, with recoveries to date in excess of $104.0 million. SMUD will continue to pursue cost recovery claims until the DOE fulfills its obligation. Employee Relations and Benefits Effective January 2018, SMUD began operating under a new four year memorandum of understanding (MOU) with both of its collective bargaining units, the International Brotherhood of Electrical Workers Local Union 1245 and the Organization of SMUD Employees. Both contracts contain a no-strike/no-lockout clause effective during the life of the agreements. SMUD participates in the California Public Employees’ Retirement System (PERS), an agent multiple-employer public employee defined benefit pension plan. In 2015, SMUD implemented GASB Statement of Governmental Accounting Standards (SGAS) No. 68, “Accounting and Financial Reporting for Pensions – An Amendment of GASB Statement No. 27,” and in 2017, SGAS No. 73, “Accounting and Financial Reporting for Pensions and Related Assets that are not within the Scope of GASB Statement 68, and Amendments to Certain Provisions of GASB Statements 67 and 68”. The primary objective of these standards is to improve accounting and financial reporting by state and local governments for pensions. SMUD is required to report the Net Pension Liability (NPL), which is the difference between the actuarial present value of projected pension benefit payments attributable to employees’ past service and the pension plan’s fiduciary net position, in its Consolidated Statements of Net Position. At December 31, 2018 and 2017, the NPL was $454.0 million and $565.8 million, respectively. SMUD elected to follow accounting for regulated operations under GASB SGAS No. 62, “Codification of Accounting and Financial Reporting Guidance Contained in Pre-November 30, 1989 FASB and AICPA Pronouncements,” (GASB No. 62) and recorded a regulatory asset as of December 31, 2014, in the amount of $425.7 million to account for the net effect of required prior period adjustments to recognize the NPL. Amortization of the regulatory asset began in 2018 over a period of 25 years. SMUD provides postemployment healthcare benefits (OPEB) to all employees who retire from SMUD and their dependents, in accordance with SMUD policy and MOUs. These benefits are funded through the PERS California Employer’s Retiree Benefit Trust, an agent multiple-employer plan. In 2018, SMUD implemented SGAS No. 75 “Accounting and Financial Reporting for Postemployment Benefits Other than Pensions” (GASB No. 75). The primary objective of GASB No. 75 is to improve accounting and financial reporting by state and local governments for postemployment benefits other than pensions. SMUD is required to report the Net OPEB Liability (NOL), which is the difference between the actuarial present value of projected OPEB benefit payments attributable to employee’s past service and the OPEB plan’s fiduciary net position, in its Consolidated Statements of Net Position. At December 31, 2018 and 2017, the NOL was $22.1 million and $100.9 million, respectively. SMUD elected to follow accounting for regulated operations under GASB No. 62 and recorded a regulatory asset as of December 31, 2017, in the amount of $319.3 million to account for the net effect of required prior period adjustments to recognize the NOL. Amortization of the regulatory asset will begin in 2020 over a period of 25 years. Developments in the Energy Market New developments in the energy market at both the federal and state level kept SMUD on high alert as it continued to monitor and address the potential impacts on the organization. Legislation at the federal level include policies on cyber security, regulations related to transmission access, the North American Electric Reliability Corporation reliability standards, anti-market manipulation rules, and greenhouse gas emissions. Legislation at the state level includes bills that provide for GHG standards and greater investment in energy efficiency, mandate rooftop solar, renewable portfolio standards, and ongoing regulatory proceedings related to Sacramento - San Joaquin River Bay - Delta processes.
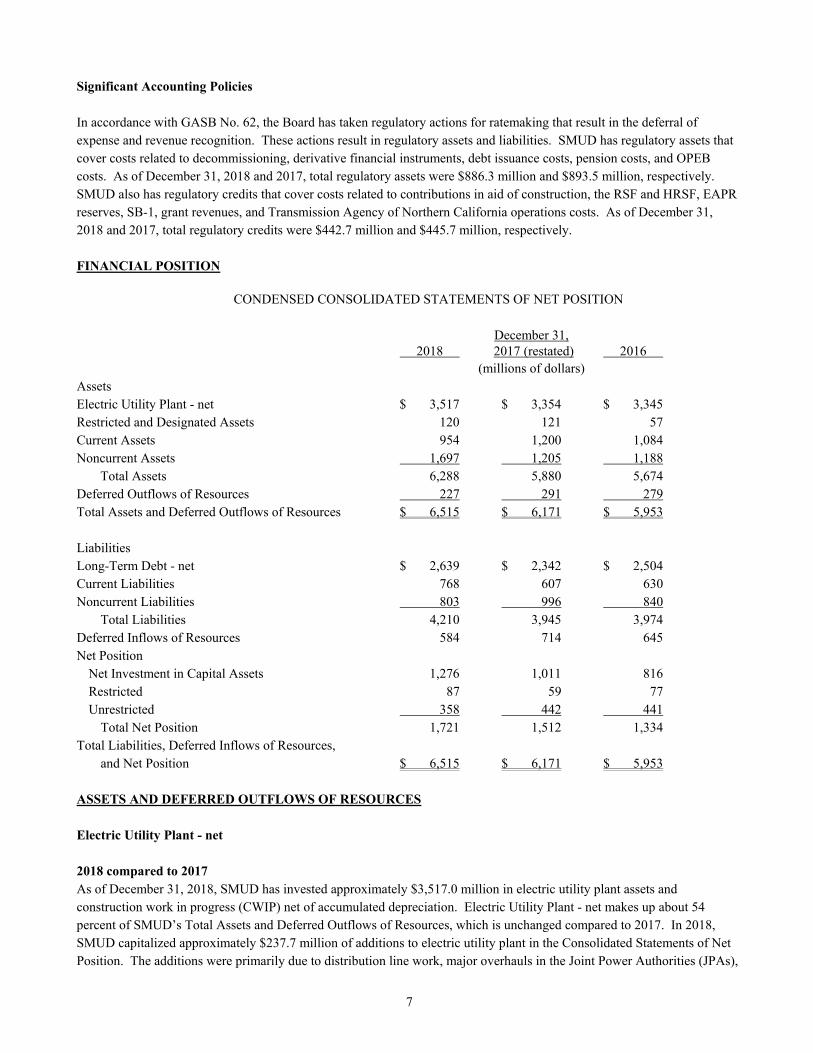
7
Significant Accounting Policies In accordance with GASB No. 62, the Board has taken regulatory actions for ratemaking that result in the deferral of expense and revenue recognition. These actions result in regulatory assets and liabilities. SMUD has regulatory assets that cover costs related to decommissioning, derivative financial instruments, debt issuance costs, pension costs, and OPEB costs. As of December 31, 2018 and 2017, total regulatory assets were $886.3 million and $893.5 million, respectively. SMUD also has regulatory credits that cover costs related to contributions in aid of construction, the RSF and HRSF, EAPR reserves, SB-1, grant revenues, and Transmission Agency of Northern California operations costs. As of December 31, 2018 and 2017, total regulatory credits were $442.7 million and $445.7 million, respectively. FINANCIAL POSITION
CONDENSED CONSOLIDATED STATEMENTS OF NET POSITION December 31,
2018 2017 (restated) 2016 (millions of dollars)
Assets Electric Utility Plant - net $ 3,517 $ 3,354 $ 3,345 Restricted and Designated Assets 120 121 57 Current Assets 954 1,200 1,084 Noncurrent Assets 1,697 1,205 1,188 Total Assets 6,288 5,880 5,674 Deferred Outflows of Resources 227 291 279 Total Assets and Deferred Outflows of Resources $ 6,515 $ 6,171 $ 5,953
Liabilities Long-Term Debt - net $ 2,639 $ 2,342 $ 2,504 Current Liabilities 768 607 630 Noncurrent Liabilities 803 996 840 Total Liabilities 4,210 3,945 3,974 Deferred Inflows of Resources 584 714 645 Net Position Net Investment in Capital Assets 1,276 1,011 816 Restricted 87 59 77 Unrestricted 358 442 441 Total Net Position 1,721 1,512 1,334 Total Liabilities, Deferred Inflows of Resources, and Net Position $ 6,515 $ 6,171 $ 5,953
ASSETS AND DEFERRED OUTFLOWS OF RESOURCES Electric Utility Plant - net 2018 compared to 2017 As of December 31, 2018, SMUD has invested approximately $3,517.0 million in electric utility plant assets and construction work in progress (CWIP) net of accumulated depreciation. Electric Utility Plant - net makes up about 54 percent of SMUD’s Total Assets and Deferred Outflows of Resources, which is unchanged compared to 2017. In 2018, SMUD capitalized approximately $237.7 million of additions to electric utility plant in the Consolidated Statements of Net Position. The additions were primarily due to distribution line work, major overhauls in the Joint Power Authorities (JPAs),
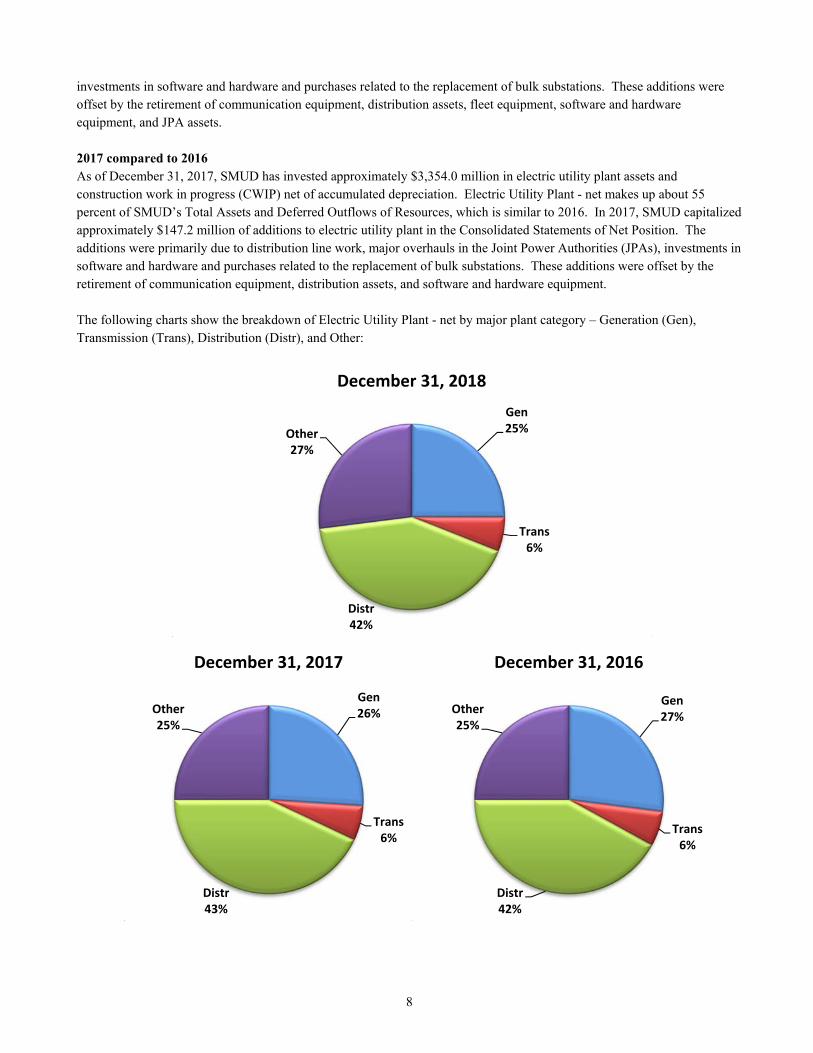
8
investments in software and hardware and purchases related to the replacement of bulk substations. These additions were offset by the retirement of communication equipment, distribution assets, fleet equipment, software and hardware equipment, and JPA assets. 2017 compared to 2016 As of December 31, 2017, SMUD has invested approximately $3,354.0 million in electric utility plant assets and construction work in progress (CWIP) net of accumulated depreciation. Electric Utility Plant - net makes up about 55 percent of SMUD’s Total Assets and Deferred Outflows of Resources, which is similar to 2016. In 2017, SMUD capitalized approximately $147.2 million of additions to electric utility plant in the Consolidated Statements of Net Position. The additions were primarily due to distribution line work, major overhauls in the Joint Power Authorities (JPAs), investments in software and hardware and purchases related to the replacement of bulk substations. These additions were offset by the retirement of communication equipment, distribution assets, and software and hardware equipment. The following charts show the breakdown of Electric Utility Plant - net by major plant category – Generation (Gen), Transmission (Trans), Distribution (Distr), and Other:
Gen25%
Trans6%
Distr42%
Other27%
December 31, 2018
Gen26%
Trans6%
Distr43%
Other25%
December 31, 2017
Gen27%
Trans6%
Distr42%
Other25%
December 31, 2016
9
Restricted and Designated Assets 2018 compared to 2017 SMUD’s restricted and designated assets are comprised of debt service reserves, nuclear decommissioning trust funds, rate stabilization fund, and other third party agreements or Board actions, less the current portion. These assets decreased $1.0 million during 2018. The decrease was due to an increase of $31.5 million in the current portion, offset by an increase of $30.2 million in revenue bond, debt service and construction reserves. 2017 compared to 2016 SMUD’s restricted and designated assets are comprised of debt service reserves, nuclear decommissioning trust funds, rate stabilization fund, and other third party agreements or Board actions, less the current portion. These assets increased $64.4 million during 2017. The increase was due to a net transfer of $64.7 million to the RSF (including the HRSF) as a result of higher precipitation and higher energy deliveries from WAPA, and a decrease of $22.0 million in current portion, offset by a decrease of $22.2 million in the revenue bond and debt service reserves. Current Assets 2018 compared to 2017 Total current assets decreased $245.4 million in 2018. Restricted and designated cash and cash equivalents decreased $157.8 million. Prepayments and other decreased by $129.0 million mainly due to the repurchase of the Solano Wind Phase 3 plant in April 2018. These decreases were offset by a total increase of restricted and designated investments, wholesale and other receivables, inventories, and prepaid gas of $62.0 million. 2017 compared to 2016 Total current assets increased $115.6 million in 2017. Prepayments and other increased by $123.0 million. SMUD submitted its notice of intent to exercise the option to buy back the Solano Wind Phase 3 plant and recorded the prepayment for purchased power as current. Unrestricted cash and cash equivalents and regulatory costs to be recovered within one year increased $27.0 million. These increases were offset by a total decrease of restricted and designated cash and cash equivalents and restricted and designated investments of $35.1 million. Noncurrent Assets 2018 compared to 2017 Total noncurrent assets increased $492.5 million. Prepaid gas increased by $498.8 million mainly due to a new prepaid gas contract. This increase was offset by decreases in regulatory costs for future recovery and hedging derivative instruments of $15.1 million. 2017 compared to 2016 Total noncurrent assets increased $16.4 million. Regulatory costs for future recovery increased by $306.6 million mainly due to the recording of the regulatory asset related to implementation of GASB No. 75 in the amount of $319.3 million. Prepaid power and capacity decreased by $128.6 million partially due to the prepayment for purchased power for Solano recorded as current (see Current Assets). Prepayments and other decreased by $126.4 million mainly due to the removal of the OPEB asset due to implementation of GASB No. 75. In addition, prepaid gas and hedging derivative instruments decreased by $36.6 million.
10
Deferred Outflows of Resources 2018 compared to 2017 Total deferred outflows of resources decreased by $64.1 million due to a decrease in deferred pension outflows of $40.0 million and a decrease in the value of hedging derivative instruments and amortization of bond losses of $27.4 million. 2017 compared to 2016 Total deferred outflows of resources increased $12.0 million due to an increase of $26.8 million in deferred pension outflows and the recording of $11.9 million in deferred OPEB outflows as a result of implementation of GASB No. 75, offset by a $26.7 million decrease in the value of hedging derivative instruments and amortization of bond losses. LIABILITIES AND DEFERRED INFLOWS OF RESOURCES
Long-Term Debt - net 2018 compared to 2017 In July 2018, SMUD issued $165.5 million of 2018 Series F Revenue Refunding Bonds. The purpose of this transaction was to refund the fixed rate debt associated with 2008 Series U bonds. Proceeds from the 2018 Series F bonds, in addition to $7.5 million of proceeds from terminating the Wells Fargo and Bank of America variable-to-fixed interest rate swaps and $5.0 million from funds on hand defeased all the outstanding Series 2008 U bonds, totaling $204.2 million. Bonds were defeased through a legal defeasance, and accordingly, the liability for the defeased bonds has been removed from Long-Term Debt - net in the Consolidated Statements of Net Position. The refunding resulted in the recognition of a deferred accounting gain of $0.2 million, which is being amortized over the life of the refunding issue. The termination payments of the interest rate swaps are being amortized over the life of the refunding issue. The 2018 refunding reduced future aggregate debt service payments by $42.6 million and resulted in a total economic gain of $39.1 million, which is the difference between the present value of the old and new debt service payments. NCEA issued $539.6 million of 2018 Commodity Supply Revenue Bonds in December 2018 maturing in June 2049, with mandatory tender purchase in June 2024. The 2018 Commodity Supply Revenue Bonds have fixed interest rates of 4.0 percent to 5.0 percent. The proceeds of the offering were used to finance the prepayment of a thirty-year commodity contract. NCEA is obligated to pay the debt service on the bonds. SMUD’s obligation is limited to the purchase and payment for the commodity tendered for delivery by NCEA. 2017 compared to 2016 In December 2017, SMUD issued $202.5 million of 2017 Series E Electric Revenue Refunding Bonds. The purpose of this transaction was to refund variable rate debt with fixed rate debt to reduce the risk of increased interest rates. Proceeds from the 2017 Series Bonds, in addition to $13.0 million of funds on hand, were used to defease $26.1 million of a portion of the Series 2016 N bonds, $26.1 million of a portion of the Series 2016 O bonds, $120.0 million of all of the outstanding 2016 Series P bonds, and $77.9 million of all of the outstanding Series 2016 Q bonds. A total of $250.1 million bonds were defeased through a legal defeasance, and accordingly, the liability for the defeased bonds has been removed from long-term debt - net in the Consolidated Statements of Net Position. The refunding resulted in the recognition of a deferred accounting loss of $5.5 million, which is being amortized over the life of the refunding issue. Based on an assumed LIBOR rate of 1.7 percent for the life of the debt, the 2017 refunding increased future aggregate debt service payments by $0.6 million and resulted in a total economic loss of $1.4 million, which is the difference between the present value of the old and new debt service payments.
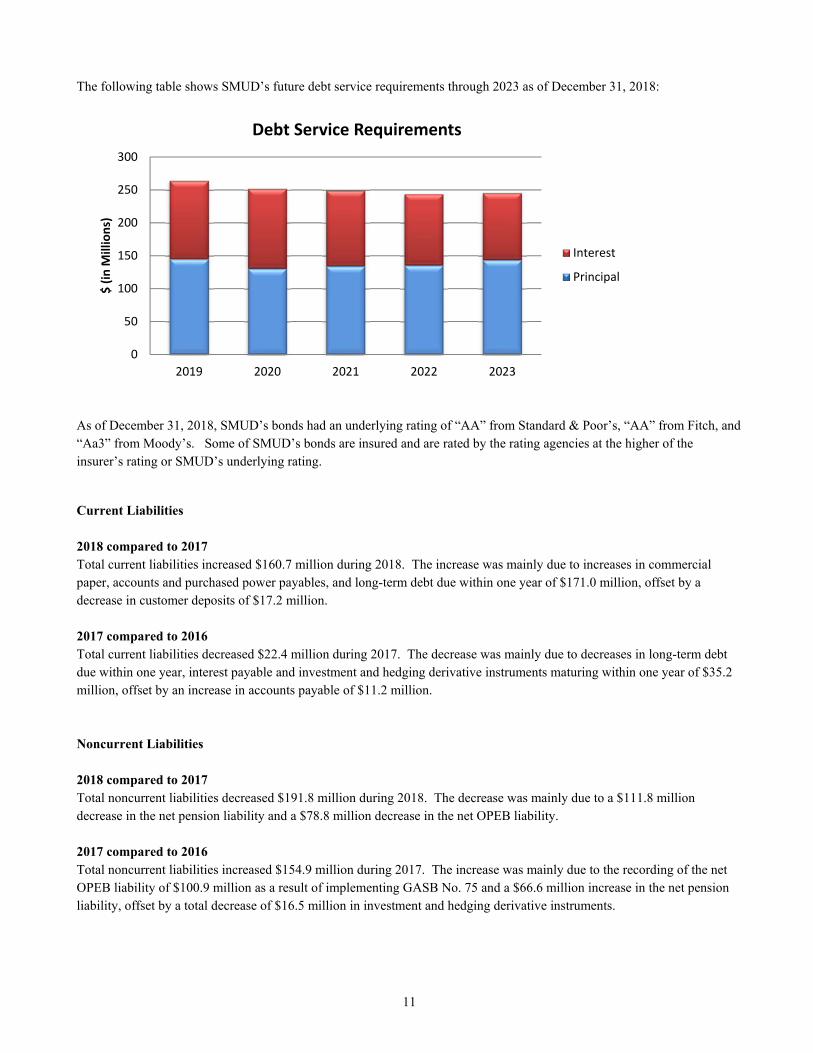
11
The following table shows SMUD’s future debt service requirements through 2023 as of December 31, 2018:
As of December 31, 2018, SMUD’s bonds had an underlying rating of “AA” from Standard & Poor’s, “AA” from Fitch, and “Aa3” from Moody’s. Some of SMUD’s bonds are insured and are rated by the rating agencies at the higher of the insurer’s rating or SMUD’s underlying rating.
Current Liabilities 2018 compared to 2017 Total current liabilities increased $160.7 million during 2018. The increase was mainly due to increases in commercial paper, accounts and purchased power payables, and long-term debt due within one year of $171.0 million, offset by a decrease in customer deposits of $17.2 million. 2017 compared to 2016 Total current liabilities decreased $22.4 million during 2017. The decrease was mainly due to decreases in long-term debt due within one year, interest payable and investment and hedging derivative instruments maturing within one year of $35.2 million, offset by an increase in accounts payable of $11.2 million. Noncurrent Liabilities 2018 compared to 2017 Total noncurrent liabilities decreased $191.8 million during 2018. The decrease was mainly due to a $111.8 million decrease in the net pension liability and a $78.8 million decrease in the net OPEB liability. 2017 compared to 2016 Total noncurrent liabilities increased $154.9 million during 2017. The increase was mainly due to the recording of the net OPEB liability of $100.9 million as a result of implementing GASB No. 75 and a $66.6 million increase in the net pension liability, offset by a total decrease of $16.5 million in investment and hedging derivative instruments.
0
50
100
150
200
250
300
2019 2020 2021 2022 2023
$ (in M
illions)
Debt Service Requirements
Interest
Principal
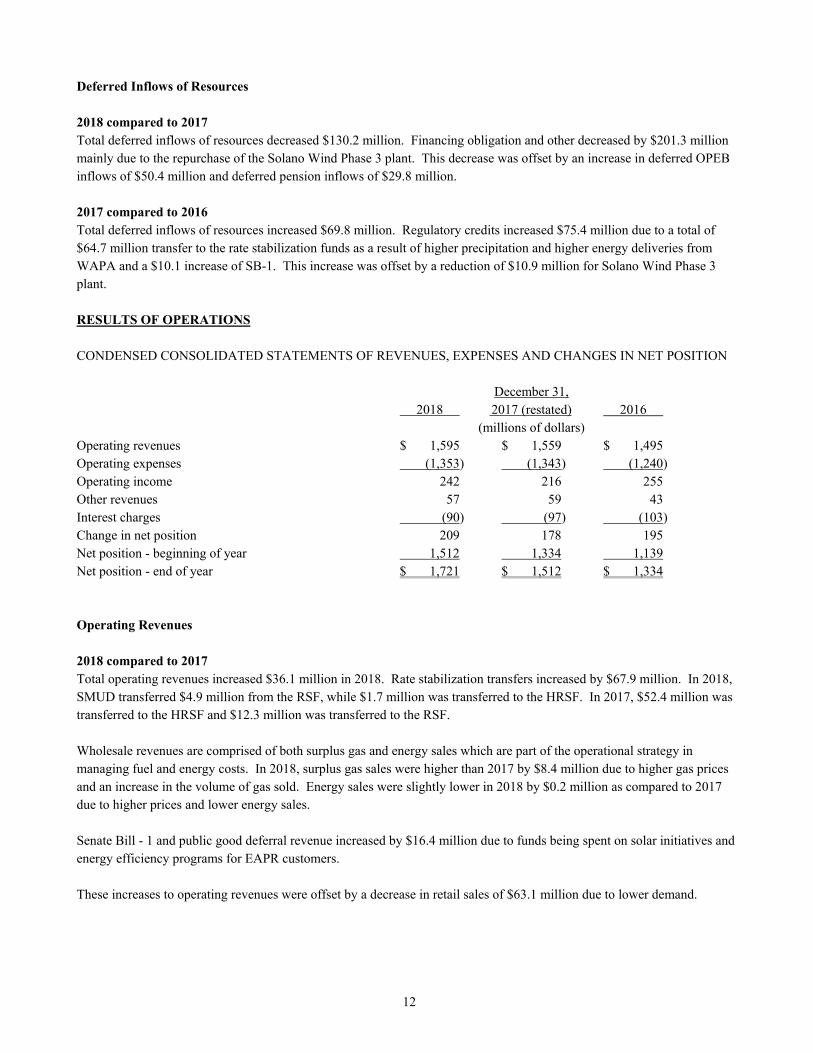
12
Deferred Inflows of Resources 2018 compared to 2017 Total deferred inflows of resources decreased $130.2 million. Financing obligation and other decreased by $201.3 million mainly due to the repurchase of the Solano Wind Phase 3 plant. This decrease was offset by an increase in deferred OPEB inflows of $50.4 million and deferred pension inflows of $29.8 million. 2017 compared to 2016 Total deferred inflows of resources increased $69.8 million. Regulatory credits increased $75.4 million due to a total of $64.7 million transfer to the rate stabilization funds as a result of higher precipitation and higher energy deliveries from WAPA and a $10.1 increase of SB-1. This increase was offset by a reduction of $10.9 million for Solano Wind Phase 3 plant. RESULTS OF OPERATIONS CONDENSED CONSOLIDATED STATEMENTS OF REVENUES, EXPENSES AND CHANGES IN NET POSITION December 31, 2018 2017 (restated) 2016 (millions of dollars)
Operating revenues $ 1,595 $ 1,559 $ 1,495 Operating expenses (1,353) (1,343) (1,240) Operating income 242 216 255 Other revenues 57 59 43 Interest charges (90) (97) (103) Change in net position 209 178 195 Net position - beginning of year 1,512 1,334 1,139 Net position - end of year $ 1,721 $ 1,512 $ 1,334
Operating Revenues 2018 compared to 2017 Total operating revenues increased $36.1 million in 2018. Rate stabilization transfers increased by $67.9 million. In 2018, SMUD transferred $4.9 million from the RSF, while $1.7 million was transferred to the HRSF. In 2017, $52.4 million was transferred to the HRSF and $12.3 million was transferred to the RSF. Wholesale revenues are comprised of both surplus gas and energy sales which are part of the operational strategy in managing fuel and energy costs. In 2018, surplus gas sales were higher than 2017 by $8.4 million due to higher gas prices and an increase in the volume of gas sold. Energy sales were slightly lower in 2018 by $0.2 million as compared to 2017 due to higher prices and lower energy sales. Senate Bill - 1 and public good deferral revenue increased by $16.4 million due to funds being spent on solar initiatives and energy efficiency programs for EAPR customers. These increases to operating revenues were offset by a decrease in retail sales of $63.1 million due to lower demand.
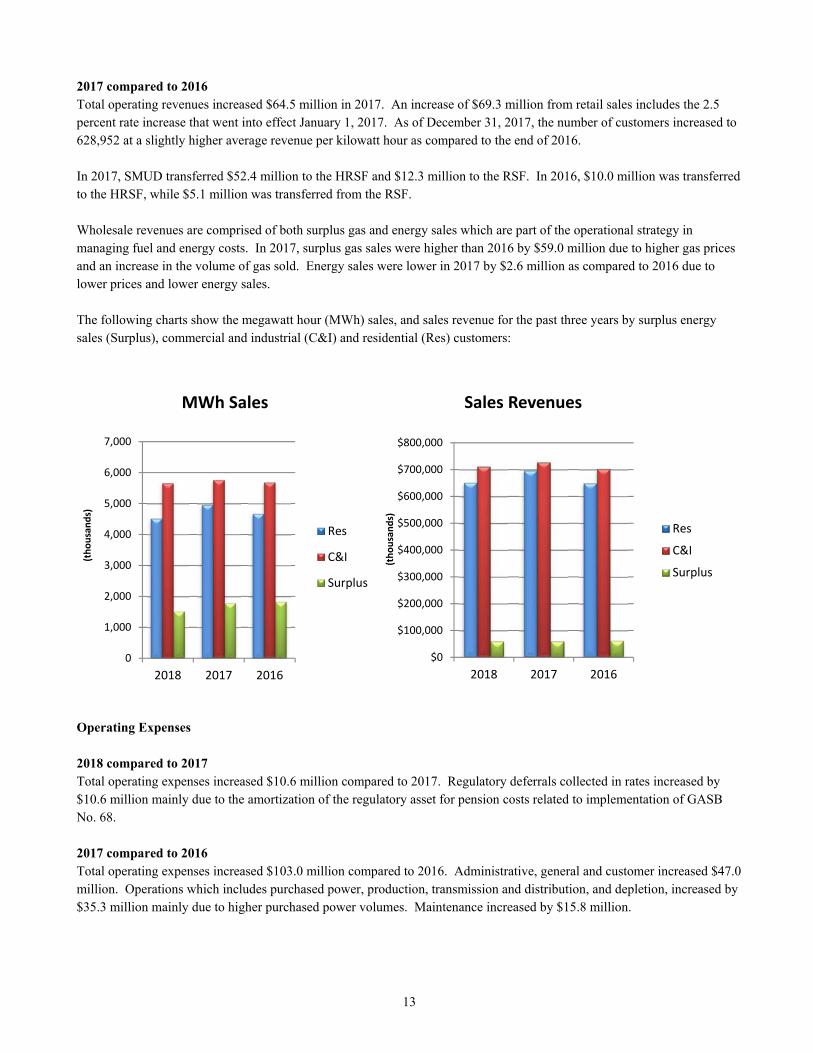
13
2017 compared to 2016 Total operating revenues increased $64.5 million in 2017. An increase of $69.3 million from retail sales includes the 2.5 percent rate increase that went into effect January 1, 2017. As of December 31, 2017, the number of customers increased to 628,952 at a slightly higher average revenue per kilowatt hour as compared to the end of 2016. In 2017, SMUD transferred $52.4 million to the HRSF and $12.3 million to the RSF. In 2016, $10.0 million was transferred to the HRSF, while $5.1 million was transferred from the RSF. Wholesale revenues are comprised of both surplus gas and energy sales which are part of the operational strategy in managing fuel and energy costs. In 2017, surplus gas sales were higher than 2016 by $59.0 million due to higher gas prices and an increase in the volume of gas sold. Energy sales were lower in 2017 by $2.6 million as compared to 2016 due to lower prices and lower energy sales. The following charts show the megawatt hour (MWh) sales, and sales revenue for the past three years by surplus energy sales (Surplus), commercial and industrial (C&I) and residential (Res) customers:
Operating Expenses 2018 compared to 2017 Total operating expenses increased $10.6 million compared to 2017. Regulatory deferrals collected in rates increased by $10.6 million mainly due to the amortization of the regulatory asset for pension costs related to implementation of GASB No. 68. 2017 compared to 2016 Total operating expenses increased $103.0 million compared to 2016. Administrative, general and customer increased $47.0 million. Operations which includes purchased power, production, transmission and distribution, and depletion, increased by $35.3 million mainly due to higher purchased power volumes. Maintenance increased by $15.8 million.
0
1,000
2,000
3,000
4,000
5,000
6,000
7,000
2018 2017 2016
(thousands)
MWh Sales
Res
C&I
Surplus
$0
$100,000
$200,000
$300,000
$400,000
$500,000
$600,000
$700,000
$800,000
2018 2017 2016
(thousands)
Sales Revenues
Res
C&I
Surplus
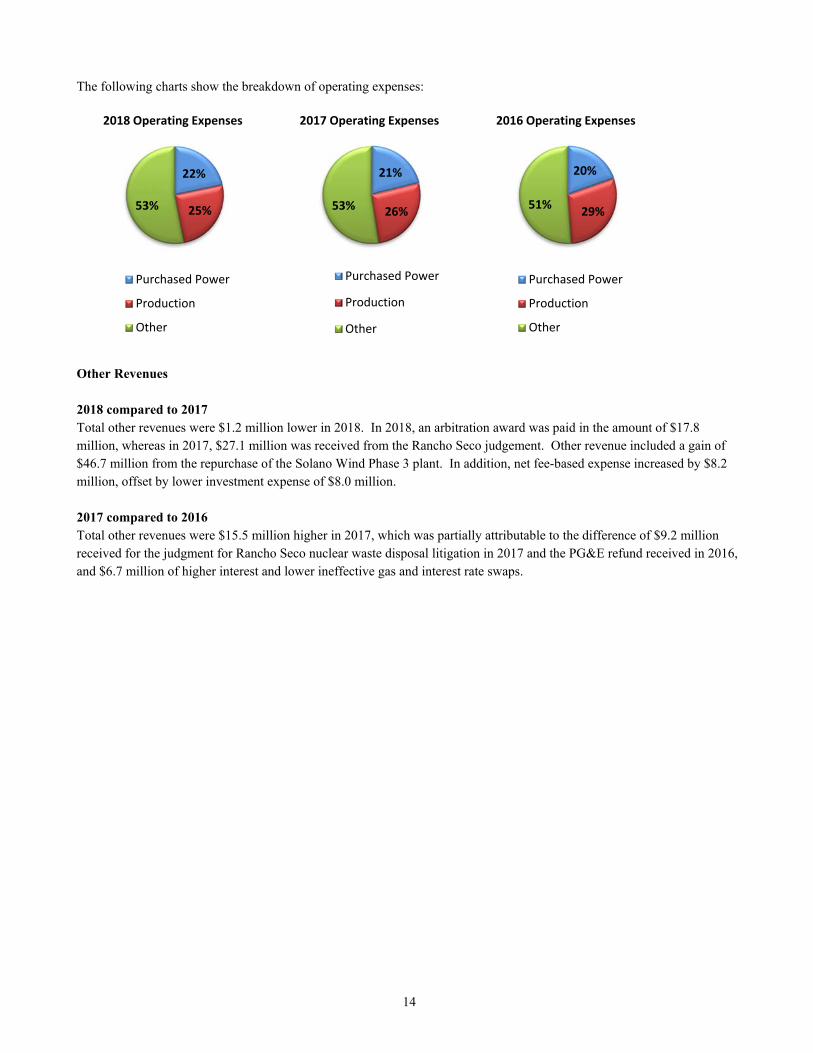
14
The following charts show the breakdown of operating expenses:
Other Revenues 2018 compared to 2017 Total other revenues were $1.2 million lower in 2018. In 2018, an arbitration award was paid in the amount of $17.8 million, whereas in 2017, $27.1 million was received from the Rancho Seco judgement. Other revenue included a gain of $46.7 million from the repurchase of the Solano Wind Phase 3 plant. In addition, net fee-based expense increased by $8.2 million, offset by lower investment expense of $8.0 million. 2017 compared to 2016 Total other revenues were $15.5 million higher in 2017, which was partially attributable to the difference of $9.2 million received for the judgment for Rancho Seco nuclear waste disposal litigation in 2017 and the PG&E refund received in 2016, and $6.7 million of higher interest and lower ineffective gas and interest rate swaps.
22%
25%53%
2018 Operating Expenses
Purchased Power
Production
Other
21%
26%53%
2017 Operating Expenses
Purchased Power
Production
Other
20%
29%51%
2016 Operating Expenses
Purchased Power
Production
Other

15
THIS PAGE INTENTIONALLY LEFT BLANK
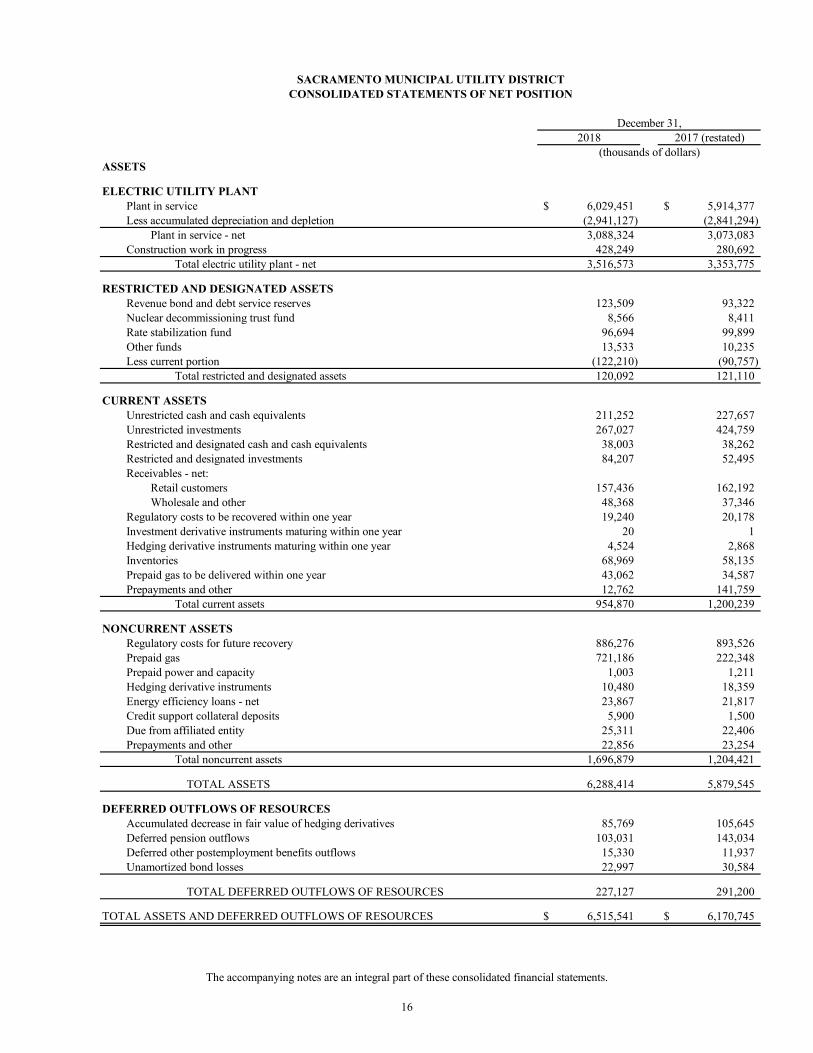
SACRAMENTO MUNICIPAL UTILITY DISTRICTCONSOLIDATED STATEMENTS OF NET POSITION
December 31,2018 2017 (restated)
(thousands of dollars)ASSETS
ELECTRIC UTILITY PLANTPlant in service 6,029,451$ 5,914,377$ Less accumulated depreciation and depletion (2,941,127) (2,841,294)
Plant in service - net 3,088,324 3,073,083 Construction work in progress 428,249 280,692
Total electric utility plant - net 3,516,573 3,353,775
RESTRICTED AND DESIGNATED ASSETSRevenue bond and debt service reserves 123,509 93,322 Nuclear decommissioning trust fund 8,566 8,411 Rate stabilization fund 96,694 99,899 Other funds 13,533 10,235 Less current portion (122,210) (90,757)
Total restricted and designated assets 120,092 121,110
CURRENT ASSETSUnrestricted cash and cash equivalents 211,252 227,657 Unrestricted investments 267,027 424,759 Restricted and designated cash and cash equivalents 38,003 38,262 Restricted and designated investments 84,207 52,495 Receivables - net:
Retail customers 157,436 162,192 Wholesale and other 48,368 37,346
Regulatory costs to be recovered within one year 19,240 20,178 Investment derivative instruments maturing within one year 20 1 Hedging derivative instruments maturing within one year 4,524 2,868 Inventories 68,969 58,135 Prepaid gas to be delivered within one year 43,062 34,587 Prepayments and other 12,762 141,759
Total current assets 954,870 1,200,239
NONCURRENT ASSETSRegulatory costs for future recovery 886,276 893,526 Prepaid gas 721,186 222,348 Prepaid power and capacity 1,003 1,211 Hedging derivative instruments 10,480 18,359 Energy efficiency loans - net 23,867 21,817 Credit support collateral deposits 5,900 1,500 Due from affiliated entity 25,311 22,406 Prepayments and other 22,856 23,254
Total noncurrent assets 1,696,879 1,204,421
TOTAL ASSETS 6,288,414 5,879,545
DEFERRED OUTFLOWS OF RESOURCESAccumulated decrease in fair value of hedging derivatives 85,769 105,645 Deferred pension outflows 103,031 143,034 Deferred other postemployment benefits outflows 15,330 11,937 Unamortized bond losses 22,997 30,584
TOTAL DEFERRED OUTFLOWS OF RESOURCES 227,127 291,200
TOTAL ASSETS AND DEFERRED OUTFLOWS OF RESOURCES 6,515,541$ 6,170,745$
The accompanying notes are an integral part of these consolidated financial statements.
16
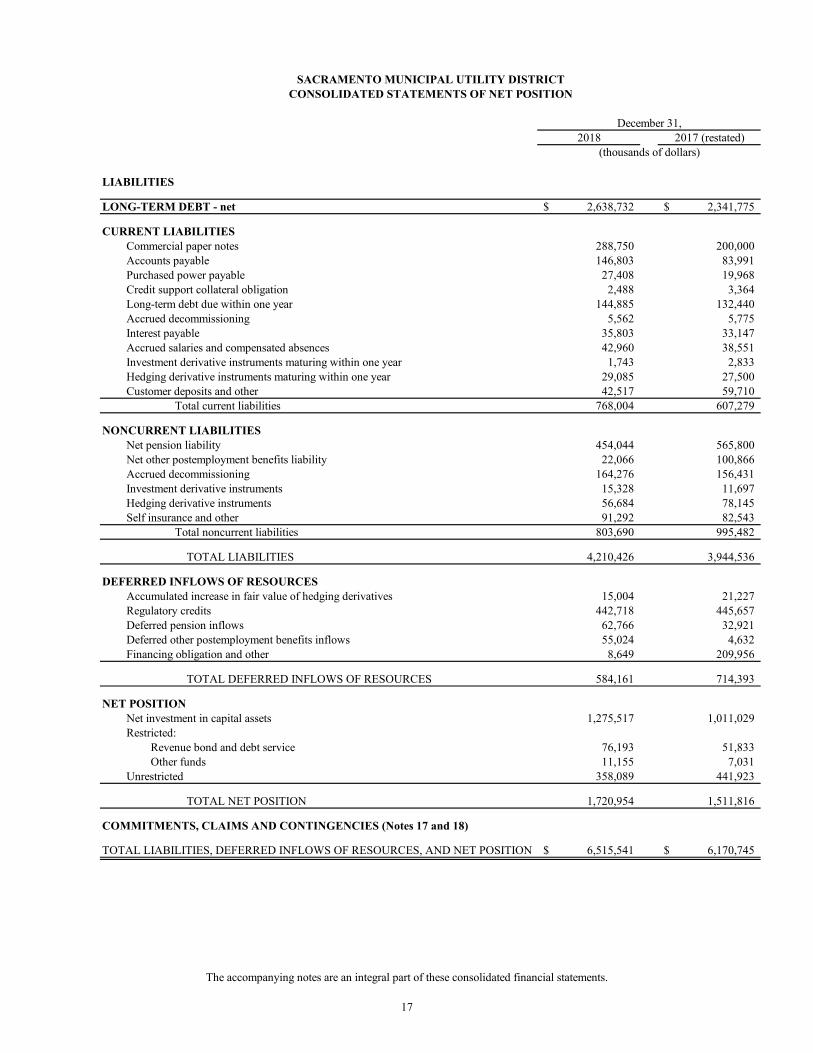
SACRAMENTO MUNICIPAL UTILITY DISTRICTCONSOLIDATED STATEMENTS OF NET POSITION
December 31,2018 2017 (restated)
(thousands of dollars)
LIABILITIES
LONG-TERM DEBT - net 2,638,732$ 2,341,775$
CURRENT LIABILITIESCommercial paper notes 288,750 200,000 Accounts payable 146,803 83,991 Purchased power payable 27,408 19,968 Credit support collateral obligation 2,488 3,364 Long-term debt due within one year 144,885 132,440 Accrued decommissioning 5,562 5,775 Interest payable 35,803 33,147 Accrued salaries and compensated absences 42,960 38,551 Investment derivative instruments maturing within one year 1,743 2,833 Hedging derivative instruments maturing within one year 29,085 27,500 Customer deposits and other 42,517 59,710
Total current liabilities 768,004 607,279
NONCURRENT LIABILITIESNet pension liability 454,044 565,800 Net other postemployment benefits liability 22,066 100,866 Accrued decommissioning 164,276 156,431 Investment derivative instruments 15,328 11,697 Hedging derivative instruments 56,684 78,145 Self insurance and other 91,292 82,543
Total noncurrent liabilities 803,690 995,482
TOTAL LIABILITIES 4,210,426 3,944,536
DEFERRED INFLOWS OF RESOURCESAccumulated increase in fair value of hedging derivatives 15,004 21,227 Regulatory credits 442,718 445,657 Deferred pension inflows 62,766 32,921 Deferred other postemployment benefits inflows 55,024 4,632 Financing obligation and other 8,649 209,956
TOTAL DEFERRED INFLOWS OF RESOURCES 584,161 714,393
NET POSITIONNet investment in capital assets 1,275,517 1,011,029 Restricted:
Revenue bond and debt service 76,193 51,833 Other funds 11,155 7,031
Unrestricted 358,089 441,923
TOTAL NET POSITION 1,720,954 1,511,816
COMMITMENTS, CLAIMS AND CONTINGENCIES (Notes 17 and 18)
TOTAL LIABILITIES, DEFERRED INFLOWS OF RESOURCES, AND NET POSITION 6,515,541$ 6,170,745$
The accompanying notes are an integral part of these consolidated financial statements.
17
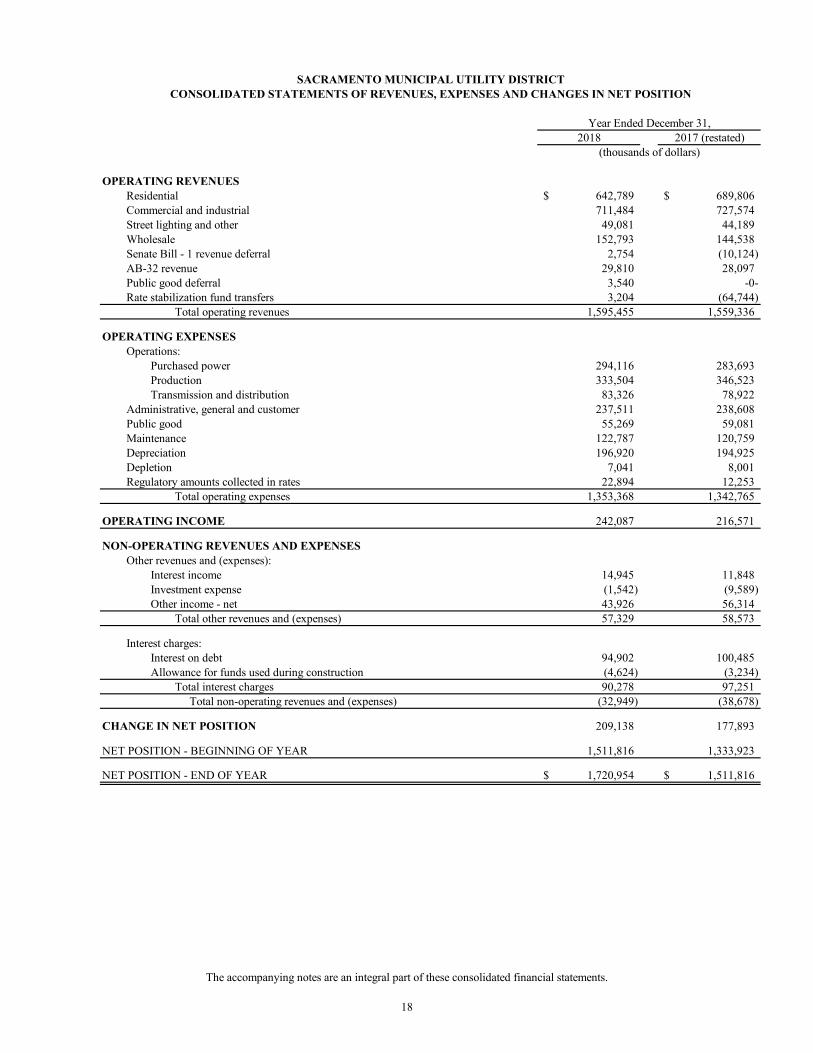
SACRAMENTO MUNICIPAL UTILITY DISTRICTCONSOLIDATED STATEMENTS OF REVENUES, EXPENSES AND CHANGES IN NET POSITION
Year Ended December 31,2018 2017 (restated)
(thousands of dollars)
OPERATING REVENUESResidential 642,789$ 689,806$ Commercial and industrial 711,484 727,574 Street lighting and other 49,081 44,189 Wholesale 152,793 144,538 Senate Bill - 1 revenue deferral 2,754 (10,124) AB-32 revenue 29,810 28,097 Public good deferral 3,540 -0-Rate stabilization fund transfers 3,204 (64,744)
Total operating revenues 1,595,455 1,559,336
OPERATING EXPENSESOperations:
Purchased power 294,116 283,693 Production 333,504 346,523 Transmission and distribution 83,326 78,922
Administrative, general and customer 237,511 238,608 Public good 55,269 59,081 Maintenance 122,787 120,759 Depreciation 196,920 194,925 Depletion 7,041 8,001 Regulatory amounts collected in rates 22,894 12,253
Total operating expenses 1,353,368 1,342,765
OPERATING INCOME 242,087 216,571
NON-OPERATING REVENUES AND EXPENSESOther revenues and (expenses):
Interest income 14,945 11,848 Investment expense (1,542) (9,589) Other income - net 43,926 56,314
Total other revenues and (expenses) 57,329 58,573
Interest charges:Interest on debt 94,902 100,485 Allowance for funds used during construction (4,624) (3,234)
Total interest charges 90,278 97,251 Total non-operating revenues and (expenses) (32,949) (38,678)
CHANGE IN NET POSITION 209,138 177,893
NET POSITION - BEGINNING OF YEAR 1,511,816 1,333,923
NET POSITION - END OF YEAR 1,720,954$ 1,511,816$
The accompanying notes are an integral part of these consolidated financial statements.
18
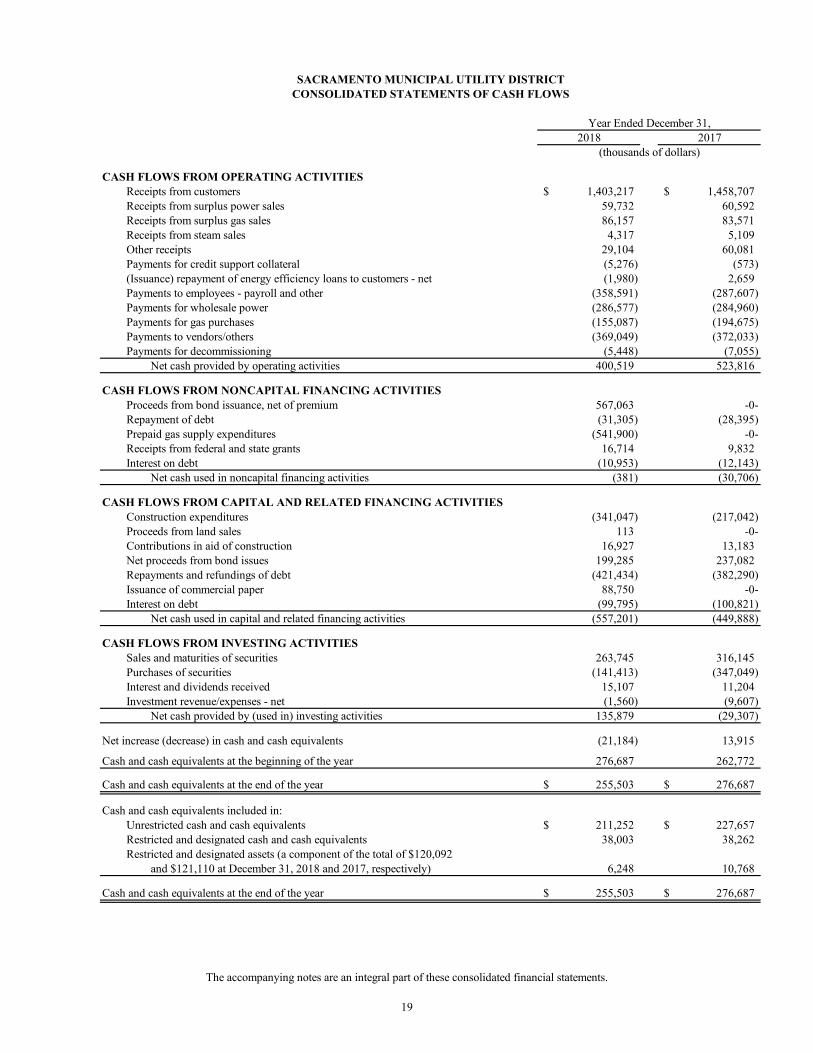
SACRAMENTO MUNICIPAL UTILITY DISTRICTCONSOLIDATED STATEMENTS OF CASH FLOWS
Year Ended December 31,2018 2017
(thousands of dollars)
CASH FLOWS FROM OPERATING ACTIVITIESReceipts from customers 1,403,217$ 1,458,707$ Receipts from surplus power sales 59,732 60,592 Receipts from surplus gas sales 86,157 83,571 Receipts from steam sales 4,317 5,109 Other receipts 29,104 60,081 Payments for credit support collateral (5,276) (573) (Issuance) repayment of energy efficiency loans to customers - net (1,980) 2,659 Payments to employees - payroll and other (358,591) (287,607) Payments for wholesale power (286,577) (284,960) Payments for gas purchases (155,087) (194,675) Payments to vendors/others (369,049) (372,033) Payments for decommissioning (5,448) (7,055)
Net cash provided by operating activities 400,519 523,816
CASH FLOWS FROM NONCAPITAL FINANCING ACTIVITIESProceeds from bond issuance, net of premium 567,063 -0-Repayment of debt (31,305) (28,395) Prepaid gas supply expenditures (541,900) -0-Receipts from federal and state grants 16,714 9,832 Interest on debt (10,953) (12,143)
Net cash used in noncapital financing activities (381) (30,706)
CASH FLOWS FROM CAPITAL AND RELATED FINANCING ACTIVITIESConstruction expenditures (341,047) (217,042) Proceeds from land sales 113 -0-Contributions in aid of construction 16,927 13,183 Net proceeds from bond issues 199,285 237,082 Repayments and refundings of debt (421,434) (382,290) Issuance of commercial paper 88,750 -0-Interest on debt (99,795) (100,821)
Net cash used in capital and related financing activities (557,201) (449,888)
CASH FLOWS FROM INVESTING ACTIVITIESSales and maturities of securities 263,745 316,145 Purchases of securities (141,413) (347,049) Interest and dividends received 15,107 11,204 Investment revenue/expenses - net (1,560) (9,607)
Net cash provided by (used in) investing activities 135,879 (29,307)
Net increase (decrease) in cash and cash equivalents (21,184) 13,915
Cash and cash equivalents at the beginning of the year 276,687 262,772
Cash and cash equivalents at the end of the year 255,503$ 276,687$
Cash and cash equivalents included in:Unrestricted cash and cash equivalents 211,252$ 227,657$ Restricted and designated cash and cash equivalents 38,003 38,262 Restricted and designated assets (a component of the total of $120,092
and $121,110 at December 31, 2018 and 2017, respectively) 6,248 10,768
Cash and cash equivalents at the end of the year 255,503$ 276,687$
The accompanying notes are an integral part of these consolidated financial statements.
19
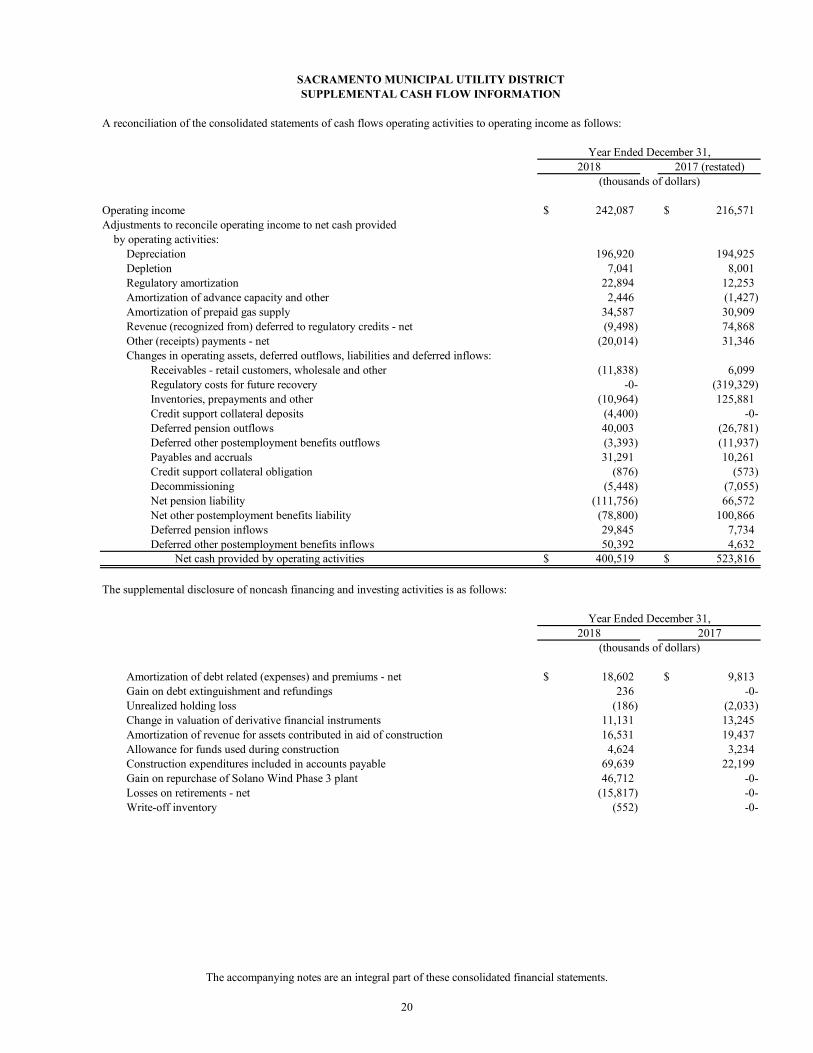
SACRAMENTO MUNICIPAL UTILITY DISTRICTSUPPLEMENTAL CASH FLOW INFORMATION
A reconciliation of the consolidated statements of cash flows operating activities to operating income as follows:
Year Ended December 31,2018 2017 (restated)
(thousands of dollars)
Operating income 242,087$ 216,571$ Adjustments to reconcile operating income to net cash provided by operating activities:
Depreciation 196,920 194,925 Depletion 7,041 8,001 Regulatory amortization 22,894 12,253 Amortization of advance capacity and other 2,446 (1,427) Amortization of prepaid gas supply 34,587 30,909 Revenue (recognized from) deferred to regulatory credits - net (9,498) 74,868 Other (receipts) payments - net (20,014) 31,346 Changes in operating assets, deferred outflows, liabilities and deferred inflows:
Receivables - retail customers, wholesale and other (11,838) 6,099 Regulatory costs for future recovery -0- (319,329) Inventories, prepayments and other (10,964) 125,881 Credit support collateral deposits (4,400) -0-Deferred pension outflows 40,003 (26,781) Deferred other postemployment benefits outflows (3,393) (11,937) Payables and accruals 31,291 10,261 Credit support collateral obligation (876) (573) Decommissioning (5,448) (7,055) Net pension liability (111,756) 66,572 Net other postemployment benefits liability (78,800) 100,866 Deferred pension inflows 29,845 7,734 Deferred other postemployment benefits inflows 50,392 4,632
Net cash provided by operating activities 400,519$ 523,816$
The supplemental disclosure of noncash financing and investing activities is as follows:
Year Ended December 31,2018 2017
(thousands of dollars)
Amortization of debt related (expenses) and premiums - net 18,602$ 9,813$ Gain on debt extinguishment and refundings 236 -0-Unrealized holding loss (186) (2,033) Change in valuation of derivative financial instruments 11,131 13,245 Amortization of revenue for assets contributed in aid of construction 16,531 19,437 Allowance for funds used during construction 4,624 3,234 Construction expenditures included in accounts payable 69,639 22,199 Gain on repurchase of Solano Wind Phase 3 plant 46,712 -0-Losses on retirements - net (15,817) -0-Write-off inventory (552) -0-
The accompanying notes are an integral part of these consolidated financial statements.
20
21
Sacramento Municipal Utility District Notes to Consolidated Financial Statements
As of and for the Years Ended December 31, 2018 and 2017
NOTE 1. ORGANIZATION The Sacramento Municipal Utility District (SMUD) was formed and operates under the State of California Municipal Utility District Act (Act). The Act gives SMUD the rights and powers to fix rates and charges for commodities or services it furnishes, and to incur indebtedness and issue bonds or other obligations. As a community-owned utility, SMUD is not subject to regulation or oversight by the California Public Utilities Commission. SMUD is responsible for the acquisition, generation, transmission, and distribution of electric power to its service area, which includes most of Sacramento County and small adjoining portions of Placer and Yolo Counties. The Board of Directors (Board) determines SMUD’s rates. SMUD is exempt from payment of federal and state income taxes and, under most circumstances, real and personal property taxes. SMUD is not exempt from real and personal property taxes on assets it holds outside of its service territory. In addition, SMUD is responsible for the payment of a portion of the property taxes associated with its real property in California that lies outside of its service area. NOTE 2. SUMMARY OF SIGNIFICANT ACCOUNTING POLICIES Method of Accounting. SMUD’s accounting records are maintained in accordance with Generally Accepted Accounting Principles for proprietary funds as prescribed by the Governmental Accounting Standards Board (GASB). SMUD’s accounting records generally follow the Uniform System of Accounts for Public Utilities and Licensees prescribed by the Federal Energy Regulatory Commission (FERC), except as it relates to the accounting for contributions of utility property in aid of construction. SMUD’s Consolidated Financial Statements are reported using the economic resources measurement focus and the accrual basis of accounting. Revenues are recorded when earned and expenses are recorded when a liability is incurred, regardless of the timing of the related cash flows. Electric revenues and costs that are directly related to the acquisition, generation, transmission, and distribution of electricity are reported as operating revenues and expenses. All other revenues and expenses are reported as non-operating revenues and expenses. Use of Estimates. The preparation of financial statements in conformity with accounting principles generally accepted in the United States of America (U.S.) requires management to make estimates and assumptions that affect the reported amounts of assets and liabilities and disclosures of contingent assets and liabilities at the date of the financial statements and reported amounts of revenues and expenses during the reporting period. Actual results could differ from those estimates. The Financial Reporting Entity. These Consolidated Financial Statements include SMUD and its component units. Although the component units are legally separate from SMUD, they are blended into and reported as part of SMUD because of the extent of their operational and financial relationships with SMUD. All significant inter-component transactions have been eliminated in consolidation. Component Units. The component units include the Central Valley Financing Authority (CVFA), the Sacramento Cogeneration Authority (SCA), the Sacramento Municipal Utility District Financing Authority (SFA), the Sacramento Power Authority (SPA), the Northern California Gas Authority No. 1 (NCGA), and the Northern California Energy Authority (NCEA). The primary purpose of CVFA, SCA, SFA and SPA is to own and operate electric utility plants that supply power to SMUD. The primary purpose of NCGA is to prepay for natural gas to sell the natural gas to SMUD. The primary purpose of NCEA is to prepay for commodities in the form of natural gas and electricity and to sell the commodities to SMUD. SMUD’s Board comprises the Commissions that govern these entities (see Note 6).
22
Plant in Service. Capital assets are generally defined by SMUD as tangible assets with an initial, individual cost of more than three thousand dollars and an estimated useful life in excess of two years. The cost of additions to Plant in Service and replacement property units is capitalized. Repair and maintenance costs are charged to expense when incurred. When SMUD retires portions of its Utility Plant, retirements are recorded against Accumulated Depreciation and the retired portion of Utility Plant is removed from Plant in Service. The costs of removal and the related salvage value, if any, are charged or credited as appropriate to Accumulated Depreciation. SMUD generally computes depreciation on Plant in Service on a straight-line, service-life basis. The consolidated average annual composite depreciation rates for 2018 and 2017 were 3.4 percent and 3.5 percent, respectively. Depreciation is calculated using the following estimated lives: Generation 5 to 80 years Transmission and Distribution 7 to 50 years Gas Pipeline 15 to 90 years General 5 to 90 years Investment in Joint Powers Authority (JPA). SMUD’s investment in the Transmission Agency of Northern California (TANC) is accounted for under the equity method of accounting and is reported as a component of Plant in Service. SMUD’s share of the TANC debt service costs and operations and maintenance expense, inclusive of depreciation, is included in Transmission and Distribution expense in the Consolidated Statements of Revenues, Expenses and Changes in Net Position (see Note 5). SMUD’s investment in the Balancing Authority of Northern California (BANC) is accounted for under the equity method of accounting. SMUD’s share of the BANC operations and maintenance expense is included in Transmission and Distribution expense in the Consolidated Statements of Revenues, Expenses and Changes in Net Position (see Note 5). Investment in Gas Properties. SMUD has an approximate 21 percent non-operating ownership interest in the Rosa Unit gas properties in New Mexico of which, SMUD’s portion of the extracted gas is transported for use in its component unit natural gas-fired power plants (see Note 6). SMUD uses the successful efforts method of accounting for its investment in gas producing properties. Costs to acquire mineral interests in gas properties, to drill and equip exploratory wells that find proved reserves, and to drill and equip development wells are capitalized as a component of Plant in Service in the Consolidated Statements of Net Position. Costs to drill exploratory wells that do not find proved reserves, geological and geophysical costs, and costs of carrying and retaining unproved properties are expensed. SMUD has purchased proven reserves and has not participated in exploratory drilling. Capitalized costs of producing gas properties, after considering estimated residual salvage values, are depleted by the unit-of-production method based on the estimated future production of the proved developed producing wells. SMUD’s investment in gas properties is reported as a component of Plant in Service. Restricted and Designated Assets. Cash, cash equivalents, and investments, which are restricted by regulation or under terms of certain agreements for payments to third parties are included as restricted assets. Restricted assets include Revenue bond and debt service reserves, Nuclear decommissioning trust fund, and $12.9 million and $9.6 million of Other funds as of December 31, 2018 and 2017, respectively. Board actions limiting the use of such funds are included as designated assets. Designated assets include the Rate stabilization fund and $0.6 million of Other funds as of December 31, 2018 and 2017. When SMUD restricts or designates funds for a specific purpose, and restricted and designated and unrestricted resources are available for use, it is SMUD’s policy to use restricted and designated resources first, then unrestricted resources as they are needed. Restricted Bond Funds. SMUD’s Indenture Agreements (Indenture) requires the maintenance of minimum levels of reserves for debt service on the 1997 Series K Bonds. Nuclear Decommissioning Trust Fund. SMUD made annual contributions to its Nuclear Decommissioning Trust Fund (Trust Fund) through 2008 to cover the cost of its primary decommissioning activities associated with the Rancho Seco
23
facility. Primary decommissioning excludes activities associated with the spent fuel storage facility after 2008 and most non-radiological decommissioning tasks. Interest earnings on the Trust Fund assets are recorded as Interest Income and are accumulated in the Trust Fund. Accrued Decommissioning. SMUD accrues decommissioning costs related to Utility Plant when an obligation to decommission facilities is legally required. Adjustments are made to such liabilities based on estimates in accordance with FASB ASC 410, “Asset Retirement and Environmental Obligations” (FASB ASC 410). For active plants, such costs are included in the Utility Plant’s cost and as a component of Operating Expense over the Utility Plant’s life. Expenditures for decommissioning activities are recorded as reductions to Accrued Decommissioning liability. Changes in the Rancho Seco decommissioning liability estimates arising from inflation, annual accretion, and other changes to the cost assumptions are recorded to Accrued Decommissioning with a corresponding adjustment to the related regulatory deferral. The current portion of the Accrued Decommissioning liability represents SMUD’s estimate of actual expenditures in the next year, as set forth in the annual budget. SMUD has identified potential retirement obligations related to certain generation, distribution and transmission facilities. SMUD’s non-perpetual leased land rights generally are renewed continuously because SMUD intends to utilize these facilities indefinitely. Since the timing and extent of any potential asset retirements are unknown, the fair value of any obligations associated with these facilities cannot be reasonably estimated. Accordingly, a liability has not been recorded. At December 31, 2018 and 2017, SMUD’s Accrued Decommissioning balance in the Consolidated Statements of Net Position relating to Rancho Seco was $156.5 million and $149.8 million, respectively (see Note 13). The Accrued Decommissioning balance in the Consolidated Statements of Net Position relating to other electricity generation and gas production facilities totaled $13.3 million and $12.4 million as of December 31, 2018 and 2017, respectively. Cash and Cash Equivalents. Cash and cash equivalents include all debt instruments purchased with an original maturity of 90 days or less, deposits held at financial institutions, all investments in the Local Agency Investment Fund (LAIF), and money market funds. LAIF has an equity interest in the State of California (State) Pooled Money Investment Account (PMIA). PMIA funds are on deposit with the State’s Centralized Treasury System and are managed in compliance with the California Government Code according to a statement of investment policy which sets forth permitted investment vehicles, liquidity parameters, and maximum maturity of investments. Investments. SMUD’s investments are reported at fair value in accordance with Statement of Governmental Accounting Standards (SGAS) No. 72, “Fair Value Measurement and Application” (see Note 12). Realized and unrealized gains and losses are included in Other Income - Net in the Consolidated Statements of Revenues, Expenses and Changes in Net Position. Premiums and discounts on zero coupon bonds are amortized using the effective interest method. Premiums and discounts on other securities are amortized using the straight-line method, which approximates the effective interest method. Electric Operating Revenues. Electric revenues are billed on the basis of monthly cycle bills and are recorded as revenue when the electricity is delivered. SMUD records an estimate for unbilled revenues earned from the dates its retail customers were last billed to the end of the month. At December 31, 2018 and 2017, unbilled revenues were $69.4 million and $72.6 million, respectively. Purchased Power Expenses. A portion of SMUD’s power needs are provided through power purchase agreements (PPA). Expenses from such agreements, along with associated transmission costs paid to other utilities, are charged to Purchased Power expense on the Consolidated Statements of Revenues, Expenses and Changes in Net Position in the period the power is received. The costs or credits, associated with energy swap agreements (gas and electric) or other arrangements that affect the net cost of Purchased Power are recognized in the period in which the underlying power delivery occurs. Contract termination payments and adjustments to prior billings are included in Purchased Power expense once the payments or adjustments can be reasonably estimated.
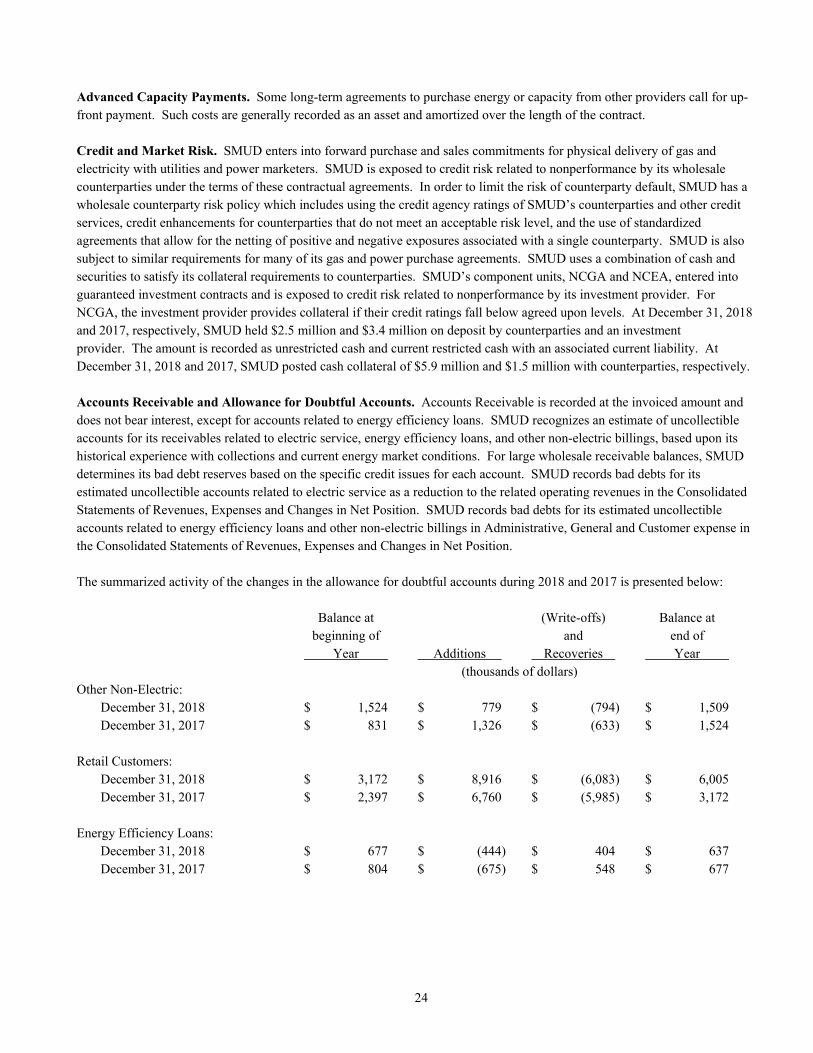
24
Advanced Capacity Payments. Some long-term agreements to purchase energy or capacity from other providers call for up-front payment. Such costs are generally recorded as an asset and amortized over the length of the contract. Credit and Market Risk. SMUD enters into forward purchase and sales commitments for physical delivery of gas and electricity with utilities and power marketers. SMUD is exposed to credit risk related to nonperformance by its wholesale counterparties under the terms of these contractual agreements. In order to limit the risk of counterparty default, SMUD has a wholesale counterparty risk policy which includes using the credit agency ratings of SMUD’s counterparties and other credit services, credit enhancements for counterparties that do not meet an acceptable risk level, and the use of standardized agreements that allow for the netting of positive and negative exposures associated with a single counterparty. SMUD is also subject to similar requirements for many of its gas and power purchase agreements. SMUD uses a combination of cash and securities to satisfy its collateral requirements to counterparties. SMUD’s component units, NCGA and NCEA, entered into guaranteed investment contracts and is exposed to credit risk related to nonperformance by its investment provider. For NCGA, the investment provider provides collateral if their credit ratings fall below agreed upon levels. At December 31, 2018 and 2017, respectively, SMUD held $2.5 million and $3.4 million on deposit by counterparties and an investment provider. The amount is recorded as unrestricted cash and current restricted cash with an associated current liability. At December 31, 2018 and 2017, SMUD posted cash collateral of $5.9 million and $1.5 million with counterparties, respectively. Accounts Receivable and Allowance for Doubtful Accounts. Accounts Receivable is recorded at the invoiced amount and does not bear interest, except for accounts related to energy efficiency loans. SMUD recognizes an estimate of uncollectible accounts for its receivables related to electric service, energy efficiency loans, and other non-electric billings, based upon its historical experience with collections and current energy market conditions. For large wholesale receivable balances, SMUD determines its bad debt reserves based on the specific credit issues for each account. SMUD records bad debts for its estimated uncollectible accounts related to electric service as a reduction to the related operating revenues in the Consolidated Statements of Revenues, Expenses and Changes in Net Position. SMUD records bad debts for its estimated uncollectible accounts related to energy efficiency loans and other non-electric billings in Administrative, General and Customer expense in the Consolidated Statements of Revenues, Expenses and Changes in Net Position. The summarized activity of the changes in the allowance for doubtful accounts during 2018 and 2017 is presented below: Balance at (Write-offs) Balance at beginning of and end of Year Additions Recoveries Year (thousands of dollars) Other Non-Electric: December 31, 2018 $ 1,524 $ 779 $ (794) $ 1,509 December 31, 2017 $ 831 $ 1,326 $ (633) $ 1,524 Retail Customers: December 31, 2018 $ 3,172 $ 8,916 $ (6,083) $ 6,005 December 31, 2017 $ 2,397 $ 6,760 $ (5,985) $ 3,172 Energy Efficiency Loans: December 31, 2018 $ 677 $ (444) $ 404 $ 637 December 31, 2017 $ 804 $ (675) $ 548 $ 677
25
Regulatory Deferrals. The Board has the authority to establish the level of rates charged for all SMUD services. As a regulated entity, SMUD’s financial statements are prepared in accordance with SGAS Statement No. 62, “Codification of Accounting and Financial Reporting Guidance Contained in Pre-November 30, 1989 FASB and AICPA Pronouncements,” which requires that the effects of the ratemaking process be recorded in the financial statements. Accordingly, certain expenses and credits, normally reflected in Change in Net Position as incurred, are recognized when included in rates and recovered from or refunded to customers. SMUD records various regulatory assets and credits to reflect ratemaking actions of the Board (see Note 8). Materials and Supplies. Materials and supplies are stated at average cost, which approximates the first-in, first-out method. Compensated Absences. SMUD accrues vacation leave and compensatory time when employees earn the rights to the benefits. SMUD does not record sick leave as a liability until it is taken by the employee, since there are no cash payments made for sick leave when employees terminate or retire. At December 31, 2018 and 2017, the total estimated liability for vacation and other compensated absences was $27.2 million and $26.0 million, respectively. Public Good. Public Good expenses consist of non-capital expenditures for energy efficiency programs, low income subsidies, renewable energy resources and technologies, and research and development. Gains/Losses on Bond Refundings. Gains and losses resulting from bond refundings are included as a component of Deferred Inflows of Resources or Deferred Outflows of Resources on the Consolidated Statements of Net Position and amortized as a component of Interest on Debt in the Consolidated Statements of Revenues, Expenses and Changes in Net Position over the shorter of the life of the refunded debt or the new debt using the effective interest method. Gains/Losses on Bond Defeasances or Extinguishments. Gains and losses resulting from bond defeasances or extinguishments that were not financed with the issuance of new debt are included as a component of Interest on Debt in the Consolidated Statements of Revenues, Expenses and Changes in Net Position. Allowance for Funds Used During Construction (AFUDC). SMUD capitalizes, as an additional cost of Construction Work In Progress (CWIP), AFUDC, which represents the cost of borrowed funds used for such purposes. The amount capitalized is determined by a formula prescribed by FERC. The AFUDC rate for 2018 and 2017 was 2.3 percent and 2.4 percent of eligible CWIP, respectively. Derivative Financial Instruments. SMUD records derivative financial instruments (interest rate swap and gas price swap agreements, certain wholesale sales agreements, certain power purchase agreements and option agreements) at fair value on its Consolidated Statements of Net Position. SMUD does not enter into agreements for speculative purposes. Fair value is estimated by comparing contract prices to forward market prices quoted by third party market participants and/or provided in relevant industry publications. SMUD is exposed to risk of nonperformance if the counterparties default or if the swap agreements are terminated. SMUD reports derivative financial instruments with remaining maturities of one year or less and the portion of long-term contracts with scheduled transactions over the next twelve months as current on the Consolidated Statements of Net Position (see Note 9). Interest Rate Swap Agreements. SMUD enters into interest rate swap agreements to modify the effective interest rates on outstanding debt (see Notes 9 and 10). Gas and Electricity Price Swap and Option Agreements. SMUD uses forward contracts to hedge the impact of market volatility on gas commodity prices for its natural gas-fueled power plants and for energy prices on purchased power for SMUD’s retail load (see Note 9).
26
Solano Wind Sale and Purchase. SMUD entered into an agreement to sell the Solano Wind Phase 3 plant in December 2011 with a corresponding Power Purchase Agreement for all output of the plant. The plant began commercial operation in April 2012 and SMUD received all output generated. Under the terms of the various agreements, SMUD had the option to buy the plant back upon the sixth, eighth, or fifteenth anniversary of the commercial operation date or the end of the delivery term. In October 2017, SMUD submitted its notice of intent to exercise this option upon the sixth anniversary of commercial operation date which was in April 2018. At December 31, 2017, SMUD recorded the prepayment for purchase power as Prepayments and Other under Current Assets. In April 2018, SMUD purchased the plant back and recorded the gain on purchase of $46.7 million as Other Income – Net in the Consolidated Statements of Revenues, Expenses and Changes in Net Position. Precipitation Hedge Agreements. SMUD enters into non-exchange traded precipitation hedge agreements to hedge the cost of replacement power caused by low precipitation years (Precipitation Agreements). SMUD records the intrinsic value of the Precipitation Agreements as Prepayments and Other under Current Assets on the Consolidated Statements of Net Position. Settlement of the Precipitation Agreements is not performed until the end of the period covered (water year ended September 30). The intrinsic value of a Precipitation Agreement is the difference between the expected results from a monthly allocation of the cumulative rainfall amounts, in an average rainfall year, and the actual rainfall during the same period. Insurance Programs. SMUD records liabilities for unpaid claims at their present value when they are probable in occurrence and the amount can be reasonably estimated. SMUD records a liability for unpaid claims associated with general, auto, workers’ compensation, and short-term and long-term disability based upon estimates derived by SMUD’s claims administrator or SMUD staff. The liability comprises the present value of the claims outstanding, and includes an amount for claim events incurred but not reported based upon SMUD’s experience (see Note 16). Pollution Remediation. SGAS No. 49, “Accounting and Financial Reporting for Pollution Remediation Obligations,” (GASB No. 49) requires that a liability be recognized for expected outlays for remediating existing pollution when certain triggering events occur. SMUD recorded a pollution remediation obligation for its North City Substation, which was built on a former landfill, for the former Community Linen Rental Services Property, and obligations for land sites, including one where it will be building a substation (see Note 18). At December 31, 2018 and 2017, the total pollution remediation liability was $17.3 million and $33.6 million, respectively, and recorded as either Current Liabilities, Customer Deposits and Other or Noncurrent Liabilities, Self Insurance and Other in the Consolidated Statements of Net Position. Costs were estimated using the expected cash flow technique prescribed under GASB No. 49, including only amounts that are reasonably estimable. Hydro License. SMUD owns and operates the Upper American River Hydroelectric Project (UARP). The original license to construct and operate the UARP was issued in 1957 by FERC. Effective July 1, 2014, SMUD received a 50-year hydro license. As part of the hydro licensing process, SMUD entered into four contracts with government agencies whereby SMUD makes annual payments to them for various services for the term of the license. At December 31, 2018 and 2017, the liability for these contract payments was $58.8 and $57.8 million, respectively, and recorded as either Current Liabilities, Customer Deposits and Other or Noncurrent Liabilities, Self Insurance and Other in the Consolidated Statements of Net Position (see Note 17). Assembly Bill 32. California Assembly Bill 32 (AB-32) was an effort by the State of California to set a greenhouse gas (GHG) emissions reduction goal into law, and initially was set through 2020. In 2015, the state established a 2030 goal for GHG emissions at 40% below 1990 levels, and in July of 2017 AB-398 was approved by the Governor. Central to these initiatives is the Cap and Trade program, which covers major sources of GHG emissions in the State including power plants; AB-398 extended Cap and Trade through 2030. The Cap and Trade program includes an enforceable emissions cap that will decline over time. The State distributes allowances, which are tradable permits, equal to the emissions allowed under the cap. Sources under the cap are required to surrender allowances and offsets equal to their emissions at the end of each compliance period. SMUD is subject to AB-32 and participated in the program auctions in 2017 and 2018. In a normal water year, SMUD expects its free allocation of allowances from the Air Resources Board to cover its compliance costs associated with electricity delivered to its retail customers. SMUD expects to recover compliance costs associated with wholesale power
27
sales costs through its wholesale power sales revenues. SMUD continues to monitor new legislation and proposed programs that could impact AB-32 and its subsequent extensions. Net Pension Liability (NPL). SMUD implemented SGAS No. 73, “Accounting and Financial Reporting for Pensions and Related Assets that are not within the Scope of GASB Statement 68, and Amendments to Certain Provisions of GASB Statements 67 and 68,” (GASB No. 73) in 2017 and SGAS No. 68, “Accounting and Financial Reporting for Pensions – An Amendment of GASB Statement No. 27,” (GASB No. 68) in 2015. The NPL is the difference between the actuarial present value of projected pension benefit payments attributable to employees’ past service and the pension plan’s fiduciary net position. At December 31, 2018 and 2017, the NPL was $454.0 million and $565.8 million, respectively (see Note 14). Net Other Postemployment Benefit (OPEB) Liability (NOL). SMUD implemented SGAS No. 75, “Accounting and Financial Reporting for Postemployment Benefits Other Than Pensions,” (GASB No. 75) in 2018 (see Note 3). The NOL is the difference between the actuarial present value of projected OPEB benefit payments attributable to employee’s past service and the OPEB plan’s fiduciary net position. At December 31, 2018 and 2017, the NOL was $22.1 million and $100.9 million, respectively (see Note 15). Net Position. SMUD classifies its net position into three components as follows:
Net investment in capital assets – This component of net position consists of capital assets, net of accumulated depreciation, reduced by the outstanding debt balances, net of unamortized debt expenses. Deferred inflows and outflows of resources that are attributable to the acquisition, construction or improvement of those assets or related debt are also included.
Restricted – This component of net position consists of assets with constraints placed on their use, either externally or internally. Constraints include those imposed by debt indentures (excluding amounts considered in net capital, above), grants or laws and regulations of other governments, or by law through constitutional provisions or enabling legislation or by the Board. These restricted assets are reduced by liabilities and deferred inflows of resources related to those assets.
Unrestricted – This component of net position consists of net amount of the assets, deferred outflows of resources, liabilities, and deferred inflows of resources that do not meet the definition of “Net investment in capital assets” or “Restricted.”
Contributions in Aid of Construction (CIAC). SMUD records CIAC from customer contributions, primarily relating to expansions to SMUD’s distribution facilities, as Other Income - Net in the Consolidated Statements of Revenues, Expenses and Changes in Net Position. Contributions of capital are valued at acquisition value. For ratemaking purposes, the Board does not recognize such revenues when received; rather, CIAC is included in revenues as such costs are amortized over the estimated useful lives of the related distribution facilities. Revenues and Expenses. SMUD distinguishes operating revenues and expenses from non-operating items. Operating revenues and expenses generally result from providing services and producing and delivering goods in connection with SMUD’s principal ongoing operations. The principal operating revenues of SMUD are charges to customers for sales and services. Operating expenses include the cost of sales and services, administrative expenses, and depreciation on capital assets. All revenues and expenses not meeting this definition are reported as Non-Operating Revenues and Expenses. Grants. SMUD receives grant proceeds from federal and state assisted programs for its projects which include, but are not limited to, advanced and renewable technologies, electric transportation, and energy efficiency. SMUD also periodically receives grant proceeds from federal or state assistance programs as partial reimbursements for costs it has incurred as a result of natural disasters, such as storm or fire damages. When applicable, these programs may be subject to financial and compliance audits pursuant to regulatory requirements. SMUD considers the possibility of any material disallowances to be remote. During 2018, SMUD recorded $4.6 million of grant proceeds and recognized $3.5 million as a component of Other Income - Net, in the Consolidated Statements of Revenues, Expenses and Changes in Net Position, and $1.2 million as a
28
Regulatory Credit. During 2017, SMUD recorded $4.9 million of grant proceeds and recognized $3.0 million as a component of Other Income - Net, in the Consolidated Statements of Revenues, Expenses and Changes in Net Position, and $1.9 million as a Regulatory Credit (see Note 8). In 2010, SMUD issued taxable Build America Bonds. SMUD receives an interest subsidy from the federal government equal to 35 percent of the interest paid (see Note 10). SMUD received reduced subsidy payments in 2018 and 2017 due to budget sequestration by the federal government. SMUD recognized $9.2 million and $9.1 million in revenues in 2018 and 2017, respectively, for its Build America Bonds, as a component of Other Income - Net, in the Consolidated Statements of Revenues, Expenses and Changes in Net Position. Customer Sales and Excise Taxes. SMUD is required by various governmental authorities, including states and municipalities, to collect and remit taxes on certain customer sales. Such taxes are presented on a net basis and excluded from revenues and expenses in the Consolidated Statements of Revenues, Expenses and Changes in Net Position. Rancho Seco Litigation. In June 1983, SMUD and the U.S. Department of Energy (DOE) entered into a contract whereby the DOE would build a repository for the acceptance and disposal of SMUD’s spent nuclear fuel (SNF) and/or high-level radioactive waste (HLW). SMUD paid the DOE a total of approximately $40.0 million in fees under the contract, thus satisfying its obligation of performance under the contract. The DOE did not build a repository and therefore breached its obligation under the contract to commence acceptance of SNF and HLW by January 31, 1998. As a result, SMUD incurred costs to design, license, and fabricate its own on-site storage facility for the long term dry storage of its spent fuel at Rancho Seco. In June 2015, SMUD filed a suit against DOE which covered the costs incurred from 2010 through June 2015. In June 2017, SMUD received an award for $28.9 million from the U.S. Court of Claims of which $27.1 million was recorded as Other Income - Net in the Consolidated Statements of Revenues, Expenses and Changes in Net Position and $1.7 million was recorded as CIAC since a portion of the award constituted a reimbursement for the cost of capital assets. Subsequent Events. Subsequent events for SMUD have been evaluated through February 15, 2019, which is the date that the financial statements were available to be issued. Reclassifications. Certain amounts in the 2017 Consolidated Financial Statements have been reclassified in order to conform to the 2018 presentation. Recent Accounting Pronouncements. In November 2016, GASB issued SGAS No. 83, “Certain Asset Retirement Obligations” (GASB No. 83). An Asset Retirement Obligation (ARO) is a legally enforceable liability associated with the retirement of a tangible capital asset. A government that has legal obligations to perform future asset retirement activities related to its tangible capital assets should recognize a liability based on the guidance in this statement. GASB No. 83 establishes the criteria for determining the timing and pattern of recognition of a liability and a corresponding deferred outflow of resources for AROs. Recognition occurs when the liability is both incurred and reasonably estimable. The determination of when the liability is incurred should be based on the occurrence of external laws, regulations, contracts, or court judgments, together with the occurrence of an internal event that obligates the government to perform the asset retirement activities. GASB No. 83 requires the measurement of the ARO be based on the probability weighted best estimate of the current value of outlays expected to be incurred, and adjusted for general inflation or deflation at least annually. It requires a government to evaluate all relevant factors at least annually to determine whether the effects of one or more of the factors are expected to significantly change the estimated asset retirement outlays. The ARO should only be remeasured when the result of the evaluation indicates a significant change in the estimated outlays. GASB No. 83 also requires disclosures of descriptive information about the nature of a government’s AROs including the methods and assumptions used for the estimates of the liabilities, the estimated remaining useful life of the associated tangible capital assets, how any funding and assurance requirements are being met, and the amount of any assets restricted for payment of the AROs (if not separately displayed in the financial statements). If a liability for an ARO (or portions thereof) has been incurred by a government but is not yet recognized because it is not reasonably estimable, the government should disclose that fact and the reasons therefor. This
29
statement is effective for SMUD in 2019. SMUD is currently assessing the financial statement impact of adopting this statement. SMUD currently records AROs following the FASB guidance (see Accrued Decommissioning under Note 2). In January 2017, GASB issued SGAS No. 84, “Fiduciary Activities” (GASB No. 84). This statement establishes standards of accounting and financial reporting for fiduciary activities. GASB No. 84 establishes criteria for identifying fiduciary activities of all state and local governments. The focus of the criteria generally is on (1) whether a government is controlling the assets of the fiduciary activity and (2) the beneficiaries with whom a fiduciary relationship exists. An activity meeting the criteria should be reported in a fiduciary fund in the basic financial statements. Governments with activities meeting the criteria should present a statement of fiduciary net position and a statement of changes in fiduciary net position. The statement of fiduciary net position reports the assets, deferred outflows of resources, liabilities, deferred inflows of resources, and fiduciary net position of the fiduciary activities. The statement of changes in fiduciary net position reports the additions to and deductions from the fiduciary fund(s). This statement also provides for the recognition of a liability to the beneficiaries in a fiduciary fund when an event has occurred that compels the government to disburse fiduciary resources. This statement is effective for SMUD in 2019. SMUD is currently assessing the financial statement impact of adopting this statement. In March 2017, GASB issued SGAS No. 85, “Omnibus 2017” (GASB No. 85). GASB No. 85 addresses a variety of topics including issues related to blending component units, goodwill, fair value measurement and application, and postemployment benefits (pensions and other postemployment benefits). This statement is effective for SMUD in 2018. SMUD has assessed the financial statement impact of adopting the new statement, and its impact is not material. In May 2017, GASB issued SGAS No. 86, “Certain Debt Extinguishment Issues” (GASB No. 86). The primary objective of this statement is to improve consistency in accounting and financial reporting for in-substance defeasance of debt by providing guidance for transactions in which cash and other monetary assets acquired with only existing resources (resources other than the proceeds of refunding debt) are placed in an irrevocable trust for the sole purpose of extinguishing debt. GASB No. 86 also improves accounting and financial reporting for prepaid insurance on debt that is extinguished and notes to financial statements for debt that is defeased in substance. This statement is effective for SMUD in 2018. SMUD has assessed the financial statement impact of adopting the new statement, and its impact is not material. In June 2017, GASB issued SGAS No. 87, “Leases” (GASB No. 87). The objective of this statement is to better meet the information needs of financial statement users by improving accounting and financial reporting for leases by governments. GASB No. 87 requires recognition of certain lease assets and liabilities for leases that previously were classified as operating leases and recognized as inflows of resources or outflows of resources based on the payment provisions of the contract. It establishes a single model for lease accounting based on the foundational principle that leases are financings of the right to use an underlying asset. Under GASB No. 87, a lessee is required to recognize a lease liability and an intangible right-to-use lease asset, and a lessor is required to recognize a lease receivable and a deferred inflow of resources. The lease liability should be measured at the present value of payments expected to be made during the lease term. As payments are made the lease liability is reduced and an outflow of resources (interest expense) is recognized for the interest on the liability. The lease asset should be amortized in a systematic and rational manner over the shorter of the lease term or the useful life of the underlying asset. The lease receivable should be measured at the present value of the lease payments expected to be received during the lease term. Any payments received are first allocated to accrued interest receivable and then to lease receivable. The deferred inflow of resources should be recognized as inflows of resources (revenue) in a systematic and rational manner over the term of the lease. The lessor should not derecognize the asset underlying the lease. A lease is defined as a contract that conveys control of the right to use another entity’s nonfinancial asset (the underlying asset) as specified in the contract for a period of time in an exchange or exchange-like transaction. Examples of nonfinancial assets include buildings, land, vehicles, and equipment. Any contract that meets this definition should be accounted for under the leases guidance, unless specifically excluded in this statement. The lease term is defined as the period during which a lessee has a noncancellable right to use an underlying asset, plus the following periods, if applicable. A short-term lease is defined as a lease that, at the commencement of the lease term, has a maximum possible term under the lease contract of 12 months (or less), including any options to extend, regardless of their probability of being exercised. Lessees and lessors should recognize short-term lease payments as outflows of resources (expenses) or inflows
30
of resources (revenues), respectively, based on the payment provisions of the lease contract. This statement is effective for SMUD in 2020. SMUD is currently assessing the financial statement impact of adopting this statement. In March 2018, GASB issued SGAS No. 88, “Certain Disclosures Related to Debt, Including Direct Borrowings and Direct Placements” (GASB No. 88). The primary objective of this Statement is to improve the information that is disclosed in notes to financial statements related to debt, including direct borrowings and direct placements. GASB No. 88 also clarifies which liabilities should be included when disclosing information related to debt. This statement defines debt for purposes of disclosure in notes to financial statements as a liability that arises from a contractual obligation to pay cash (or other assets that may be used in lieu of cash) in one or more payments to settle an amount that is fixed at the date the contractual obligation is established. GASB No. 88 also requires additional information related to debt be disclosed, including unused lines of credits; assets pledged as collateral for the debt; and terms specified in debt agreements related to significant events of default with finance-related consequences, significant termination events with finance-related consequences, and significant subjective acceleration clauses. This Statement also requires that existing and additional information be provided for direct borrowings and direct placements of debt separately from other debt. This statement is effective for SMUD in 2019. SMUD is currently assessing the note disclosure impact of adopting this statement. In June 2018, GASB issued SGAS No. 89, “Accounting for Interest Cost Incurred before the End of a Construction Period” (GASB No. 89). The objectives of this Statement are (1) to enhance the relevance and comparability of information about capital assets and the cost of borrowing for a reporting period and (2) to simplify accounting for interest cost incurred before the end of a construction period. GASB No. 89 establishes accounting requirements for interest cost incurred before the end of a construction period. This Statement requires that interest cost incurred before the end of a construction period be recognized as an expense in the period in which the cost is incurred for financial statements. As a result, interest cost incurred before the end of a construction period will not be included in the historical cost of a capital asset reported in a business-type activity. The GASB has allowed that provided the criteria for regulated operations are met and the entity has elected regulatory accounting, qualifying interest cost may be capitalized as a regulatory asset. This statement is effective for SMUD in 2020. SMUD has assessed the financial statement impact of adopting the new statement and its impact is not material. SMUD will discontinue capitalizing interest costs in 2020 when GASB 89 is implemented. In August 2018, GASB issued SGAS No. 90, “Majority Equity Interests” (GASB No. 90). The objectives of this Statement are to improve the consistency and comparability of reporting a government’s majority equity interest in a legally separate organization and to improve the relevance of financial statement information for certain component units. GASB No. 90 defines a majority equity interest and specifies that a majority equity interest in a legally separate organization should be reported as an investment if a government’s holding of the equity interest meets the definition of an investment. A majority equity interest that meets the definition of an investment should be measured using the equity method. For all other holdings of a majority equity interest, a government should report the legally separate organization as a component unit. The government should report an asset related to the majority equity interest using the equity method. This statement is effective for SMUD in 2019. SMUD is currently assessing the financial statement impact of adopting this statement, but does not expect it to be material. NOTE 3. ACCOUNTING CHANGE In June 2015, GASB issued SGAS No. 75, “Accounting and Financial Reporting for Postemployment Benefits Other Than Pensions” (GASB No. 75). This Statement replaces the requirements of SGAS No. 45, “Accounting and Financial Reporting by Employers for Postemployment Benefits Other Than Pensions,” as amended, and SGAS No. 57, “OPEB Measurements by Agent Employers and Agent Multiple-Employer Plans.” For defined benefit other postemployment benefits (OPEB), GASB No. 75 identifies the methods and assumptions that are required to be used to project benefit payments, discount projected benefit payments to their actuarial present value, and attribute that present value to periods of employee service. Note disclosure and required supplementary information requirements about defined benefit OPEB also are addressed. In addition, this statement details the recognition and disclosure requirements for employers with payables to defined benefit OPEB plans that are administered through trusts that meet the specified criteria.
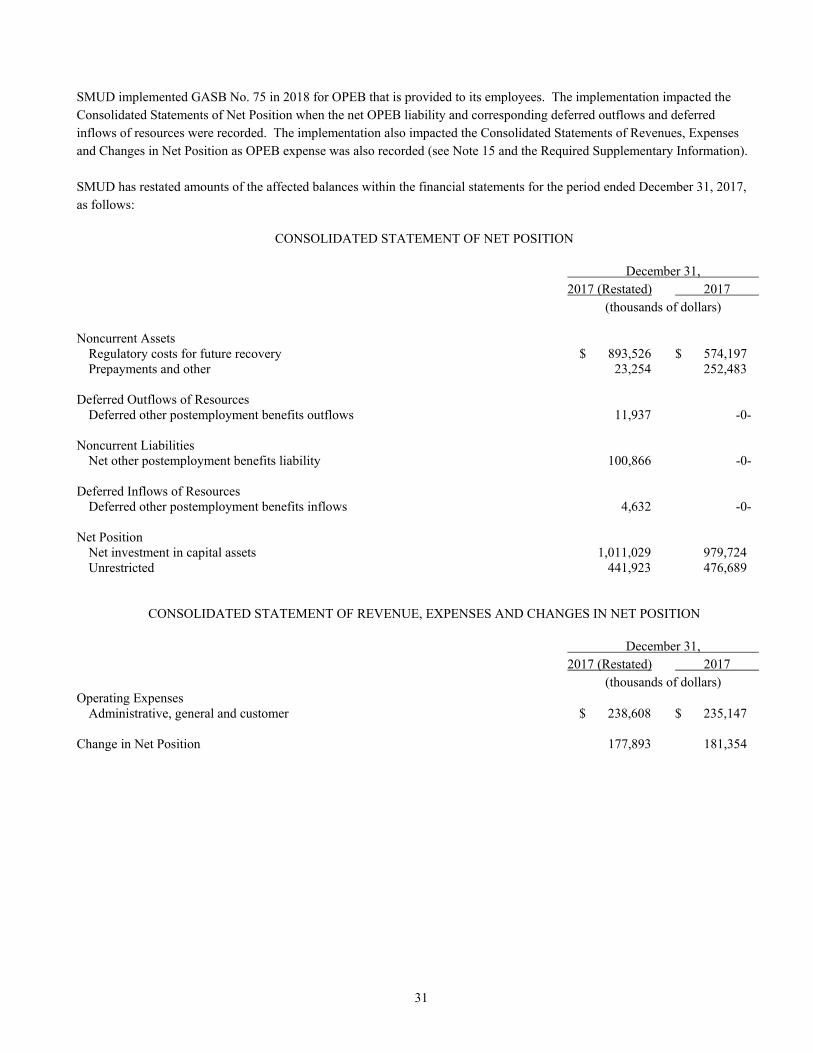
31
SMUD implemented GASB No. 75 in 2018 for OPEB that is provided to its employees. The implementation impacted the Consolidated Statements of Net Position when the net OPEB liability and corresponding deferred outflows and deferred inflows of resources were recorded. The implementation also impacted the Consolidated Statements of Revenues, Expenses and Changes in Net Position as OPEB expense was also recorded (see Note 15 and the Required Supplementary Information). SMUD has restated amounts of the affected balances within the financial statements for the period ended December 31, 2017, as follows: CONSOLIDATED STATEMENT OF NET POSITION December 31, 2017 (Restated) 2017 (thousands of dollars) Noncurrent Assets Regulatory costs for future recovery $ 893,526 $ 574,197 Prepayments and other 23,254 252,483 Deferred Outflows of Resources Deferred other postemployment benefits outflows 11,937 -0- Noncurrent Liabilities Net other postemployment benefits liability 100,866 -0- Deferred Inflows of Resources Deferred other postemployment benefits inflows 4,632 -0- Net Position Net investment in capital assets 1,011,029 979,724 Unrestricted 441,923 476,689 CONSOLIDATED STATEMENT OF REVENUE, EXPENSES AND CHANGES IN NET POSITION December 31, 2017 (Restated) 2017 (thousands of dollars) Operating Expenses Administrative, general and customer $ 238,608 $ 235,147 Change in Net Position 177,893 181,354
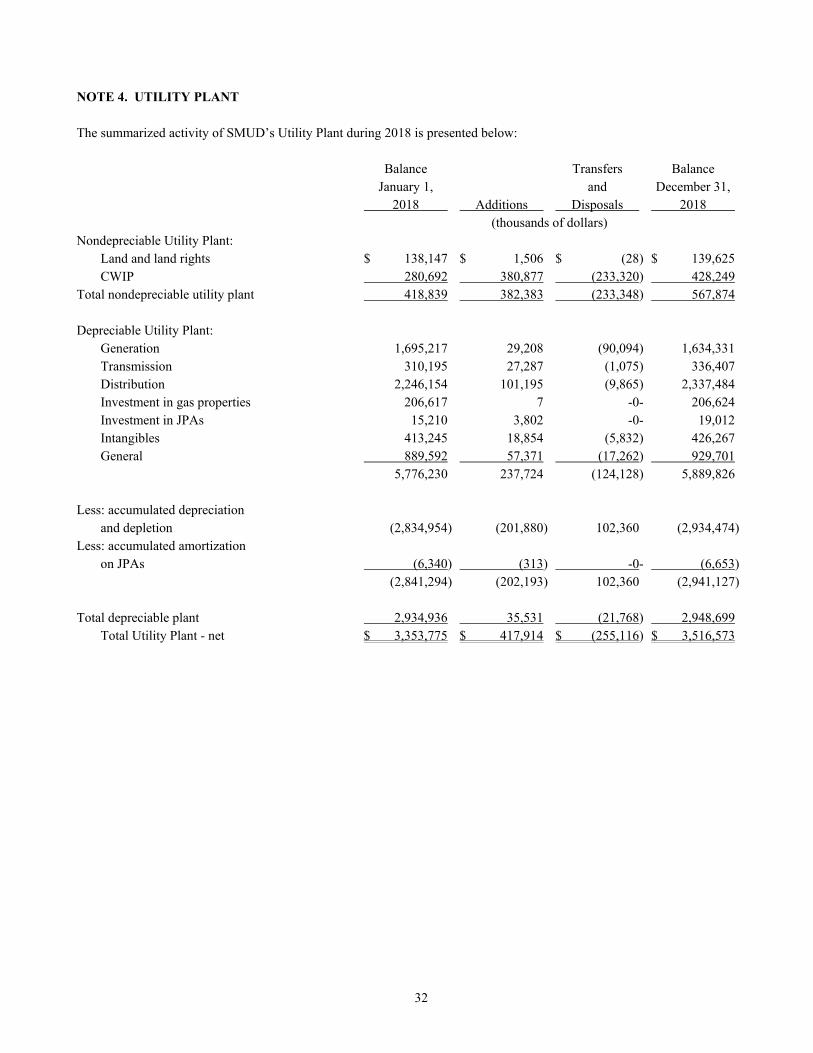
32
NOTE 4. UTILITY PLANT The summarized activity of SMUD’s Utility Plant during 2018 is presented below: Balance Transfers Balance January 1, and December 31, 2018 Additions Disposals 2018 (thousands of dollars) Nondepreciable Utility Plant: Land and land rights $ 138,147 $ 1,506 $ (28) $ 139,625 CWIP 280,692 380,877 (233,320) 428,249 Total nondepreciable utility plant 418,839 382,383 (233,348) 567,874 Depreciable Utility Plant: Generation 1,695,217 29,208 (90,094) 1,634,331 Transmission 310,195 27,287 (1,075) 336,407 Distribution 2,246,154 101,195 (9,865) 2,337,484 Investment in gas properties 206,617 7 -0- 206,624 Investment in JPAs 15,210 3,802 -0- 19,012 Intangibles 413,245 18,854 (5,832) 426,267 General 889,592 57,371 (17,262) 929,701 5,776,230 237,724 (124,128) 5,889,826 Less: accumulated depreciation and depletion (2,834,954) (201,880) 102,360 (2,934,474) Less: accumulated amortization on JPAs (6,340) (313) -0- (6,653) (2,841,294) (202,193) 102,360 (2,941,127) Total depreciable plant 2,934,936 35,531 (21,768) 2,948,699 Total Utility Plant - net $ 3,353,775 $ 417,914 $ (255,116) $ 3,516,573
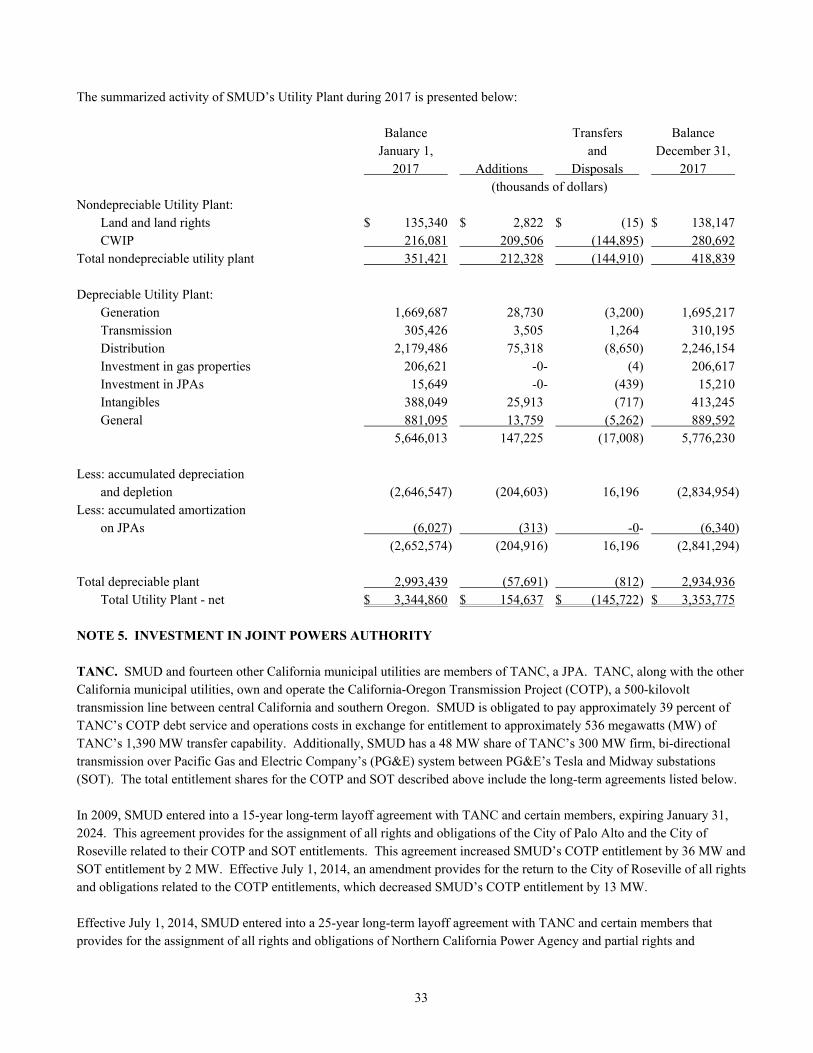
33
The summarized activity of SMUD’s Utility Plant during 2017 is presented below: Balance Transfers Balance January 1, and December 31, 2017 Additions Disposals 2017 (thousands of dollars) Nondepreciable Utility Plant: Land and land rights $ 135,340 $ 2,822 $ (15) $ 138,147 CWIP 216,081 209,506 (144,895) 280,692 Total nondepreciable utility plant 351,421 212,328 (144,910) 418,839 Depreciable Utility Plant: Generation 1,669,687 28,730 (3,200) 1,695,217 Transmission 305,426 3,505 1,264 310,195 Distribution 2,179,486 75,318 (8,650) 2,246,154 Investment in gas properties 206,621 -0- (4) 206,617 Investment in JPAs 15,649 -0- (439) 15,210 Intangibles 388,049 25,913 (717) 413,245 General 881,095 13,759 (5,262) 889,592 5,646,013 147,225 (17,008) 5,776,230 Less: accumulated depreciation and depletion (2,646,547) (204,603) 16,196 (2,834,954) Less: accumulated amortization on JPAs (6,027) (313) -0- (6,340) (2,652,574) (204,916) 16,196 (2,841,294) Total depreciable plant 2,993,439 (57,691) (812) 2,934,936 Total Utility Plant - net $ 3,344,860 $ 154,637 $ (145,722) $ 3,353,775 NOTE 5. INVESTMENT IN JOINT POWERS AUTHORITY TANC. SMUD and fourteen other California municipal utilities are members of TANC, a JPA. TANC, along with the other California municipal utilities, own and operate the California-Oregon Transmission Project (COTP), a 500-kilovolt transmission line between central California and southern Oregon. SMUD is obligated to pay approximately 39 percent of TANC’s COTP debt service and operations costs in exchange for entitlement to approximately 536 megawatts (MW) of TANC’s 1,390 MW transfer capability. Additionally, SMUD has a 48 MW share of TANC’s 300 MW firm, bi-directional transmission over Pacific Gas and Electric Company’s (PG&E) system between PG&E’s Tesla and Midway substations (SOT). The total entitlement shares for the COTP and SOT described above include the long-term agreements listed below. In 2009, SMUD entered into a 15-year long-term layoff agreement with TANC and certain members, expiring January 31, 2024. This agreement provides for the assignment of all rights and obligations of the City of Palo Alto and the City of Roseville related to their COTP and SOT entitlements. This agreement increased SMUD’s COTP entitlement by 36 MW and SOT entitlement by 2 MW. Effective July 1, 2014, an amendment provides for the return to the City of Roseville of all rights and obligations related to the COTP entitlements, which decreased SMUD’s COTP entitlement by 13 MW. Effective July 1, 2014, SMUD entered into a 25-year long-term layoff agreement with TANC and certain members that provides for the assignment of all rights and obligations of Northern California Power Agency and partial rights and
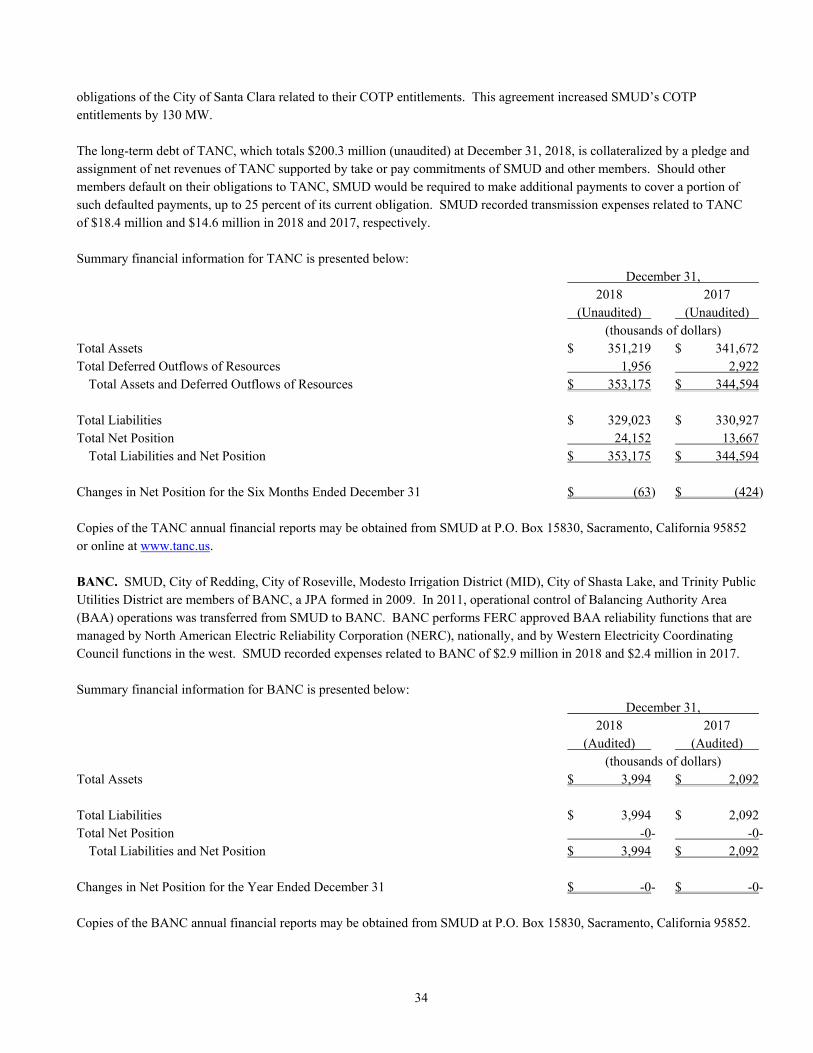
34
obligations of the City of Santa Clara related to their COTP entitlements. This agreement increased SMUD’s COTP entitlements by 130 MW. The long-term debt of TANC, which totals $200.3 million (unaudited) at December 31, 2018, is collateralized by a pledge and assignment of net revenues of TANC supported by take or pay commitments of SMUD and other members. Should other members default on their obligations to TANC, SMUD would be required to make additional payments to cover a portion of such defaulted payments, up to 25 percent of its current obligation. SMUD recorded transmission expenses related to TANC of $18.4 million and $14.6 million in 2018 and 2017, respectively. Summary financial information for TANC is presented below: December 31, 2018 2017 (Unaudited) (Unaudited) (thousands of dollars) Total Assets $ 351,219 $ 341,672 Total Deferred Outflows of Resources 1,956 2,922 Total Assets and Deferred Outflows of Resources $ 353,175 $ 344,594 Total Liabilities $ 329,023 $ 330,927 Total Net Position 24,152 13,667 Total Liabilities and Net Position $ 353,175 $ 344,594 Changes in Net Position for the Six Months Ended December 31 $ (63) $ (424) Copies of the TANC annual financial reports may be obtained from SMUD at P.O. Box 15830, Sacramento, California 95852 or online at www.tanc.us. BANC. SMUD, City of Redding, City of Roseville, Modesto Irrigation District (MID), City of Shasta Lake, and Trinity Public Utilities District are members of BANC, a JPA formed in 2009. In 2011, operational control of Balancing Authority Area (BAA) operations was transferred from SMUD to BANC. BANC performs FERC approved BAA reliability functions that are managed by North American Electric Reliability Corporation (NERC), nationally, and by Western Electricity Coordinating Council functions in the west. SMUD recorded expenses related to BANC of $2.9 million in 2018 and $2.4 million in 2017. Summary financial information for BANC is presented below: December 31, 2018 2017 (Audited) (Audited) (thousands of dollars) Total Assets $ 3,994 $ 2,092 Total Liabilities $ 3,994 $ 2,092 Total Net Position -0- -0- Total Liabilities and Net Position $ 3,994 $ 2,092 Changes in Net Position for the Year Ended December 31 $ -0- $ -0- Copies of the BANC annual financial reports may be obtained from SMUD at P.O. Box 15830, Sacramento, California 95852.

35
NOTE 6. COMPONENT UNITS CVFA Carson Cogeneration Project. CVFA is a JPA formed by SMUD and the Sacramento Regional County Sanitation District. CVFA operates the Carson Project, a 65 MW (net) natural gas-fired cogeneration facility and a 42 MW (net) natural gas-fired simple cycle peaking plant. The revenue stream to pay the CVFA bonds’ debt service is provided by a “take-or-pay” power purchase agreement between SMUD and CVFA. SCA Procter & Gamble Cogeneration Project. SCA is a JPA formed by SMUD and the SFA. SCA operates the Procter & Gamble Project, a 136 MW (net) natural gas-fired cogeneration facility and a 50 MW (net) natural gas-fired simple cycle peaking plant. The revenue stream to pay the SCA bonds’ debt service is provided by a “take-or-pay” power purchase agreement between SMUD and SCA. SFA Cosumnes Power Plant Project. SFA is a JPA formed by SMUD and MID. SFA operates the Cosumnes Power Plant Project, a 539 MW (net) natural gas-fired, combined cycle facility. The revenue stream to pay the SFA bonds’ debt service is provided by a “take-or-pay” power purchase agreement between SMUD and SFA. SPA Campbell Soup Cogeneration Project. SPA is a JPA formed by SMUD and the SFA. SPA operates the Campbell Soup Project, a 160 MW (net) natural gas-fired cogeneration facility, and the McClellan Project, a 72 MW (net) natural gas-fired simple cycle peaking plant. NCGA. NCGA is a JPA formed by SMUD and the SFA. NCGA has a prepaid gas contract with Morgan Stanley Capital Group (MSCG) expiring in 2027, which is financed primarily by NCGA revenue bonds. SMUD has contracted with NCGA to purchase all the gas delivered by MSCG to NCGA, based on market prices. NCGA is obligated to pay the principal and interest on the bonds. Neither SMUD nor SFA is obligated to make debt service payments on the bonds. NCGA can terminate the prepaid gas contract under certain circumstances, including a failure by MSCG to meet its gas delivery obligation to NCGA or a drop in MSCG’s credit rating below a specified level. If this occurs, MSCG will be required to make a termination payment to NCGA based on the unamortized prepayment proceeds received by MSCG. NCEA. NCEA is a JPA formed by SMUD and the SFA. NCEA has a prepaid natural gas and electricity (commodity) contract with J. Aron & Company LLC (J. Aron) expiring in 2049, which is financed primarily by NCEA revenue bonds. SMUD has contracted with NCEA to purchase all the commodity delivered by J. Aron to NCEA, based on market prices. NCEA is obligated to pay the principal and interest on the bonds. Neither SMUD nor SFA is obligated to make debt service payments on the bonds. NCEA can terminate the prepaid commodity contract under certain circumstances, including a failure by J. Aron to meet its commodity delivery obligation to NCEA. If this occurs, J. Aron will be required to make a termination payment to NCEA based on the unamortized prepayment proceeds received by J. Aron.
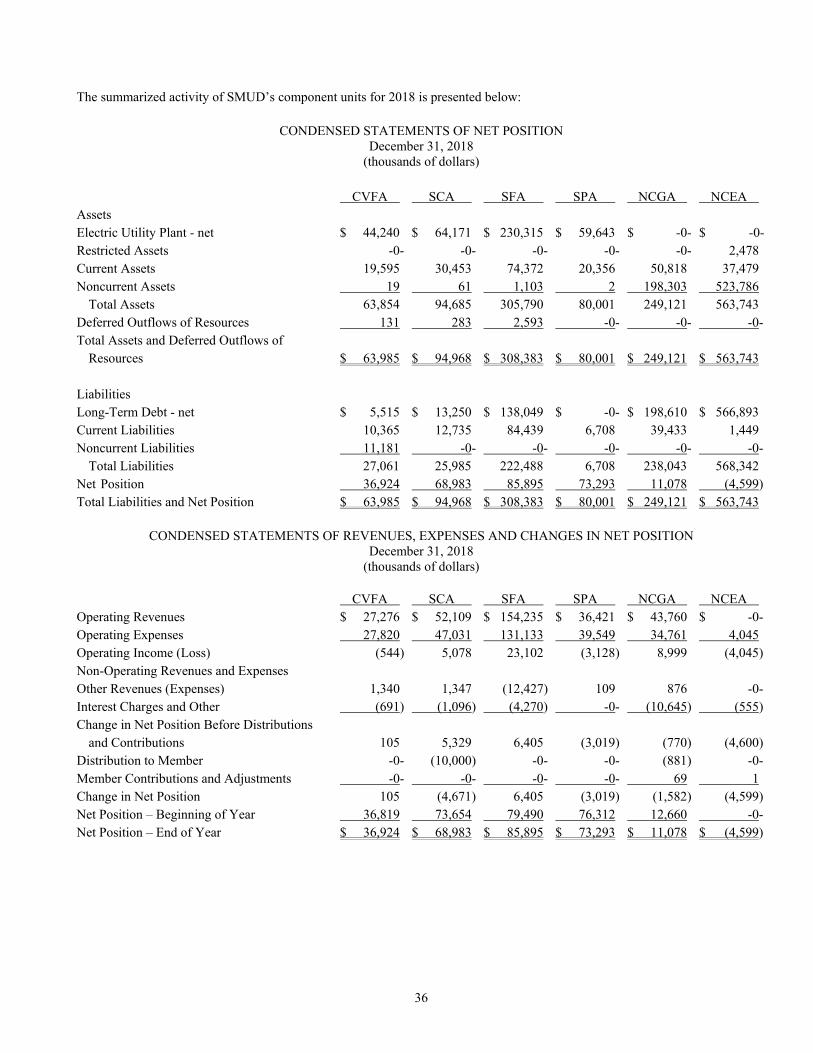
36
The summarized activity of SMUD’s component units for 2018 is presented below:
CONDENSED STATEMENTS OF NET POSITION December 31, 2018
(thousands of dollars) CVFA SCA SFA SPA NCGA NCEA Assets Electric Utility Plant - net $ 44,240 $ 64,171 $ 230,315 $ 59,643 $ -0- $ -0- Restricted Assets -0- -0- -0- -0- -0- 2,478 Current Assets 19,595 30,453 74,372 20,356 50,818 37,479 Noncurrent Assets 19 61 1,103 2 198,303 523,786 Total Assets 63,854 94,685 305,790 80,001 249,121 563,743 Deferred Outflows of Resources 131 283 2,593 -0- -0- -0- Total Assets and Deferred Outflows of Resources $ 63,985 $ 94,968 $ 308,383 $ 80,001 $ 249,121 $ 563,743 Liabilities Long-Term Debt - net $ 5,515 $ 13,250 $ 138,049 $ -0- $ 198,610 $ 566,893 Current Liabilities 10,365 12,735 84,439 6,708 39,433 1,449 Noncurrent Liabilities 11,181 -0- -0- -0- -0- -0- Total Liabilities 27,061 25,985 222,488 6,708 238,043 568,342 Net Position 36,924 68,983 85,895 73,293 11,078 (4,599) Total Liabilities and Net Position $ 63,985 $ 94,968 $ 308,383 $ 80,001 $ 249,121 $ 563,743
CONDENSED STATEMENTS OF REVENUES, EXPENSES AND CHANGES IN NET POSITION December 31, 2018
(thousands of dollars)
CVFA SCA SFA SPA NCGA NCEA Operating Revenues $ 27,276 $ 52,109 $ 154,235 $ 36,421 $ 43,760 $ -0- Operating Expenses 27,820 47,031 131,133 39,549 34,761 4,045 Operating Income (Loss) (544) 5,078 23,102 (3,128) 8,999 (4,045) Non-Operating Revenues and Expenses Other Revenues (Expenses) 1,340 1,347 (12,427) 109 876 -0- Interest Charges and Other (691) (1,096) (4,270) -0- (10,645) (555) Change in Net Position Before Distributions and Contributions 105 5,329 6,405 (3,019) (770) (4,600) Distribution to Member -0- (10,000) -0- -0- (881) -0- Member Contributions and Adjustments -0- -0- -0- -0- 69 1 Change in Net Position 105 (4,671) 6,405 (3,019) (1,582) (4,599) Net Position – Beginning of Year 36,819 73,654 79,490 76,312 12,660 -0- Net Position – End of Year $ 36,924 $ 68,983 $ 85,895 $ 73,293 $ 11,078 $ (4,599)
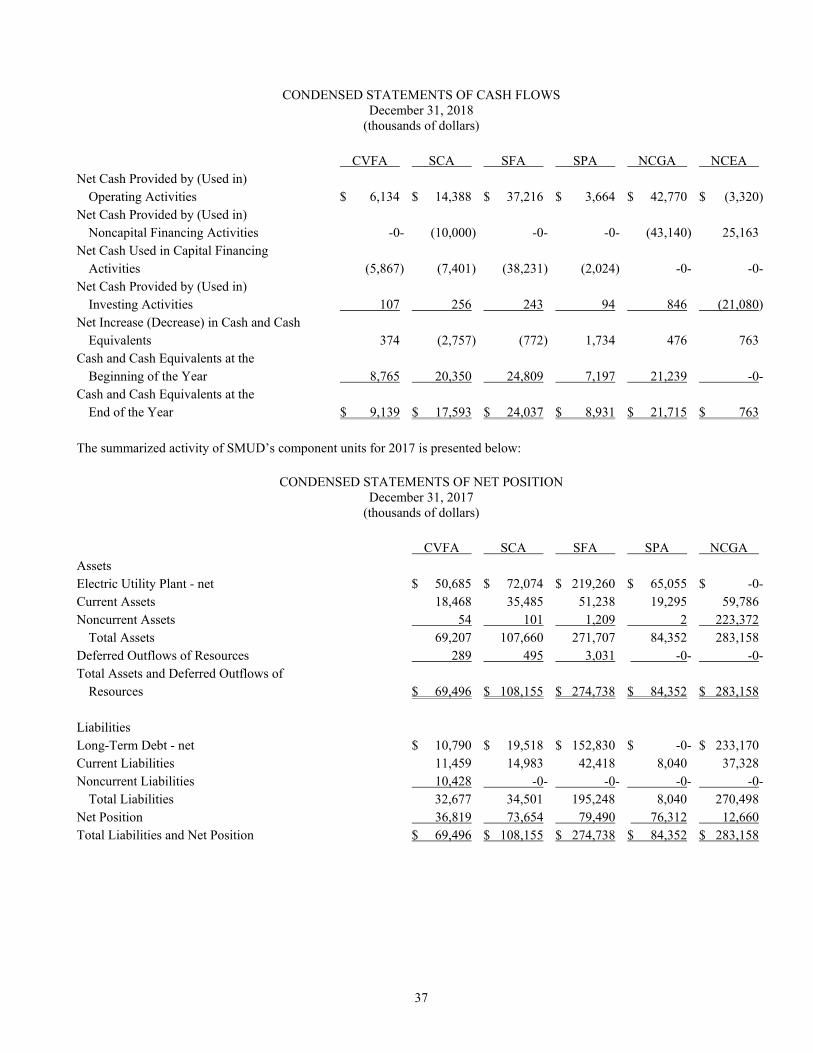
37
CONDENSED STATEMENTS OF CASH FLOWS December 31, 2018
(thousands of dollars) CVFA SCA SFA SPA NCGA NCEA Net Cash Provided by (Used in) Operating Activities $ 6,134 $ 14,388 $ 37,216 $ 3,664 $ 42,770 $ (3,320) Net Cash Provided by (Used in) Noncapital Financing Activities -0- (10,000) -0- -0- (43,140) 25,163 Net Cash Used in Capital Financing Activities (5,867) (7,401) (38,231) (2,024) -0- -0- Net Cash Provided by (Used in) Investing Activities 107 256 243 94 846 (21,080) Net Increase (Decrease) in Cash and Cash Equivalents 374 (2,757) (772) 1,734 476 763 Cash and Cash Equivalents at the Beginning of the Year 8,765 20,350 24,809 7,197 21,239 -0- Cash and Cash Equivalents at the End of the Year $ 9,139 $ 17,593 $ 24,037 $ 8,931 $ 21,715 $ 763 The summarized activity of SMUD’s component units for 2017 is presented below:
CONDENSED STATEMENTS OF NET POSITION December 31, 2017
(thousands of dollars) CVFA SCA SFA SPA NCGA Assets Electric Utility Plant - net $ 50,685 $ 72,074 $ 219,260 $ 65,055 $ -0- Current Assets 18,468 35,485 51,238 19,295 59,786 Noncurrent Assets 54 101 1,209 2 223,372 Total Assets 69,207 107,660 271,707 84,352 283,158 Deferred Outflows of Resources 289 495 3,031 -0- -0- Total Assets and Deferred Outflows of Resources $ 69,496 $ 108,155 $ 274,738 $ 84,352 $ 283,158 Liabilities Long-Term Debt - net $ 10,790 $ 19,518 $ 152,830 $ -0- $ 233,170 Current Liabilities 11,459 14,983 42,418 8,040 37,328 Noncurrent Liabilities 10,428 -0- -0- -0- -0- Total Liabilities 32,677 34,501 195,248 8,040 270,498 Net Position 36,819 73,654 79,490 76,312 12,660 Total Liabilities and Net Position $ 69,496 $ 108,155 $ 274,738 $ 84,352 $ 283,158
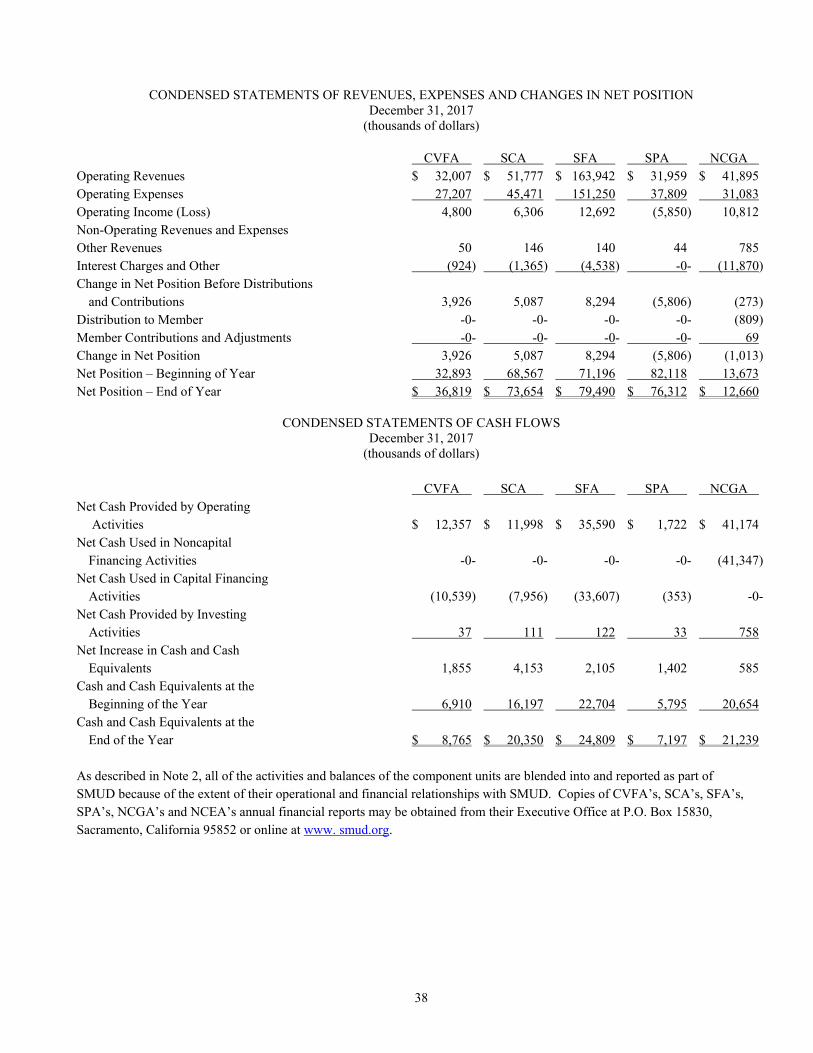
38
CONDENSED STATEMENTS OF REVENUES, EXPENSES AND CHANGES IN NET POSITION December 31, 2017
(thousands of dollars)
CVFA SCA SFA SPA NCGA Operating Revenues $ 32,007 $ 51,777 $ 163,942 $ 31,959 $ 41,895 Operating Expenses 27,207 45,471 151,250 37,809 31,083 Operating Income (Loss) 4,800 6,306 12,692 (5,850) 10,812 Non-Operating Revenues and Expenses Other Revenues 50 146 140 44 785 Interest Charges and Other (924) (1,365) (4,538) -0- (11,870) Change in Net Position Before Distributions and Contributions 3,926 5,087 8,294 (5,806) (273) Distribution to Member -0- -0- -0- -0- (809) Member Contributions and Adjustments -0- -0- -0- -0- 69 Change in Net Position 3,926 5,087 8,294 (5,806) (1,013) Net Position – Beginning of Year 32,893 68,567 71,196 82,118 13,673 Net Position – End of Year $ 36,819 $ 73,654 $ 79,490 $ 76,312 $ 12,660
CONDENSED STATEMENTS OF CASH FLOWS
December 31, 2017 (thousands of dollars)
CVFA SCA SFA SPA NCGA Net Cash Provided by Operating Activities $ 12,357 $ 11,998 $ 35,590 $ 1,722 $ 41,174 Net Cash Used in Noncapital Financing Activities -0- -0- -0- -0- (41,347) Net Cash Used in Capital Financing Activities (10,539) (7,956) (33,607) (353) -0- Net Cash Provided by Investing Activities 37 111 122 33 758 Net Increase in Cash and Cash Equivalents 1,855 4,153 2,105 1,402 585 Cash and Cash Equivalents at the Beginning of the Year 6,910 16,197 22,704 5,795 20,654 Cash and Cash Equivalents at the End of the Year $ 8,765 $ 20,350 $ 24,809 $ 7,197 $ 21,239 As described in Note 2, all of the activities and balances of the component units are blended into and reported as part of SMUD because of the extent of their operational and financial relationships with SMUD. Copies of CVFA’s, SCA’s, SFA’s, SPA’s, NCGA’s and NCEA’s annual financial reports may be obtained from their Executive Office at P.O. Box 15830, Sacramento, California 95852 or online at www. smud.org.
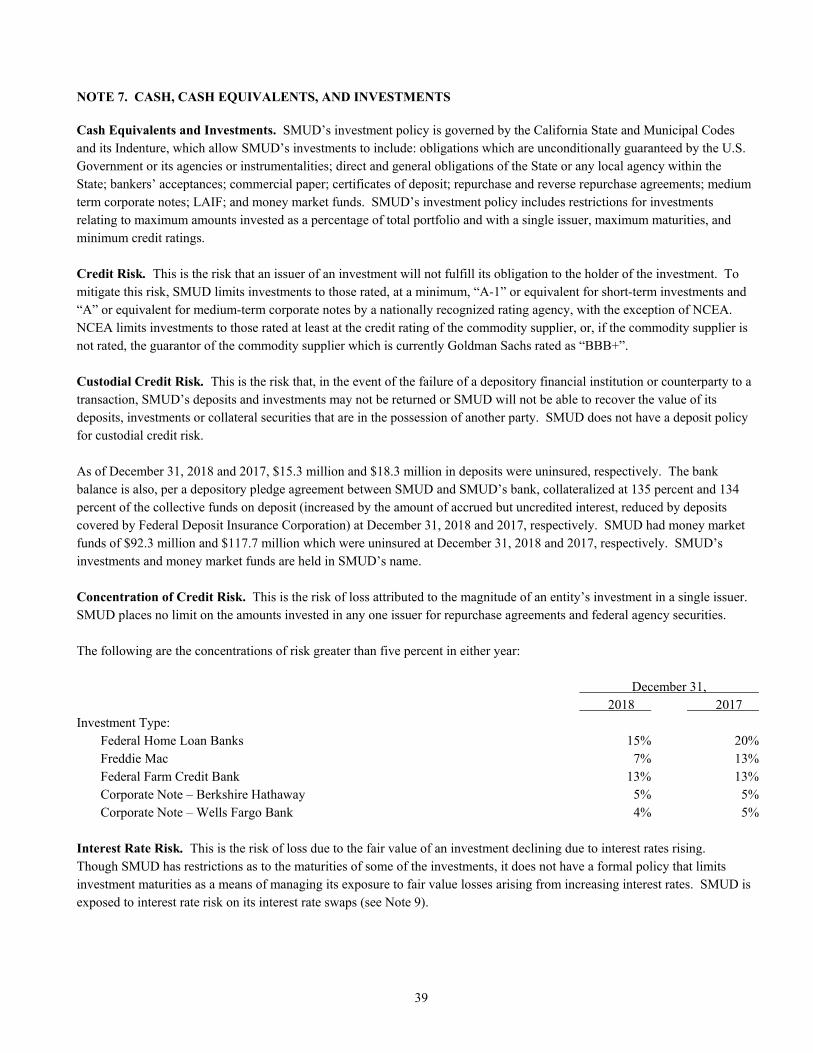
39
NOTE 7. CASH, CASH EQUIVALENTS, AND INVESTMENTS Cash Equivalents and Investments. SMUD’s investment policy is governed by the California State and Municipal Codes and its Indenture, which allow SMUD’s investments to include: obligations which are unconditionally guaranteed by the U.S. Government or its agencies or instrumentalities; direct and general obligations of the State or any local agency within the State; bankers’ acceptances; commercial paper; certificates of deposit; repurchase and reverse repurchase agreements; medium term corporate notes; LAIF; and money market funds. SMUD’s investment policy includes restrictions for investments relating to maximum amounts invested as a percentage of total portfolio and with a single issuer, maximum maturities, and minimum credit ratings. Credit Risk. This is the risk that an issuer of an investment will not fulfill its obligation to the holder of the investment. To mitigate this risk, SMUD limits investments to those rated, at a minimum, “A-1” or equivalent for short-term investments and “A” or equivalent for medium-term corporate notes by a nationally recognized rating agency, with the exception of NCEA. NCEA limits investments to those rated at least at the credit rating of the commodity supplier, or, if the commodity supplier is not rated, the guarantor of the commodity supplier which is currently Goldman Sachs rated as “BBB+”. Custodial Credit Risk. This is the risk that, in the event of the failure of a depository financial institution or counterparty to a transaction, SMUD’s deposits and investments may not be returned or SMUD will not be able to recover the value of its deposits, investments or collateral securities that are in the possession of another party. SMUD does not have a deposit policy for custodial credit risk. As of December 31, 2018 and 2017, $15.3 million and $18.3 million in deposits were uninsured, respectively. The bank balance is also, per a depository pledge agreement between SMUD and SMUD’s bank, collateralized at 135 percent and 134 percent of the collective funds on deposit (increased by the amount of accrued but uncredited interest, reduced by deposits covered by Federal Deposit Insurance Corporation) at December 31, 2018 and 2017, respectively. SMUD had money market funds of $92.3 million and $117.7 million which were uninsured at December 31, 2018 and 2017, respectively. SMUD’s investments and money market funds are held in SMUD’s name. Concentration of Credit Risk. This is the risk of loss attributed to the magnitude of an entity’s investment in a single issuer. SMUD places no limit on the amounts invested in any one issuer for repurchase agreements and federal agency securities. The following are the concentrations of risk greater than five percent in either year: December 31, 2018 2017 Investment Type: Federal Home Loan Banks 15% 20% Freddie Mac 7% 13% Federal Farm Credit Bank 13% 13% Corporate Note – Berkshire Hathaway 5% 5% Corporate Note – Wells Fargo Bank 4% 5% Interest Rate Risk. This is the risk of loss due to the fair value of an investment declining due to interest rates rising. Though SMUD has restrictions as to the maturities of some of the investments, it does not have a formal policy that limits investment maturities as a means of managing its exposure to fair value losses arising from increasing interest rates. SMUD is exposed to interest rate risk on its interest rate swaps (see Note 9).
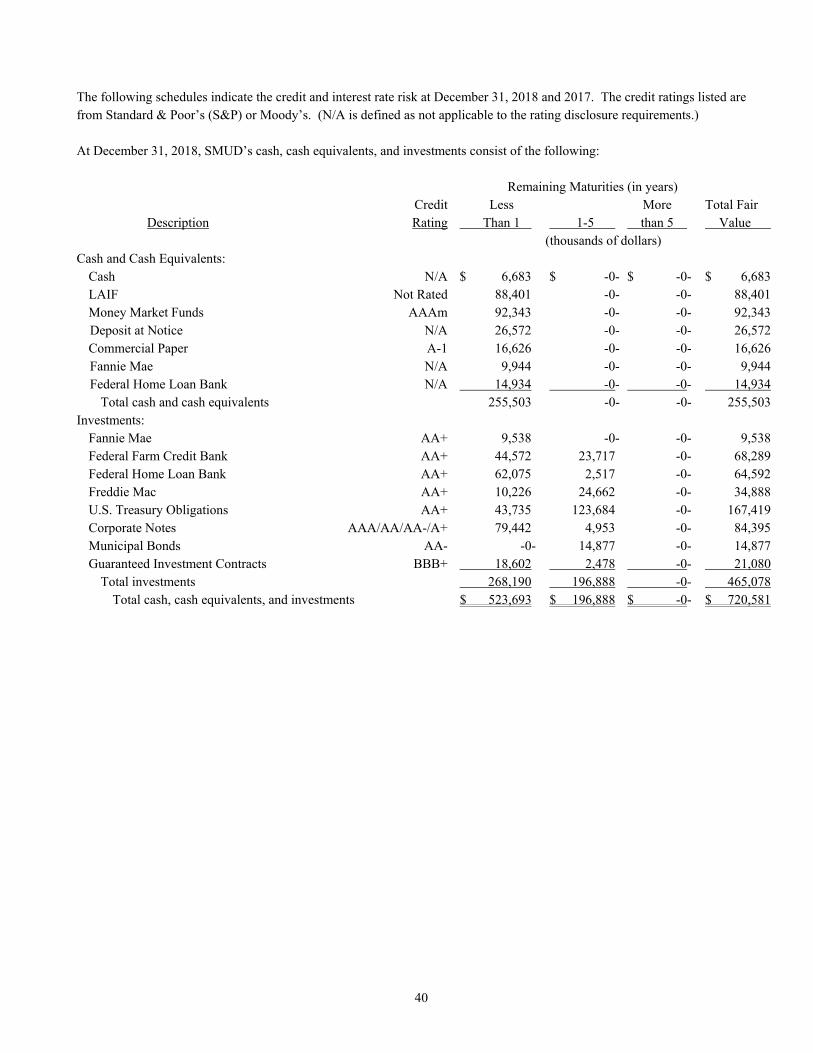
40
The following schedules indicate the credit and interest rate risk at December 31, 2018 and 2017. The credit ratings listed are from Standard & Poor’s (S&P) or Moody’s. (N/A is defined as not applicable to the rating disclosure requirements.) At December 31, 2018, SMUD’s cash, cash equivalents, and investments consist of the following: Remaining Maturities (in years) Credit Less More Total Fair Description Rating Than 1 1-5 than 5 Value (thousands of dollars) Cash and Cash Equivalents: Cash N/A $ 6,683 $ -0- $ -0- $ 6,683 LAIF Not Rated 88,401 -0- -0- 88,401 Money Market Funds AAAm 92,343 -0- -0- 92,343 Deposit at Notice N/A 26,572 -0- -0- 26,572 Commercial Paper A-1 16,626 -0- -0- 16,626 Fannie Mae N/A 9,944 -0- -0- 9,944 Federal Home Loan Bank N/A 14,934 -0- -0- 14,934 Total cash and cash equivalents 255,503 -0- -0- 255,503 Investments: Fannie Mae AA+ 9,538 -0- -0- 9,538 Federal Farm Credit Bank AA+ 44,572 23,717 -0- 68,289 Federal Home Loan Bank AA+ 62,075 2,517 -0- 64,592 Freddie Mac AA+ 10,226 24,662 -0- 34,888 U.S. Treasury Obligations AA+ 43,735 123,684 -0- 167,419 Corporate Notes AAA/AA/AA-/A+ 79,442 4,953 -0- 84,395 Municipal Bonds AA- -0- 14,877 -0- 14,877 Guaranteed Investment Contracts BBB+ 18,602 2,478 -0- 21,080 Total investments 268,190 196,888 -0- 465,078 Total cash, cash equivalents, and investments $ 523,693 $ 196,888 $ -0- $ 720,581
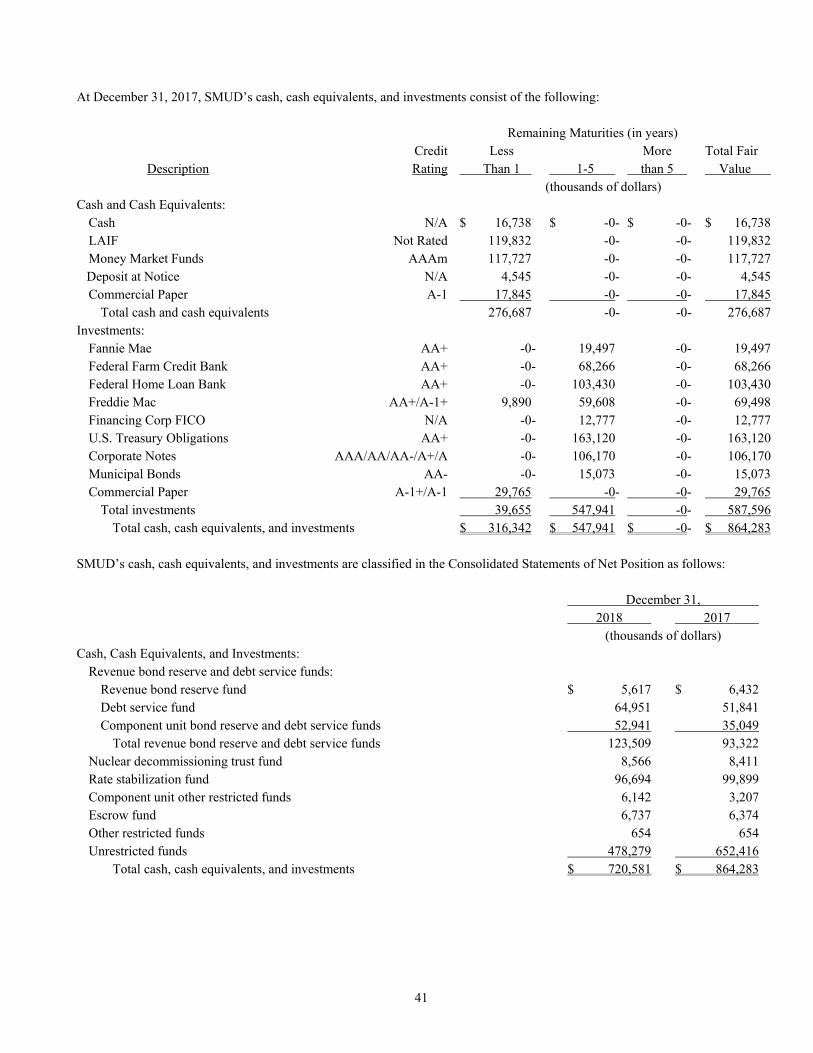
41
At December 31, 2017, SMUD’s cash, cash equivalents, and investments consist of the following: Remaining Maturities (in years) Credit Less More Total Fair Description Rating Than 1 1-5 than 5 Value (thousands of dollars) Cash and Cash Equivalents: Cash N/A $ 16,738 $ -0- $ -0- $ 16,738 LAIF Not Rated 119,832 -0- -0- 119,832 Money Market Funds AAAm 117,727 -0- -0- 117,727 Deposit at Notice N/A 4,545 -0- -0- 4,545 Commercial Paper A-1 17,845 -0- -0- 17,845 Total cash and cash equivalents 276,687 -0- -0- 276,687 Investments: Fannie Mae AA+ -0- 19,497 -0- 19,497 Federal Farm Credit Bank AA+ -0- 68,266 -0- 68,266 Federal Home Loan Bank AA+ -0- 103,430 -0- 103,430 Freddie Mac AA+/A-1+ 9,890 59,608 -0- 69,498 Financing Corp FICO N/A -0- 12,777 -0- 12,777 U.S. Treasury Obligations AA+ -0- 163,120 -0- 163,120 Corporate Notes AAA/AA/AA-/A+/A -0- 106,170 -0- 106,170 Municipal Bonds AA- -0- 15,073 -0- 15,073 Commercial Paper A-1+/A-1 29,765 -0- -0- 29,765 Total investments 39,655 547,941 -0- 587,596 Total cash, cash equivalents, and investments $ 316,342 $ 547,941 $ -0- $ 864,283 SMUD’s cash, cash equivalents, and investments are classified in the Consolidated Statements of Net Position as follows: December 31, 2018 2017 (thousands of dollars) Cash, Cash Equivalents, and Investments: Revenue bond reserve and debt service funds: Revenue bond reserve fund $ 5,617 $ 6,432 Debt service fund 64,951 51,841 Component unit bond reserve and debt service funds 52,941 35,049 Total revenue bond reserve and debt service funds 123,509 93,322 Nuclear decommissioning trust fund 8,566 8,411 Rate stabilization fund 96,694 99,899 Component unit other restricted funds 6,142 3,207 Escrow fund 6,737 6,374 Other restricted funds 654 654 Unrestricted funds 478,279 652,416 Total cash, cash equivalents, and investments $ 720,581 $ 864,283
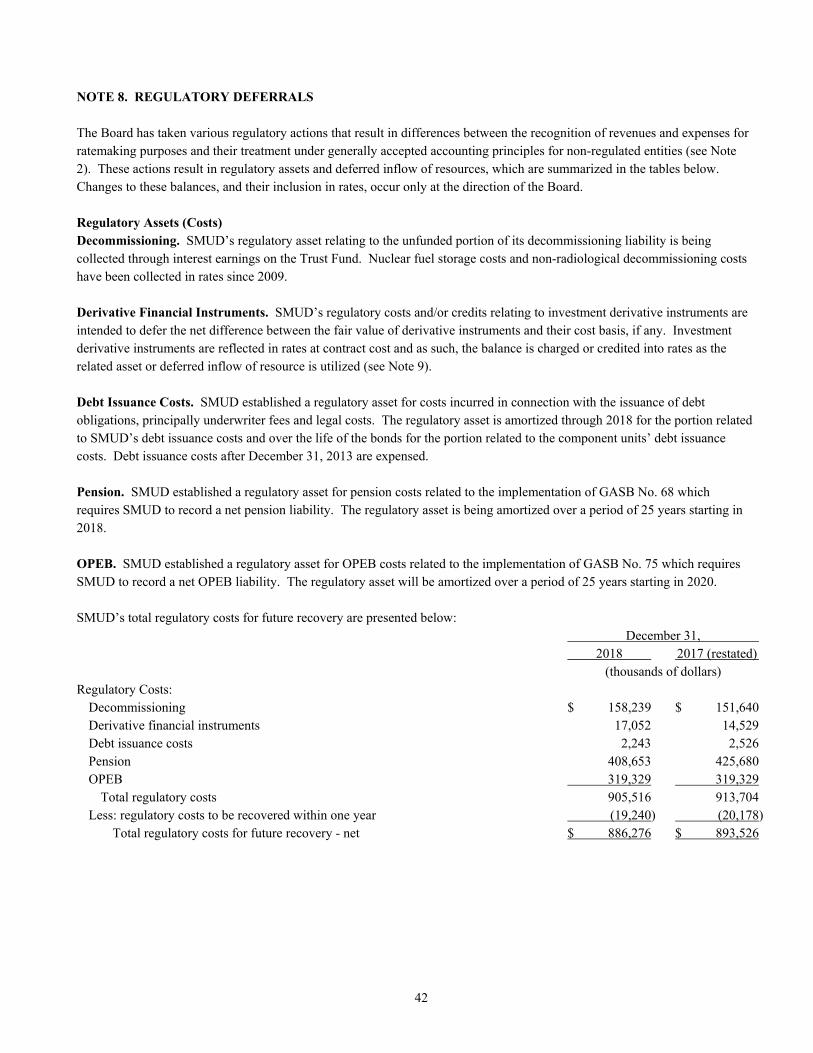
42
NOTE 8. REGULATORY DEFERRALS The Board has taken various regulatory actions that result in differences between the recognition of revenues and expenses for ratemaking purposes and their treatment under generally accepted accounting principles for non-regulated entities (see Note 2). These actions result in regulatory assets and deferred inflow of resources, which are summarized in the tables below. Changes to these balances, and their inclusion in rates, occur only at the direction of the Board. Regulatory Assets (Costs) Decommissioning. SMUD’s regulatory asset relating to the unfunded portion of its decommissioning liability is being collected through interest earnings on the Trust Fund. Nuclear fuel storage costs and non-radiological decommissioning costs have been collected in rates since 2009. Derivative Financial Instruments. SMUD’s regulatory costs and/or credits relating to investment derivative instruments are intended to defer the net difference between the fair value of derivative instruments and their cost basis, if any. Investment derivative instruments are reflected in rates at contract cost and as such, the balance is charged or credited into rates as the related asset or deferred inflow of resource is utilized (see Note 9). Debt Issuance Costs. SMUD established a regulatory asset for costs incurred in connection with the issuance of debt obligations, principally underwriter fees and legal costs. The regulatory asset is amortized through 2018 for the portion related to SMUD’s debt issuance costs and over the life of the bonds for the portion related to the component units’ debt issuance costs. Debt issuance costs after December 31, 2013 are expensed. Pension. SMUD established a regulatory asset for pension costs related to the implementation of GASB No. 68 which requires SMUD to record a net pension liability. The regulatory asset is being amortized over a period of 25 years starting in 2018. OPEB. SMUD established a regulatory asset for OPEB costs related to the implementation of GASB No. 75 which requires SMUD to record a net OPEB liability. The regulatory asset will be amortized over a period of 25 years starting in 2020. SMUD’s total regulatory costs for future recovery are presented below: December 31, 2018 2017 (restated) (thousands of dollars) Regulatory Costs: Decommissioning $ 158,239 $ 151,640 Derivative financial instruments 17,052 14,529 Debt issuance costs 2,243 2,526 Pension 408,653 425,680 OPEB 319,329 319,329 Total regulatory costs 905,516 913,704 Less: regulatory costs to be recovered within one year (19,240) (20,178) Total regulatory costs for future recovery - net $ 886,276 $ 893,526
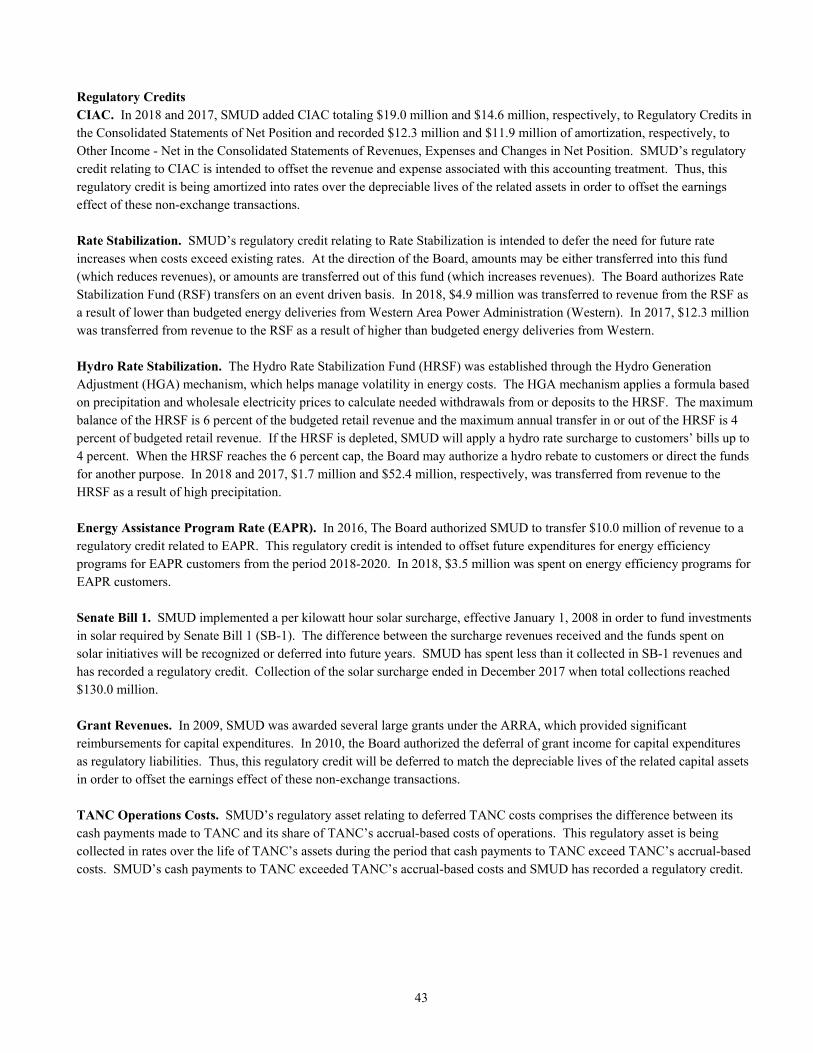
43
Regulatory Credits CIAC. In 2018 and 2017, SMUD added CIAC totaling $19.0 million and $14.6 million, respectively, to Regulatory Credits in the Consolidated Statements of Net Position and recorded $12.3 million and $11.9 million of amortization, respectively, to Other Income - Net in the Consolidated Statements of Revenues, Expenses and Changes in Net Position. SMUD’s regulatory credit relating to CIAC is intended to offset the revenue and expense associated with this accounting treatment. Thus, this regulatory credit is being amortized into rates over the depreciable lives of the related assets in order to offset the earnings effect of these non-exchange transactions. Rate Stabilization. SMUD’s regulatory credit relating to Rate Stabilization is intended to defer the need for future rate increases when costs exceed existing rates. At the direction of the Board, amounts may be either transferred into this fund (which reduces revenues), or amounts are transferred out of this fund (which increases revenues). The Board authorizes Rate Stabilization Fund (RSF) transfers on an event driven basis. In 2018, $4.9 million was transferred to revenue from the RSF as a result of lower than budgeted energy deliveries from Western Area Power Administration (Western). In 2017, $12.3 million was transferred from revenue to the RSF as a result of higher than budgeted energy deliveries from Western. Hydro Rate Stabilization. The Hydro Rate Stabilization Fund (HRSF) was established through the Hydro Generation Adjustment (HGA) mechanism, which helps manage volatility in energy costs. The HGA mechanism applies a formula based on precipitation and wholesale electricity prices to calculate needed withdrawals from or deposits to the HRSF. The maximum balance of the HRSF is 6 percent of the budgeted retail revenue and the maximum annual transfer in or out of the HRSF is 4 percent of budgeted retail revenue. If the HRSF is depleted, SMUD will apply a hydro rate surcharge to customers’ bills up to 4 percent. When the HRSF reaches the 6 percent cap, the Board may authorize a hydro rebate to customers or direct the funds for another purpose. In 2018 and 2017, $1.7 million and $52.4 million, respectively, was transferred from revenue to the HRSF as a result of high precipitation. Energy Assistance Program Rate (EAPR). In 2016, The Board authorized SMUD to transfer $10.0 million of revenue to a regulatory credit related to EAPR. This regulatory credit is intended to offset future expenditures for energy efficiency programs for EAPR customers from the period 2018-2020. In 2018, $3.5 million was spent on energy efficiency programs for EAPR customers. Senate Bill 1. SMUD implemented a per kilowatt hour solar surcharge, effective January 1, 2008 in order to fund investments in solar required by Senate Bill 1 (SB-1). The difference between the surcharge revenues received and the funds spent on solar initiatives will be recognized or deferred into future years. SMUD has spent less than it collected in SB-1 revenues and has recorded a regulatory credit. Collection of the solar surcharge ended in December 2017 when total collections reached $130.0 million. Grant Revenues. In 2009, SMUD was awarded several large grants under the ARRA, which provided significant reimbursements for capital expenditures. In 2010, the Board authorized the deferral of grant income for capital expenditures as regulatory liabilities. Thus, this regulatory credit will be deferred to match the depreciable lives of the related capital assets in order to offset the earnings effect of these non-exchange transactions. TANC Operations Costs. SMUD’s regulatory asset relating to deferred TANC costs comprises the difference between its cash payments made to TANC and its share of TANC’s accrual-based costs of operations. This regulatory asset is being collected in rates over the life of TANC’s assets during the period that cash payments to TANC exceed TANC’s accrual-based costs. SMUD’s cash payments to TANC exceeded TANC’s accrual-based costs and SMUD has recorded a regulatory credit.
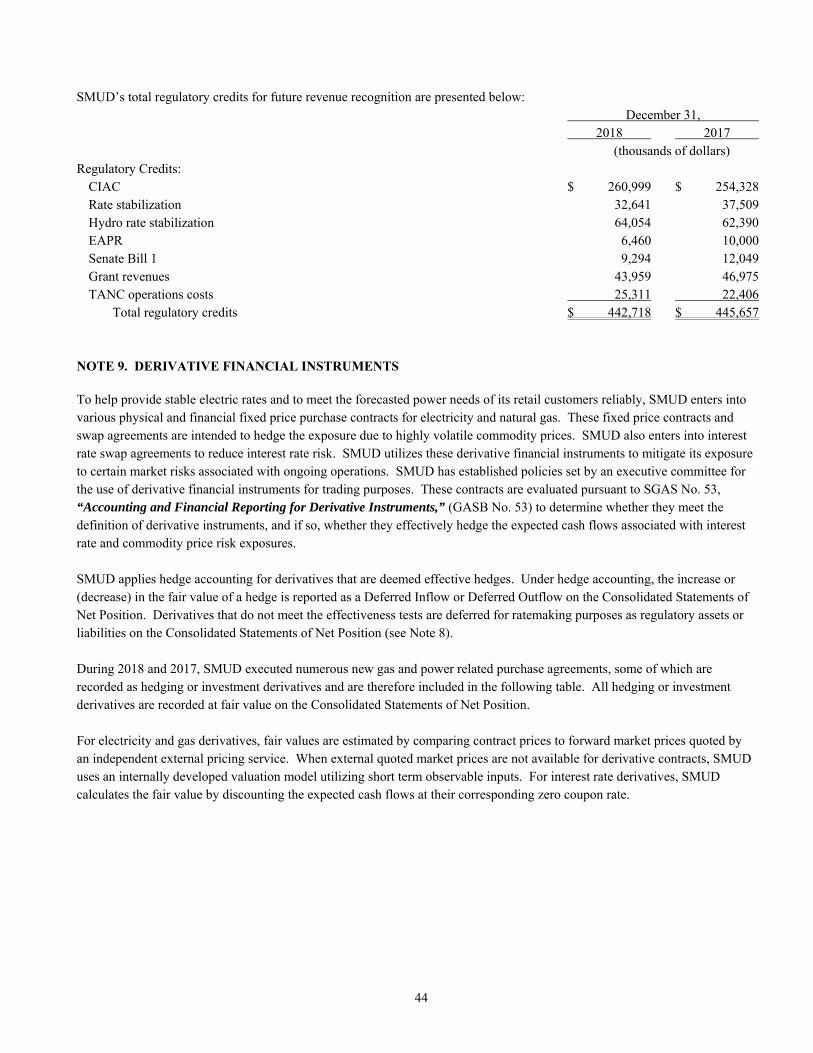
44
SMUD’s total regulatory credits for future revenue recognition are presented below: December 31, 2018 2017 (thousands of dollars) Regulatory Credits: CIAC $ 260,999 $ 254,328 Rate stabilization 32,641 37,509 Hydro rate stabilization 64,054 62,390 EAPR 6,460 10,000 Senate Bill 1 9,294 12,049 Grant revenues 43,959 46,975 TANC operations costs 25,311 22,406 Total regulatory credits $ 442,718 $ 445,657 NOTE 9. DERIVATIVE FINANCIAL INSTRUMENTS To help provide stable electric rates and to meet the forecasted power needs of its retail customers reliably, SMUD enters into various physical and financial fixed price purchase contracts for electricity and natural gas. These fixed price contracts and swap agreements are intended to hedge the exposure due to highly volatile commodity prices. SMUD also enters into interest rate swap agreements to reduce interest rate risk. SMUD utilizes these derivative financial instruments to mitigate its exposure to certain market risks associated with ongoing operations. SMUD has established policies set by an executive committee for the use of derivative financial instruments for trading purposes. These contracts are evaluated pursuant to SGAS No. 53, “Accounting and Financial Reporting for Derivative Instruments,” (GASB No. 53) to determine whether they meet the definition of derivative instruments, and if so, whether they effectively hedge the expected cash flows associated with interest rate and commodity price risk exposures. SMUD applies hedge accounting for derivatives that are deemed effective hedges. Under hedge accounting, the increase or (decrease) in the fair value of a hedge is reported as a Deferred Inflow or Deferred Outflow on the Consolidated Statements of Net Position. Derivatives that do not meet the effectiveness tests are deferred for ratemaking purposes as regulatory assets or liabilities on the Consolidated Statements of Net Position (see Note 8). During 2018 and 2017, SMUD executed numerous new gas and power related purchase agreements, some of which are recorded as hedging or investment derivatives and are therefore included in the following table. All hedging or investment derivatives are recorded at fair value on the Consolidated Statements of Net Position. For electricity and gas derivatives, fair values are estimated by comparing contract prices to forward market prices quoted by an independent external pricing service. When external quoted market prices are not available for derivative contracts, SMUD uses an internally developed valuation model utilizing short term observable inputs. For interest rate derivatives, SMUD calculates the fair value by discounting the expected cash flows at their corresponding zero coupon rate.
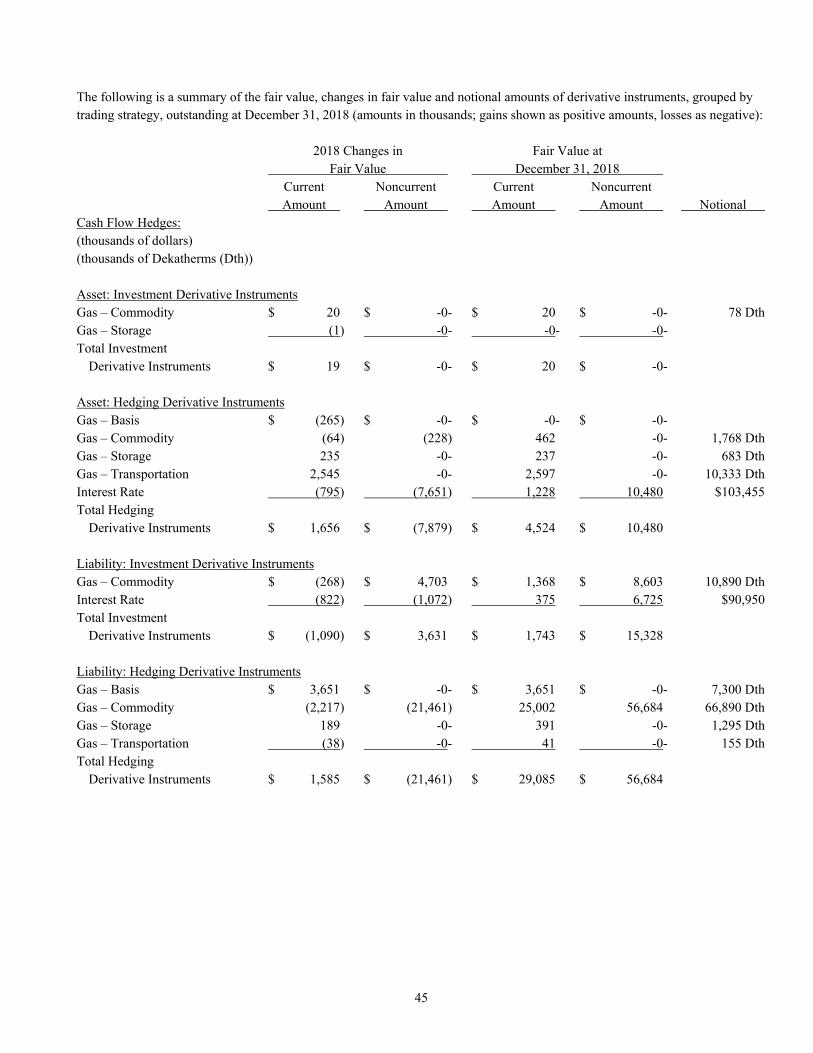
45
The following is a summary of the fair value, changes in fair value and notional amounts of derivative instruments, grouped by trading strategy, outstanding at December 31, 2018 (amounts in thousands; gains shown as positive amounts, losses as negative): 2018 Changes in Fair Value at Fair Value December 31, 2018 Current Noncurrent Current Noncurrent Amount Amount Amount Amount Notional Cash Flow Hedges: (thousands of dollars) (thousands of Dekatherms (Dth)) Asset: Investment Derivative Instruments Gas – Commodity $ 20 $ -0- $ 20 $ -0- 78 Dth Gas – Storage (1) -0- -0- -0- Total Investment Derivative Instruments $ 19 $ -0- $ 20 $ -0- Asset: Hedging Derivative Instruments Gas – Basis $ (265) $ -0- $ -0- $ -0- Gas – Commodity (64) (228) 462 -0- 1,768 Dth Gas – Storage 235 -0- 237 -0- 683 Dth Gas – Transportation 2,545 -0- 2,597 -0- 10,333 Dth Interest Rate (795) (7,651) 1,228 10,480 $103,455 Total Hedging Derivative Instruments $ 1,656 $ (7,879) $ 4,524 $ 10,480 Liability: Investment Derivative Instruments Gas – Commodity $ (268) $ 4,703 $ 1,368 $ 8,603 10,890 Dth Interest Rate (822) (1,072) 375 6,725 $90,950 Total Investment Derivative Instruments $ (1,090) $ 3,631 $ 1,743 $ 15,328 Liability: Hedging Derivative Instruments Gas – Basis $ 3,651 $ -0- $ 3,651 $ -0- 7,300 Dth Gas – Commodity (2,217) (21,461) 25,002 56,684 66,890 Dth Gas – Storage 189 -0- 391 -0- 1,295 Dth Gas – Transportation (38) -0- 41 -0- 155 Dth Total Hedging Derivative Instruments $ 1,585 $ (21,461) $ 29,085 $ 56,684
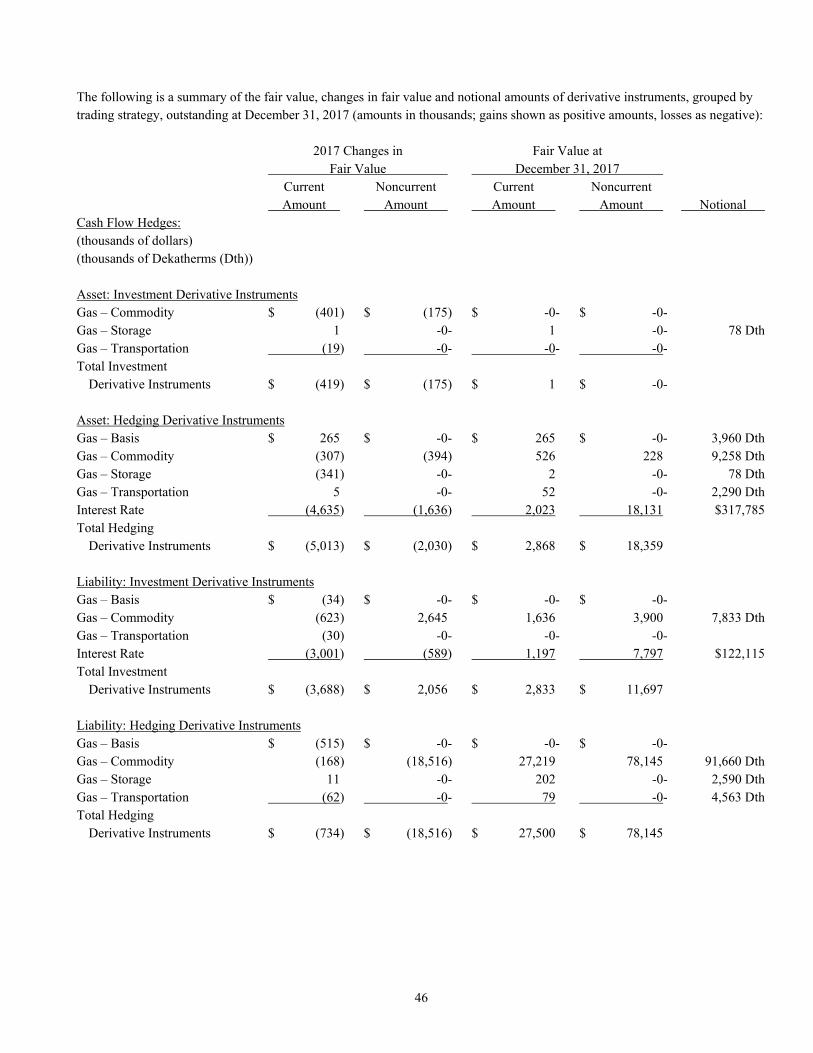
46
The following is a summary of the fair value, changes in fair value and notional amounts of derivative instruments, grouped by trading strategy, outstanding at December 31, 2017 (amounts in thousands; gains shown as positive amounts, losses as negative): 2017 Changes in Fair Value at Fair Value December 31, 2017 Current Noncurrent Current Noncurrent Amount Amount Amount Amount Notional Cash Flow Hedges: (thousands of dollars) (thousands of Dekatherms (Dth)) Asset: Investment Derivative Instruments Gas – Commodity $ (401) $ (175) $ -0- $ -0- Gas – Storage 1 -0- 1 -0- 78 Dth Gas – Transportation (19) -0- -0- -0- Total Investment Derivative Instruments $ (419) $ (175) $ 1 $ -0- Asset: Hedging Derivative Instruments Gas – Basis $ 265 $ -0- $ 265 $ -0- 3,960 Dth Gas – Commodity (307) (394) 526 228 9,258 Dth Gas – Storage (341) -0- 2 -0- 78 Dth Gas – Transportation 5 -0- 52 -0- 2,290 Dth Interest Rate (4,635) (1,636) 2,023 18,131 $317,785 Total Hedging Derivative Instruments $ (5,013) $ (2,030) $ 2,868 $ 18,359 Liability: Investment Derivative Instruments Gas – Basis $ (34) $ -0- $ -0- $ -0- Gas – Commodity (623) 2,645 1,636 3,900 7,833 Dth Gas – Transportation (30) -0- -0- -0- Interest Rate (3,001) (589) 1,197 7,797 $122,115 Total Investment Derivative Instruments $ (3,688) $ 2,056 $ 2,833 $ 11,697 Liability: Hedging Derivative Instruments Gas – Basis $ (515) $ -0- $ -0- $ -0- Gas – Commodity (168) (18,516) 27,219 78,145 91,660 Dth Gas – Storage 11 -0- 202 -0- 2,590 Dth Gas – Transportation (62) -0- 79 -0- 4,563 Dth Total Hedging Derivative Instruments $ (734) $ (18,516) $ 27,500 $ 78,145
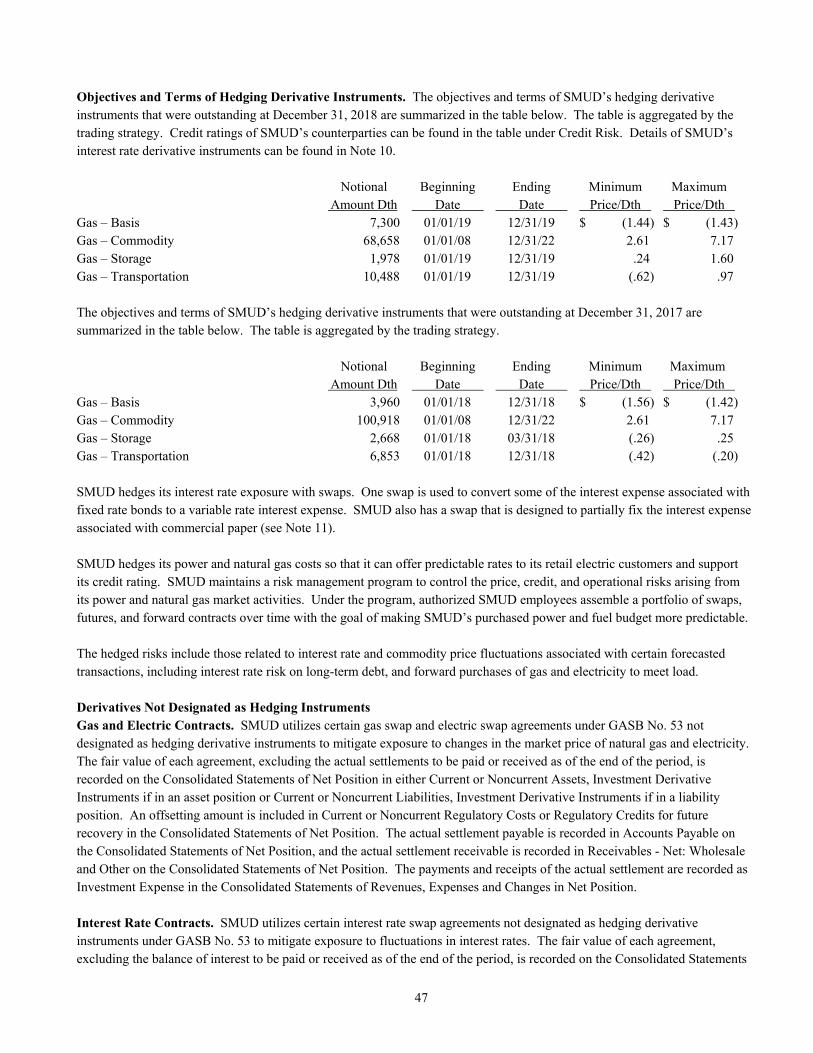
47
Objectives and Terms of Hedging Derivative Instruments. The objectives and terms of SMUD’s hedging derivative instruments that were outstanding at December 31, 2018 are summarized in the table below. The table is aggregated by the trading strategy. Credit ratings of SMUD’s counterparties can be found in the table under Credit Risk. Details of SMUD’s interest rate derivative instruments can be found in Note 10. Notional Beginning Ending Minimum Maximum Amount Dth Date Date Price/Dth Price/Dth Gas – Basis 7,300 01/01/19 12/31/19 $ (1.44) $ (1.43) Gas – Commodity 68,658 01/01/08 12/31/22 2.61 7.17 Gas – Storage 1,978 01/01/19 12/31/19 .24 1.60 Gas – Transportation 10,488 01/01/19 12/31/19 (.62) .97 The objectives and terms of SMUD’s hedging derivative instruments that were outstanding at December 31, 2017 are summarized in the table below. The table is aggregated by the trading strategy. Notional Beginning Ending Minimum Maximum Amount Dth Date Date Price/Dth Price/Dth Gas – Basis 3,960 01/01/18 12/31/18 $ (1.56) $ (1.42) Gas – Commodity 100,918 01/01/08 12/31/22 2.61 7.17 Gas – Storage 2,668 01/01/18 03/31/18 (.26) .25 Gas – Transportation 6,853 01/01/18 12/31/18 (.42) (.20) SMUD hedges its interest rate exposure with swaps. One swap is used to convert some of the interest expense associated with fixed rate bonds to a variable rate interest expense. SMUD also has a swap that is designed to partially fix the interest expense associated with commercial paper (see Note 11). SMUD hedges its power and natural gas costs so that it can offer predictable rates to its retail electric customers and support its credit rating. SMUD maintains a risk management program to control the price, credit, and operational risks arising from its power and natural gas market activities. Under the program, authorized SMUD employees assemble a portfolio of swaps, futures, and forward contracts over time with the goal of making SMUD’s purchased power and fuel budget more predictable. The hedged risks include those related to interest rate and commodity price fluctuations associated with certain forecasted transactions, including interest rate risk on long-term debt, and forward purchases of gas and electricity to meet load. Derivatives Not Designated as Hedging Instruments Gas and Electric Contracts. SMUD utilizes certain gas swap and electric swap agreements under GASB No. 53 not designated as hedging derivative instruments to mitigate exposure to changes in the market price of natural gas and electricity. The fair value of each agreement, excluding the actual settlements to be paid or received as of the end of the period, is recorded on the Consolidated Statements of Net Position in either Current or Noncurrent Assets, Investment Derivative Instruments if in an asset position or Current or Noncurrent Liabilities, Investment Derivative Instruments if in a liability position. An offsetting amount is included in Current or Noncurrent Regulatory Costs or Regulatory Credits for future recovery in the Consolidated Statements of Net Position. The actual settlement payable is recorded in Accounts Payable on the Consolidated Statements of Net Position, and the actual settlement receivable is recorded in Receivables - Net: Wholesale and Other on the Consolidated Statements of Net Position. The payments and receipts of the actual settlement are recorded as Investment Expense in the Consolidated Statements of Revenues, Expenses and Changes in Net Position. Interest Rate Contracts. SMUD utilizes certain interest rate swap agreements not designated as hedging derivative instruments under GASB No. 53 to mitigate exposure to fluctuations in interest rates. The fair value of each agreement, excluding the balance of interest to be paid or received as of the end of the period, is recorded on the Consolidated Statements
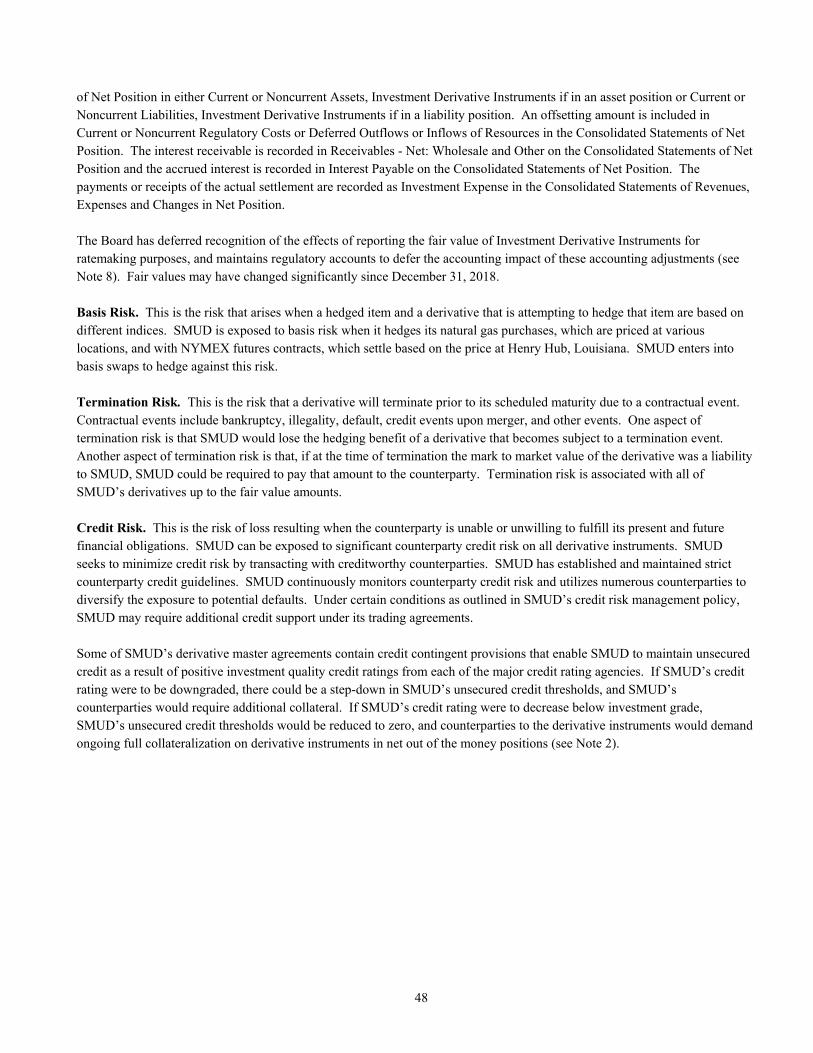
48
of Net Position in either Current or Noncurrent Assets, Investment Derivative Instruments if in an asset position or Current or Noncurrent Liabilities, Investment Derivative Instruments if in a liability position. An offsetting amount is included in Current or Noncurrent Regulatory Costs or Deferred Outflows or Inflows of Resources in the Consolidated Statements of Net Position. The interest receivable is recorded in Receivables - Net: Wholesale and Other on the Consolidated Statements of Net Position and the accrued interest is recorded in Interest Payable on the Consolidated Statements of Net Position. The payments or receipts of the actual settlement are recorded as Investment Expense in the Consolidated Statements of Revenues, Expenses and Changes in Net Position. The Board has deferred recognition of the effects of reporting the fair value of Investment Derivative Instruments for ratemaking purposes, and maintains regulatory accounts to defer the accounting impact of these accounting adjustments (see Note 8). Fair values may have changed significantly since December 31, 2018. Basis Risk. This is the risk that arises when a hedged item and a derivative that is attempting to hedge that item are based on different indices. SMUD is exposed to basis risk when it hedges its natural gas purchases, which are priced at various locations, and with NYMEX futures contracts, which settle based on the price at Henry Hub, Louisiana. SMUD enters into basis swaps to hedge against this risk. Termination Risk. This is the risk that a derivative will terminate prior to its scheduled maturity due to a contractual event. Contractual events include bankruptcy, illegality, default, credit events upon merger, and other events. One aspect of termination risk is that SMUD would lose the hedging benefit of a derivative that becomes subject to a termination event. Another aspect of termination risk is that, if at the time of termination the mark to market value of the derivative was a liability to SMUD, SMUD could be required to pay that amount to the counterparty. Termination risk is associated with all of SMUD’s derivatives up to the fair value amounts. Credit Risk. This is the risk of loss resulting when the counterparty is unable or unwilling to fulfill its present and future financial obligations. SMUD can be exposed to significant counterparty credit risk on all derivative instruments. SMUD seeks to minimize credit risk by transacting with creditworthy counterparties. SMUD has established and maintained strict counterparty credit guidelines. SMUD continuously monitors counterparty credit risk and utilizes numerous counterparties to diversify the exposure to potential defaults. Under certain conditions as outlined in SMUD’s credit risk management policy, SMUD may require additional credit support under its trading agreements. Some of SMUD’s derivative master agreements contain credit contingent provisions that enable SMUD to maintain unsecured credit as a result of positive investment quality credit ratings from each of the major credit rating agencies. If SMUD’s credit rating were to be downgraded, there could be a step-down in SMUD’s unsecured credit thresholds, and SMUD’s counterparties would require additional collateral. If SMUD’s credit rating were to decrease below investment grade, SMUD’s unsecured credit thresholds would be reduced to zero, and counterparties to the derivative instruments would demand ongoing full collateralization on derivative instruments in net out of the money positions (see Note 2).
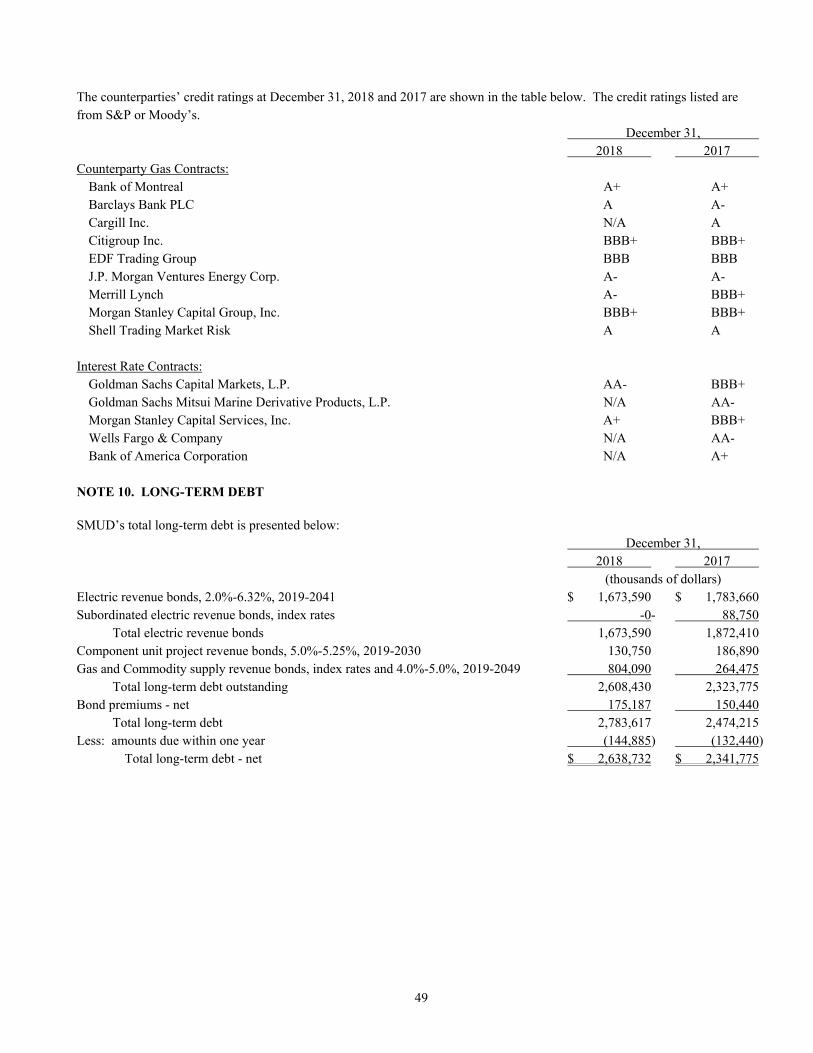
49
The counterparties’ credit ratings at December 31, 2018 and 2017 are shown in the table below. The credit ratings listed are from S&P or Moody’s. December 31, 2018 2017 Counterparty Gas Contracts: Bank of Montreal A+ A+ Barclays Bank PLC A A- Cargill Inc. N/A A Citigroup Inc. BBB+ BBB+ EDF Trading Group BBB BBB J.P. Morgan Ventures Energy Corp. A- A- Merrill Lynch A- BBB+ Morgan Stanley Capital Group, Inc. BBB+ BBB+ Shell Trading Market Risk A A Interest Rate Contracts: Goldman Sachs Capital Markets, L.P. AA- BBB+ Goldman Sachs Mitsui Marine Derivative Products, L.P. N/A AA- Morgan Stanley Capital Services, Inc. A+ BBB+ Wells Fargo & Company N/A AA- Bank of America Corporation N/A A+ NOTE 10. LONG-TERM DEBT SMUD’s total long-term debt is presented below: December 31, 2018 2017 (thousands of dollars) Electric revenue bonds, 2.0%-6.32%, 2019-2041 $ 1,673,590 $ 1,783,660 Subordinated electric revenue bonds, index rates -0- 88,750 Total electric revenue bonds 1,673,590 1,872,410 Component unit project revenue bonds, 5.0%-5.25%, 2019-2030 130,750 186,890 Gas and Commodity supply revenue bonds, index rates and 4.0%-5.0%, 2019-2049 804,090 264,475 Total long-term debt outstanding 2,608,430 2,323,775 Bond premiums - net 175,187 150,440 Total long-term debt 2,783,617 2,474,215 Less: amounts due within one year (144,885) (132,440) Total long-term debt - net $ 2,638,732 $ 2,341,775
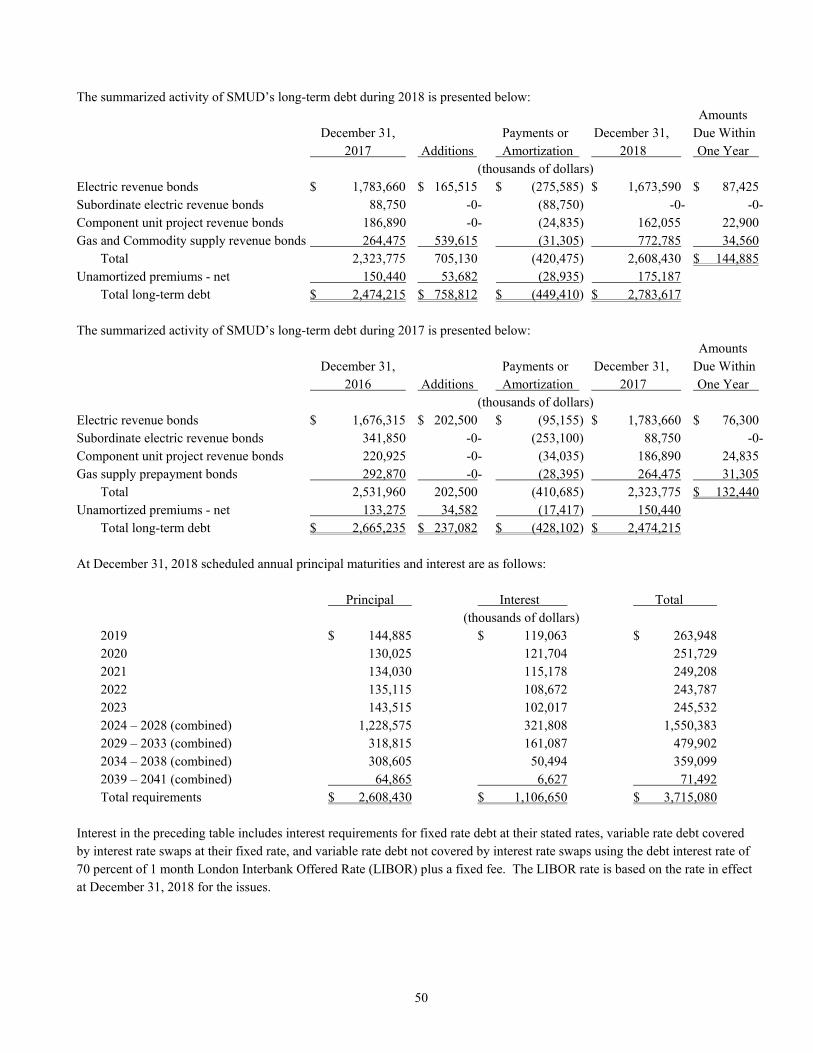
50
The summarized activity of SMUD’s long-term debt during 2018 is presented below: Amounts December 31, Payments or December 31, Due Within 2017 Additions Amortization 2018 One Year (thousands of dollars) Electric revenue bonds $ 1,783,660 $ 165,515 $ (275,585) $ 1,673,590 $ 87,425 Subordinate electric revenue bonds 88,750 -0- (88,750) -0- -0- Component unit project revenue bonds 186,890 -0- (24,835) 162,055 22,900 Gas and Commodity supply revenue bonds 264,475 539,615 (31,305) 772,785 34,560 Total 2,323,775 705,130 (420,475) 2,608,430 $ 144,885 Unamortized premiums - net 150,440 53,682 (28,935) 175,187 Total long-term debt $ 2,474,215 $ 758,812 $ (449,410) $ 2,783,617 The summarized activity of SMUD’s long-term debt during 2017 is presented below: Amounts December 31, Payments or December 31, Due Within 2016 Additions Amortization 2017 One Year (thousands of dollars) Electric revenue bonds $ 1,676,315 $ 202,500 $ (95,155) $ 1,783,660 $ 76,300 Subordinate electric revenue bonds 341,850 -0- (253,100) 88,750 -0- Component unit project revenue bonds 220,925 -0- (34,035) 186,890 24,835 Gas supply prepayment bonds 292,870 -0- (28,395) 264,475 31,305 Total 2,531,960 202,500 (410,685) 2,323,775 $ 132,440 Unamortized premiums - net 133,275 34,582 (17,417) 150,440 Total long-term debt $ 2,665,235 $ 237,082 $ (428,102) $ 2,474,215 At December 31, 2018 scheduled annual principal maturities and interest are as follows: Principal Interest Total (thousands of dollars) 2019 $ 144,885 $ 119,063 $ 263,948 2020 130,025 121,704 251,729 2021 134,030 115,178 249,208 2022 135,115 108,672 243,787 2023 143,515 102,017 245,532 2024 – 2028 (combined) 1,228,575 321,808 1,550,383 2029 – 2033 (combined) 318,815 161,087 479,902 2034 – 2038 (combined) 308,605 50,494 359,099 2039 – 2041 (combined) 64,865 6,627 71,492 Total requirements $ 2,608,430 $ 1,106,650 $ 3,715,080 Interest in the preceding table includes interest requirements for fixed rate debt at their stated rates, variable rate debt covered by interest rate swaps at their fixed rate, and variable rate debt not covered by interest rate swaps using the debt interest rate of 70 percent of 1 month London Interbank Offered Rate (LIBOR) plus a fixed fee. The LIBOR rate is based on the rate in effect at December 31, 2018 for the issues.
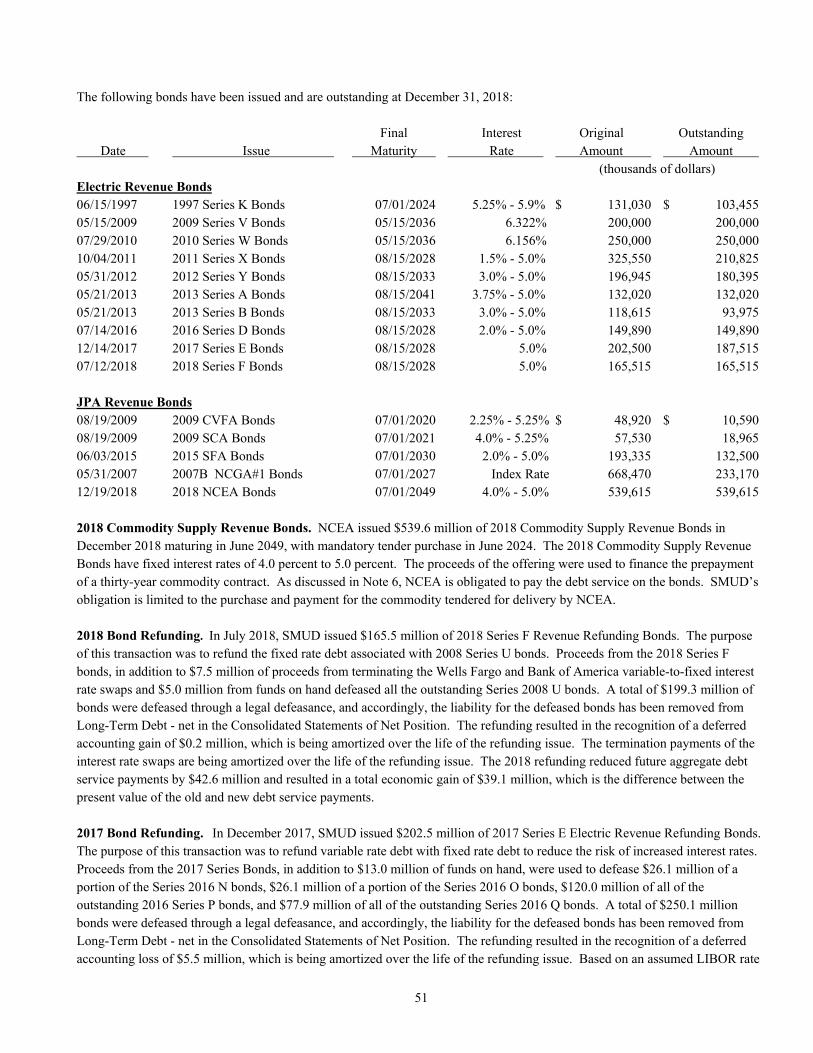
51
The following bonds have been issued and are outstanding at December 31, 2018: Final Interest Original Outstanding Date Issue Maturity Rate Amount Amount (thousands of dollars) Electric Revenue Bonds 06/15/1997 1997 Series K Bonds 07/01/2024 5.25% - 5.9% $ 131,030 $ 103,455 05/15/2009 2009 Series V Bonds 05/15/2036 6.322% 200,000 200,000 07/29/2010 2010 Series W Bonds 05/15/2036 6.156% 250,000 250,000 10/04/2011 2011 Series X Bonds 08/15/2028 1.5% - 5.0% 325,550 210,825 05/31/2012 2012 Series Y Bonds 08/15/2033 3.0% - 5.0% 196,945 180,395 05/21/2013 2013 Series A Bonds 08/15/2041 3.75% - 5.0% 132,020 132,020 05/21/2013 2013 Series B Bonds 08/15/2033 3.0% - 5.0% 118,615 93,975 07/14/2016 2016 Series D Bonds 08/15/2028 2.0% - 5.0% 149,890 149,890 12/14/2017 2017 Series E Bonds 08/15/2028 5.0% 202,500 187,515 07/12/2018 2018 Series F Bonds 08/15/2028 5.0% 165,515 165,515 JPA Revenue Bonds 08/19/2009 2009 CVFA Bonds 07/01/2020 2.25% - 5.25% $ 48,920 $ 10,590 08/19/2009 2009 SCA Bonds 07/01/2021 4.0% - 5.25% 57,530 18,965 06/03/2015 2015 SFA Bonds 07/01/2030 2.0% - 5.0% 193,335 132,500 05/31/2007 2007B NCGA#1 Bonds 07/01/2027 Index Rate 668,470 233,170 12/19/2018 2018 NCEA Bonds 07/01/2049 4.0% - 5.0% 539,615 539,615 2018 Commodity Supply Revenue Bonds. NCEA issued $539.6 million of 2018 Commodity Supply Revenue Bonds in December 2018 maturing in June 2049, with mandatory tender purchase in June 2024. The 2018 Commodity Supply Revenue Bonds have fixed interest rates of 4.0 percent to 5.0 percent. The proceeds of the offering were used to finance the prepayment of a thirty-year commodity contract. As discussed in Note 6, NCEA is obligated to pay the debt service on the bonds. SMUD’s obligation is limited to the purchase and payment for the commodity tendered for delivery by NCEA. 2018 Bond Refunding. In July 2018, SMUD issued $165.5 million of 2018 Series F Revenue Refunding Bonds. The purpose of this transaction was to refund the fixed rate debt associated with 2008 Series U bonds. Proceeds from the 2018 Series F bonds, in addition to $7.5 million of proceeds from terminating the Wells Fargo and Bank of America variable-to-fixed interest rate swaps and $5.0 million from funds on hand defeased all the outstanding Series 2008 U bonds. A total of $199.3 million of bonds were defeased through a legal defeasance, and accordingly, the liability for the defeased bonds has been removed from Long-Term Debt - net in the Consolidated Statements of Net Position. The refunding resulted in the recognition of a deferred accounting gain of $0.2 million, which is being amortized over the life of the refunding issue. The termination payments of the interest rate swaps are being amortized over the life of the refunding issue. The 2018 refunding reduced future aggregate debt service payments by $42.6 million and resulted in a total economic gain of $39.1 million, which is the difference between the present value of the old and new debt service payments. 2017 Bond Refunding. In December 2017, SMUD issued $202.5 million of 2017 Series E Electric Revenue Refunding Bonds. The purpose of this transaction was to refund variable rate debt with fixed rate debt to reduce the risk of increased interest rates. Proceeds from the 2017 Series Bonds, in addition to $13.0 million of funds on hand, were used to defease $26.1 million of a portion of the Series 2016 N bonds, $26.1 million of a portion of the Series 2016 O bonds, $120.0 million of all of the outstanding 2016 Series P bonds, and $77.9 million of all of the outstanding Series 2016 Q bonds. A total of $250.1 million bonds were defeased through a legal defeasance, and accordingly, the liability for the defeased bonds has been removed from Long-Term Debt - net in the Consolidated Statements of Net Position. The refunding resulted in the recognition of a deferred accounting loss of $5.5 million, which is being amortized over the life of the refunding issue. Based on an assumed LIBOR rate
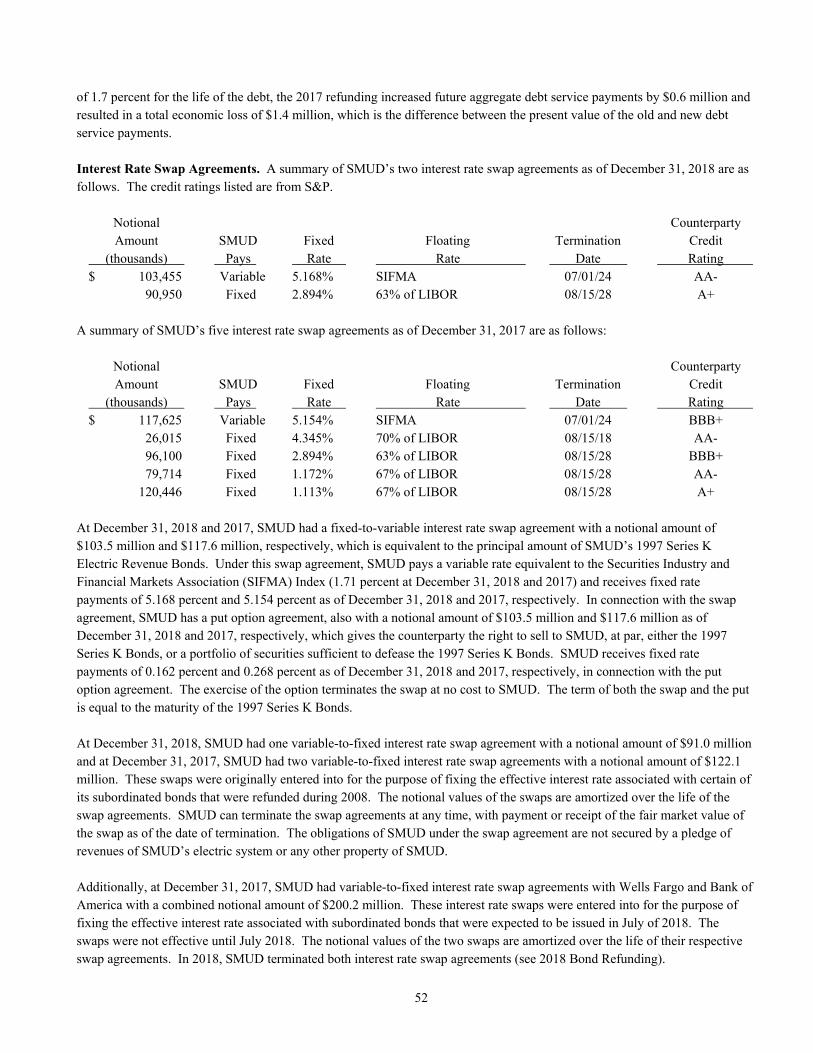
52
of 1.7 percent for the life of the debt, the 2017 refunding increased future aggregate debt service payments by $0.6 million and resulted in a total economic loss of $1.4 million, which is the difference between the present value of the old and new debt service payments. Interest Rate Swap Agreements. A summary of SMUD’s two interest rate swap agreements as of December 31, 2018 are as follows. The credit ratings listed are from S&P. Notional Counterparty Amount SMUD Fixed Floating Termination Credit (thousands) Pays Rate Rate Date Rating $ 103,455 Variable 5.168% SIFMA 07/01/24 AA- 90,950 Fixed 2.894% 63% of LIBOR 08/15/28 A+ A summary of SMUD’s five interest rate swap agreements as of December 31, 2017 are as follows: Notional Counterparty Amount SMUD Fixed Floating Termination Credit (thousands) Pays Rate Rate Date Rating $ 117,625 Variable 5.154% SIFMA 07/01/24 BBB+ 26,015 Fixed 4.345% 70% of LIBOR 08/15/18 AA- 96,100 Fixed 2.894% 63% of LIBOR 08/15/28 BBB+ 79,714 Fixed 1.172% 67% of LIBOR 08/15/28 AA- 120,446 Fixed 1.113% 67% of LIBOR 08/15/28 A+ At December 31, 2018 and 2017, SMUD had a fixed-to-variable interest rate swap agreement with a notional amount of $103.5 million and $117.6 million, respectively, which is equivalent to the principal amount of SMUD’s 1997 Series K Electric Revenue Bonds. Under this swap agreement, SMUD pays a variable rate equivalent to the Securities Industry and Financial Markets Association (SIFMA) Index (1.71 percent at December 31, 2018 and 2017) and receives fixed rate payments of 5.168 percent and 5.154 percent as of December 31, 2018 and 2017, respectively. In connection with the swap agreement, SMUD has a put option agreement, also with a notional amount of $103.5 million and $117.6 million as of December 31, 2018 and 2017, respectively, which gives the counterparty the right to sell to SMUD, at par, either the 1997 Series K Bonds, or a portfolio of securities sufficient to defease the 1997 Series K Bonds. SMUD receives fixed rate payments of 0.162 percent and 0.268 percent as of December 31, 2018 and 2017, respectively, in connection with the put option agreement. The exercise of the option terminates the swap at no cost to SMUD. The term of both the swap and the put is equal to the maturity of the 1997 Series K Bonds. At December 31, 2018, SMUD had one variable-to-fixed interest rate swap agreement with a notional amount of $91.0 million and at December 31, 2017, SMUD had two variable-to-fixed interest rate swap agreements with a notional amount of $122.1 million. These swaps were originally entered into for the purpose of fixing the effective interest rate associated with certain of its subordinated bonds that were refunded during 2008. The notional values of the swaps are amortized over the life of the swap agreements. SMUD can terminate the swap agreements at any time, with payment or receipt of the fair market value of the swap as of the date of termination. The obligations of SMUD under the swap agreement are not secured by a pledge of revenues of SMUD’s electric system or any other property of SMUD. Additionally, at December 31, 2017, SMUD had variable-to-fixed interest rate swap agreements with Wells Fargo and Bank of America with a combined notional amount of $200.2 million. These interest rate swaps were entered into for the purpose of fixing the effective interest rate associated with subordinated bonds that were expected to be issued in July of 2018. The swaps were not effective until July 2018. The notional values of the two swaps are amortized over the life of their respective swap agreements. In 2018, SMUD terminated both interest rate swap agreements (see 2018 Bond Refunding).
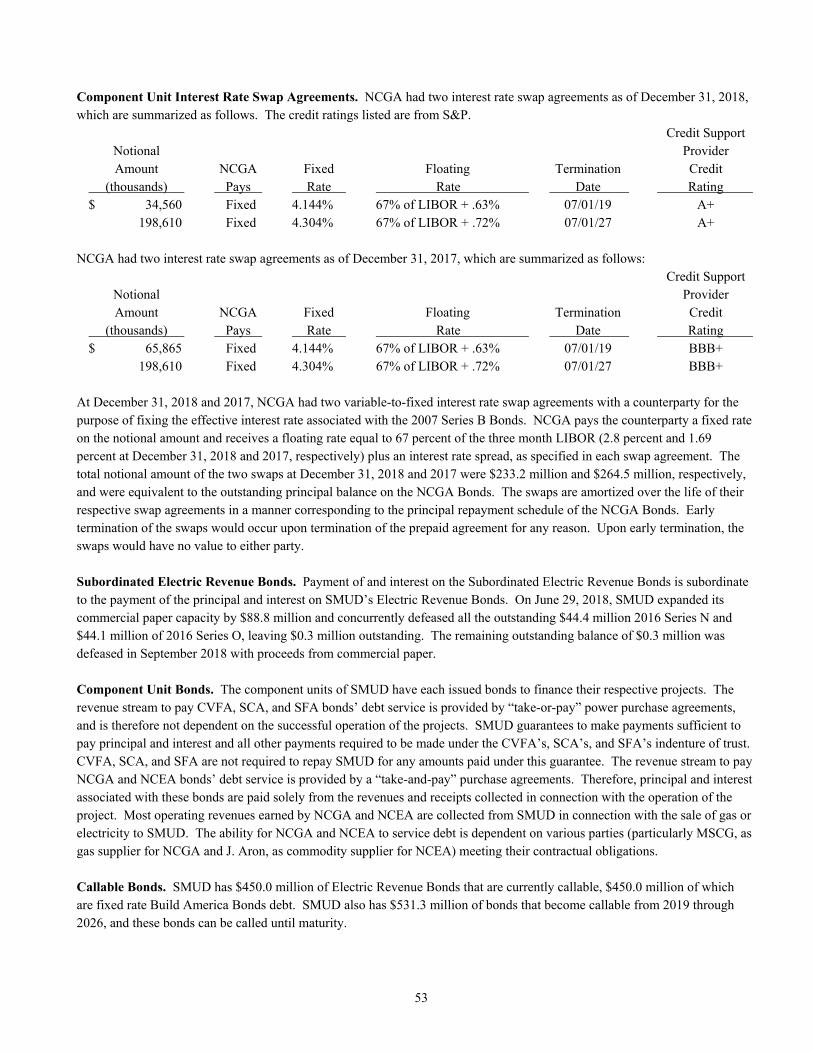
53
Component Unit Interest Rate Swap Agreements. NCGA had two interest rate swap agreements as of December 31, 2018, which are summarized as follows. The credit ratings listed are from S&P. Credit Support Notional Provider Amount NCGA Fixed Floating Termination Credit (thousands) Pays Rate Rate Date Rating $ 34,560 Fixed 4.144% 67% of LIBOR + .63% 07/01/19 A+ 198,610 Fixed 4.304% 67% of LIBOR + .72% 07/01/27 A+ NCGA had two interest rate swap agreements as of December 31, 2017, which are summarized as follows: Credit Support Notional Provider Amount NCGA Fixed Floating Termination Credit (thousands) Pays Rate Rate Date Rating $ 65,865 Fixed 4.144% 67% of LIBOR + .63% 07/01/19 BBB+ 198,610 Fixed 4.304% 67% of LIBOR + .72% 07/01/27 BBB+ At December 31, 2018 and 2017, NCGA had two variable-to-fixed interest rate swap agreements with a counterparty for the purpose of fixing the effective interest rate associated with the 2007 Series B Bonds. NCGA pays the counterparty a fixed rate on the notional amount and receives a floating rate equal to 67 percent of the three month LIBOR (2.8 percent and 1.69 percent at December 31, 2018 and 2017, respectively) plus an interest rate spread, as specified in each swap agreement. The total notional amount of the two swaps at December 31, 2018 and 2017 were $233.2 million and $264.5 million, respectively, and were equivalent to the outstanding principal balance on the NCGA Bonds. The swaps are amortized over the life of their respective swap agreements in a manner corresponding to the principal repayment schedule of the NCGA Bonds. Early termination of the swaps would occur upon termination of the prepaid agreement for any reason. Upon early termination, the swaps would have no value to either party. Subordinated Electric Revenue Bonds. Payment of and interest on the Subordinated Electric Revenue Bonds is subordinate to the payment of the principal and interest on SMUD’s Electric Revenue Bonds. On June 29, 2018, SMUD expanded its commercial paper capacity by $88.8 million and concurrently defeased all the outstanding $44.4 million 2016 Series N and $44.1 million of 2016 Series O, leaving $0.3 million outstanding. The remaining outstanding balance of $0.3 million was defeased in September 2018 with proceeds from commercial paper. Component Unit Bonds. The component units of SMUD have each issued bonds to finance their respective projects. The revenue stream to pay CVFA, SCA, and SFA bonds’ debt service is provided by “take-or-pay” power purchase agreements, and is therefore not dependent on the successful operation of the projects. SMUD guarantees to make payments sufficient to pay principal and interest and all other payments required to be made under the CVFA’s, SCA’s, and SFA’s indenture of trust. CVFA, SCA, and SFA are not required to repay SMUD for any amounts paid under this guarantee. The revenue stream to pay NCGA and NCEA bonds’ debt service is provided by a “take-and-pay” purchase agreements. Therefore, principal and interest associated with these bonds are paid solely from the revenues and receipts collected in connection with the operation of the project. Most operating revenues earned by NCGA and NCEA are collected from SMUD in connection with the sale of gas or electricity to SMUD. The ability for NCGA and NCEA to service debt is dependent on various parties (particularly MSCG, as gas supplier for NCGA and J. Aron, as commodity supplier for NCEA) meeting their contractual obligations. Callable Bonds. SMUD has $450.0 million of Electric Revenue Bonds that are currently callable, $450.0 million of which are fixed rate Build America Bonds debt. SMUD also has $531.3 million of bonds that become callable from 2019 through 2026, and these bonds can be called until maturity.
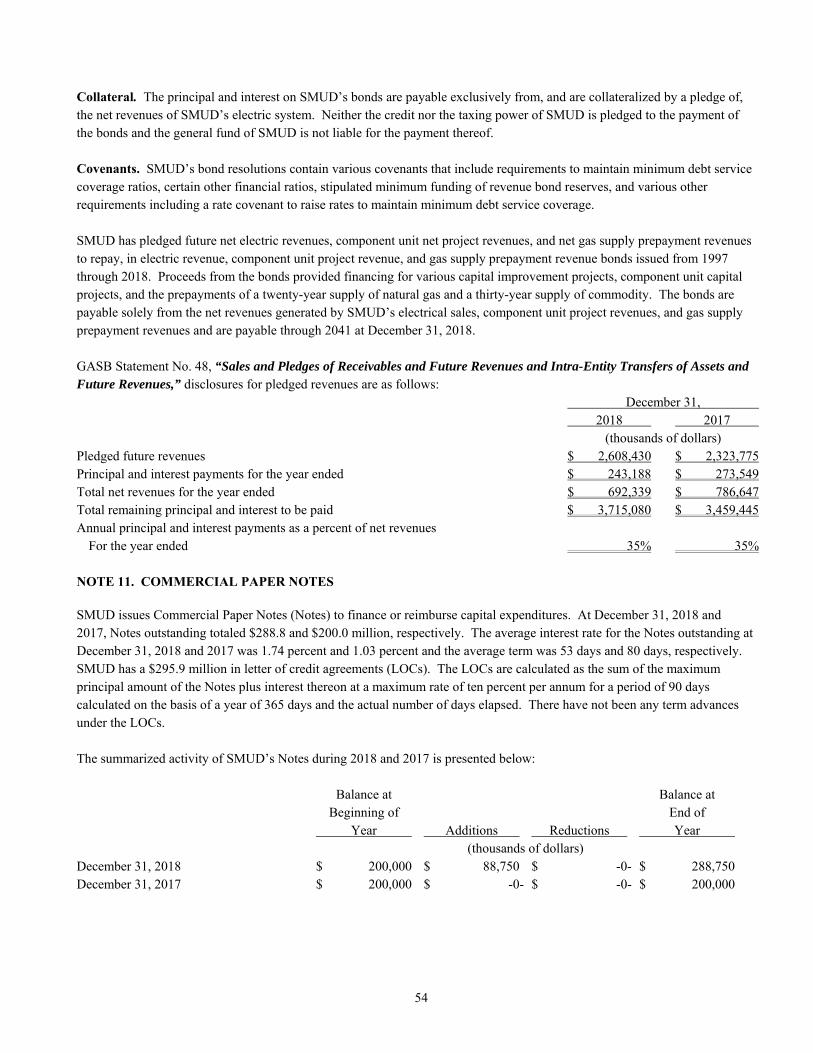
54
Collateral. The principal and interest on SMUD’s bonds are payable exclusively from, and are collateralized by a pledge of, the net revenues of SMUD’s electric system. Neither the credit nor the taxing power of SMUD is pledged to the payment of the bonds and the general fund of SMUD is not liable for the payment thereof. Covenants. SMUD’s bond resolutions contain various covenants that include requirements to maintain minimum debt service coverage ratios, certain other financial ratios, stipulated minimum funding of revenue bond reserves, and various other requirements including a rate covenant to raise rates to maintain minimum debt service coverage. SMUD has pledged future net electric revenues, component unit net project revenues, and net gas supply prepayment revenues to repay, in electric revenue, component unit project revenue, and gas supply prepayment revenue bonds issued from 1997 through 2018. Proceeds from the bonds provided financing for various capital improvement projects, component unit capital projects, and the prepayments of a twenty-year supply of natural gas and a thirty-year supply of commodity. The bonds are payable solely from the net revenues generated by SMUD’s electrical sales, component unit project revenues, and gas supply prepayment revenues and are payable through 2041 at December 31, 2018. GASB Statement No. 48, “Sales and Pledges of Receivables and Future Revenues and Intra-Entity Transfers of Assets and Future Revenues,” disclosures for pledged revenues are as follows: December 31, 2018 2017 (thousands of dollars) Pledged future revenues $ 2,608,430 $ 2,323,775 Principal and interest payments for the year ended $ 243,188 $ 273,549 Total net revenues for the year ended $ 692,339 $ 786,647 Total remaining principal and interest to be paid $ 3,715,080 $ 3,459,445 Annual principal and interest payments as a percent of net revenues For the year ended 35% 35% NOTE 11. COMMERCIAL PAPER NOTES SMUD issues Commercial Paper Notes (Notes) to finance or reimburse capital expenditures. At December 31, 2018 and 2017, Notes outstanding totaled $288.8 and $200.0 million, respectively. The average interest rate for the Notes outstanding at December 31, 2018 and 2017 was 1.74 percent and 1.03 percent and the average term was 53 days and 80 days, respectively. SMUD has a $295.9 million in letter of credit agreements (LOCs). The LOCs are calculated as the sum of the maximum principal amount of the Notes plus interest thereon at a maximum rate of ten percent per annum for a period of 90 days calculated on the basis of a year of 365 days and the actual number of days elapsed. There have not been any term advances under the LOCs. The summarized activity of SMUD’s Notes during 2018 and 2017 is presented below: Balance at Balance at Beginning of End of Year Additions Reductions Year (thousands of dollars) December 31, 2018 $ 200,000 $ 88,750 $ -0- $ 288,750 December 31, 2017 $ 200,000 $ -0- $ -0- $ 200,000
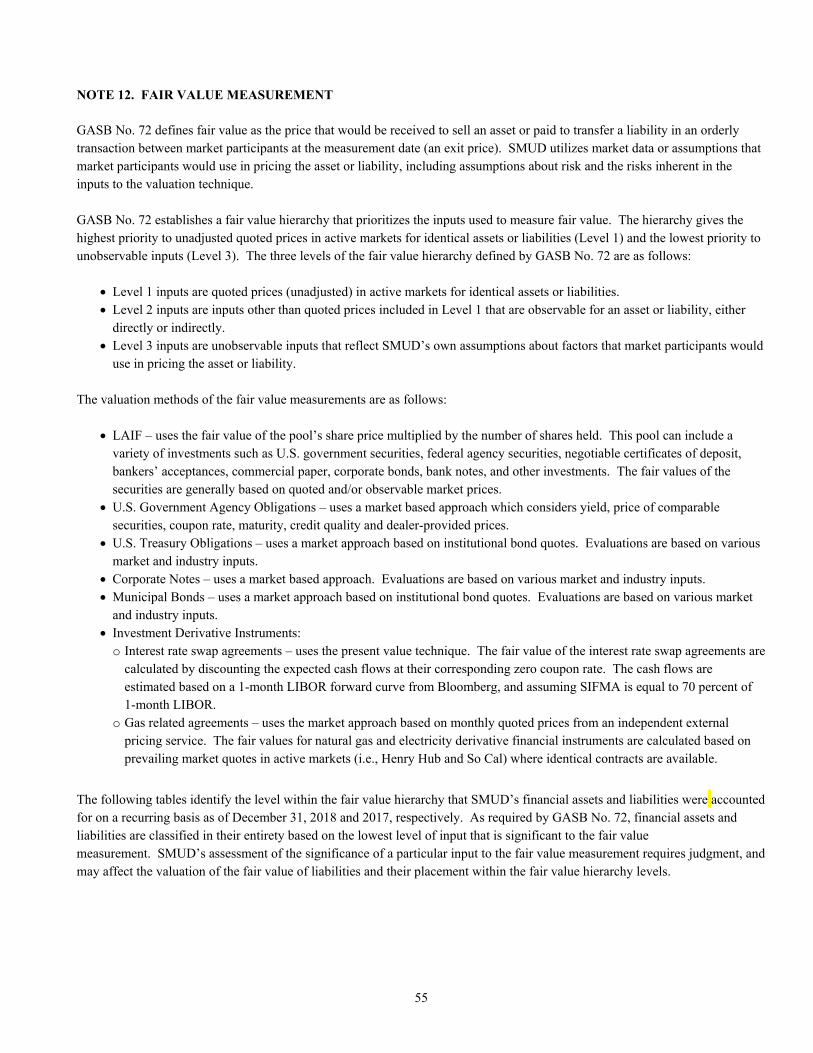
55
NOTE 12. FAIR VALUE MEASUREMENT GASB No. 72 defines fair value as the price that would be received to sell an asset or paid to transfer a liability in an orderly transaction between market participants at the measurement date (an exit price). SMUD utilizes market data or assumptions that market participants would use in pricing the asset or liability, including assumptions about risk and the risks inherent in the inputs to the valuation technique. GASB No. 72 establishes a fair value hierarchy that prioritizes the inputs used to measure fair value. The hierarchy gives the highest priority to unadjusted quoted prices in active markets for identical assets or liabilities (Level 1) and the lowest priority to unobservable inputs (Level 3). The three levels of the fair value hierarchy defined by GASB No. 72 are as follows:
Level 1 inputs are quoted prices (unadjusted) in active markets for identical assets or liabilities. Level 2 inputs are inputs other than quoted prices included in Level 1 that are observable for an asset or liability, either
directly or indirectly. Level 3 inputs are unobservable inputs that reflect SMUD’s own assumptions about factors that market participants would
use in pricing the asset or liability. The valuation methods of the fair value measurements are as follows:
LAIF – uses the fair value of the pool’s share price multiplied by the number of shares held. This pool can include a variety of investments such as U.S. government securities, federal agency securities, negotiable certificates of deposit, bankers’ acceptances, commercial paper, corporate bonds, bank notes, and other investments. The fair values of the securities are generally based on quoted and/or observable market prices.
U.S. Government Agency Obligations – uses a market based approach which considers yield, price of comparable securities, coupon rate, maturity, credit quality and dealer-provided prices.
U.S. Treasury Obligations – uses a market approach based on institutional bond quotes. Evaluations are based on various market and industry inputs.
Corporate Notes – uses a market based approach. Evaluations are based on various market and industry inputs. Municipal Bonds – uses a market approach based on institutional bond quotes. Evaluations are based on various market
and industry inputs. Investment Derivative Instruments: o Interest rate swap agreements – uses the present value technique. The fair value of the interest rate swap agreements are
calculated by discounting the expected cash flows at their corresponding zero coupon rate. The cash flows are estimated based on a 1-month LIBOR forward curve from Bloomberg, and assuming SIFMA is equal to 70 percent of 1-month LIBOR.
o Gas related agreements – uses the market approach based on monthly quoted prices from an independent external pricing service. The fair values for natural gas and electricity derivative financial instruments are calculated based on prevailing market quotes in active markets (i.e., Henry Hub and So Cal) where identical contracts are available.
The following tables identify the level within the fair value hierarchy that SMUD’s financial assets and liabilities were accounted for on a recurring basis as of December 31, 2018 and 2017, respectively. As required by GASB No. 72, financial assets and liabilities are classified in their entirety based on the lowest level of input that is significant to the fair value measurement. SMUD’s assessment of the significance of a particular input to the fair value measurement requires judgment, and may affect the valuation of the fair value of liabilities and their placement within the fair value hierarchy levels.
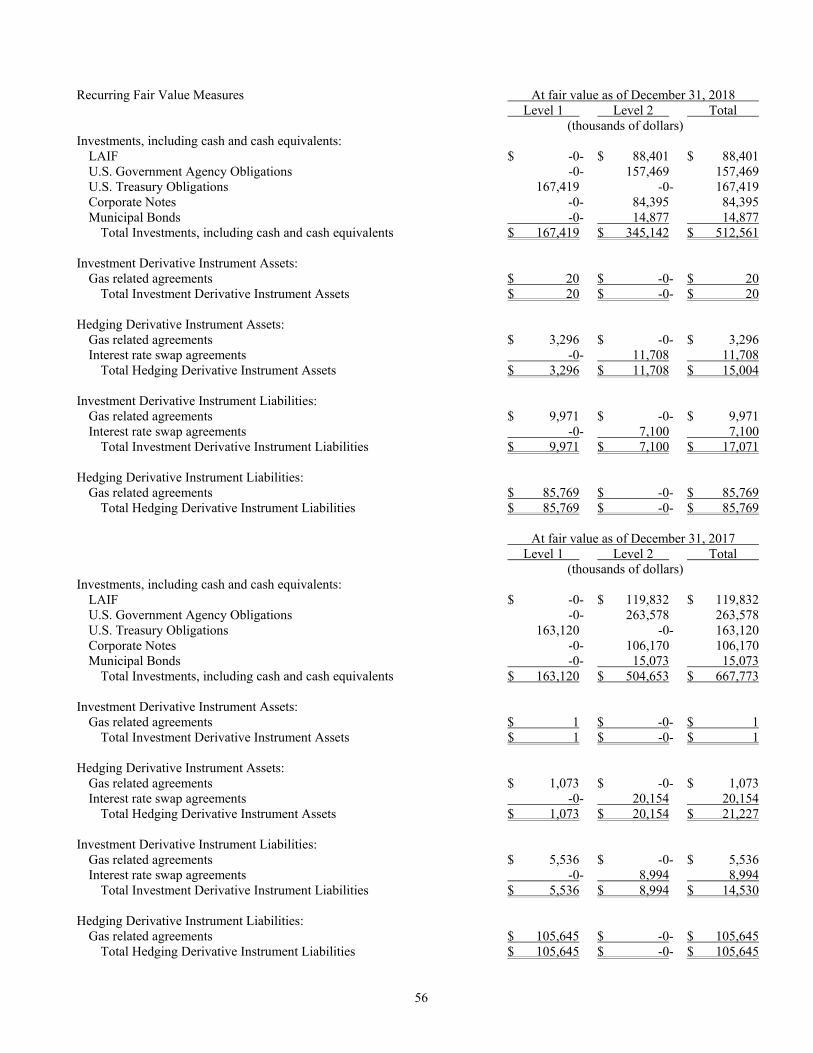
56
Recurring Fair Value Measures At fair value as of December 31, 2018 Level 1 Level 2 Total (thousands of dollars) Investments, including cash and cash equivalents: LAIF $ -0- $ 88,401 $ 88,401 U.S. Government Agency Obligations -0- 157,469 157,469 U.S. Treasury Obligations 167,419 -0- 167,419 Corporate Notes -0- 84,395 84,395 Municipal Bonds -0- 14,877 14,877 Total Investments, including cash and cash equivalents $ 167,419 $ 345,142 $ 512,561 Investment Derivative Instrument Assets: Gas related agreements $ 20 $ -0- $ 20 Total Investment Derivative Instrument Assets $ 20 $ -0- $ 20 Hedging Derivative Instrument Assets: Gas related agreements $ 3,296 $ -0- $ 3,296 Interest rate swap agreements -0- 11,708 11,708 Total Hedging Derivative Instrument Assets $ 3,296 $ 11,708 $ 15,004 Investment Derivative Instrument Liabilities: Gas related agreements $ 9,971 $ -0- $ 9,971 Interest rate swap agreements -0- 7,100 7,100 Total Investment Derivative Instrument Liabilities $ 9,971 $ 7,100 $ 17,071 Hedging Derivative Instrument Liabilities: Gas related agreements $ 85,769 $ -0- $ 85,769 Total Hedging Derivative Instrument Liabilities $ 85,769 $ -0- $ 85,769 At fair value as of December 31, 2017 Level 1 Level 2 Total (thousands of dollars) Investments, including cash and cash equivalents: LAIF $ -0- $ 119,832 $ 119,832 U.S. Government Agency Obligations -0- 263,578 263,578 U.S. Treasury Obligations 163,120 -0- 163,120 Corporate Notes -0- 106,170 106,170 Municipal Bonds -0- 15,073 15,073 Total Investments, including cash and cash equivalents $ 163,120 $ 504,653 $ 667,773 Investment Derivative Instrument Assets: Gas related agreements $ 1 $ -0- $ 1 Total Investment Derivative Instrument Assets $ 1 $ -0- $ 1 Hedging Derivative Instrument Assets: Gas related agreements $ 1,073 $ -0- $ 1,073 Interest rate swap agreements -0- 20,154 20,154 Total Hedging Derivative Instrument Assets $ 1,073 $ 20,154 $ 21,227 Investment Derivative Instrument Liabilities: Gas related agreements $ 5,536 $ -0- $ 5,536 Interest rate swap agreements -0- 8,994 8,994 Total Investment Derivative Instrument Liabilities $ 5,536 $ 8,994 $ 14,530 Hedging Derivative Instrument Liabilities: Gas related agreements $ 105,645 $ -0- $ 105,645 Total Hedging Derivative Instrument Liabilities $ 105,645 $ -0- $ 105,645
57
NOTE 13. RANCHO SECO DECOMMISSIONING LIABILITY Background. With the completion of nuclear decommissioning of the former 913 MW nuclear power plant, and the subsequent termination of the 10 CFR 50 license by the Nuclear Regulatory Commission (NRC) effective August 31, 2018, all remaining Rancho Seco decommissioning liability relates to the Independent Spent Fuel Storage Installation (ISFSI) licensed under 10 CFR Part 72. Nuclear decommissioning is the process of safely removing nuclear facilities from service and reducing residual radioactivity to a level that permits termination of the NRC licenses and release of the property for unrestricted use. Final decommissioning of the ISFSI will occur after the spent nuclear fuel (SNF) and Greater Than Class C (GTCC) radioactive waste are removed from the site and SMUD demonstrates that the site is suitable for release in accordance with release criteria specified in 10 CFR 20, Subpart E and an approved License Termination Plan. The DOE, under the Nuclear Waste Policy Act (NWPA) of 1982 as amended, is responsible for permanent disposal of spent nuclear fuel and GTCC radioactive waste, which are currently stored in the Part 72 licensed ISFSI. SMUD has a contract with the DOE for the removal and disposal of SNF and GTCC waste. All SMUD’s SNF and GTCC waste are currently stored in sealed canisters in the ISFSI. However, the date when DOE will remove the fuel and GTCC waste is uncertain. In 2010, the DOE formally withdrew the application for licensing of Yucca Mountain as a high-level waste repository. While the court ordered reinstatement of NRC license review activities of Yucca Mountain have yielded generally positive results, Yucca Mountain remains speculative as a disposal option for SMUD’s used nuclear fuel. The DOE also announced in January 2010 the creation of a Blue-Ribbon Commission to study alternatives for developing a repository for the nation’s used nuclear fuel. The Commission provided a final report on alternatives in January 2012. The DOE evaluated the recommendations and published the report “Strategy for the Management and Disposal of Used Nuclear Fuel and High-Level Radioactive Waste” in January 2013. The next phase of the process will be for Congress and the President of the United States to consider the recommendations and enact legislation to implement the recommendations. At this time, two license applications have been submitted to the NRC for the construction and operation of Consolidated Interim Storage Facility(s) that would store SNF and GTCC waste on an interim basis. These applications are currently under review by the NRC. Should the NRC license one or both facilities, Congress will have to modify the NWPA to allow for its use. In May 2018, the U.S. House of Representatives passed H.R. 3053 – the Nuclear Waste Policy Amendments Act, which was co-sponsored by Representative Doris Matsui and 109 other members of Congress. This bill includes a provision to allow a Consolidated Interim Storage Facility to store fuel from permanently shut down sites like Rancho Seco. As of the end of 2018, the U.S. Senate has not acted on the bill. Passage of this legislation would be a significant step towards removal of the used nuclear fuel from the Rancho Seco facility. Until then, SMUD is committed to the safe and secure storage of its SNF and GTCC waste under its Part 72 license until DOE fulfills its obligation to dispose of this material in accordance with NWPA. In support of this commitment, SMUD submitted its ISFSI license renewal application to the NRC in March of 2018. Once approved, the ISFSI would be allowed to continue the safe and secure storage of SMUD’s SNF and GTCC.
58
Asset Retirement Obligations (ARO). These financial statements reflect SMUD’s current estimate of its obligation for the cost of decommissioning (including the cost of managing the Storage Facility until it can be decommissioned) under the requirements of FASB ASC 410, based on studies completed each year. Each year, SMUD evaluates the estimate of costs of decommissioning and there was an increase in costs in the 2018 study. The ARO estimate assumes all spent nuclear fuel will be removed from the site by 2035. Rancho Seco’s ARO is presented below: December 31, 2018 2017 (thousands of dollars) Active decommissioning $ 15,506 $ 14,559 Spent fuel management 141,009 135,221 Total ARO 156,515 149,780 Less: current portion (5,562) (5,775) Total non-current portion of ARO $ 150,953 $ 144,005 The summarized activity of the Rancho Seco ARO during 2018 and 2017 are presented below. The annual adjustments include a savings computed as the difference between the fair value of the obligation as if the decommissioning activities were performed by a third party and the amount actually incurred by SMUD performing the decommissioning activities. December 31, 2018 2017 (thousands of dollars) ARO at beginning of year $ 149,780 $ 147,970 Accretion 7,591 7,521 Expenditures (5,448) (7,439) Change in study 7,975 2,969 Annual adjustments (3,383) (1,241) ARO at end of year $ 156,515 $ 149,780 NOTE 14. PENSION PLANS Summary of Significant Accounting Policies. For purposes of measuring net pension liability, deferred outflows of resources and deferred inflows of resources related to pensions, and pension expense, information about the fiduciary net position of the pension plans and additions to/deductions from the Plan’s fiduciary net position have been determined on the same basis as they are reported by the California Public Employees’ Retirement System (PERS) Financial Office. For this purpose, benefit payments (including refunds of employee contributions) are recognized when currently due and payable in accordance with the benefit terms. Investments are reported at fair value. Plan Description and Benefits Provided. SMUD participates in PERS, an agent multiple-employer public employee defined benefit pension plan (PERS Plan). PERS provides retirement and disability benefits, annual cost-of-living adjustments, and death benefits to plan members and beneficiaries. PERS acts as a common investment and administrative agent for participating public entities within the State. Benefit provisions and all other requirements are established by State statute and SMUD policies. The pension plan provides retirement benefits, survivor benefits, and death and disability benefits based upon employee’s years of credited service, age, and final compensation. A full description of the pension plan regarding number of employees covered, benefit provision, assumptions (for funding, but not accounting purposes), and membership information are included in the annual actuarial valuation reports as of June 30, 2017 and June 30, 2016. SMUD also provides a supplemental benefit in lieu of PERS’ Single Highest Year (SHY) for certain represented employees
59
hired before January 1, 2013. For these employees, if the present value of pension allowance under the PERS Plan with the employer paid member contributions (EPMC) benefit enhancement program is less than the present value of what the employee would have received under the PERS Plan benefit with SHY earnings but no EPMC, SMUD pays a lump sum equivalent to the difference. There are no assets accumulated in a trust for SHY. SMUD implemented GASB No. 73 to record SHY in 2017. GASB No. 68 and GASB No. 73 require that the reported results must pertain to liability and asset information within certain defined timeframes. The following timeframes are used for the year ended: PERS Plan December 31, 2018 2017 Valuation date June 30, 2017 June 30, 2016 Measurement date June 30, 2018 June 30, 2017 SHY December 31, 2018 2017 Valuation date and Measurement date June 30, 2018 June 30, 2017 Employees Covered by Benefit Terms. The following employees were covered by the benefit terms for the year ended: PERS Plan December 31, 2018 2017 Inactive employees or beneficiaries currently receiving benefit payments 2,865 2,777 Inactive employees entitled to but not yet receiving benefit payments 919 921 Active employees 2,169 2,125 Total employees covered by benefit terms 5,953 5,823 SHY December 31, 2018 2017 Inactive employees or beneficiaries currently receiving benefit payments -0- -0- Inactive employees entitled to but not yet receiving benefit payments 1 -0- Active employees 231 276 Total employees covered by benefit terms 232 276 Contributions. Section 20814(c) of the California Public Employees’ Retirement Law requires that the employer contribution rates for all public employers be determined on an annual basis by the actuary and shall be effective on the July 1 following notice of a change in the rate. The total plan contributions are determined through PERS’ annual actuarial valuation process. The actuarially determined rate is the estimated amount necessary to finance the costs of benefits earned by employees during the year, with an additional amount to finance any unfunded accrued liability. The employer is required to contribute the difference between the actuarially determined rate and the contribution rate of employees. For the PERS fiscal years ended June 30, 2018 and 2017, the average active employee contribution rate is 6.8 percent and 6.9 percent of annual pay, respectively. For the PERS fiscal year ended June 30, 2018, the employer’s contribution rate is 7.7 percent of annual payroll plus $22.3 million for the unfunded accrued liability contribution. For the PERS fiscal year ended June 30, 2017, the employer’s contribution rate is 16.0 percent of annual payroll. Employer contribution rates may change if plan contracts are amended. For the fiscal years ended June 30, 2018 and 2017, SMUD made contributions recognized by the PERS Plan in the amount of $90.1 million and $32.4 million, respectively. Net Pension Liability (NPL). SMUD’s NPL at December 31, 2018 and 2017 was measured at June 30, 2018 and 2017, respectively. The total pension liability used to calculate the NPL was determined by actuarial valuations as of June 30, 2017
60
and 2016 rolled forward using generally accepted actuarial procedures to the June 30, 2018 and 2017 measurement dates for the PERS Plan and actuarial valuations as of June 30, 2018 and 2017 for SHY. Actuarial Methods and Assumptions. The actuarial methods and assumptions used for the December 31, 2018 and December 31, 2017 total pension liabilities are as follows for the PERS Plan: Actuarial Cost Method Entry age normal Discount Rate 7.15% Inflation 2.5% (2018), 2.75% (2017) Salary Increases Varies by entry age and service Mortality Rate Table The mortality table used was developed based on PERS’ specific data. For 2018, the table
includes 15 years of mortality improvements using the Society of Actuaries Scale 90% of scale MP 2016 (2017 experience study). For 2017, the table includes 20 years of mortality improvements using Society of Actuaries Scale BB (2014 experience study).
Post Retirement Benefit Increase For 2018, contract COLA up to 2.0% until Purchase Power Protection Allowance Floor on Purchasing Power applies, 2.5% thereafter. For 2017, contract COLA up to 2.75% until Purchase Power Protection Allowance Floor on Purchasing Power applies, 2.75% thereafter.
The actuarial methods and assumptions used for the December 31, 2018 and December 31, 2017 total pension liabilities are as follows for SHY: Actuarial Cost Method Entry age normal Discount Rate Bond Buyer 20 Index – 3.87% (2018), 3.58% (2017) Inflation 2.75% Salary Increases Aggregate - 3.00%; merit - PERS 1997-2015 Experience Study (2018), PERS 1997-2011
Experience Study (2017) Mortality, Retirement, Disability, Termination PERS 1997-2015 Experience Study (2018), PERS 1997-2011 Experience Study (2017) Mortality Improvement Mortality projected 15 years with 90% of Scale MP-2016 (2018) Mortality projected 20 years with Scale BB (2017) Discount Rates. For the PERS Plan, the discount rate used to measure the total pension liability for the years ended December 31, 2018 and 2017 was 7.15 percent for both years. For the year ended December 31, 2018, the projection of cash flows used to determine the discount rate assumed that contributions from plan members will be made at the current member contribution rates and that contributions from employers will be made at statutorily required rates, actuarially determined. Based on those assumptions, the PERS Plan was projected to be available to make all projected future benefit payments of current plan members. The long-term expected discount rate of return on plan investments was applied to all periods of projected benefit payments to determine the total pension liability. For the year ended December 31, 2017, to determine whether the municipal bond rate should be used in the calculation of a discount rate for each plan, PERS stress tested plans that would most likely result in a discount rate that would be different from the actuarially assumed discount rate. The tests revealed the assets would not run out. Therefore, the discount rates used for the valuations are appropriate and the use of the municipal bond rate calculation is not deemed necessary. The long-term expected discount rates are applied to all plans in the Public Employees Retirement Fund. The cash flows used in the testing were developed assuming that both members and employers will make their required contributions on time and as scheduled in all future years.
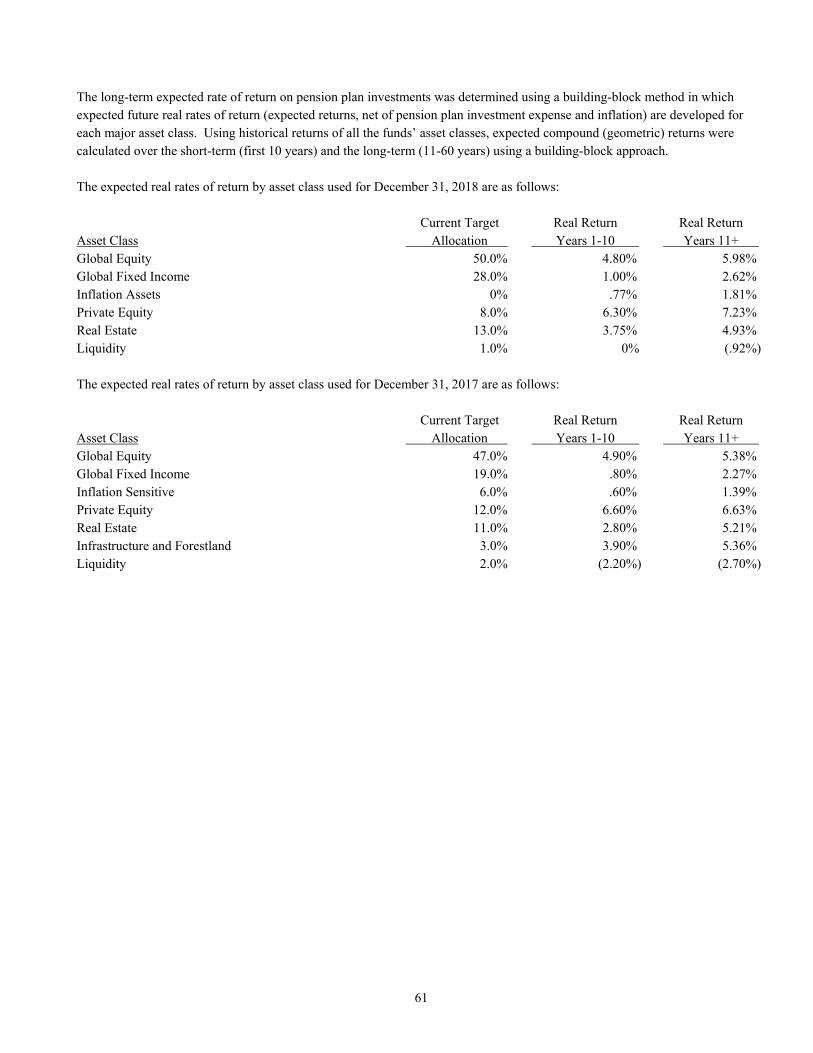
61
The long-term expected rate of return on pension plan investments was determined using a building-block method in which expected future real rates of return (expected returns, net of pension plan investment expense and inflation) are developed for each major asset class. Using historical returns of all the funds’ asset classes, expected compound (geometric) returns were calculated over the short-term (first 10 years) and the long-term (11-60 years) using a building-block approach. The expected real rates of return by asset class used for December 31, 2018 are as follows: Current Target Real Return Real Return Asset Class Allocation Years 1-10 Years 11+ Global Equity 50.0% 4.80% 5.98% Global Fixed Income 28.0% 1.00% 2.62% Inflation Assets 0% .77% 1.81% Private Equity 8.0% 6.30% 7.23% Real Estate 13.0% 3.75% 4.93% Liquidity 1.0% 0% (.92%) The expected real rates of return by asset class used for December 31, 2017 are as follows: Current Target Real Return Real Return Asset Class Allocation Years 1-10 Years 11+ Global Equity 47.0% 4.90% 5.38% Global Fixed Income 19.0% .80% 2.27% Inflation Sensitive 6.0% .60% 1.39% Private Equity 12.0% 6.60% 6.63% Real Estate 11.0% 2.80% 5.21% Infrastructure and Forestland 3.0% 3.90% 5.36% Liquidity 2.0% (2.20%) (2.70%)
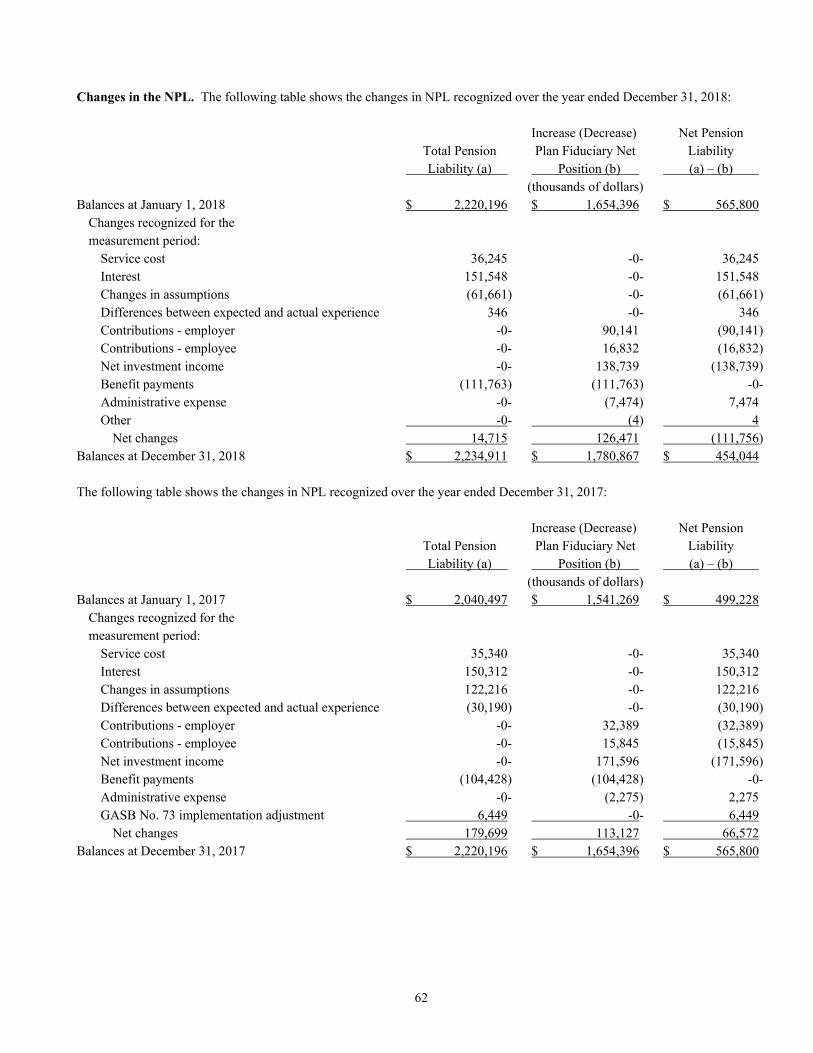
62
Changes in the NPL. The following table shows the changes in NPL recognized over the year ended December 31, 2018: Increase (Decrease) Net Pension Total Pension Plan Fiduciary Net Liability Liability (a) Position (b) (a) – (b) (thousands of dollars) Balances at January 1, 2018 $ 2,220,196 $ 1,654,396 $ 565,800 Changes recognized for the measurement period: Service cost 36,245 -0- 36,245 Interest 151,548 -0- 151,548 Changes in assumptions (61,661) -0- (61,661) Differences between expected and actual experience 346 -0- 346 Contributions - employer -0- 90,141 (90,141) Contributions - employee -0- 16,832 (16,832) Net investment income -0- 138,739 (138,739) Benefit payments (111,763) (111,763) -0- Administrative expense -0- (7,474) 7,474 Other -0- (4) 4 Net changes 14,715 126,471 (111,756) Balances at December 31, 2018 $ 2,234,911 $ 1,780,867 $ 454,044 The following table shows the changes in NPL recognized over the year ended December 31, 2017: Increase (Decrease) Net Pension Total Pension Plan Fiduciary Net Liability Liability (a) Position (b) (a) – (b) (thousands of dollars) Balances at January 1, 2017 $ 2,040,497 $ 1,541,269 $ 499,228 Changes recognized for the measurement period: Service cost 35,340 -0- 35,340 Interest 150,312 -0- 150,312 Changes in assumptions 122,216 -0- 122,216 Differences between expected and actual experience (30,190) -0- (30,190) Contributions - employer -0- 32,389 (32,389) Contributions - employee -0- 15,845 (15,845) Net investment income -0- 171,596 (171,596) Benefit payments (104,428) (104,428) -0- Administrative expense -0- (2,275) 2,275 GASB No. 73 implementation adjustment 6,449 -0- 6,449 Net changes 179,699 113,127 66,572 Balances at December 31, 2017 $ 2,220,196 $ 1,654,396 $ 565,800
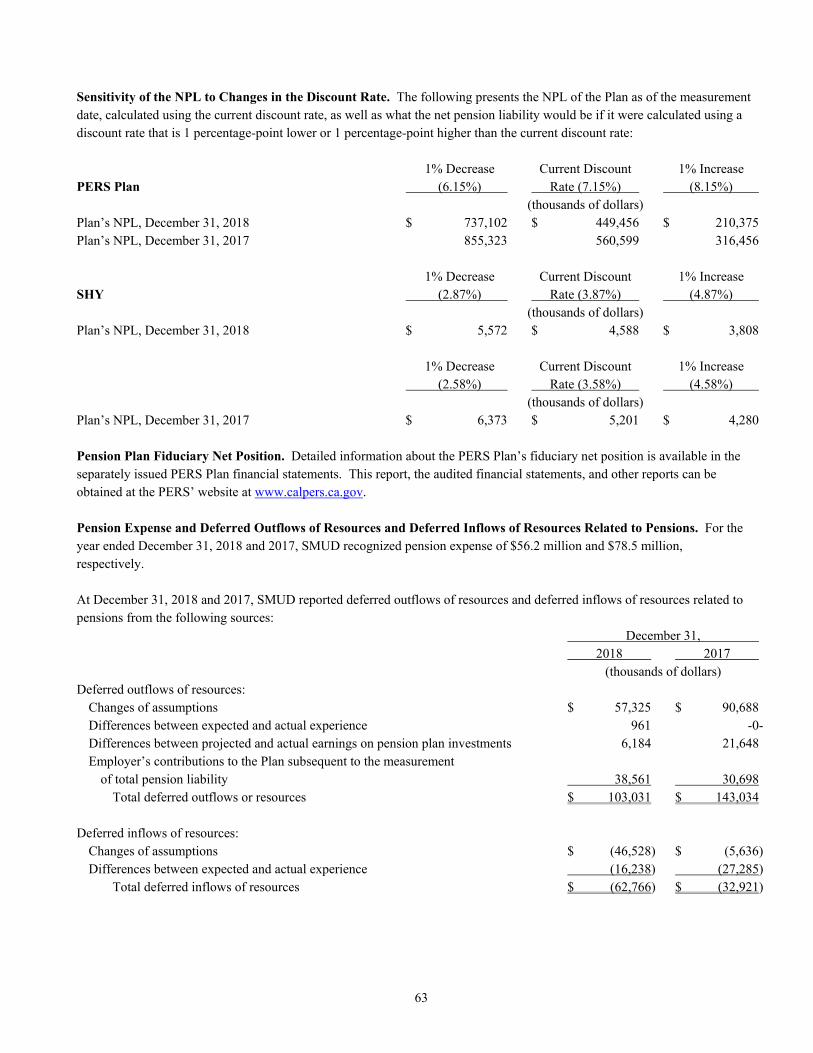
63
Sensitivity of the NPL to Changes in the Discount Rate. The following presents the NPL of the Plan as of the measurement date, calculated using the current discount rate, as well as what the net pension liability would be if it were calculated using a discount rate that is 1 percentage-point lower or 1 percentage-point higher than the current discount rate: 1% Decrease Current Discount 1% Increase PERS Plan (6.15%) Rate (7.15%) (8.15%) (thousands of dollars) Plan’s NPL, December 31, 2018 $ 737,102 $ 449,456 $ 210,375 Plan’s NPL, December 31, 2017 855,323 560,599 316,456 1% Decrease Current Discount 1% Increase SHY (2.87%) Rate (3.87%) (4.87%) (thousands of dollars) Plan’s NPL, December 31, 2018 $ 5,572 $ 4,588 $ 3,808 1% Decrease Current Discount 1% Increase (2.58%) Rate (3.58%) (4.58%) (thousands of dollars) Plan’s NPL, December 31, 2017 $ 6,373 $ 5,201 $ 4,280 Pension Plan Fiduciary Net Position. Detailed information about the PERS Plan’s fiduciary net position is available in the separately issued PERS Plan financial statements. This report, the audited financial statements, and other reports can be obtained at the PERS’ website at www.calpers.ca.gov. Pension Expense and Deferred Outflows of Resources and Deferred Inflows of Resources Related to Pensions. For the year ended December 31, 2018 and 2017, SMUD recognized pension expense of $56.2 million and $78.5 million, respectively. At December 31, 2018 and 2017, SMUD reported deferred outflows of resources and deferred inflows of resources related to pensions from the following sources: December 31, 2018 2017 (thousands of dollars) Deferred outflows of resources: Changes of assumptions $ 57,325 $ 90,688 Differences between expected and actual experience 961 -0- Differences between projected and actual earnings on pension plan investments 6,184 21,648 Employer’s contributions to the Plan subsequent to the measurement of total pension liability 38,561 30,698 Total deferred outflows or resources $ 103,031 $ 143,034 Deferred inflows of resources: Changes of assumptions $ (46,528) $ (5,636) Differences between expected and actual experience (16,238) (27,285) Total deferred inflows of resources $ (62,766) $ (32,921)
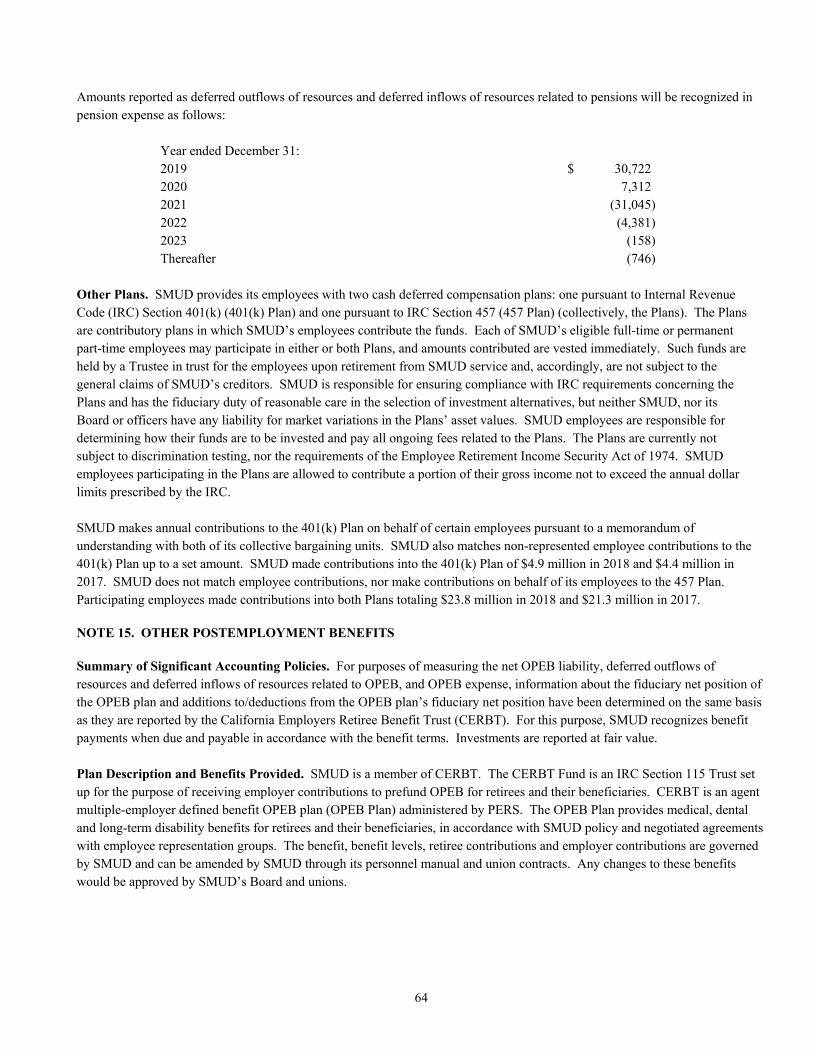
64
Amounts reported as deferred outflows of resources and deferred inflows of resources related to pensions will be recognized in pension expense as follows: Year ended December 31: 2019 $ 30,722 2020 7,312 2021 (31,045) 2022 (4,381) 2023 (158) Thereafter (746) Other Plans. SMUD provides its employees with two cash deferred compensation plans: one pursuant to Internal Revenue Code (IRC) Section 401(k) (401(k) Plan) and one pursuant to IRC Section 457 (457 Plan) (collectively, the Plans). The Plans are contributory plans in which SMUD’s employees contribute the funds. Each of SMUD’s eligible full-time or permanent part-time employees may participate in either or both Plans, and amounts contributed are vested immediately. Such funds are held by a Trustee in trust for the employees upon retirement from SMUD service and, accordingly, are not subject to the general claims of SMUD’s creditors. SMUD is responsible for ensuring compliance with IRC requirements concerning the Plans and has the fiduciary duty of reasonable care in the selection of investment alternatives, but neither SMUD, nor its Board or officers have any liability for market variations in the Plans’ asset values. SMUD employees are responsible for determining how their funds are to be invested and pay all ongoing fees related to the Plans. The Plans are currently not subject to discrimination testing, nor the requirements of the Employee Retirement Income Security Act of 1974. SMUD employees participating in the Plans are allowed to contribute a portion of their gross income not to exceed the annual dollar limits prescribed by the IRC. SMUD makes annual contributions to the 401(k) Plan on behalf of certain employees pursuant to a memorandum of understanding with both of its collective bargaining units. SMUD also matches non-represented employee contributions to the 401(k) Plan up to a set amount. SMUD made contributions into the 401(k) Plan of $4.9 million in 2018 and $4.4 million in 2017. SMUD does not match employee contributions, nor make contributions on behalf of its employees to the 457 Plan. Participating employees made contributions into both Plans totaling $23.8 million in 2018 and $21.3 million in 2017. NOTE 15. OTHER POSTEMPLOYMENT BENEFITS Summary of Significant Accounting Policies. For purposes of measuring the net OPEB liability, deferred outflows of resources and deferred inflows of resources related to OPEB, and OPEB expense, information about the fiduciary net position of the OPEB plan and additions to/deductions from the OPEB plan’s fiduciary net position have been determined on the same basis as they are reported by the California Employers Retiree Benefit Trust (CERBT). For this purpose, SMUD recognizes benefit payments when due and payable in accordance with the benefit terms. Investments are reported at fair value. Plan Description and Benefits Provided. SMUD is a member of CERBT. The CERBT Fund is an IRC Section 115 Trust set up for the purpose of receiving employer contributions to prefund OPEB for retirees and their beneficiaries. CERBT is an agent multiple-employer defined benefit OPEB plan (OPEB Plan) administered by PERS. The OPEB Plan provides medical, dental and long-term disability benefits for retirees and their beneficiaries, in accordance with SMUD policy and negotiated agreements with employee representation groups. The benefit, benefit levels, retiree contributions and employer contributions are governed by SMUD and can be amended by SMUD through its personnel manual and union contracts. Any changes to these benefits would be approved by SMUD’s Board and unions.
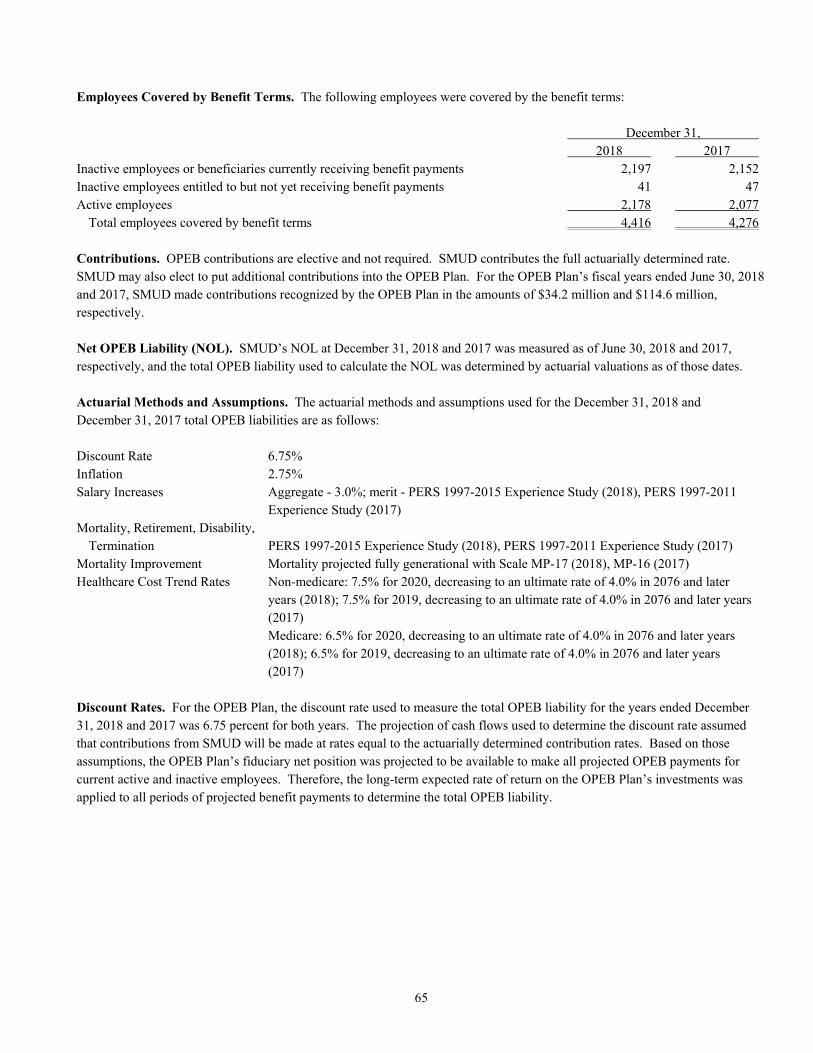
65
Employees Covered by Benefit Terms. The following employees were covered by the benefit terms: December 31, 2018 2017 Inactive employees or beneficiaries currently receiving benefit payments 2,197 2,152 Inactive employees entitled to but not yet receiving benefit payments 41 47 Active employees 2,178 2,077 Total employees covered by benefit terms 4,416 4,276 Contributions. OPEB contributions are elective and not required. SMUD contributes the full actuarially determined rate. SMUD may also elect to put additional contributions into the OPEB Plan. For the OPEB Plan’s fiscal years ended June 30, 2018 and 2017, SMUD made contributions recognized by the OPEB Plan in the amounts of $34.2 million and $114.6 million, respectively. Net OPEB Liability (NOL). SMUD’s NOL at December 31, 2018 and 2017 was measured as of June 30, 2018 and 2017, respectively, and the total OPEB liability used to calculate the NOL was determined by actuarial valuations as of those dates. Actuarial Methods and Assumptions. The actuarial methods and assumptions used for the December 31, 2018 and December 31, 2017 total OPEB liabilities are as follows: Discount Rate 6.75% Inflation 2.75% Salary Increases Aggregate - 3.0%; merit - PERS 1997-2015 Experience Study (2018), PERS 1997-2011
Experience Study (2017) Mortality, Retirement, Disability, Termination PERS 1997-2015 Experience Study (2018), PERS 1997-2011 Experience Study (2017) Mortality Improvement Mortality projected fully generational with Scale MP-17 (2018), MP-16 (2017) Healthcare Cost Trend Rates Non-medicare: 7.5% for 2020, decreasing to an ultimate rate of 4.0% in 2076 and later
years (2018); 7.5% for 2019, decreasing to an ultimate rate of 4.0% in 2076 and later years (2017)
Medicare: 6.5% for 2020, decreasing to an ultimate rate of 4.0% in 2076 and later years (2018); 6.5% for 2019, decreasing to an ultimate rate of 4.0% in 2076 and later years
(2017) Discount Rates. For the OPEB Plan, the discount rate used to measure the total OPEB liability for the years ended December 31, 2018 and 2017 was 6.75 percent for both years. The projection of cash flows used to determine the discount rate assumed that contributions from SMUD will be made at rates equal to the actuarially determined contribution rates. Based on those assumptions, the OPEB Plan’s fiduciary net position was projected to be available to make all projected OPEB payments for current active and inactive employees. Therefore, the long-term expected rate of return on the OPEB Plan’s investments was applied to all periods of projected benefit payments to determine the total OPEB liability.
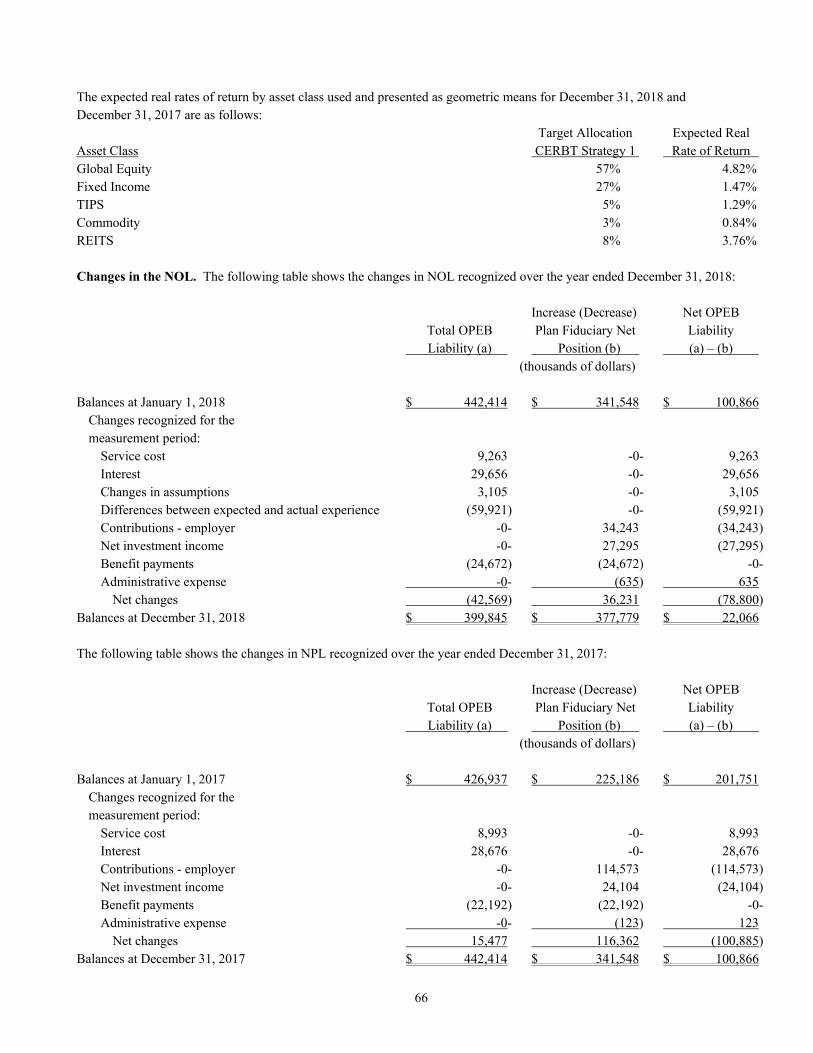
66
The expected real rates of return by asset class used and presented as geometric means for December 31, 2018 and December 31, 2017 are as follows: Target Allocation Expected Real Asset Class CERBT Strategy 1 Rate of Return Global Equity 57% 4.82% Fixed Income 27% 1.47% TIPS 5% 1.29% Commodity 3% 0.84% REITS 8% 3.76% Changes in the NOL. The following table shows the changes in NOL recognized over the year ended December 31, 2018: Increase (Decrease) Net OPEB Total OPEB Plan Fiduciary Net Liability Liability (a) Position (b) (a) – (b) (thousands of dollars) Balances at January 1, 2018 $ 442,414 $ 341,548 $ 100,866 Changes recognized for the measurement period: Service cost 9,263 -0- 9,263 Interest 29,656 -0- 29,656 Changes in assumptions 3,105 -0- 3,105 Differences between expected and actual experience (59,921) -0- (59,921) Contributions - employer -0- 34,243 (34,243) Net investment income -0- 27,295 (27,295) Benefit payments (24,672) (24,672) -0- Administrative expense -0- (635) 635 Net changes (42,569) 36,231 (78,800) Balances at December 31, 2018 $ 399,845 $ 377,779 $ 22,066 The following table shows the changes in NPL recognized over the year ended December 31, 2017: Increase (Decrease) Net OPEB Total OPEB Plan Fiduciary Net Liability Liability (a) Position (b) (a) – (b) (thousands of dollars) Balances at January 1, 2017 $ 426,937 $ 225,186 $ 201,751 Changes recognized for the measurement period: Service cost 8,993 -0- 8,993 Interest 28,676 -0- 28,676 Contributions - employer -0- 114,573 (114,573) Net investment income -0- 24,104 (24,104) Benefit payments (22,192) (22,192) -0- Administrative expense -0- (123) 123 Net changes 15,477 116,362 (100,885) Balances at December 31, 2017 $ 442,414 $ 341,548 $ 100,866
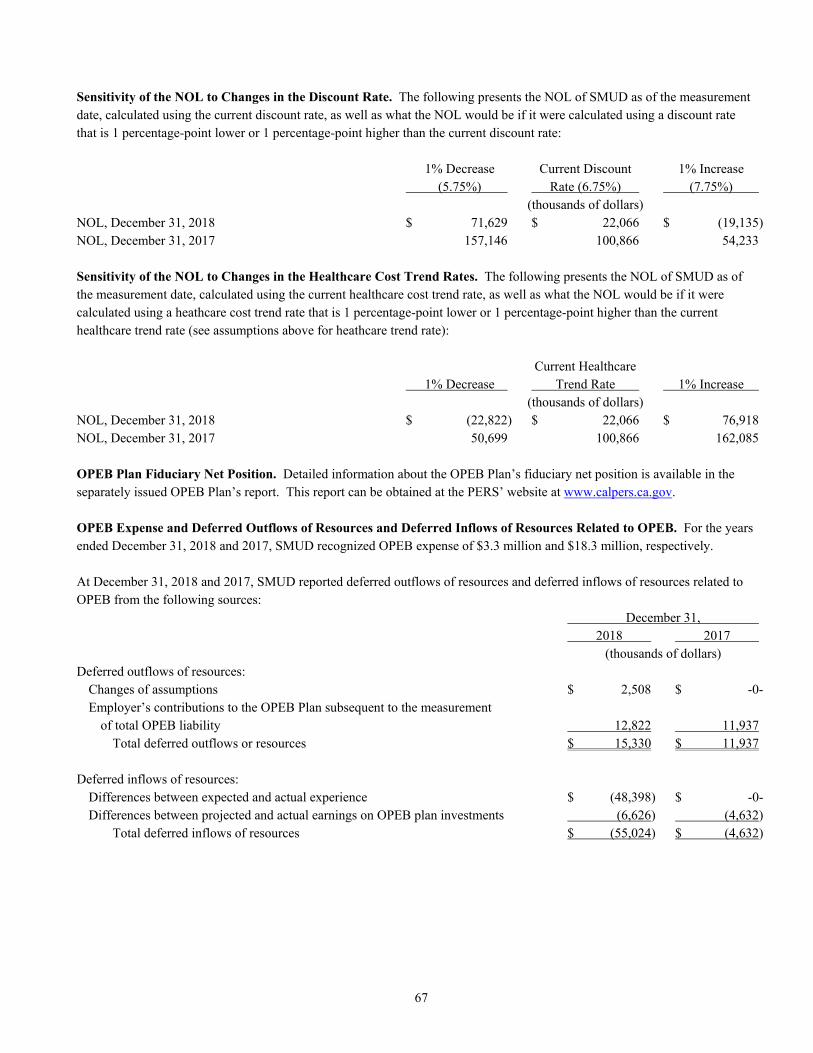
67
Sensitivity of the NOL to Changes in the Discount Rate. The following presents the NOL of SMUD as of the measurement date, calculated using the current discount rate, as well as what the NOL would be if it were calculated using a discount rate that is 1 percentage-point lower or 1 percentage-point higher than the current discount rate: 1% Decrease Current Discount 1% Increase (5.75%) Rate (6.75%) (7.75%) (thousands of dollars) NOL, December 31, 2018 $ 71,629 $ 22,066 $ (19,135) NOL, December 31, 2017 157,146 100,866 54,233 Sensitivity of the NOL to Changes in the Healthcare Cost Trend Rates. The following presents the NOL of SMUD as of the measurement date, calculated using the current healthcare cost trend rate, as well as what the NOL would be if it were calculated using a heathcare cost trend rate that is 1 percentage-point lower or 1 percentage-point higher than the current healthcare trend rate (see assumptions above for heathcare trend rate): Current Healthcare 1% Decrease Trend Rate 1% Increase (thousands of dollars) NOL, December 31, 2018 $ (22,822) $ 22,066 $ 76,918 NOL, December 31, 2017 50,699 100,866 162,085 OPEB Plan Fiduciary Net Position. Detailed information about the OPEB Plan’s fiduciary net position is available in the separately issued OPEB Plan’s report. This report can be obtained at the PERS’ website at www.calpers.ca.gov. OPEB Expense and Deferred Outflows of Resources and Deferred Inflows of Resources Related to OPEB. For the years ended December 31, 2018 and 2017, SMUD recognized OPEB expense of $3.3 million and $18.3 million, respectively. At December 31, 2018 and 2017, SMUD reported deferred outflows of resources and deferred inflows of resources related to OPEB from the following sources: December 31, 2018 2017 (thousands of dollars) Deferred outflows of resources: Changes of assumptions $ 2,508 $ -0- Employer’s contributions to the OPEB Plan subsequent to the measurement of total OPEB liability 12,822 11,937 Total deferred outflows or resources $ 15,330 $ 11,937 Deferred inflows of resources: Differences between expected and actual experience $ (48,398) $ -0- Differences between projected and actual earnings on OPEB plan investments (6,626) (4,632) Total deferred inflows of resources $ (55,024) $ (4,632)
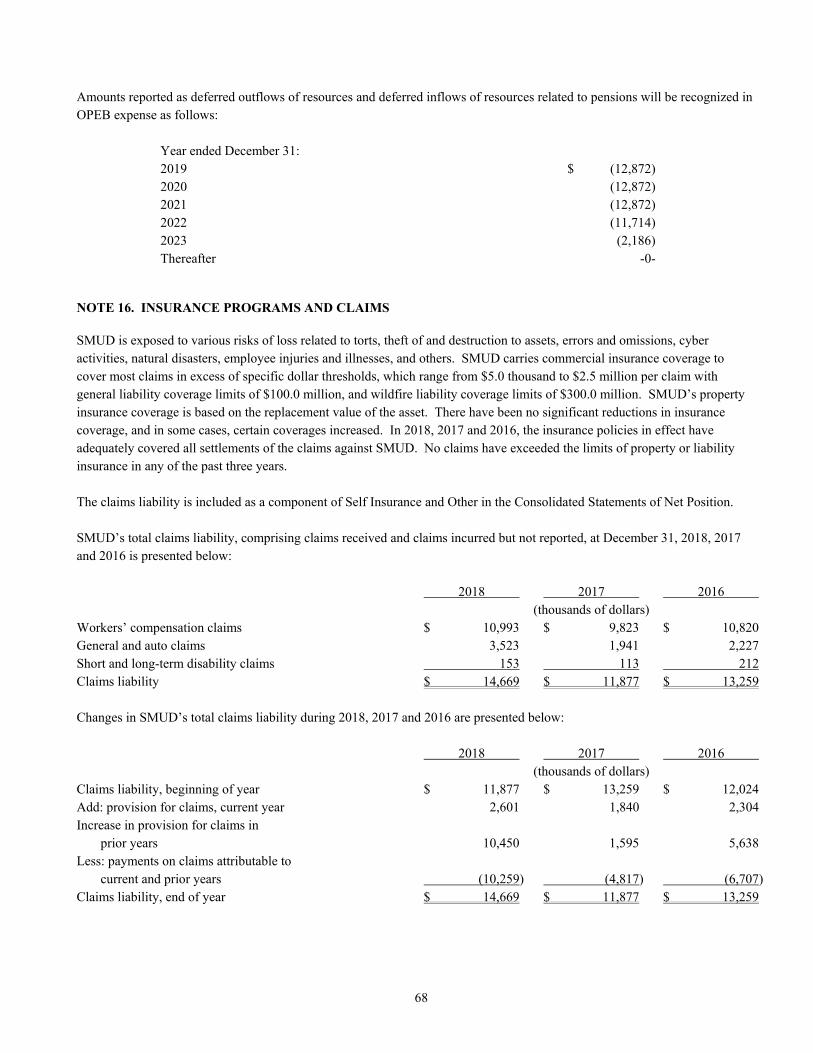
68
Amounts reported as deferred outflows of resources and deferred inflows of resources related to pensions will be recognized in OPEB expense as follows: Year ended December 31: 2019 $ (12,872) 2020 (12,872) 2021 (12,872) 2022 (11,714) 2023 (2,186) Thereafter -0- NOTE 16. INSURANCE PROGRAMS AND CLAIMS SMUD is exposed to various risks of loss related to torts, theft of and destruction to assets, errors and omissions, cyber activities, natural disasters, employee injuries and illnesses, and others. SMUD carries commercial insurance coverage to cover most claims in excess of specific dollar thresholds, which range from $5.0 thousand to $2.5 million per claim with general liability coverage limits of $100.0 million, and wildfire liability coverage limits of $300.0 million. SMUD’s property insurance coverage is based on the replacement value of the asset. There have been no significant reductions in insurance coverage, and in some cases, certain coverages increased. In 2018, 2017 and 2016, the insurance policies in effect have adequately covered all settlements of the claims against SMUD. No claims have exceeded the limits of property or liability insurance in any of the past three years. The claims liability is included as a component of Self Insurance and Other in the Consolidated Statements of Net Position. SMUD’s total claims liability, comprising claims received and claims incurred but not reported, at December 31, 2018, 2017 and 2016 is presented below: 2018 2017 2016 (thousands of dollars) Workers’ compensation claims $ 10,993 $ 9,823 $ 10,820 General and auto claims 3,523 1,941 2,227 Short and long-term disability claims 153 113 212 Claims liability $ 14,669 $ 11,877 $ 13,259 Changes in SMUD’s total claims liability during 2018, 2017 and 2016 are presented below: 2018 2017 2016 (thousands of dollars) Claims liability, beginning of year $ 11,877 $ 13,259 $ 12,024 Add: provision for claims, current year 2,601 1,840 2,304 Increase in provision for claims in prior years 10,450 1,595 5,638 Less: payments on claims attributable to current and prior years (10,259) (4,817) (6,707) Claims liability, end of year $ 14,669 $ 11,877 $ 13,259
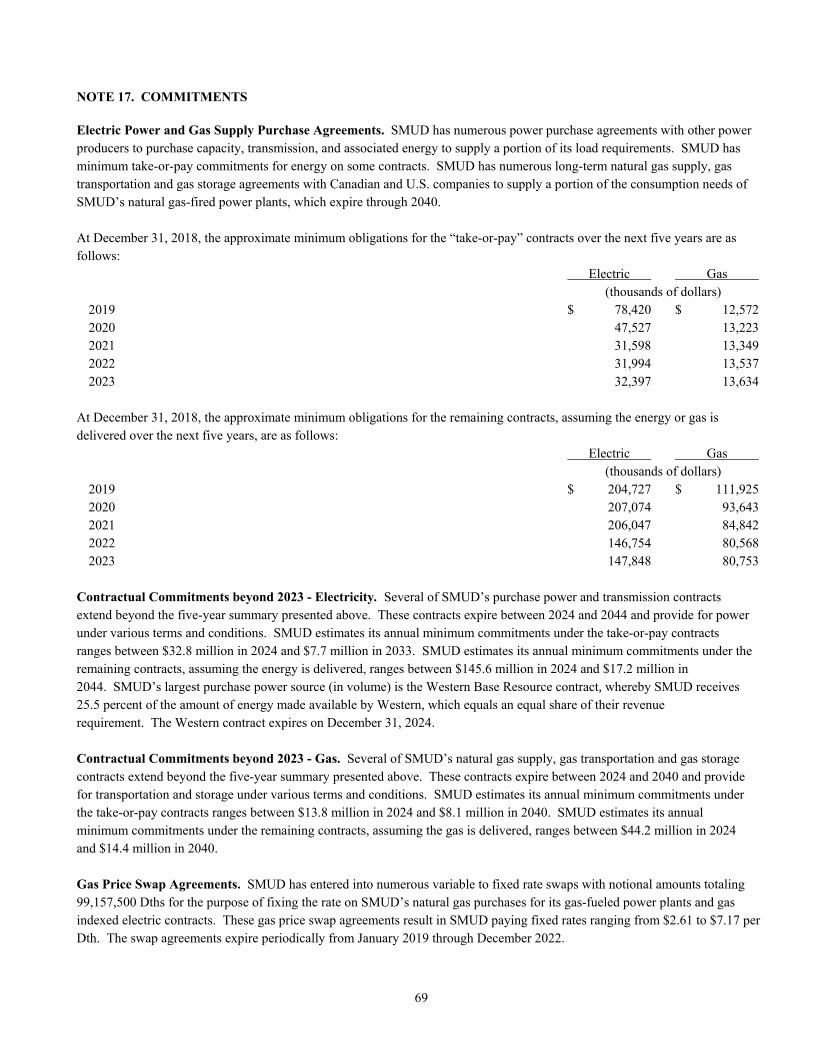
69
NOTE 17. COMMITMENTS Electric Power and Gas Supply Purchase Agreements. SMUD has numerous power purchase agreements with other power producers to purchase capacity, transmission, and associated energy to supply a portion of its load requirements. SMUD has minimum take-or-pay commitments for energy on some contracts. SMUD has numerous long-term natural gas supply, gas transportation and gas storage agreements with Canadian and U.S. companies to supply a portion of the consumption needs of SMUD’s natural gas-fired power plants, which expire through 2040. At December 31, 2018, the approximate minimum obligations for the “take-or-pay” contracts over the next five years are as follows: Electric Gas (thousands of dollars) 2019 $ 78,420 $ 12,572 2020 47,527 13,223 2021 31,598 13,349 2022 31,994 13,537 2023 32,397 13,634 At December 31, 2018, the approximate minimum obligations for the remaining contracts, assuming the energy or gas is delivered over the next five years, are as follows: Electric Gas (thousands of dollars) 2019 $ 204,727 $ 111,925 2020 207,074 93,643 2021 206,047 84,842 2022 146,754 80,568 2023 147,848 80,753 Contractual Commitments beyond 2023 - Electricity. Several of SMUD’s purchase power and transmission contracts extend beyond the five-year summary presented above. These contracts expire between 2024 and 2044 and provide for power under various terms and conditions. SMUD estimates its annual minimum commitments under the take-or-pay contracts ranges between $32.8 million in 2024 and $7.7 million in 2033. SMUD estimates its annual minimum commitments under the remaining contracts, assuming the energy is delivered, ranges between $145.6 million in 2024 and $17.2 million in 2044. SMUD’s largest purchase power source (in volume) is the Western Base Resource contract, whereby SMUD receives 25.5 percent of the amount of energy made available by Western, which equals an equal share of their revenue requirement. The Western contract expires on December 31, 2024. Contractual Commitments beyond 2023 - Gas. Several of SMUD’s natural gas supply, gas transportation and gas storage contracts extend beyond the five-year summary presented above. These contracts expire between 2024 and 2040 and provide for transportation and storage under various terms and conditions. SMUD estimates its annual minimum commitments under the take-or-pay contracts ranges between $13.8 million in 2024 and $8.1 million in 2040. SMUD estimates its annual minimum commitments under the remaining contracts, assuming the gas is delivered, ranges between $44.2 million in 2024 and $14.4 million in 2040. Gas Price Swap Agreements. SMUD has entered into numerous variable to fixed rate swaps with notional amounts totaling 99,157,500 Dths for the purpose of fixing the rate on SMUD’s natural gas purchases for its gas-fueled power plants and gas indexed electric contracts. These gas price swap agreements result in SMUD paying fixed rates ranging from $2.61 to $7.17 per Dth. The swap agreements expire periodically from January 2019 through December 2022.
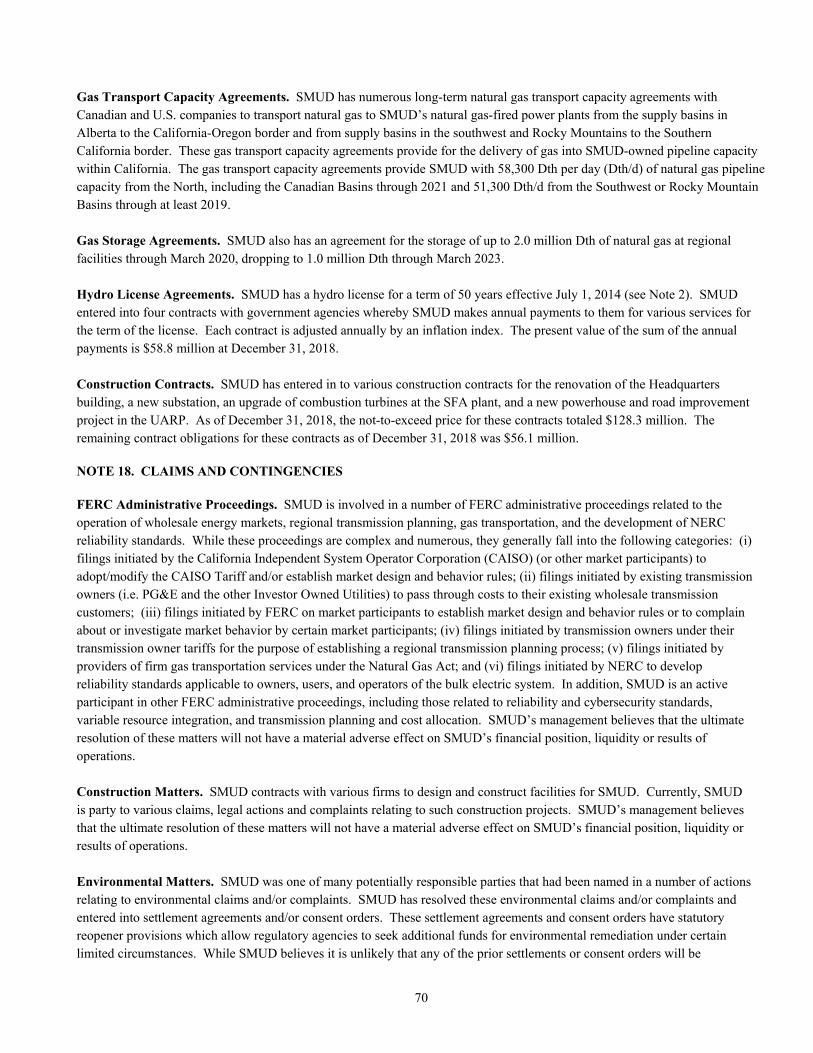
70
Gas Transport Capacity Agreements. SMUD has numerous long-term natural gas transport capacity agreements with Canadian and U.S. companies to transport natural gas to SMUD’s natural gas-fired power plants from the supply basins in Alberta to the California-Oregon border and from supply basins in the southwest and Rocky Mountains to the Southern California border. These gas transport capacity agreements provide for the delivery of gas into SMUD-owned pipeline capacity within California. The gas transport capacity agreements provide SMUD with 58,300 Dth per day (Dth/d) of natural gas pipeline capacity from the North, including the Canadian Basins through 2021 and 51,300 Dth/d from the Southwest or Rocky Mountain Basins through at least 2019. Gas Storage Agreements. SMUD also has an agreement for the storage of up to 2.0 million Dth of natural gas at regional facilities through March 2020, dropping to 1.0 million Dth through March 2023. Hydro License Agreements. SMUD has a hydro license for a term of 50 years effective July 1, 2014 (see Note 2). SMUD entered into four contracts with government agencies whereby SMUD makes annual payments to them for various services for the term of the license. Each contract is adjusted annually by an inflation index. The present value of the sum of the annual payments is $58.8 million at December 31, 2018. Construction Contracts. SMUD has entered in to various construction contracts for the renovation of the Headquarters building, a new substation, an upgrade of combustion turbines at the SFA plant, and a new powerhouse and road improvement project in the UARP. As of December 31, 2018, the not-to-exceed price for these contracts totaled $128.3 million. The remaining contract obligations for these contracts as of December 31, 2018 was $56.1 million. NOTE 18. CLAIMS AND CONTINGENCIES FERC Administrative Proceedings. SMUD is involved in a number of FERC administrative proceedings related to the operation of wholesale energy markets, regional transmission planning, gas transportation, and the development of NERC reliability standards. While these proceedings are complex and numerous, they generally fall into the following categories: (i) filings initiated by the California Independent System Operator Corporation (CAISO) (or other market participants) to adopt/modify the CAISO Tariff and/or establish market design and behavior rules; (ii) filings initiated by existing transmission owners (i.e. PG&E and the other Investor Owned Utilities) to pass through costs to their existing wholesale transmission customers; (iii) filings initiated by FERC on market participants to establish market design and behavior rules or to complain about or investigate market behavior by certain market participants; (iv) filings initiated by transmission owners under their transmission owner tariffs for the purpose of establishing a regional transmission planning process; (v) filings initiated by providers of firm gas transportation services under the Natural Gas Act; and (vi) filings initiated by NERC to develop reliability standards applicable to owners, users, and operators of the bulk electric system. In addition, SMUD is an active participant in other FERC administrative proceedings, including those related to reliability and cybersecurity standards, variable resource integration, and transmission planning and cost allocation. SMUD’s management believes that the ultimate resolution of these matters will not have a material adverse effect on SMUD’s financial position, liquidity or results of operations. Construction Matters. SMUD contracts with various firms to design and construct facilities for SMUD. Currently, SMUD is party to various claims, legal actions and complaints relating to such construction projects. SMUD’s management believes that the ultimate resolution of these matters will not have a material adverse effect on SMUD’s financial position, liquidity or results of operations. Environmental Matters. SMUD was one of many potentially responsible parties that had been named in a number of actions relating to environmental claims and/or complaints. SMUD has resolved these environmental claims and/or complaints and entered into settlement agreements and/or consent orders. These settlement agreements and consent orders have statutory reopener provisions which allow regulatory agencies to seek additional funds for environmental remediation under certain limited circumstances. While SMUD believes it is unlikely that any of the prior settlements or consent orders will be
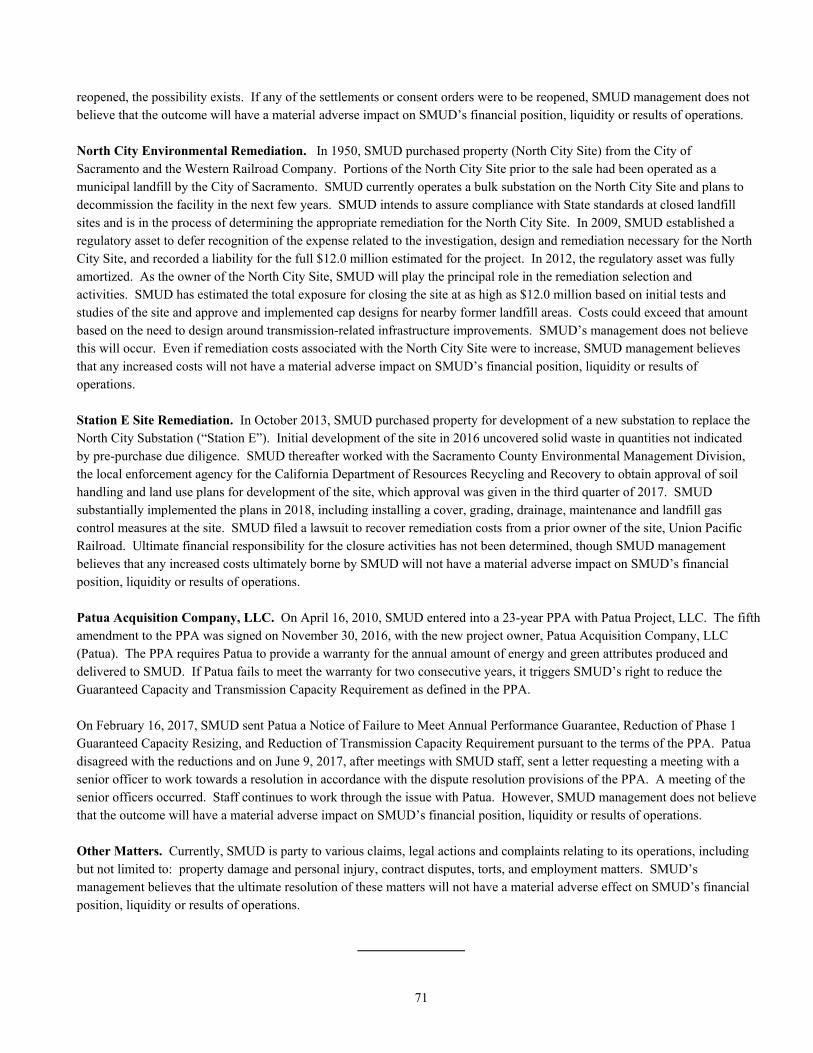
71
reopened, the possibility exists. If any of the settlements or consent orders were to be reopened, SMUD management does not believe that the outcome will have a material adverse impact on SMUD’s financial position, liquidity or results of operations. North City Environmental Remediation. In 1950, SMUD purchased property (North City Site) from the City of Sacramento and the Western Railroad Company. Portions of the North City Site prior to the sale had been operated as a municipal landfill by the City of Sacramento. SMUD currently operates a bulk substation on the North City Site and plans to decommission the facility in the next few years. SMUD intends to assure compliance with State standards at closed landfill sites and is in the process of determining the appropriate remediation for the North City Site. In 2009, SMUD established a regulatory asset to defer recognition of the expense related to the investigation, design and remediation necessary for the North City Site, and recorded a liability for the full $12.0 million estimated for the project. In 2012, the regulatory asset was fully amortized. As the owner of the North City Site, SMUD will play the principal role in the remediation selection and activities. SMUD has estimated the total exposure for closing the site at as high as $12.0 million based on initial tests and studies of the site and approve and implemented cap designs for nearby former landfill areas. Costs could exceed that amount based on the need to design around transmission-related infrastructure improvements. SMUD’s management does not believe this will occur. Even if remediation costs associated with the North City Site were to increase, SMUD management believes that any increased costs will not have a material adverse impact on SMUD’s financial position, liquidity or results of operations. Station E Site Remediation. In October 2013, SMUD purchased property for development of a new substation to replace the North City Substation (“Station E”). Initial development of the site in 2016 uncovered solid waste in quantities not indicated by pre-purchase due diligence. SMUD thereafter worked with the Sacramento County Environmental Management Division, the local enforcement agency for the California Department of Resources Recycling and Recovery to obtain approval of soil handling and land use plans for development of the site, which approval was given in the third quarter of 2017. SMUD substantially implemented the plans in 2018, including installing a cover, grading, drainage, maintenance and landfill gas control measures at the site. SMUD filed a lawsuit to recover remediation costs from a prior owner of the site, Union Pacific Railroad. Ultimate financial responsibility for the closure activities has not been determined, though SMUD management believes that any increased costs ultimately borne by SMUD will not have a material adverse impact on SMUD’s financial position, liquidity or results of operations. Patua Acquisition Company, LLC. On April 16, 2010, SMUD entered into a 23-year PPA with Patua Project, LLC. The fifth amendment to the PPA was signed on November 30, 2016, with the new project owner, Patua Acquisition Company, LLC (Patua). The PPA requires Patua to provide a warranty for the annual amount of energy and green attributes produced and delivered to SMUD. If Patua fails to meet the warranty for two consecutive years, it triggers SMUD’s right to reduce the Guaranteed Capacity and Transmission Capacity Requirement as defined in the PPA. On February 16, 2017, SMUD sent Patua a Notice of Failure to Meet Annual Performance Guarantee, Reduction of Phase 1 Guaranteed Capacity Resizing, and Reduction of Transmission Capacity Requirement pursuant to the terms of the PPA. Patua disagreed with the reductions and on June 9, 2017, after meetings with SMUD staff, sent a letter requesting a meeting with a senior officer to work towards a resolution in accordance with the dispute resolution provisions of the PPA. A meeting of the senior officers occurred. Staff continues to work through the issue with Patua. However, SMUD management does not believe that the outcome will have a material adverse impact on SMUD’s financial position, liquidity or results of operations. Other Matters. Currently, SMUD is party to various claims, legal actions and complaints relating to its operations, including but not limited to: property damage and personal injury, contract disputes, torts, and employment matters. SMUD’s management believes that the ultimate resolution of these matters will not have a material adverse effect on SMUD’s financial position, liquidity or results of operations.
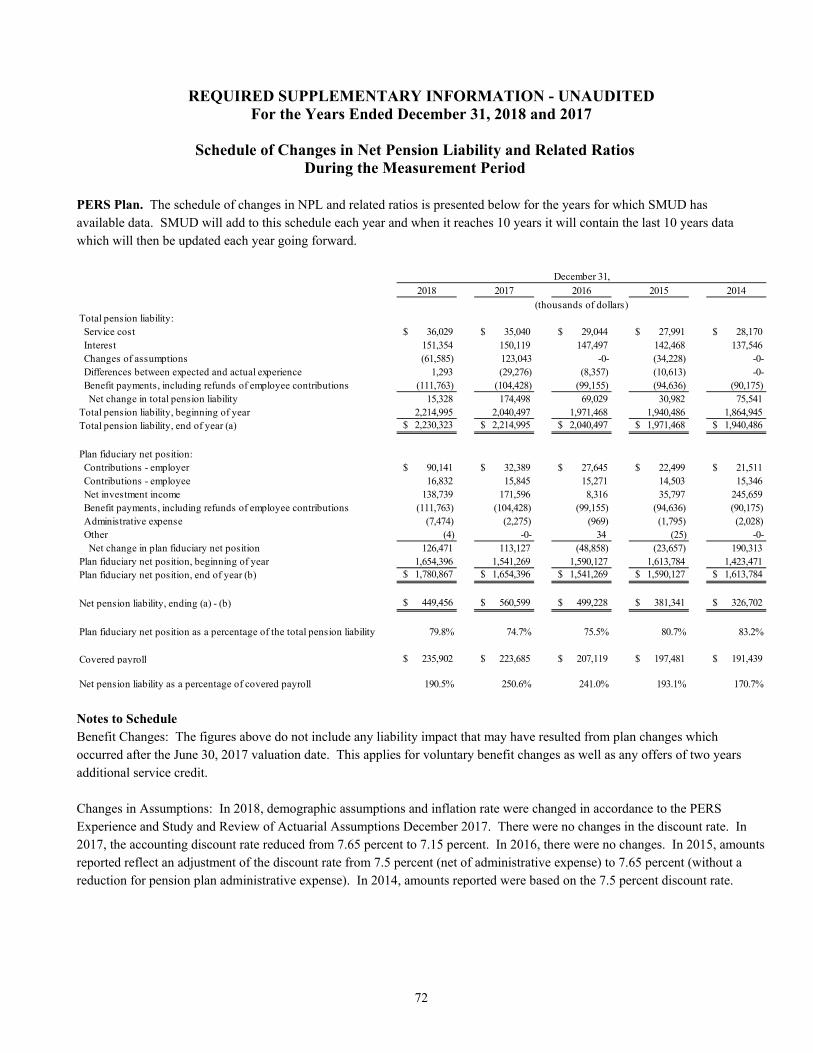
72
REQUIRED SUPPLEMENTARY INFORMATION - UNAUDITED For the Years Ended December 31, 2018 and 2017
Schedule of Changes in Net Pension Liability and Related Ratios
During the Measurement Period PERS Plan. The schedule of changes in NPL and related ratios is presented below for the years for which SMUD has available data. SMUD will add to this schedule each year and when it reaches 10 years it will contain the last 10 years data which will then be updated each year going forward.
Notes to Schedule Benefit Changes: The figures above do not include any liability impact that may have resulted from plan changes which occurred after the June 30, 2017 valuation date. This applies for voluntary benefit changes as well as any offers of two years additional service credit. Changes in Assumptions: In 2018, demographic assumptions and inflation rate were changed in accordance to the PERS Experience and Study and Review of Actuarial Assumptions December 2017. There were no changes in the discount rate. In 2017, the accounting discount rate reduced from 7.65 percent to 7.15 percent. In 2016, there were no changes. In 2015, amounts reported reflect an adjustment of the discount rate from 7.5 percent (net of administrative expense) to 7.65 percent (without a reduction for pension plan administrative expense). In 2014, amounts reported were based on the 7.5 percent discount rate.
2018 2017 2016 2015 2014
Total pension liability: Service cost $ 36,029 $ 35,040 $ 29,044 $ 27,991 $ 28,170 Interest 151,354 150,119 147,497 142,468 137,546 Changes of assumptions (61,585) 123,043 -0- (34,228) -0- Differences between expected and actual experience 1,293 (29,276) (8,357) (10,613) -0- Benefit payments, including refunds of employee contributions (111,763) (104,428) (99,155) (94,636) (90,175) Net change in total pension liability 15,328 174,498 69,029 30,982 75,541 Total pension liability, beginning of year 2,214,995 2,040,497 1,971,468 1,940,486 1,864,945 Total pension liability, end of year (a) $ 2,230,323 $ 2,214,995 $ 2,040,497 $ 1,971,468 $ 1,940,486
Plan fiduciary net position: Contributions - employer $ 90,141 $ 32,389 $ 27,645 $ 22,499 $ 21,511 Contributions - employee 16,832 15,845 15,271 14,503 15,346 Net investment income 138,739 171,596 8,316 35,797 245,659 Benefit payments, including refunds of employee contributions (111,763) (104,428) (99,155) (94,636) (90,175) Administrative expense (7,474) (2,275) (969) (1,795) (2,028) Other (4) -0- 34 (25) -0- Net change in plan fiduciary net position 126,471 113,127 (48,858) (23,657) 190,313 Plan fiduciary net position, beginning of year 1,654,396 1,541,269 1,590,127 1,613,784 1,423,471 Plan fiduciary net position, end of year (b) $ 1,780,867 $ 1,654,396 $ 1,541,269 $ 1,590,127 $ 1,613,784
Net pension liability, ending (a) - (b) $ 449,456 $ 560,599 $ 499,228 $ 381,341 $ 326,702
Plan fiduciary net position as a percentage of the total pension liability 79.8% 74.7% 75.5% 80.7% 83.2%
Covered payroll $ 235,902 $ 223,685 $ 207,119 $ 197,481 $ 191,439
Net pension liability as a percentage of covered payroll 190.5% 250.6% 241.0% 193.1% 170.7%
December 31,
(thousands of dollars)
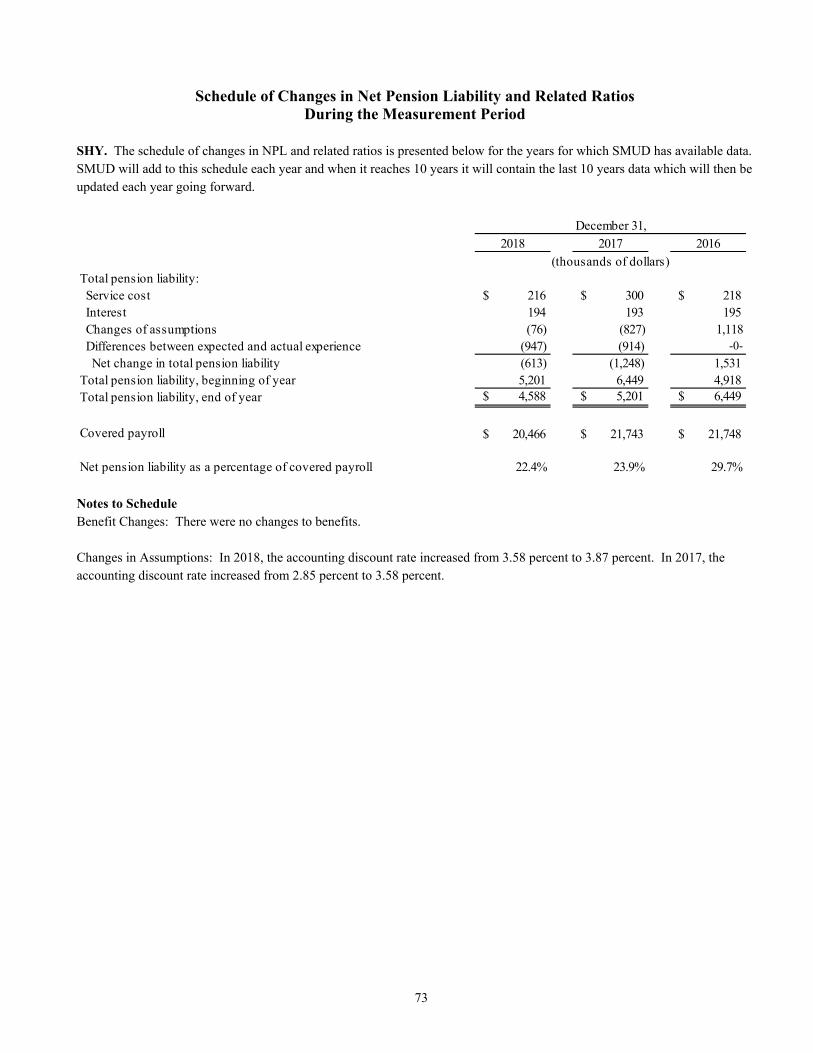
73
Schedule of Changes in Net Pension Liability and Related Ratios During the Measurement Period
SHY. The schedule of changes in NPL and related ratios is presented below for the years for which SMUD has available data. SMUD will add to this schedule each year and when it reaches 10 years it will contain the last 10 years data which will then be updated each year going forward.
Notes to Schedule Benefit Changes: There were no changes to benefits. Changes in Assumptions: In 2018, the accounting discount rate increased from 3.58 percent to 3.87 percent. In 2017, the accounting discount rate increased from 2.85 percent to 3.58 percent.
2018 2017 2016
Total pension liability: Service cost $ 216 $ 300 $ 218 Interest 194 193 195 Changes of assumptions (76) (827) 1,118 Differences between expected and actual experience (947) (914) -0-
Net change in total pension liability (613) (1,248) 1,531 Total pension liability, beginning of year 5,201 6,449 4,918 Total pension liability, end of year $ 4,588 $ 5,201 $ 6,449
Covered payroll $ 20,466 $ 21,743 $ 21,748
Net pension liability as a percentage of covered payroll 22.4% 23.9% 29.7%
December 31,
(thousands of dollars)
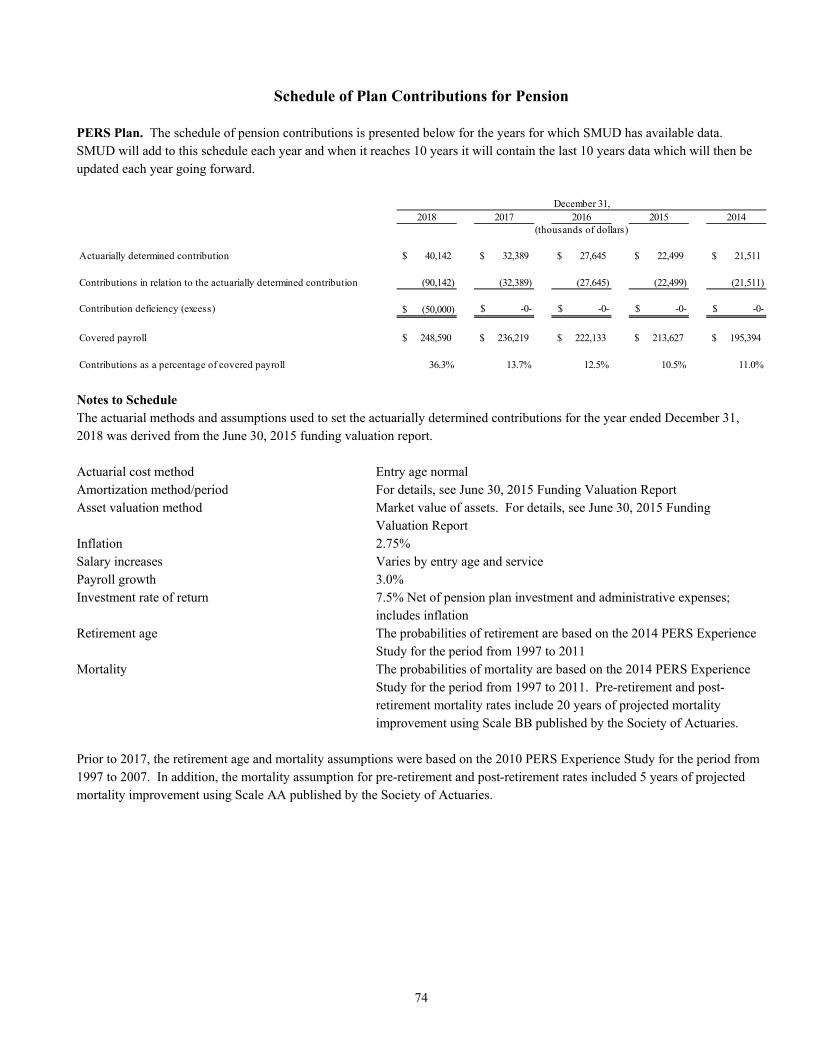
74
Schedule of Plan Contributions for Pension PERS Plan. The schedule of pension contributions is presented below for the years for which SMUD has available data. SMUD will add to this schedule each year and when it reaches 10 years it will contain the last 10 years data which will then be updated each year going forward.
Notes to Schedule The actuarial methods and assumptions used to set the actuarially determined contributions for the year ended December 31, 2018 was derived from the June 30, 2015 funding valuation report. Actuarial cost method Entry age normal Amortization method/period For details, see June 30, 2015 Funding Valuation Report Asset valuation method Market value of assets. For details, see June 30, 2015 Funding
Valuation Report Inflation 2.75% Salary increases Varies by entry age and service Payroll growth 3.0% Investment rate of return 7.5% Net of pension plan investment and administrative expenses;
includes inflation Retirement age The probabilities of retirement are based on the 2014 PERS Experience
Study for the period from 1997 to 2011 Mortality The probabilities of mortality are based on the 2014 PERS Experience
Study for the period from 1997 to 2011. Pre-retirement and post-retirement mortality rates include 20 years of projected mortality improvement using Scale BB published by the Society of Actuaries.
Prior to 2017, the retirement age and mortality assumptions were based on the 2010 PERS Experience Study for the period from 1997 to 2007. In addition, the mortality assumption for pre-retirement and post-retirement rates included 5 years of projected mortality improvement using Scale AA published by the Society of Actuaries.
2018 2017 2016 2015 2014
Actuarially determined contribution 40,142$ 32,389$ 27,645$ 22,499$ 21,511$
Contributions in relation to the actuarially determined contribution (90,142) (32,389) (27,645) (22,499) (21,511)
Contribution deficiency (excess) (50,000)$ $ -0- $ -0- $ -0- $ -0-
Covered payroll 248,590$ 236,219$ 222,133$ 213,627$ 195,394$
Contributions as a percentage of covered payroll 36.3% 13.7% 12.5% 10.5% 11.0%
December 31,
(thousands of dollars)
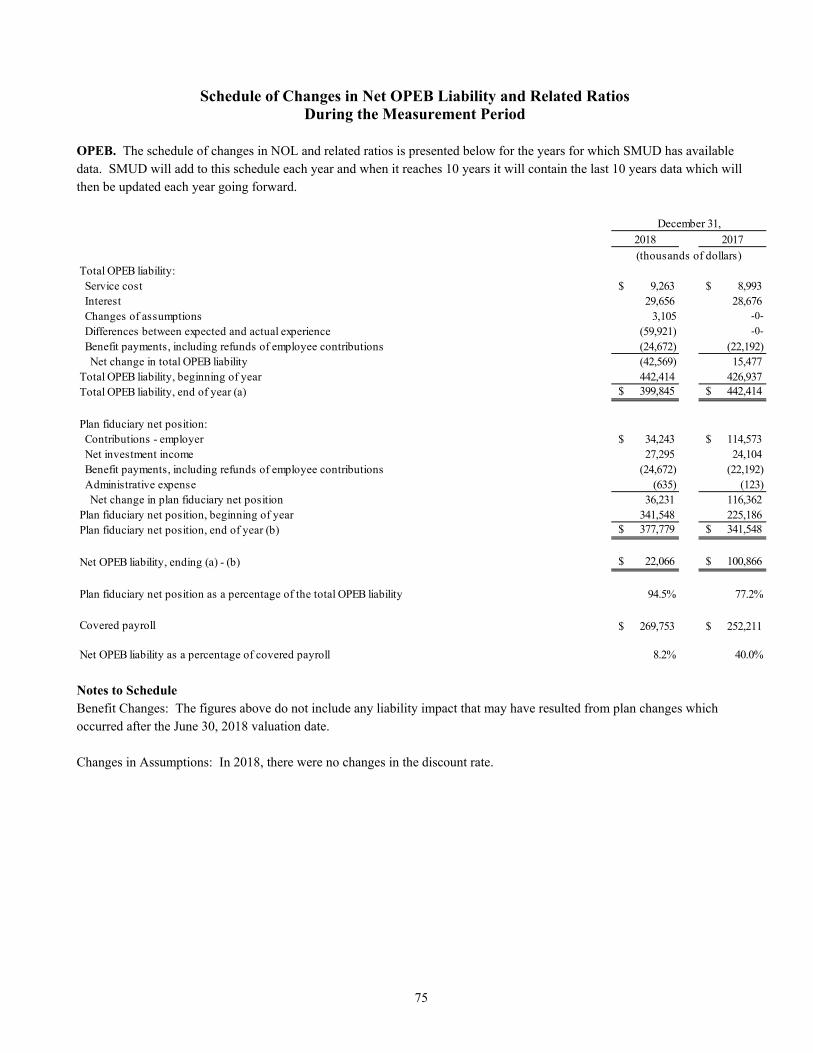
75
Schedule of Changes in Net OPEB Liability and Related Ratios During the Measurement Period
OPEB. The schedule of changes in NOL and related ratios is presented below for the years for which SMUD has available data. SMUD will add to this schedule each year and when it reaches 10 years it will contain the last 10 years data which will then be updated each year going forward.
Notes to Schedule Benefit Changes: The figures above do not include any liability impact that may have resulted from plan changes which occurred after the June 30, 2018 valuation date. Changes in Assumptions: In 2018, there were no changes in the discount rate.
2018 2017
Total OPEB liability: Service cost $ 9,263 $ 8,993 Interest 29,656 28,676 Changes of assumptions 3,105 -0-
Differences between expected and actual experience (59,921) -0-
Benefit payments, including refunds of employee contributions (24,672) (22,192) Net change in total OPEB liability (42,569) 15,477 Total OPEB liability, beginning of year 442,414 426,937 Total OPEB liability, end of year (a) $ 399,845 $ 442,414
Plan fiduciary net position: Contributions - employer $ 34,243 $ 114,573 Net investment income 27,295 24,104 Benefit payments, including refunds of employee contributions (24,672) (22,192) Administrative expense (635) (123) Net change in plan fiduciary net position 36,231 116,362 Plan fiduciary net position, beginning of year 341,548 225,186 Plan fiduciary net position, end of year (b) $ 377,779 $ 341,548
Net OPEB liability, ending (a) - (b) $ 22,066 $ 100,866
Plan fiduciary net position as a percentage of the total OPEB liability 94.5% 77.2%
Covered payroll $ 269,753 $ 252,211
Net OPEB liability as a percentage of covered payroll 8.2% 40.0%
December 31,
(thousands of dollars)
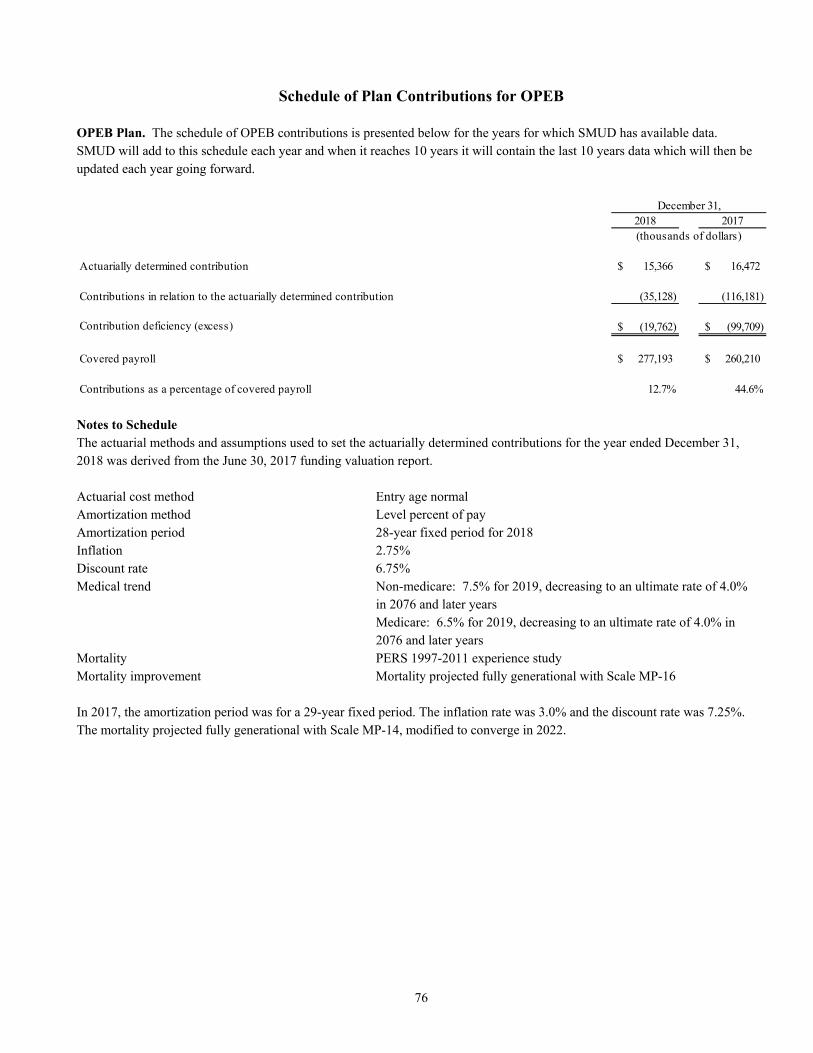
76
Schedule of Plan Contributions for OPEB
OPEB Plan. The schedule of OPEB contributions is presented below for the years for which SMUD has available data. SMUD will add to this schedule each year and when it reaches 10 years it will contain the last 10 years data which will then be updated each year going forward.
Notes to Schedule The actuarial methods and assumptions used to set the actuarially determined contributions for the year ended December 31, 2018 was derived from the June 30, 2017 funding valuation report. Actuarial cost method Entry age normal Amortization method Level percent of pay Amortization period 28-year fixed period for 2018 Inflation 2.75% Discount rate 6.75% Medical trend Non-medicare: 7.5% for 2019, decreasing to an ultimate rate of 4.0%
in 2076 and later years Medicare: 6.5% for 2019, decreasing to an ultimate rate of 4.0% in
2076 and later years Mortality PERS 1997-2011 experience study Mortality improvement Mortality projected fully generational with Scale MP-16 In 2017, the amortization period was for a 29-year fixed period. The inflation rate was 3.0% and the discount rate was 7.25%. The mortality projected fully generational with Scale MP-14, modified to converge in 2022.
2018 2017
Actuarially determined contribution 15,366$ 16,472$
Contributions in relation to the actuarially determined contribution (35,128) (116,181)
Contribution deficiency (excess) (19,762)$ (99,709)$
Covered payroll 277,193$ 260,210$
Contributions as a percentage of covered payroll 12.7% 44.6%
December 31,
(thousands of dollars)
Appendix I 132
Appendix I NERA Marginal Cost Study Review Letter – NEM 2.0 Proposal

THIS PAGE INTENTIONALLY LEFT BLANK
Kurt Strunk Director NERA Economic Consulting 1166 Avenue of the Americas 29th Floor New York, NY 10036 212 345 5023 [email protected]
18 March 2019
Planning, Pricing and Enterprise Performance Department Sacramento Municipal Utility District 6301 S Street, Mailstop A451 Sacramento, CA 95817-1899
Review of Staff Proposal for NEM 2.0 and NBC
Dear Pricing Staff,
Sacramento Municipal Utility District (SMUD) engaged Kurt Strunk and Willis Geffert, of NERA Economic Consulting, to provide an independent review of SMUD’s proposed successor tariff to its current Net Energy Metering (NEM) tariff. The successor tariff is known as NEM 2.0 (the previous arrangement was NEM 1.0). Specifically, we reviewed SMUD’s proposal for a Grid Access Charge – a per kW charge that SMUD would charge to customers with new distributed photovoltaic solar facilities.1 Our review encompassed an assessment of non-bypassable charges that are used in the Grid Access Charge calculation. Our remit was to assess whether SMUD’s proposed methodology aligns with marginal cost principles and reflects reasonable business decisions by SMUD, considering customer experience, in particular.
We reviewed summary documents about NEM 2.0 provided by SMUD and had multiple conversations with SMUD staff about NEM 2.0 and the NBC. We requested and received clarification on all questions arising from our review. While we reviewed the NEM 2.0 methodology in detail and reviewed SMUD’s calculations at a high level, we did not audit the input data and did not perform a comprehensive review of SMUD’s calculations.
Key Findings
Based upon our review, we conclude the following:
1. SMUD’s methodology to calculate NBCs is based on widely accepted marginal cost principles used in electric utility ratemaking. Under NEM 2.0 (as under NEM 1.0), a customer’s solar generation reduces its consumption of electricity. The reduction in electricity consumption in turn leads to savings on a customer’s bill based on the customer’s per kWh energy charge.2 However, a portion of SMUD’s per kWh rates compensates SMUD for costs that are fixed regardless of how much solar generation a
1 Under the current NEM 1.0 arrangement, SMUD will grandfather its existing customers with solar facilities. It has been
common in the U.S. for utilities to grandfather existing customers when utilities change from a prior to a new NEM regime. 2 In practice, SMUD has per kWh charges that vary across different time of day rate periods. SMUD’s calculation of NBCs
reflects these different periods.
Page 2 18 March 2019 Review of Staff Proposal for NEM 2.0 and NBC
© NERA Economic Consulting
customer has. The NBC is designed, in line with marginal cost principles, to collect these fixed costs from customers with solar facilities.
2. SMUD’s per kWh rates reflect several categories of costs incurred by SMUD to serve customers. SMUD made reasonable choices regarding which cost categories to include when calculating the NBCs.
3. SMUD proposes to charge customers using a Grid Access Charge, where customers are charged based on the kW size of each customer’s solar facility.3 Yet, the underlying rates that form the basis of the Grid Access Charge are per kWh identified non-bypassable cost components by time period. SMUD therefore needs to transform those non-bypassable cost components into per kW rates. This is done with an assumption of the number of hours in the year that facilities generate.4 Multiplying the per kWh amount by that number of hours results in the Grid Access Charge.5 SMUD’s NBC methodology utilizes reasonable and conservative assumptions to determine the assumed number of hours to calculate the Grid Access Charge. The methodology is conservative because SMUD could have made different yet still reasonable assumptions that would have led to a higher Grid Access Charge.
4. SMUD’s methodology reasonably considers customer experience when determining a Grid Access Charge. For example, SMUD has decided to publish in advance the Grid Access Charges for residential and non-residential customers through 2025. This provides certainty to customers about future Grid Access Charges for six years (the charges start in 2020), so customers can make more informed decisions about investments in distributed solar. Appropriately, SMUD proposes to determine Grid Access Charges for commercial customers for all years initially fixed (2020 to 2025) based on the per kWh rate structure in the end-year of SMUD’s commercial rates restructuring process (that end year being 2028). We note that doing otherwise could harm the customer experience.6 In addition, SMUD’s proposed Grid Access Charges are rounded to simplify the customer experience. For commercial customers, SMUD proposes to unify the NBCs across customer classes based on the voltage level of their service, considering secondary-voltage, primary-voltage, and sub-transmission-service customers (and with the rate class with the smallest general service commercial customers also having its own NBC). This
3 Specifically, each rate class will have its own NBC, based on the fixed costs contained within each rate class’s per kWh rates. 4 Specifically, it is the number of hours weighted by how much is generated in each hour. Generating for an hour at half of a
facilities maximum power output counts as half an hour. In electricity parlance, SMUD must use a capacity factor to translate from a per kWh charge to a Grid Access Charge.
5 As a final step, SMUD divides an annual per kW charge by 12 to arrive at a monthly Grid Access Charge. SMUD will bill the NBC to customers on a monthly basis.
6 Generally speaking, the commercial rate restructure will result in lower per kWh charges and higher fixed charges (with no overall rate impact). If SMUD instead based commercial customers’ NBCs on each year’s rate structure during the transition, then the early years would have higher NBCs that are out of line with the price signals SMUD proposes to target for the commercial class.
Page 3 18 March 2019 Review of Staff Proposal for NEM 2.0 and NBC
© NERA Economic Consulting
is also a reasonable choice for customer experience given the similarity of customers in those groupings. Residential customers will also have a unified NBC.
Sincerely,
Kurt Strunk Director
Willis Geffert Senior Consultant
Appendix II 133
Appendix II NERA Marginal Cost Study Review Letter – Commercial Restructure

THIS PAGE INTENTIONALLY LEFT BLANK

Kurt Strunk Director NERA Economic Consulting 1166 Avenue of the Americas 29th Floor New York, NY 10036 212 345 5023 [email protected]
18 March 2019
Planning, Pricing and Enterprise Performance Department Sacramento Municipal Utility District 6301 S Street, Mailstop A451 Sacramento, CA 95817-1899
Review of Staff Proposal for Commercial Rate Restructure Design
Dear Pricing Staff,
The Sacramento Municipal Utility District (SMUD) engaged Kurt Strunk and Willis Geffert, of NERA Economic Consulting (NERA), to provide an independent review of SMUD’s proposed commercial rate restructure design. Our remit was to assess whether SMUD’s commercial rate restructuring design aligns with marginal cost principles and reflects reasonable business decisions by SMUD, considering customer experience, in particular.
We reviewed summary documents about the Commercial Rate Restructure Design provided by SMUD and had multiple conversations with SMUD staff about the restructuring proposal. We requested and received clarification on any questions arising from our review. While we reviewed the proposed commercial rate restructure design in detail and reviewed SMUD’s calculations at a high level, we did not audit the input data and did not perform a comprehensive review of SMUD’s calculations.
Key Findings
Based upon our review, we conclude the following:
1. SMUD’s proposed restructuring of commercial rates is based on widely accepted marginal cost principles used in electric utility ratemaking. Specifically, with the restructuring, SMUD’s commercial rates will more closely align with SMUD’s marginal costs. Economic theory demonstrates that basing rates on marginal costs sends economically efficient price signals to customers, which support a more efficient use of society’s resources.
2. SMUD’s restructuring unifies the rate components that SMUD charges to different customer classes. Each rate class will have fixed monthly customer charges (SMUD’s System Infrastructure Fixed Charge), energy charges, a peak demand charge (SMUD’s Site Infrastructure Charge) and a summer peak demand charge, although the class for SMUD’s smallest general service commercial customers will not have a summer peak demand charge even after the restructuring. SMUD’s effort to transition to a uniform rate structure for commercial classes is appropriate and reasonable and has the following benefits: a) allows easier comparisons between different rate classes; b) makes it easier to
Page 2 18 March 2019 Review of Staff Proposal for Commercial Rate Restructure Design
© NERA Economic Consulting
prevent “rate cliffs” as a customer transitions from one class to another; and c) gives SMUD more ability to align its rates with its marginal costs.1
3. SMUD’s restructuring will generally result in lower per kWh energy charges for its commercial customers, and SMUD will balance out that change with a combination of higher fixed customers charges, demand charges, and summer peak demand charges.2 On net, the proposed restructuring will not affect total charges to the different commercial rate classes. SMUD’s restructuring brings SMUD’s rates more in line with its marginal costs, where a large part of SMUD’s costs are fixed regardless of energy consumption. Thus, the restructuring will help SMUD provide more efficient price signals to customers and increase intra-class equity by charging customers in line with the costs they impose on SMUD.
4. The details of how SMUD proposes to reallocate charges to the different non-energy components reasonably reflect underlying marginal costs, and also reflect SMUD’s goals of providing quality customer experience, including consideration of bill impacts, preventing rate cliffs, and the principle of gradualism. SMUD’s marginal cost analysis shows that some of its costs vary with energy consumption, some are fixed per customer, and some vary depending on a customer’s demand. SMUD’s restructuring brings SMUD’s rates more closely in line with those different marginal cost categories.
5. SMUD proposes changes to its time of day (TOD) periods as part of its restructuring. The proposed TOD periods better align with how SMUD’s costs vary throughout the day. SMUD also strikes an appropriate balance between consistency of TOD periods on weekdays, weekends, and in summer and non-summer, on the one hand, and reflecting cost differences between those periods, on the other hand. For example, SMUD’s proposal to introduce a super-peak saver period in the non-summer (but not the summer) aligns with the reality of very low energy costs during the sunny hours in the non-summer specifically (versus the summer), due to lower consumption in the non-summer coupled with increasing generation from solar facilities.
6. In summary, the proposed commercial restructured rates offer more efficient and accurate price signals and in this way improve upon the existing commercial rate structure.
1 The one exception to a uniform rate structure – that SMUD’s smallest general service commercial customers will not have a
summer peak demand charge – is a reasonable exception as it simplifies the billing of these smallest customers. 2 Any given class may not see increases in all of those latter three non-energy rate components. However, the collective effect of
restructuring is to balance the reduction in energy rates with changes in the three non-energy rate components (namely, the fixed customers charges, demand charges, and summer peak demand charges).
Page 3 18 March 2019 Review of Staff Proposal for Commercial Rate Restructure Design
© NERA Economic Consulting
Sincerely,
Kurt Strunk Director
Willis Geffert Senior Consultant
Appendix III 134
Appendix III Expert Rate Strategy and Recommendation Opinion Letter

THIS PAGE INTENTIONALLY LEFT BLANK
P a g e | 1
March 15, 2019
Planning, Pricing and Enterprise Performance (PP&EP)
Sacramento Municipal Utility District 6301 S Street, Mailstop A451
Sacramento, CA 95817-1899
Dear PP&EP Staff,
Utility Financial Solutions (UFS) was engaged by the Sacramento Municipal Utility District (SMUD) to provide an independent review of SMUD’s 2019 Rate Proposals for Commercial customers and
proposed modifications to the Net Metering Program. UFS offered a global perspective on both the rate strategies developed by SMUD and the consistency of these strategies with industry standards
around the nation.
Documents Reviewed
In conducting our review, UFS facilitated several staff discussions regarding recommendations made
to the Board of Directors. Documents reviewed included pricing roadmap information, summary documents about commercial restructure, summary documents on revisions to the Net Energy Metering program (NEM 2) and information presented to the board, in addition to meetings and calls with staff.
Key Findings of Review:
Based upon our review, UFS concludes the following:
1. The proposed rate adjustments are required to protect the financial integrity of SMUD. Based on UFS experience, small periodic rate adjustments below 5% when needed are industry accepted best practices and protect customers from large future rate increases.
2. The methodology used to determine the NEM 2 non-bypassable charge and the cost basis to determine the Grid Access Charge in $/kW is consistent with industry standards. UFS concurs the charge is needed to properly recover costs from all customers.
3. The recommendation to apply low income discounts on the NEM 2 non-bypassable charge is a prudent approach and will minimize the impacts to SMUD’s low income customers.
4. The proposed grandfathering provision of 20 years (from the date of installation) for customers with self-generating units installed prior to 2018 is consistent with current industry practices.
5. The proposed grandfathering provision of 10 years (from the date of installation) for customers with self-generating units installed between January 1, 2018 and March 31, 2019 is
a prudent transition policy.
DocuSign Envelope ID: 962357F6-E0CB-4E96-A8F9-F033611B0F05
P a g e | 2
6. The modifications to the Commercial Site Infrastructure Charges (SIC) are needed to properly recover distribution costs from all commercial customers and prevent cost shifting to other ratepayers within the same class of service.
7. The proposed glide path on transition of commercial rates is used by most electric utilities to smooth potential rate impacts on customers within the commercial classes.
8. Implementation of Site Infrastructure Charge (demand charge) for all commercial accounts is prudent to help ensure appropriate recovery of infrastructure investments and prevent shifting costs to other ratepayers.
9. The adjustments to the Commercial System Infrastructure Fixed Charge (SIFC) will better align customer specific costs and prevent this cost from being recovered within the usage
component of the rates. This practice is consistent with industry standards.
10. The adjustments to the SPKW (Summer Super Peak Demand) charges will better align this charge with SMUD’s marginal cost of providing capacity.
11. The proposed changes to the Time of Day (TOD) rate structures will better align SMUD’s rates with the marginal costs during each time period.
12. The modifications to the Super Off Peak hours to include weekends and holidays is consistent with SMUD’s marginal costs and market prices of electricity. The proposed modification provides additional incentives to promote electrification of buildings and weekend usage of electricity.
13. SMUD’s gradual progression to cost based rates for commercial customers is both prudent and consistent with industry standards. The proposed modifications provide a balance between fairness to customers (cost based rates), rate simplicity, and minimizing customer impacts due to rate changes.
14. UFS’ opinion stands that the proposed modifications to the commercial rate structures will provide more accurate price signals, lead to more efficient use of distribution and transmission infrastructure, and incentivize customers to shift usage to lower cost time periods.
15. It is UFS’s opinion the proposed changes to the Net Energy Metering program will more fairly recover costs from future customers installing self-generation, reduce shifting costs to non-generating customers and minimize rate impacts on customers with currently installed self-generation.
Sincerely,
Mark Beauchamp, President
Utility Financial Solutions
DocuSign Envelope ID: 962357F6-E0CB-4E96-A8F9-F033611B0F05
3/17/2019
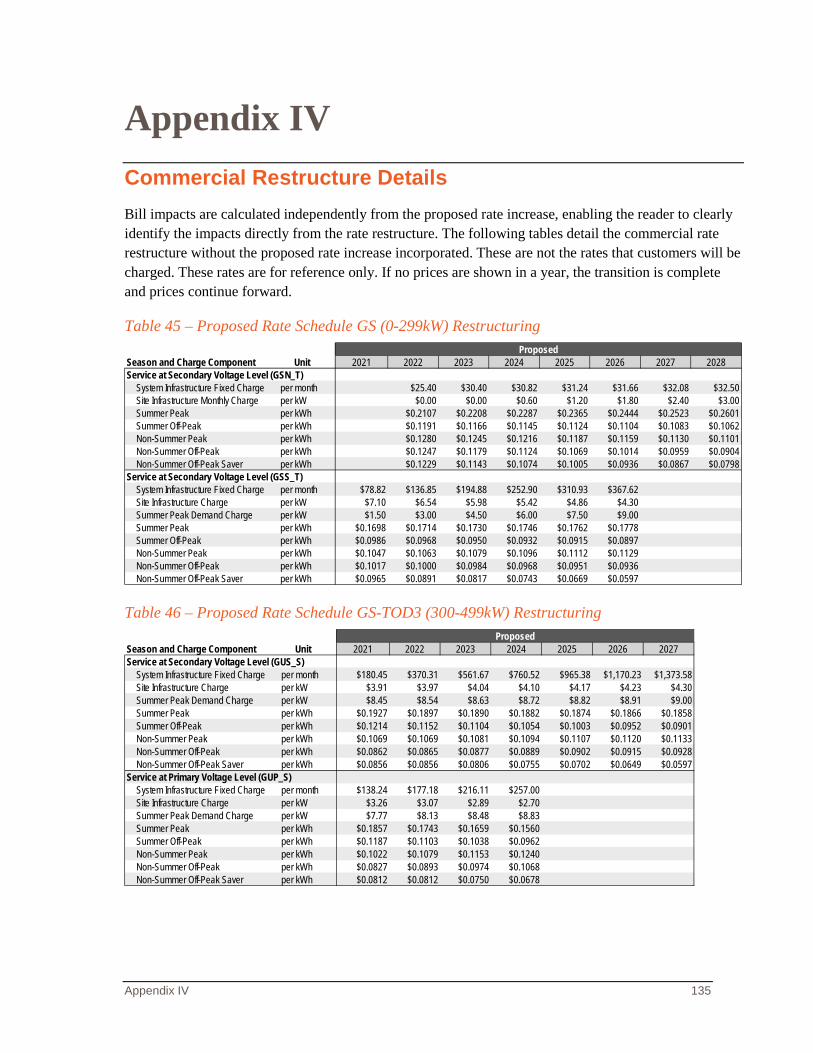
Appendix IV 135
Appendix IV Commercial Restructure Details Bill impacts are calculated independently from the proposed rate increase, enabling the reader to clearly identify the impacts directly from the rate restructure. The following tables detail the commercial rate restructure without the proposed rate increase incorporated. These are not the rates that customers will be charged. These rates are for reference only. If no prices are shown in a year, the transition is complete and prices continue forward.
Table 45 – Proposed Rate Schedule GS (0-299kW) Restructuring
Table 46 – Proposed Rate Schedule GS-TOD3 (300-499kW) Restructuring
Season and Charge Component Unit 2021 2022 2023 2024 2025 2026 2027 2028Service at Secondary Voltage Level (GSN_T)
System Infrastructure Fixed Charge per month $25.40 $30.40 $30.82 $31.24 $31.66 $32.08 $32.50Site Infrastructure Monthly Charge per kW $0.00 $0.00 $0.60 $1.20 $1.80 $2.40 $3.00Summer Peak per kWh $0.2107 $0.2208 $0.2287 $0.2365 $0.2444 $0.2523 $0.2601Summer Off-Peak per kWh $0.1191 $0.1166 $0.1145 $0.1124 $0.1104 $0.1083 $0.1062Non-Summer Peak per kWh $0.1280 $0.1245 $0.1216 $0.1187 $0.1159 $0.1130 $0.1101Non-Summer Off-Peak per kWh $0.1247 $0.1179 $0.1124 $0.1069 $0.1014 $0.0959 $0.0904Non-Summer Off-Peak Saver per kWh $0.1229 $0.1143 $0.1074 $0.1005 $0.0936 $0.0867 $0.0798
Service at Secondary Voltage Level (GSS_T)System Infrastructure Fixed Charge per month $78.82 $136.85 $194.88 $252.90 $310.93 $367.62Site Infrastructure Charge per kW $7.10 $6.54 $5.98 $5.42 $4.86 $4.30Summer Peak Demand Charge per kW $1.50 $3.00 $4.50 $6.00 $7.50 $9.00Summer Peak per kWh $0.1698 $0.1714 $0.1730 $0.1746 $0.1762 $0.1778Summer Off-Peak per kWh $0.0986 $0.0968 $0.0950 $0.0932 $0.0915 $0.0897Non-Summer Peak per kWh $0.1047 $0.1063 $0.1079 $0.1096 $0.1112 $0.1129Non-Summer Off-Peak per kWh $0.1017 $0.1000 $0.0984 $0.0968 $0.0951 $0.0936Non-Summer Off-Peak Saver per kWh $0.0965 $0.0891 $0.0817 $0.0743 $0.0669 $0.0597
Proposed
Season and Charge Component Unit 2021 2022 2023 2024 2025 2026 2027Service at Secondary Voltage Level (GUS_S)
System Infrastructure Fixed Charge per month $180.45 $370.31 $561.67 $760.52 $965.38 $1,170.23 $1,373.58Site Infrastructure Charge per kW $3.91 $3.97 $4.04 $4.10 $4.17 $4.23 $4.30Summer Peak Demand Charge per kW $8.45 $8.54 $8.63 $8.72 $8.82 $8.91 $9.00Summer Peak per kWh $0.1927 $0.1897 $0.1890 $0.1882 $0.1874 $0.1866 $0.1858Summer Off-Peak per kWh $0.1214 $0.1152 $0.1104 $0.1054 $0.1003 $0.0952 $0.0901Non-Summer Peak per kWh $0.1069 $0.1069 $0.1081 $0.1094 $0.1107 $0.1120 $0.1133Non-Summer Off-Peak per kWh $0.0862 $0.0865 $0.0877 $0.0889 $0.0902 $0.0915 $0.0928Non-Summer Off-Peak Saver per kWh $0.0856 $0.0856 $0.0806 $0.0755 $0.0702 $0.0649 $0.0597
Service at Primary Voltage Level (GUP_S)System Infrastructure Fixed Charge per month $138.24 $177.18 $216.11 $257.00Site Infrastructure Charge per kW $3.26 $3.07 $2.89 $2.70Summer Peak Demand Charge per kW $7.77 $8.13 $8.48 $8.83Summer Peak per kWh $0.1857 $0.1743 $0.1659 $0.1560Summer Off-Peak per kWh $0.1187 $0.1103 $0.1038 $0.0962Non-Summer Peak per kWh $0.1022 $0.1079 $0.1153 $0.1240Non-Summer Off-Peak per kWh $0.0827 $0.0893 $0.0974 $0.1068Non-Summer Off-Peak Saver per kWh $0.0812 $0.0812 $0.0750 $0.0678
Proposed
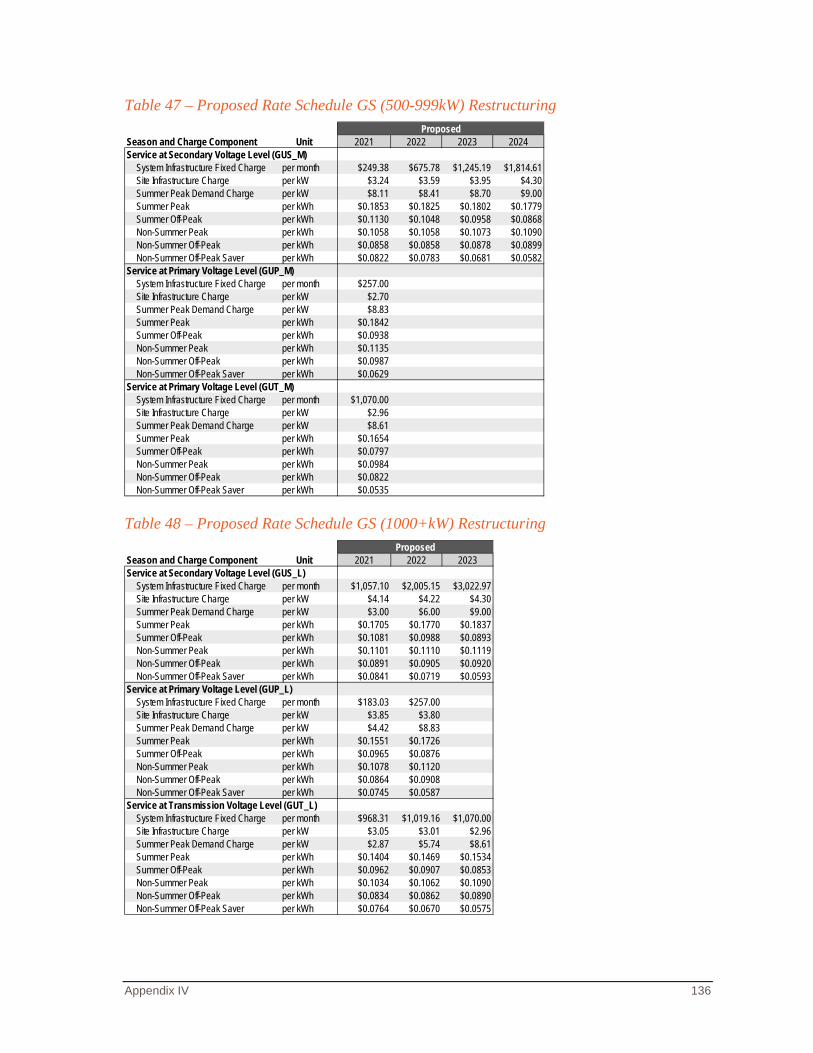
Appendix IV 136
Table 47 – Proposed Rate Schedule GS (500-999kW) Restructuring
Table 48 – Proposed Rate Schedule GS (1000+kW) Restructuring
Season and Charge Component Unit 2021 2022 2023 2024Service at Secondary Voltage Level (GUS_M)
System Infrastructure Fixed Charge per month $249.38 $675.78 $1,245.19 $1,814.61Site Infrastructure Charge per kW $3.24 $3.59 $3.95 $4.30Summer Peak Demand Charge per kW $8.11 $8.41 $8.70 $9.00Summer Peak per kWh $0.1853 $0.1825 $0.1802 $0.1779Summer Off-Peak per kWh $0.1130 $0.1048 $0.0958 $0.0868Non-Summer Peak per kWh $0.1058 $0.1058 $0.1073 $0.1090Non-Summer Off-Peak per kWh $0.0858 $0.0858 $0.0878 $0.0899Non-Summer Off-Peak Saver per kWh $0.0822 $0.0783 $0.0681 $0.0582
Service at Primary Voltage Level (GUP_M)System Infrastructure Fixed Charge per month $257.00Site Infrastructure Charge per kW $2.70Summer Peak Demand Charge per kW $8.83Summer Peak per kWh $0.1842Summer Off-Peak per kWh $0.0938Non-Summer Peak per kWh $0.1135Non-Summer Off-Peak per kWh $0.0987Non-Summer Off-Peak Saver per kWh $0.0629
Service at Primary Voltage Level (GUT_M)System Infrastructure Fixed Charge per month $1,070.00Site Infrastructure Charge per kW $2.96Summer Peak Demand Charge per kW $8.61Summer Peak per kWh $0.1654Summer Off-Peak per kWh $0.0797Non-Summer Peak per kWh $0.0984Non-Summer Off-Peak per kWh $0.0822Non-Summer Off-Peak Saver per kWh $0.0535
Proposed
Season and Charge Component Unit 2021 2022 2023Service at Secondary Voltage Level (GUS_L)
System Infrastructure Fixed Charge per month $1,057.10 $2,005.15 $3,022.97Site Infrastructure Charge per kW $4.14 $4.22 $4.30Summer Peak Demand Charge per kW $3.00 $6.00 $9.00Summer Peak per kWh $0.1705 $0.1770 $0.1837Summer Off-Peak per kWh $0.1081 $0.0988 $0.0893Non-Summer Peak per kWh $0.1101 $0.1110 $0.1119Non-Summer Off-Peak per kWh $0.0891 $0.0905 $0.0920Non-Summer Off-Peak Saver per kWh $0.0841 $0.0719 $0.0593
Service at Primary Voltage Level (GUP_L)System Infrastructure Fixed Charge per month $183.03 $257.00Site Infrastructure Charge per kW $3.85 $3.80Summer Peak Demand Charge per kW $4.42 $8.83Summer Peak per kWh $0.1551 $0.1726Summer Off-Peak per kWh $0.0965 $0.0876Non-Summer Peak per kWh $0.1078 $0.1120Non-Summer Off-Peak per kWh $0.0864 $0.0908Non-Summer Off-Peak Saver per kWh $0.0745 $0.0587
Service at Transmission Voltage Level (GUT_L)System Infrastructure Fixed Charge per month $968.31 $1,019.16 $1,070.00Site Infrastructure Charge per kW $3.05 $3.01 $2.96Summer Peak Demand Charge per kW $2.87 $5.74 $8.61Summer Peak per kWh $0.1404 $0.1469 $0.1534Summer Off-Peak per kWh $0.0962 $0.0907 $0.0853Non-Summer Peak per kWh $0.1034 $0.1062 $0.1090Non-Summer Off-Peak per kWh $0.0834 $0.0862 $0.0890Non-Summer Off-Peak Saver per kWh $0.0764 $0.0670 $0.0575
Proposed