Embed Size (px)
Citation preview
CEO Leadership Academy
Programmatic Profile and Educational Performance 2011–12 School Year Report Date: September 2012
Prepared by: Janice Ereth, PhD Susan Gramling Andrea Bogie
A nonprofit social research organization and division of the National Council on Crime and Delinquency 426 S. Yellowstone Drive, Suite 250
Madison, WI 53719 voice (800) 306-6223 fax (608) 831-6446
www.nccdglobal.org
https://sharepoint.nccdcrc.org/Projects/Project Documents/USA/Wisconsin/508WI_Milw/2011-12/CEO/CEO 2011-12 Yr 1 FINAL.docx © 2012 by NCCD, All Rights Reserved
TABLE OF CONTENTS
EXECUTIVE SUMMARY .............................................................................................................................................................. i I. INTRODUCTION .......................................................................................................................................................... 1 II. PROGRAMMATIC PROFILE ...................................................................................................................................... 2
A. Description of Philosophy of Educational Methodology ............................................................ 2 1. Mission and Philosophy ........................................................................................................... 2 2. Instructional Design .................................................................................................................. 3
B. School Structure ......................................................................................................................................... 5 1. Board of Directors ...................................................................................................................... 5
2. Areas of Instruction ................................................................................................................... 6 3. Teacher Information .................................................................................................................. 8 4. Hours of Instruction/School Calendar ................................................................................ 8 5. Parental Involvement ................................................................................................................ 9 6. Waiting List ................................................................................................................................ 11 7. Discipline Policy ....................................................................................................................... 11 8. Graduation Information ........................................................................................................ 13
C. Student Population ................................................................................................................................ 15 III. EDUCATIONAL PERFORMANCE ......................................................................................................................... 18 A. Attendance ................................................................................................................................................ 18
B. Parent-Teacher Conferences ............................................................................................................... 19 C. Special Education Student Records .................................................................................................. 19 D. High School Graduation Plan.............................................................................................................. 20 E. High School Graduation Requirements .......................................................................................... 21 F. Twelfth-Grade College Applications and Acceptance ............................................................... 22 G. Assessment for New Enrollees ........................................................................................................... 23
1. Reading ....................................................................................................................................... 23 2. Math ............................................................................................................................................. 24
H. Local Measures of Academic Performance .................................................................................... 25 1. Literacy ........................................................................................................................................ 25 2. Mathematics.............................................................................................................................. 27 3. Writing Skills .............................................................................................................................. 28 4. IEP Goals for Special Education Student Progress ....................................................... 29
I. Standardized Measures of Academic Performance .................................................................... 29 1. Standardized Tests for Ninth-Grade Students .............................................................. 32
a. Students at or Above Benchmarks on the Fall 2011 EXPLORE Subtests ................................................................................................... 34 b. Students Below Benchmarks on the Fall 2011 EXPLORE Subtests ................................................................................................... 34
https://sharepoint.nccdcrc.org/Projects/Project Documents/USA/Wisconsin/508WI_Milw/2011-12/CEO/CEO 2011-12 Yr 1 FINAL.docx © 2012 by NCCD, All Rights Reserved
TABLE OF CONTENTS (continued)
2. Standardized Tests for Tenth-Grade Students .............................................................. 36 a. PLAN ............................................................................................................................. 36
i. Students at or Above Benchmarks on the Fall 2011 PLAN Subtests ........................................................................................... 37
ii. Students Below Benchmarks on the Fall 2011 PLAN Subtests ........................................................................................... 38
b. WKCE for Tenth Graders ........................................................................................ 40 3. Standardized Tests for Eleventh or Twelfth Graders .................................................. 41
J. Multiple-Year Student Progress ......................................................................................................... 42 1. Progress From the Fall 2010 EXPLORE to the Fall 2011 PLAN ................................. 42
a. Students at or Above Benchmarks on the Fall 2010 EXPLORE Subtests ................................................................................................... 43 b. Students Below Benchmarks on the Fall 2010 EXPLORE Subtests ................................................................................................... 44
2. Progress From the PLAN to the ACT ................................................................................. 45 a. Students at or Above Benchmarks on the Fall 2009 or Fall 2010
PLAN Subtests ........................................................................................................... 46 b. Students Below Benchmarks on the Fall 2009 or Fall 2010 PLAN Subtests ........................................................................................................... 47
K. School Scorecard ..................................................................................................................................... 48 L. Annual Review of the School’s Adequate Yearly Progress ....................................................... 49
IV. SUMMARY/RECOMMENDATIONS ..................................................................................................................... 50 APPENDICES Appendix A: Contract Compliance Chart Appendix B: Outcome Measure Agreement Memo Appendix C: Trend Information Appendix D: CRC Pilot Scorecard Appendix E: Teacher Interviews Appendix F: Parent Surveys/Interviews Appendix G: Student Interviews Appendix H: Board Member Interviews
i https://sharepoint.nccdcrc.org/Projects/Project Documents/USA/Wisconsin/508WI_Milw/2011-12/CEO/CEO 2011-12 Yr 1 FINAL.docx © 2012 by NCCD, All Rights Reserved
EXECUTIVE SUMMARY for
CEO Leadership Academy 2011–12
This is the first annual report to describe the operation of the CEO Leadership Academy as a City of Milwaukee-chartered school. It is a result of intensive work undertaken by the City of Milwaukee Charter School Review Committee (CSRC), school staff, and the Children’s Research Center (CRC). Based on the information gathered and discussed in the attached report, CRC has reached the following findings. I. CONTRACT COMPLIANCE SUMMARY1
The CEO Leadership Academy (CEO) has met all of the provisions in its contract with the City of Milwaukee and the subsequent requirements of the CSRC.
II. PERFORMANCE CRITERIA A. Local Measures 1. Primary Measures of Educational Progress The CSRC requires each school to track student progress in reading, writing, mathematics, and individualized education program (IEP) goals throughout the year to identify students in need of additional help and to assist teachers in developing strategies to improve the academic performance of all students. This year, CEO’s local measures of academic progress resulted in the following outcomes. Ninth- through twelfth-grade students completed the reading and math pacing plan assessments designed by the Noble Street School in Chicago. Progress for ninth, tenth, and twelfth graders were measured from the first- to fourth-quarter assessments; progress for eleventh graders was measured from the first- to third-quarter assessments. Student writing skills were assessed by teachers in six domains and IEP goal progress was tracked for special education students.
By the time of the post-test, 59.1% of students had improved their mastery percentage
scores in literacy on the Noble Street pacing plan assessment. Forty-five (36.3%) students who completed both Noble Street pacing plan math
assessments improved their mastery percentage between fall and spring.
1 See Appendix A for a list of each education-related contract provision, page references, and a description of whether or not each provision was met.

ii https://sharepoint.nccdcrc.org/Projects/Project Documents/USA/Wisconsin/508WI_Milw/2011-12/CEO/CEO 2011-12 Yr 1 FINAL.docx © 2012 by NCCD, All Rights Reserved
The average writing score, out of six possible points, for 122 students who completed
writing samples in the spring of 2012, was 2.9%; 11.5% of students received an average score of 4 or more.
Only three students had IEPs in place for a full year; therefore, progress toward
meeting IEP goals was not required for the other 13 special education students. In order to protect student identity, results are not reported for fewer than 10 students; therefore, goal progress was not included in the report this year.
2. Secondary Measures of Educational Outcomes
To meet City of Milwaukee requirements, CEO identified measurable outcomes in the following secondary areas of academic progress:
Attendance; Parent conferences; Special education student records; Graduation plans; and Assessment of new school enrollees.2
The school met all but one of its internal goals. The school met its goals related to parent conferences, special education student records, graduation plans, and assessment of new enrollees, but did not meet the attendance goal for this year. 3. School Scorecard The school scored 59.1% on the school scorecard.
B. Year-to-Year Academic Achievement on Standardized Tests The following summarizes year-to-year achievement based on standardized test scores. EXPLORE to PLAN: Forty-one students took the EXPLORE in the fall of 2010 as ninth-grade students and the PLAN in the fall of 2011 as tenth graders. CRC examined progress for students who were at or above benchmark at the time of the fall 2010 EXPLORE.
Twelve (29.3%) of 41 students who completed the EXPLORE and PLAN were at or
above benchmark on the EXPLORE English test in the fall of 2010; 11 (91.7%) of those students remained at or above benchmark on the fall 2011 PLAN.
2 Two ninth/tenth graders enrolled at the beginning of the school year were not available during the testing times for the Accelerated Reader assessment; one student who enrolled during the second semester did not take the Accelerate d Reader or ALEKS assessment.
iii https://sharepoint.nccdcrc.org/Projects/Project Documents/USA/Wisconsin/508WI_Milw/2011-12/CEO/CEO 2011-12 Yr 1 FINAL.docx © 2012 by NCCD, All Rights Reserved
Three (7.3%) students were at or above benchmark on the fall 2010 EXPLORE math
test, three (7.3%) students at or above the reading benchmark, and four (9.8%) students at or above the composite benchmark; none of the students were at or above the EXPLORE science benchmark. In order to protect student identity, CRC does not report results for fewer than 10 students; therefore, progress for students at or above the math, reading, and composite benchmarks was not included in this report.
PLAN to ACT: Twenty-nine students took the PLAN in the fall of 2009 or 2010 as tenth-grade students and the ACT during 2011–12 as eleventh or twelfth graders. CRC examined progress for students who were at or above benchmark at the time of the PLAN. Seven (24.1%) students who completed the PLAN and ACT were at or above benchmark on the PLAN English test, two (6.9%) were at or above the math benchmark, four (13.8%) were at or above the reading benchmark, and one (3.4%) student was at or above the PLAN composite benchmark at the time of their respective fall PLAN. Due to the small N size of students at or above benchmark, CRC could not include results in this report.
IV. SURVEY/INTERVIEW RESULTS CRC conducted parent surveys and interviewed board members, teachers, and students to obtain feedback on their perceptions about the school. Some of the key results include:
Of 134 CEO families (representing 86 children) 79 (58.9%) responded to the survey. Of these,
» Most (88.6%) parents would recommend this school to other parents; and
» More than half (57.0% ) rated the school’s overall contribution to their child’s
learning as “excellent” and another 31.6% rated the school “good.”
Nine of 13 board members participated in interviews. Of these : » Two-thirds (66.6%) rated the school as “good” overall; and
» More than half (55.5%) suggested for improving the school by either hiring
“higher caliber” staff and teachers or focusing on improving the academic performance of ninth-grade students.
All seven instructional staff/classroom teachers participated in interviews. Of these:
» Six (85.7%) teachers listed the school’s progress toward becoming an excellent school as “good,” and one (14.3%) of the teachers listed the school’s progress as “poor”; and
» Six (85.7%) also rated the school’s contribution to students’ academic progress as “good,” while the remaining teacher (14.3%) rated the contribution as “fair.”
iv https://sharepoint.nccdcrc.org/Projects/Project Documents/USA/Wisconsin/508WI_Milw/2011-12/CEO/CEO 2011-12 Yr 1 FINAL.docx © 2012 by NCCD, All Rights Reserved
Twenty randomly selected eleventh- and twelfth-grade students were interviewed. Of these:
» All (100%) indicated that they had improved in reading and math at the
school; and
» Nearly all 20 (95.0%) indicated that they liked their school and had plans to go to college.
V. RECOMMENDATIONS FOR SCHOOL IMPROVEMENT The following recommendations were jointly identified by the school leadership and CRC. To continue a focused school improvement plan, it is recommended that the following activities be undertaken for the 2012–13 year.
Work closely with instructional staff to utilize assessment data to differentiate instruction for students at different achievement levels while at the same time increasing the overall rigor of the curriculum so that more students demonstrate mastery on the interim assessments.
Consider requiring lower achieving students to participate in Saturday Academy or supplemental tutoring sessions; the content for the tutoring sessions should be recommended by the content teacher based on a student’s most recent assessment results.
Adopt strategies to improve the overall school environment to better engage students
as demonstrated by improved attendance and a reduction in suspensions and expulsions.
VI. RECOMMENDATION FOR ONGOING MONITORING CRC recommends that the school continue regular, annual academic monitoring and reporting.3
3 This is CEO’s first year as a City of Milwaukee Charter School. CRC will carefully review CEO’s academic progress over the next school year (2012–13) prior to making a recommendation for continuing the regular monitoring process for the school’s third year of operation. Areas of particular interest will be whether there are improvements in the number of students that qualify for promotion to the next grade level and whether more students demonstrate improvements in reading, math, and writing from the beginning to the end of the year on the school’s local measures.
1 https://sharepoint.nccdcrc.org/Projects/Project Documents/USA/Wisconsin/508WI_Milw/2011-12/CEO/CEO 2011-12 Yr 1 FINAL.docx © 2012 by NCCD, All Rights Reserved
I. INTRODUCTION This is the first regular program monitoring report to describe educational outcomes for the
CEO Leadership Academy (CEO), a school chartered by the City of Milwaukee.4 This report focuses on
the educational component of the monitoring program undertaken by the City of Milwaukee Charter
School Review Committee (CSRC) and was prepared as a result of a contract between the CSRC and
the Children’s Research Center (CRC).5
The process used to gather the information in this report included the following steps:
One initial site visit occurred, wherein a structured interview was conducted with the
high school’s leadership staff, critical documents were reviewed, and copies of these documents were obtained for CRC files.
CRC staff assisted the school in developing its outcome measures for the learning
memo. Additional scheduled and unscheduled site visits were made to observe classroom
activities, student-teacher interactions, parent-staff exchanges, and overall school operations, including the clarification of necessary data collection. CRC staff also reviewed a representative sample of special education files.
CRC staff conducted interviews with a random selection of students, teachers, and
members of the school’s board of directors. CRC conducted a survey of parents of all students enrolled in the school. At the end of the school year, structured interviews were conducted with the high
school leadership team.
The school provided electronic data to CRC, which CRC compiled and analyzed.
4 The City of Milwaukee chartered seven schools for the 2011–12 school year. CEO initially opened in the fall of 2004 as a private school. In the fall of 2006–07, the school received TALC funding from the Bill and Melinda Gates Foundation and participated in a monitoring process with CRC similar to the CSRC process described in this report. In 2011 the school entered into a five-year charter agreement with the City of Milwaukee. 5 CRC is a nonprofit social science research organization and division of the National Council on Crime and Delinquency (NCCD).
2 https://sharepoint.nccdcrc.org/Projects/Project Documents/USA/Wisconsin/508WI_Milw/2011-12/CEO/CEO 2011-12 Yr 1 FINAL.docx © 2012 by NCCD, All Rights Reserved
II. PROGRAMMATIC PROFILE
CEO Leadership Academy6 3222 W. Brown Street Milwaukee, Wisconsin 53208 Telephone: (414) 873-4014 Website: http://ceoleadershipacademy.org Principal: Rashida Evans
CEO Leadership Academy is located on the north side of the city of Milwaukee. After a year of
planning, CEO opened its doors to ninth- and tenth-grade students in September 2004. It operated as
a private high school, affiliated with an organization known as Clergy for Educational Options, a group
of interdenominational pastors and church leaders. The school initially operated as a “choice” school.
This is the first year the school operated as a city-chartered school.
A. Description and Philosophy of Educational Methodology
1. Mission and Philosophy
CEO’s vision is “to produce responsible leaders through academic mastery, community-
focused education, and the fostering of lifelong learning in any environment.” Its mission is to “nurture
scholars capable of transforming their world, by sending them to and through college.” The school
also adopted three “core values” (commitment, excellence, and opportunity) to enable it to achieve its
vision and mission. The core values are defined as follows:
Commitment
» Staff is committed to hard work for the success of our students.
» Students are committed to personal academic success and the overall success of their academic environment.
6 CEO stands for Commitment, Excellence, and Opportunity

3 https://sharepoint.nccdcrc.org/Projects/Project Documents/USA/Wisconsin/508WI_Milw/2011-12/CEO/CEO 2011-12 Yr 1 FINAL.docx © 2012 by NCCD, All Rights Reserved
» Parents/guardians are committed to supporting student learning through involvement and accountability.
Excellence » Staff is committed to providing students and families with a quality education
that is aligned to our mission.
» Our work is done with a spirit of excellence that demonstrates how we value students, families, and the work we do.
» Students are committed to giving their best in their academic performance,
behavior, and all other activities.
» Students and staff will display pride in excellence and shame in mediocrity.
Opportunity » Staff will create opportunities for learning inside and outside of the classroom
that will open the world of possibilities to our students.
» Students will embrace the opportunities available to them with a spirit of gratitude and follow-through.
» Parents/guardians will support students in pursuing new and ongoing
opportunities that are in alignment with the academy’s mission.7 CEO distinguishes itself by providing orientation sessions, workshops, and other events to
help students, teachers, and families develop and maintain the type of positive culture that is
necessary to build and sustain a high-performing school.8
2. Instructional Design
The school serves inner-city students who are seeking high academic standards and high
character expectations as part of their learning environment. The school’s updated strategic plan
embodies an objective to have students meet or exceed district, state, national, and international
7 CEO Leadership Academy 2011–12 Parent Guardian/Student Handbook. 8 From descriptive materials collected by the principal and provided to CRC at the beginning of this school year, including an updated LIVING STRATEGIES: Three-Year Strategic Plan.
4 https://sharepoint.nccdcrc.org/Projects/Project Documents/USA/Wisconsin/508WI_Milw/2011-12/CEO/CEO 2011-12 Yr 1 FINAL.docx © 2012 by NCCD, All Rights Reserved
benchmarks of student achievement. The plan indicates that it will use several strategies to achieve
this objective. Some of the key strategies involve the implementation of a blended learning model
and online tools to build basic skills in math and reading. CEO’s curriculum relies upon interim
assessments that are aligned to the college readiness tests (EXPLORE, PLAN, and ACT) and requires
regular attention to data-driven instruction. It also incorporates Wisconsin’s model academic
standards and ensures that its students will satisfy state requirements for graduation as well as
entrance requirements for most colleges and universities. 9
Additionally, students are offered the following opportunities:
The college coach assists students with the creation of a high school graduation plan.
These plans help students to focus and monitor their progress toward their post–high school college and career goal(s). The coach utilizes a “countdown to college” check-list with students that is specifically designed for each of the four years students will be in attendance at CEO.
CEO provides students opportunities to participate in job shadowing experiences, community/career internships, and/or support services required for them to be successful.
During the interview and survey process, board members, teachers, and parents were asked
about the school’s program of instruction. Among those who responded, 88.8% of board members,
71.4% of teachers, and 91.1% of parents rated the program of instruction as excellent or good or were
either satisfied or very satisfied.
9 CEO has been in its current facility since the 2008–09 school year. This location has given the school additional space and resources for students and staff. Members of the board consistently indicated that the physical location and condition of the school facilities were adequate, but changes to both would enhance the ability of the learning community to fulfill the vision and mission of the school

5 https://sharepoint.nccdcrc.org/Projects/Project Documents/USA/Wisconsin/508WI_Milw/2011-12/CEO/CEO 2011-12 Yr 1 FINAL.docx © 2012 by NCCD, All Rights Reserved
B. School Structure 1. Board of Directors
CEO is governed by a board of directors, which has ultimate responsibility for the success of
the school and is accountable directly to the City of Milwaukee and the Wisconsin Department of
Public Instruction to ensure that all of the terms of its charter are met. The board sets policy for the
school and hires the school principal, who, in turn, hires the school staff. The board has regular
meetings at which issues are discussed, policy is set, and the business of the school is conducted.
Much of the board work is conducted by committees that meet with greater frequency than the full
board. There are three main committees: finance, academic excellence, and resource development.
The board also creates ad hoc committees to deal with special issues such as the school building.10
This year 13 members comprised the board of directors: a chairperson, a vice chairperson, a
secretary/parent member, two committee chairpersons, and eight other directors serving as members
of the community at large. Board members represented a variety of educational organizations (e.g.,
Institute for the Transformation of Learning, Black Alliance for Educational Options, New School
Venture Fund, Schools That Can Milwaukee, Darrell Lynn Hines Academy) and major local businesses
that contribute their expertise in administrative and fiscal management. CEO board member
experience included education administration, nonprofit leadership and management, law, and
teaching, as well as a parent representative.
A few board members have been on the board since the school’s inception in 2004. Others
have served on the board from one to seven years. Nine (69.2%) of the eligible members of the board
participated in the interviews conducted this year.11
10 This information was taken from the school’s board material packet and the agenda for its January 2012 meeting. 11 Board interviews, along with teacher and student interviews and parent surveys, are conducted every other year. All board members were contacted via email to confirm a date and time for an interview. Not all of the members responded to these emails; interviews were not conducted with these members.
6 https://sharepoint.nccdcrc.org/Projects/Project Documents/USA/Wisconsin/508WI_Milw/2011-12/CEO/CEO 2011-12 Yr 1 FINAL.docx © 2012 by NCCD, All Rights Reserved
All board members reported that they participated in strategic planning, received a
presentation on the school’s annual academic performance report, and received and approved the
school’s annual budget as well as a copy of the annual financial audit. Almost every member
highlighted the commitment/leadership/vision of the board, administration, and/or teachers as what
they valued most about the CEO community. Several members also expressed the importance of the
school’s vision and mission because of the high expectations it contains for its students. The
predominant “dislikes” about the school were its physical location and the condition of the facility, the
lack of better academic progress among the students, and the low level of per-pupil allocations.12 The
main suggestions for improving the school were to employ higher-caliber staff and teachers, raise the
basic skill levels of ninth-grade students by utilizing blended learning, and to move to a better facility.
Other board opinions are related to specific topics covered elsewhere in this report and can be
found within those sections. See Appendix H for additional results from interviews with board
members.
2. Areas of Instruction
During the 2011–12 school year, CEO served ninth- through twelfth-grade students. The
school had nine regular classrooms and a school gym. CEO has a comprehensive four-year education
plan for all of its students. The plan is designed to enable students to meet all of the school’s
expectations for annual grade-level promotion, high school graduation, and, ultimately, success in
college. The courses in the core curriculum areas are English, math, science, and social studies. Each of
the specific courses in these subjects is designed to contain adequate rigor to enable students who
successfully complete these courses to be able to successfully complete college courses in the various
subject areas.
12 Some board members added a comment that this was seen as unfair especially in light of the reimbursement that was provided to MPS for students in the city of Milwaukee.

7 https://sharepoint.nccdcrc.org/Projects/Project Documents/USA/Wisconsin/508WI_Milw/2011-12/CEO/CEO 2011-12 Yr 1 FINAL.docx © 2012 by NCCD, All Rights Reserved
CEO has stated requirements in two areas: academic and community service. The academic
requirement is that students earn at least 21 credits to graduate.13 The expectations for grade-level
promotion are that ninth graders complete five credits; tenth graders, 10.5 credits; and eleventh
graders, 16 credits. CEO also requires students who are lacking credits in any required area at the end
of any semester to enroll in Saturday Academy classes or another credit recovery option such as
summer school. Credit recovery must be approved by CEO administration to ensure consistent and
regular progress toward high school graduation.14
All students are encouraged to give back to the community through community service. To
that end, CEO recommends community service for ninth- through eleventh-grade students; 40 hours
of community service are required for twelfth-grade students. Students can either find their own
community service opportunities or seek assistance from staff to locate and arrange a site. Examples
of service sites include schools, daycare centers, libraries, and hospitals. Students and the school
provide each service site with materials to document the students’ service hours. These hours are
incorporated into student transcripts at the end of each school year.
13 Specific credit requirements are: four credits of English; three credits each of social studies, science, and mathematics; two credits each of foreign language and physical education/health; and four elective credits. 14 Saturday Academy operates from 8:30 a.m. until 12:30 p.m. It provides credit recovery options for those who failed courses in the first semester, assists ninth and tenth graders with basic skill development, and offers college preparation experiences. Carroll University and the University of Wisconsin-Milwaukee partner with CEO for these operations.
8 https://sharepoint.nccdcrc.org/Projects/Project Documents/USA/Wisconsin/508WI_Milw/2011-12/CEO/CEO 2011-12 Yr 1 FINAL.docx © 2012 by NCCD, All Rights Reserved
2. Teacher Information
Under the leadership of the principal, the dean of students, the achievement coordinator, and
the college coach, the CEO teaching roster was composed of seven instructors at the beginning of the
school year. These full-time teaching staff had expertise in English, mathematics, science, social
studies, and special education. At the beginning of the school year, two (28.6%) of the seven teachers
were new to the school.15 The remaining teachers (five, or 71.4%) had been at the school from one to
eight years. These teachers averaged 2.6 years of teaching at CEO over the last eight years. All (100.0%)
of the teachers were retained at the school for the entire school year. All (100%) seven teachers held a
Wisconsin Department of Public Instruction (DPI) license or permit to teach. The teachers were
assisted by one paraprofessional and two online instructional support staff. The two online instruction
support staff also had valid DPI licenses. Two administrative assistants handled the school office and
provided support to the teaching staff.
During the interview process, teachers were asked about professional development
opportunities; five of the seven teachers rated professional development opportunities as excellent or
good and six of the seven indicated they were satisfied with the opportunities for continuing
education. See Appendix E for additional information from interviews with teachers.
3. Hours of Instruction/School Calendar
The first day of school for all CEO students was September 1, 2011, and the school year ended
June 14, 2012. CEO operates on a 36-week school year composed of two 18-week semesters. During
the 2011–12 academic school year, CEO was operational and had students in attendance for 173 days.
The school day began at 7:35 a.m. with breakfast and ended at 3:52 p.m. After breakfast, students
15 CEO became a charter school for the 2011–12 school year. Since charter schools require all teachers to be DPI-certified, the school did not retain teachers from the last school year who did not possess a certification unless they were willing to initiate the process of becoming DPI-certified. This new practice resulted in a large number of new teachers for this school year.
9 https://sharepoint.nccdcrc.org/Projects/Project Documents/USA/Wisconsin/508WI_Milw/2011-12/CEO/CEO 2011-12 Yr 1 FINAL.docx © 2012 by NCCD, All Rights Reserved
attended homeroom/morning meeting at approximately 8:00 a.m., which was followed by six
instructional periods lasting an hour each, a 45-minute lunch break, and a 20-minute homeroom recall
period at the end of the day. Students were dismissed early every Wednesday to enable them to
engage in community service work and to allow staff to participate in staff meetings or other
professional development activities.
At least six hours of the day were designated for academic instruction; approximately 20
minutes for breakfast; and 75 minutes for homeroom, lunch, and end-of-day recall. Each teacher
taught courses in his/her area of expertise (English, math, science, foreign language, technology, and
physical education/health). The six hours of daily instruction exceeded CSRC’s requirement for 875
hours of instruction during the course of each school year. Additionally, several teachers assumed
responsibilities for related learning opportunities such as study skills, student council, leadership
team, yearbook, and the school newsletter.
CEO students also had the opportunity to participate in several afterschool activities, including
organized sports, computer club, and an extended-day program known as Power Hour. The extended-
day program operated three days a week (Tuesday through Thursday). It was available to all students,
but ninth and tenth graders were encouraged to participate in an effort to improve their skills in
reading, writing, and math. These activities typically occurred between 4:00 and 5:00 p.m.
4. Parental Involvement
CEO recognizes that parent/guardian involvement is a critical component of student success.
The school encourages and solicits the engagement and involvement of parents in the following
ways:
All parents/guardians are required to sign an annual contract with the school. This contract makes it clear that CEO provides students with a college prep curriculum and that students might be required to attend Saturday Academy or Power Hour in order to successfully complete the curriculum, graduate, and be prepared for success in

10 https://sharepoint.nccdcrc.org/Projects/Project Documents/USA/Wisconsin/508WI_Milw/2011-12/CEO/CEO 2011-12 Yr 1 FINAL.docx © 2012 by NCCD, All Rights Reserved
college. The contract also identifies the parent/guardians responsibility for overseeing the student’s completion of homework and studying for other required assessments.
One of the 13 directors on the school’s board of directors is a parent representative. The board is responsible for making decisions related to school policies, the school’s budget, and for approving the school’s strategic direction.
CEO employs a full-time dean of students. The dean is expected to work with
parents/guardians to ensure that children are coming to school regularly. It is also the dean’s task to provide parents with regular feedback on issues that surface at the school related to a student’s behaviors and achievements.
CEO informs parents/guardians in the school handbook that CEO has a commitment
to them and informs them that they are always welcome to observe or volunteer at the school, to make suggestions or voice opinions to staff, and to speak to the teachers about a student’s academic progress.16
CEO created a parent council that meets on a monthly basis. The function of the
council is to advise the principal and serve as a voice for the parents of the school. This body works with the student council to plan special events for the school and provides assistance with the implementation of these events. Parents have made suggestions for improving parent-teacher conferences and improving the “joy factor” in the school.
Teachers, parents, and board members were asked about parental involvement. A majority
(71.4%) of board members who responded to this item indicated that they were somewhat or very
satisfied with the level of parental involvement with the school. However, only 42.8% of the teachers
were satisfied with the level of parental involvement. Since the majority of teachers (71.4%) reported
satisfaction with their relationships with parents, it appears that the teachers’ response to the item
about parental involvement represented their desire for parents to increase their participation in the
school and the students’ learning. A solid majority (83.5%) of parents indicated that the opportunity
for parent involvement with the school was excellent or good, and 93.6% indicated that opportunities
for parental participation were an important reason for choosing CEO.
16 This information was extracted from CEO’s charter school application and the high school's 2011–12 Parent/Guardian-Student Handbook.
11 https://sharepoint.nccdcrc.org/Projects/Project Documents/USA/Wisconsin/508WI_Milw/2011-12/CEO/CEO 2011-12 Yr 1 FINAL.docx © 2012 by NCCD, All Rights Reserved
5. Waiting List
The school’s administrator reported that as of May 2011, the school did not have a waiting list
for the upcoming fall.
6. Discipline Policy
CEO places a strong emphasis on a safe and orderly learning environment. As stated in the
handbook, all students are expected to respect, uphold, and adhere to the rules, regulations, and
policies of the academy. The school has adopted “non-negotiable” rules that are considered so critical
to the culture of CEO that the violation of a rule will result in an expulsion. The rules are:
1. Students cannot bring drugs and/or alcohol into or within a two-mile radius of the
academy and/or be convicted of selling drugs;
2. Students cannot bring into and/or use weapons within a two-mile radius of the academy;
3. Students cannot blatantly disrespect, use profanity toward, or threaten a staff member;
4. Students cannot engage in fighting and/or a physical altercation in or within a two-mile radius of the academy; and
5. Students cannot bully or harass other students at the academy.17
In the Parent Handbook, the school provides detailed information on the consequences
students will experience for the violation of any of the school’s policies or rules. For example, the
school has a demerit system; students will receive demerits for a variety of behaviors such as tardiness,
uniform violations, disruptive behavior, or theft. Students who receive five or more demerits in a one-
week cycle will be required to participate in the following types of detention:
17 These five statements are taken directly from the Parent/Guardian-Student Handbook, which is distributed and signed upon receipt by every students’ parent or guardian.
12 https://sharepoint.nccdcrc.org/Projects/Project Documents/USA/Wisconsin/508WI_Milw/2011-12/CEO/CEO 2011-12 Yr 1 FINAL.docx © 2012 by NCCD, All Rights Reserved
Five demerits = Afterschool detention Ten demerits = Saturday detention Fifteen demerits = In-school suspension Sixteen or more demerits = In- or out-of-school suspension Four afterschool detentions in a semester = Saturday detention Three Saturday detentions in a semester = In- or out-of-school suspension Any student who repeatedly earns demerits will participate in a conference with the
administration and his/her parents/guardians to discuss his/her future. In addition to the demerit
system, school staff continue to communicate with parents via phone calls and special parent
sessions, among other things. The handbook contains detailed information on the various forms of
detention, suspensions, and, ultimately, the procedures for expulsions.
This year teachers, parents, board members, and students were asked about the discipline
(rules) policy at CEO. The opinions expressed were very favorable regarding the discipline policy:
Teachers:
All (100.0%) teachers considered the discipline at the school as a “very important” or
“somewhat important” reason for either continuing to teach there; and
A majority (57.1%) of teachers were either very satisfied or somewhat satisfied with the discipline policy as stated, while 71.4% were somewhat or very satisfied with the adherence to the discipline policy.
Parents:
All (100.0%) parents considered discipline as a “very important” or “somewhat
important” factor in choosing CEO;
A majority (86.1%) rated the discipline methods at the school as “good” or excellent”; and
Almost three quarters (73.4%) were comfortable with how the staff handles
discipline.18
18 Agreed or strongly agreed with the statement: “I am comfortable with how the staff handles discipline.”
13 https://sharepoint.nccdcrc.org/Projects/Project Documents/USA/Wisconsin/508WI_Milw/2011-12/CEO/CEO 2011-12 Yr 1 FINAL.docx © 2012 by NCCD, All Rights Reserved
Board Members:
All nine interviewed board members were very satisfied with the discipline policy; and
All members reported being either very or somewhat satisfied with the adherence to
the discipline policy. Students: A majority (60.0%) indicated that they liked the school rules, and 70% thought the
school rules were fair; and
Despite these responses, when asked what they disliked about the school, a majority (55.0%) said rules, demerit system, or detention.
7. Graduation Information
CEO employs a full-time college coach whose primary responsibility is to work with the
students as they prepare for post-secondary careers and educational experiences. The principal, dean
of students, and the entire teaching staff assist the coach with her efforts. Over the last school year,
the college coach completed and shared with all staff, students, and parents a document that
contained detailed information about CEO’s college-going culture. This document contained the
following:
A college-going culture survey, designed to assess whether the school had policies
and practices in place that are essential to the implementation of a college awareness and readiness program. Results from the survey were used during the school year to improve CEO’s college culture.
Materials on the nine critical principles of a college culture. The coach worked with
school leadership, all school personnel, students, and parents to help them be aware of and practice these principles.19
19 The nine principles included: college talk, clear expectations, information and resources, comprehensive counseling model, testing and curriculum, faculty involvement, family involvement, college partnerships, and articulation.
14 https://sharepoint.nccdcrc.org/Projects/Project Documents/USA/Wisconsin/508WI_Milw/2011-12/CEO/CEO 2011-12 Yr 1 FINAL.docx © 2012 by NCCD, All Rights Reserved
“Countdown to College” sheets were created for each of the four grade levels. These
materials identify steps that students need to complete during the course of the school year to be prepared to enter college at the end of their four years at CEO. For seniors, the steps were identified for each month of school; these sheets were used to monitor each student’s progress toward graduation and successful acceptance into one or more colleges and universities.
All twelfth graders visited with the college coach in September to complete a credit
review and prepare a schedule leading to graduation. A specific form was structured for use in these meetings so that each senior was aware of what was required of him/her in order to graduate and be accepted into a college at the end of the school year. During this session, each student identified the colleges and careers of greatest interest to him/her, registered for the ACT, and created a calendar with important dates and college preparation deadlines. This session was complemented by at least two additional individual meetings during the course of the school year.
All eleventh graders participated in an individual session to develop a graduation and
post-secondary plan. As part of this plan, each student was required to investigate and read supplemental materials about different careers and college majors. This exercise assisted students in identifying potential careers based on their personal preferences and interests. The plan also required students to determine what they will need to do to be successful in the career(s) of their choice.
All tenth graders and their parents were invited to participate in a session related to
post-secondary education and future careers. Topics discussed included PLAN results, credit status, graduation plans, career interests, and steps required for college admission. Transcripts and steps required for graduation were reviewed with the entire tenth-grade class.
All ninth graders participated in class counseling sessions to review CEO graduation
requirements. Additionally, students were given information related to opportunities for participation in pre-college programs and information to help them understand how CEO staff would work with them on scheduling, reviewing credit status, and planning for graduation within a four-year timeframe.
Individualized sessions were complemented by a series of other activities provided by CEO to
its students to increase their knowledge and ability to be more successful in their post-secondary
careers after graduation from high school. Some of these activities included:
CEO formed a partnership with Carroll University to sponsor the Saturday Academy
program. In February, a colloquium was held to highlight the research undertaken by CEO students with the assistance of their Carroll student mentors.
15 https://sharepoint.nccdcrc.org/Projects/Project Documents/USA/Wisconsin/508WI_Milw/2011-12/CEO/CEO 2011-12 Yr 1 FINAL.docx © 2012 by NCCD, All Rights Reserved
Evenings were set aside to assist parents and students with the completion of materials required to obtain scholarships or financial assistance.
Alumni were invited back to CEO to speak to students and parents about their college
experiences.
During the month of February, members of the CEO community participated in a college tour.
The school assisted students with college application completion, interview
preparation, and submission of all required materials to the colleges selected by the students.
Students were offered opportunities for trips to different colleges.
All ninth through eleventh graders completed a career interest survey.
A key outcome of these diverse activities, as reported by the school at the end of the school
year, was that 22 (81.5%) of the 27 high school graduates were accepted into post-secondary schools.
C. Student Population CEO began the academic year with 165 students registered in ninth through twelfth grades.20
During the year, an additional 10 students enrolled and 40 students withdrew.21,22 Of the 40 students
who withdrew from CEO during the year, 27 (67.5%) were expelled for fighting, breech of a non-
negotiable rule, breech of school attendance policy, and/or possession of contraband; 11 (27.5%)
transferred to other schools or Job Corps; one (2.5%) student withdrew for an unknown reason; and
one (2.5%) withdrew to be homeschooled. At the end of the school year, 135 students enrolled in CEO.
20 There were 165 students registered at the beginning of the year: 77 (46.7%) ninth graders, 36 (21.8%) tenth graders, 20 (12.1%) eleventh graders, and 32 (19.4%) twelfth graders. 21 Ten students registered after the start of the school year: seven (70.0%) ninth graders and three (30.0%) tenth graders. 22 Forty students withdrew during the year: 27 (67.5%) ninth graders, 10 (25.0%) tenth graders, one (2.5%) eleventh grader, and two (5.0%) twelfth graders.
16 https://sharepoint.nccdcrc.org/Projects/Project Documents/USA/Wisconsin/508WI_Milw/2011-12/CEO/CEO 2011-12 Yr 1 FINAL.docx © 2012 by NCCD, All Rights Reserved
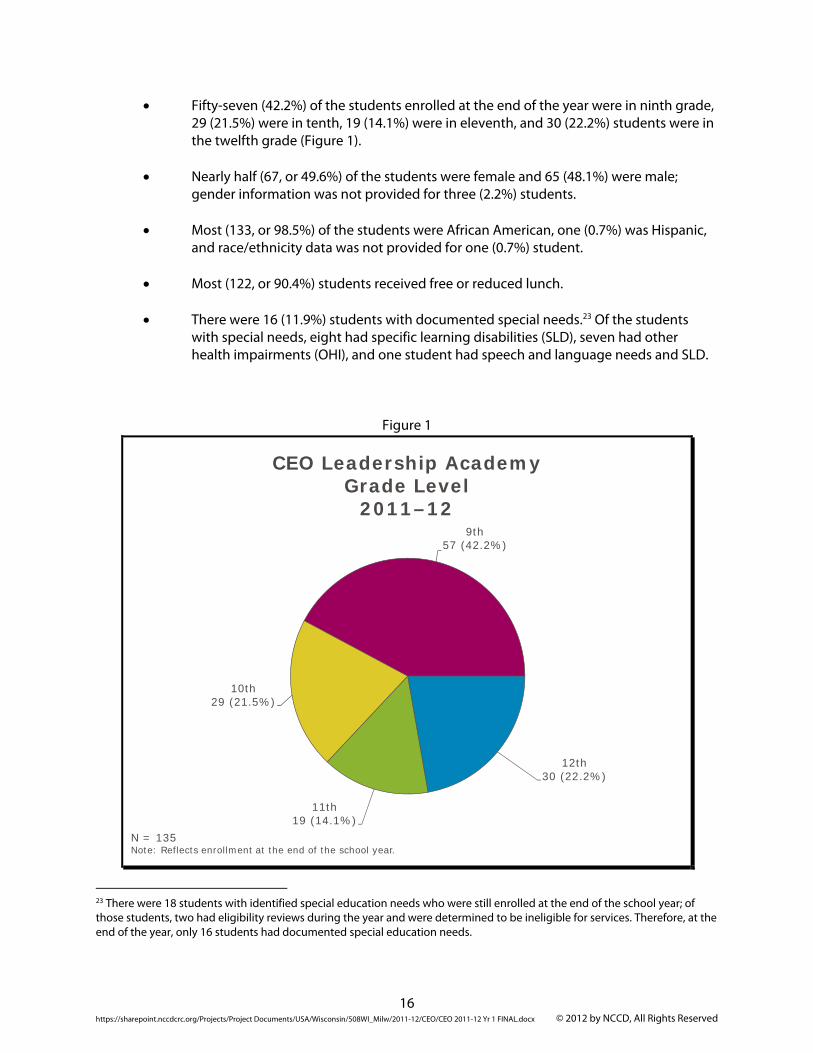
Fifty-seven (42.2%) of the students enrolled at the end of the year were in ninth grade, 29 (21.5%) were in tenth, 19 (14.1%) were in eleventh, and 30 (22.2%) students were in the twelfth grade (Figure 1).
Nearly half (67, or 49.6%) of the students were female and 65 (48.1%) were male; gender information was not provided for three (2.2%) students.
Most (133, or 98.5%) of the students were African American, one (0.7%) was Hispanic,
and race/ethnicity data was not provided for one (0.7%) student. Most (122, or 90.4%) students received free or reduced lunch. There were 16 (11.9%) students with documented special needs.23 Of the students
with special needs, eight had specific learning disabilities (SLD), seven had other health impairments (OHI), and one student had speech and language needs and SLD.
Figure 1
CEO Leadership Academy Grade Level
2011–129th
57 (42.2%)
12th 30 (22.2%)
11th 19 (14.1%)
10th 29 (21.5%)
N = 135Note: Reflects enrollment at the end of the school year.
23 There were 18 students with identified special education needs who were still enrolled at the end of the school year; of those students, two had eligibility reviews during the year and were determined to be ineligible for services. Therefore, at the end of the year, only 16 students had documented special education needs.

17 https://sharepoint.nccdcrc.org/Projects/Project Documents/USA/Wisconsin/508WI_Milw/2011-12/CEO/CEO 2011-12 Yr 1 FINAL.docx © 2012 by NCCD, All Rights Reserved
There were 127 students who had been enrolled for the entire school year. This represents a
retention rate of 77.0%.24
There were 114 students enrolled at the end of the 2010–11 school year who were eligible to
return to the school, i.e., had not graduated from high school. Of these, 86 were enrolled as of the
third Friday in September 2011. This represents a student return rate of 75.4%.25,26
Twenty randomly selected eleventh and twelfth graders participated in satisfaction interviews
at the end of the school year. All 20 students interviewed reported that they felt safe in school, learned
new things every day in school, and that they had improved in reading and math. All but one student
reported that they liked their school and that they had plans to go to college. When asked what they
liked best about the school, students mentioned the teachers and the family
environment/atmosphere. A majority of the interviewed students (55.0%) stated that they least liked
the rules, demerit system, and detention. See Appendix G for additional information from student
interviews.
24 One hundred twenty-seven of 165 students enrolled at the beginning of the school year. 25 Additionally, six of the 55 students who withdrew from CEO sometime during 2010–11, but were eligible to return during 2011–12, were enrolled on the third Friday of September 2011. 26 This was CEO’s first year as a city-charter school; reenrollment data were available because of CEO’s existing relationship with CRC. Therefore, although reenrollment data are presented here, results will not be included in the report card this year.
18 https://sharepoint.nccdcrc.org/Projects/Project Documents/USA/Wisconsin/508WI_Milw/2011-12/CEO/CEO 2011-12 Yr 1 FINAL.docx © 2012 by NCCD, All Rights Reserved
III. EDUCATIONAL PERFORMANCE To monitor performance as it relates to the CSRC contract, CEO collected a variety of
qualitative and quantitative information. This year, the school established goals for attendance, parent
conferences, and special education student records. In addition, it identified local and standardized
measures of academic performance to monitor student progress.
This year, local assessment measures included student progress in literacy, mathematics, and
writing, as well as IEP goals for special education students. The standardized assessment measures
used were the WKCE,27 the EXPLORE, the PLAN,28 and the ACT.
A. Attendance
At the beginning of the academic year, the school established a goal of maintaining an
average attendance rate of 90%. Students were marked present for the day if they attended four of six
instructional periods. This year, students attended school an average of 85.4% of the time. The school
has therefore not met its goal related to attendance. When excused absences were included, the
attendance rate rose to 90.6%, consistent with the school’s goal.
Note that 89 students served out-of-school suspensions at least once during the school year.
These students spent, on average, 2.3 days out of school due to suspension. Additionally, 24 students
served in-school suspensions at least once during the school year; these students spent, on average,
0.8 days out of class due to suspension.
27 The WKCE is a standardized test aligned with Wisconsin model academic standards. 28 The EXPLORE and PLAN were developed by ACT and measure a student’s preparedness to take the ACT.
19 https://sharepoint.nccdcrc.org/Projects/Project Documents/USA/Wisconsin/508WI_Milw/2011-12/CEO/CEO 2011-12 Yr 1 FINAL.docx © 2012 by NCCD, All Rights Reserved
B. Parent-Teacher Conferences
At the beginning of the academic year, the school established a goal that parents of at least
85% of students would participate in one of two scheduled parent-teacher conferences. The school
scheduled two conference sessions, one in the fall and one in the spring. There were 127 students
enrolled for the entire school year and eligible to attend both conferences. Parents of 115 (90.6%)
children attended at least one conference. The school has therefore met its goal related to parent
conferences. Note that parents of 73 (57.5%) students attended both conferences.
C. Special Education Student Records
This year, the school established a goal to develop and maintain records for all special
education students. At the end of the year, there were 19 students with special education records.
Special education eligibility assessments for 18 students were completed this year (eligibility reviews
occur every three years); two students were no longer eligible, and 16 students had continued
eligibility for special education services. Additionally, the one student who did not have an eligibility
assessment this year continued in the special education program. All special education students had
an IEP. During the year, the school conducted IEP reviews for all students who required one.
In addition to examining the special education data provided by the school, CRC conducted a
review of a representative number of files during the year. This review indicated that IEPs had been
completed and reviewed in a timely manner, and that all parents were invited to participate in the IEP
team review. However, despite receiving proper notice, parents of five students were not present for
the IEP sessions; parents of the other 12 students participated. The school has met its goal related to
keeping updated special education records.

20 https://sharepoint.nccdcrc.org/Projects/Project Documents/USA/Wisconsin/508WI_Milw/2011-12/CEO/CEO 2011-12 Yr 1 FINAL.docx © 2012 by NCCD, All Rights Reserved
D. High School Graduation Plan A high school graduation plan is to be developed for each high school student by the end of
his/her first semester of enrollment at the school. The plans are to include (1) evidence of
parent/guardian/family involvement; (2) information regarding the student’s post-secondary plans;
and (3) a schedule reflecting plans for completing four credits in English; three credits in math,
science, and social studies; two credits of foreign language and physical education/health, and four
credits in other electives.29
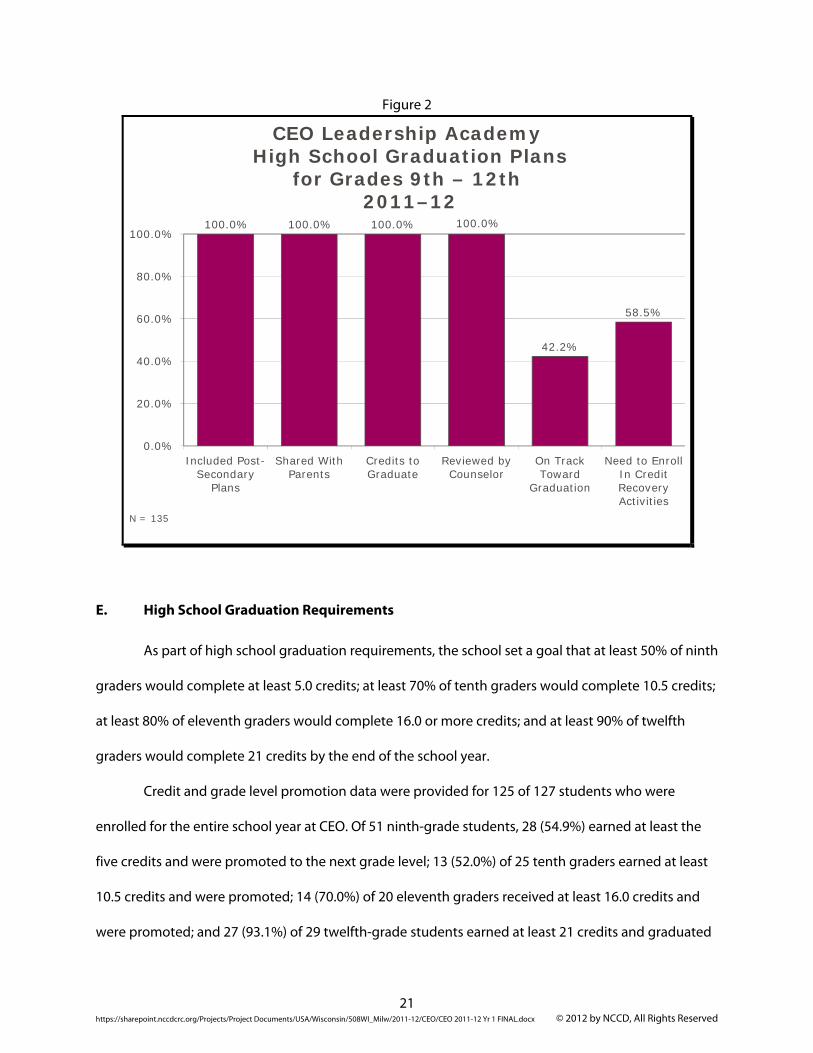
This year, plans were completed for all 135 CEO students enrolled at the end of the year. Of
these, 100.0% included the student’s post-secondary plans, 100.0% were submitted to parents for
their review, and 100.0% included a schedule reflecting credits needed to graduate. The college coach
was required to review each student’s plan at least once during the year. Part of the review was to
ensure that students were on track to graduate and to determine if a student should be referred for
summer school. The coach reviewed plans for all 135 (100.0%) students. This year, 57 (42.2%) students
were on track to graduate, and 79 (58.5%) students will need to enroll in credit recovery activities
(Figure 2).30
29 Evidence of involvement reflects whether or not the school provided the student’s parent(s) with a copy of the plan. Parents are also encouraged to review the plan as part of scheduled parent-teacher conferences. 30 CEO did not offer summer school after the 2011–12 school year, but credit recovery activities were available during the school year.
21 https://sharepoint.nccdcrc.org/Projects/Project Documents/USA/Wisconsin/508WI_Milw/2011-12/CEO/CEO 2011-12 Yr 1 FINAL.docx © 2012 by NCCD, All Rights Reserved
Figure 2
CEO Leadership AcademyHigh School Graduation Plans
for Grades 9th – 12th2011–12
100.0% 100.0% 100.0% 100.0%
42.2%
58.5%
0.0%
20.0%
40.0%
60.0%
80.0%
100.0%
Included Post-Secondary
Plans
Shared WithParents
Credits toGraduate
Reviewed byCounselor
On TrackToward
Graduation
Need to EnrollIn CreditRecoveryActivities
N = 135
E. High School Graduation Requirements As part of high school graduation requirements, the school set a goal that at least 50% of ninth
graders would complete at least 5.0 credits; at least 70% of tenth graders would complete 10.5 credits;
at least 80% of eleventh graders would complete 16.0 or more credits; and at least 90% of twelfth
graders would complete 21 credits by the end of the school year.
Credit and grade level promotion data were provided for 125 of 127 students who were
enrolled for the entire school year at CEO. Of 51 ninth-grade students, 28 (54.9%) earned at least the
five credits and were promoted to the next grade level; 13 (52.0%) of 25 tenth graders earned at least
10.5 credits and were promoted; 14 (70.0%) of 20 eleventh graders received at least 16.0 credits and
were promoted; and 27 (93.1%) of 29 twelfth-grade students earned at least 21 credits and graduated
22 https://sharepoint.nccdcrc.org/Projects/Project Documents/USA/Wisconsin/508WI_Milw/2011-12/CEO/CEO 2011-12 Yr 1 FINAL.docx © 2012 by NCCD, All Rights Reserved
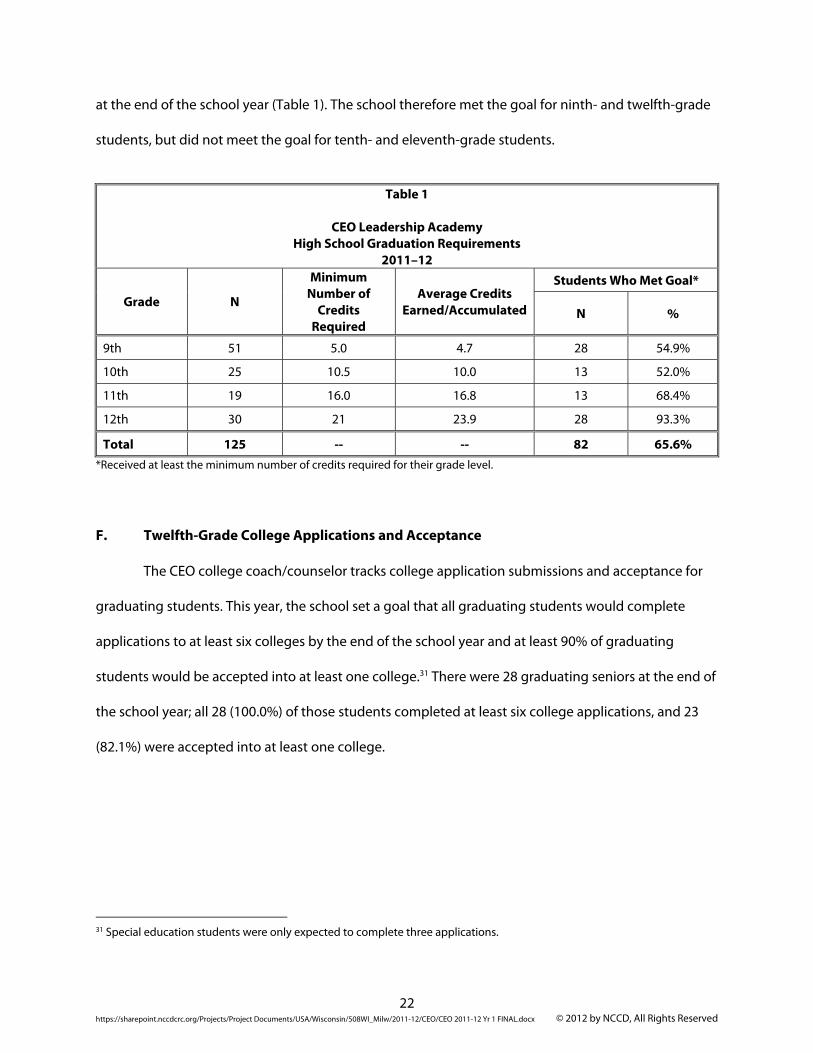
at the end of the school year (Table 1). The school therefore met the goal for ninth- and twelfth-grade
students, but did not meet the goal for tenth- and eleventh-grade students.
Table 1
CEO Leadership Academy
High School Graduation Requirements 2011–12
Grade N
Minimum Number of
Credits Required
Average Credits Earned/Accumulated
Students Who Met Goal*
N %
9th 51 5.0 4.7 28 54.9%
10th 25 10.5 10.0 13 52.0%
11th 19 16.0 16.8 13 68.4%
12th 30 21 23.9 28 93.3%
Total 125 -- -- 82 65.6% *Received at least the minimum number of credits required for their grade level.
F. Twelfth-Grade College Applications and Acceptance
The CEO college coach/counselor tracks college application submissions and acceptance for
graduating students. This year, the school set a goal that all graduating students would complete
applications to at least six colleges by the end of the school year and at least 90% of graduating
students would be accepted into at least one college.31 There were 28 graduating seniors at the end of
the school year; all 28 (100.0%) of those students completed at least six college applications, and 23
(82.1%) were accepted into at least one college.
31 Special education students were only expected to complete three applications.
23 https://sharepoint.nccdcrc.org/Projects/Project Documents/USA/Wisconsin/508WI_Milw/2011-12/CEO/CEO 2011-12 Yr 1 FINAL.docx © 2012 by NCCD, All Rights Reserved
G. Assessment for New Enrollees
The CSRC requires that schools test each new student within 30 days of enrollment to
ascertain the student’s literacy and math capabilities. This year, CEO tested ninth- and tenth-grade
students within 30 days of enrollment using the Accelerated Reader and Assessment and Learning in
Knowledge Spaces (ALEKS) math assessments. Students’ basic skills levels are described below.32
1. Reading
Accelerated Reader assesses students’ progress on the acquisition of literacy skills in four areas
based on their current reading level: initial understanding, inferential comprehension, literacy analysis,
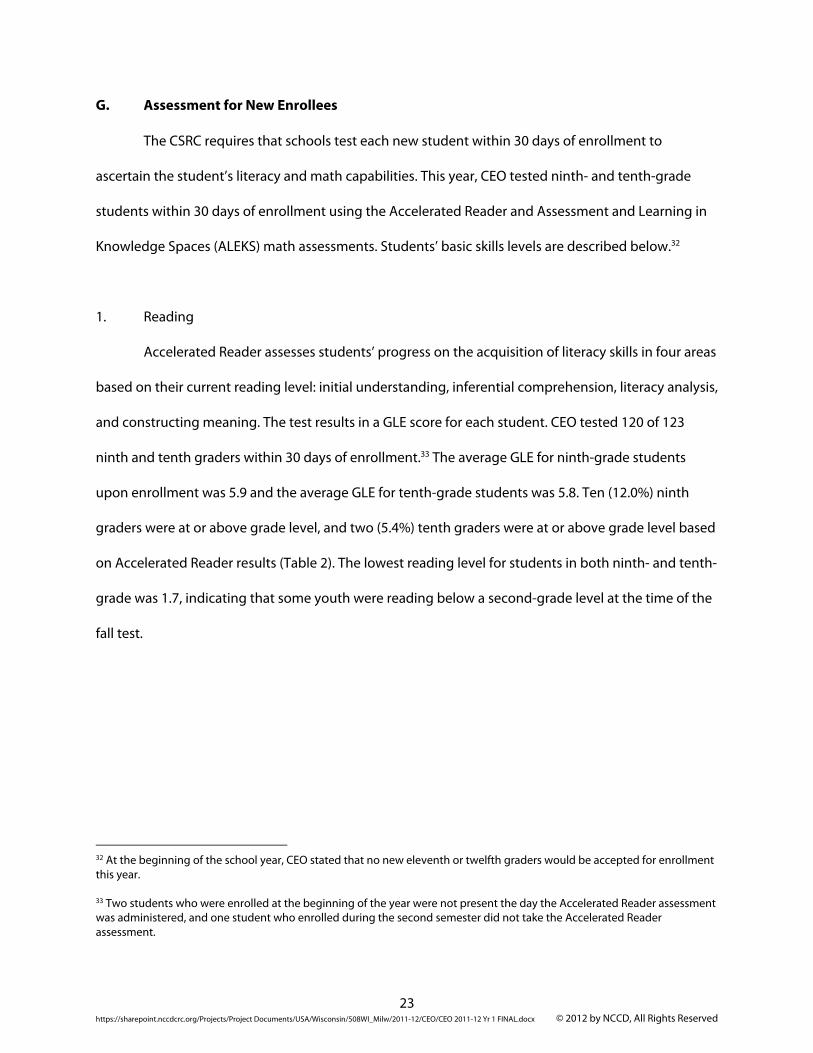
and constructing meaning. The test results in a GLE score for each student. CEO tested 120 of 123
ninth and tenth graders within 30 days of enrollment.33 The average GLE for ninth-grade students
upon enrollment was 5.9 and the average GLE for tenth-grade students was 5.8. Ten (12.0%) ninth
graders were at or above grade level, and two (5.4%) tenth graders were at or above grade level based
on Accelerated Reader results (Table 2). The lowest reading level for students in both ninth- and tenth-
grade was 1.7, indicating that some youth were reading below a second-grade level at the time of the
fall test.
32 At the beginning of the school year, CEO stated that no new eleventh or twelfth graders would be accepted for enrollment this year. 33 Two students who were enrolled at the beginning of the year were not present the day the Accelerated Reader assessment was administered, and one student who enrolled during the second semester did not take the Accelerated Reader assessment.
24 https://sharepoint.nccdcrc.org/Projects/Project Documents/USA/Wisconsin/508WI_Milw/2011-12/CEO/CEO 2011-12 Yr 1 FINAL.docx © 2012 by NCCD, All Rights Reserved
Table 2
CEO Leadership Academy Assessment for New Enrollees: Accelerated Reader
for 9th and 10th Graders 2011–12
Grade N Minimum GLE
Maximum GLE
Average GLE
Students At or AboveGrade Level
N %
9th 83 1.7 PHS 5.9 10 12.0%
10th 37 1.7 12.9 5.8 2 5.4%
Total 120 -- -- 5.9 12 10.0%
2. Math
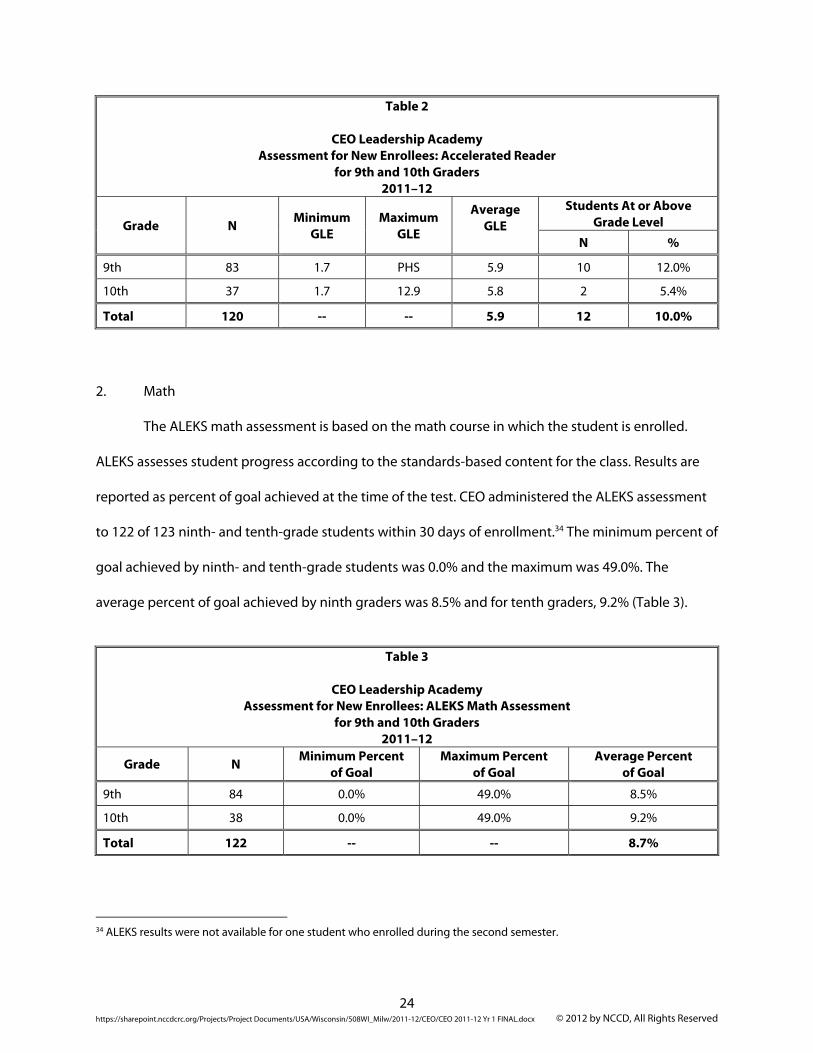
The ALEKS math assessment is based on the math course in which the student is enrolled.
ALEKS assesses student progress according to the standards-based content for the class. Results are
reported as percent of goal achieved at the time of the test. CEO administered the ALEKS assessment
to 122 of 123 ninth- and tenth-grade students within 30 days of enrollment.34 The minimum percent of
goal achieved by ninth- and tenth-grade students was 0.0% and the maximum was 49.0%. The
average percent of goal achieved by ninth graders was 8.5% and for tenth graders, 9.2% (Table 3).
Table 3
CEO Leadership Academy
Assessment for New Enrollees: ALEKS Math Assessment for 9th and 10th Graders
2011–12
Grade N Minimum Percentof Goal
Maximum Percentof Goal
Average Percentof Goal
9th 84 0.0% 49.0% 8.5%
10th 38 0.0% 49.0% 9.2%
Total 122 -- -- 8.7%
34 ALEKS results were not available for one student who enrolled during the second semester.
25 https://sharepoint.nccdcrc.org/Projects/Project Documents/USA/Wisconsin/508WI_Milw/2011-12/CEO/CEO 2011-12 Yr 1 FINAL.docx © 2012 by NCCD, All Rights Reserved
H. Local Measures of Educational Performance
Charter schools, by their definition and nature, are autonomous schools with curricula that
reflect each school’s individual philosophy, mission, and goals. In addition to administering
standardized tests, each charter school is responsible for describing goals and expectations for its
students in the context of that school’s unique approach to education. These goals and expectations
are established by each city-chartered school at the beginning of the academic year to measure the
educational performance of its students. These local measures are useful for monitoring and reporting
progress, guiding and improving instruction, clearly expressing the expected quality of student work,
and providing evidence that students are meeting local benchmarks. The CSRC expectation is that at a
minimum, schools establish local measures in reading, writing, math, and special education.
1. Literacy
The school set a goal that all students would be assessed quarterly using the pacing plan for
reading designed by the Noble Street School in Chicago. Progress for ninth-, tenth-, and twelfth-grade
students was measured from the first-quarter to the fourth-quarter assessment; progress for eleventh-
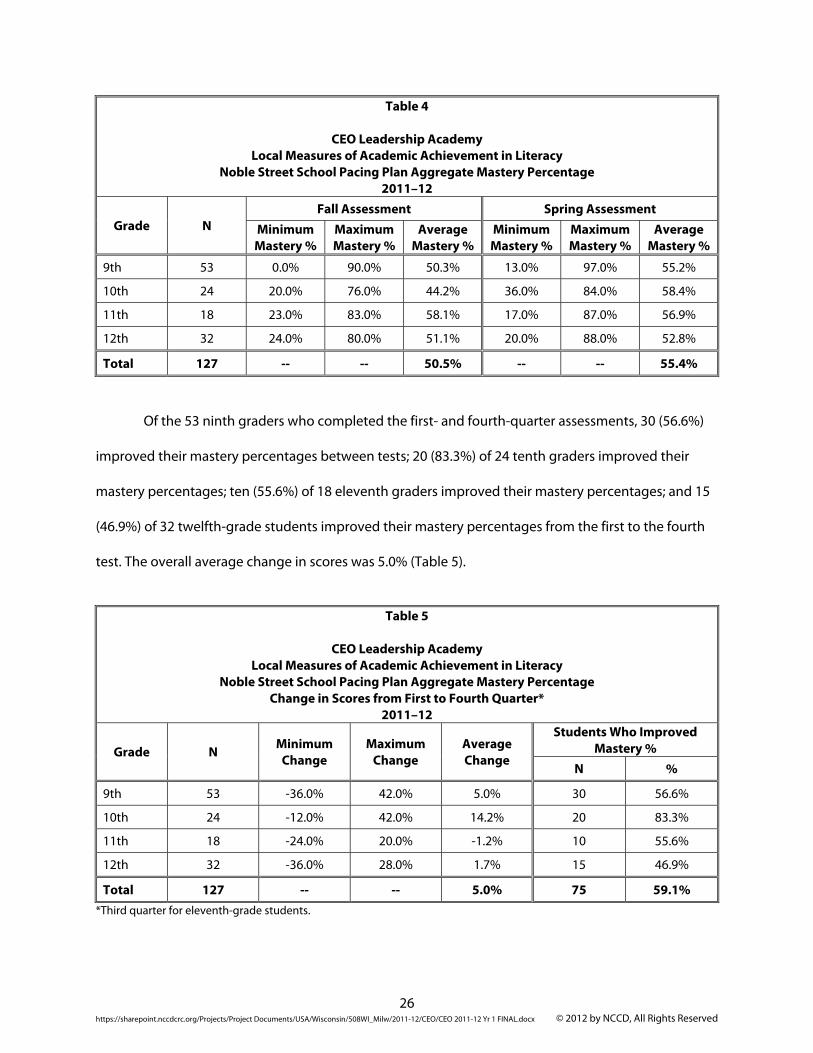
grade students was measured from the first- to third-quarter assessment.35 There were 127 students
who completed both the first- and third- or fourth-quarter assessments. Students in ninth, tenth, and
twelfth grades improved the overall average mastery percent scored between the fall and spring
assessment. Eleventh-grade students maintained the average mastery percent from the first- to third-
quarter assessment. Progress from fall to spring is described below (Table 4).
35 Eleventh-grade students did not complete the fourth-quarter assessment; eleventh-grade students completed the ACT in the spring semester instead of the fourth-quarter assessment.
26 https://sharepoint.nccdcrc.org/Projects/Project Documents/USA/Wisconsin/508WI_Milw/2011-12/CEO/CEO 2011-12 Yr 1 FINAL.docx © 2012 by NCCD, All Rights Reserved
Table 4
CEO Leadership Academy Local Measures of Academic Achievement in Literacy
Noble Street School Pacing Plan Aggregate Mastery Percentage 2011–12
Grade N Fall Assessment Spring Assessment
Minimum Mastery %
Maximum Mastery %
Average Mastery %
Minimum Mastery %
Maximum Mastery %
Average Mastery %
9th 53 0.0% 90.0% 50.3% 13.0% 97.0% 55.2%
10th 24 20.0% 76.0% 44.2% 36.0% 84.0% 58.4%
11th 18 23.0% 83.0% 58.1% 17.0% 87.0% 56.9%
12th 32 24.0% 80.0% 51.1% 20.0% 88.0% 52.8%
Total 127 -- -- 50.5% -- -- 55.4%
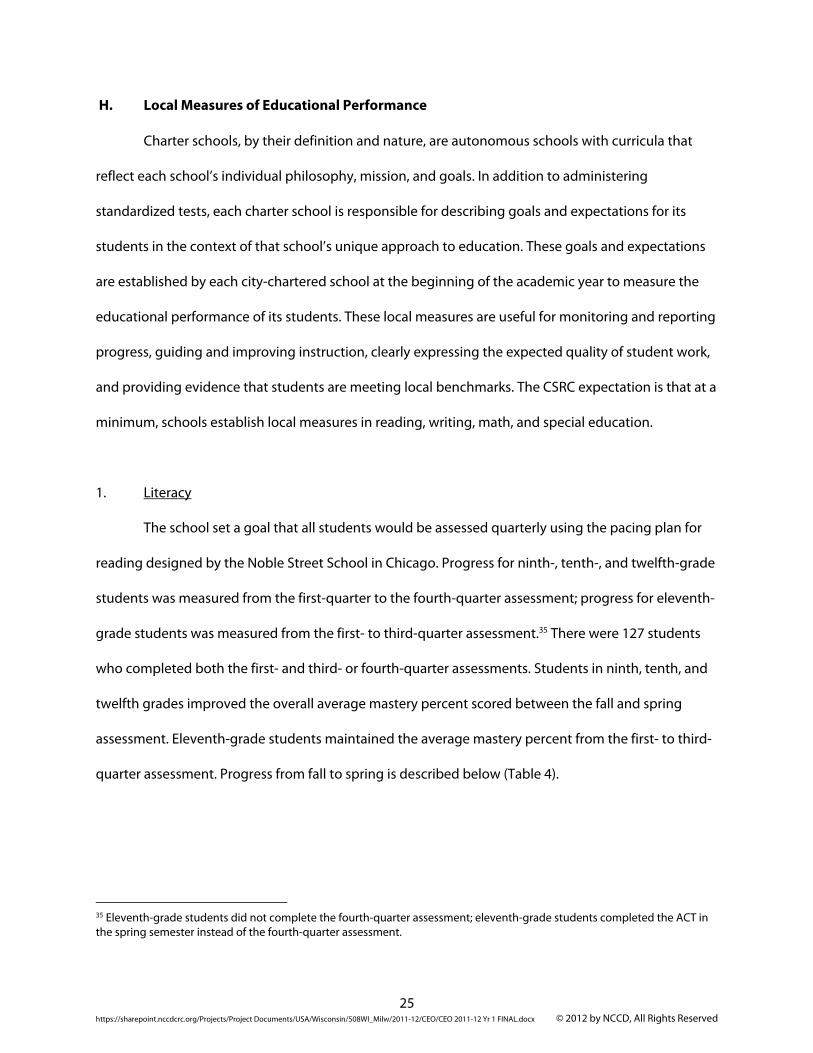
Of the 53 ninth graders who completed the first- and fourth-quarter assessments, 30 (56.6%)
improved their mastery percentages between tests; 20 (83.3%) of 24 tenth graders improved their
mastery percentages; ten (55.6%) of 18 eleventh graders improved their mastery percentages; and 15
(46.9%) of 32 twelfth-grade students improved their mastery percentages from the first to the fourth
test. The overall average change in scores was 5.0% (Table 5).
Table 5
CEO Leadership Academy
Local Measures of Academic Achievement in Literacy Noble Street School Pacing Plan Aggregate Mastery Percentage
Change in Scores from First to Fourth Quarter* 2011–12
Grade N Minimum Change
Maximum Change
Average Change
Students Who Improved Mastery %
N %
9th 53 -36.0% 42.0% 5.0% 30 56.6%
10th 24 -12.0% 42.0% 14.2% 20 83.3%
11th 18 -24.0% 20.0% -1.2% 10 55.6%
12th 32 -36.0% 28.0% 1.7% 15 46.9%
Total 127 -- -- 5.0% 75 59.1% *Third quarter for eleventh-grade students.
27 https://sharepoint.nccdcrc.org/Projects/Project Documents/USA/Wisconsin/508WI_Milw/2011-12/CEO/CEO 2011-12 Yr 1 FINAL.docx © 2012 by NCCD, All Rights Reserved
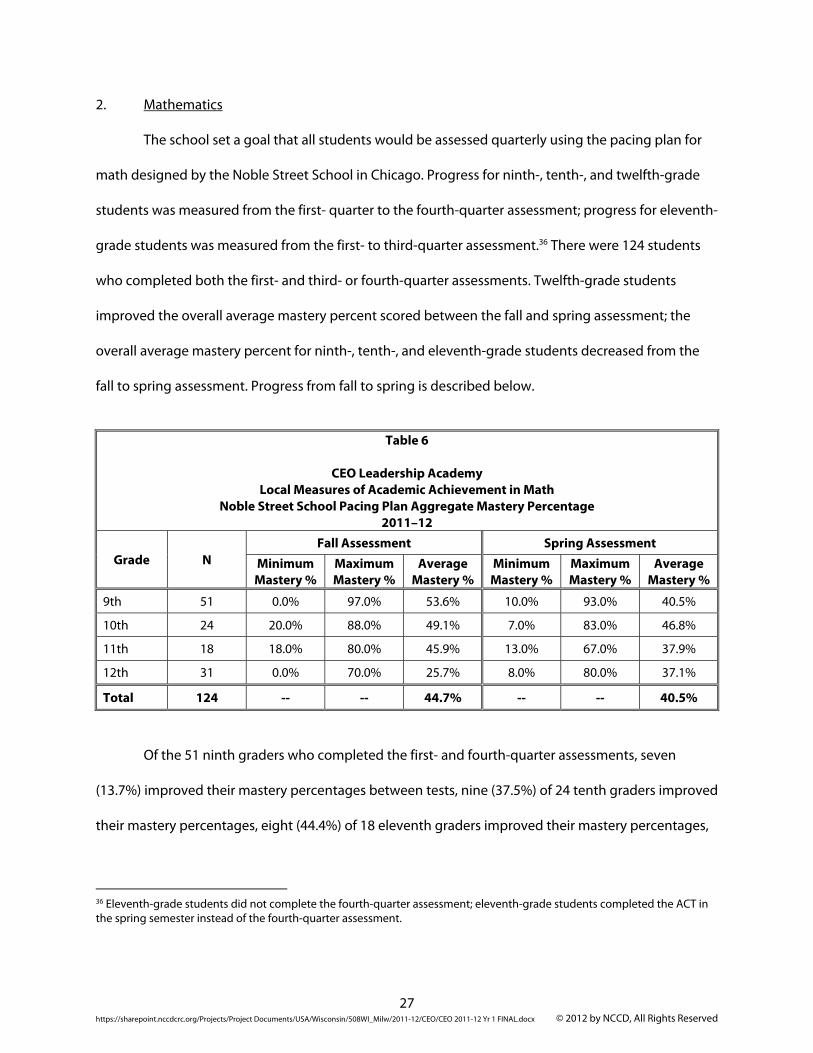
2. Mathematics
The school set a goal that all students would be assessed quarterly using the pacing plan for
math designed by the Noble Street School in Chicago. Progress for ninth-, tenth-, and twelfth-grade
students was measured from the first- quarter to the fourth-quarter assessment; progress for eleventh-
grade students was measured from the first- to third-quarter assessment.36 There were 124 students
who completed both the first- and third- or fourth-quarter assessments. Twelfth-grade students
improved the overall average mastery percent scored between the fall and spring assessment; the
overall average mastery percent for ninth-, tenth-, and eleventh-grade students decreased from the
fall to spring assessment. Progress from fall to spring is described below.
Table 6
CEO Leadership Academy
Local Measures of Academic Achievement in Math Noble Street School Pacing Plan Aggregate Mastery Percentage
2011–12
Grade N Fall Assessment Spring Assessment
Minimum Mastery %
Maximum Mastery %
Average Mastery %
Minimum Mastery %
Maximum Mastery %
Average Mastery %
9th 51 0.0% 97.0% 53.6% 10.0% 93.0% 40.5%
10th 24 20.0% 88.0% 49.1% 7.0% 83.0% 46.8%
11th 18 18.0% 80.0% 45.9% 13.0% 67.0% 37.9%
12th 31 0.0% 70.0% 25.7% 8.0% 80.0% 37.1%
Total 124 -- -- 44.7% -- -- 40.5%
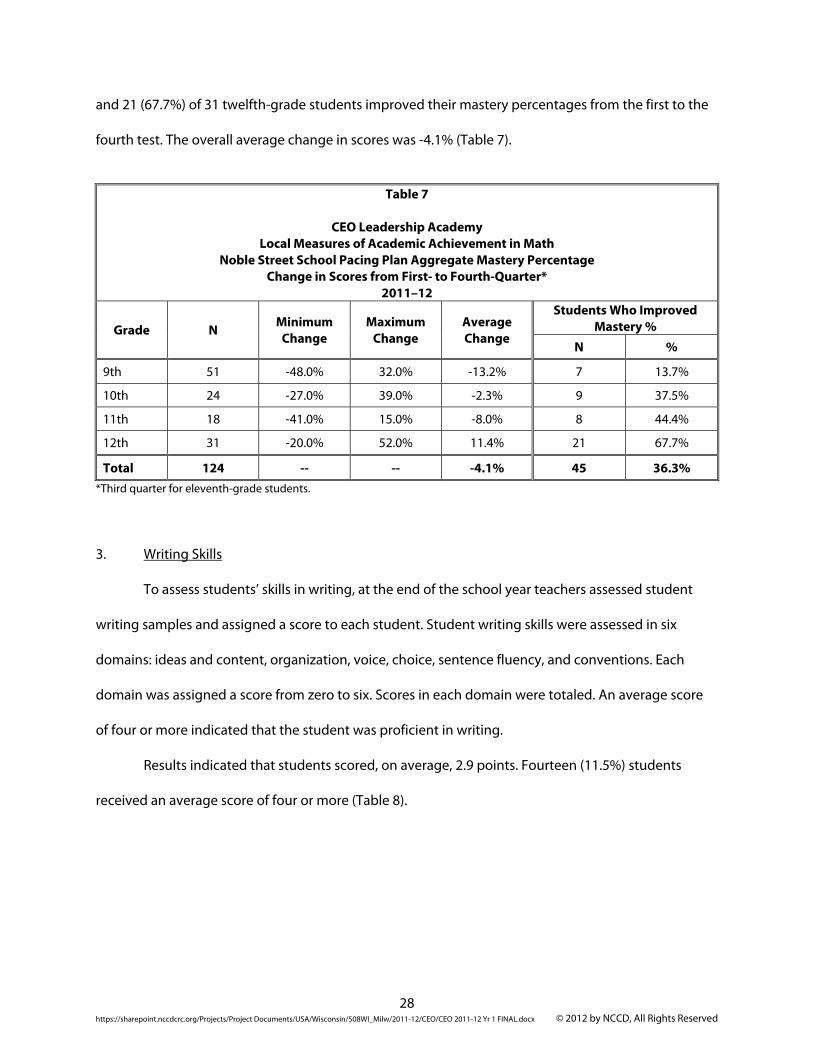
Of the 51 ninth graders who completed the first- and fourth-quarter assessments, seven
(13.7%) improved their mastery percentages between tests, nine (37.5%) of 24 tenth graders improved
their mastery percentages, eight (44.4%) of 18 eleventh graders improved their mastery percentages,
36 Eleventh-grade students did not complete the fourth-quarter assessment; eleventh-grade students completed the ACT in the spring semester instead of the fourth-quarter assessment.
28 https://sharepoint.nccdcrc.org/Projects/Project Documents/USA/Wisconsin/508WI_Milw/2011-12/CEO/CEO 2011-12 Yr 1 FINAL.docx © 2012 by NCCD, All Rights Reserved
and 21 (67.7%) of 31 twelfth-grade students improved their mastery percentages from the first to the
fourth test. The overall average change in scores was -4.1% (Table 7).
Table 7
CEO Leadership Academy
Local Measures of Academic Achievement in Math Noble Street School Pacing Plan Aggregate Mastery Percentage
Change in Scores from First- to Fourth-Quarter* 2011–12
Grade N Minimum Change
Maximum Change
Average Change
Students Who Improved Mastery %
N %
9th 51 -48.0% 32.0% -13.2% 7 13.7%
10th 24 -27.0% 39.0% -2.3% 9 37.5%
11th 18 -41.0% 15.0% -8.0% 8 44.4%
12th 31 -20.0% 52.0% 11.4% 21 67.7%
Total 124 -- -- -4.1% 45 36.3% *Third quarter for eleventh-grade students.
3. Writing Skills
To assess students’ skills in writing, at the end of the school year teachers assessed student
writing samples and assigned a score to each student. Student writing skills were assessed in six
domains: ideas and content, organization, voice, choice, sentence fluency, and conventions. Each
domain was assigned a score from zero to six. Scores in each domain were totaled. An average score
of four or more indicated that the student was proficient in writing.
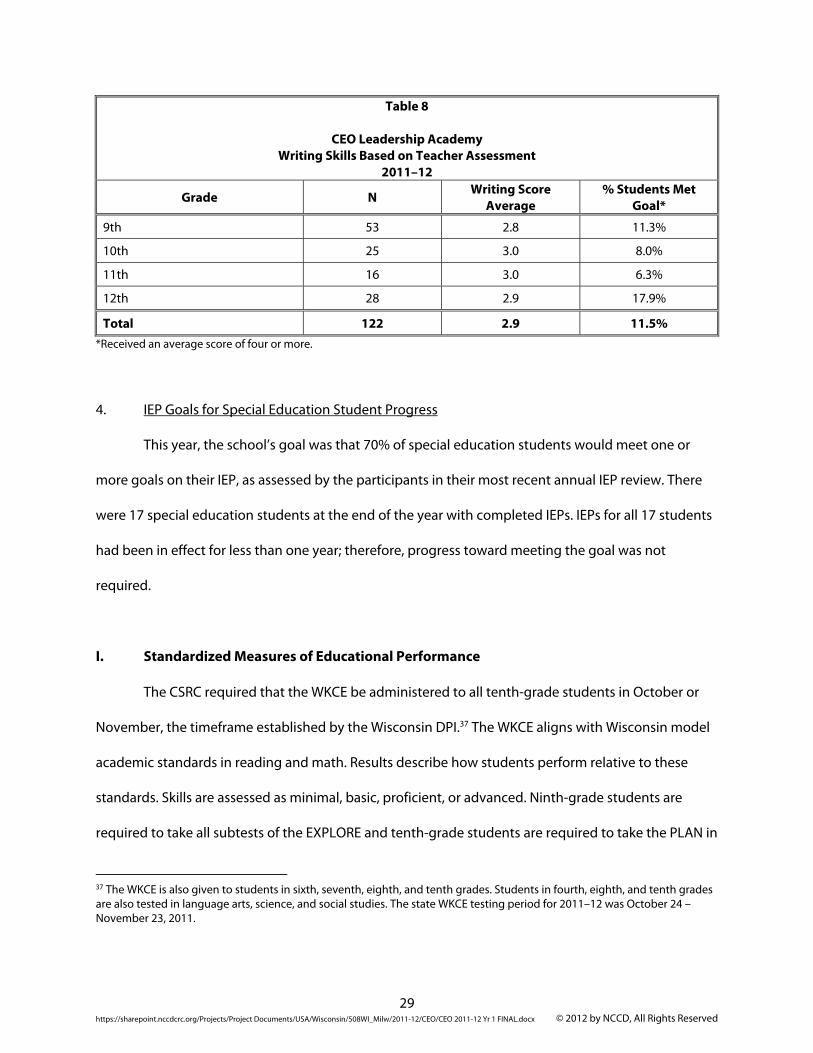
Results indicated that students scored, on average, 2.9 points. Fourteen (11.5%) students
received an average score of four or more (Table 8).
29 https://sharepoint.nccdcrc.org/Projects/Project Documents/USA/Wisconsin/508WI_Milw/2011-12/CEO/CEO 2011-12 Yr 1 FINAL.docx © 2012 by NCCD, All Rights Reserved
Table 8
CEO Leadership Academy Writing Skills Based on Teacher Assessment
2011–12
Grade N Writing Score Average
% Students Met Goal*
9th 53 2.8 11.3%
10th 25 3.0 8.0%
11th 16 3.0 6.3%
12th 28 2.9 17.9%
Total 122 2.9 11.5% *Received an average score of four or more.
4. IEP Goals for Special Education Student Progress
This year, the school’s goal was that 70% of special education students would meet one or
more goals on their IEP, as assessed by the participants in their most recent annual IEP review. There
were 17 special education students at the end of the year with completed IEPs. IEPs for all 17 students
had been in effect for less than one year; therefore, progress toward meeting the goal was not
required.
I. Standardized Measures of Educational Performance
The CSRC required that the WKCE be administered to all tenth-grade students in October or
November, the timeframe established by the Wisconsin DPI.37 The WKCE aligns with Wisconsin model
academic standards in reading and math. Results describe how students perform relative to these
standards. Skills are assessed as minimal, basic, proficient, or advanced. Ninth-grade students are
required to take all subtests of the EXPLORE and tenth-grade students are required to take the PLAN in
37 The WKCE is also given to students in sixth, seventh, eighth, and tenth grades. Students in fourth, eighth, and tenth grades are also tested in language arts, science, and social studies. The state WKCE testing period for 2011–12 was October 24 – November 23, 2011.
30 https://sharepoint.nccdcrc.org/Projects/Project Documents/USA/Wisconsin/508WI_Milw/2011-12/CEO/CEO 2011-12 Yr 1 FINAL.docx © 2012 by NCCD, All Rights Reserved
the fall of the school year; eleventh-grade students are required to take the ACT by the end of the
school year; and twelfth-grade students are required to take the ACT in the fall semester. The
following sections describe student achievement on these tests.
The EXPLORE is the first in a series of two pre-ACT tests developed by ACT and is typically
administered to students in eighth or ninth grade. The EXPLORE includes sections for English, math,
reading, and science. EXPLORE scores provide information about students’ knowledge, skills, interests,
and plans. Students can use this information as they plan their high school coursework and begin
thinking about college and careers. In addition to providing a score for each section, the EXPLORE
provides a composite score for each student that reflects all the areas tested. Students can score
between one and 25 on each section of the test; the composite score, which also ranges from one to
25, is an average of the scores from all four of the subtests.38
The PLAN, the second in the series of pre-ACT tests, is generally taken in tenth grade as a
follow-up to the EXPLORE. Like the EXPLORE, the PLAN includes sections for English, math, reading,
and science. Results of the PLAN can be used as a guidance tool for students planning to attend
college or join the workforce following graduation. It has also been shown to be a predictor of student
success on the ACT. Students can score between one and 32 on each section of the test; the
composite score, which also ranges from one to 32, is an average of the scores from all four of the
subtests.39
In addition to providing information about students’ skill levels in reading, math, English, and
science, scores from the EXPLORE, PLAN, and ACT from consecutive years can be used to gauge
student progress toward college readiness. ACT conducted a study to determine the relationship
between scores on the EXPLORE, PLAN, and ACT with success in college courses. Based on that
38 Information found at http://actstudent.org/explore/index.html, July 2008. 39 Information found at http://www.act.org/plan, July 2008.
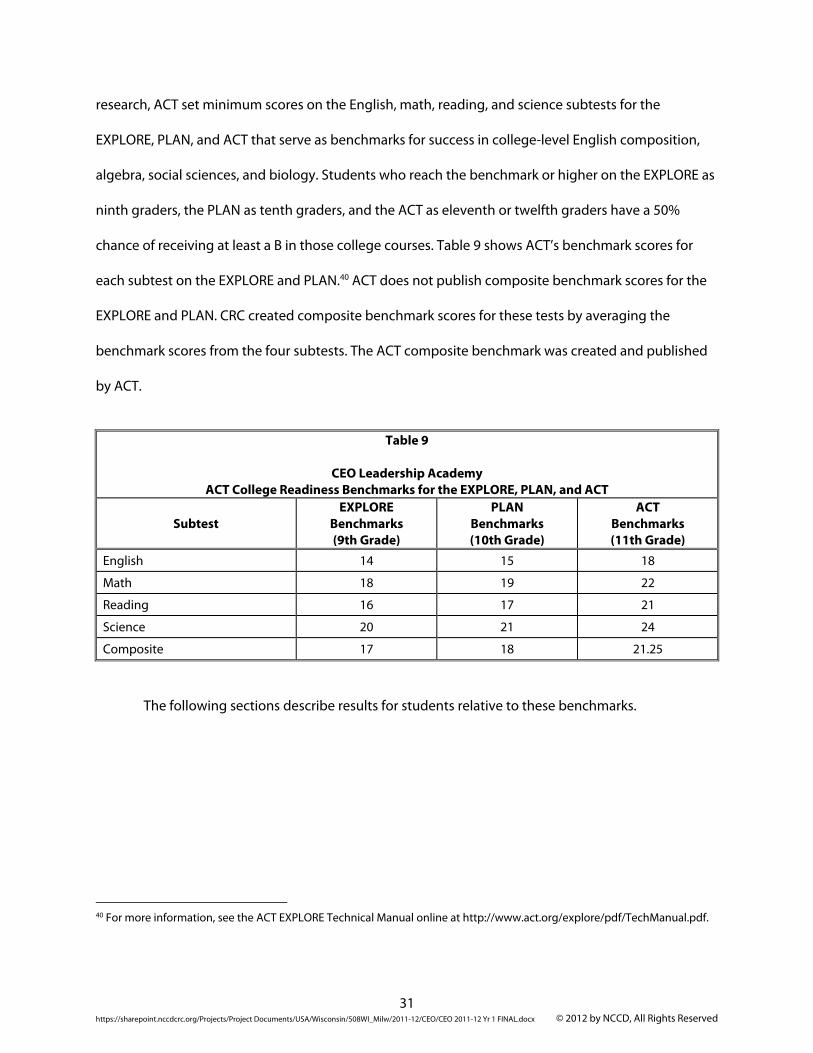
31 https://sharepoint.nccdcrc.org/Projects/Project Documents/USA/Wisconsin/508WI_Milw/2011-12/CEO/CEO 2011-12 Yr 1 FINAL.docx © 2012 by NCCD, All Rights Reserved
research, ACT set minimum scores on the English, math, reading, and science subtests for the
EXPLORE, PLAN, and ACT that serve as benchmarks for success in college-level English composition,
algebra, social sciences, and biology. Students who reach the benchmark or higher on the EXPLORE as
ninth graders, the PLAN as tenth graders, and the ACT as eleventh or twelfth graders have a 50%
chance of receiving at least a B in those college courses. Table 9 shows ACT’s benchmark scores for
each subtest on the EXPLORE and PLAN.40 ACT does not publish composite benchmark scores for the
EXPLORE and PLAN. CRC created composite benchmark scores for these tests by averaging the
benchmark scores from the four subtests. The ACT composite benchmark was created and published
by ACT.
Table 9
CEO Leadership Academy
ACT College Readiness Benchmarks for the EXPLORE, PLAN, and ACT
Subtest EXPLORE
Benchmarks (9th Grade)
PLANBenchmarks (10th Grade)
ACTBenchmarks (11th Grade)
English 14 15 18
Math 18 19 22
Reading 16 17 21
Science 20 21 24
Composite 17 18 21.25
The following sections describe results for students relative to these benchmarks.
40 For more information, see the ACT EXPLORE Technical Manual online at http://www.act.org/explore/pdf/TechManual.pdf.
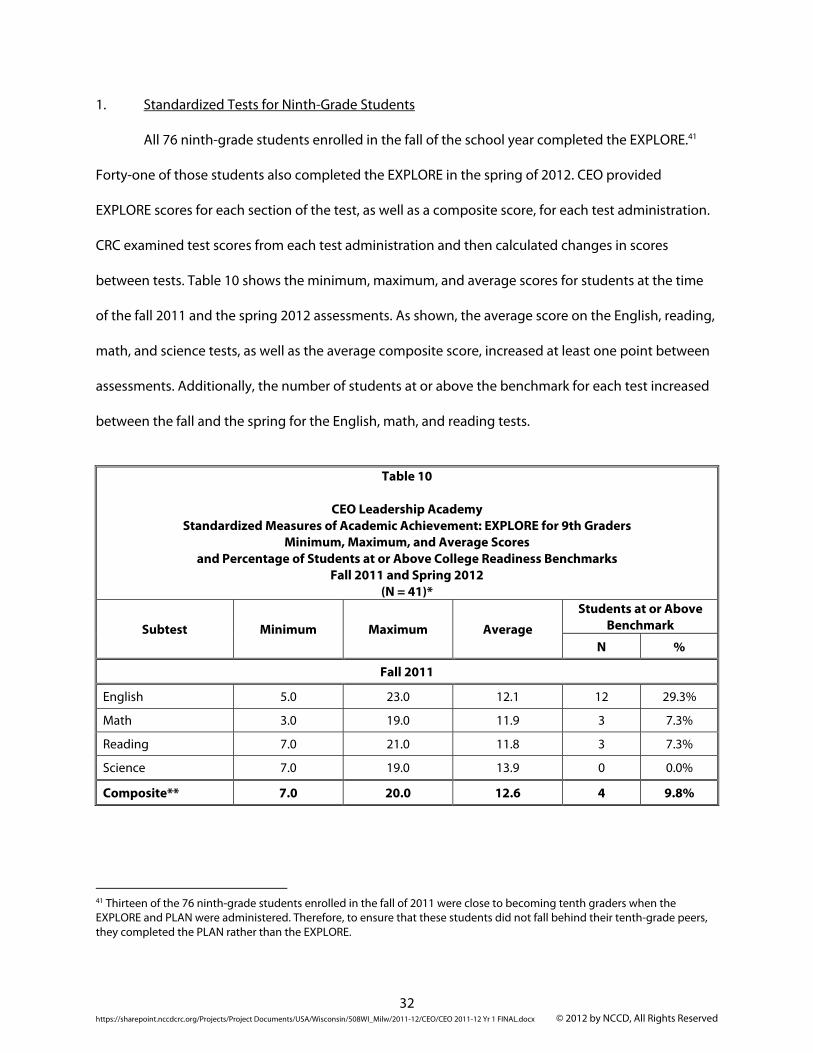
32 https://sharepoint.nccdcrc.org/Projects/Project Documents/USA/Wisconsin/508WI_Milw/2011-12/CEO/CEO 2011-12 Yr 1 FINAL.docx © 2012 by NCCD, All Rights Reserved
1. Standardized Tests for Ninth-Grade Students
All 76 ninth-grade students enrolled in the fall of the school year completed the EXPLORE.41
Forty-one of those students also completed the EXPLORE in the spring of 2012. CEO provided
EXPLORE scores for each section of the test, as well as a composite score, for each test administration.
CRC examined test scores from each test administration and then calculated changes in scores
between tests. Table 10 shows the minimum, maximum, and average scores for students at the time
of the fall 2011 and the spring 2012 assessments. As shown, the average score on the English, reading,
math, and science tests, as well as the average composite score, increased at least one point between
assessments. Additionally, the number of students at or above the benchmark for each test increased
between the fall and the spring for the English, math, and reading tests.
Table 10
CEO Leadership Academy
Standardized Measures of Academic Achievement: EXPLORE for 9th Graders Minimum, Maximum, and Average Scores
and Percentage of Students at or Above College Readiness Benchmarks Fall 2011 and Spring 2012
(N = 41)*
Subtest Minimum Maximum Average
Students at or Above Benchmark
N %
Fall 2011
English 5.0 23.0 12.1 12 29.3%
Math 3.0 19.0 11.9 3 7.3%
Reading 7.0 21.0 11.8 3 7.3%
Science 7.0 19.0 13.9 0 0.0%
Composite** 7.0 20.0 12.6 4 9.8%
41 Thirteen of the 76 ninth-grade students enrolled in the fall of 2011 were close to becoming tenth graders when the EXPLORE and PLAN were administered. Therefore, to ensure that these students did not fall behind their tenth-grade peers, they completed the PLAN rather than the EXPLORE.
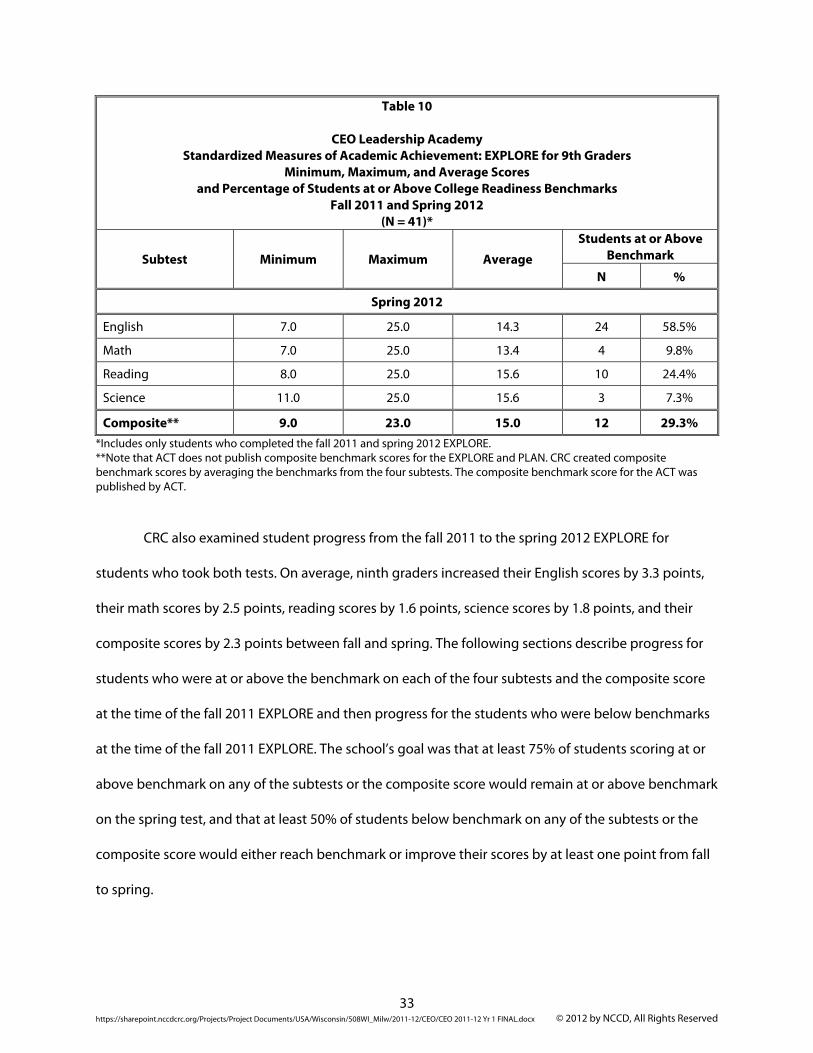
33 https://sharepoint.nccdcrc.org/Projects/Project Documents/USA/Wisconsin/508WI_Milw/2011-12/CEO/CEO 2011-12 Yr 1 FINAL.docx © 2012 by NCCD, All Rights Reserved
Table 10
CEO Leadership Academy Standardized Measures of Academic Achievement: EXPLORE for 9th Graders
Minimum, Maximum, and Average Scores and Percentage of Students at or Above College Readiness Benchmarks
Fall 2011 and Spring 2012 (N = 41)*
Subtest Minimum Maximum Average
Students at or Above Benchmark
N %
Spring 2012
English 7.0 25.0 14.3 24 58.5%
Math 7.0 25.0 13.4 4 9.8%
Reading 8.0 25.0 15.6 10 24.4%
Science 11.0 25.0 15.6 3 7.3%
Composite** 9.0 23.0 15.0 12 29.3% *Includes only students who completed the fall 2011 and spring 2012 EXPLORE. **Note that ACT does not publish composite benchmark scores for the EXPLORE and PLAN. CRC created composite benchmark scores by averaging the benchmarks from the four subtests. The composite benchmark score for the ACT was published by ACT.
CRC also examined student progress from the fall 2011 to the spring 2012 EXPLORE for
students who took both tests. On average, ninth graders increased their English scores by 3.3 points,
their math scores by 2.5 points, reading scores by 1.6 points, science scores by 1.8 points, and their
composite scores by 2.3 points between fall and spring. The following sections describe progress for
students who were at or above the benchmark on each of the four subtests and the composite score
at the time of the fall 2011 EXPLORE and then progress for the students who were below benchmarks
at the time of the fall 2011 EXPLORE. The school’s goal was that at least 75% of students scoring at or
above benchmark on any of the subtests or the composite score would remain at or above benchmark
on the spring test, and that at least 50% of students below benchmark on any of the subtests or the
composite score would either reach benchmark or improve their scores by at least one point from fall
to spring.
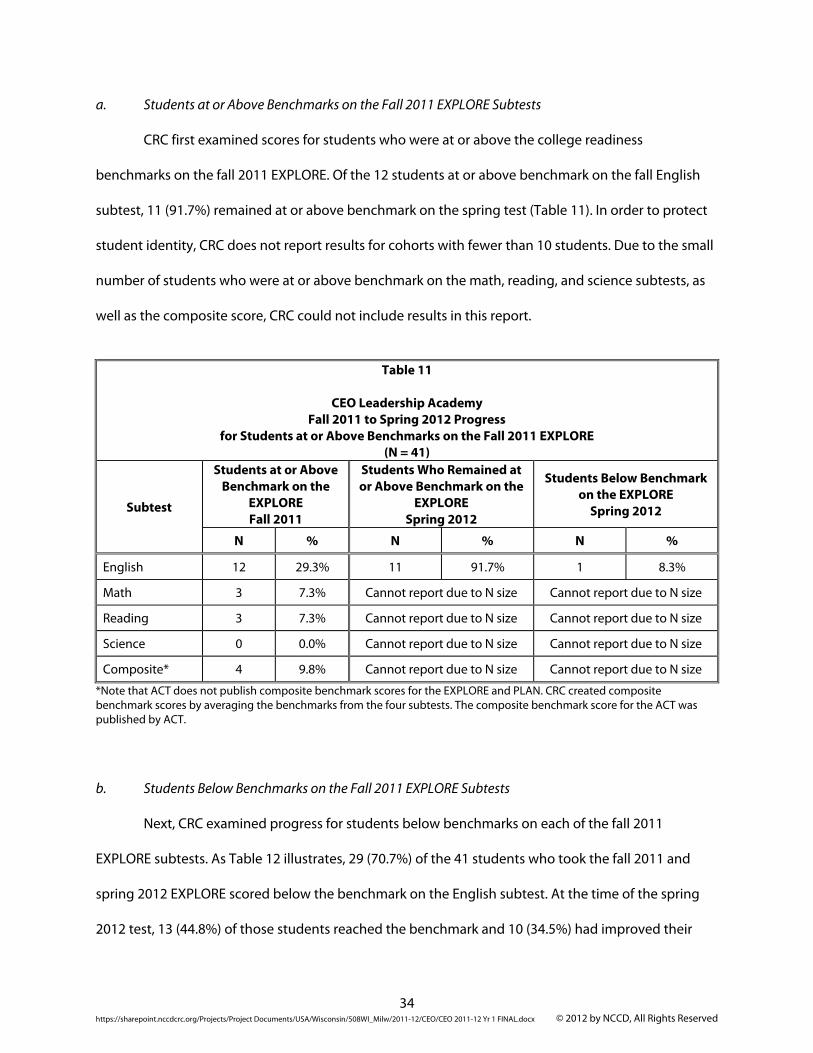
34 https://sharepoint.nccdcrc.org/Projects/Project Documents/USA/Wisconsin/508WI_Milw/2011-12/CEO/CEO 2011-12 Yr 1 FINAL.docx © 2012 by NCCD, All Rights Reserved
a. Students at or Above Benchmarks on the Fall 2011 EXPLORE Subtests
CRC first examined scores for students who were at or above the college readiness
benchmarks on the fall 2011 EXPLORE. Of the 12 students at or above benchmark on the fall English
subtest, 11 (91.7%) remained at or above benchmark on the spring test (Table 11). In order to protect
student identity, CRC does not report results for cohorts with fewer than 10 students. Due to the small
number of students who were at or above benchmark on the math, reading, and science subtests, as
well as the composite score, CRC could not include results in this report.
Table 11
CEO Leadership Academy
Fall 2011 to Spring 2012 Progress for Students at or Above Benchmarks on the Fall 2011 EXPLORE
(N = 41)
Subtest
Students at or Above Benchmark on the
EXPLORE Fall 2011
Students Who Remained at or Above Benchmark on the
EXPLORE Spring 2012
Students Below Benchmark on the EXPLORE
Spring 2012
N % N % N %
English 12 29.3% 11 91.7% 1 8.3%
Math 3 7.3% Cannot report due to N size Cannot report due to N size
Reading 3 7.3% Cannot report due to N size Cannot report due to N size
Science 0 0.0% Cannot report due to N size Cannot report due to N size
Composite* 4 9.8% Cannot report due to N size Cannot report due to N size
*Note that ACT does not publish composite benchmark scores for the EXPLORE and PLAN. CRC created composite benchmark scores by averaging the benchmarks from the four subtests. The composite benchmark score for the ACT was published by ACT. b. Students Below Benchmarks on the Fall 2011 EXPLORE Subtests
Next, CRC examined progress for students below benchmarks on each of the fall 2011
EXPLORE subtests. As Table 12 illustrates, 29 (70.7%) of the 41 students who took the fall 2011 and
spring 2012 EXPLORE scored below the benchmark on the English subtest. At the time of the spring
2012 test, 13 (44.8%) of those students reached the benchmark and 10 (34.5%) had improved their
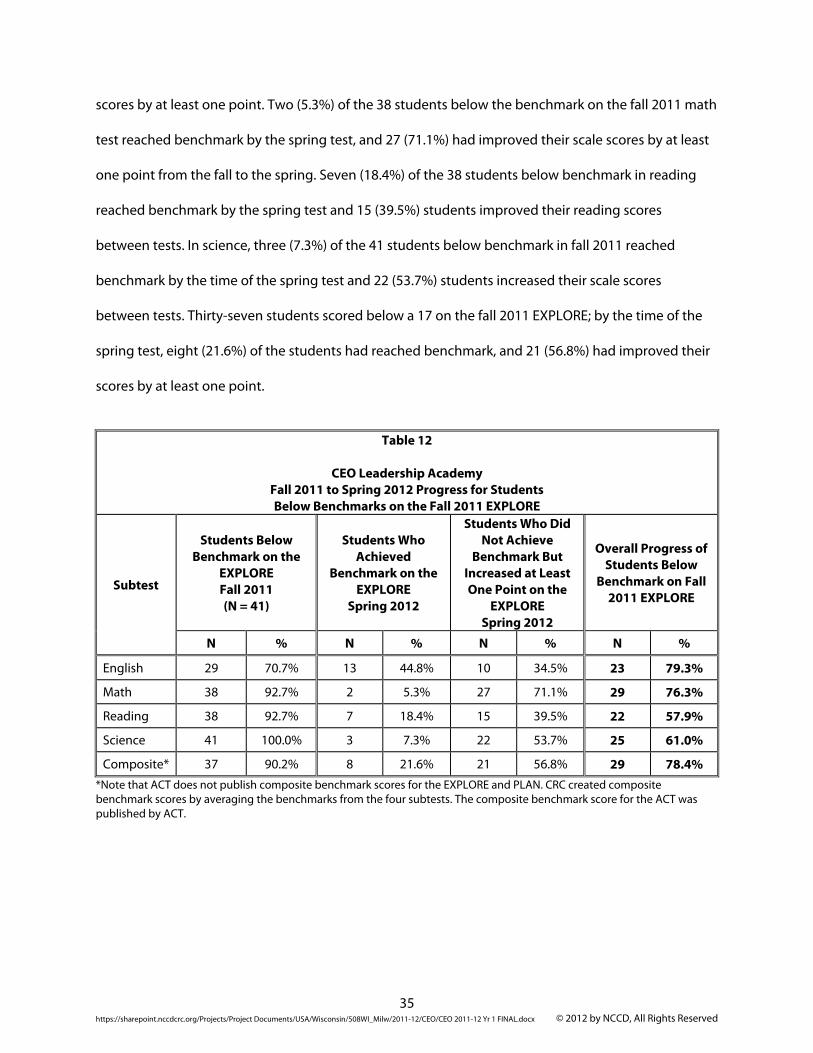
35 https://sharepoint.nccdcrc.org/Projects/Project Documents/USA/Wisconsin/508WI_Milw/2011-12/CEO/CEO 2011-12 Yr 1 FINAL.docx © 2012 by NCCD, All Rights Reserved
scores by at least one point. Two (5.3%) of the 38 students below the benchmark on the fall 2011 math
test reached benchmark by the spring test, and 27 (71.1%) had improved their scale scores by at least
one point from the fall to the spring. Seven (18.4%) of the 38 students below benchmark in reading
reached benchmark by the spring test and 15 (39.5%) students improved their reading scores
between tests. In science, three (7.3%) of the 41 students below benchmark in fall 2011 reached
benchmark by the time of the spring test and 22 (53.7%) students increased their scale scores
between tests. Thirty-seven students scored below a 17 on the fall 2011 EXPLORE; by the time of the
spring test, eight (21.6%) of the students had reached benchmark, and 21 (56.8%) had improved their
scores by at least one point.
Table 12
CEO Leadership Academy
Fall 2011 to Spring 2012 Progress for Students Below Benchmarks on the Fall 2011 EXPLORE
Subtest
Students Below Benchmark on the
EXPLORE Fall 2011 (N = 41)
Students Who Achieved
Benchmark on the EXPLORE
Spring 2012
Students Who Did Not Achieve
Benchmark But Increased at Least One Point on the
EXPLORE Spring 2012
Overall Progress of Students Below
Benchmark on Fall 2011 EXPLORE
N % N % N % N %
English 29 70.7% 13 44.8% 10 34.5% 23 79.3%
Math 38 92.7% 2 5.3% 27 71.1% 29 76.3%
Reading 38 92.7% 7 18.4% 15 39.5% 22 57.9%
Science 41 100.0% 3 7.3% 22 53.7% 25 61.0%
Composite* 37 90.2% 8 21.6% 21 56.8% 29 78.4% *Note that ACT does not publish composite benchmark scores for the EXPLORE and PLAN. CRC created composite benchmark scores by averaging the benchmarks from the four subtests. The composite benchmark score for the ACT was published by ACT.
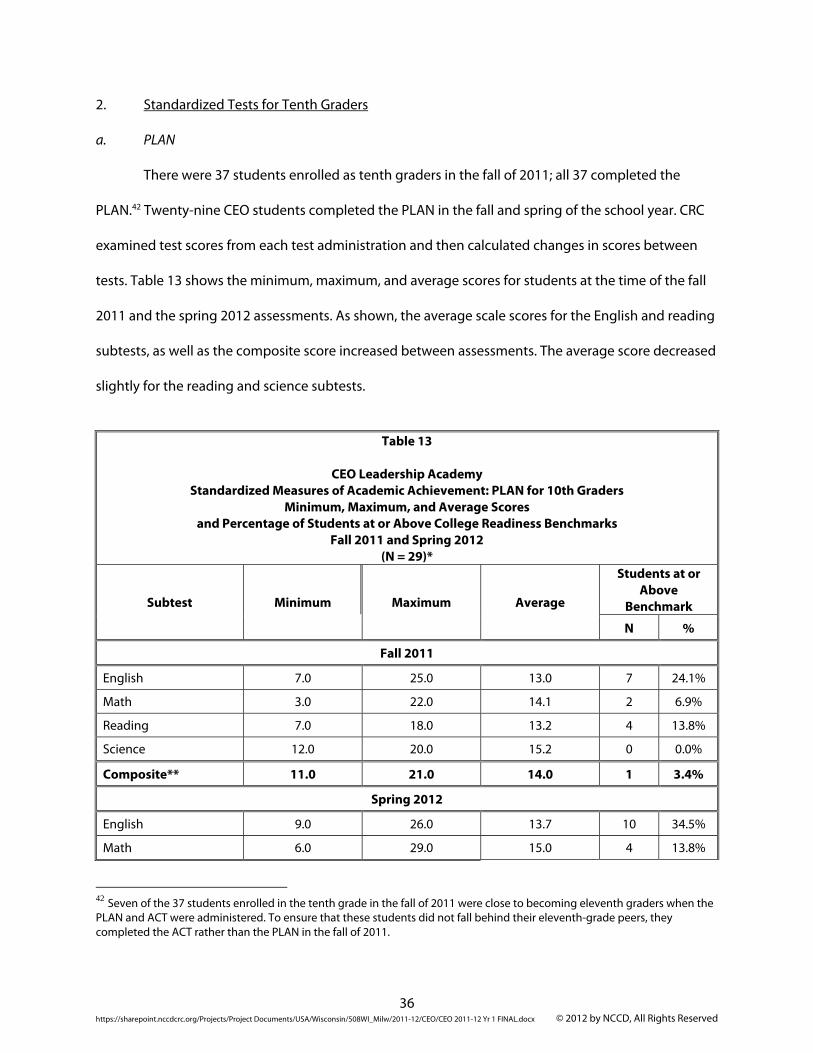
36 https://sharepoint.nccdcrc.org/Projects/Project Documents/USA/Wisconsin/508WI_Milw/2011-12/CEO/CEO 2011-12 Yr 1 FINAL.docx © 2012 by NCCD, All Rights Reserved
2. Standardized Tests for Tenth Graders
a. PLAN
There were 37 students enrolled as tenth graders in the fall of 2011; all 37 completed the
PLAN.42 Twenty-nine CEO students completed the PLAN in the fall and spring of the school year. CRC
examined test scores from each test administration and then calculated changes in scores between
tests. Table 13 shows the minimum, maximum, and average scores for students at the time of the fall
2011 and the spring 2012 assessments. As shown, the average scale scores for the English and reading
subtests, as well as the composite score increased between assessments. The average score decreased
slightly for the reading and science subtests.
Table 13
CEO Leadership Academy
Standardized Measures of Academic Achievement: PLAN for 10th Graders Minimum, Maximum, and Average Scores
and Percentage of Students at or Above College Readiness Benchmarks Fall 2011 and Spring 2012
(N = 29)*
Subtest Minimum Maximum Average
Students at or Above
Benchmark
N %
Fall 2011
English 7.0 25.0 13.0 7 24.1%
Math 3.0 22.0 14.1 2 6.9%
Reading 7.0 18.0 13.2 4 13.8%
Science 12.0 20.0 15.2 0 0.0%
Composite** 11.0 21.0 14.0 1 3.4%
Spring 2012
English 9.0 26.0 13.7 10 34.5%
Math 6.0 29.0 15.0 4 13.8%
42 Seven of the 37 students enrolled in the tenth grade in the fall of 2011 were close to becoming eleventh graders when the PLAN and ACT were administered. To ensure that these students did not fall behind their eleventh-grade peers, they completed the ACT rather than the PLAN in the fall of 2011.
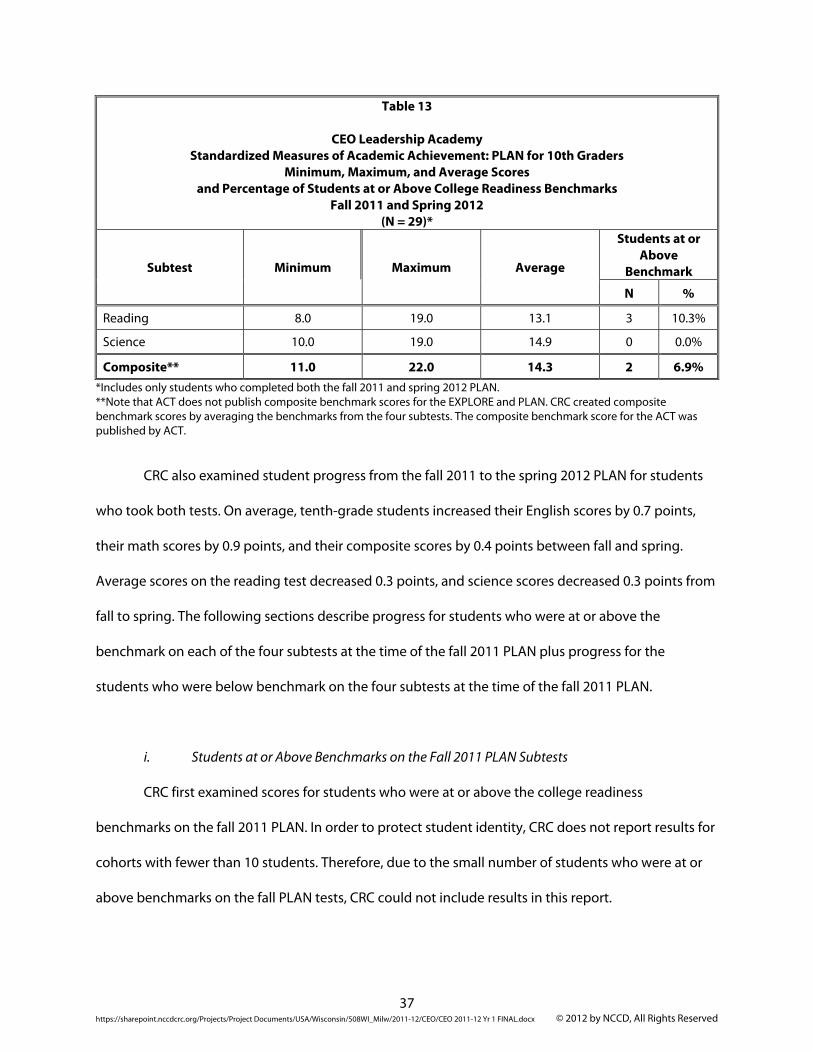
37 https://sharepoint.nccdcrc.org/Projects/Project Documents/USA/Wisconsin/508WI_Milw/2011-12/CEO/CEO 2011-12 Yr 1 FINAL.docx © 2012 by NCCD, All Rights Reserved
Table 13
CEO Leadership Academy Standardized Measures of Academic Achievement: PLAN for 10th Graders
Minimum, Maximum, and Average Scores and Percentage of Students at or Above College Readiness Benchmarks
Fall 2011 and Spring 2012 (N = 29)*
Subtest Minimum Maximum Average
Students at or Above
Benchmark
N %
Reading 8.0 19.0 13.1 3 10.3%
Science 10.0 19.0 14.9 0 0.0%
Composite** 11.0 22.0 14.3 2 6.9% *Includes only students who completed both the fall 2011 and spring 2012 PLAN. **Note that ACT does not publish composite benchmark scores for the EXPLORE and PLAN. CRC created composite benchmark scores by averaging the benchmarks from the four subtests. The composite benchmark score for the ACT was published by ACT.
CRC also examined student progress from the fall 2011 to the spring 2012 PLAN for students
who took both tests. On average, tenth-grade students increased their English scores by 0.7 points,
their math scores by 0.9 points, and their composite scores by 0.4 points between fall and spring.
Average scores on the reading test decreased 0.3 points, and science scores decreased 0.3 points from
fall to spring. The following sections describe progress for students who were at or above the
benchmark on each of the four subtests at the time of the fall 2011 PLAN plus progress for the
students who were below benchmark on the four subtests at the time of the fall 2011 PLAN.
i. Students at or Above Benchmarks on the Fall 2011 PLAN Subtests
CRC first examined scores for students who were at or above the college readiness
benchmarks on the fall 2011 PLAN. In order to protect student identity, CRC does not report results for
cohorts with fewer than 10 students. Therefore, due to the small number of students who were at or
above benchmarks on the fall PLAN tests, CRC could not include results in this report.
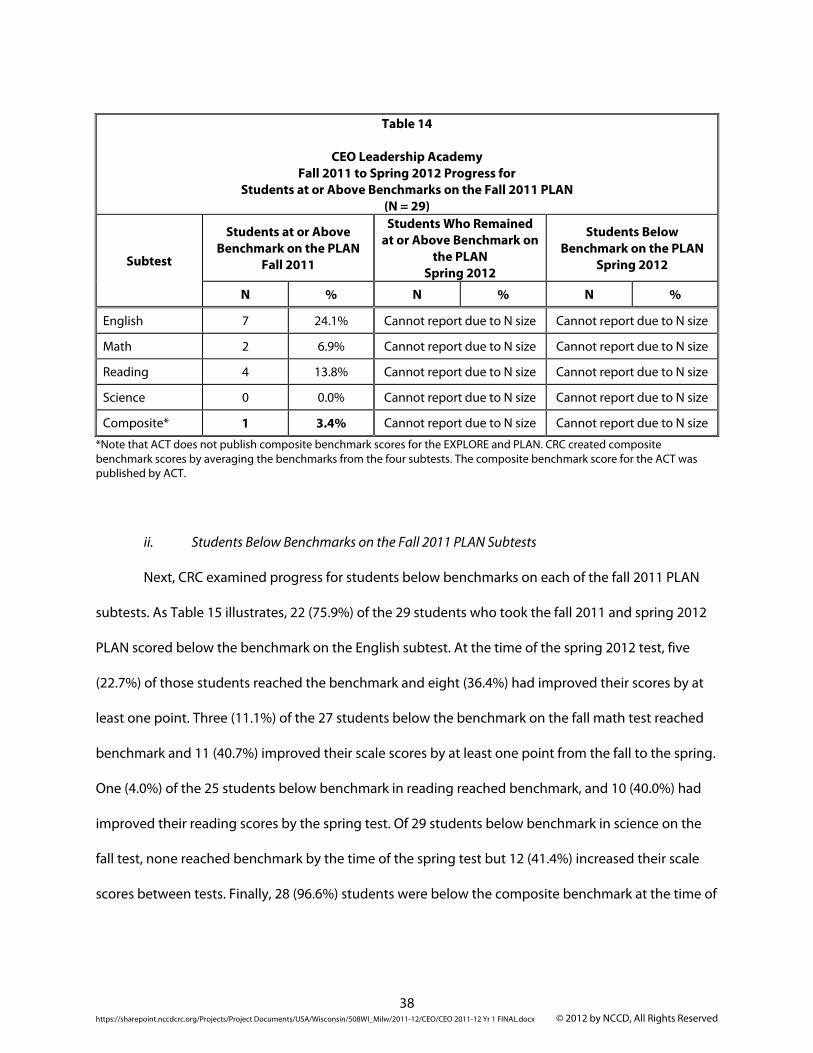
38 https://sharepoint.nccdcrc.org/Projects/Project Documents/USA/Wisconsin/508WI_Milw/2011-12/CEO/CEO 2011-12 Yr 1 FINAL.docx © 2012 by NCCD, All Rights Reserved
Table 14
CEO Leadership Academy
Fall 2011 to Spring 2012 Progress for Students at or Above Benchmarks on the Fall 2011 PLAN
(N = 29)
Subtest
Students at or Above Benchmark on the PLAN
Fall 2011
Students Who Remained at or Above Benchmark on
the PLAN Spring 2012
Students Below Benchmark on the PLAN
Spring 2012
N % N % N %
English 7 24.1% Cannot report due to N size Cannot report due to N size
Math 2 6.9% Cannot report due to N size Cannot report due to N size
Reading 4 13.8% Cannot report due to N size Cannot report due to N size
Science 0 0.0% Cannot report due to N size Cannot report due to N size
Composite* 1 3.4% Cannot report due to N size Cannot report due to N size
*Note that ACT does not publish composite benchmark scores for the EXPLORE and PLAN. CRC created composite benchmark scores by averaging the benchmarks from the four subtests. The composite benchmark score for the ACT was published by ACT.
ii. Students Below Benchmarks on the Fall 2011 PLAN Subtests
Next, CRC examined progress for students below benchmarks on each of the fall 2011 PLAN
subtests. As Table 15 illustrates, 22 (75.9%) of the 29 students who took the fall 2011 and spring 2012
PLAN scored below the benchmark on the English subtest. At the time of the spring 2012 test, five
(22.7%) of those students reached the benchmark and eight (36.4%) had improved their scores by at
least one point. Three (11.1%) of the 27 students below the benchmark on the fall math test reached
benchmark and 11 (40.7%) improved their scale scores by at least one point from the fall to the spring.
One (4.0%) of the 25 students below benchmark in reading reached benchmark, and 10 (40.0%) had
improved their reading scores by the spring test. Of 29 students below benchmark in science on the
fall test, none reached benchmark by the time of the spring test but 12 (41.4%) increased their scale
scores between tests. Finally, 28 (96.6%) students were below the composite benchmark at the time of
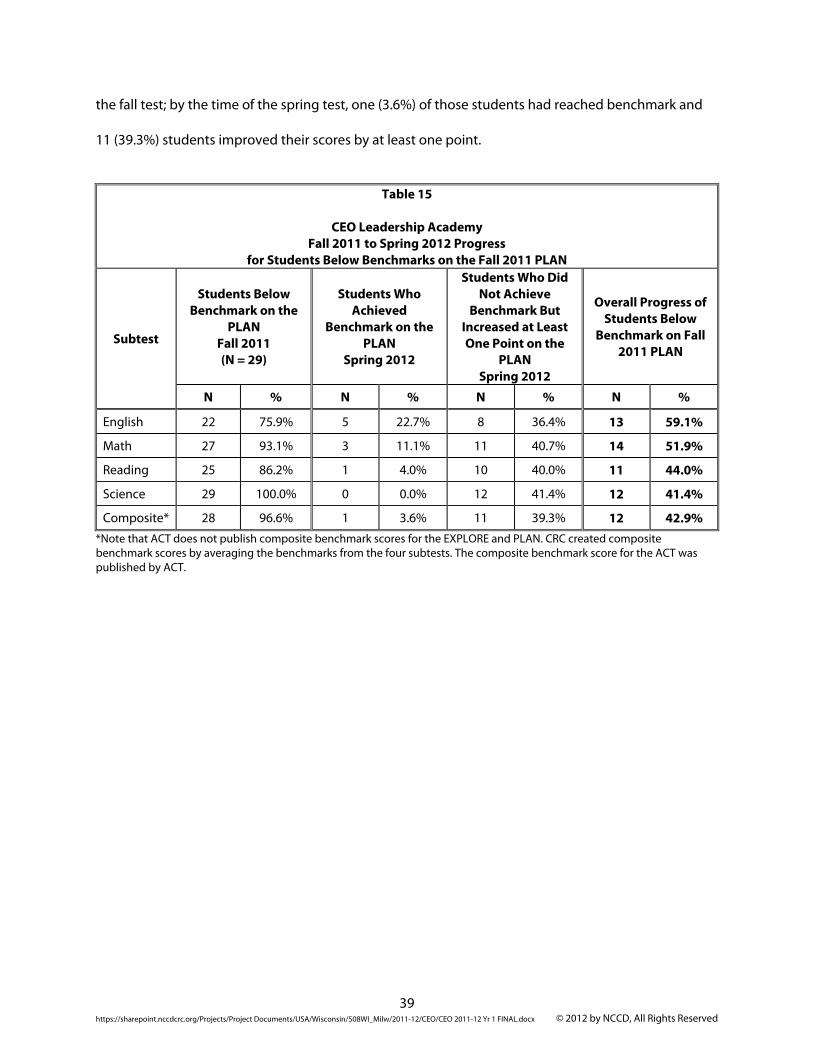
39 https://sharepoint.nccdcrc.org/Projects/Project Documents/USA/Wisconsin/508WI_Milw/2011-12/CEO/CEO 2011-12 Yr 1 FINAL.docx © 2012 by NCCD, All Rights Reserved
the fall test; by the time of the spring test, one (3.6%) of those students had reached benchmark and
11 (39.3%) students improved their scores by at least one point.
Table 15
CEO Leadership Academy
Fall 2011 to Spring 2012 Progress for Students Below Benchmarks on the Fall 2011 PLAN
Subtest
Students Below Benchmark on the
PLAN Fall 2011 (N = 29)
Students Who Achieved
Benchmark on the PLAN
Spring 2012
Students Who Did Not Achieve
Benchmark But Increased at Least One Point on the
PLAN Spring 2012
Overall Progress of Students Below
Benchmark on Fall 2011 PLAN
N % N % N % N %
English 22 75.9% 5 22.7% 8 36.4% 13 59.1%
Math 27 93.1% 3 11.1% 11 40.7% 14 51.9%
Reading 25 86.2% 1 4.0% 10 40.0% 11 44.0%
Science 29 100.0% 0 0.0% 12 41.4% 12 41.4%
Composite* 28 96.6% 1 3.6% 11 39.3% 12 42.9% *Note that ACT does not publish composite benchmark scores for the EXPLORE and PLAN. CRC created composite benchmark scores by averaging the benchmarks from the four subtests. The composite benchmark score for the ACT was published by ACT.
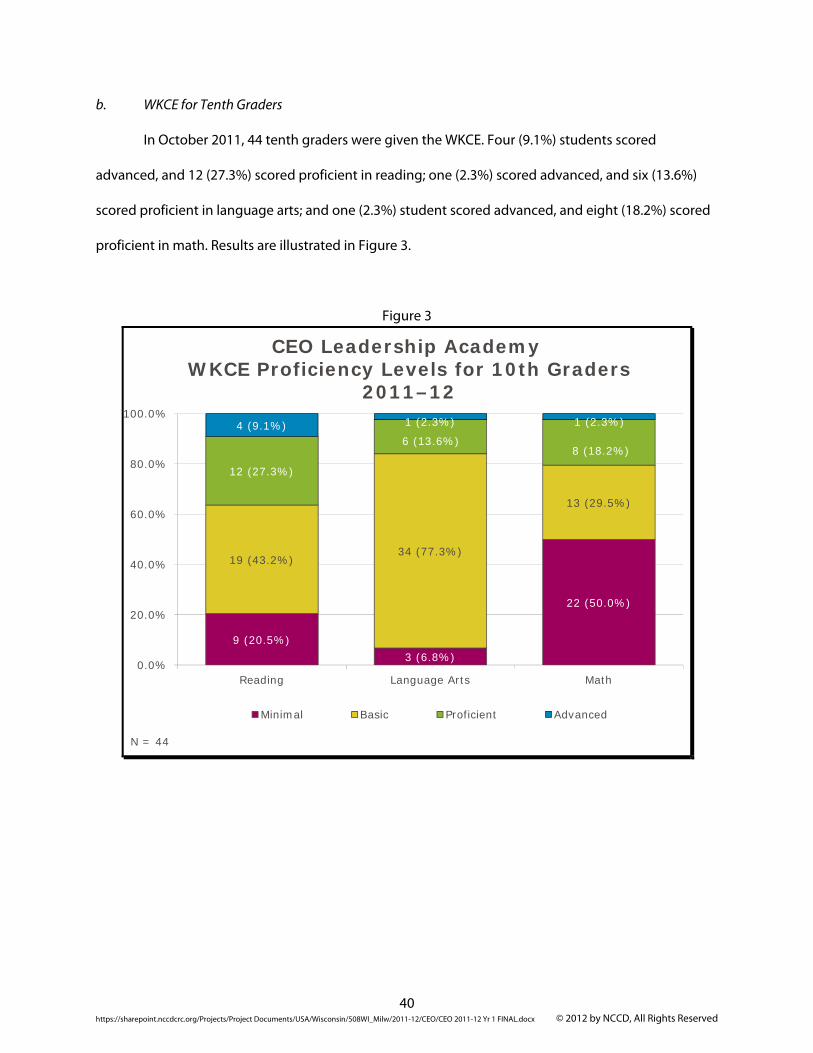
40 https://sharepoint.nccdcrc.org/Projects/Project Documents/USA/Wisconsin/508WI_Milw/2011-12/CEO/CEO 2011-12 Yr 1 FINAL.docx © 2012 by NCCD, All Rights Reserved
b. WKCE for Tenth Graders
In October 2011, 44 tenth graders were given the WKCE. Four (9.1%) students scored
advanced, and 12 (27.3%) scored proficient in reading; one (2.3%) scored advanced, and six (13.6%)
scored proficient in language arts; and one (2.3%) student scored advanced, and eight (18.2%) scored
proficient in math. Results are illustrated in Figure 3.
Figure 3
CEO Leadership AcademyWKCE Proficiency Levels for 10th Graders
2011–12
9 (20.5%)3 (6.8%)
22 (50.0%)
19 (43.2%)34 (77.3%)
13 (29.5%)
12 (27.3%)
6 (13.6%)8 (18.2%)
4 (9.1%) 1 (2.3%) 1 (2.3%)
0.0%
20.0%
40.0%
60.0%
80.0%
100.0%
Reading Language Arts Math
Minimal Basic Proficient Advanced
N = 44
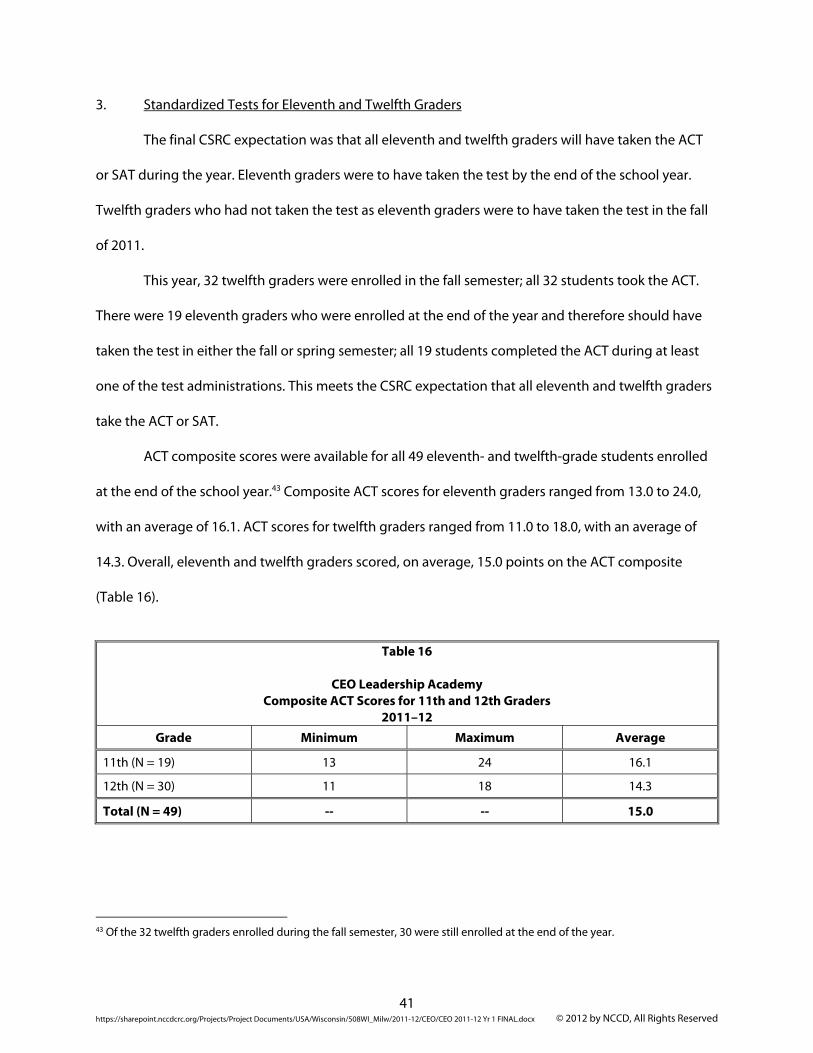
41 https://sharepoint.nccdcrc.org/Projects/Project Documents/USA/Wisconsin/508WI_Milw/2011-12/CEO/CEO 2011-12 Yr 1 FINAL.docx © 2012 by NCCD, All Rights Reserved
3. Standardized Tests for Eleventh and Twelfth Graders
The final CSRC expectation was that all eleventh and twelfth graders will have taken the ACT
or SAT during the year. Eleventh graders were to have taken the test by the end of the school year.
Twelfth graders who had not taken the test as eleventh graders were to have taken the test in the fall
of 2011.
This year, 32 twelfth graders were enrolled in the fall semester; all 32 students took the ACT.
There were 19 eleventh graders who were enrolled at the end of the year and therefore should have
taken the test in either the fall or spring semester; all 19 students completed the ACT during at least
one of the test administrations. This meets the CSRC expectation that all eleventh and twelfth graders
take the ACT or SAT.
ACT composite scores were available for all 49 eleventh- and twelfth-grade students enrolled
at the end of the school year.43 Composite ACT scores for eleventh graders ranged from 13.0 to 24.0,
with an average of 16.1. ACT scores for twelfth graders ranged from 11.0 to 18.0, with an average of
14.3. Overall, eleventh and twelfth graders scored, on average, 15.0 points on the ACT composite
(Table 16).
Table 16
CEO Leadership Academy
Composite ACT Scores for 11th and 12th Graders 2011–12
Grade Minimum Maximum Average
11th (N = 19) 13 24 16.1
12th (N = 30) 11 18 14.3
Total (N = 49) -- -- 15.0
43 Of the 32 twelfth graders enrolled during the fall semester, 30 were still enrolled at the end of the year.
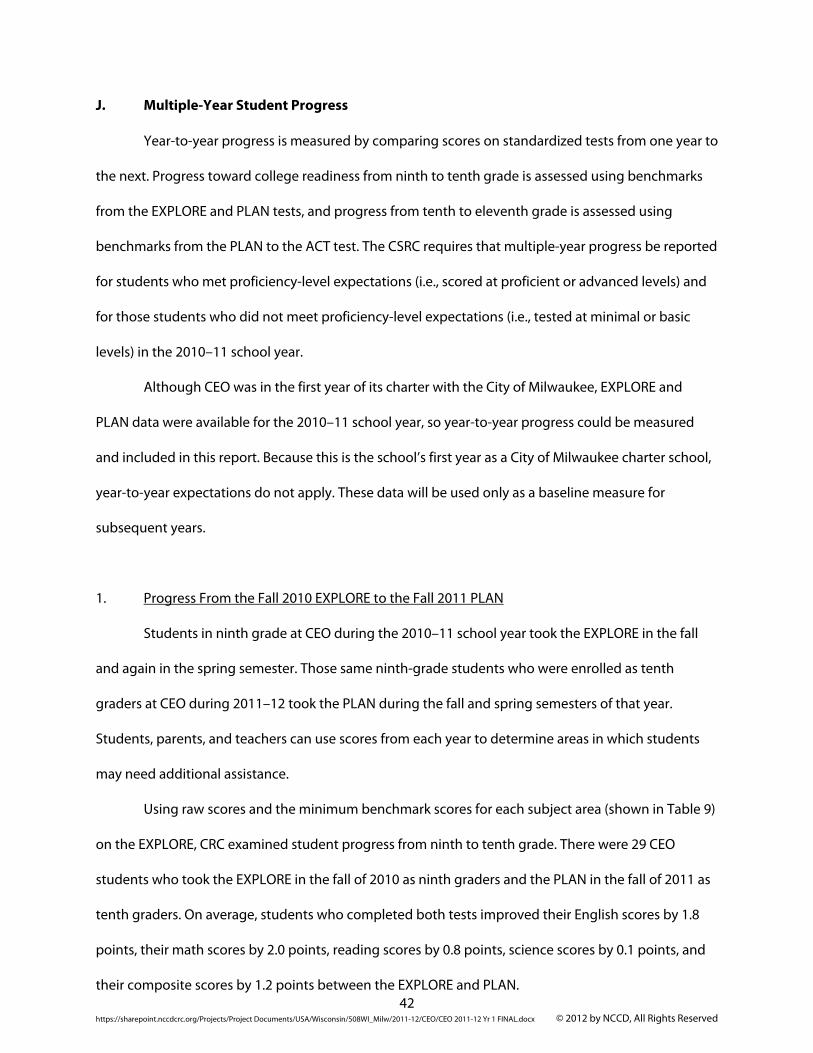
42 https://sharepoint.nccdcrc.org/Projects/Project Documents/USA/Wisconsin/508WI_Milw/2011-12/CEO/CEO 2011-12 Yr 1 FINAL.docx © 2012 by NCCD, All Rights Reserved
J. Multiple-Year Student Progress
Year-to-year progress is measured by comparing scores on standardized tests from one year to
the next. Progress toward college readiness from ninth to tenth grade is assessed using benchmarks
from the EXPLORE and PLAN tests, and progress from tenth to eleventh grade is assessed using
benchmarks from the PLAN to the ACT test. The CSRC requires that multiple-year progress be reported
for students who met proficiency-level expectations (i.e., scored at proficient or advanced levels) and
for those students who did not meet proficiency-level expectations (i.e., tested at minimal or basic
levels) in the 2010–11 school year.
Although CEO was in the first year of its charter with the City of Milwaukee, EXPLORE and
PLAN data were available for the 2010–11 school year, so year-to-year progress could be measured
and included in this report. Because this is the school’s first year as a City of Milwaukee charter school,
year-to-year expectations do not apply. These data will be used only as a baseline measure for
subsequent years.
1. Progress From the Fall 2010 EXPLORE to the Fall 2011 PLAN
Students in ninth grade at CEO during the 2010–11 school year took the EXPLORE in the fall
and again in the spring semester. Those same ninth-grade students who were enrolled as tenth
graders at CEO during 2011–12 took the PLAN during the fall and spring semesters of that year.
Students, parents, and teachers can use scores from each year to determine areas in which students
may need additional assistance.
Using raw scores and the minimum benchmark scores for each subject area (shown in Table 9)
on the EXPLORE, CRC examined student progress from ninth to tenth grade. There were 29 CEO
students who took the EXPLORE in the fall of 2010 as ninth graders and the PLAN in the fall of 2011 as
tenth graders. On average, students who completed both tests improved their English scores by 1.8
points, their math scores by 2.0 points, reading scores by 0.8 points, science scores by 0.1 points, and
their composite scores by 1.2 points between the EXPLORE and PLAN.
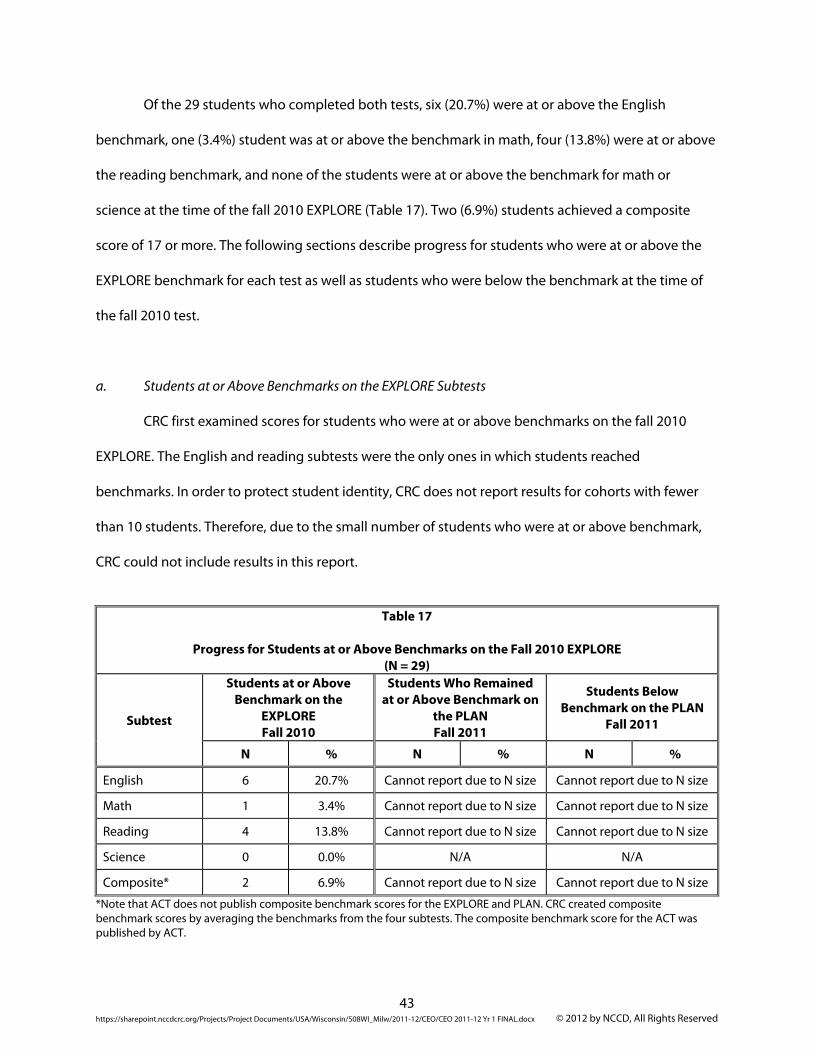
43 https://sharepoint.nccdcrc.org/Projects/Project Documents/USA/Wisconsin/508WI_Milw/2011-12/CEO/CEO 2011-12 Yr 1 FINAL.docx © 2012 by NCCD, All Rights Reserved
Of the 29 students who completed both tests, six (20.7%) were at or above the English
benchmark, one (3.4%) student was at or above the benchmark in math, four (13.8%) were at or above
the reading benchmark, and none of the students were at or above the benchmark for math or
science at the time of the fall 2010 EXPLORE (Table 17). Two (6.9%) students achieved a composite
score of 17 or more. The following sections describe progress for students who were at or above the
EXPLORE benchmark for each test as well as students who were below the benchmark at the time of
the fall 2010 test.
a. Students at or Above Benchmarks on the EXPLORE Subtests
CRC first examined scores for students who were at or above benchmarks on the fall 2010
EXPLORE. The English and reading subtests were the only ones in which students reached
benchmarks. In order to protect student identity, CRC does not report results for cohorts with fewer
than 10 students. Therefore, due to the small number of students who were at or above benchmark,
CRC could not include results in this report.
Table 17
Progress for Students at or Above Benchmarks on the Fall 2010 EXPLORE
(N = 29)
Subtest
Students at or Above Benchmark on the
EXPLORE Fall 2010
Students Who Remained at or Above Benchmark on
the PLAN Fall 2011
Students Below Benchmark on the PLAN
Fall 2011
N % N % N %
English 6 20.7% Cannot report due to N size Cannot report due to N size
Math 1 3.4% Cannot report due to N size Cannot report due to N size
Reading 4 13.8% Cannot report due to N size Cannot report due to N size
Science 0 0.0% N/A N/A
Composite* 2 6.9% Cannot report due to N size Cannot report due to N size
*Note that ACT does not publish composite benchmark scores for the EXPLORE and PLAN. CRC created composite benchmark scores by averaging the benchmarks from the four subtests. The composite benchmark score for the ACT was published by ACT.
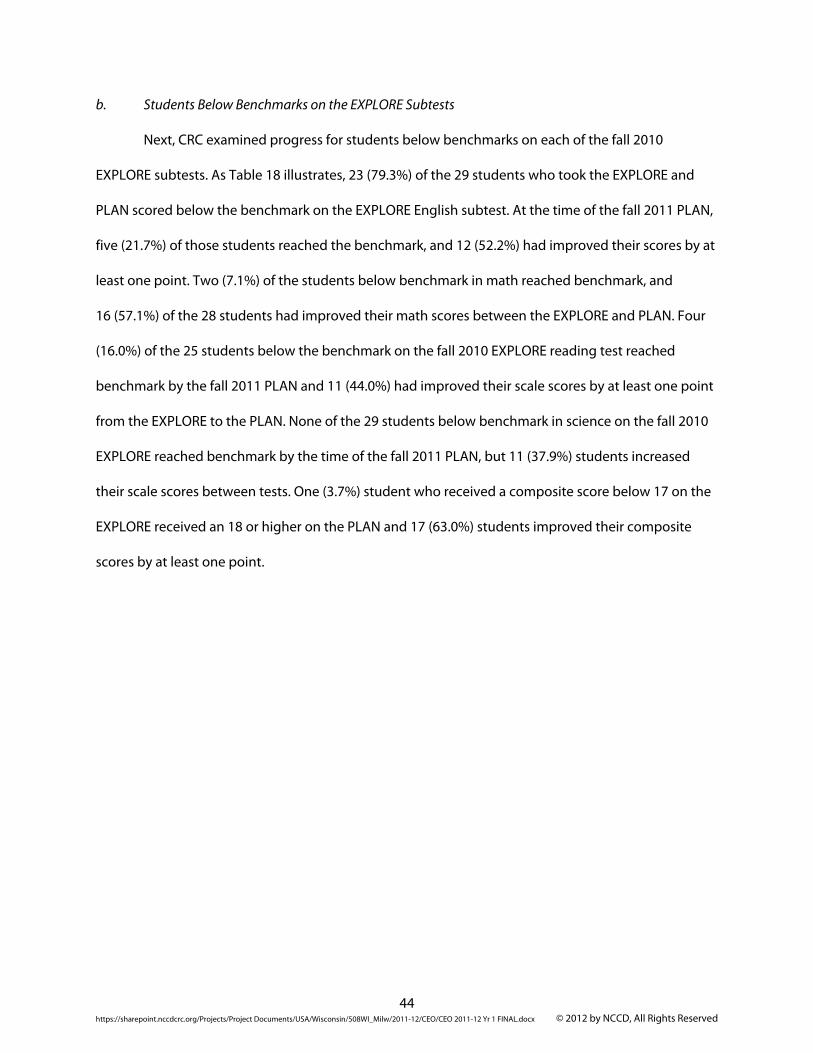
44 https://sharepoint.nccdcrc.org/Projects/Project Documents/USA/Wisconsin/508WI_Milw/2011-12/CEO/CEO 2011-12 Yr 1 FINAL.docx © 2012 by NCCD, All Rights Reserved
b. Students Below Benchmarks on the EXPLORE Subtests
Next, CRC examined progress for students below benchmarks on each of the fall 2010
EXPLORE subtests. As Table 18 illustrates, 23 (79.3%) of the 29 students who took the EXPLORE and
PLAN scored below the benchmark on the EXPLORE English subtest. At the time of the fall 2011 PLAN,
five (21.7%) of those students reached the benchmark, and 12 (52.2%) had improved their scores by at
least one point. Two (7.1%) of the students below benchmark in math reached benchmark, and
16 (57.1%) of the 28 students had improved their math scores between the EXPLORE and PLAN. Four
(16.0%) of the 25 students below the benchmark on the fall 2010 EXPLORE reading test reached
benchmark by the fall 2011 PLAN and 11 (44.0%) had improved their scale scores by at least one point
from the EXPLORE to the PLAN. None of the 29 students below benchmark in science on the fall 2010
EXPLORE reached benchmark by the time of the fall 2011 PLAN, but 11 (37.9%) students increased
their scale scores between tests. One (3.7%) student who received a composite score below 17 on the
EXPLORE received an 18 or higher on the PLAN and 17 (63.0%) students improved their composite
scores by at least one point.
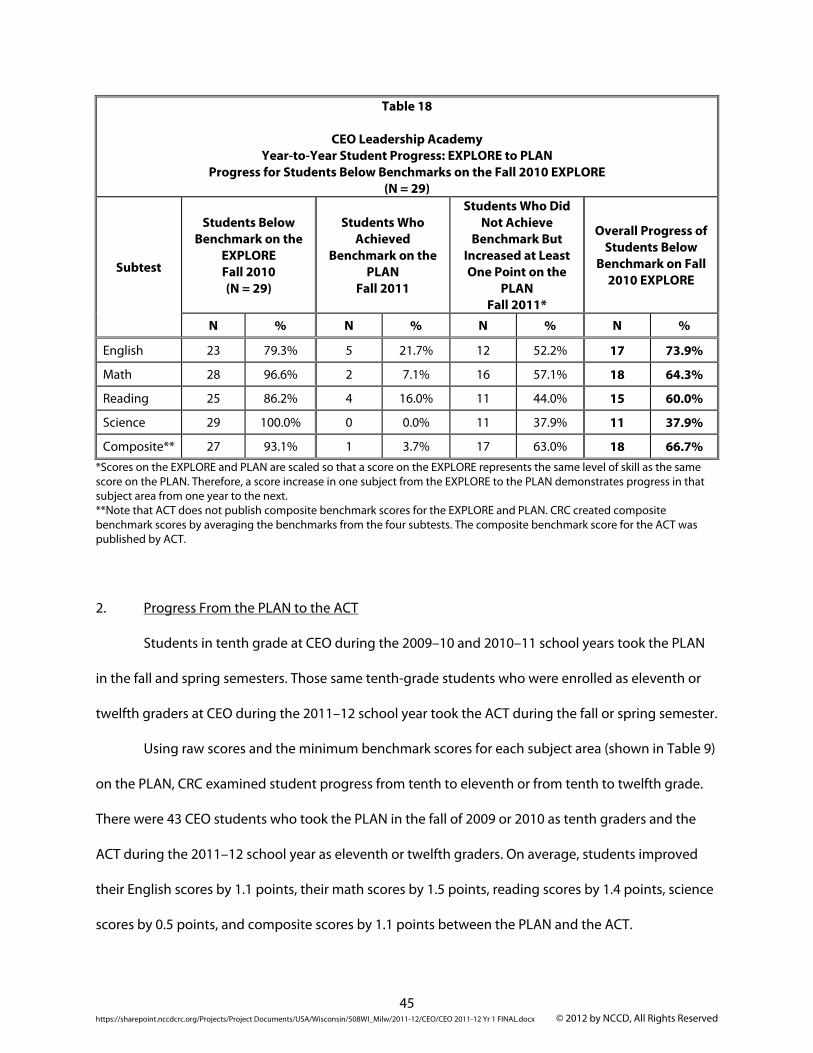
45 https://sharepoint.nccdcrc.org/Projects/Project Documents/USA/Wisconsin/508WI_Milw/2011-12/CEO/CEO 2011-12 Yr 1 FINAL.docx © 2012 by NCCD, All Rights Reserved
Table 18
CEO Leadership Academy Year-to-Year Student Progress: EXPLORE to PLAN
Progress for Students Below Benchmarks on the Fall 2010 EXPLORE (N = 29)
Subtest
Students Below Benchmark on the
EXPLORE Fall 2010 (N = 29)
Students Who Achieved
Benchmark on the PLAN
Fall 2011
Students Who Did Not Achieve
Benchmark But Increased at Least One Point on the
PLAN Fall 2011*
Overall Progress of Students Below
Benchmark on Fall 2010 EXPLORE
N % N % N % N %
English 23 79.3% 5 21.7% 12 52.2% 17 73.9%
Math 28 96.6% 2 7.1% 16 57.1% 18 64.3%
Reading 25 86.2% 4 16.0% 11 44.0% 15 60.0%
Science 29 100.0% 0 0.0% 11 37.9% 11 37.9%
Composite** 27 93.1% 1 3.7% 17 63.0% 18 66.7% *Scores on the EXPLORE and PLAN are scaled so that a score on the EXPLORE represents the same level of skill as the same score on the PLAN. Therefore, a score increase in one subject from the EXPLORE to the PLAN demonstrates progress in that subject area from one year to the next. **Note that ACT does not publish composite benchmark scores for the EXPLORE and PLAN. CRC created composite benchmark scores by averaging the benchmarks from the four subtests. The composite benchmark score for the ACT was published by ACT.
2. Progress From the PLAN to the ACT
Students in tenth grade at CEO during the 2009–10 and 2010–11 school years took the PLAN
in the fall and spring semesters. Those same tenth-grade students who were enrolled as eleventh or
twelfth graders at CEO during the 2011–12 school year took the ACT during the fall or spring semester.
Using raw scores and the minimum benchmark scores for each subject area (shown in Table 9)
on the PLAN, CRC examined student progress from tenth to eleventh or from tenth to twelfth grade.
There were 43 CEO students who took the PLAN in the fall of 2009 or 2010 as tenth graders and the
ACT during the 2011–12 school year as eleventh or twelfth graders. On average, students improved
their English scores by 1.1 points, their math scores by 1.5 points, reading scores by 1.4 points, science
scores by 0.5 points, and composite scores by 1.1 points between the PLAN and the ACT.
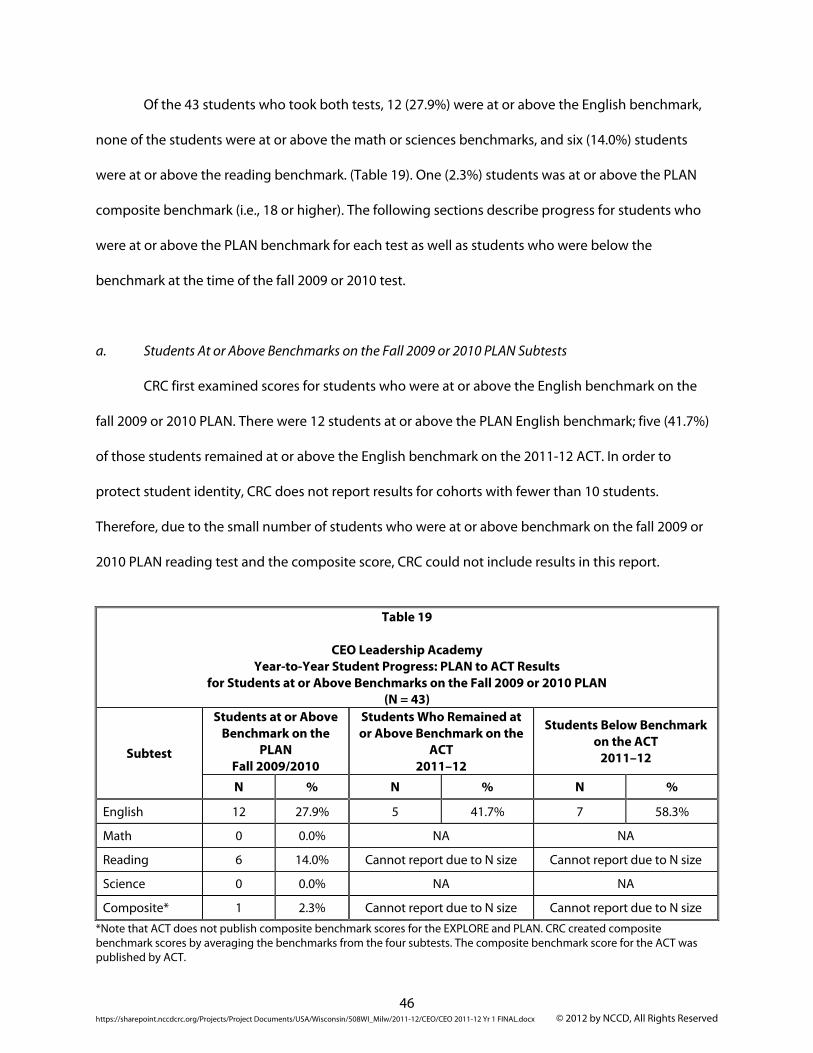
46 https://sharepoint.nccdcrc.org/Projects/Project Documents/USA/Wisconsin/508WI_Milw/2011-12/CEO/CEO 2011-12 Yr 1 FINAL.docx © 2012 by NCCD, All Rights Reserved
Of the 43 students who took both tests, 12 (27.9%) were at or above the English benchmark,
none of the students were at or above the math or sciences benchmarks, and six (14.0%) students
were at or above the reading benchmark. (Table 19). One (2.3%) students was at or above the PLAN
composite benchmark (i.e., 18 or higher). The following sections describe progress for students who
were at or above the PLAN benchmark for each test as well as students who were below the
benchmark at the time of the fall 2009 or 2010 test.
a. Students At or Above Benchmarks on the Fall 2009 or 2010 PLAN Subtests
CRC first examined scores for students who were at or above the English benchmark on the
fall 2009 or 2010 PLAN. There were 12 students at or above the PLAN English benchmark; five (41.7%)
of those students remained at or above the English benchmark on the 2011-12 ACT. In order to
protect student identity, CRC does not report results for cohorts with fewer than 10 students.
Therefore, due to the small number of students who were at or above benchmark on the fall 2009 or
2010 PLAN reading test and the composite score, CRC could not include results in this report.
Table 19
CEO Leadership Academy
Year-to-Year Student Progress: PLAN to ACT Results for Students at or Above Benchmarks on the Fall 2009 or 2010 PLAN
(N = 43)
Subtest
Students at or Above Benchmark on the
PLAN Fall 2009/2010
Students Who Remained at or Above Benchmark on the
ACT 2011–12
Students Below Benchmark on the ACT
2011–12
N % N % N %
English 12 27.9% 5 41.7% 7 58.3%
Math 0 0.0% NA NA
Reading 6 14.0% Cannot report due to N size Cannot report due to N size
Science 0 0.0% NA NA
Composite* 1 2.3% Cannot report due to N size Cannot report due to N size
*Note that ACT does not publish composite benchmark scores for the EXPLORE and PLAN. CRC created composite benchmark scores by averaging the benchmarks from the four subtests. The composite benchmark score for the ACT was published by ACT.
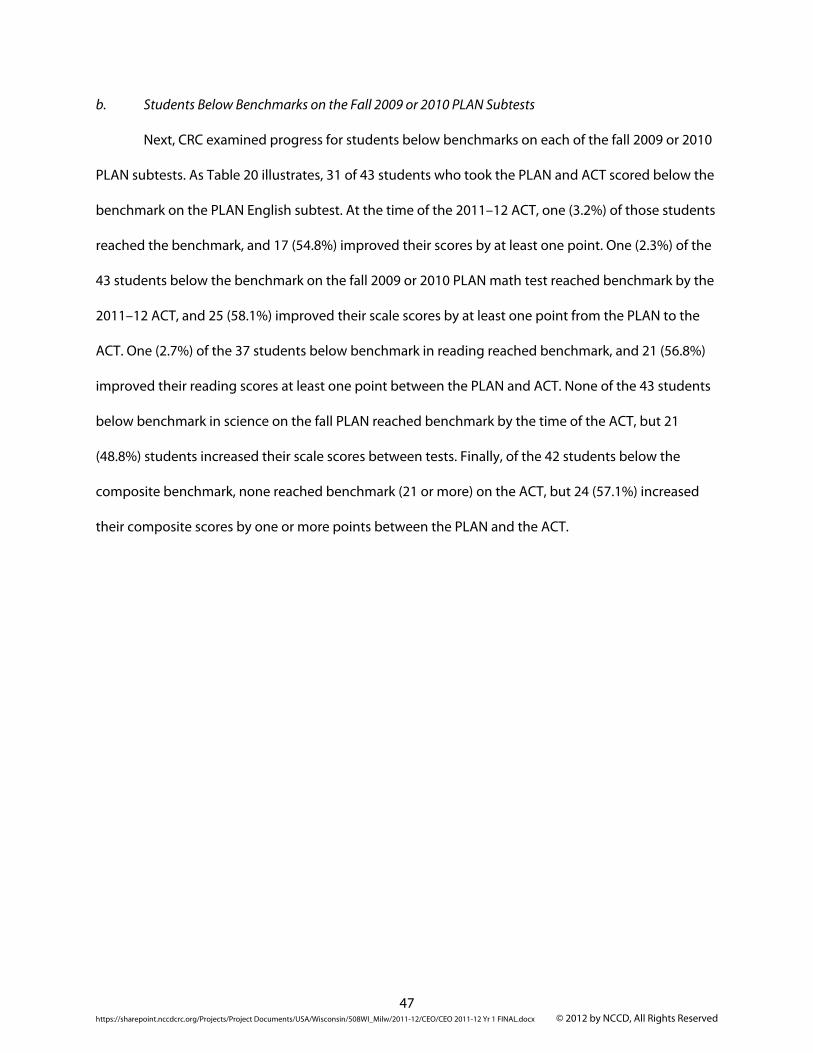
47 https://sharepoint.nccdcrc.org/Projects/Project Documents/USA/Wisconsin/508WI_Milw/2011-12/CEO/CEO 2011-12 Yr 1 FINAL.docx © 2012 by NCCD, All Rights Reserved
b. Students Below Benchmarks on the Fall 2009 or 2010 PLAN Subtests
Next, CRC examined progress for students below benchmarks on each of the fall 2009 or 2010
PLAN subtests. As Table 20 illustrates, 31 of 43 students who took the PLAN and ACT scored below the
benchmark on the PLAN English subtest. At the time of the 2011–12 ACT, one (3.2%) of those students
reached the benchmark, and 17 (54.8%) improved their scores by at least one point. One (2.3%) of the
43 students below the benchmark on the fall 2009 or 2010 PLAN math test reached benchmark by the
2011–12 ACT, and 25 (58.1%) improved their scale scores by at least one point from the PLAN to the
ACT. One (2.7%) of the 37 students below benchmark in reading reached benchmark, and 21 (56.8%)
improved their reading scores at least one point between the PLAN and ACT. None of the 43 students
below benchmark in science on the fall PLAN reached benchmark by the time of the ACT, but 21
(48.8%) students increased their scale scores between tests. Finally, of the 42 students below the
composite benchmark, none reached benchmark (21 or more) on the ACT, but 24 (57.1%) increased
their composite scores by one or more points between the PLAN and the ACT.
48 https://sharepoint.nccdcrc.org/Projects/Project Documents/USA/Wisconsin/508WI_Milw/2011-12/CEO/CEO 2011-12 Yr 1 FINAL.docx © 2012 by NCCD, All Rights Reserved
Table 20
CEO Leadership Academy Year-to-Year Student Progress: PLAN to ACT
Progress for Students Below Benchmarks on the Fall 2009 or 2010 PLAN
Subtest
Students Below Benchmark on the
PLAN Fall 2009/2010
(N = 43)
Students Who Achieved
Benchmark on the ACT
2011–12
Students Who Did Not Achieve
Benchmark But Increased at Least One Point on the
ACT 2011–12
Overall Progress of Students Below
Benchmark on Fall 2009/2010 PLAN
N % N % N % N %
English 31 72.1% 1 3.2% 17 54.8% 18 58.1%
Math 43 100.0% 1 2.3% 25 58.1% 26 60.5%
Reading 37 86.0% 1 2.7% 21 56.8% 22 59.5%
Science 43 100.0% 0 0.0% 21 48.8% 21 48.8%
Composite** 42 97.7% 0 0.0% 24 57.1% 24 57.1% Note: Scores on the PLAN and ACT are scaled so that a score on the PLAN represents the same level of skill as the same score on the ACT. Therefore, a score increase in one subject from the PLAN to the ACT demonstrates progress in that subject area from one year to the next. **Note that ACT does not publish composite benchmark scores for the EXPLORE and PLAN. CRC created composite benchmark scores by averaging the benchmarks from the four subtests. The composite benchmark score for the ACT was published by ACT.
K. School Scorecard
In the 2009–10 school year, the CSRC piloted a scorecard for each school that it charters. The
scorecard includes multiple measures of student academic progress such as performance on
standardized tests and local measures, as well as point-in-time academic achievement and
engagement elements such as attendance and student and teacher retention and return. The score
provides a summary indicator of school performance. In addition, the CSRC intends to examine
scorecard results from all city-chartered schools over the past three years and establish policies that
will guide decisions about contract renewal, probationary status, and school closure.
The school scored 59.1% on the scorecard this year.
49 https://sharepoint.nccdcrc.org/Projects/Project Documents/USA/Wisconsin/508WI_Milw/2011-12/CEO/CEO 2011-12 Yr 1 FINAL.docx © 2012 by NCCD, All Rights Reserved
L. Annual Review of the School’s Adequate Yearly Progress
Since passage of No Child Left Behind (NCLB), school performance in Wisconsin has been
measured by Adequate Yearly Progress (AYP). AYP consists of four objectives: test participation,
graduation rate or attendance rate, and achieving a designated proficiency rate on two academic
indicators—reading and mathematics.
In July 2012, State Superintendent Tony Evers announced that Wisconsin’s request for waivers
from certain provisions of NCLB, including the AYP designation, was approved by the US Department
of Education. AYP will be replaced with an alternate school progress indicator as part of a larger
accountability system developed by the Wisconsin Department of Public Instruction (DPI), which goes
into effect in the 2012–13 school year. Therefore, there is no AYP determination for 2011–12 as the
department transitions to the new accountability system. For more information please see the DPI
website: http://dpi.wi.gov/oea/acct/accountability.html.

50 https://sharepoint.nccdcrc.org/Projects/Project Documents/USA/Wisconsin/508WI_Milw/2011-12/CEO/CEO 2011-12 Yr 1 FINAL.docx © 2012 by NCCD, All Rights Reserved
IV. SUMMARY AND RECOMMENDATIONS
This report covers the first year of CEO’s operation as a City of Milwaukee charter school. The
school has met all provisions of its contract with the City of Milwaukee and the subsequent
requirements of the CSRC.44 The school scored 59.1% on the scorecard this year.
Because this is CEO’s first year of operation as a city charter school and it met all of its contract
requirements, CRC recommends that CEO continue regular, annual academic monitoring and
reporting. However, the school received a scorecard percentage of only 59.1%; therefore, special
attention should be given at the end of the 2012–13 school year to track the improvement of the
school on the scorecard and other outcomes reported in the trend data section of these reports before
making a recommendation for its third year of operation.
44 One contract provision was significantly met.

© 2012 by NCCD, All Rights Reserved https://sharepoint.nccdcrc.org/Projects/Project Documents/USA/Wisconsin/508WI_Milw/2011-12/CEO/CEO 2011-12 Yr 1 FINAL.docx
Appendix A
Contract Compliance Chart
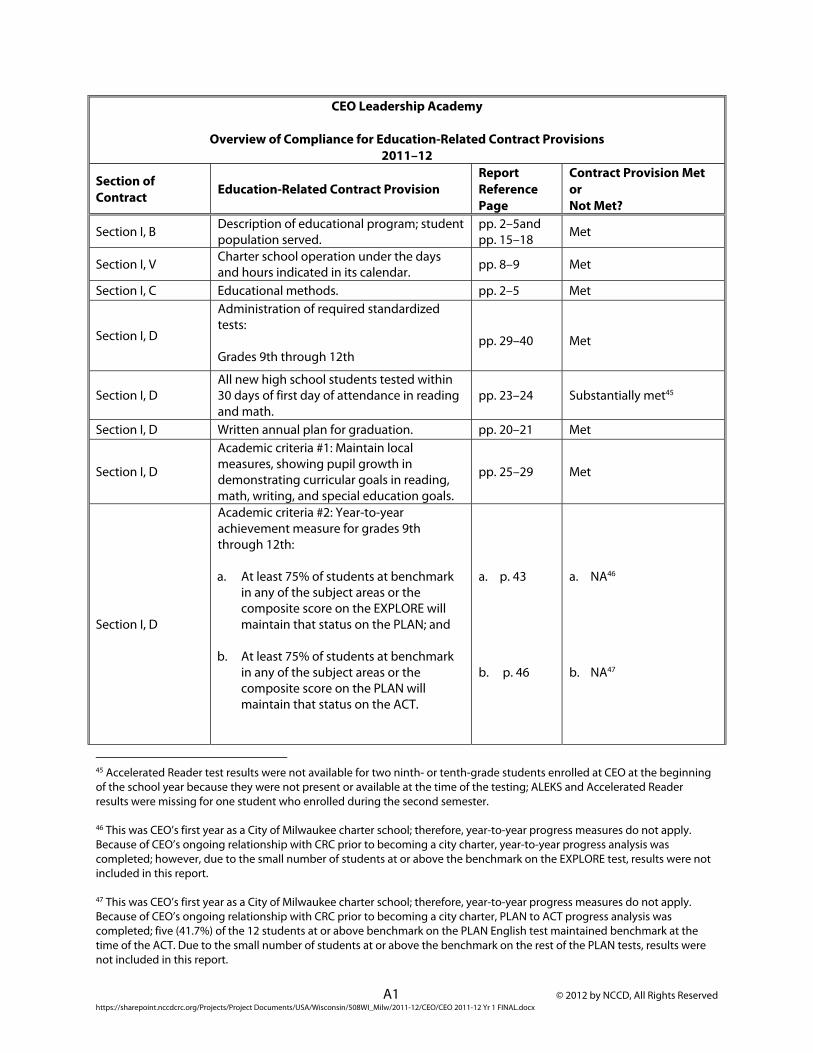
A1 © 2012 by NCCD, All Rights Reserved https://sharepoint.nccdcrc.org/Projects/Project Documents/USA/Wisconsin/508WI_Milw/2011-12/CEO/CEO 2011-12 Yr 1 FINAL.docx
CEO Leadership Academy
Overview of Compliance for Education-Related Contract Provisions 2011–12
Section of Contract Education-Related Contract Provision
Report Reference Page
Contract Provision Met or Not Met?
Section I, B Description of educational program; student population served.
pp. 2–5and pp. 15–18 Met
Section I, V Charter school operation under the days and hours indicated in its calendar. pp. 8–9 Met
Section I, C Educational methods. pp. 2–5 Met
Section I, D
Administration of required standardized tests: Grades 9th through 12th
pp. 29–40
Met
Section I, D All new high school students tested within 30 days of first day of attendance in reading and math.
pp. 23–24 Substantially met45
Section I, D Written annual plan for graduation. pp. 20–21 Met
Section I, D
Academic criteria #1: Maintain local measures, showing pupil growth in demonstrating curricular goals in reading, math, writing, and special education goals.
pp. 25–29 Met
Section I, D
Academic criteria #2: Year-to-year achievement measure for grades 9th through 12th: a. At least 75% of students at benchmark
in any of the subject areas or the composite score on the EXPLORE will maintain that status on the PLAN; and
b. At least 75% of students at benchmark in any of the subject areas or the composite score on the PLAN will maintain that status on the ACT.
a. p. 43 b. p. 46
a. NA46 b. NA47
45 Accelerated Reader test results were not available for two ninth- or tenth-grade students enrolled at CEO at the beginning of the school year because they were not present or available at the time of the testing; ALEKS and Accelerated Reader results were missing for one student who enrolled during the second semester. 46 This was CEO’s first year as a City of Milwaukee charter school; therefore, year-to-year progress measures do not apply. Because of CEO’s ongoing relationship with CRC prior to becoming a city charter, year-to-year progress analysis was completed; however, due to the small number of students at or above the benchmark on the EXPLORE test, results were not included in this report. 47 This was CEO’s first year as a City of Milwaukee charter school; therefore, year-to-year progress measures do not apply. Because of CEO’s ongoing relationship with CRC prior to becoming a city charter, PLAN to ACT progress analysis was completed; five (41.7%) of the 12 students at or above benchmark on the PLAN English test maintained benchmark at the time of the ACT. Due to the small number of students at or above the benchmark on the rest of the PLAN tests, results were not included in this report.
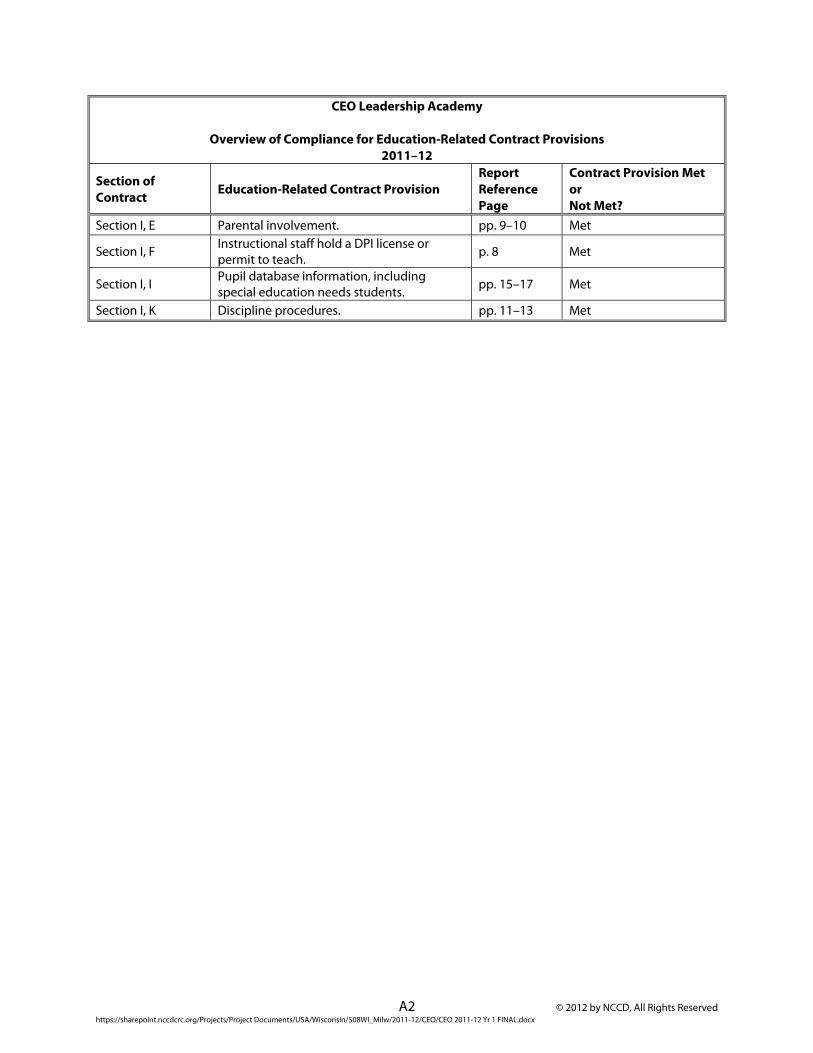
A2 © 2012 by NCCD, All Rights Reserved https://sharepoint.nccdcrc.org/Projects/Project Documents/USA/Wisconsin/508WI_Milw/2011-12/CEO/CEO 2011-12 Yr 1 FINAL.docx
CEO Leadership Academy
Overview of Compliance for Education-Related Contract Provisions 2011–12
Section of Contract Education-Related Contract Provision
Report Reference Page
Contract Provision Met or Not Met?
Section I, E Parental involvement. pp. 9–10 Met
Section I, F Instructional staff hold a DPI license or permit to teach. p. 8 Met
Section I, I Pupil database information, including special education needs students. pp. 15–17 Met
Section I, K Discipline procedures. pp. 11–13 Met
© 2012 by NCCD, All Rights Reserved https://sharepoint.nccdcrc.org/Projects/Project Documents/USA/Wisconsin/508WI_Milw/2011-12/CEO/CEO 2011-12 Yr 1 FINAL.docx
Appendix B
Outcome Measures Agreement Memo
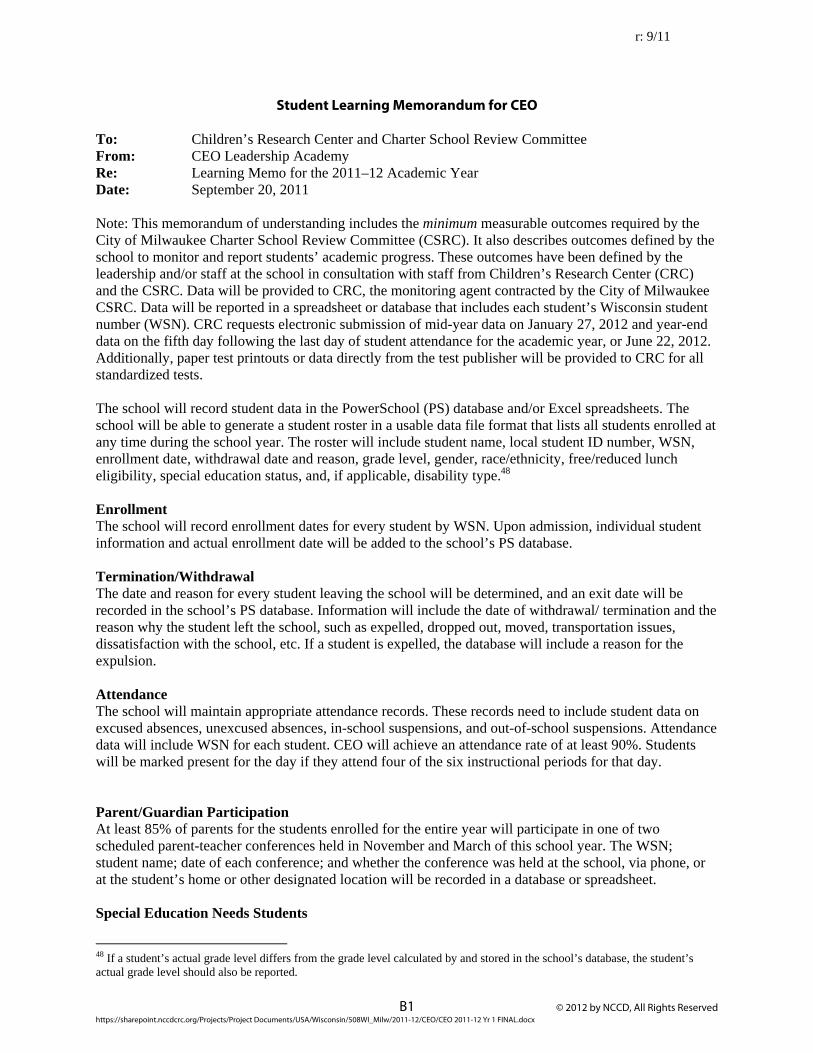
r: 9/11
B1 © 2012 by NCCD, All Rights Reserved https://sharepoint.nccdcrc.org/Projects/Project Documents/USA/Wisconsin/508WI_Milw/2011-12/CEO/CEO 2011-12 Yr 1 FINAL.docx
Student Learning Memorandum for CEO To: Children’s Research Center and Charter School Review Committee From: CEO Leadership Academy Re: Learning Memo for the 2011–12 Academic Year Date: September 20, 2011 Note: This memorandum of understanding includes the minimum measurable outcomes required by the City of Milwaukee Charter School Review Committee (CSRC). It also describes outcomes defined by the school to monitor and report students’ academic progress. These outcomes have been defined by the leadership and/or staff at the school in consultation with staff from Children’s Research Center (CRC) and the CSRC. Data will be provided to CRC, the monitoring agent contracted by the City of Milwaukee CSRC. Data will be reported in a spreadsheet or database that includes each student’s Wisconsin student number (WSN). CRC requests electronic submission of mid-year data on January 27, 2012 and year-end data on the fifth day following the last day of student attendance for the academic year, or June 22, 2012. Additionally, paper test printouts or data directly from the test publisher will be provided to CRC for all standardized tests. The school will record student data in the PowerSchool (PS) database and/or Excel spreadsheets. The school will be able to generate a student roster in a usable data file format that lists all students enrolled at any time during the school year. The roster will include student name, local student ID number, WSN, enrollment date, withdrawal date and reason, grade level, gender, race/ethnicity, free/reduced lunch eligibility, special education status, and, if applicable, disability type.48 Enrollment The school will record enrollment dates for every student by WSN. Upon admission, individual student information and actual enrollment date will be added to the school’s PS database. Termination/Withdrawal The date and reason for every student leaving the school will be determined, and an exit date will be recorded in the school’s PS database. Information will include the date of withdrawal/ termination and the reason why the student left the school, such as expelled, dropped out, moved, transportation issues, dissatisfaction with the school, etc. If a student is expelled, the database will include a reason for the expulsion. Attendance The school will maintain appropriate attendance records. These records need to include student data on excused absences, unexcused absences, in-school suspensions, and out-of-school suspensions. Attendance data will include WSN for each student. CEO will achieve an attendance rate of at least 90%. Students will be marked present for the day if they attend four of the six instructional periods for that day. Parent/Guardian Participation At least 85% of parents for the students enrolled for the entire year will participate in one of two scheduled parent-teacher conferences held in November and March of this school year. The WSN; student name; date of each conference; and whether the conference was held at the school, via phone, or at the student’s home or other designated location will be recorded in a database or spreadsheet. Special Education Needs Students
48 If a student’s actual grade level differs from the grade level calculated by and stored in the school’s database, the student’s actual grade level should also be reported.
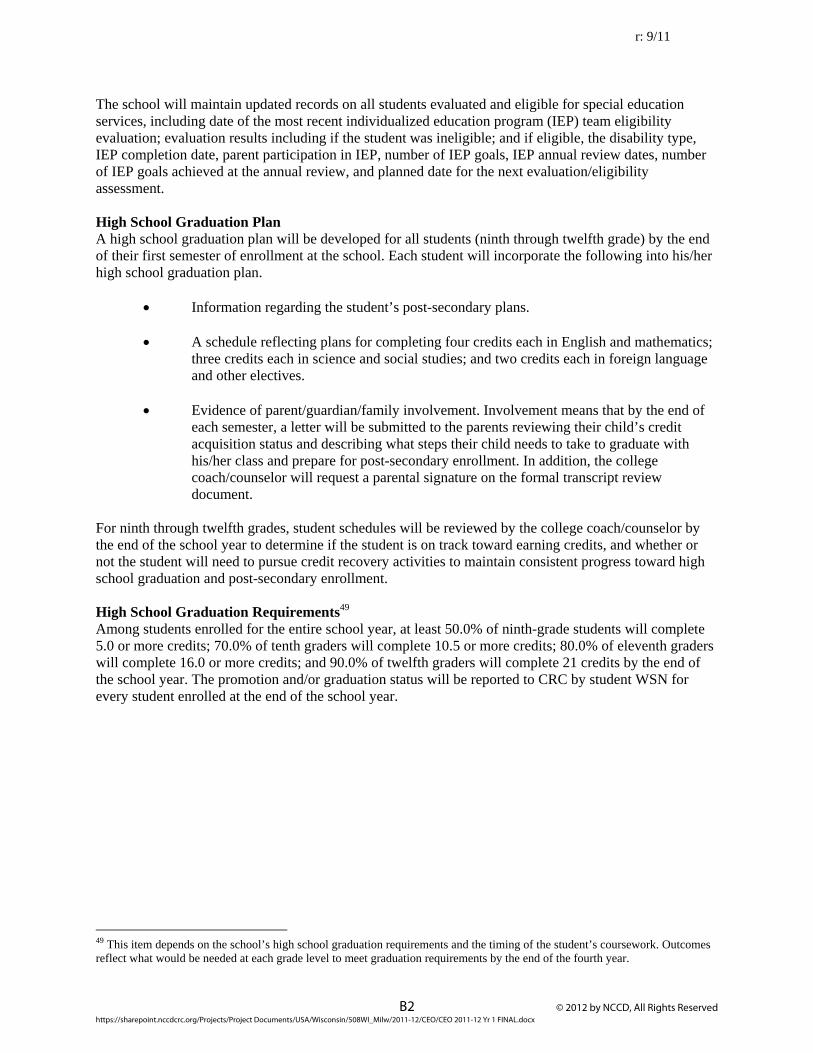
r: 9/11
B2 © 2012 by NCCD, All Rights Reserved https://sharepoint.nccdcrc.org/Projects/Project Documents/USA/Wisconsin/508WI_Milw/2011-12/CEO/CEO 2011-12 Yr 1 FINAL.docx
The school will maintain updated records on all students evaluated and eligible for special education services, including date of the most recent individualized education program (IEP) team eligibility evaluation; evaluation results including if the student was ineligible; and if eligible, the disability type, IEP completion date, parent participation in IEP, number of IEP goals, IEP annual review dates, number of IEP goals achieved at the annual review, and planned date for the next evaluation/eligibility assessment. High School Graduation Plan A high school graduation plan will be developed for all students (ninth through twelfth grade) by the end of their first semester of enrollment at the school. Each student will incorporate the following into his/her high school graduation plan.
Information regarding the student’s post-secondary plans.
A schedule reflecting plans for completing four credits each in English and mathematics;
three credits each in science and social studies; and two credits each in foreign language and other electives.
Evidence of parent/guardian/family involvement. Involvement means that by the end of
each semester, a letter will be submitted to the parents reviewing their child’s credit acquisition status and describing what steps their child needs to take to graduate with his/her class and prepare for post-secondary enrollment. In addition, the college coach/counselor will request a parental signature on the formal transcript review document.
For ninth through twelfth grades, student schedules will be reviewed by the college coach/counselor by the end of the school year to determine if the student is on track toward earning credits, and whether or not the student will need to pursue credit recovery activities to maintain consistent progress toward high school graduation and post-secondary enrollment. High School Graduation Requirements49 Among students enrolled for the entire school year, at least 50.0% of ninth-grade students will complete 5.0 or more credits; 70.0% of tenth graders will complete 10.5 or more credits; 80.0% of eleventh graders will complete 16.0 or more credits; and 90.0% of twelfth graders will complete 21 credits by the end of the school year. The promotion and/or graduation status will be reported to CRC by student WSN for every student enrolled at the end of the school year.
49 This item depends on the school’s high school graduation requirements and the timing of the student’s coursework. Outcomes reflect what would be needed at each grade level to meet graduation requirements by the end of the fourth year.
r: 9/11
B3 © 2012 by NCCD, All Rights Reserved https://sharepoint.nccdcrc.org/Projects/Project Documents/USA/Wisconsin/508WI_Milw/2011-12/CEO/CEO 2011-12 Yr 1 FINAL.docx
Twelfth-grade College Applications and Acceptance All graduating twelfth-grade students will have completed applications to at least six colleges by the end of the school year.50 At least 90.0% of graduating students will be accepted into at least one college. The college coach/counselor will monitor student progress on this outcome and record the total number of college applications each student completes and the number of acceptance letters received by each graduate. Academic Achievement: Assessment for New Enrollees51 All ninth- and tenth-grade students will be tested within 30 days of enrollment using Accelerated Reader.52 Accelerated Reader assesses a student’s progress on the acquistion of literacy skills in four areas based on their current reading level: initial understanding, inferential comprehension, literary analysis, and constructing meaning. All students who enroll after the September testing date, regardless of grade level, will be tested within 30 calendar days of their enrollment. These data will be used to report on the basic skill levels of the students at the time of their enrollment. All ninth- and tenth-grade students will be tested within 30 days of enrollment using the Assessment and Learning in Knowledge Spaces (ALEKS) for the math course the student is taking.53 ALEKS assesses a student’s progress according to the standards-based content of each math class. All students who enroll after the September testing date, regardless of their grade level, will be tested within 30 calendar days of their enrollment on the appropriate ALEKS test. These data will be used to report on the students’ basic math skill levels at the time of enrollment. Academic Achievement: Local Measures54 Literacy All students’ reading progress will be assessed quarterly using the pacing plan for reading designed by the Noble Street School in Chicago.55,56 CEO will provide CRC with the aggregate mastery percentages for the first and fourth assessment by individual student WSN for all ninth, tenth, and twelfth graders who completed these tests. First- and third-quarter assessment results will be provided for eleventh-grade students.
50 Special needs students are expected to complete applications to at least three colleges by the end of the school year. 51 CEO will not be accepting new eleventh- and twelfth-grade students during the school year. 52 Detailed information on Accelerated Reader can be found at the following website: www.renlearn.com. 53 Detailed information on ALEKS can be found at the following website: www.aleks.com. 54 Local measures of academic achievement are classroom- or school-level measures that monitor student progress throughout the year (formative assessment) and can be summarized at the end of the year (summative assessment) to demonstrate academic growth. They are reflective of each school’s unique philosophy and curriculum. The CSRC requires local measures of academic achievement in the areas of literacy, mathematics, writing, and IEP goals. 55 The eleventh-grade students will not complete the fourth-quarter assessment. They will instead complete the actual ACT test. For these individual students, CEO will provide CRC with their first- and third-quarter aggregate mastery percentages . 56 Noble Street’s website indicates that the assessments they designed are fashioned after the ACT and indicate a student’s progress toward the acquisition of skills required to be successful in a post-secondary setting. The website is: www.noblestreetcharterschool.org
r: 9/11
B4 © 2012 by NCCD, All Rights Reserved https://sharepoint.nccdcrc.org/Projects/Project Documents/USA/Wisconsin/508WI_Milw/2011-12/CEO/CEO 2011-12 Yr 1 FINAL.docx
Mathematics All students’ math progress will be assessed quarterly using the pacing plan for math designed by the Noble Street School in Chicago.57,58 CEO will provide CRC with the aggregate mastery percentages for the first and fourth assessment by individual student WSN for all ninth, tenth, and twelfth graders who completed these tests. First- and-third quarter assessment results will be provided for eleventh-grade students. Writing By the end of the final marking period, students in ninth through twelfth grade will have a writing sample assessed, and each grade cohort will be judged proficient if they obtain an average score of 4 or more. Student writing skills will be assessed in the following six domains: ideas and content, organization, voice, choice, sentence fluency, and conventions. Each domain will be assessed on the following scale: 1 = beginning; 2 = emerging; 3 = developing; 4 = proficient; 5 = strong; and 6 = exemplary. IEP Goals At least 70% of the special education students will meet one or more of the goals defined in their IEP. Data on each special education student’s goal achievements will be recorded in an Excel spreadsheet by student WSN. Academic Achievement: Standardized Measures Ninth-grade Students All ninth-grade students are required to take all subtests59 of the EXPLORE test (the first in a series of two pre-ACT tests that identify students who are not ready for the ACT)60 in the fall and spring of the school year. At least 75% of the ninth-grade students who are at or above benchmark for any of the four subtests (English, math, reading, and science) or have a composite score of 17 or more at the time of the fall test will remain at or above benchmark(s) on the spring tests. At least 50% of the ninth graders who were below the benchmark for any of the four subtests or received a composite score below 17 at the time of the fall testing will either achieve benchmark(s) or have increased their score by one or more points on the relevant subtest or composite score by the time of the spring test administration.
57 The eleventh-grade students will not complete the fourth-quarter assessment. They will instead complete the actual ACT test. For these individual students, CEO will provide CRC with their first- and third-quarter aggregate mastery percentages. 58 Noble Street’s website indicates that the assessments they designed are fashioned after the ACT and indicate a student’s progress toward the acquisition of skills required to be successful in a post-secondary setting. The website is: www.noblestreetcharterschool.org 59 English, mathematics, reading, and science. 60 The Educational Planning and Assessment System (EPAS), developed by the American College Testing (ACT) service, provides a longitudinal, standardized approach to educational and career planning, assessment, instructional support, and evaluation. The series includes the EXPLORE, PLAN, and ACT tests. Score ranges from all three tests are linked to Standards for Transition statements that describe what students have learned and what they are ready to learn next. The Standards for Transition, in turn, are linked to Pathways statements that suggest strategies to enhance students’ classroom learning. Standards and Pathways can be used by teachers to evaluate instruction and student progress and advise students on courses of study.
r: 9/11
B5 © 2012 by NCCD, All Rights Reserved https://sharepoint.nccdcrc.org/Projects/Project Documents/USA/Wisconsin/508WI_Milw/2011-12/CEO/CEO 2011-12 Yr 1 FINAL.docx
Tenth-grade Students All tenth-grade students are required to take all subtests of the PLAN (the second test in the pre-ACT series) in the fall and spring of the school year.61 At least 75% of the tenth-grade students who are at or above benchmark for any of the four subtests (English, math, reading, and science) or have a composite score of 18 or higher at the time of the fall test will remain at or above benchmark(s) on the spring test. At least 55% of the tenth graders who were below the benchmark for any of the four subtests or received a composite score below 18 at the time of the fall testing will either achieve benchmark(s) or have increased their score by one or more points on the relevant subtest or composite score by the time of the spring test administration. All tenth-grade students are required to take the Wisconsin Knowledge and Concepts Examination (WKCE) in the timeframe identified by the Department of Public Instruction (DPI). Eleventh-grade Students All eleventh-grade students are required to take the ACT or the SAT by the end of the school year. CEO will monitor students’ participation in a spreadsheet and report the subtest and composite scores for each student as well as the date the test was administered. Twelfth-grade Students CEO will require all seniors to take the ACT or SAT test in the fall semester of 2011. CEO will monitor students’ participation in a spreadsheet and report the subtest and composite score for each student. The spreadsheet needs to indicate the date (month/year) that each twelfth grader took the ACT or SAT test. Scores from the EXPLORE, PLAN, and ACT will be used to track student progress from ninth to tenth grade and from tenth to eleventh or twelfth grade.
EXPLORE to PLAN: At least 75.0% of the tenth-grade students who were at or above benchmark for any of the four subtests (English, math, reading, and science) or the composite score at the time of the fall 2010 EXPLORE test will remain at or above benchmark on the fall 2011 PLAN. Tenth graders who were below benchmark for any of the four subtests or the composite score at the time of the fall 2009 EXPLORE will either achieve benchmark(s) or have increased their score by one or more points by the time of the fall 2010 PLAN.
PLAN to ACT: At least 75.0% of the eleventh- or twelfth-grade students who were at or
above benchmark for any of the four subtests (English, math, reading, and science) or the composite score at the time of either the fall 2009 or fall 2010 PLAN test will remain at or above benchmark on the most recently completed ACT test. Eleventh- or twelfth-grade students who were below benchmark for any of the four subtests or the composite score at the time of the fall 2009 or fall 2010 PLAN will either achieve benchmark(s) or have increased their score by one or more points by the time of the most recently completed ACT.62
61 English, mathematics, reading, and science. 62 Eleventh-grade students who took the ACT during the 2011–12 school year took the PLAN in the fall of 2010; twelfth-grade students who took the ACT during the 2011–12 school year took the PLAN in the fall of 2009.
r: 9/11
B6 © 2012 by NCCD, All Rights Reserved https://sharepoint.nccdcrc.org/Projects/Project Documents/USA/Wisconsin/508WI_Milw/2011-12/CEO/CEO 2011-12 Yr 1 FINAL.docx
Learning Memo Data Addendum CEO
This addendum has been developed to clarify the data collection and submission process related to each of the outcomes stated in the school’s learning memo for the 2011–12 academic year. Additionally, there are important principles applicable to all data collection that must be considered. 1. All students attending the school at any time during the 2011–12 academic year should be
included in all student data files created by the school. This includes students who enroll after the first day of school and students who withdraw before the end of the school year. Be sure to include each student’s unique WSN in each data file.
2. All data fields must be completed for each student enrolled at any time during the school year. If
a student is not enrolled and/or present when a measure is completed, record an N/E for that student to indicate “not enrolled.” This may occur if a student enrolls after the beginning of the school year or withdraws prior to the end of the school year.
3. Record and submit a score/response for each student. Please do not submit aggregate data (e.g.,
14 students scored 75.0%, or the attendance rate was 92.0%). End-of-the-year data must be submitted to CRC by no later than the fifth working day after the end of the second semester or June 22, 2012. Staff person(s) responsible for year-end data submission is: Rashida Evans
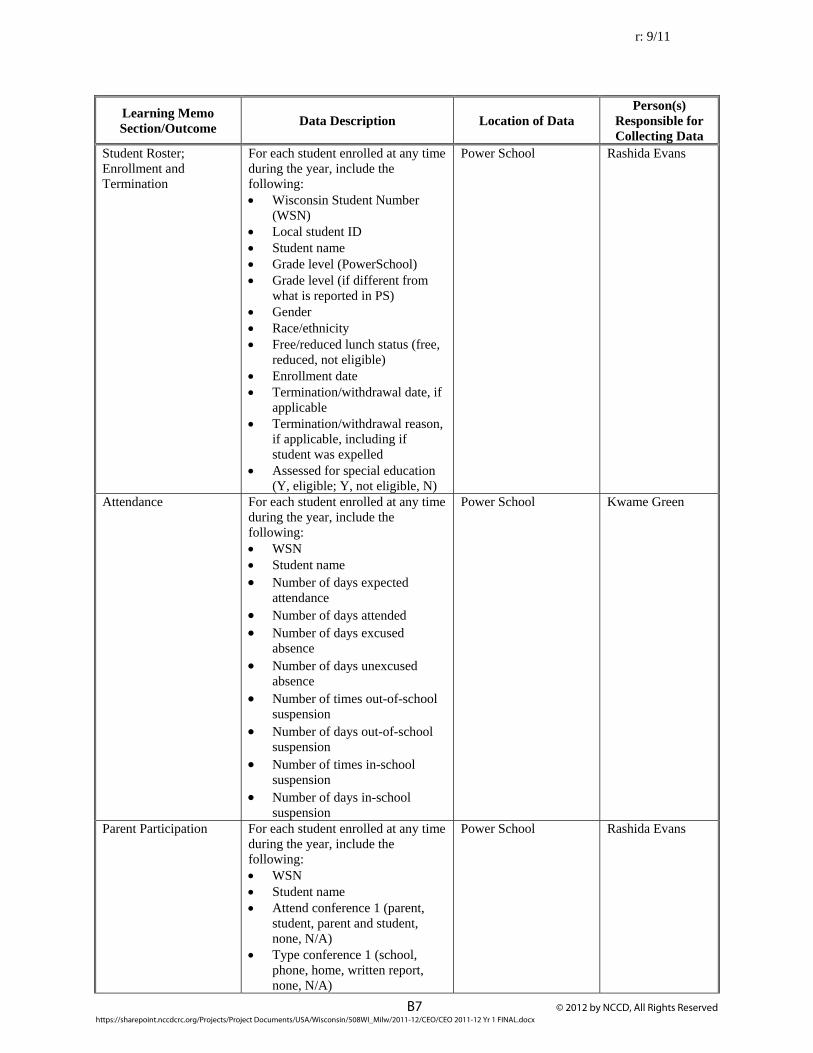
r: 9/11
B7 © 2012 by NCCD, All Rights Reserved https://sharepoint.nccdcrc.org/Projects/Project Documents/USA/Wisconsin/508WI_Milw/2011-12/CEO/CEO 2011-12 Yr 1 FINAL.docx
Learning Memo Section/Outcome
Data Description Location of Data Person(s)
Responsible for Collecting Data
Student Roster; Enrollment and Termination
For each student enrolled at any time during the year, include the following: Wisconsin Student Number
(WSN) Local student ID Student name Grade level (PowerSchool) Grade level (if different from
what is reported in PS) Gender Race/ethnicity Free/reduced lunch status (free,
reduced, not eligible) Enrollment date Termination/withdrawal date, if
applicable Termination/withdrawal reason,
if applicable, including if student was expelled
Assessed for special education (Y, eligible; Y, not eligible, N)
Power School Rashida Evans
Attendance For each student enrolled at any time during the year, include the following: WSN Student name Number of days expected
attendance Number of days attended Number of days excused
absence Number of days unexcused
absence Number of times out-of-school
suspension Number of days out-of-school
suspension Number of times in-school
suspension Number of days in-school
suspension
Power School Kwame Green
Parent Participation For each student enrolled at any time during the year, include the following: WSN Student name Attend conference 1 (parent,
student, parent and student, none, N/A)
Type conference 1 (school, phone, home, written report, none, N/A)
Power School Rashida Evans
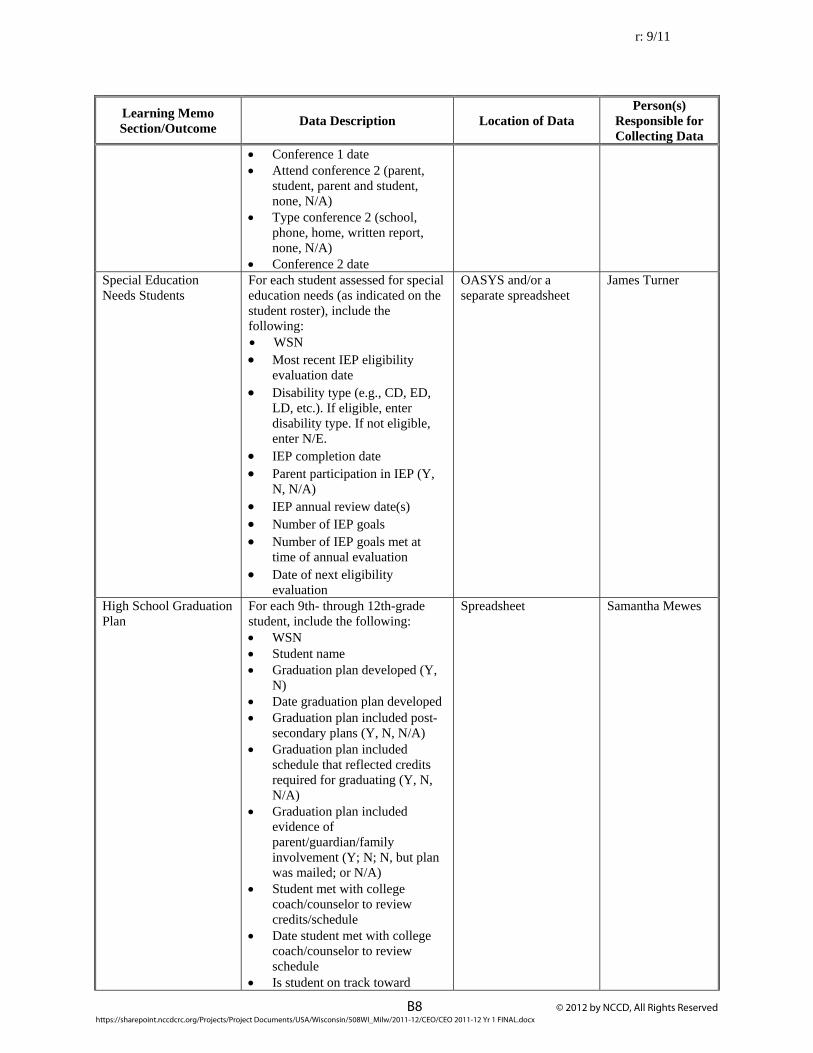
r: 9/11
B8 © 2012 by NCCD, All Rights Reserved https://sharepoint.nccdcrc.org/Projects/Project Documents/USA/Wisconsin/508WI_Milw/2011-12/CEO/CEO 2011-12 Yr 1 FINAL.docx
Learning Memo Section/Outcome
Data Description Location of Data Person(s)
Responsible for Collecting Data
Conference 1 date Attend conference 2 (parent,
student, parent and student, none, N/A)
Type conference 2 (school, phone, home, written report, none, N/A)
Conference 2 date Special Education Needs Students
For each student assessed for special education needs (as indicated on the student roster), include the following: WSN Most recent IEP eligibility
evaluation date Disability type (e.g., CD, ED,
LD, etc.). If eligible, enter disability type. If not eligible, enter N/E.
IEP completion date Parent participation in IEP (Y,
N, N/A) IEP annual review date(s) Number of IEP goals Number of IEP goals met at
time of annual evaluation Date of next eligibility
evaluation
OASYS and/or a separate spreadsheet
James Turner
High School Graduation Plan
For each 9th- through 12th-grade student, include the following: WSN Student name Graduation plan developed (Y,
N) Date graduation plan developed Graduation plan included post-
secondary plans (Y, N, N/A) Graduation plan included
schedule that reflected credits required for graduating (Y, N, N/A)
Graduation plan included evidence of parent/guardian/family involvement (Y; N; N, but plan was mailed; or N/A)
Student met with college coach/counselor to review credits/schedule
Date student met with college coach/counselor to review schedule
Is student on track toward
Spreadsheet Samantha Mewes
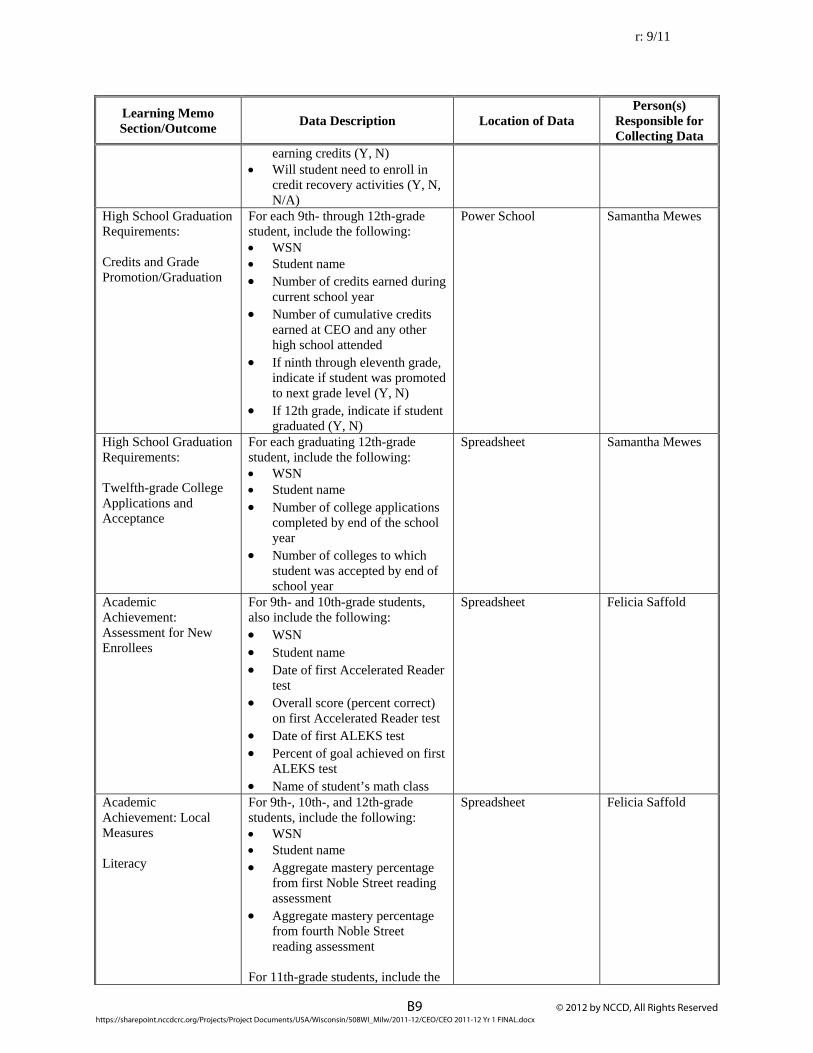
r: 9/11
B9 © 2012 by NCCD, All Rights Reserved https://sharepoint.nccdcrc.org/Projects/Project Documents/USA/Wisconsin/508WI_Milw/2011-12/CEO/CEO 2011-12 Yr 1 FINAL.docx
Learning Memo Section/Outcome
Data Description Location of Data Person(s)
Responsible for Collecting Data
earning credits (Y, N) Will student need to enroll in
credit recovery activities (Y, N, N/A)
High School Graduation Requirements: Credits and Grade Promotion/Graduation
For each 9th- through 12th-grade student, include the following: WSN Student name Number of credits earned during
current school year Number of cumulative credits
earned at CEO and any other high school attended
If ninth through eleventh grade, indicate if student was promoted to next grade level (Y, N)
If 12th grade, indicate if student graduated (Y, N)
Power School Samantha Mewes
High School Graduation Requirements: Twelfth-grade College Applications and Acceptance
For each graduating 12th-grade student, include the following: WSN Student name Number of college applications
completed by end of the school year
Number of colleges to which student was accepted by end of school year
Spreadsheet Samantha Mewes
Academic Achievement: Assessment for New Enrollees
For 9th- and 10th-grade students, also include the following: WSN Student name Date of first Accelerated Reader
test Overall score (percent correct)
on first Accelerated Reader test Date of first ALEKS test Percent of goal achieved on first
ALEKS test Name of student’s math class
Spreadsheet Felicia Saffold
Academic Achievement: Local Measures Literacy
For 9th-, 10th-, and 12th-grade students, include the following: WSN Student name Aggregate mastery percentage
from first Noble Street reading assessment
Aggregate mastery percentage from fourth Noble Street reading assessment
For 11th-grade students, include the
Spreadsheet Felicia Saffold
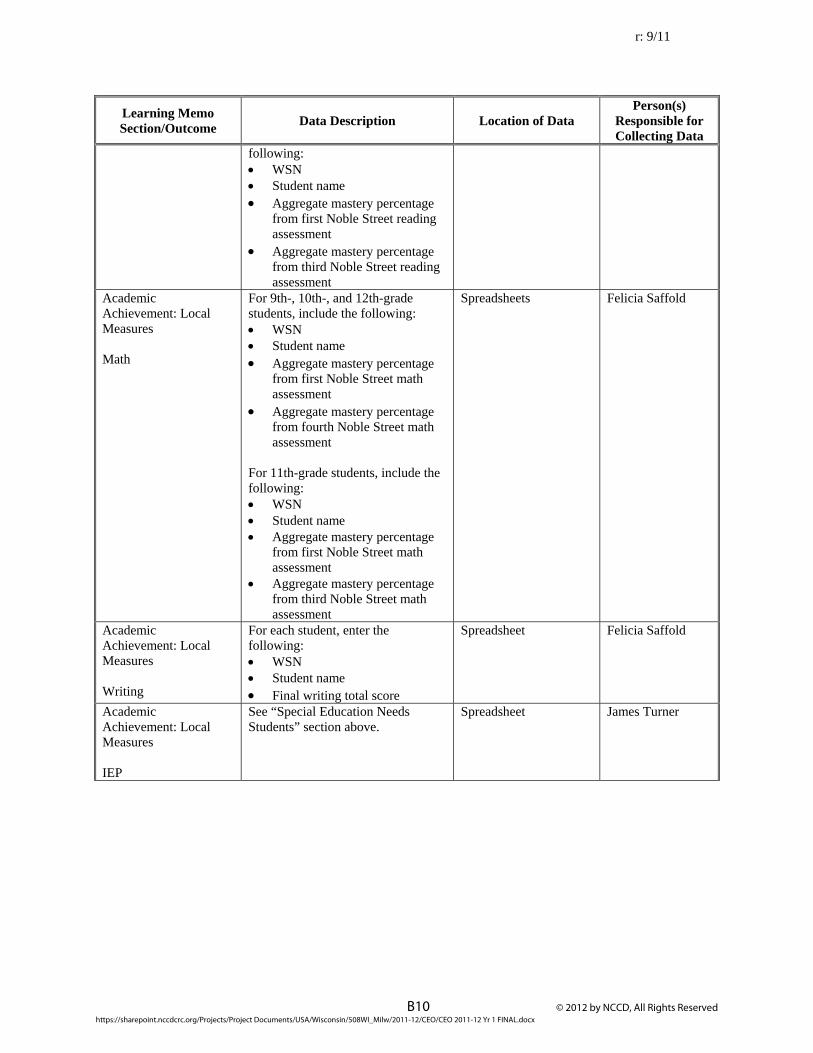
r: 9/11
B10 © 2012 by NCCD, All Rights Reserved https://sharepoint.nccdcrc.org/Projects/Project Documents/USA/Wisconsin/508WI_Milw/2011-12/CEO/CEO 2011-12 Yr 1 FINAL.docx
Learning Memo Section/Outcome
Data Description Location of Data Person(s)
Responsible for Collecting Data
following: WSN Student name Aggregate mastery percentage
from first Noble Street reading assessment
Aggregate mastery percentage from third Noble Street reading assessment
Academic Achievement: Local Measures Math
For 9th-, 10th-, and 12th-grade students, include the following: WSN Student name Aggregate mastery percentage
from first Noble Street math assessment
Aggregate mastery percentage from fourth Noble Street math assessment
For 11th-grade students, include the following: WSN Student name Aggregate mastery percentage
from first Noble Street math assessment
Aggregate mastery percentage from third Noble Street math assessment
Spreadsheets Felicia Saffold
Academic Achievement: Local Measures Writing
For each student, enter the following: WSN Student name Final writing total score
Spreadsheet Felicia Saffold
Academic Achievement: Local Measures IEP
See “Special Education Needs Students” section above.
Spreadsheet James Turner
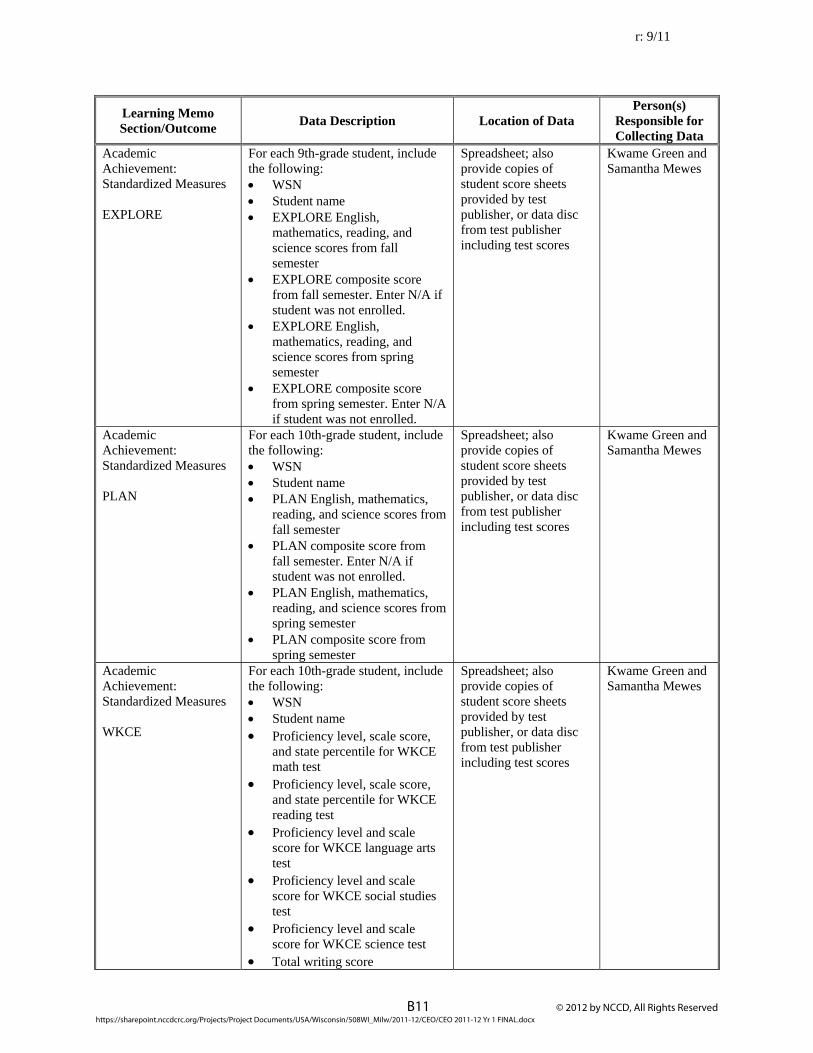
r: 9/11
B11 © 2012 by NCCD, All Rights Reserved https://sharepoint.nccdcrc.org/Projects/Project Documents/USA/Wisconsin/508WI_Milw/2011-12/CEO/CEO 2011-12 Yr 1 FINAL.docx
Learning Memo Section/Outcome
Data Description Location of Data Person(s)
Responsible for Collecting Data
Academic Achievement: Standardized Measures EXPLORE
For each 9th-grade student, include the following: WSN Student name EXPLORE English,
mathematics, reading, and science scores from fall semester
EXPLORE composite score from fall semester. Enter N/A if student was not enrolled.
EXPLORE English, mathematics, reading, and science scores from spring semester
EXPLORE composite score from spring semester. Enter N/A if student was not enrolled.
Spreadsheet; also provide copies of student score sheets provided by test publisher, or data disc from test publisher including test scores
Kwame Green and Samantha Mewes
Academic Achievement: Standardized Measures PLAN
For each 10th-grade student, include the following: WSN Student name PLAN English, mathematics,
reading, and science scores from fall semester
PLAN composite score from fall semester. Enter N/A if student was not enrolled.
PLAN English, mathematics, reading, and science scores from spring semester
PLAN composite score from spring semester
Spreadsheet; also provide copies of student score sheets provided by test publisher, or data disc from test publisher including test scores
Kwame Green and Samantha Mewes
Academic Achievement: Standardized Measures WKCE
For each 10th-grade student, include the following: WSN Student name Proficiency level, scale score,
and state percentile for WKCE math test
Proficiency level, scale score, and state percentile for WKCE reading test
Proficiency level and scale score for WKCE language arts test
Proficiency level and scale score for WKCE social studies test
Proficiency level and scale score for WKCE science test
Total writing score
Spreadsheet; also provide copies of student score sheets provided by test publisher, or data disc from test publisher including test scores
Kwame Green and Samantha Mewes
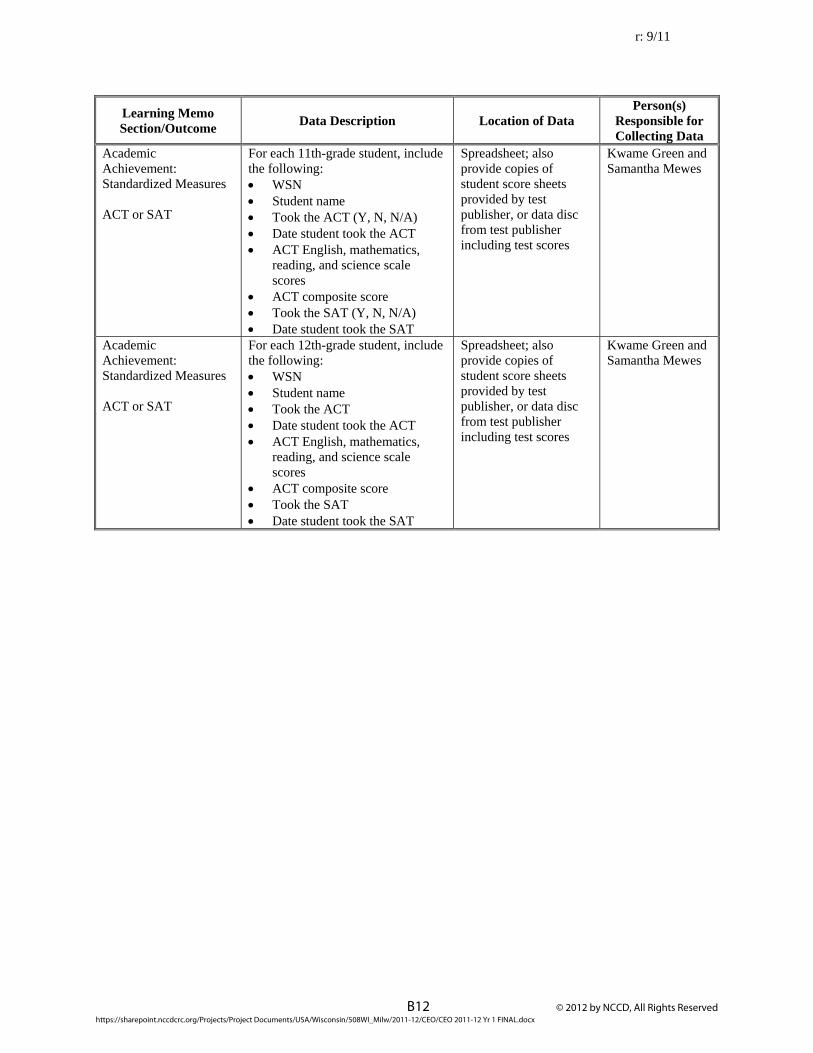
r: 9/11
B12 © 2012 by NCCD, All Rights Reserved https://sharepoint.nccdcrc.org/Projects/Project Documents/USA/Wisconsin/508WI_Milw/2011-12/CEO/CEO 2011-12 Yr 1 FINAL.docx
Learning Memo Section/Outcome
Data Description Location of Data Person(s)
Responsible for Collecting Data
Academic Achievement: Standardized Measures ACT or SAT
For each 11th-grade student, include the following: WSN Student name Took the ACT (Y, N, N/A) Date student took the ACT ACT English, mathematics,
reading, and science scale scores
ACT composite score Took the SAT (Y, N, N/A) Date student took the SAT
Spreadsheet; also provide copies of student score sheets provided by test publisher, or data disc from test publisher including test scores
Kwame Green and Samantha Mewes
Academic Achievement: Standardized Measures ACT or SAT
For each 12th-grade student, include the following: WSN Student name Took the ACT Date student took the ACT ACT English, mathematics,
reading, and science scale scores
ACT composite score Took the SAT Date student took the SAT
Spreadsheet; also provide copies of student score sheets provided by test publisher, or data disc from test publisher including test scores
Kwame Green and Samantha Mewes

© 2012 by NCCD, All Rights Reserved https://sharepoint.nccdcrc.org/Projects/Project Documents/USA/Wisconsin/508WI_Milw/2011-12/CEO/CEO 2011-12 Yr 1 FINAL.docx
Appendix C
Trend Information
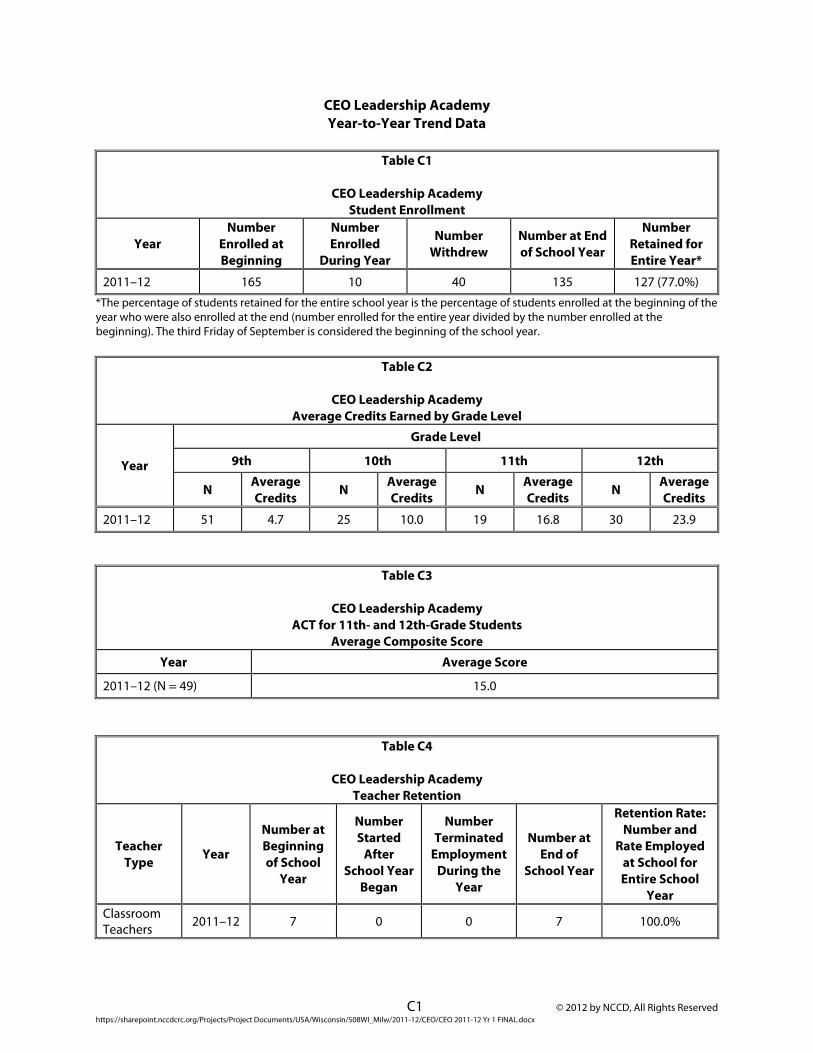
C1 © 2012 by NCCD, All Rights Reserved https://sharepoint.nccdcrc.org/Projects/Project Documents/USA/Wisconsin/508WI_Milw/2011-12/CEO/CEO 2011-12 Yr 1 FINAL.docx
CEO Leadership Academy Year-to-Year Trend Data
Table C1
CEO Leadership Academy
Student Enrollment
Year Number
Enrolled at Beginning
Number Enrolled
During Year
Number Withdrew
Number at End of School Year
Number Retained for Entire Year*
2011–12 165 10 40 135 127 (77.0%)
*The percentage of students retained for the entire school year is the percentage of students enrolled at the beginning of the year who were also enrolled at the end (number enrolled for the entire year divided by the number enrolled at the beginning). The third Friday of September is considered the beginning of the school year.
Table C2
CEO Leadership Academy Average Credits Earned by Grade Level
Year
Grade Level
9th 10th 11th 12th
N Average Credits
N Average Credits
N Average Credits
N Average Credits
2011–12 51 4.7 25 10.0 19 16.8 30 23.9
Table C3
CEO Leadership Academy ACT for 11th- and 12th-Grade Students
Average Composite Score
Year Average Score
2011–12 (N = 49) 15.0
Table C4
CEO Leadership Academy Teacher Retention
Teacher Type
Year
Number at Beginning of School
Year
Number Started
After School Year
Began
Number Terminated
Employment During the
Year
Number at End of
School Year
Retention Rate: Number and
Rate Employed at School for Entire School
Year Classroom Teachers 2011–12 7 0 0 7 100.0%
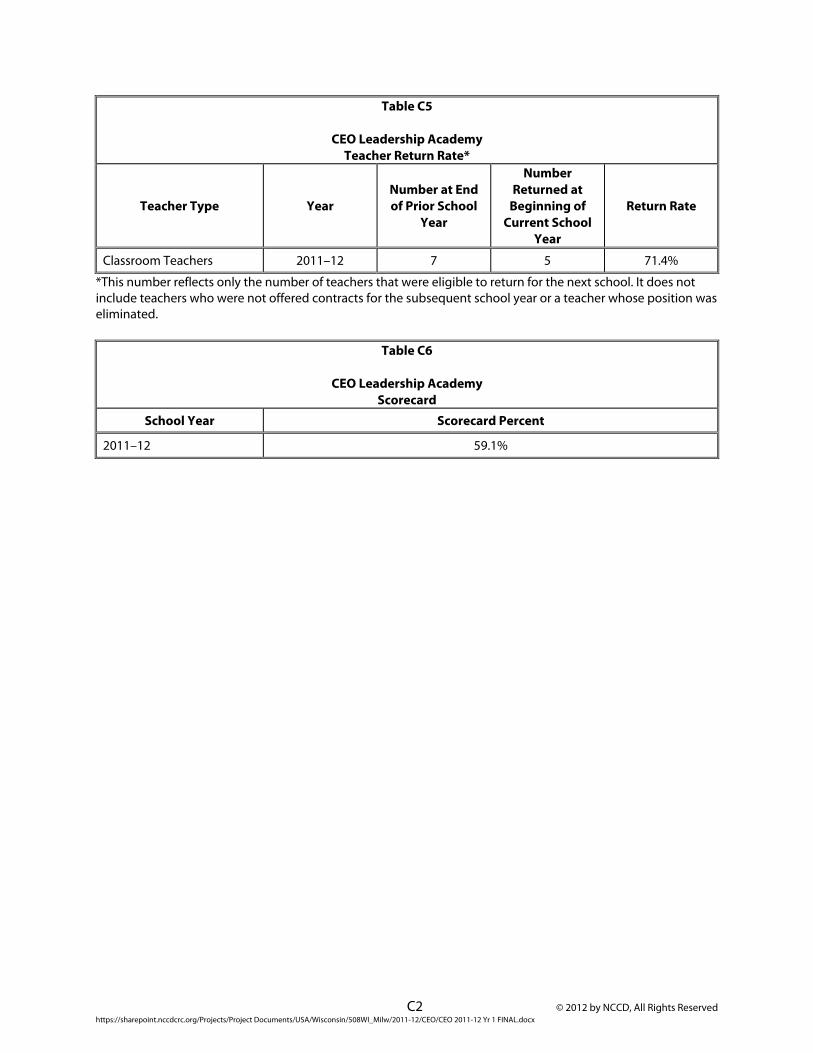
C2 © 2012 by NCCD, All Rights Reserved https://sharepoint.nccdcrc.org/Projects/Project Documents/USA/Wisconsin/508WI_Milw/2011-12/CEO/CEO 2011-12 Yr 1 FINAL.docx
Table C5
CEO Leadership Academy Teacher Return Rate*
Teacher Type Year Number at End of Prior School
Year
Number Returned at
Beginning of Current School
Year
Return Rate
Classroom Teachers 2011–12 7 5 71.4%
*This number reflects only the number of teachers that were eligible to return for the next school. It does not include teachers who were not offered contracts for the subsequent school year or a teacher whose position was eliminated.
Table C6
CEO Leadership Academy Scorecard
School Year Scorecard Percent
2011–12 59.1%

© 2012 by NCCD, All Rights Reserved https://sharepoint.nccdcrc.org/Projects/Project Documents/USA/Wisconsin/508WI_Milw/2011-12/CEO/CEO 2011-12 Yr 1 FINAL.docx
Appendix D
CRC Pilot Scorecard
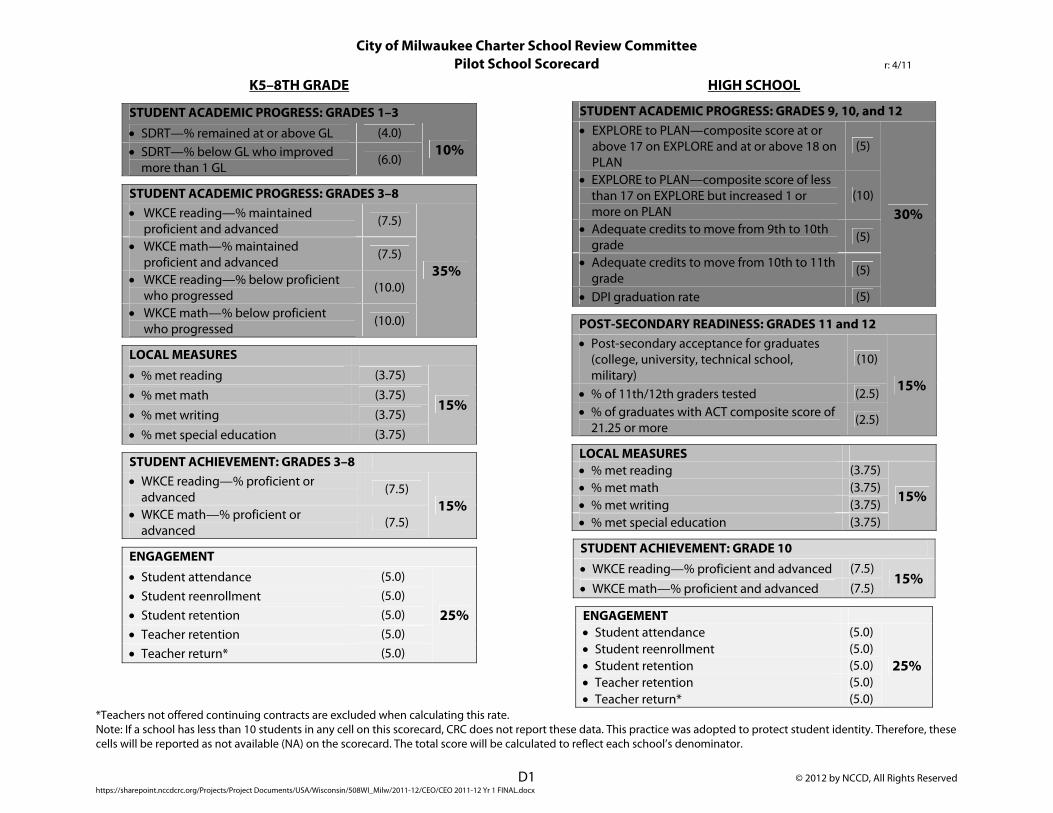
D1 © 2012 by NCCD, All Rights Reserved https://sharepoint.nccdcrc.org/Projects/Project Documents/USA/Wisconsin/508WI_Milw/2011-12/CEO/CEO 2011-12 Yr 1 FINAL.docx
City of Milwaukee Charter School Review Committee Pilot School Scorecard r: 4/11
K5–8TH GRADE
STUDENT ACADEMIC PROGRESS: GRADES 1–3
SDRT—% remained at or above GL (4.0) 10% SDRT—% below GL who improved
more than 1 GL (6.0)
STUDENT ACADEMIC PROGRESS: GRADES 3–8 WKCE reading—% maintained
proficient and advanced (7.5)
35%
WKCE math—% maintained proficient and advanced
(7.5)
WKCE reading—% below proficient who progressed
(10.0)
WKCE math—% below proficient who progressed
(10.0)
LOCAL MEASURES
% met reading (3.75)
15% % met math (3.75)
% met writing (3.75)
% met special education (3.75)
STUDENT ACHIEVEMENT: GRADES 3–8 WKCE reading—% proficient or
advanced (7.5)
15% WKCE math—% proficient or
advanced (7.5)
ENGAGEMENT Student attendance (5.0)
25% Student reenrollment (5.0) Student retention (5.0) Teacher retention (5.0) Teacher return* (5.0)
HIGH SCHOOL
STUDENT ACADEMIC PROGRESS: GRADES 9, 10, and 12 EXPLORE to PLAN—composite score at or
above 17 on EXPLORE and at or above 18 on PLAN
(5)
30%
EXPLORE to PLAN—composite score of less than 17 on EXPLORE but increased 1 or more on PLAN
(10)
Adequate credits to move from 9th to 10th grade
(5)
Adequate credits to move from 10th to 11th grade
(5)
DPI graduation rate (5)
POST-SECONDARY READINESS: GRADES 11 and 12 Post-secondary acceptance for graduates
(college, university, technical school, military)
(10)
15% % of 11th/12th graders tested (2.5) % of graduates with ACT composite score of
21.25 or more (2.5)
LOCAL MEASURES % met reading (3.75)
15% % met math (3.75) % met writing (3.75) % met special education (3.75)
STUDENT ACHIEVEMENT: GRADE 10
WKCE reading—% proficient and advanced (7.5) 15%
WKCE math—% proficient and advanced (7.5)
ENGAGEMENT Student attendance (5.0)
25% Student reenrollment (5.0) Student retention (5.0) Teacher retention (5.0) Teacher return* (5.0)
*Teachers not offered continuing contracts are excluded when calculating this rate. Note: If a school has less than 10 students in any cell on this scorecard, CRC does not report these data. This practice was adopted to protect student identity. Therefore, these cells will be reported as not available (NA) on the scorecard. The total score will be calculated to reflect each school’s denominator.
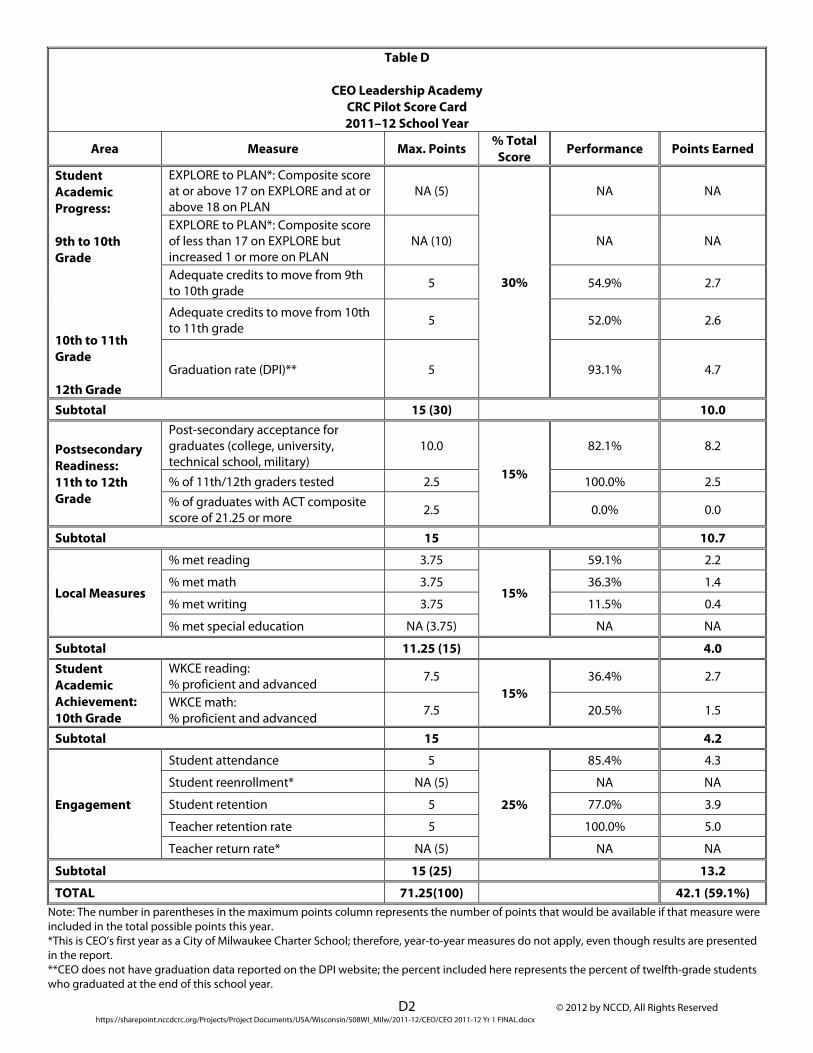
D2 © 2012 by NCCD, All Rights Reserved https://sharepoint.nccdcrc.org/Projects/Project Documents/USA/Wisconsin/508WI_Milw/2011-12/CEO/CEO 2011-12 Yr 1 FINAL.docx
Table D
CEO Leadership Academy CRC Pilot Score Card 2011–12 School Year
Area Measure Max. Points % Total Score Performance Points Earned
Student Academic Progress: 9th to 10th Grade 10th to 11th Grade 12th Grade
EXPLORE to PLAN*: Composite score at or above 17 on EXPLORE and at or above 18 on PLAN
NA (5)
30%
NA NA
EXPLORE to PLAN*: Composite score of less than 17 on EXPLORE but increased 1 or more on PLAN
NA (10) NA NA
Adequate credits to move from 9th to 10th grade 5 54.9% 2.7
Adequate credits to move from 10th to 11th grade 5 52.0% 2.6
Graduation rate (DPI)** 5 93.1% 4.7
Subtotal 15 (30) 10.0
Postsecondary Readiness: 11th to 12th Grade
Post-secondary acceptance for graduates (college, university, technical school, military)
10.0
15%
82.1% 8.2
% of 11th/12th graders tested 2.5 100.0% 2.5
% of graduates with ACT composite score of 21.25 or more 2.5 0.0% 0.0
Subtotal 15 10.7
Local Measures
% met reading 3.75
15%
59.1% 2.2
% met math 3.75 36.3% 1.4
% met writing 3.75 11.5% 0.4
% met special education NA (3.75) NA NA
Subtotal 11.25 (15) 4.0 Student Academic Achievement: 10th Grade
WKCE reading: % proficient and advanced 7.5
15% 36.4% 2.7
WKCE math: % proficient and advanced 7.5 20.5% 1.5
Subtotal 15 4.2
Engagement
Student attendance 5
25%
85.4% 4.3
Student reenrollment* NA (5) NA NA
Student retention 5 77.0% 3.9
Teacher retention rate 5 100.0% 5.0
Teacher return rate* NA (5) NA NA
Subtotal 15 (25) 13.2
TOTAL 71.25(100) 42.1 (59.1%) Note: The number in parentheses in the maximum points column represents the number of points that would be available if that measure were included in the total possible points this year. *This is CEO’s first year as a City of Milwaukee Charter School; therefore, year-to-year measures do not apply, even though results are presented in the report. **CEO does not have graduation data reported on the DPI website; the percent included here represents the percent of twelfth-grade students who graduated at the end of this school year.

© 2012 by NCCD, All Rights Reserved
https://sharepoint.nccdcrc.org/Projects/Project Documents/USA/Wisconsin/508WI_Milw/2011-12/CEO/CEO 2011-12 Yr 1 FINAL.docx
Appendix E
Teacher Interviews
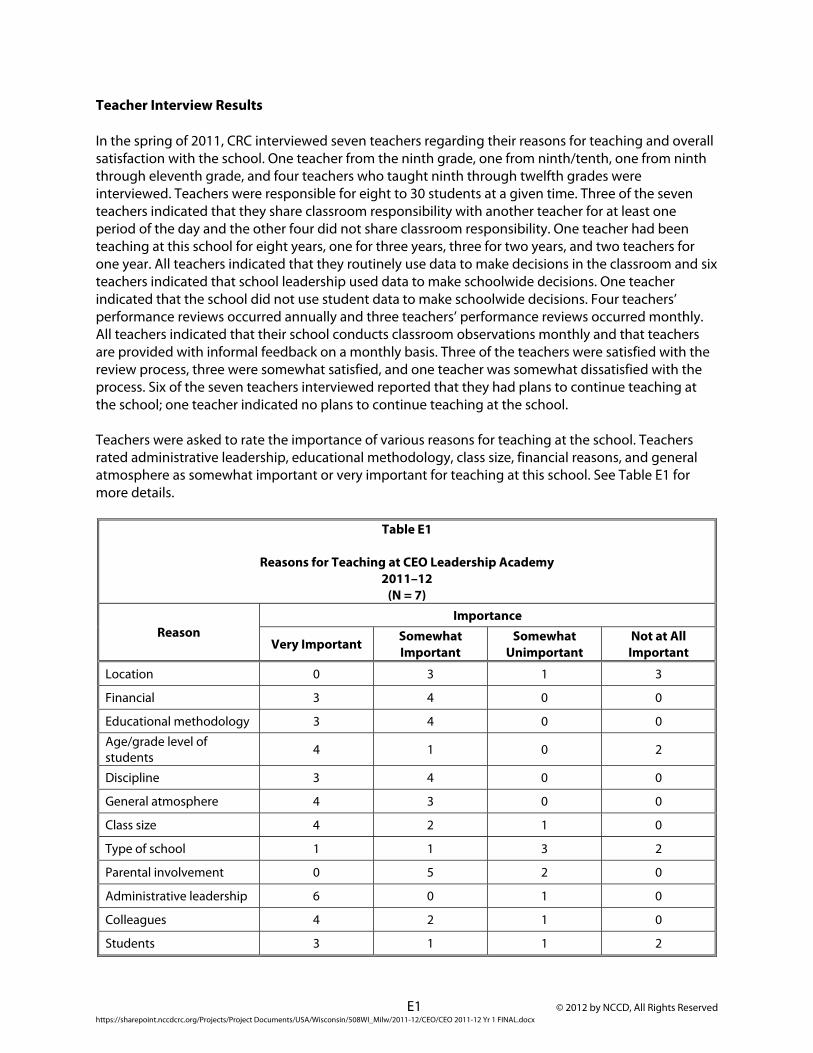
E1 © 2012 by NCCD, All Rights Reserved https://sharepoint.nccdcrc.org/Projects/Project Documents/USA/Wisconsin/508WI_Milw/2011-12/CEO/CEO 2011-12 Yr 1 FINAL.docx
Teacher Interview Results
In the spring of 2011, CRC interviewed seven teachers regarding their reasons for teaching and overall satisfaction with the school. One teacher from the ninth grade, one from ninth/tenth, one from ninth through eleventh grade, and four teachers who taught ninth through twelfth grades were interviewed. Teachers were responsible for eight to 30 students at a given time. Three of the seven teachers indicated that they share classroom responsibility with another teacher for at least one period of the day and the other four did not share classroom responsibility. One teacher had been teaching at this school for eight years, one for three years, three for two years, and two teachers for one year. All teachers indicated that they routinely use data to make decisions in the classroom and six teachers indicated that school leadership used data to make schoolwide decisions. One teacher indicated that the school did not use student data to make schoolwide decisions. Four teachers’ performance reviews occurred annually and three teachers’ performance reviews occurred monthly. All teachers indicated that their school conducts classroom observations monthly and that teachers are provided with informal feedback on a monthly basis. Three of the teachers were satisfied with the review process, three were somewhat satisfied, and one teacher was somewhat dissatisfied with the process. Six of the seven teachers interviewed reported that they had plans to continue teaching at the school; one teacher indicated no plans to continue teaching at the school. Teachers were asked to rate the importance of various reasons for teaching at the school. Teachers rated administrative leadership, educational methodology, class size, financial reasons, and general atmosphere as somewhat important or very important for teaching at this school. See Table E1 for more details.
Table E1
Reasons for Teaching at CEO Leadership Academy 2011–12
(N = 7)
Reason Importance
Very Important Somewhat Important
Somewhat Unimportant
Not at All Important
Location 0 3 1 3
Financial 3 4 0 0
Educational methodology 3 4 0 0
Age/grade level of students 4 1 0 2
Discipline 3 4 0 0
General atmosphere 4 3 0 0
Class size 4 2 1 0
Type of school 1 1 3 2
Parental involvement 0 5 2 0
Administrative leadership 6 0 1 0
Colleagues 4 2 1 0
Students 3 1 1 2
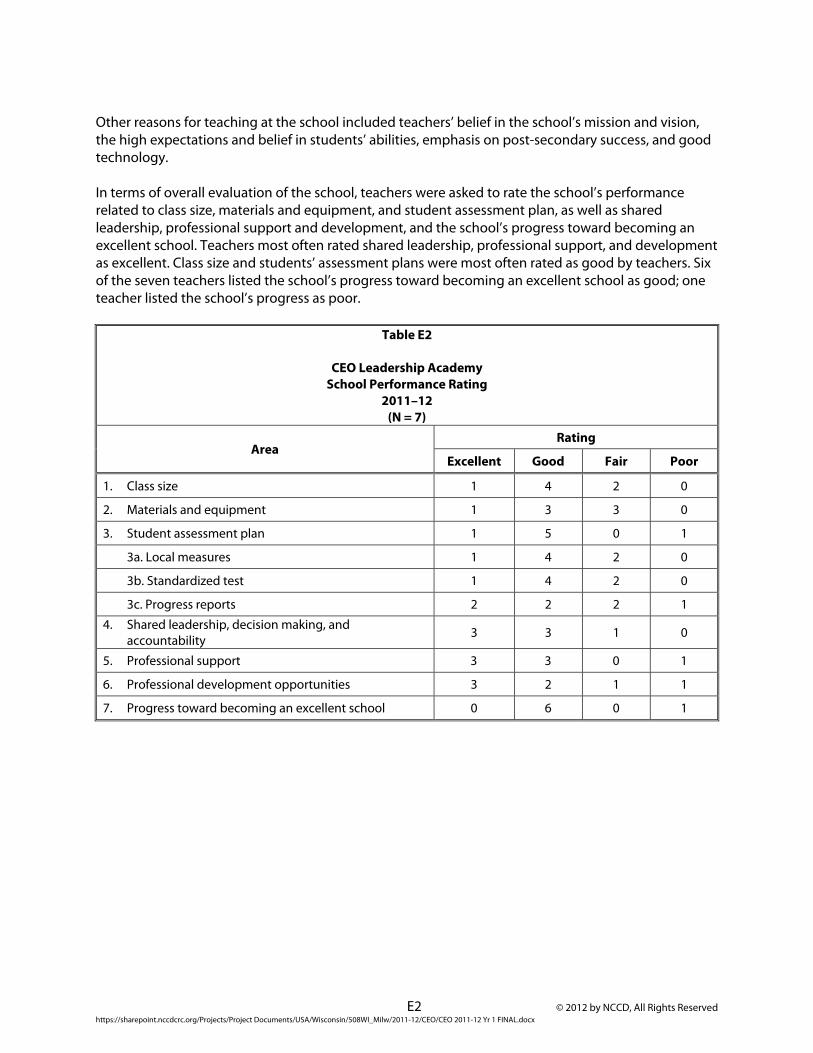
E2 © 2012 by NCCD, All Rights Reserved https://sharepoint.nccdcrc.org/Projects/Project Documents/USA/Wisconsin/508WI_Milw/2011-12/CEO/CEO 2011-12 Yr 1 FINAL.docx
Other reasons for teaching at the school included teachers’ belief in the school’s mission and vision, the high expectations and belief in students’ abilities, emphasis on post-secondary success, and good technology. In terms of overall evaluation of the school, teachers were asked to rate the school’s performance related to class size, materials and equipment, and student assessment plan, as well as shared leadership, professional support and development, and the school’s progress toward becoming an excellent school. Teachers most often rated shared leadership, professional support, and development as excellent. Class size and students’ assessment plans were most often rated as good by teachers. Six of the seven teachers listed the school’s progress toward becoming an excellent school as good; one teacher listed the school’s progress as poor.
Table E2
CEO Leadership Academy School Performance Rating
2011–12 (N = 7)
Area Rating
Excellent Good Fair Poor
1. Class size 1 4 2 0
2. Materials and equipment 1 3 3 0
3. Student assessment plan 1 5 0 1
3a. Local measures 1 4 2 0
3b. Standardized test 1 4 2 0
3c. Progress reports 2 2 2 1
4. Shared leadership, decision making, and accountability 3 3 1 0
5. Professional support 3 3 0 1
6. Professional development opportunities 3 2 1 1
7. Progress toward becoming an excellent school 0 6 0 1
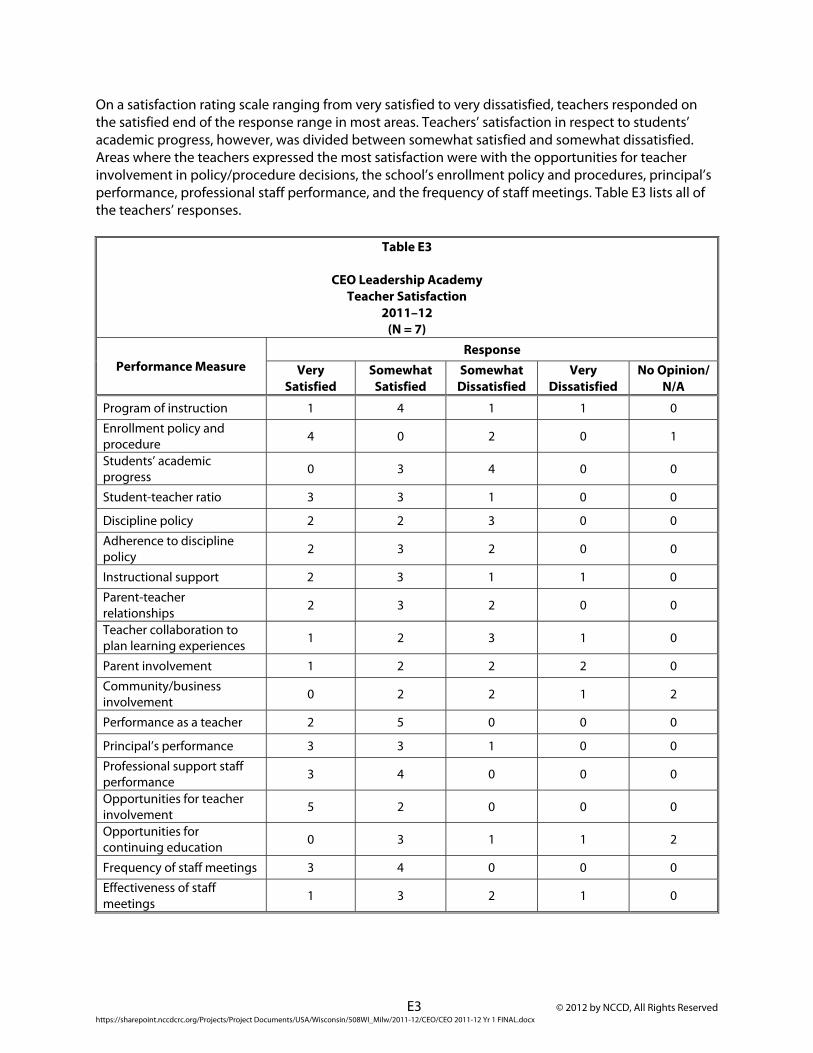
E3 © 2012 by NCCD, All Rights Reserved https://sharepoint.nccdcrc.org/Projects/Project Documents/USA/Wisconsin/508WI_Milw/2011-12/CEO/CEO 2011-12 Yr 1 FINAL.docx
On a satisfaction rating scale ranging from very satisfied to very dissatisfied, teachers responded on the satisfied end of the response range in most areas. Teachers’ satisfaction in respect to students’ academic progress, however, was divided between somewhat satisfied and somewhat dissatisfied. Areas where the teachers expressed the most satisfaction were with the opportunities for teacher involvement in policy/procedure decisions, the school’s enrollment policy and procedures, principal’s performance, professional staff performance, and the frequency of staff meetings. Table E3 lists all of the teachers’ responses.
Table E3
CEO Leadership Academy Teacher Satisfaction
2011–12 (N = 7)
Performance Measure Response
Very Satisfied
Somewhat Satisfied
Somewhat Dissatisfied
Very Dissatisfied
No Opinion/ N/A
Program of instruction 1 4 1 1 0
Enrollment policy and procedure 4 0 2 0 1
Students’ academic progress 0 3 4 0 0
Student-teacher ratio 3 3 1 0 0
Discipline policy 2 2 3 0 0
Adherence to discipline policy 2 3 2 0 0
Instructional support 2 3 1 1 0
Parent-teacher relationships 2 3 2 0 0
Teacher collaboration to plan learning experiences 1 2 3 1 0
Parent involvement 1 2 2 2 0
Community/business involvement
0 2 2 1 2
Performance as a teacher 2 5 0 0 0
Principal’s performance 3 3 1 0 0
Professional support staff performance 3 4 0 0 0
Opportunities for teacher involvement 5 2 0 0 0
Opportunities for continuing education 0 3 1 1 2
Frequency of staff meetings 3 4 0 0 0
Effectiveness of staff meetings
1 3 2 1 0
E4 © 2012 by NCCD, All Rights Reserved https://sharepoint.nccdcrc.org/Projects/Project Documents/USA/Wisconsin/508WI_Milw/2011-12/CEO/CEO 2011-12 Yr 1 FINAL.docx
When teachers were asked to name three things they liked most about the school, teachers noted the following:
High expectations for students (two teachers); Relationships with students/staff (four teachers); Receive regular feedback (two teachers); and Administrative staff/leadership (two teachers).
One teacher each mentioned the data-driven culture, school’s focus on mission, classroom culture, the availability of technology, all certified teachers, alumni talk to students about college, ability to ask questions, and small size. Teachers most often mentioned the following as least liked about the school:
Lack of prep time (three teachers); and Lack of resources, i.e., materials (two teachers).
One teacher each mentioned the amount of time required outside of the classroom, emphasis on 100% uniform compliance, focus on testing, lack of electives for students, too few vacation days, discipline not consistent, morning and evening time too unstructured, no access to expert in field, school day too long, strict focus on college readiness, student culture of missed assignments; building needs updating; not a happy place all the time, and study time for students outside of class. Teachers were then asked to comment on any barriers they identified that could affect their decisions to continue teaching at the school. Two teachers identified poor performance reviews as potential barriers. One teacher each said requirements and demands made on teachers and lack of financial benefits as reasons that could affect their decisions to continue teaching. Three teachers identified no barriers. When asked for a suggestion to improve the school, teachers recommended make the school-year round (two); build a positive academic environment/focus on positive reinforcement (two); Provide more remedial education to youth with learning gaps (one); develop assistance for teachers in each content area (one); and foster stronger student culture in the school (one). When asked to provide a suggestion to improve the classroom, teachers recommended replacing classroom tables with desks (two); receive assistance in developing new teaching strategies (one); improve communication with parents (one); add more technology (one); smaller class sizes (one); and teach only one class to reduce preparation for numerous courses (one). Teachers were also asked to rate the school’s contribution to students’ academic progress. On a scale of poor, fair, good, or excellent, six of the teachers rated the school’s contribution as good, and one teacher rated the school’s contribution as fair.

© 2012 by NCCD, All Rights Reserved https://sharepoint.nccdcrc.org/Projects/Project Documents/USA/Wisconsin/508WI_Milw/2011-12/CEO/CEO 2011-12 Yr 1 FINAL.docx
Appendix F
Parent Surveys/Interviews
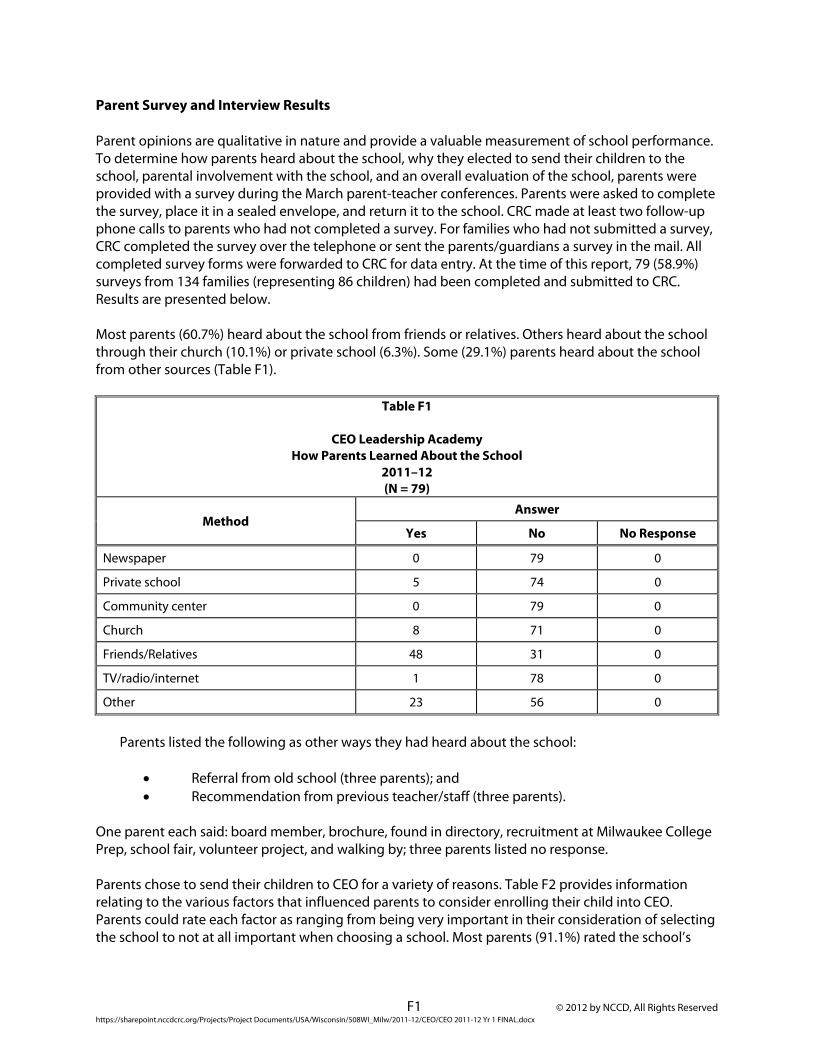
F1 © 2012 by NCCD, All Rights Reserved https://sharepoint.nccdcrc.org/Projects/Project Documents/USA/Wisconsin/508WI_Milw/2011-12/CEO/CEO 2011-12 Yr 1 FINAL.docx
Parent Survey and Interview Results
Parent opinions are qualitative in nature and provide a valuable measurement of school performance. To determine how parents heard about the school, why they elected to send their children to the school, parental involvement with the school, and an overall evaluation of the school, parents were provided with a survey during the March parent-teacher conferences. Parents were asked to complete the survey, place it in a sealed envelope, and return it to the school. CRC made at least two follow-up phone calls to parents who had not completed a survey. For families who had not submitted a survey, CRC completed the survey over the telephone or sent the parents/guardians a survey in the mail. All completed survey forms were forwarded to CRC for data entry. At the time of this report, 79 (58.9%) surveys from 134 families (representing 86 children) had been completed and submitted to CRC. Results are presented below. Most parents (60.7%) heard about the school from friends or relatives. Others heard about the school through their church (10.1%) or private school (6.3%). Some (29.1%) parents heard about the school from other sources (Table F1).
Table F1
CEO Leadership Academy How Parents Learned About the School
2011–12 (N = 79)
Method Answer
Yes No No Response
Newspaper 0 79 0
Private school 5 74 0
Community center 0 79 0
Church 8 71 0
Friends/Relatives 48 31 0
TV/radio/internet 1 78 0
Other 23 56 0
Parents listed the following as other ways they had heard about the school:
Referral from old school (three parents); and Recommendation from previous teacher/staff (three parents).
One parent each said: board member, brochure, found in directory, recruitment at Milwaukee College Prep, school fair, volunteer project, and walking by; three parents listed no response. Parents chose to send their children to CEO for a variety of reasons. Table F2 provides information relating to the various factors that influenced parents to consider enrolling their child into CEO. Parents could rate each factor as ranging from being very important in their consideration of selecting the school to not at all important when choosing a school. Most parents (91.1%) rated the school’s
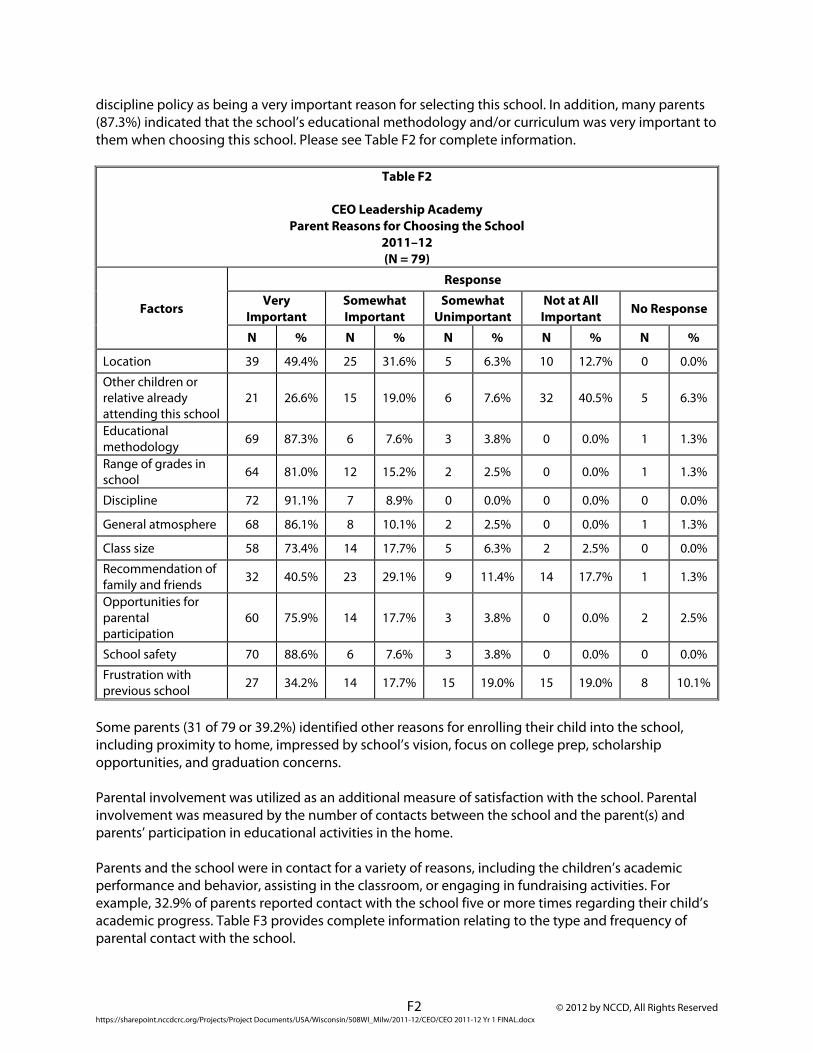
F2 © 2012 by NCCD, All Rights Reserved https://sharepoint.nccdcrc.org/Projects/Project Documents/USA/Wisconsin/508WI_Milw/2011-12/CEO/CEO 2011-12 Yr 1 FINAL.docx
discipline policy as being a very important reason for selecting this school. In addition, many parents (87.3%) indicated that the school’s educational methodology and/or curriculum was very important to them when choosing this school. Please see Table F2 for complete information.
Table F2
CEO Leadership Academy
Parent Reasons for Choosing the School 2011–12 (N = 79)
Factors
Response
Very Important
Somewhat Important
Somewhat Unimportant
Not at All Important No Response
N % N % N % N % N %
Location 39 49.4% 25 31.6% 5 6.3% 10 12.7% 0 0.0%
Other children or relative already attending this school
21 26.6% 15 19.0% 6 7.6% 32 40.5% 5 6.3%
Educational methodology 69 87.3% 6 7.6% 3 3.8% 0 0.0% 1 1.3%
Range of grades in school 64 81.0% 12 15.2% 2 2.5% 0 0.0% 1 1.3%
Discipline 72 91.1% 7 8.9% 0 0.0% 0 0.0% 0 0.0%
General atmosphere 68 86.1% 8 10.1% 2 2.5% 0 0.0% 1 1.3%
Class size 58 73.4% 14 17.7% 5 6.3% 2 2.5% 0 0.0%
Recommendation of family and friends
32 40.5% 23 29.1% 9 11.4% 14 17.7% 1 1.3%
Opportunities for parental participation
60 75.9% 14 17.7% 3 3.8% 0 0.0% 2 2.5%
School safety 70 88.6% 6 7.6% 3 3.8% 0 0.0% 0 0.0%
Frustration with previous school 27 34.2% 14 17.7% 15 19.0% 15 19.0% 8 10.1%
Some parents (31 of 79 or 39.2%) identified other reasons for enrolling their child into the school, including proximity to home, impressed by school’s vision, focus on college prep, scholarship opportunities, and graduation concerns. Parental involvement was utilized as an additional measure of satisfaction with the school. Parental involvement was measured by the number of contacts between the school and the parent(s) and parents’ participation in educational activities in the home. Parents and the school were in contact for a variety of reasons, including the children’s academic performance and behavior, assisting in the classroom, or engaging in fundraising activities. For example, 32.9% of parents reported contact with the school five or more times regarding their child’s academic progress. Table F3 provides complete information relating to the type and frequency of parental contact with the school.
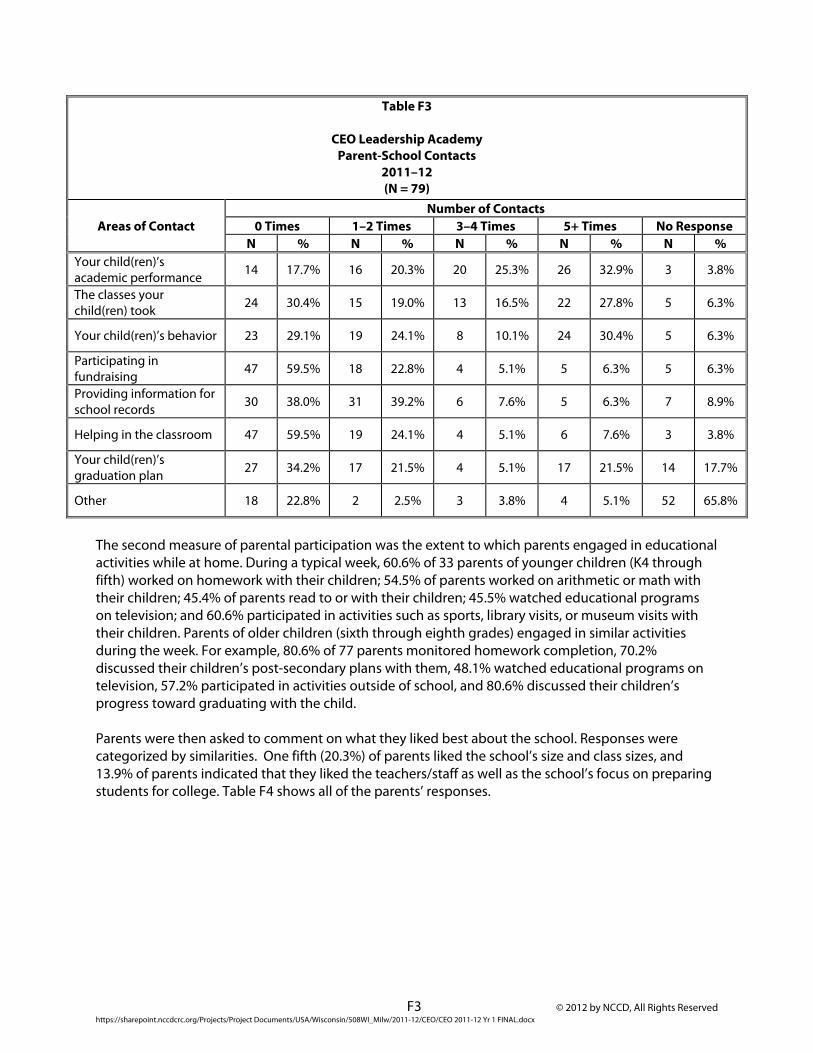
F3 © 2012 by NCCD, All Rights Reserved https://sharepoint.nccdcrc.org/Projects/Project Documents/USA/Wisconsin/508WI_Milw/2011-12/CEO/CEO 2011-12 Yr 1 FINAL.docx
Table F3
CEO Leadership Academy Parent-School Contacts
2011–12 (N = 79)
Areas of Contact Number of Contacts
0 Times 1–2 Times 3–4 Times 5+ Times No ResponseN % N % N % N % N %
Your child(ren)’s academic performance 14 17.7% 16 20.3% 20 25.3% 26 32.9% 3 3.8%
The classes your child(ren) took 24 30.4% 15 19.0% 13 16.5% 22 27.8% 5 6.3%
Your child(ren)’s behavior 23 29.1% 19 24.1% 8 10.1% 24 30.4% 5 6.3%
Participating in fundraising 47 59.5% 18 22.8% 4 5.1% 5 6.3% 5 6.3%
Providing information for school records 30 38.0% 31 39.2% 6 7.6% 5 6.3% 7 8.9%
Helping in the classroom 47 59.5% 19 24.1% 4 5.1% 6 7.6% 3 3.8%
Your child(ren)’s graduation plan 27 34.2% 17 21.5% 4 5.1% 17 21.5% 14 17.7%
Other 18 22.8% 2 2.5% 3 3.8% 4 5.1% 52 65.8%
The second measure of parental participation was the extent to which parents engaged in educational activities while at home. During a typical week, 60.6% of 33 parents of younger children (K4 through fifth) worked on homework with their children; 54.5% of parents worked on arithmetic or math with their children; 45.4% of parents read to or with their children; 45.5% watched educational programs on television; and 60.6% participated in activities such as sports, library visits, or museum visits with their children. Parents of older children (sixth through eighth grades) engaged in similar activities during the week. For example, 80.6% of 77 parents monitored homework completion, 70.2% discussed their children’s post-secondary plans with them, 48.1% watched educational programs on television, 57.2% participated in activities outside of school, and 80.6% discussed their children’s progress toward graduating with the child. Parents were then asked to comment on what they liked best about the school. Responses were categorized by similarities. One fifth (20.3%) of parents liked the school’s size and class sizes, and 13.9% of parents indicated that they liked the teachers/staff as well as the school’s focus on preparing students for college. Table F4 shows all of the parents’ responses.
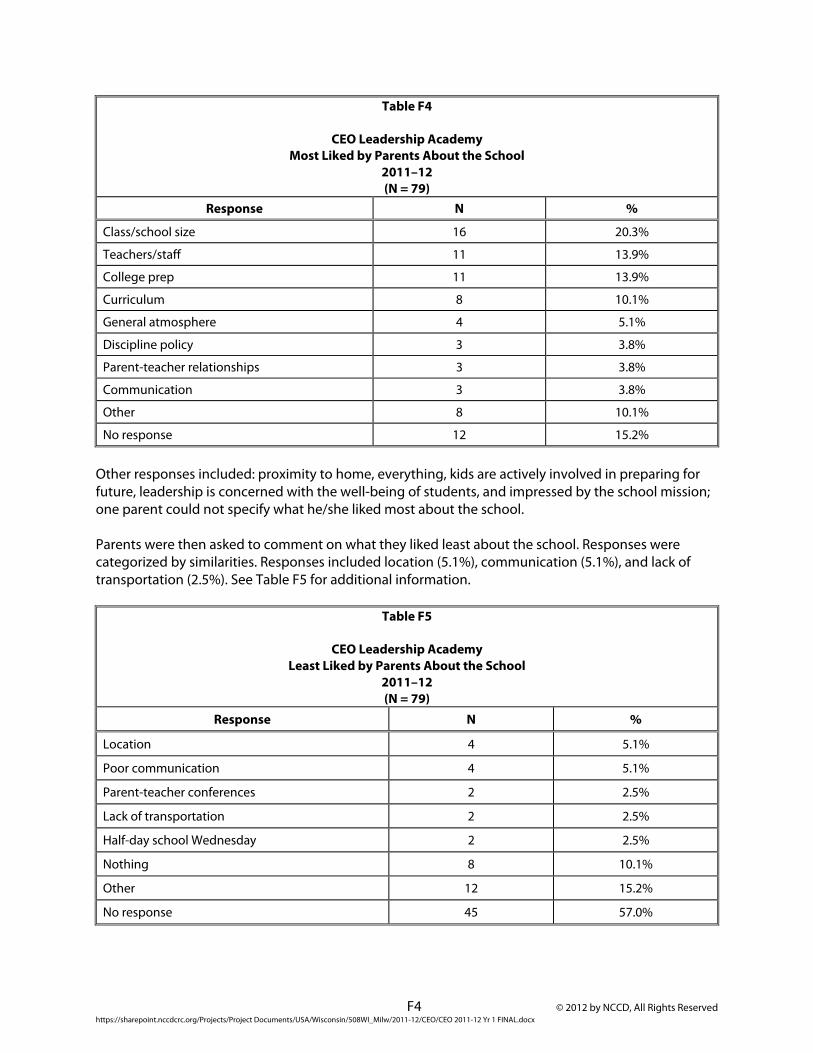
F4 © 2012 by NCCD, All Rights Reserved https://sharepoint.nccdcrc.org/Projects/Project Documents/USA/Wisconsin/508WI_Milw/2011-12/CEO/CEO 2011-12 Yr 1 FINAL.docx
Table F4
CEO Leadership Academy Most Liked by Parents About the School
2011–12 (N = 79)
Response N %
Class/school size 16 20.3%
Teachers/staff 11 13.9%
College prep 11 13.9%
Curriculum 8 10.1%
General atmosphere 4 5.1%
Discipline policy 3 3.8%
Parent-teacher relationships 3 3.8%
Communication 3 3.8%
Other 8 10.1%
No response 12 15.2%
Other responses included: proximity to home, everything, kids are actively involved in preparing for future, leadership is concerned with the well-being of students, and impressed by the school mission; one parent could not specify what he/she liked most about the school. Parents were then asked to comment on what they liked least about the school. Responses were categorized by similarities. Responses included location (5.1%), communication (5.1%), and lack of transportation (2.5%). See Table F5 for additional information.
Table F5
CEO Leadership Academy
Least Liked by Parents About the School 2011–12 (N = 79)
Response N %
Location 4 5.1%
Poor communication 4 5.1%
Parent-teacher conferences 2 2.5%
Lack of transportation 2 2.5%
Half-day school Wednesday 2 2.5%
Nothing 8 10.1%
Other 12 15.2%
No response 45 57.0%
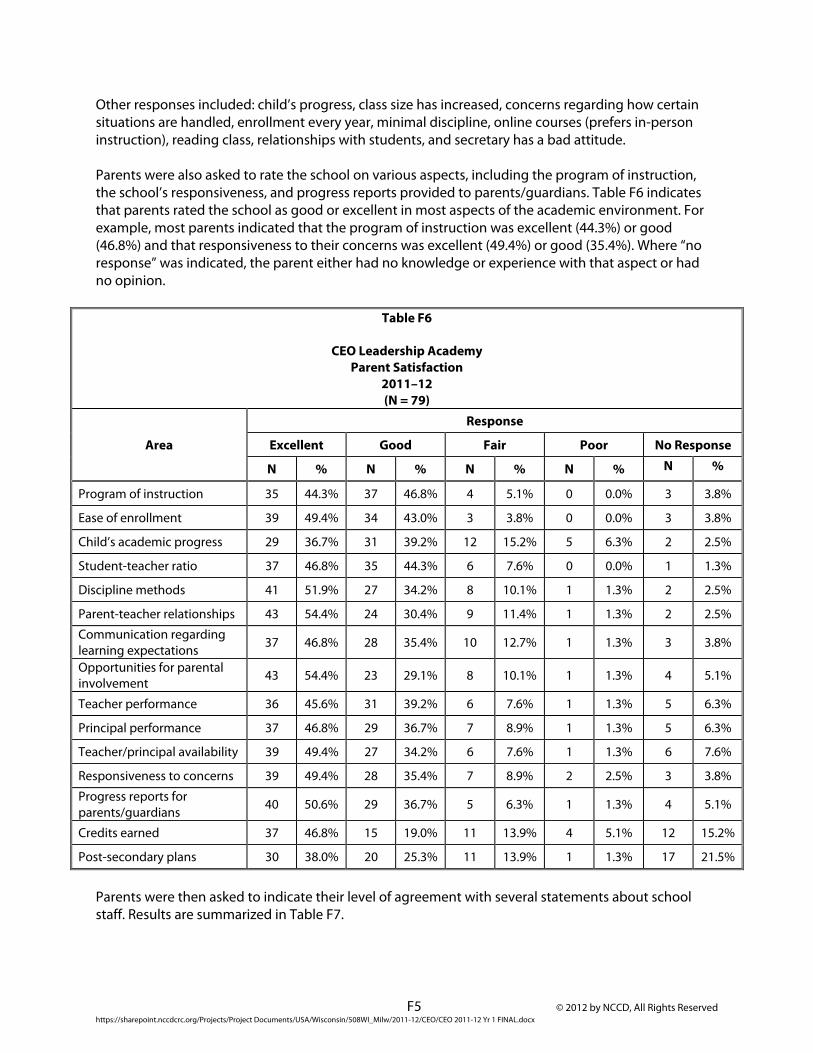
F5 © 2012 by NCCD, All Rights Reserved https://sharepoint.nccdcrc.org/Projects/Project Documents/USA/Wisconsin/508WI_Milw/2011-12/CEO/CEO 2011-12 Yr 1 FINAL.docx
Other responses included: child’s progress, class size has increased, concerns regarding how certain situations are handled, enrollment every year, minimal discipline, online courses (prefers in-person instruction), reading class, relationships with students, and secretary has a bad attitude. Parents were also asked to rate the school on various aspects, including the program of instruction, the school’s responsiveness, and progress reports provided to parents/guardians. Table F6 indicates that parents rated the school as good or excellent in most aspects of the academic environment. For example, most parents indicated that the program of instruction was excellent (44.3%) or good (46.8%) and that responsiveness to their concerns was excellent (49.4%) or good (35.4%). Where “no response” was indicated, the parent either had no knowledge or experience with that aspect or had no opinion.
Table F6
CEO Leadership Academy Parent Satisfaction
2011–12 (N = 79)
Area
Response
Excellent Good Fair Poor No Response
N % N % N % N % N %
Program of instruction 35 44.3% 37 46.8% 4 5.1% 0 0.0% 3 3.8%
Ease of enrollment 39 49.4% 34 43.0% 3 3.8% 0 0.0% 3 3.8%
Child’s academic progress 29 36.7% 31 39.2% 12 15.2% 5 6.3% 2 2.5%
Student-teacher ratio 37 46.8% 35 44.3% 6 7.6% 0 0.0% 1 1.3%
Discipline methods 41 51.9% 27 34.2% 8 10.1% 1 1.3% 2 2.5%
Parent-teacher relationships 43 54.4% 24 30.4% 9 11.4% 1 1.3% 2 2.5%
Communication regarding learning expectations 37 46.8% 28 35.4% 10 12.7% 1 1.3% 3 3.8%
Opportunities for parental involvement 43 54.4% 23 29.1% 8 10.1% 1 1.3% 4 5.1%
Teacher performance 36 45.6% 31 39.2% 6 7.6% 1 1.3% 5 6.3%
Principal performance 37 46.8% 29 36.7% 7 8.9% 1 1.3% 5 6.3%
Teacher/principal availability 39 49.4% 27 34.2% 6 7.6% 1 1.3% 6 7.6%
Responsiveness to concerns 39 49.4% 28 35.4% 7 8.9% 2 2.5% 3 3.8%
Progress reports for parents/guardians
40 50.6% 29 36.7% 5 6.3% 1 1.3% 4 5.1%
Credits earned 37 46.8% 15 19.0% 11 13.9% 4 5.1% 12 15.2%
Post-secondary plans 30 38.0% 20 25.3% 11 13.9% 1 1.3% 17 21.5%
Parents were then asked to indicate their level of agreement with several statements about school staff. Results are summarized in Table F7.
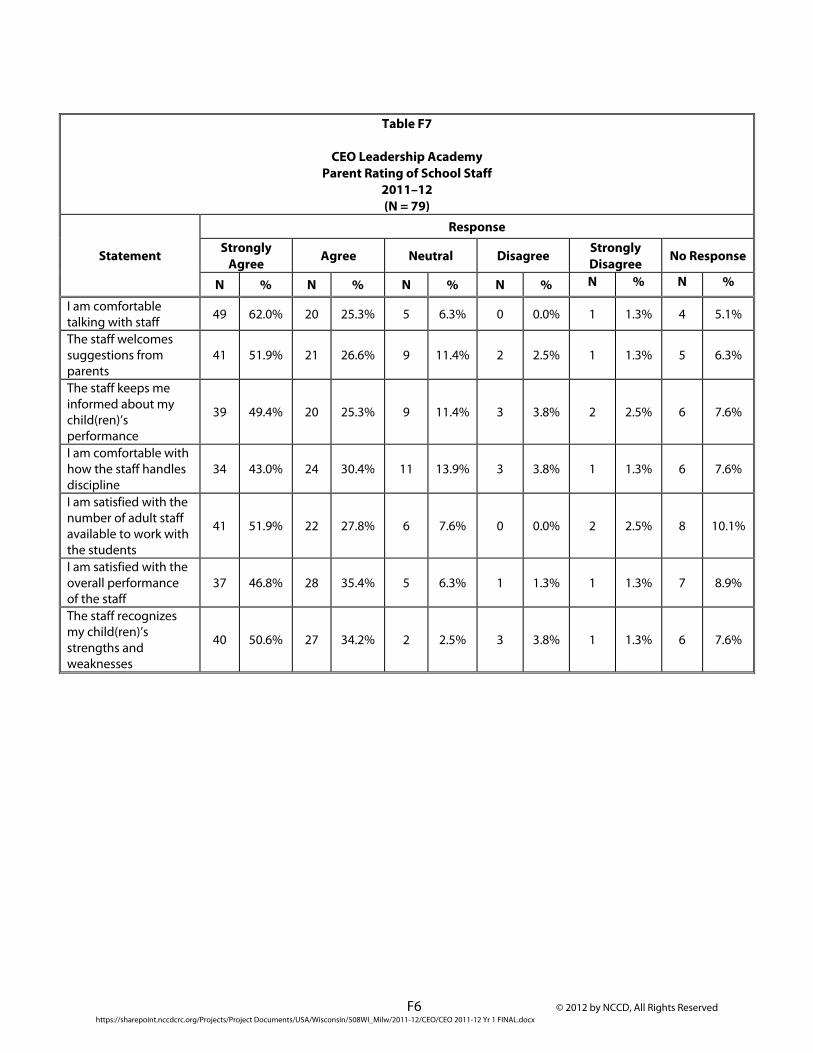
F6 © 2012 by NCCD, All Rights Reserved https://sharepoint.nccdcrc.org/Projects/Project Documents/USA/Wisconsin/508WI_Milw/2011-12/CEO/CEO 2011-12 Yr 1 FINAL.docx
Table F7
CEO Leadership Academy
Parent Rating of School Staff 2011–12 (N = 79)
Statement
Response
Strongly Agree Agree Neutral Disagree Strongly
Disagree No Response
N % N % N % N % N % N %
I am comfortable talking with staff 49 62.0% 20 25.3% 5 6.3% 0 0.0% 1 1.3% 4 5.1%
The staff welcomes suggestions from parents
41 51.9% 21 26.6% 9 11.4% 2 2.5% 1 1.3% 5 6.3%
The staff keeps me informed about my child(ren)’s performance
39 49.4% 20 25.3% 9 11.4% 3 3.8% 2 2.5% 6 7.6%
I am comfortable with how the staff handles discipline
34 43.0% 24 30.4% 11 13.9% 3 3.8% 1 1.3% 6 7.6%
I am satisfied with the number of adult staff available to work with the students
41 51.9% 22 27.8% 6 7.6% 0 0.0% 2 2.5% 8 10.1%
I am satisfied with the overall performance of the staff
37 46.8% 28 35.4% 5 6.3% 1 1.3% 1 1.3% 7 8.9%
The staff recognizes my child(ren)’s strengths and weaknesses
40 50.6% 27 34.2% 2 2.5% 3 3.8% 1 1.3% 6 7.6%
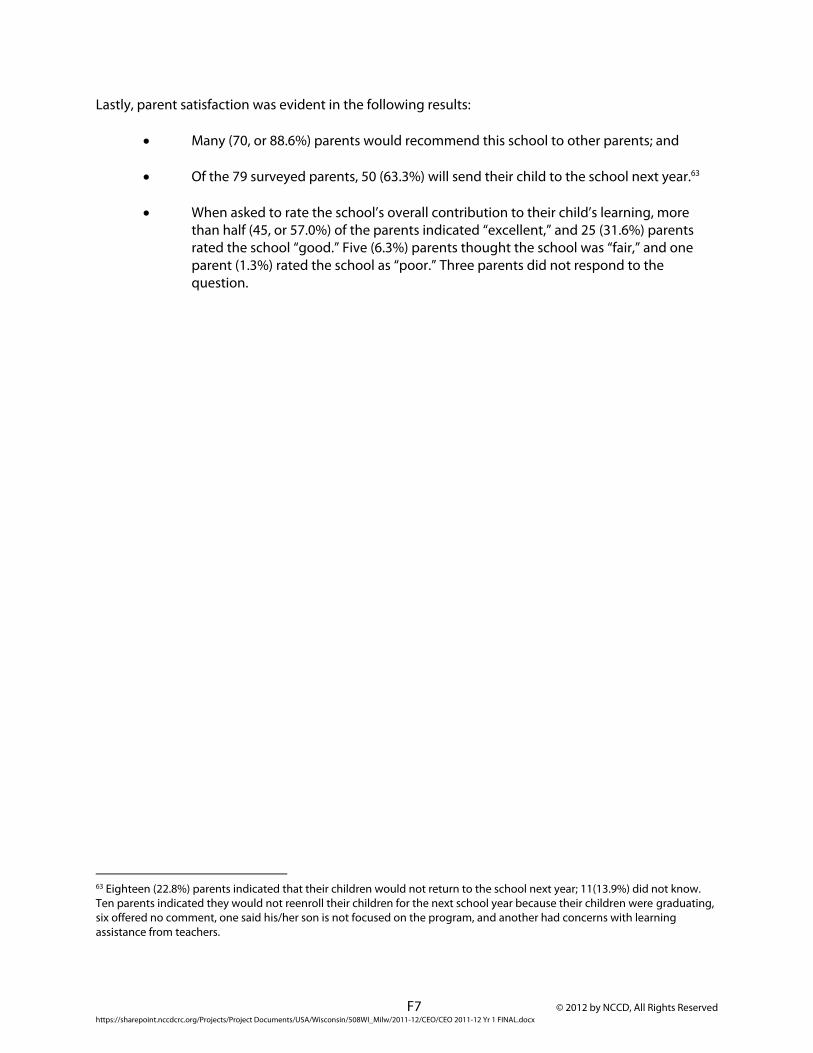
F7 © 2012 by NCCD, All Rights Reserved https://sharepoint.nccdcrc.org/Projects/Project Documents/USA/Wisconsin/508WI_Milw/2011-12/CEO/CEO 2011-12 Yr 1 FINAL.docx
Lastly, parent satisfaction was evident in the following results:
Many (70, or 88.6%) parents would recommend this school to other parents; and Of the 79 surveyed parents, 50 (63.3%) will send their child to the school next year.63 When asked to rate the school’s overall contribution to their child’s learning, more
than half (45, or 57.0%) of the parents indicated “excellent,” and 25 (31.6%) parents rated the school “good.” Five (6.3%) parents thought the school was “fair,” and one parent (1.3%) rated the school as “poor.” Three parents did not respond to the question.
63 Eighteen (22.8%) parents indicated that their children would not return to the school next year; 11(13.9%) did not know. Ten parents indicated they would not reenroll their children for the next school year because their children were graduating, six offered no comment, one said his/her son is not focused on the program, and another had concerns with learning assistance from teachers.

© 2012 by NCCD, All Rights Reserved https://sharepoint.nccdcrc.org/Projects/Project Documents/USA/Wisconsin/508WI_Milw/2011-12/CEO/CEO 2011-12 Yr 1 FINAL.docx
Appendix G
Student Interviews
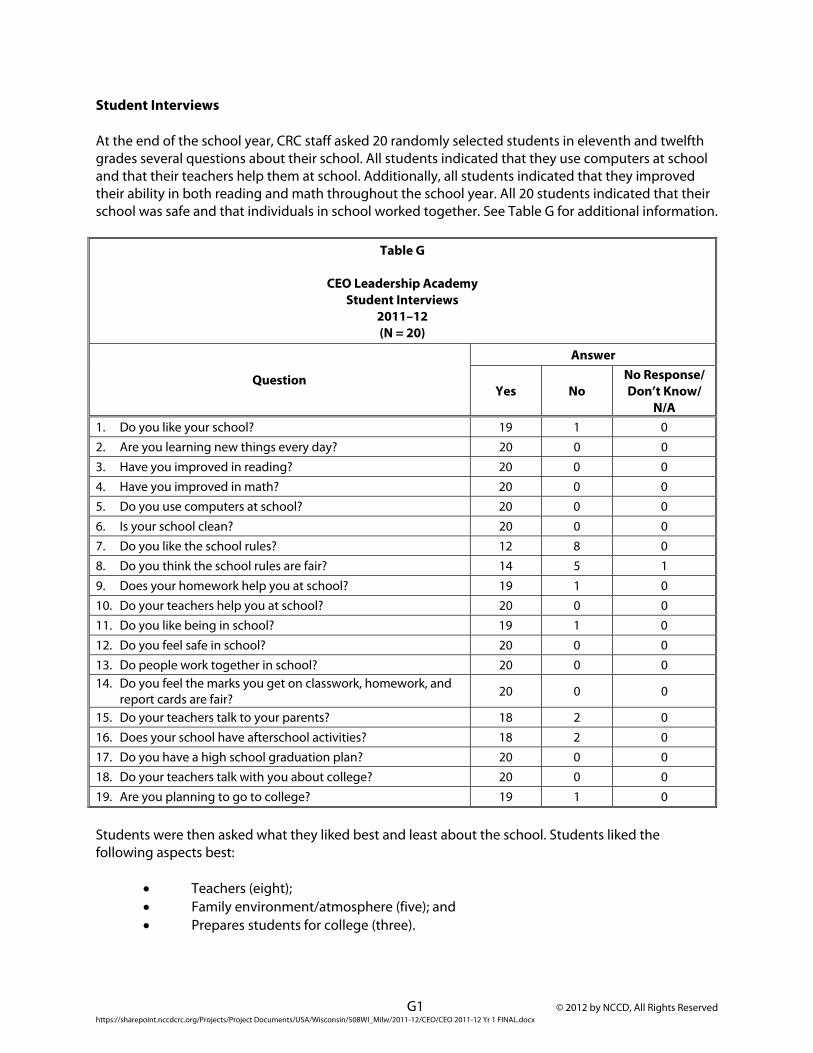
G1 © 2012 by NCCD, All Rights Reserved https://sharepoint.nccdcrc.org/Projects/Project Documents/USA/Wisconsin/508WI_Milw/2011-12/CEO/CEO 2011-12 Yr 1 FINAL.docx
Student Interviews
At the end of the school year, CRC staff asked 20 randomly selected students in eleventh and twelfth grades several questions about their school. All students indicated that they use computers at school and that their teachers help them at school. Additionally, all students indicated that they improved their ability in both reading and math throughout the school year. All 20 students indicated that their school was safe and that individuals in school worked together. See Table G for additional information.
Table G
CEO Leadership Academy
Student Interviews 2011–12 (N = 20)
Question
Answer
Yes No No Response/ Don’t Know/
N/A 1. Do you like your school? 19 1 0 2. Are you learning new things every day? 20 0 0 3. Have you improved in reading? 20 0 0 4. Have you improved in math? 20 0 0 5. Do you use computers at school? 20 0 0 6. Is your school clean? 20 0 0 7. Do you like the school rules? 12 8 0 8. Do you think the school rules are fair? 14 5 1 9. Does your homework help you at school? 19 1 0 10. Do your teachers help you at school? 20 0 0 11. Do you like being in school? 19 1 0 12. Do you feel safe in school? 20 0 0 13. Do people work together in school? 20 0 0 14. Do you feel the marks you get on classwork, homework, and
report cards are fair? 20 0 0
15. Do your teachers talk to your parents? 18 2 0 16. Does your school have afterschool activities? 18 2 0 17. Do you have a high school graduation plan? 20 0 0 18. Do your teachers talk with you about college? 20 0 0 19. Are you planning to go to college? 19 1 0
Students were then asked what they liked best and least about the school. Students liked the following aspects best:
Teachers (eight); Family environment/atmosphere (five); and Prepares students for college (three).
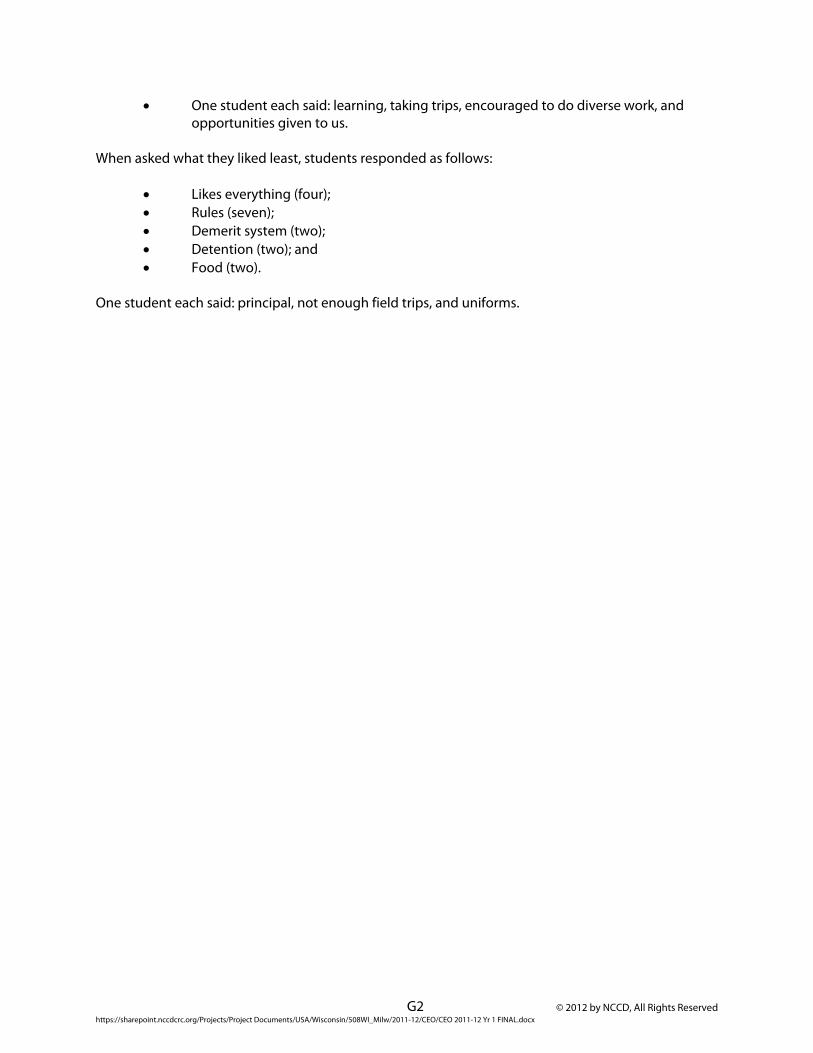
G2 © 2012 by NCCD, All Rights Reserved https://sharepoint.nccdcrc.org/Projects/Project Documents/USA/Wisconsin/508WI_Milw/2011-12/CEO/CEO 2011-12 Yr 1 FINAL.docx
One student each said: learning, taking trips, encouraged to do diverse work, and opportunities given to us.
When asked what they liked least, students responded as follows:
Likes everything (four); Rules (seven); Demerit system (two); Detention (two); and Food (two).
One student each said: principal, not enough field trips, and uniforms.

© 2012 by NCCD, All Rights Reserved https://sharepoint.nccdcrc.org/Projects/Project Documents/USA/Wisconsin/508WI_Milw/2011-12/CEO/CEO 2011-12 Yr 1 FINAL.docx
Appendix H
Board Member Interviews
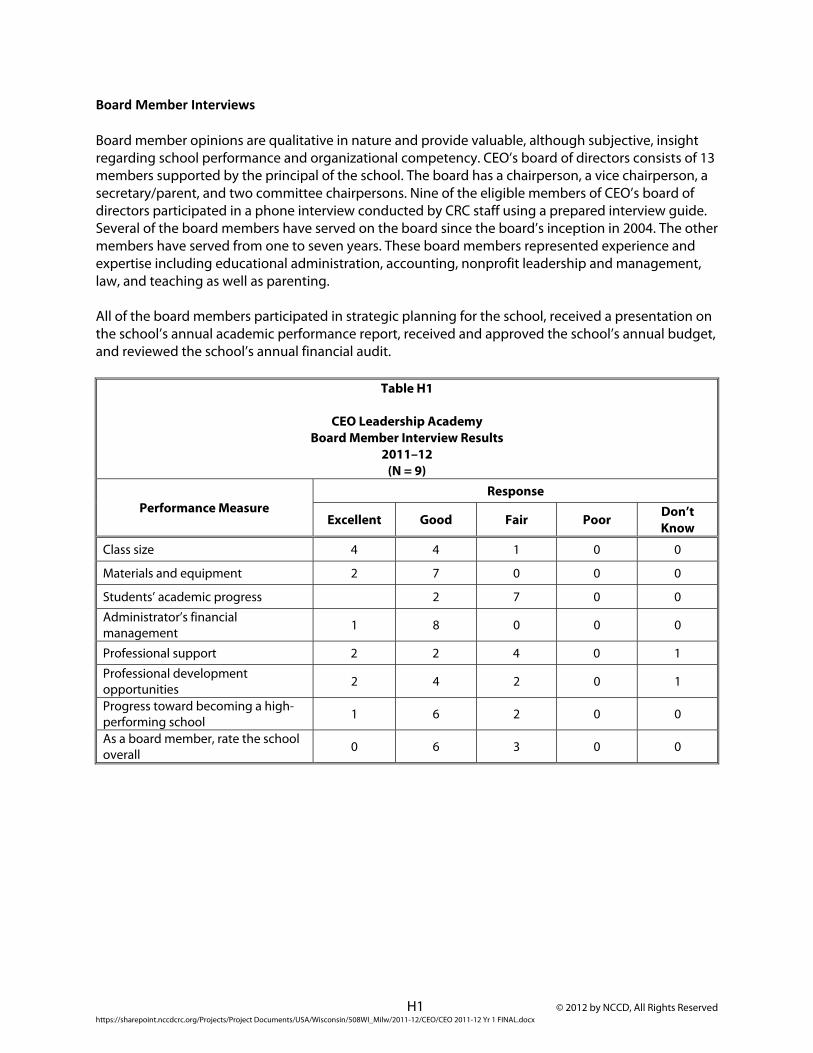
H1 © 2012 by NCCD, All Rights Reserved https://sharepoint.nccdcrc.org/Projects/Project Documents/USA/Wisconsin/508WI_Milw/2011-12/CEO/CEO 2011-12 Yr 1 FINAL.docx
Board Member Interviews Board member opinions are qualitative in nature and provide valuable, although subjective, insight regarding school performance and organizational competency. CEO’s board of directors consists of 13 members supported by the principal of the school. The board has a chairperson, a vice chairperson, a secretary/parent, and two committee chairpersons. Nine of the eligible members of CEO’s board of directors participated in a phone interview conducted by CRC staff using a prepared interview guide. Several of the board members have served on the board since the board’s inception in 2004. The other members have served from one to seven years. These board members represented experience and expertise including educational administration, accounting, nonprofit leadership and management, law, and teaching as well as parenting. All of the board members participated in strategic planning for the school, received a presentation on the school’s annual academic performance report, received and approved the school’s annual budget, and reviewed the school’s annual financial audit.
Table H1
CEO Leadership Academy Board Member Interview Results
2011–12 (N = 9)
Performance Measure Response
Excellent Good Fair Poor Don’t Know
Class size 4 4 1 0 0
Materials and equipment 2 7 0 0 0
Students’ academic progress 2 7 0 0
Administrator’s financial management 1 8 0 0 0
Professional support 2 2 4 0 1
Professional development opportunities 2 4 2 0 1
Progress toward becoming a high-performing school 1 6 2 0 0
As a board member, rate the school overall 0 6 3 0 0
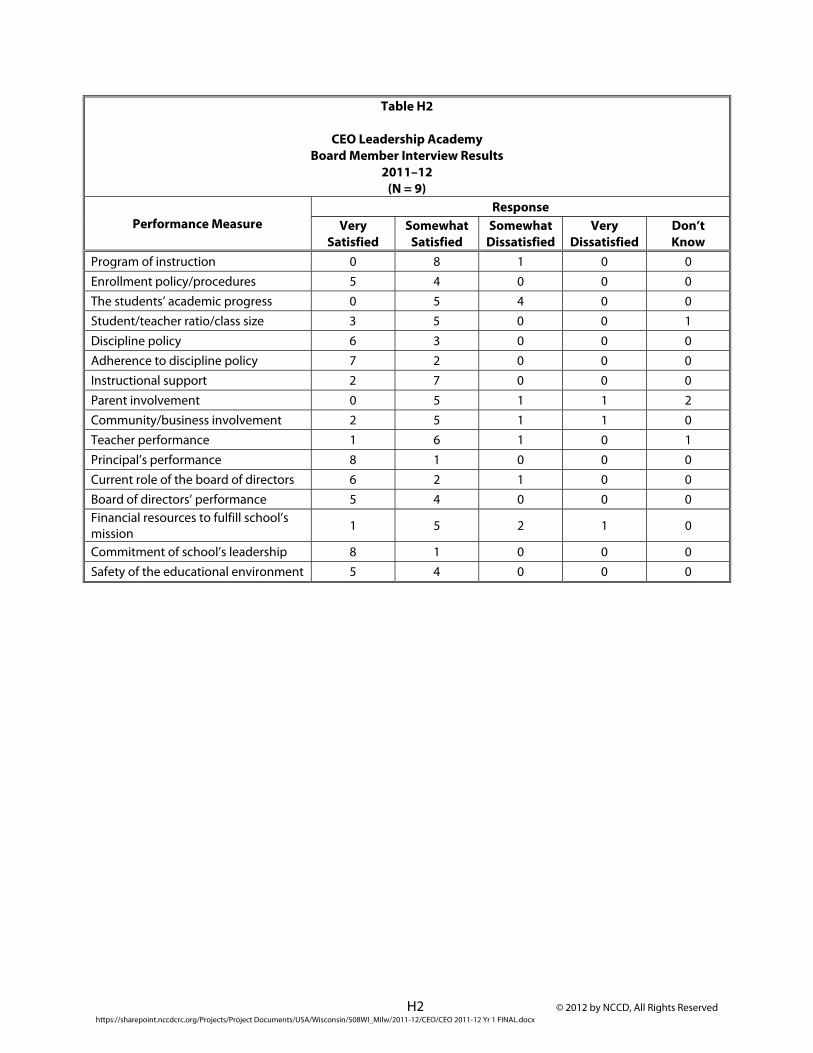
H2 © 2012 by NCCD, All Rights Reserved https://sharepoint.nccdcrc.org/Projects/Project Documents/USA/Wisconsin/508WI_Milw/2011-12/CEO/CEO 2011-12 Yr 1 FINAL.docx
Table H2
CEO Leadership Academy Board Member Interview Results
2011–12 (N = 9)
Performance Measure Response
Very Satisfied
Somewhat Satisfied
Somewhat Dissatisfied
Very Dissatisfied
Don’t Know
Program of instruction 0 8 1 0 0 Enrollment policy/procedures 5 4 0 0 0 The students’ academic progress 0 5 4 0 0 Student/teacher ratio/class size 3 5 0 0 1 Discipline policy 6 3 0 0 0 Adherence to discipline policy 7 2 0 0 0 Instructional support 2 7 0 0 0 Parent involvement 0 5 1 1 2 Community/business involvement 2 5 1 1 0 Teacher performance 1 6 1 0 1 Principal’s performance 8 1 0 0 0 Current role of the board of directors 6 2 1 0 0 Board of directors’ performance 5 4 0 0 0 Financial resources to fulfill school’s mission 1 5 2 1 0
Commitment of school’s leadership 8 1 0 0 0 Safety of the educational environment 5 4 0 0 0
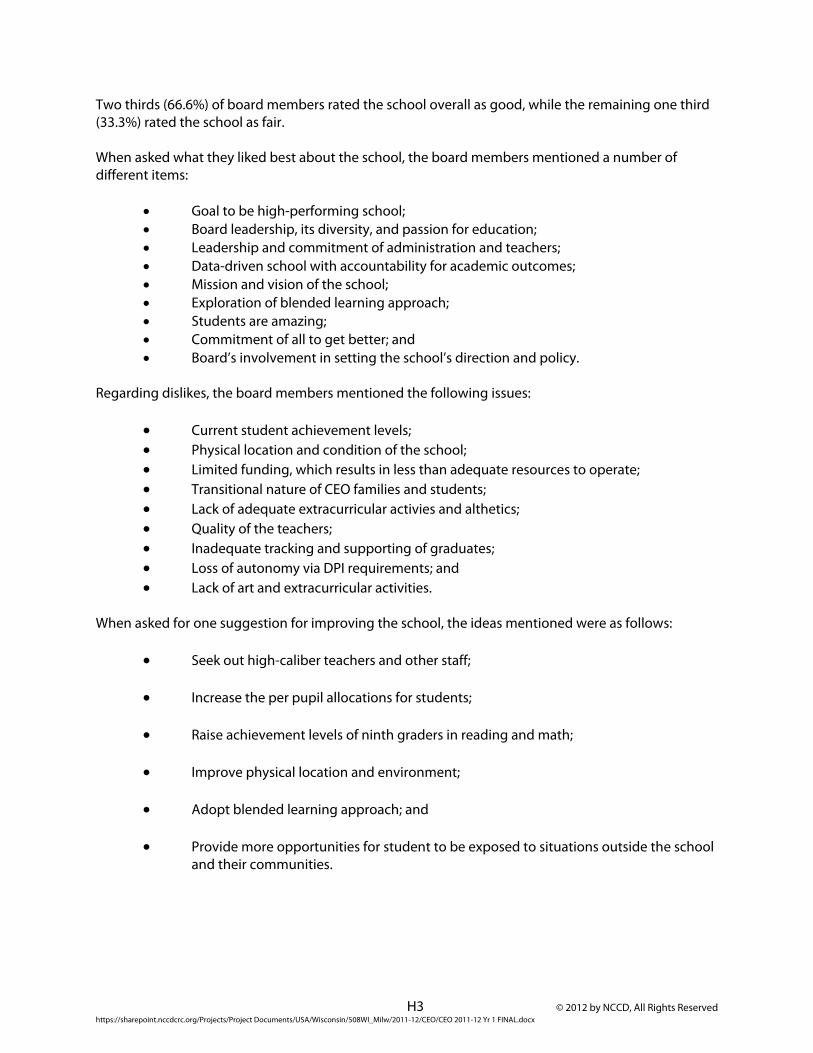
H3 © 2012 by NCCD, All Rights Reserved https://sharepoint.nccdcrc.org/Projects/Project Documents/USA/Wisconsin/508WI_Milw/2011-12/CEO/CEO 2011-12 Yr 1 FINAL.docx
Two thirds (66.6%) of board members rated the school overall as good, while the remaining one third (33.3%) rated the school as fair.
When asked what they liked best about the school, the board members mentioned a number of different items:
Goal to be high-performing school; Board leadership, its diversity, and passion for education; Leadership and commitment of administration and teachers; Data-driven school with accountability for academic outcomes; Mission and vision of the school; Exploration of blended learning approach; Students are amazing; Commitment of all to get better; and Board’s involvement in setting the school’s direction and policy.
Regarding dislikes, the board members mentioned the following issues:
Current student achievement levels; Physical location and condition of the school; Limited funding, which results in less than adequate resources to operate; Transitional nature of CEO families and students; Lack of adequate extracurricular activies and althetics; Quality of the teachers; Inadequate tracking and supporting of graduates; Loss of autonomy via DPI requirements; and Lack of art and extracurricular activities.
When asked for one suggestion for improving the school, the ideas mentioned were as follows: Seek out high-caliber teachers and other staff;
Increase the per pupil allocations for students;
Raise achievement levels of ninth graders in reading and math;
Improve physical location and environment;
Adopt blended learning approach; and
Provide more opportunities for student to be exposed to situations outside the school
and their communities.