Embed Size (px)
Citation preview
.,.
LO ~
co M ~
LO ,;
~
.,;
,-,~ --.-- -;; ~ -~-I -I - ~ I T - ~ ,
- .. .. - -- ---~- .. I'" ... ,- "
,- -. ~. __ -0 ~
-Ill. - ~; .i
If you have issues viewing or accessing this file contact us at NCJRS.gov.
U.S. Department of Justice National Institute of Justice
151385
This document has been reproduced exactly as received from the person or organization originating it. Points of view or opinions stated in this document are those of the authors and do not necessarily represent the official position or policies of the National Institute of .Iustice.
Permission to reproduce this copyrighted material has been granted b~ Calitornia Department of Justice
to the National Criminal Justice Reference Service (NCJRS).
Further reproduction outside of the NCJRS system requires permission of the copyright owner.
Crime and Delinquency in California, 1993
California Department of Justice Daniel E. Lungren, Attorney General Division of Law Enforcement Office of Management, Evaluation and Training
4
~ I
1/
I '
III
1111
CRIME AND DELINQUENCY IN CALIFORNIA, 1993
ii
The role of the Law Enforcement Information Center is:
.. To collect, analyze, and report statistical data, which provide valid measures of crime and the criminal justice process;
• To examine these data on an ongoing basis to better describe crime and the criminal justice system;
• To promote the responsible presentation and use of crime statistics.
OFFICE OF MANt.G~MENT, EVALUATION AND TRAINING
James M. Watson, Chief Mike Acosta, Assistant Chief
STATISTICAL ANALYSIS CENTER
Quint Hegner ................................................................... Program Manager Dorothy Tuma ................................................................... Section Manager
Rebecca Bowe ...................................................... Senior Graphic Artist Ron Lai ............................................. Design and Publication Consultant Linda Nance .................................................... Publication Coordinator,
Crimes, Adult Felony Arrest Dispositions, Expenditures and Personnel Sections
Ted Olsen .................................................................................... Editor Donnette Orsi .................................................... Composing Technician Charlotte Rhea ............................................................ Special Requests Adele Spears ................................. Arrests, Adult Corrections Sections
STATISTICAL DATA CENTER
Raymond R. Griego ........................................................ Program Manager Charles Watkins ................................................................ Section Manager
Josie Allen ............................ Domestic Violence, Homicide Data Bases Jennie Barton ................................ Uniform Crime Reporting Data Base Karen Hardy .......................................... l2ltizens' Complaints Data Base Ann Kelly .................... Monthly Arrest and Citation Register Data Base Roy V. Lewis ...................................... . .. Research Program Specialist Del McGuire ...................................... Adult Probation, Jails and Camps,
Law Enforcement Personnel Data Bases Myrna Naughton ...................... Adult Criminal Justice Statistical System Teresa Vaccaro .............................................. Statute Code Coordinator
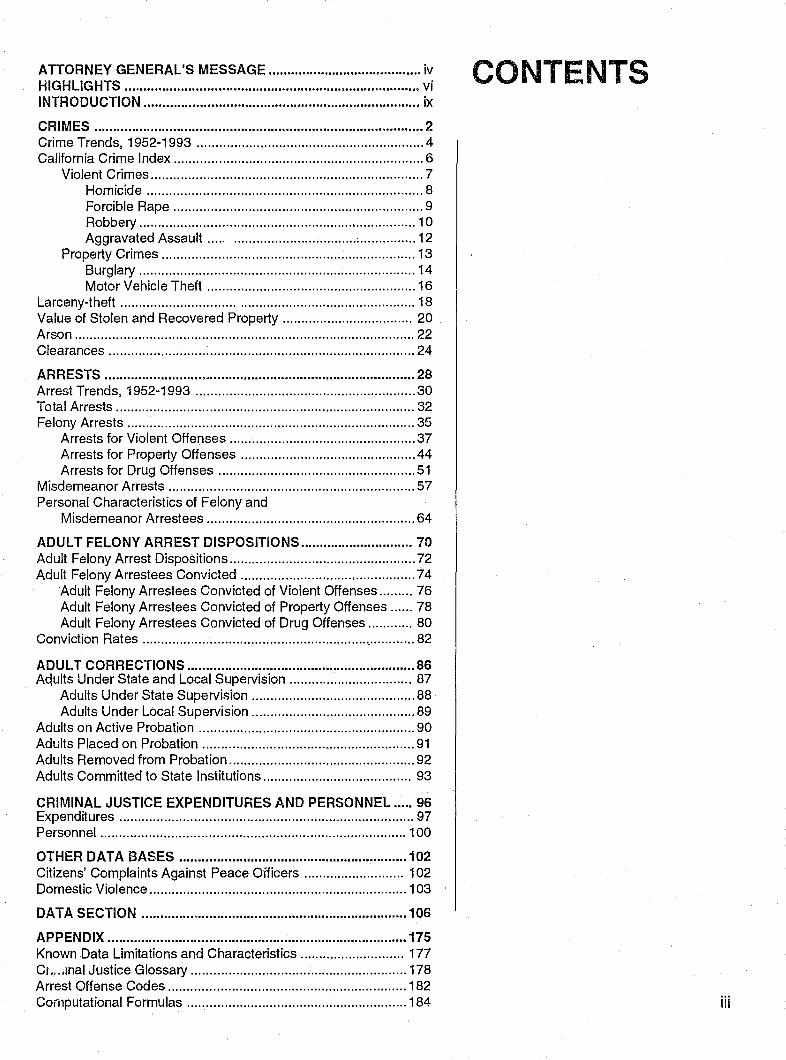
ATTORNEY GENERAL'S MESSAGE ......................................... iv HIGHLIGHTS ............................................................................... vi CONTENTS INTRODUCTION .......................................................................... ix
CRIMES ........................................................................................ 2 Crime Trends, 1952-1993 ............................................................. 4 California Crime Index ................................................................... 6
Violent Crimes ......................................................................... 7 Homicide .......................................................................... 8 Forcible Rape ................................................................... 9 Robbery .......................................................................... 10 Aggravated Assault ....................................... , ............... 12
Property Crimes .................................................................... 13 Burglary .......................................................................... 14 Motor Vehicle Theft ........................................................ 16
Larceny-theft .............................................................................. 18 Value of Stolen and Recovered Property ................................... 20 Arson ........................................................................................... 22 Clearances .................................................................................. 24
ARRESTS ................................................................................... 28 Arrest Trends, 1952-1993 ........................................................... 30 Total Arrests ................................................................................ 32 Felony Arrests ............................................................................. 35
Arrests for Violent Offenses .................................................. 37 Arrests for Property Offenses ............................................... 44 Arrests for Drug Offenses ..................................................... 51
Misdemeanor Arrests .................................................................. 57 Personal Characteristics of Felony and
Misdemeanor Arrestees ........................................................ 64
ADULT FELONY ARREST DiSPOSiTIONS .............................. 70 Adult Felony Arrest Dispositions .................................................. 72 Adult Felony Arrestees Convicted ............................................... 74
Adult Felony Arrestees Convicted of Violent Offenses ......... 76 Adult Felony Arrestees Convicted of Property Offenses ...... 78 Adult Felony Arrestees Convicted of Drug Offenses ............ 80
Conviction Rates .......................................................................... 82
ADULT CORRECTIONS ............................................................. 86 Adults Under State and Local Supervision ................................. 87
Adults Under State Supervision ............................................ 88 Adults Under Local Supervision ............................................ 89
Adults on Active Probation .......................................................... 90 Adults Placed on Probation ......................................................... 91 Adults Removed from Probation .................................................. 92 Adults Committed to State Institutions ........................................ 93
CRIMINAL JUSTICE EXPENDITURES AND PERSONNEL ..... 96 Expenditures ............................................................................... 97 Personnel .................................................................................. 100
OTHER DATA BASES ............................................................. 102 Citizens' Complaints Against Peace Officers ........................... 102 Domestic Violence ..................................................................... 1 03
DATA SECTION ....................................................................... 106
APPENDIX ................................................................................ 175 Known Data Limitations and Characteristics ............................ 177 Ct .... mal Justice Glossary .......................................................... 178 Arrest Offense Codes ................................................................ 182 Computational Formulas ........................................................... 184 iii
iv
AT1·ORNEY GENERALIS MESSAGE g • ~
The crime statistics for 1993 show some very encouraging signs. For the first time since 1987, a 4.1 percent decrease in the violent crime rate is noted. Along with a 3.3 percent decrease in property offenses there was an overall decrease of 3.5 percent in the California Index Crimes. Some progress in the war against crime is evident.
There is still cause for concern, however, because the most serious crime in the index, homicide, increased 3.2 percent in rate. The gang problem in California is still out of control and random violence is a concern of all. And even though rates are generally down, there is still a very large number of criminal events occurring. We should never forget that each of these events translates to a victim wllo has lost life or property or who has been physically injured. Whether victims or relatives, all have been emotionally injured.
Law enforcement's response to crime, as measured by arrest statistics, also shows decreases this year. The rate of arrests for all offenses decreased by 4.4 percent for 1993 over 1992. Total felony arrests decreased by 1.5 percent but arrests for dangerous drugs continued an increase begun in 1991. This indicates that violence as a result of drug problems is still ruling some neighborhoods. Perhaps the most disturbing development is reflected in the continuing increase in the number of juvenile arrests.
DANIEL E. LUNGREN Attorney General
Misdemeanor arrests decreased by 6 percent. During the past few years, government agencies in California, including law enforcement, have been faced with declining budgets. Some of the impact of these declining resources has resulted in the redirection of efforts and in declines in arrests for less serious offenses.
While the arrest rates are down slightly, the proportion of complaints filed has been increasing. The efforts of the district attorneys and the courts in response to "get tough" legislation are resulting in growing proportions of convictions and incarcerations for those who are arrested.
While there is hope in this year's statistical counts, it remains a mandate that state and local governments' and the criminal justice system's number one priority must be to protect Californians against criminal predators. California has repeatedly led the way in developing innovative ways to cope with issues and problems. We must continue this tradition so that all California residents can feel secure once again.
v
HIGHLIGHTS
vi
• From 1952 to 1980 the California Crime Index (CCl) rate increased 336.7 percent (from 898.1 to 3,922.1). After a peak in 1980, the rate decreased 14.1 percent to 3,367.8 in 1993.
II The CCl rate decreased 3.5 percent from 1992 to 1993.
• From 1992 to 1993 violent crimes - homicide, forcible rape, robbery, and aggravated assault - decreased 4.1 percent in rate. Property crimes - burglary and motor vehicle theft - decreased 3.3 percent in rate.
• From 1960 to 1993 the felony arrest rate almost doubled (from 1,170.0 to 2,319.0). The misdemeanor arrest rate of 4,434.6 per 100,000 population at risk is the lowest for the period.
• From 1992 to 1993 there was a 4.4 percent decrease in the total arrest rate.
'I
HIGHLIGHTS
• From 1988 to 1993 the rate of juvenile arrests for violent offenses increased 39.5 percent.
• In 1993, seven out often adult felony arrest dispositions resulted in a conviction.
• The proportion of convictions in which sentences to state institutions were given increased from 17.5 percent in 1988 to 26.1 percent in 1993.
• Since 1988, the rate of adults under state supervision has increased 44.5 percent (from, 692.0 to 999. 7).
vii
INTRODUCTION
Crime and Delinquency in California presents statistics showing the amounts and types of offenses known to public authorities and the administrative actions taken by the criminal justice system. For over 40 years, Crime and Delinquency in California has provided information on crimes and the criminal justice process. The collection and publication of these data are mandated by California Penal Code Sections 13010-13012.
NOTES
• Crime and arrest rates are calculated using annual population estimates provided by the Demographic Research Unit, California Department of Finance. Intercensal population data are revised after each decennial census. Upon receipt of the intercensal revisions, cr;me and arrest rates are recalculated.
• In prior years, the annual Crime and Delinquency in California publication included a Juvenile Justice System section. Budgetary constraints in 1990 required elimination of funds necessary to continue the collection of information from county probation departm~nts on juvenile justice dispositions and caseload data. Information on juvenile arrests is included in the Arrests section of this report. Disposition data prior to 1990 are available upon request.
• Historical data have been added to this Crime and Delinquency report to provide long-term trend data. The time periods for which data are available vary from data base to data base depending upon the date each program was instituted.
Crime data from the Uniform Crime Reporting Program have been published continuously for over 40 years and are available in a somewhat consistent form from 1952.
Arrest data from the Monthly Arrest and Citation Register reporting system are complete from 1957. Prior to 1957, only adult felony arrest data were available.
Disposition data from the Offender-Based Transaction Statistics (OBTS) system are available from 1975. The OBTS system, which began with a 25 percent sample in four counties in 1973, became operational statewide in 1975. All 58 counties were reporting by 1978.
Adult corrections data are compiled from a number of sources and are complete from 1966. State supervision data are available from 1960 and state institution data are available from 1952.
Expenditure data, as published in previous Crime and Delinquency publications, are available from the 1967/68 fiscal year while personnel data are available from 1969.
Since 1952 there have been many changes in laws and data collection procedures. These changes should be considered when comparing data for extended periods.
ix
, ,
"
.... --~~. --- -
. T' -- ---......._"- ----- -.
• • •
CRIMES WHAT IS A CRIME?
A crime is an act specifically prohibited by law, or failure to perform an act specifically required by law, for which punishment is prescribed.
• Felonies are serious crimes for which the offender can be sentenced to state prison.
II Misdemeanors are less serious crimes for which an offender can be sentenced to probation, jail, fine, or a combination of these.
• Infractions are the least serious crimes and are usually punishable by a fine.
HOW ARE CRIMES COUNTED?
There are two methods used as indicators of the scope of crime and its fluctuations: victimization studies and the Uniform Crime Reporting (UCR) Program.
Victimization Studies have been conducted regularly by the federal government since 1972. The method is similar to public polling, in which a representative sample of households and commercial organizations is selected and their occupants interviewed to determine the crimes which have been committed against them and/or their premises. The amount of crime is determined by the responses of the representative sample, expressed in percentages of the entire population.
The Uniform Crime Reporting (UCR) Program was inaugurated in 1930 and is administered on the national level by the Federal Bureau of Investigation (FBI). It provides criminal statistics for use in law enforcement administration, operation, and management. In California, this program is administered.by the Department of Justice (DOJ).
As part of the UCR Program, law enforcement agencies throughout the state report summary information to DOJ on "selected" crimes. Reported crimes are classified by UCR definitions designed to eliminate differences among the various states' penal code definitions of crimes. This information is not only incorporated in this Crime and Oelinquency report; it is processed and forwarded to the FBI for use in its annual publication, Crime in the United States.
The crimes, selected because of their seriousness, frequency of occurrence, and likelihood of being reported to the police, are: homicide, forcible rape, robbery, aggravated assault, burglary, larceny-theft, motor vehicle theft, and arson. Except for larceny-theft, UCR does not count misdemeanors and infractions.
DOJ differs slightly from the FBI in presentation of crime data. The California Crime Index (CCI) comprise~ homicide, forcible rape, robbery, aggravated assault, burglary, and motor vehicle theft. When a 1983 law raised the lower limit of felony theft from $200 to over $400, DOJ dropped theft ($200 and over) from its measure of crime. Law enforcement agencies began submitting arson crime data in 1979; 1980 was the first year of complete reporting. Therefore, to maintain long-term felony trend data in the CCI, DOJ excludes larceny-theft and arson.
WHAT IS A RATE?
A rate describes the number of events that occur within a given population. Crime rates and clearance rates are used in this section. Formulas for calculating both can be found in the Appendix.
WHY IS CRIME UNDERREPORTED?
As mentioned, the UCR Program accounts for Index crimes only; however, some Index crimes go undetected and therefore unreported.
Another reason for underreporting crime is the hierarchy rule. Most crimes occur singly as opposed to more than one crime being committed within the same incident. However, if several crimes are committed at the same time, only one is reported. For example, if a person were to enter a bar, rob eight patrons, and kill the bartender, only the homicide would be reported.
2 CRIME & DELINQUENCY. 1993
CRIMES The hierarchy rule assigns a value to each crime and requires that only the single most serious offense be reported. Arson is the exception. Since arson frequently occurs in conjunction with other crimes, it is felt that valuable information could be lost using the hierarchy rule.
The system collects information in summary form which shows one count for each crime reported. No distinction can be made as to the range of seriousness that can be present in most crimes.
CAN JURISDICTIONAL COMPARISONS BE MADE?
A number of factors can influence crime counts in p;~rticular jurisdictions. These factors should be considered when using crime statistics, especially for comparative purposes.
.. Variations in composition of the population, particularly age structure.
.. Population density and size of locality and its aurrounding area. • Stability of population with respect to residents' mobility, commuting patterns, and transient factors. • Modes of transportation and highway system. rJ Economic conditions, including median income and job availability. .. Cultural conditions, such as education, recreation, and religious characteristics. .. Family conditions with respect to divorce and family cohesiveness. .. Effective sirength of law enforcement agencies. .. Administrative and investigative emphases of law enforcement. .. Policies of other components of the criminal justice system (I.e., prosecutorial, judicial, correctional, and probational). III Attitudes of citizenry toward crime. III Crime reporting practices of citizenry.
WHAT IS THE VALUE OFTHE UCR PROGRAM?
Since its inception in 1930, UCR has become a nationwide program. All California law enforcement agencies participate. Quality control surveys conducted by DOJ staff have shown a high level of compliance with UCR reporting standards. The number of participants and the amount and quality of data collected under the stringent rules of the system make UCR a valuable program.
In 1982, the federal Bureau of Justice Statistics and the FBI initiated a joint study of the national UCR Program. The study was completed in 1985 with a recommendation to develop an Incident-Based Reporting (IBR) system. This system would focus on individual criminal incidents rather than the summary information in the eXisting UCR Program.
Under an IBR system, law enforcement agencies would submit a separate record on each criminal incident, along with information on the victim(s), suspect(s), and arrestee(s) involved. An IBR system would provide data that more accurately measure the total number of crimes occurring in society, the severity of those crimes, and profile the victims of those crimes.
The FBI began the implementation phase of IBR in 1986. South Carolina was selected as a test site and data collection started early in 1987. Based on experience gained in the project, the FBI developed and released final guidelines for the national system in August 1988. The national system is now designated the National Incident-Based Reporting System (NIBRS).
In April 1987, limited federal grant funds were made available to state UCR programs. California used these funds to evaluate the feasibility of converting to an IBR system. When state funding is available, California will begin developing an IBR system that will more accurately portray crime and delinquency in California.
WHAT DOES IT ALL MEAN?
Crime is not an easy thing to measure. In California, however, because of the high quality of its law enforcement agencies and their close cooperation with DOJ, UCR data are, and have been for many years, an extremely good indicator of the extent of and fluctuation in crimes reported to law enforcement.
CRIMES 3
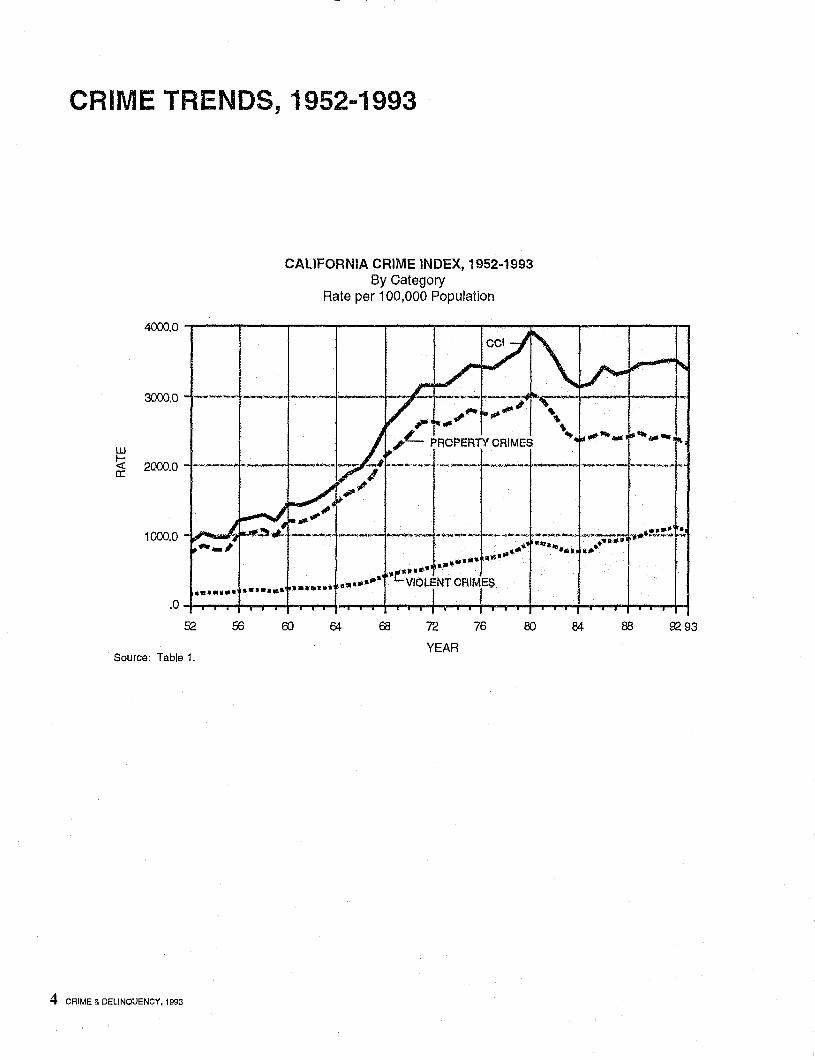
CRIME TRENDS, 1952-1993
CALIFORNIA CRIME INDEX, 1952-1993 By Category
Rate per 100,000 Population
~.O ~----T-----~--~----~----~----~----~--~------~----~
3000.0
w ~ 000 0: 2 .0
10CXl.O -. .. .--.......
-----l--~I---I!___,~-
... ~ ... " . . ....... ..... JIIl. ~ •
.............•...... , .......... VIOLENT CRIMES
52 56 EO 64 68 72 76 80
YEAR Source: Table 1.
4 CAIME & DELINQUENCY, 1993
84 88 9293
CRIME TRENDS, 1952-1993
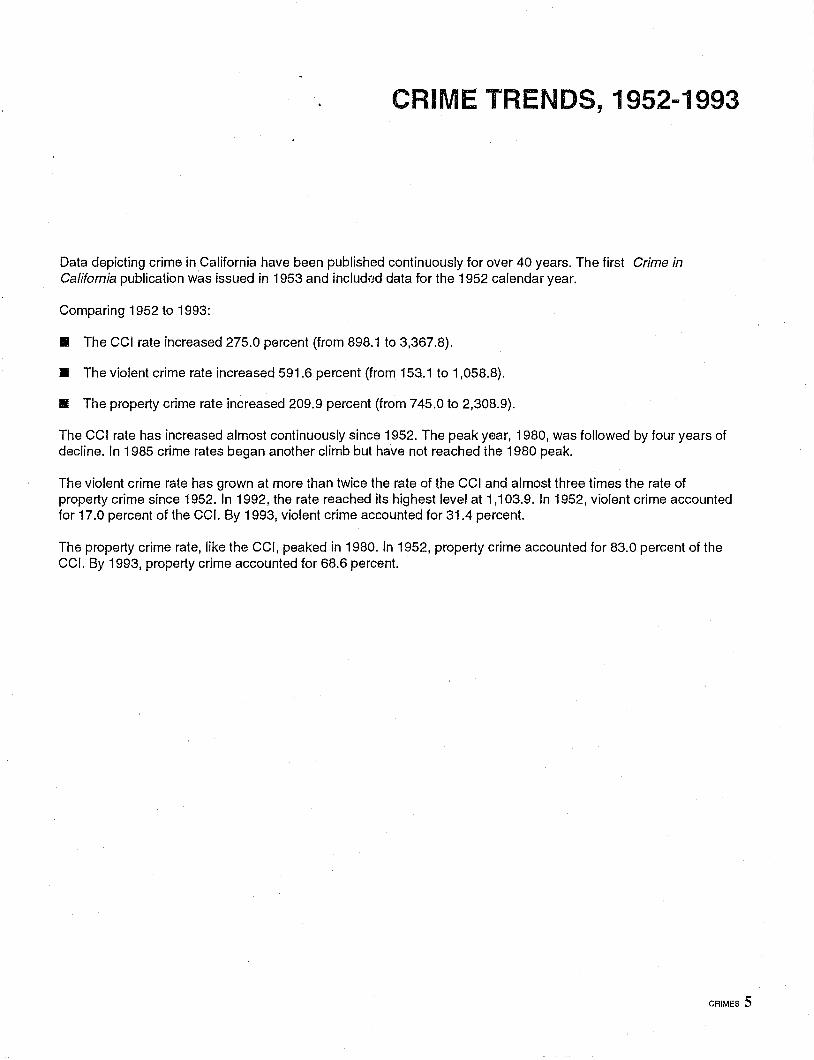
Data depicting crime in California have been published continuously for over 40 years. The first Crime in California publication was issued in 1953 and includ(:d data for the 1952 calendar year.
Comparing 1952 to 1993:
• The CCI rate increased 275.0 percent (from 898.1 to 3,367.8).
• The violent crime rate increased 591.6 percent (from 153.1 to 1,058.8).
• The property crime rate increased 209.9 percent (from 745.0 to 2,308.9).
The CCI rate has increased almost continuously since 1952. The peak year, 1980, was followed by four years of decline. In 1985 crime rates began another climb but have not reached the 1980 peak.
The violent crime rate has grown at more than twice the rate of the CCI and almost three times the rate of property crime since 1952. In 1992, the rate reached its highest level at 1,103.9. In 1952, violent crime accounted for 17.0 percent of the CCI. By 1993, violent crime accounted for 31.4 percent.
The property crime rate, like the CCI, peaked in 1980. In 1952, property crime accounted for 83.0 percent of the CCI. By 1993, property crime accounted for 68.6 percent.
CRIMES 5
California Crime Index
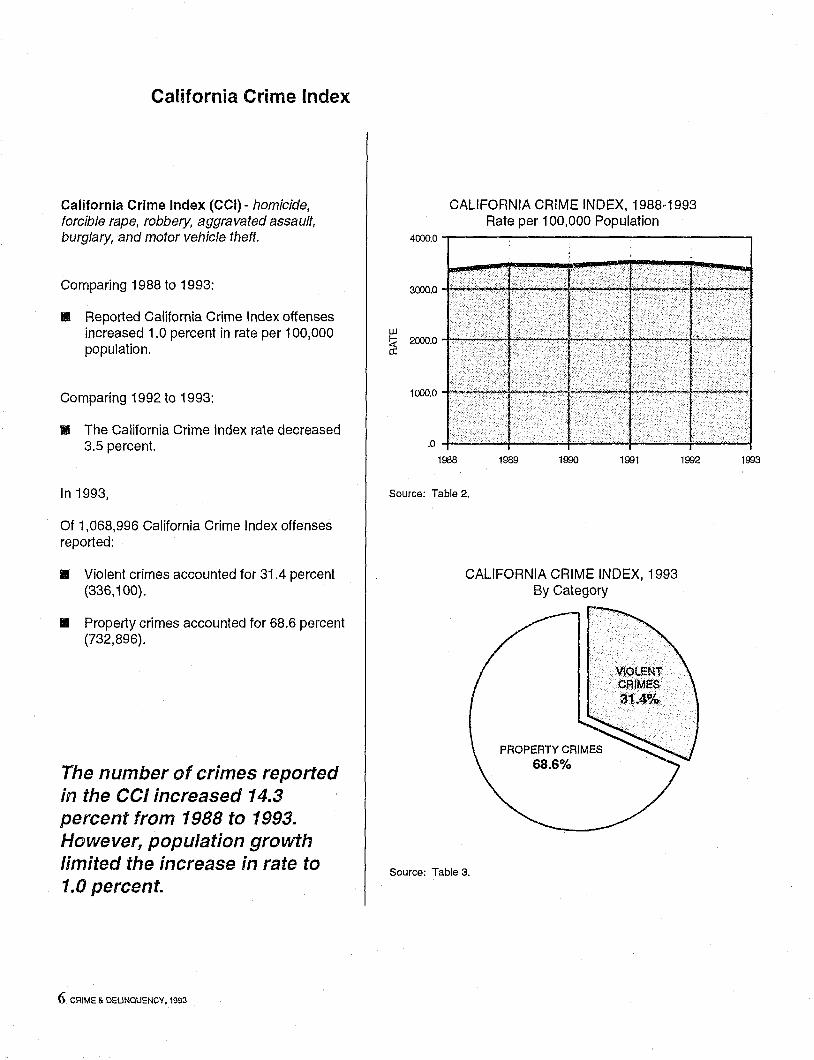
California Crime Index (CCI) - homicide, forcible rape, robbery, aggravated assault, burglary, and motor vehicle theft.
Comparing 1988 to 1993:
• Reported California Crime Index offenses increased 1.0 percent in rate per 100,000 population.
Comparing 1992 to 1993:
.. The California Crime Index rate decreased 3.5 percent.
In 1993,
Of 1,068,996 California Crime Index offenses reported:
.. Violent crimes accounted for 31.4 percent (336,100).
.. Property crimes accounted for 68.6 percent (732,896).
The number of crimes reported in the CCI increased 14.3 percent from 1988 to 1993. However, population growth limited the increase in rate to 1.0 percent.
6 CRIME &. DELINQUENCY. 1993
CALIFORNIA CRIME INDEX, 1988-1993 Rate per 100,000 Population
4000.0 "'T-"---------~-----__,
3000.0
UJ ~ 2000.0 +-"-~""'-_+_·......., ........ .,;..ry-....... ·-1.;.;.........,-~}_"_<· a:
.0 +------~_+ ......... -....;.f----~~+_---~+-..;.......__{ 1988 1989 1990 1991
Source: Table 2.
CALIFORNIA CRIME INDEX, 1993 By Category
Source: Table 3.
PROPERTY CRIMES
68.6%
1992 1993
W I.:( a:
VIOLENT CRIMES, 1988-1993 Rate per 100,000 Population
1200.0 -.------------------,
-
600.0 ------- ~_J 1---- ----
300" ---+----r I -t---1--I I I
·°4----~------+_----_r----~Ir_----~ 1988 1989 1990 1991 1992 1993
Source: Table 2.
Source: Table 3.
VIOLENT CRIMES, 1993 By Crime
HOMICIDE
1.2%
AGGRAVATED ASSAULT
57.7%
Violent Crimes
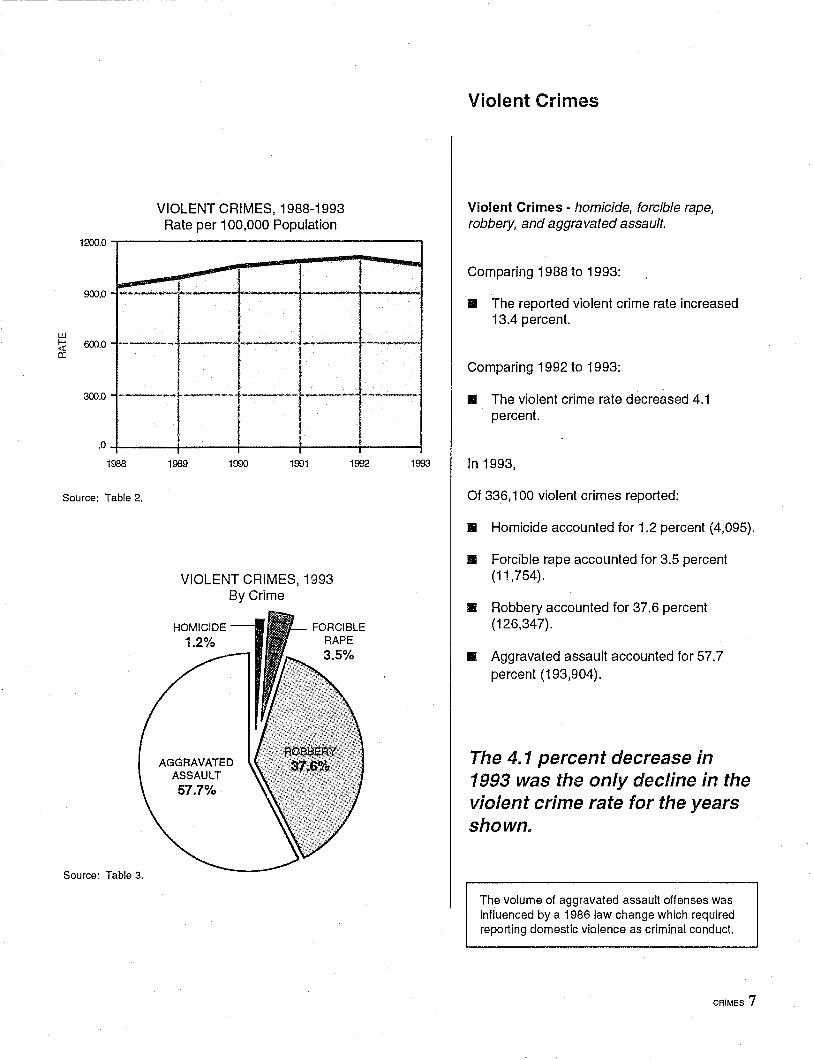
Violent Crimes - homicide, forcible rape, robbery, and aggravated assault.
Comparing 1988 to 1993:
.. The reported violent crime rate increased 13.4 percent.
Comparing 1992 to 1993:
.. The violent crime rate decreased 4.1 percent.
In 1993,
Of 336,100 violent crimes reported:
.. Homicide accounted for 1.2 percent (4,095).
II Forcible rape accounted for 3.5 percent (1 i ,754).
.. Robbery accounted for 37.6 percent (126,347).
.. Aggravated assault accounted for 57.7 percent (193,904).
The 4. 1 percent decrease in 1993 was the only decline in the violent crime rate for the years shown.
The volume of aggravated assault offenses was influenced by a 1986 law change which required reporting domestic violence as criminal conduct.
CRIMES 7
Homicide
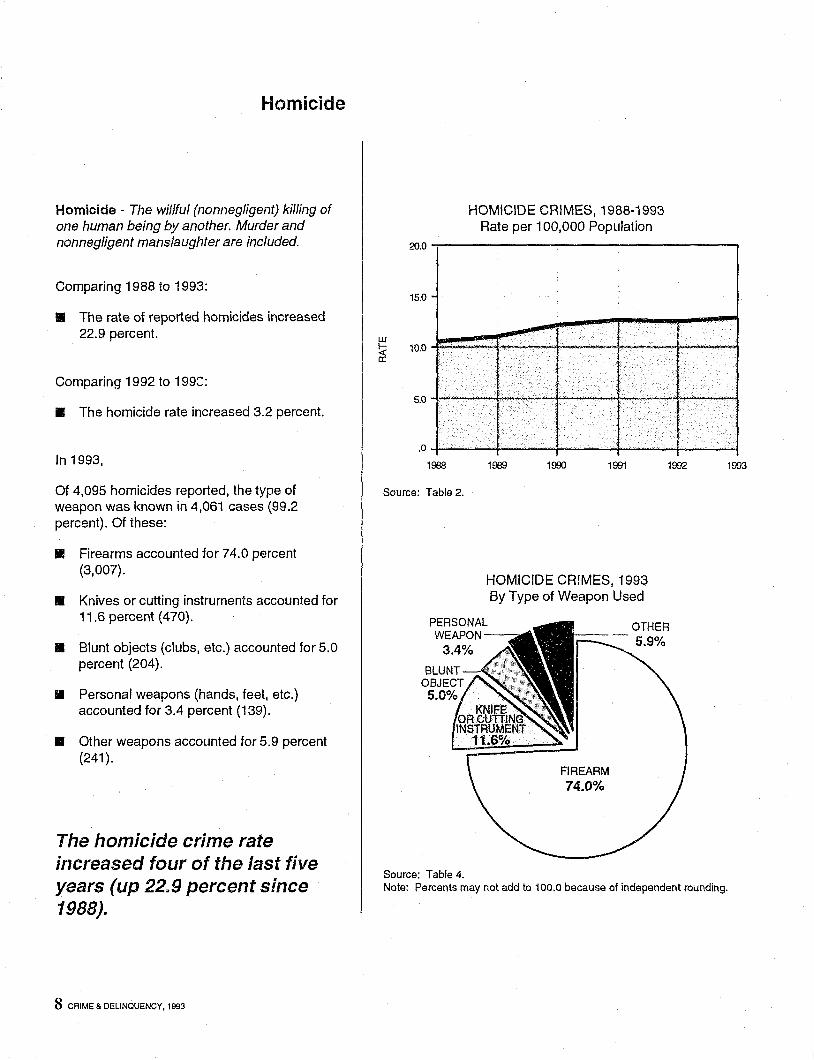
Homicide - The willful (nonneg/igent) killing of one human being by another. Murder and nonnegligenf manslaughter are included.
Comparing 1988 to 1993:
• The rate of reported homicides increased 22.9 percent.
Comparing 1992 to 199::::
• The homicide rate increased 3.2 percent.
In 1993,
Of 4,095 homicides reported, the type of weapon was known in 4,061 cases (99.2 percent). Of these:
III Firearms accounted for 74.0 percent (3,007).
• Knives or cutting instruments accounted for 11.6 percent (470).
• Blunt objects (clubs, etc.) accounted for 5.0 percent (204).
II Personal weapons (hands, feet. etc.) accounted for 3.4 percent (139).
• Other weapons accounted for 5.9 percent (241).
The homicide crime rate increased four of the last five years (up 22.9 percent since 1988).
8 CRIME & DELINQUENCY, 1993
HOMICIDE CRIMES, 1988-1993 Rate per 100,000 Population
20.0....--------------------,
15.0
10.0 1~~::l~:::::r::JI=::I=:J
..
. O~--~~------~----~------4_----~ 1968
Source: Table 2.
Source: Table 4.
1989 1990 1991
HOMICIDE CRIMES, 1993 By Type of Weapon Used
FIREARM 74.0%
1992
Note: Percents may not add to 100.0 because of independent rounding.
1993
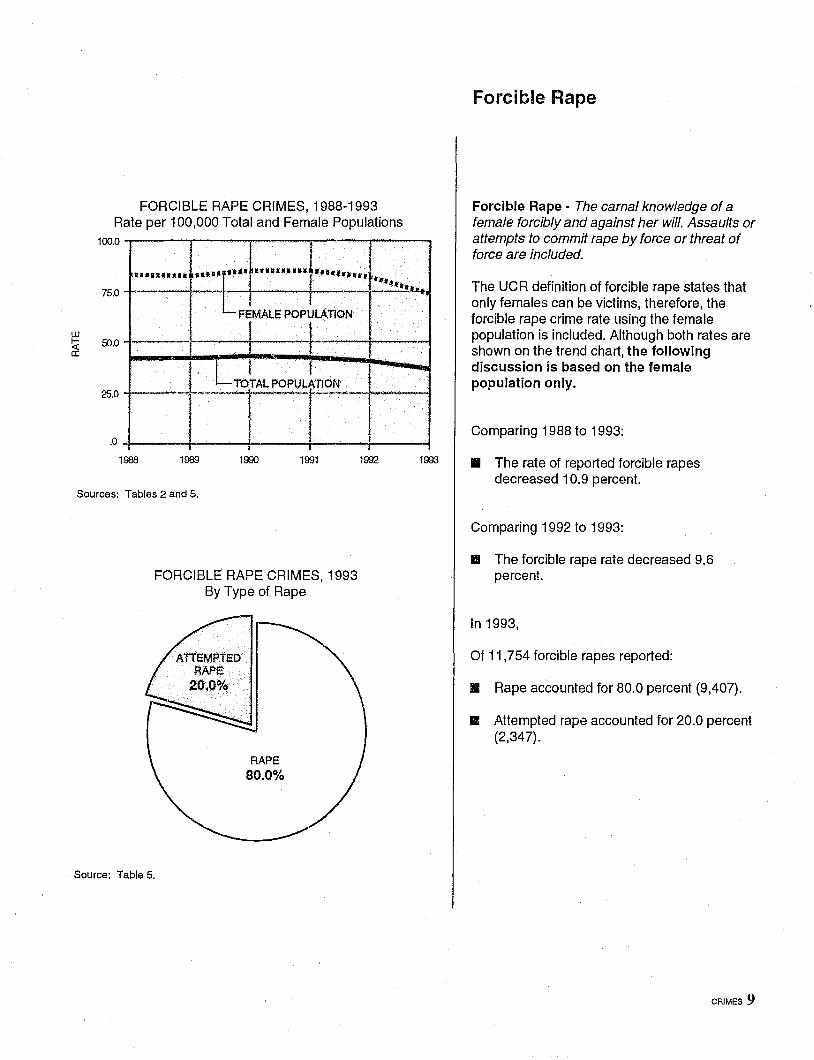
FORCIBLE RAPE CRIMES, 1988-1993 Rate per 100,000 Total and Female Populations
100.0
.......... 75.0
.. · .. E..l .......... L ....... 1 __ . - I I ...... ht-. ~ I ......
I t FEMALE POPULATION
UJ I;;: 50.0 - I a:
I· LTO~AL POPULATION - -- r--I I
25.0
.0
1988 1989 1990 1991 1992
Sources: Tables 2 and 5.
Source: Table 5.
FORCIBLE RAPE CRIMES, 1993 By Type of Rape
-
1993
Forcible Rape
Forcible Rape - The carnal knowledge of a female forcibly and against her will. Assaults or attempts to commit rape by force or threat of force are included .
The UCR definition of forcible rape states that only females can be victims, therefore, the forcible rape crime rate using the female population is included. Although both rates are shown on the trend chart, the following discussion is based on the female population only.
Comparing 1988 to 1993:
• The rate of reported forcible rapes decreased 10.9 percent.
Comparing 1992 to 1993:
II The forcible rape rate decreased 9.6 percent.
In 1993,
Of 11,754 forcible rapes reported:
• Rape accounted for 80.0 percent (9,407).
II Attempted rape accounted for 20.0 percent (2,347).
CRIMES 9
,---------,---- ---- - - -,
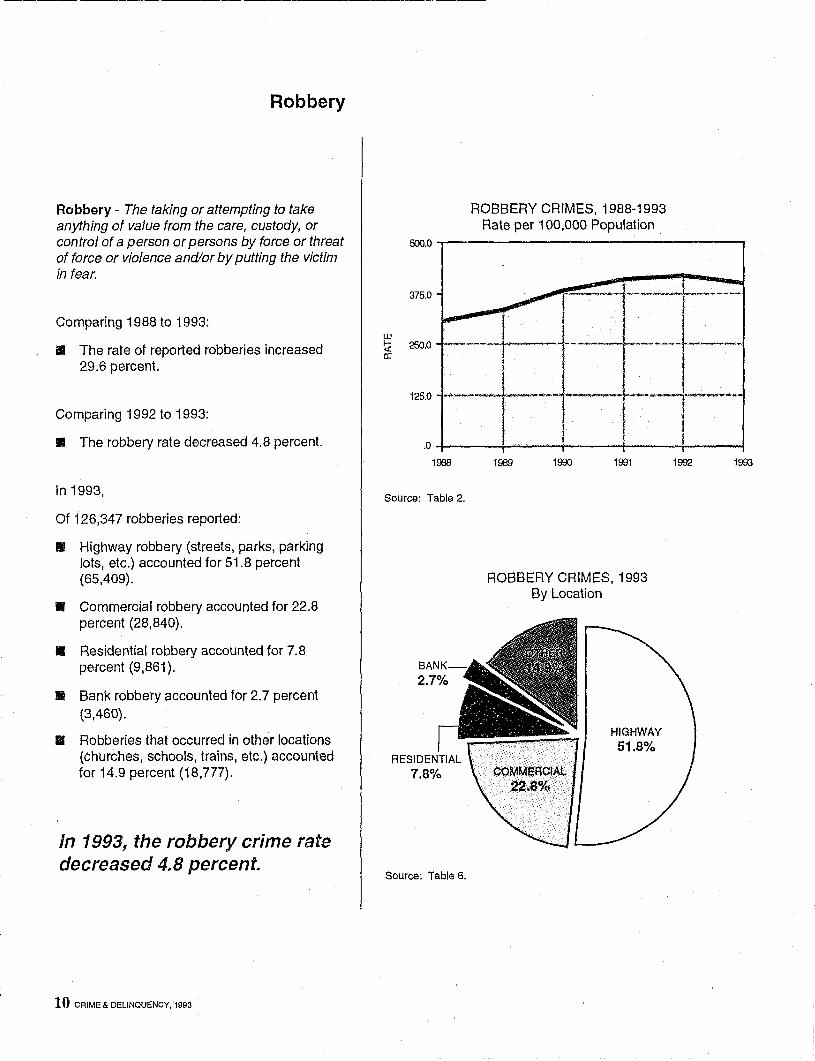
Robbery
Robbery - The taking or attempting to take anything of value from the care, custody, or control of a person or persons by force or threat of force or violence and/or by putting the victim in fear.
Comparing 1988 to 1993:
II The rate of reported robberies increased 29.6 percent.
Comparing 1992 to 1993:
• The robbery rate decreased 4.8 percent.
In 1993,
Of 126,347 robberies reported:
II Highway robbery (streets, parks, parking lots, etc.) accounted for 51.8 percent (65,409).
• Commercial robbery accounted for 22.8 percent (28,840).
• Residential robbery accounted for 7.8 percent (9,861).
II Bank robbery accounted for 2.7 percent (3,460).
II Robberies that occurred in other locations (churches, schools, trains, etc.) accounted for 14.9 percent (18,777).
In 1993, the robbery crime rate decreased 4.8 percent.
10 CAl ME & DELINQUENCY, 1993
ROBBERY CRIMES, 1988-1993 Rate per 100,000 Population
500.0 ~-----------------,
375.0
UJ ~ 250.0
125.0
1988
Source: Table 2.
Source: Table 6.
1989 1990 1991
ROBBERY CRIMES, 1993 By Location
HIGHWAY 51.8%
1992 1993
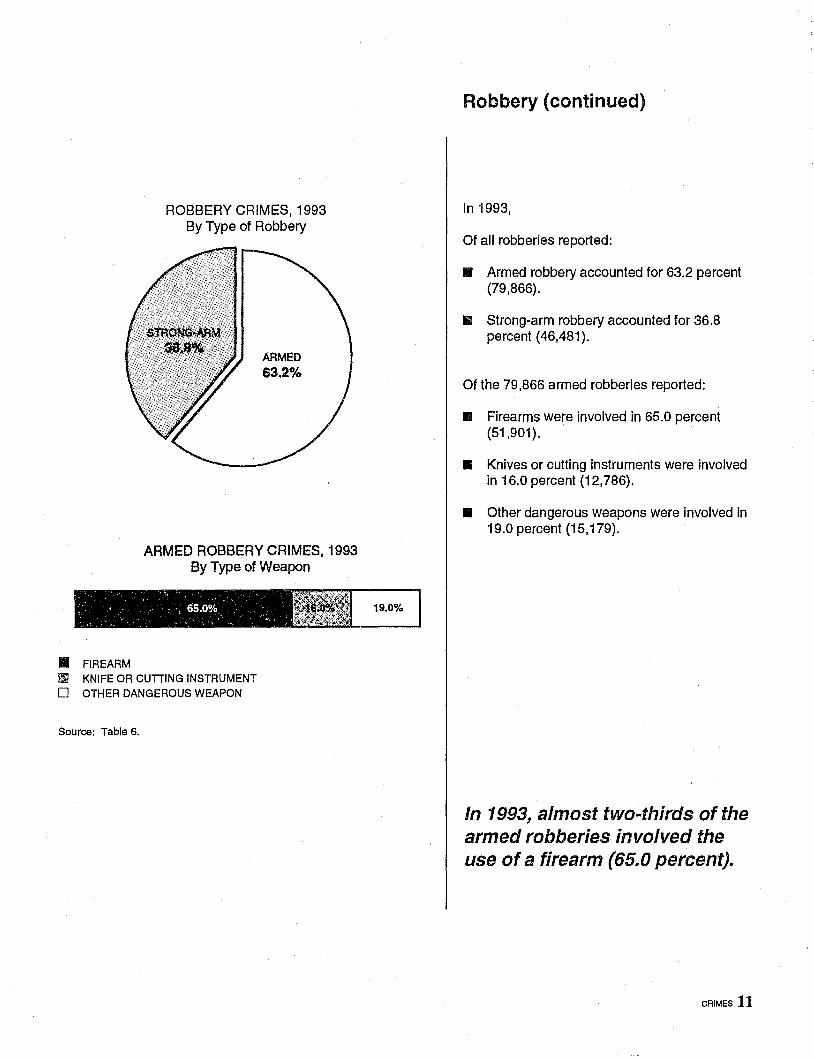
ROBBERY CRIMES, 1993 By Type of Robbery
ARMED 63.2%
ARMED ROBBERY CRIMES, 1993 By Type of Weapon
.... ;: ........ : .•. :.' '.' .' -·,65.0%."·. ,-~,~ ~.'. , ~ '. > • ,I... .., ,
II FIREARM ~ KNIFE OR CUTTING INSTRUMENT o OTHER DANGEROUS WEAPON
Source: Table 6.
19.0%
Robbery (continued)
In 1993,
Of all robberies reported:
.. Armed robbery accounted for 63.2 percent (79,866).
Ii: Strong-arm robbery accounted for 36.8 percent (46,481).
Of the 79,866 armed robberies reported:
.. Firearms were involved in 65.0 percent (51,901).
• Knives or cutting instruments were involved in 16.0 percent (12,786).
• Other dangerous weapons were involved in 19.0 percent (15,179).
In 1993, almost two-thirds of the armed robberies involved the use of a firearm (65.0 percent).
CRIMES 11
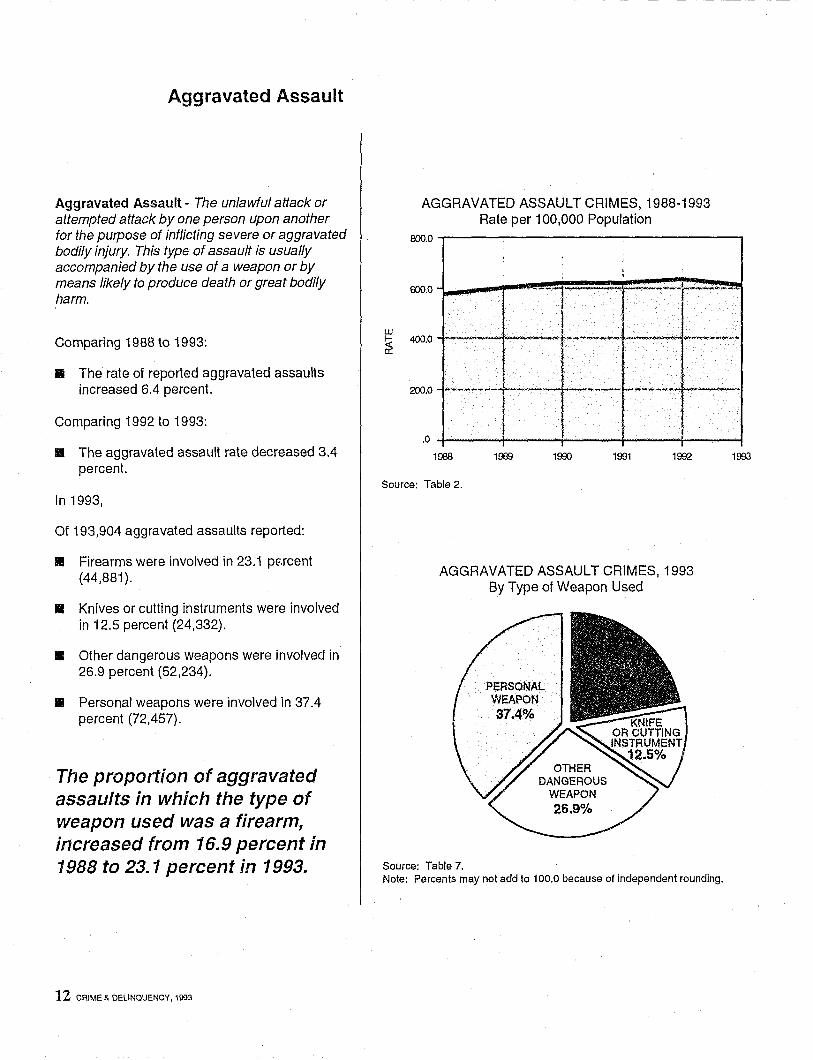
Aggravated Assault
Aggravated Assault - The unlawful attack or attempted attack by one person upon another for the purpose of inflicting severe or aggravated bodily injury. This type of assault is usually accompanied by the use of a weapon or by means likely to produce death or great bodily harm.
Comparing 1988 to 1993:
II The rate of reported aggravated assaults increased 6.4 percent.
Comparing 1992 to 1993:
.. The aggravated assault rate decreased 3.4 percent.
In 1993,
Of 193,904 aggravated assaults reported:
II Firearms were involved in 23.1 pE;rcent (44,881).
• Knives or cutting instruments were involved in 12.5 percent (24,332).
• Other dangerous weapons were involved in 26.9 percent (52,234).
II Personal weapons were involved in 37.4 percent (72,457).
The proportion of aggravated assaults in which the type of weapon used was a firearm, increased from 16.9 percent in 1988 to 23. 1 percent in 1993.
12 CRIME & DELINQUENCY. 1993
AGGRAVATED ASSAULT CRIMES, 1988-1993 Rate per 100,000 Population
800.0
,
600.0 --1 ~-"""--i"""-"""''''''-''''''''~
I I --t ... -.---~-UJ
~ 400.0 a: I ------+-t- """"--...,....~ ... -.....
I I 1
200.0
.0
1988 1989 1990 1991 1992
Source: Table 2.
AGGRAVATED ASSAULT CRIMES, 1993 By Type of Weapon Used
Source: Table 7.
--... ~--,....
1993
Note: Percents may not add to 100.0 because of independent rounding.
UJ
PROPERTY CRIMES, 1988-1993 Rate per 100,000 Population
4000.0..,-------------------,
3000.0
~ 2000.0 1------- ---~---~t--J --1----- .----~-.. -1000.0 _,.,..-. __ -.;,oo{-__ .J{_~"'R ___ '...-!o __ ~"f!O<_";'"1'O'_~.;oOo.O"''-Wo.fIo:o'' __
i I
.0+--------~----_4---r_----+_1----~
1988
Source: Table 2.
Source: Table 3.
1989 1990 1991 1992 1993
PROPERTY CRIMES, 1993 By Crime
MOTOR VEHICLE THEFT
43.6% BURGLARY 56.4%
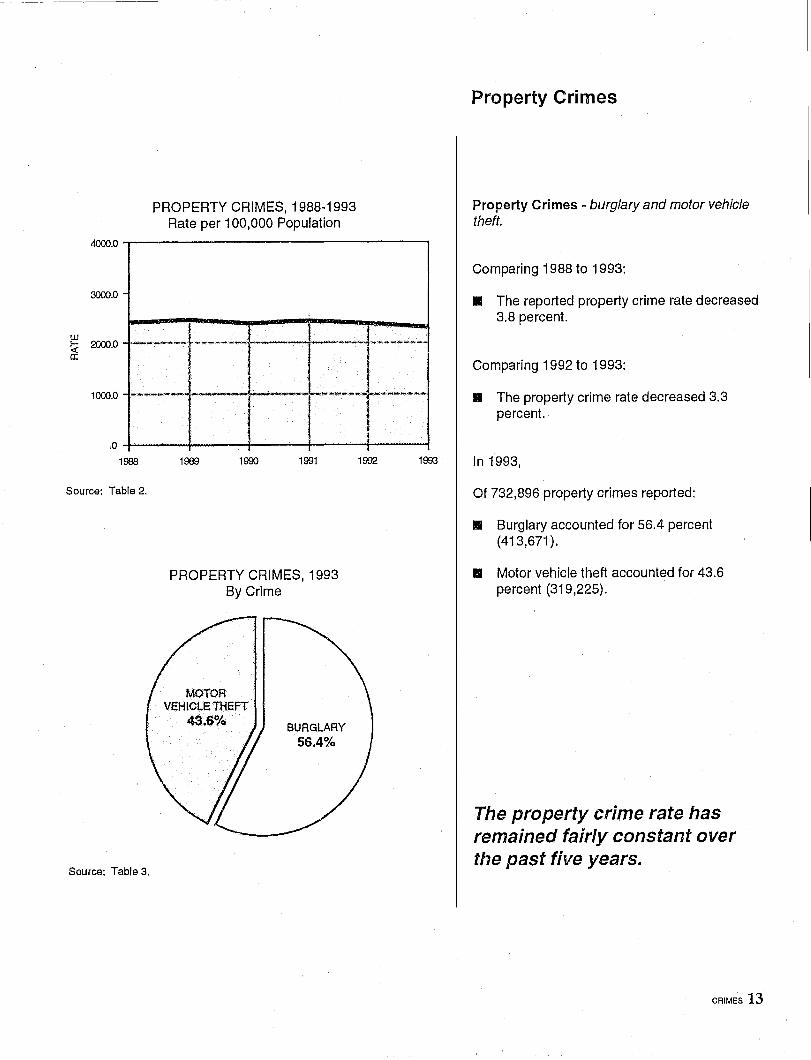
Property Crimes
Property Crimes - burglary and motor vehicle theft.
Comparing 1988 to 1993:
• The reported property crime rate decreased 3.8 percent.
Comparing 1992 to 1993:
• The property crime rate decreased 3.3 percent.
In 1993,
Of 732,896 property crimes reported:
• Burglary accounted for 56.4 percent (413,671).
.. Motor vehicle theft accounted for 43.6 percent (319,225).
The property crime rate has remained fairly constant over the past five years.
CRIMES 13
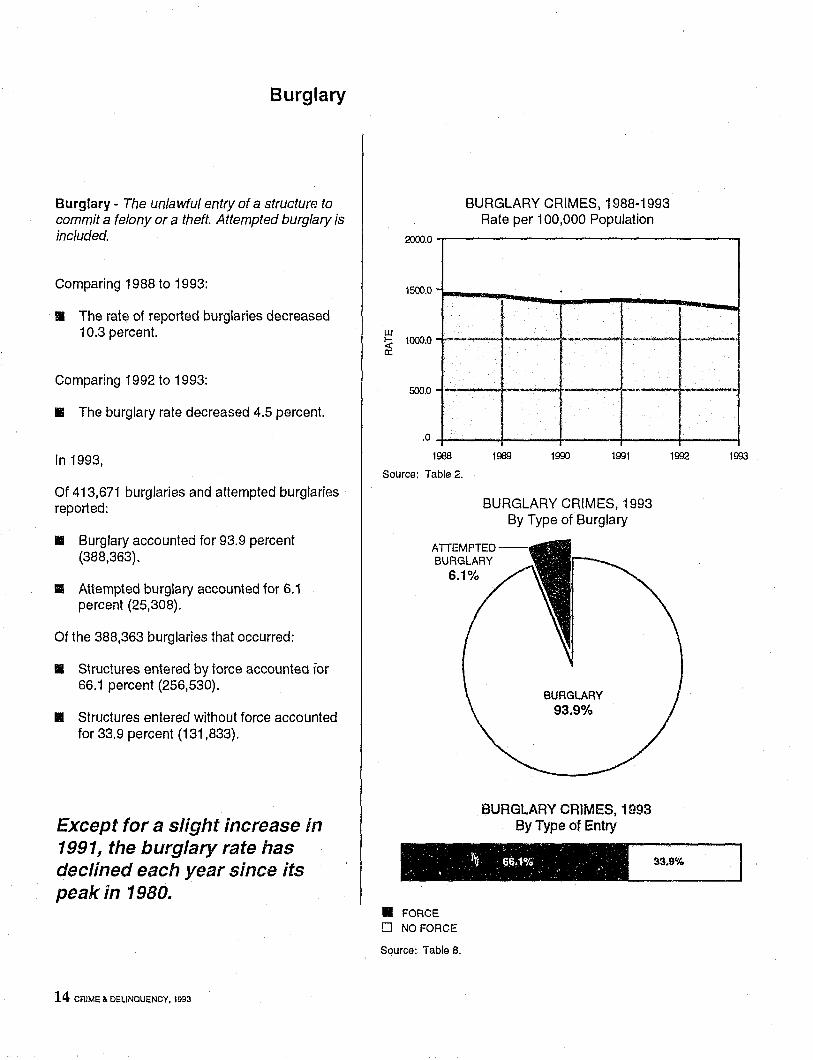
Burglary
Burglary - The unlawful entry of a structur(-] to commit a felony or a theft. Attempted burglary is included.
Comparing 1988 to 1993:
III The rate of reported burglaries decreased 10.3 percent.
Comparing 1992 to 1993:
• The burglary rate decreased 4.5 percent.
In 1993,
Of 413,671 burglaries and attempted burglaries reported:
• Burglary accounted for 93.9 percent (388,363).
• Attempted burglary accounted for 6.1 percent (25,308).
Of the 388,363 burglaries that occurred:
• St.ructures entered by force accountea for 66.1 percent (256,530).
• Structures entered without force accounted for 33.9 percent (131,833).
Except for a slight increase in 1991, the burglary rate has declined each year since its peak in 1980.
14 CRIME & DELINQUENCY, 1993
2000.0
1500.0 -
BURGLARY CRIMES, 1988-1993 Rate per 100,000 Population
UJ
~ 1000.0
500.0
-..... ...... ....-. -l-.~ tI:tt ""~\ AI'" -- ... *.. .1"'" . -- -.
.0
1968
Source: Table 2.
1989 1900 1991
BURGLARY CRIMES, 1993 By Type of Burglary
ATIEMPTED BURGLARY
6.1%
BURGLARY 93.9%
BURGLARY CRIMESI 1993 By Type of Entry
I 1992 1993
.. \ ... -,.' .~. 66.1%' : . .... .
. . , ~ . . .'. .
• FORCE
o NO FORCE
Source: Table 8.
Source: Table a.
Source: Table a.
BURGLARY CRIMES, 1993 By Location
RESIDENTIAL 61.7%
BURGLARY CRIMES, 1993 By Time of Day
DAYTIME 37.9%
Note: Percent!! may not add to 100.0 because of independent rounding.
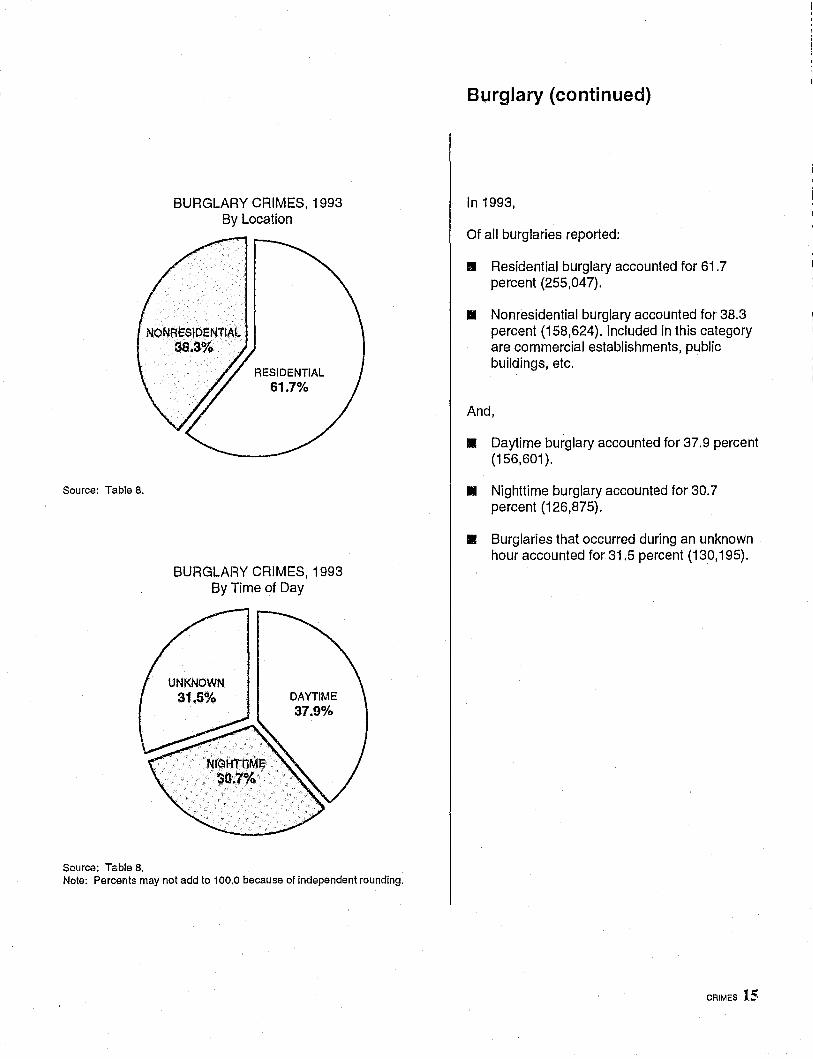
Burglary (continued)
In 1993,
Of all burglaries reported:
.. Residential burglary accounted for 61.7 percent (255,047).
• Nonresidential burglary accounted for 38.3 percent (158,624). Included in this category are commercial establishments, public buildings, etc.
And,
• Daytime burglary accounted for 37.9 percent (156,601 ).
• Nighttime burglary accounted for 30.7 percent (126,875).
• Burglaries that occurred during an unknown hour accounted for 31.5 percent (130,195).
CRIMES 15
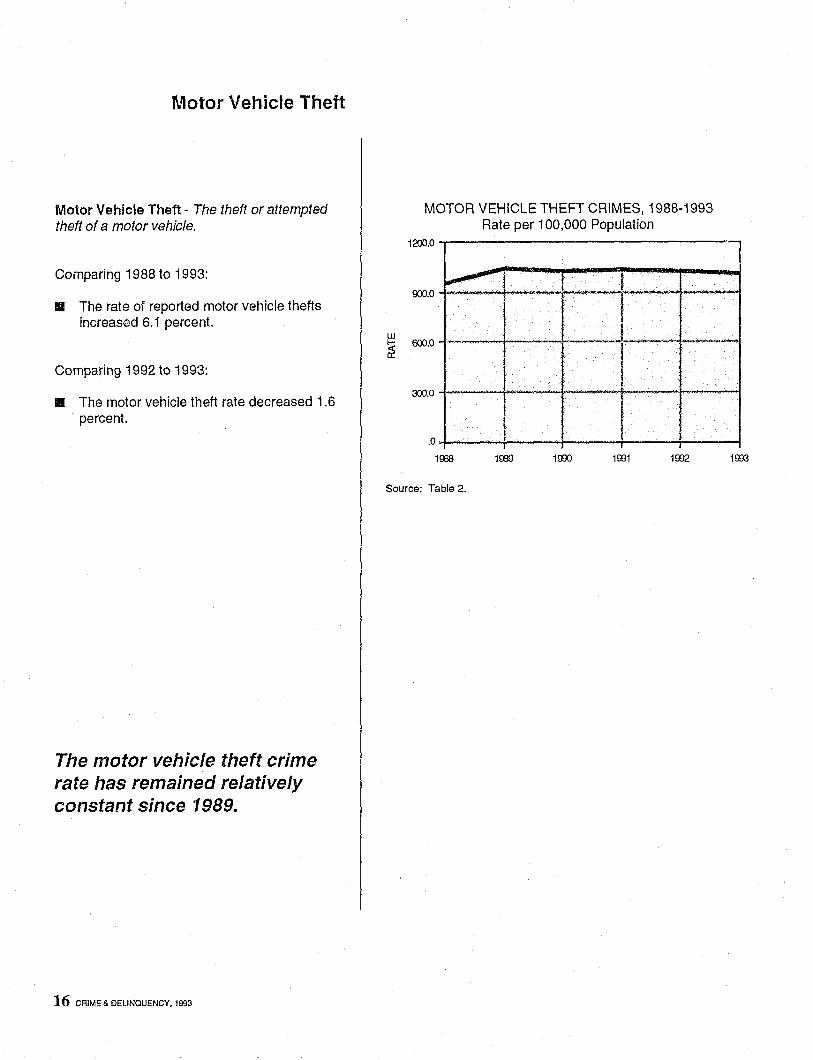
Motor Vehicle Theft
Motor Vehicle Theft - The theft or attempted theft of a motor vehicle.
Comparing 1988 to 1993:
II The rate of reported motor vehicle thefts increased 6.1 percent.
Comparing 1992 to 1993:
• The motor vehicle theft rate decreased 1.6 percent.
The motor vehicle theft crime rate has remained relatively constant since 1989.
16 CRIME& DELINaUENCY.1993
MOTOR VEHICLE THEFT CRIMES, 1988-1993 Rate per 100,000 Population
1200.0
~ 900.0
w ~ 600.0
.. _-
300.0
.0
1008
Source: Table 2.
!
1 I
1009
'l L ___
~--...~
._--1-----.-~-.--
1000 1001 1002 1003
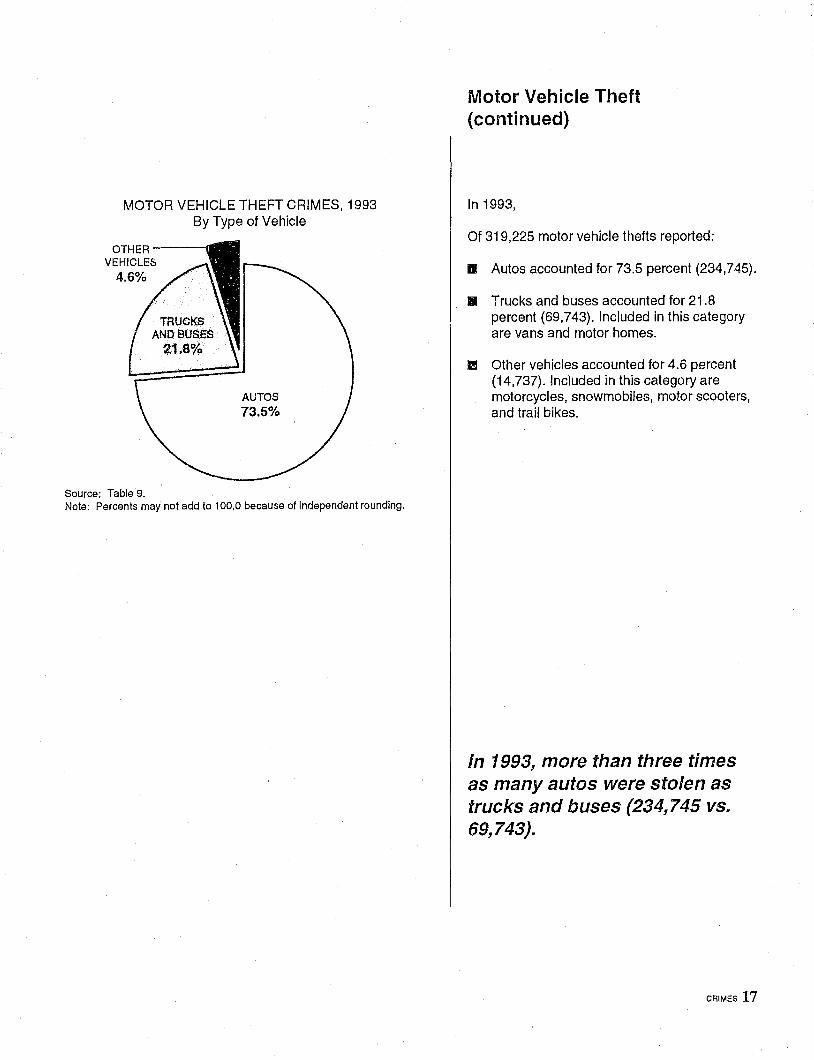
MOTOR VEHICLE THEFT CRIMES, 1993 By Type of Vehicle
OTHER ----41
VEHICLES 4.6%
Source: Table 9.
AUTOS 73.5%
Note: Percents may not add to 100.0 because of independent rounding.
Motor Vehicle Theft (continued)
In 1993,
Of 319,225 motor vehicle thefts reported:
• Autos accounted for 73.5 percent (234,745).
II Trucks and buses accounted for 21.8 percent (69,743). Included in this category are vans and motor homes.
II!ll Other vehicles accounted for 4.6 percent (14,737). Included in this category are motorcycles, snowmobiles, motor scooters, and trail bikes.
In 1993, more than three times as many autos were stolen as trucks and buses (234,745 vs. 69,743).
CRIMES 17
Larceny-theft
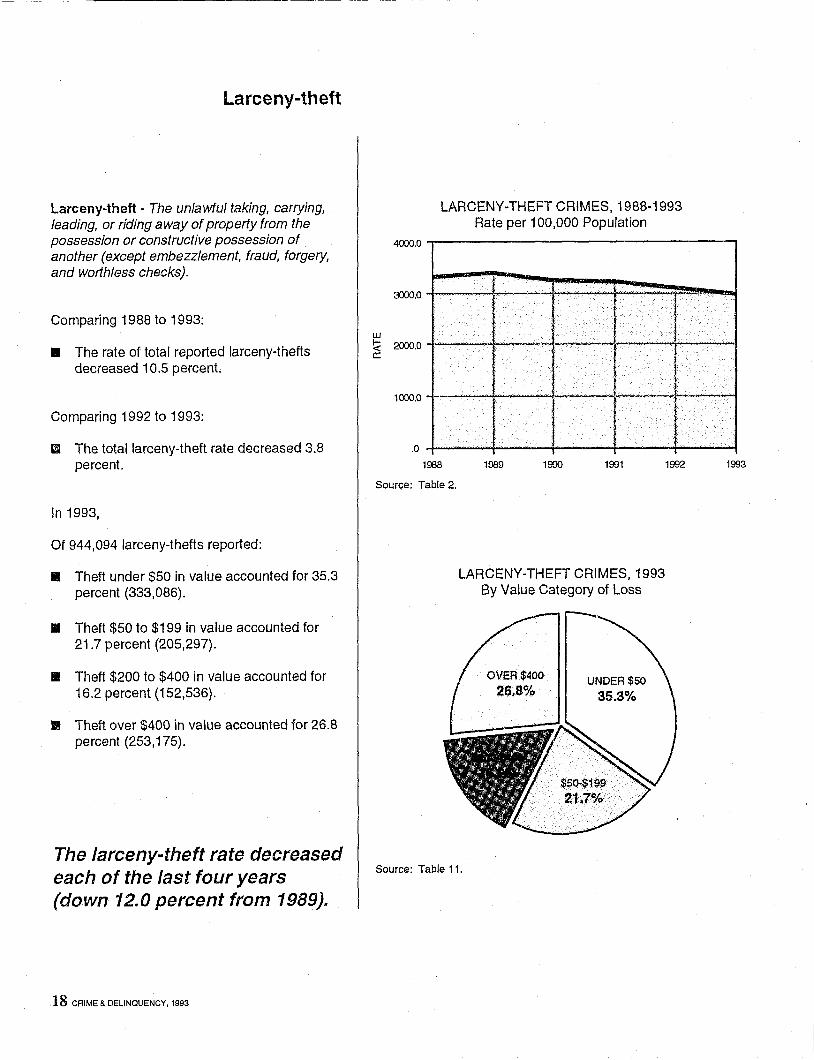
Larceny-theft - The unlawful taking, carrying, leading, or riding away of property from the possession or constructive possession of another (except embezzlement, fraud, forgery, and worthless checks).
Comparing 1988 to 1993:
• The rate of total reported larceny-thefts decreased 10.5 percent.
Comparing 1992 to 1993:
m The total larceny-theft rate decreased 3.8 percent.
In 1993,
Of 944,094 larceny-thefts reported:
.. Theft under $50 in value accounted for 35.3 percent (333,086).
• Theft $50 to $199 in value accounted for 21.7 percent (205,297).
• Theft $200 to $400 in value accounted for 16.2 percent (152,536).
11 Theft over $400 in value accounted for 26.8 percent (253,175).
The larceny-theft rate decreased each of the last four years (down 12.0 percent from 1989).
18 CRIME & DELINQUENCY, 1993
4000.0
3:J()().0
UJ
~ 2000.0 a:
1000.0
.0
LARCENY-THEFT CRIMES, 1988-1993 Rate per 100,000 Population
i -"-
~ -- ~~
l
i I
1988
Source: Table 2.
1989 1990 1991 1992
LARCENY-THEFT CRIMES, 1993 By Value Category of Loss
Source: Table 11.
UNDER $50
35.3%
1993
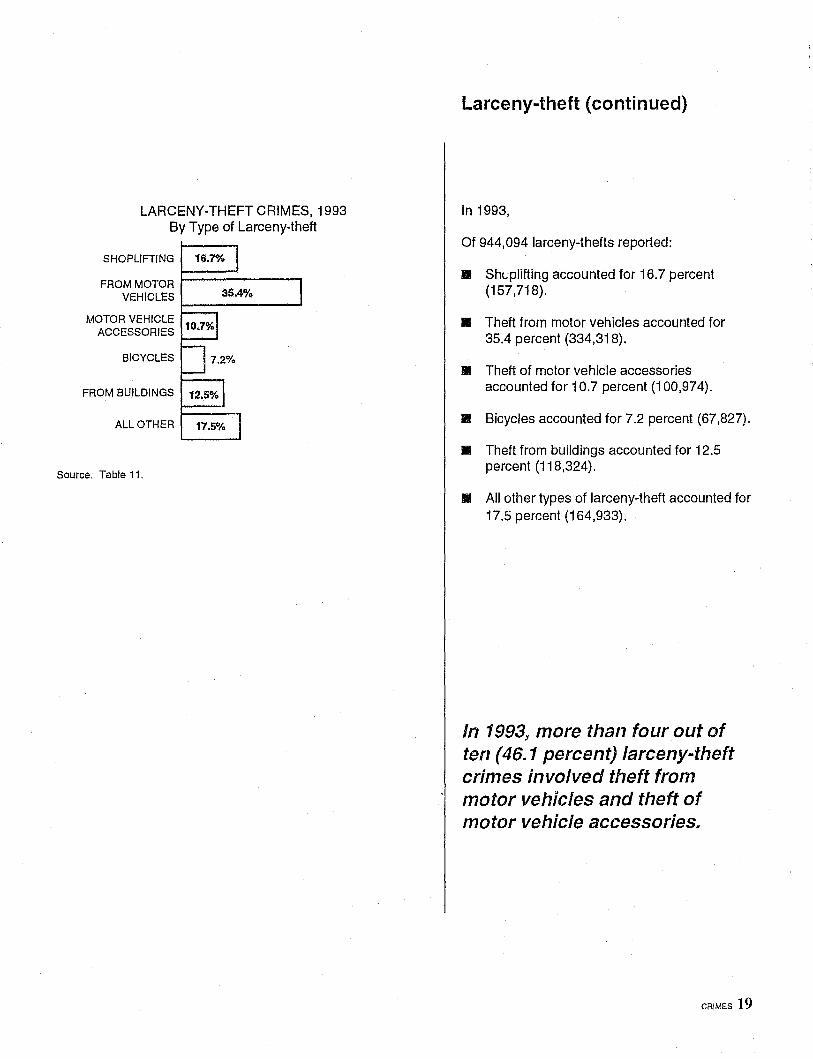
LARCENY-THEFT CRIMES, 1993 By Type of Larceny-theft
SHOPLIFTING 16.7%
FROM MOTOR ~==~--..... VEHICLES 35.4%
MOTOR VEHICLE ACCESSORIES
BICYCLES
FROM BUILDINGS
ALL OTHER
Source: Table 11.
Larceny-theft (continued)
In 1993,
Of 944,094 larceny-thefts reported:
II She-plitting accounted for 16.7 percent (157,718).
.. Theft from motor vehicles accounted for 35.4 percent (334,318).
.. Theft of motor vehicle accessories accounted for 10.7 percent (100,974).
• Bicycles accounted for 7.2 percent (67,827).
.. Theft from buildings accounted for 12.5 percent (118,324).
II All other types of larceny-theft accounted for 17.5 percent (164,933).
In 1993, more than four out of ten (46. 1 percent) larceny-theft crimes involved theft from motor vehicles and theft of motor vehicle accessories.
CRIMES 19
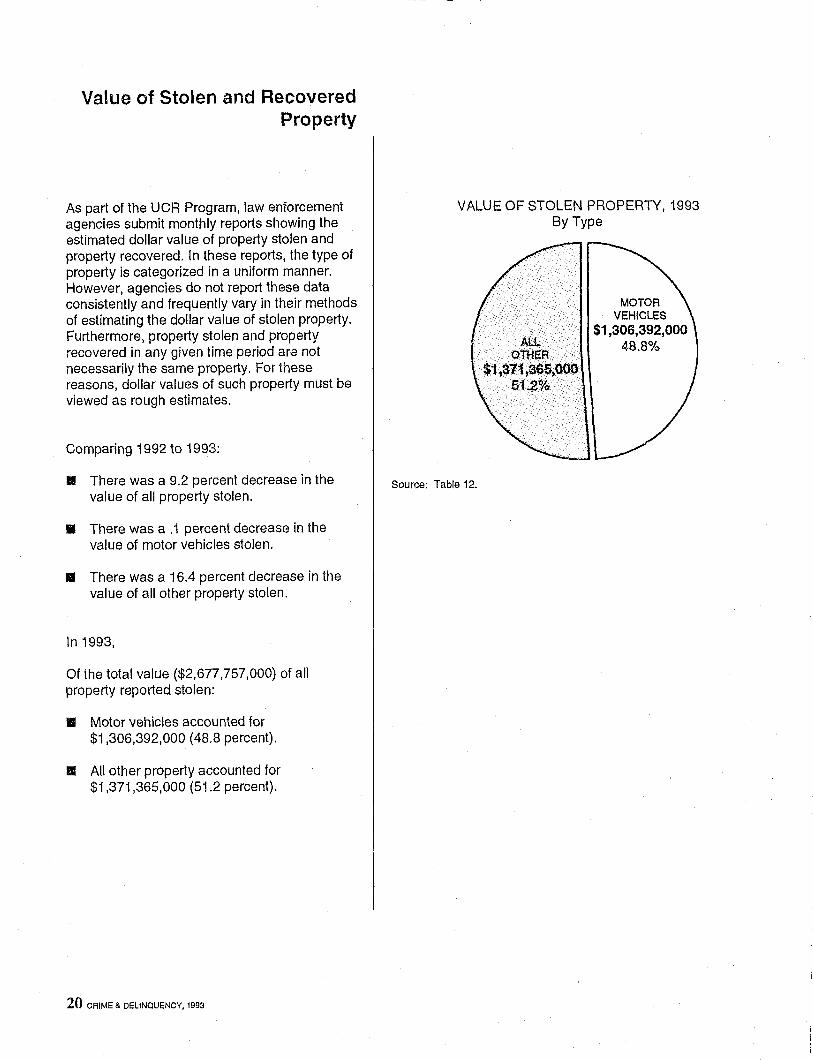
Value of Stolen and Recovered Property
As part of the UCR Program, law enforcement agencies submit monthly reports showing the estimated dollar value of property stolen and property recovered. In these reports, the type of property is categorized in a uniform manner. However, agencies do not report these data consistently and frequently vary in their methods of estimating the dollar value of stolen property. Furthermore, property stolen and property recovered in any given time period are not necessarily the same property. For these reasons, dollar values of such property must be viewed as rough estimates.
Comparing 1992 to 1993:
• There was a 9.2 percent decrease in the value of all property stolen.
.. There was a .1 percent decrease in the value of motor vehicles stolen.
• There was a 16.4 percent decrease in the value of all other property stolen.
In 1993,
Of the total value ($2,677,757,000) of all property reported stolen:
• Motor vehicles accounted for $1,306,392,000 (48,8 percent).
II All other property accounted for $1,371,365,000 (51,2 percent).
20 CRIME & DELINQUENCY, 1993
VALUE OF STOLEN PROPERTY, 1993 By Type
Source: Table 12.
ALL OTHEf{
··$1.,311,365,00Q 51.2%
MOTOR VEHICLES
$1,306,392,000 48.8%
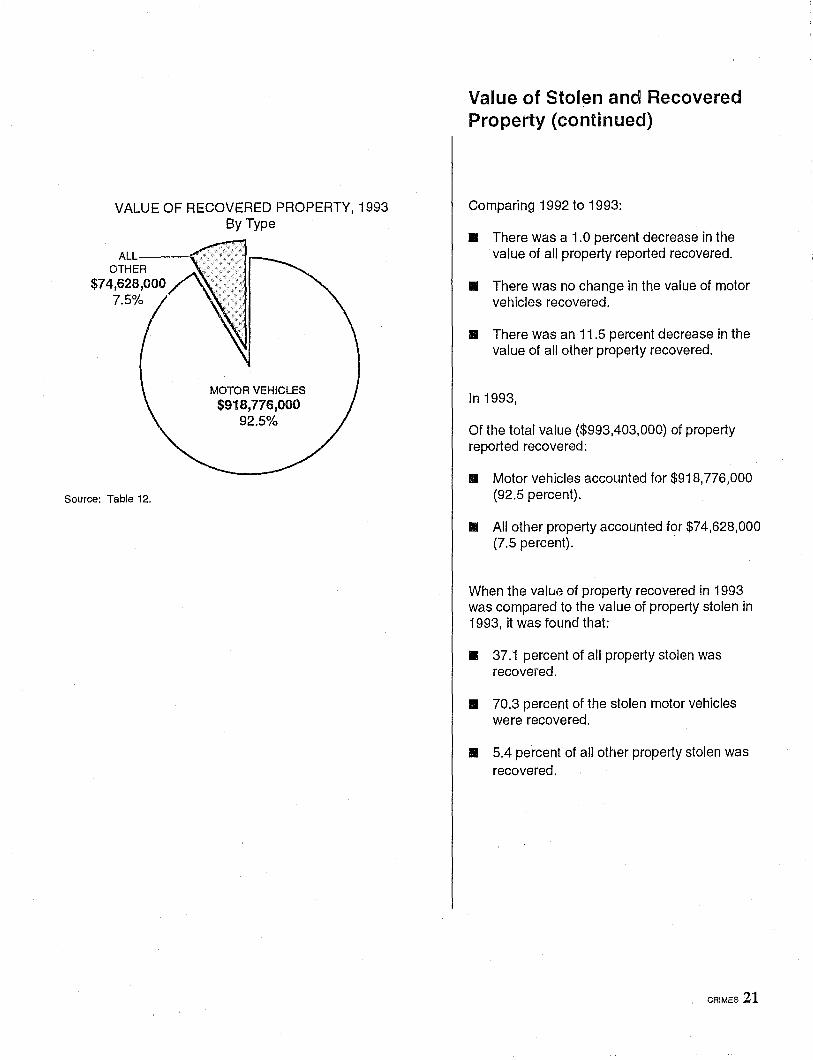
VALUE OF RECOVERED PROPERTY, 1993 By Type
ALL----< OTHER
$74,628,000 7.5%
Source: Table 12.
MOTOR VEHICLES $918,776,000
92.5%
Value of Stolen and Recovered Property (continued)
Comparing 1992 to 1993:
II There was a 1.0 percent decrease in the value of all property reported recovered.
II There was no change in the value of motor vehicles recovered.
&I There was an 11 .5 percent decrease in the value of all other property recovered.
In 1993,
Of the total value ($993,403,000) of property reported recovered:
III Motor vehicles accounted for $918,776,000 (92.5 percent).
II All other property accounted for $74,628,000 (7.5 percent).
When the valLJl~ of property recovered in 1993 was compared to the value of property stolen in 1993, it was found that:
II 37.1 percent of all property stolen was recovered.
.. 70.3 percent of the stolen motor vehicles were recovered.
II 5.4 percent of all other property stolen was recovered.
CRIMES 21
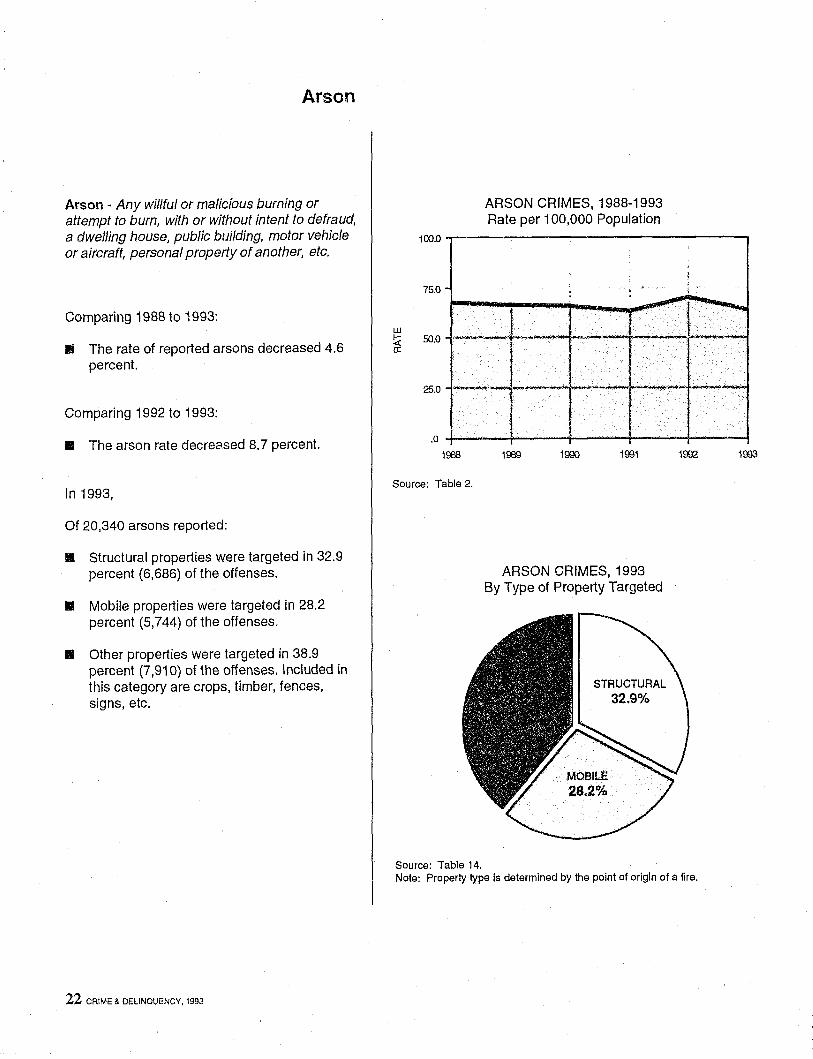
Arson
Arson - Any willful or malicious burning or attempt to burn, with or without intent to defraud, a dwelling house, public building. motor vehicle or aircraft, personal property of another, etc.
Comparing 1988 to 1993:
II The rate of reported arsons decreased 4.6 percent.
Comparing 1992 to 1993:
• The arson rate decreased 8.7 percent.
In 1993,
Of 20,340 arsons reported:
iii Structural properties were targeted in 32.9 percent (6,686) of the offenses.
.. Mobile properties were targeted in 28.2 percent (5,744) of the offenses.
• Other properties were targeted in 38.9 percent (7,910) of the offenses. Included in this category are crops, timber, fences, signs, etc.
22 CRIME & DELINQUENCY. 1993
ARSON CRIMES, 1988-1993 Rate per 100,000 Population
100.0 -r-------------------.
UJ
~ ex:
.0 4-----~------+_----_+------+_----~
1988
Source: Table 2.
Source: Table 14.
1989 1990 1991
ARSON CRIMES, 1993 By Type of Property Targeted
1002
Note: Property type is determined by the point of origin of a fire.
1993
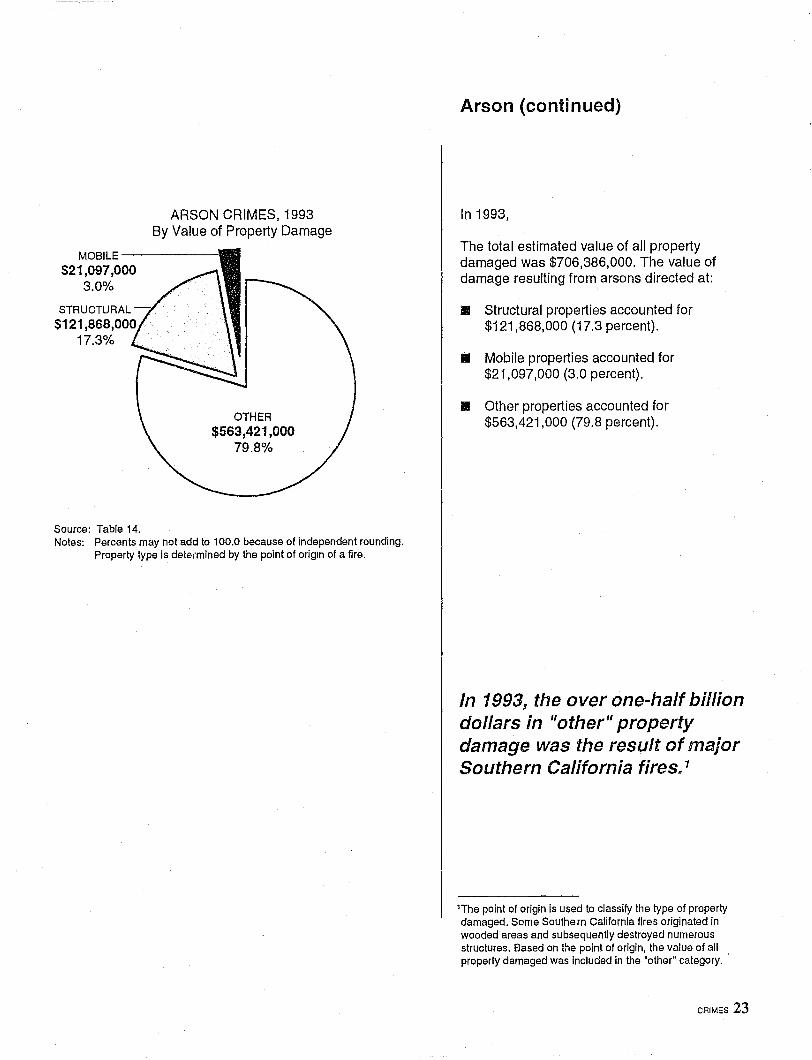
ARSON CRIMES, 1993 By Value of Property Damage
MOBILE------l
$21 ,097,000 3.0%
STRUCTURAL -
$121,868,000 17.3%
Source: Table 14.
OTHER $563,421,000
79.8%
Notes: Percents may not add to 100.0 because of independent rounding. Property type is determined by the point of origin of a fire.
Arson (continued)
In 1993,
The total estimated value of all property damaged was $706,386,000. The value of damage resulting from arsons directed at:
II Structural properties accounted for $121,868,000 (17.3 percent).
• Mobile properties accounted for $21,097,000 (3.0 percent).
• Other properties accounted for $563,421,000 (79.8 percent).
In 1993, the over one-half billion dollars in "other" property damage was the result of major Southern California fires. 1
lThe point of origin is used to classify the type of property damaged. Some Southern California fires originated in wooded areas and subsequently destroyed numerous structures. Based on the point of origin, the value of all property damaged was included in the 'other' category.
CRIMES 23
---- -------- -- -------- --
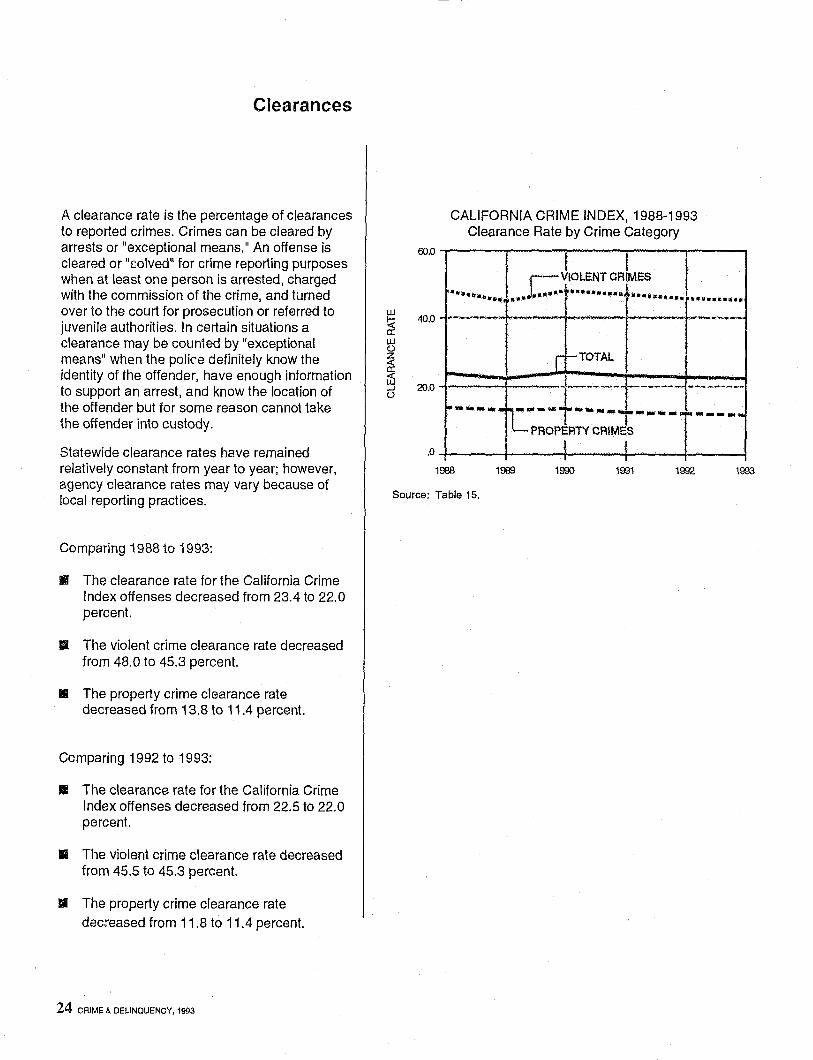
Clearances
A clearance rate is the percentage of clearances to reported crimes. Crimes can be cleared by arrests or "exceptional means." An offense is cleared or "colved" for crime reporting purposes when at least one person is arrested, charged with the commission of the crime, and turned over to the court for prosecution or referred to juvenile authorities. In certain situations a clearance may be counted by "exceptional means" when the police definitely know the identity of the offender, have enough information to support an arrest, and know the location of the offender but for some reason cannot take the offender into custody.
Statewide clearance rates have remained relatively constant from year to year; however, agency clearance rates may vary because of local reporting practices.
Comparing 1988 to 1993:
., The clearance rate for the California Crime Index offenses decreased from 23.4 to 22.0 percent.
II The violent crime clearance rate decreased from 48.0 to 45.3 percent.
III The property crime clearance rate decreased from 13.8 to 11.4 percent.
Comparing 1992 to 1993:
1\ The clearance rate for the California Crime Index offenses decreased from 22.5 to 22.0 percent.
• The violent crime clearance rate decreased from 45.5 to 45.3 percent.
• The property crime clearance rate
decreased from 11.8 to 11.4 percent.
24 CAIME & DELINQUENCY. 1993
60.0
w ~ 40.0 a: w o
~ 15 ..J 20.0 o
.0
CALIFORNIA CRIME INDEX, 1988-1993 Clearance Rate by Crime Category
•• •• If •••••
CJIOLENT CR~ES . _- .a ....... Q t .• _ ..• 1 •••.•...•. , ••.•...•. --~ ----.----
I t-TOTAL
I r--t ---- -------~----.n.:.:_-.. ..._- ... t ........ - .. _-_.
PROPERTY CRIMES
J J I
1008 1989 1900 1991 1993
Source: Table 15.
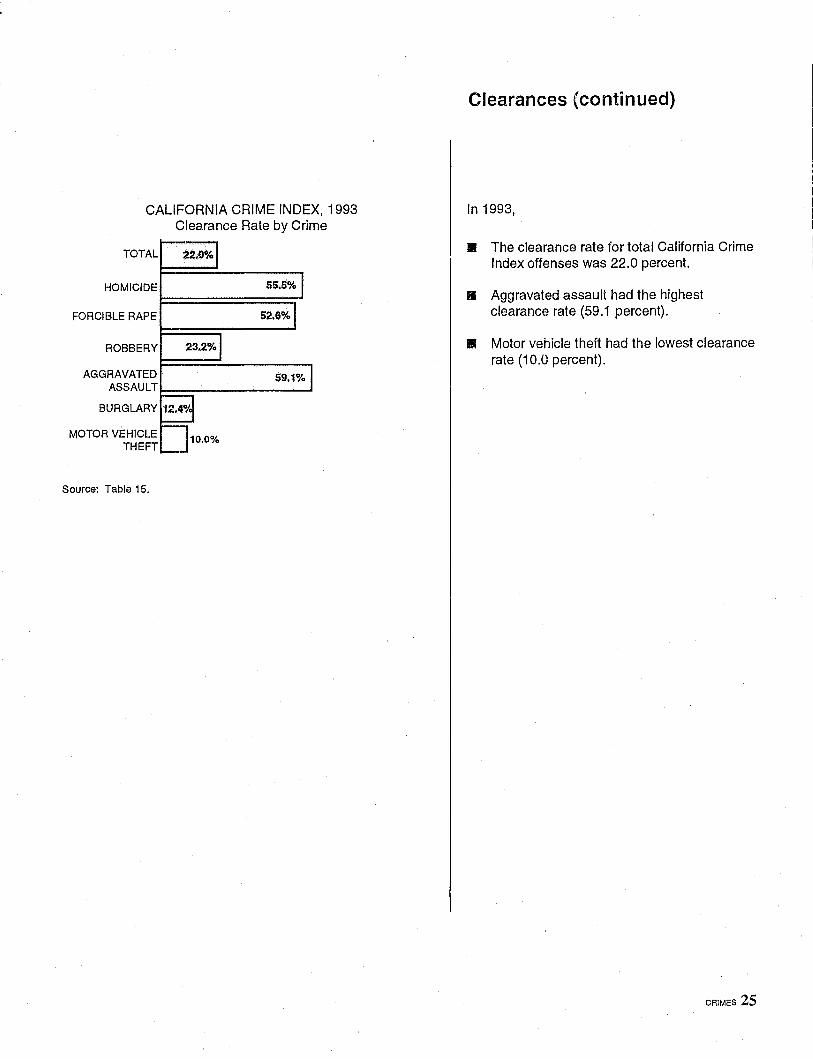
CALIFORNIA CRIME INDEX, 1993 Clearance Rate by Crime
TOTAL 22.0%
HOMICIDE
FORCIBLE RAPE
ROBBERY 23.2%
AGGRAVATED 59.1% ASSAULTt--_______ -I
MOTOR VEHICLE THEFT
Source: Table 15.
Clearances (continued)
In 1993,
• The clearance rate for total California Crime Index offenses was 22.0 percent.
II Aggravated assault had the highest clearance rate (59.1 percent).
.. Motor vehicle theft had the lowest clearance rate (10.0 percent).
CRIMES 25

-.
"
---.- -
•
. '
ARRESTS
WHAT IS AN ARREST?
Arrests occur when persons are taken into custody because they are believed to have violated the law. Not all arrests result in persons being placed in jail. Arrestees may be released by the arresting agency, may post bailor may be released on their own recognizance to appear in court at a later date. Some are issued citations, much like traffic tickets, which direct them to appear in court at a later date.
Arrests are divided into two major groups: felony arrests and misdemeanor arrests. An arrest for a felony-level offense can result in a sentence to state prison if the offender is convicted as an adult. An arrest for a misdemeanor-level offense can result in a sentence of up to one year in a county jail, a fine, probation or any combination of the three.
Juveniles may also be arrested for truancy, incorrigibility, running away, and curfew violations. These are commonly referred to as status offenses because agency intervention is based solely on the juvenile's status as a minor. Status offenses are acts that would not be "crimes" if committed by adults.
28 CRIME &. DELINQUENCY, 1993
ARRESTS
HOW ARE ARRESTS REPORTED?
Unlike crimes, which are classified by nationwide Uniform Crime Reporting (UCR) standards, arrests are reported by California statute definition of the offense. This may cause some differences in the definitions of certain crimes and the reporting of the arrests for those crimes. For instance, theft from a locked automobile is a burglary by California Penal Code definition. The crime would be classified and reported as a theft under the UCR definition. The arrest offenses listed in the following section are defined by California statute, for which codes are listed in the Appendix.
All California law enforcement agencies report arrest and citation informati..m to the Department of Justice on the "Monthly Arrest and Citation Register," which lists each arrestee; includes information on age, sex, and race! ethnic group; and specifies the "most serious" arrest offense and law enforcement disposition.
WHAT IS AN ARREST RATE?
An arrest rate describes the number of arrests made by law enforcement agencies per 100,000 total population or per 100,000 population considered to be at risk for arrest. The following section includes three ai-risk comparison populations: adults (18-69 years of age), juveniles (10-17 years of age), and tot~\ (10-69 years of age). The formula used to calculate at-risk rates can be found in the Appendix.
ARRESTS 29
ARREST TRENDS, 1952-1993
ill f-
~ ~ en 0:
~
FELONY AND MISDEMEANOR ARRESTS, 1952-1993 Rate per 100,000 Population at Risk
8000.0 "--'~--'---r---Ir-I --:-I--rl---:--I--:-
I --"1
1---:-1
1 I j I dMISDE~EANOR i I J
I I l.~·~·~·~.-' .. -.( 1 ~*·-----t-----· I, -- t .... ----t~; ;;:;p~"r. '-----~i-~- .... '-.. ·-'l· "", .. ~ ... -,.-t-
I j I .. J. I I ... I I .......... +" ......... ! .......... ~". I II I I \. I l ,I". ••
6000.0
4000.0
2000.0 ____ _. ---.1-- ~_._ .. ____ I J. ____ I_.~
1'-__ +' _r i. FELl.' NY I f i Lt I I
! \ j
~ 4------+-----4----~~----+-----4-----~-----+----_+'----~~----+\~
52 56 00 64 68 72 YEAR
76 00 84 88 92 93
Source: Tauie 16. Note: Data prior to 1960 are incomplete.
30 CAIME & DELINQUENCY, 1993
ARREST TRENDS, 1952-1993
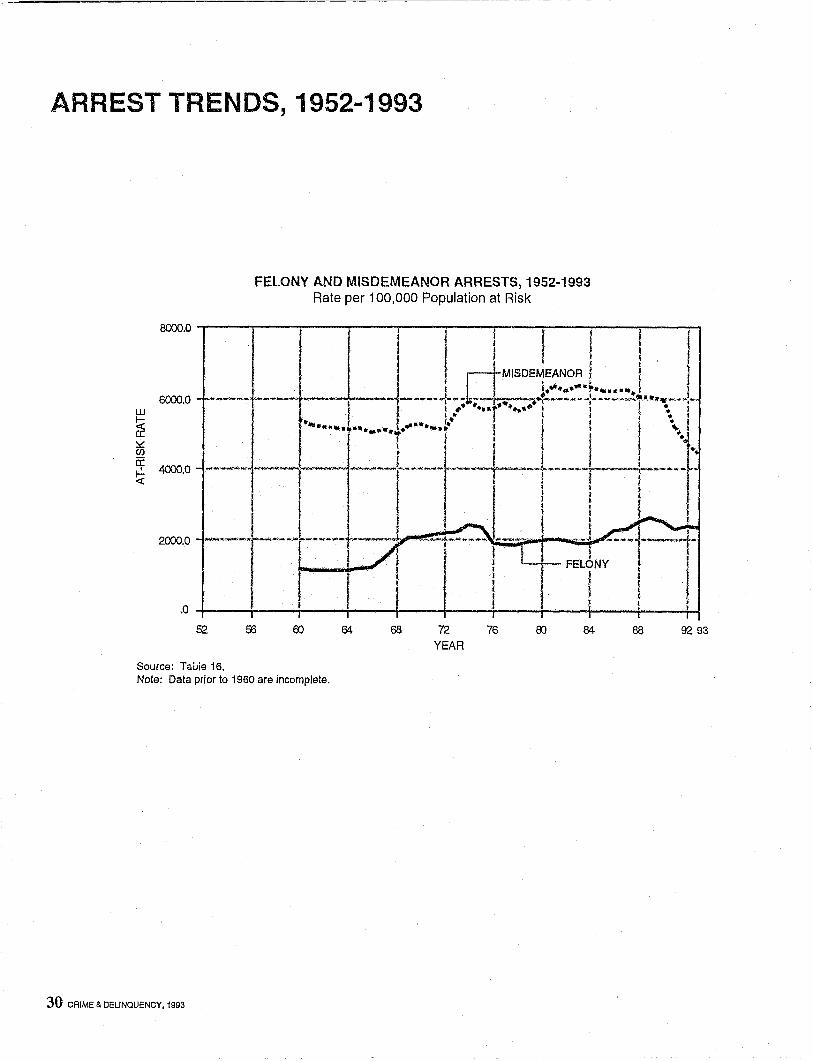
The first Crime in California publication was issued in 1953 and included adult felony arrest offense data for the 1952 calendar year. Complete arrest data prior to 1957 and census data broken down by age prior to 1960 are not available.
The corresponding chart displays arrest rates beginning with 1960, the first year complete data were available. Felony and misdemeanor arrest rates are based on populations at risk.
Comparing 1960 to 1993:
• There was a 98.2 percent increase in the rate of felony arrests.
• There was a 17.9 percent decrease in the rate of misdemeanor arrests.
The felony arrest rate has almost doubled since 1960. Felony arrests as a proportion of total arrests increaGed from 15.4 percent in 1960 to 33.8 percent in 1993.
The 1993 misdemeanor arrest rate of 4,434.6 per 100,000 population at risk is the lowest for the years shown. Misdemeanor arrests as a proportion of total arrests decreased from 71.4 percent in 1960 to 64.7 percent in 1993.
ARRESTS 31
Total Arrests
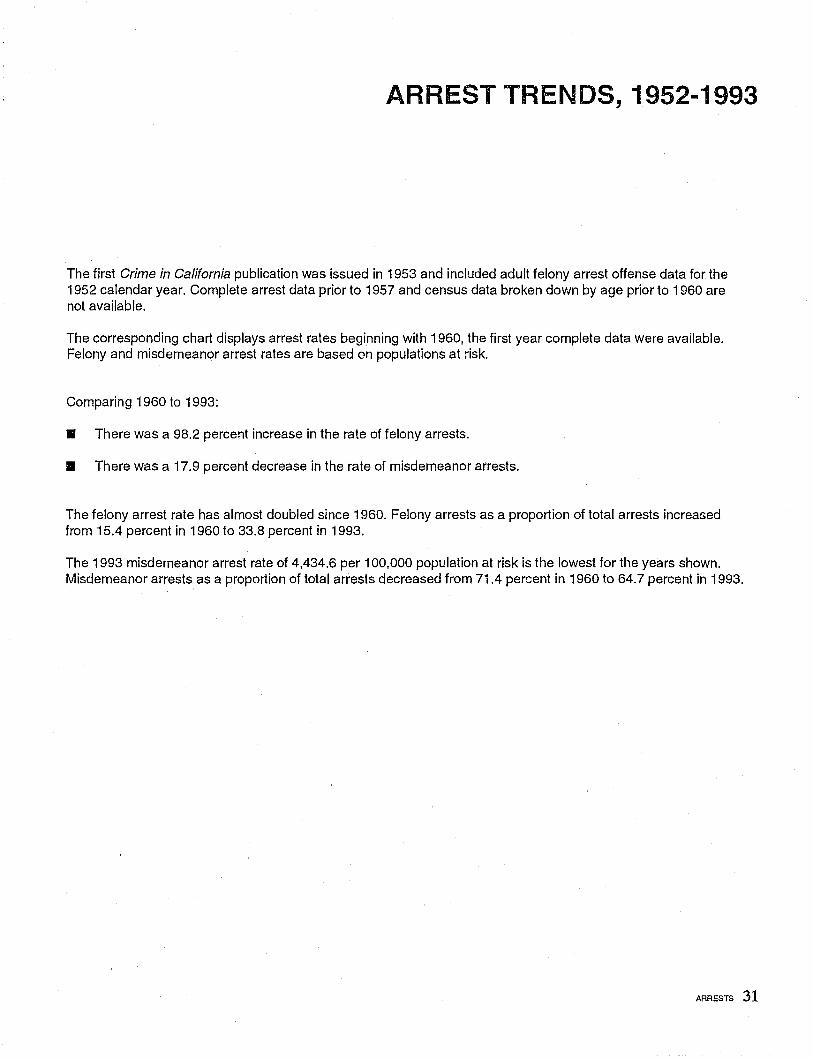
Comparing 1988 to 1993:
II There was a 20.9 percent decrease in the rate of total arrests.
,. There was a 23.8 percent decrease in the rate of adult arrests and a .6 percent increase in the rate of juvenile arrests.
Comparing 1992 to 1993:
II There was a 4.4 percent rate decrease in total arrests.
• There was a 5.2 percent rate decrease in adult arrests and a .3 percent rate increase in juvenile arrests.
Arrest rates for years prior to 1992 may not match previously published data. Arrest rates in the Crime and Delinquency, 1992 publication were recalculated using revised population data based on the 1990 census. Additionally, the "at-risk" population categories were changed to exclude persons 70 years of age and over.
From 1992 to 1993, the arrest rate decreased 4.4 percent. This was the fourth consecutive year of decline.
32 CRIME & DELINQUENCY. 1993
9000.0 ...".----.,----:-----:----------,
8500.0
1988 1989 1990 1991 1992 1993
Source: Table 17.
Source: Table 18.
STATUS OFFE'NSES
1.4%
TOTAL ARRESTS, 1993 By Adult and Juvenile
ADULT
84.7%
TOTAL ARRESTS, 1993 By Level of Offense
MISDEMEANOR
64.7%
Source: Table 18. Note: Percents may not add to 100.0 because of independent rounding.
Total Arrests (continued)
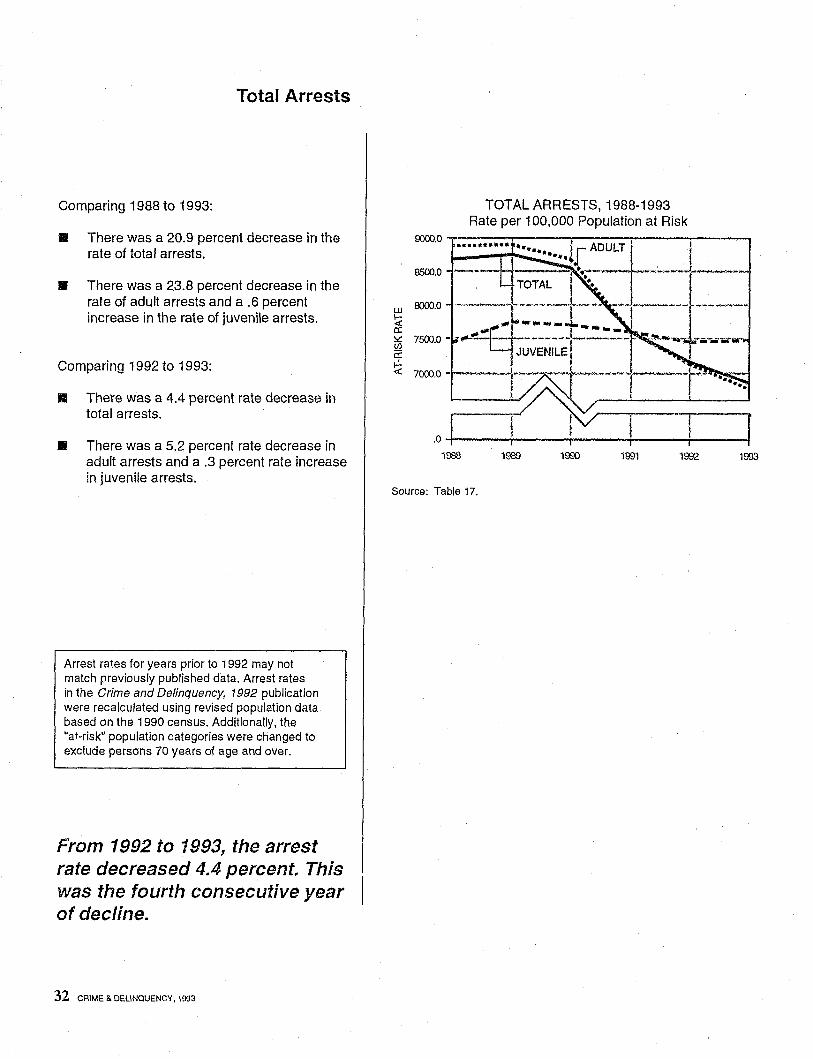
In 1993,
Of 1,667,522 arrests reported:
III Adult arrests accounted for 84.7 percent (1,412,431 ).
.. Juvenile arrests accounted for 15.3 percent (255,091 ).
And,
II Felony arrests accounted for 33.8 percent (564,307).
• Misdemeanor arrests accounted for 64.7 percent (1,079,136).
.. Status offense arrests accounted for 1 .4 percent (24,079).
Juvenile arrests as a proportion of total arrests increased from 12.0 percent in 1988 to 15.3 percent in 1993.
ARRESTS 33
Total Arrests (continued)
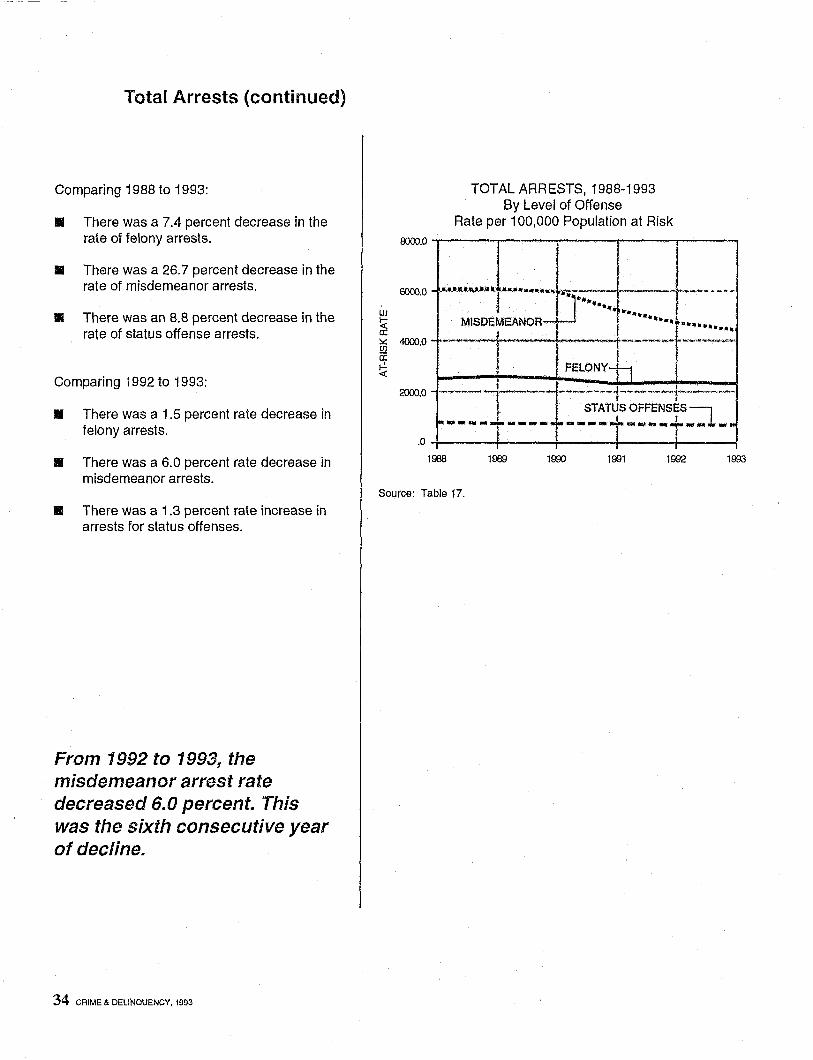
Comparing 1988 to 1993:
• There was a 7.4 percent decrease in the rate of felony arrests.
,. There was a 26.7 percent decrease in the rate of misdemeanor arrests.
,. There was an 8.8 percent decrease in the rate of status offense arrests.
Comparing 1992 to 1993:
• There was a 1.5 percent rate decrease in felony arrests.
• There was a 6.0 percent rate decrease in misdemeanor arrests.
• There was a 1.3 percent rate increase in arrests for status offenses.
From 1992 to 1993, the misdemeanor arrest rate decreased 6.0 percent. This was the sixth consecutive year of decline.
34 CRIME & DEllNQUENCY. 1993
0000.0
6000.0
w ~ a: :>::: U)
4000.0
a: r!-<:
2000.0
.0
TOTAL ARRESTS, 1988-1993 By Level of Offense
Rate per 100,000 Population at Risk
,... .. ~ .. ~.--.~ l--------.. jJ .. -. 1 J - ••• _ MISDEMEANOR .".... • •••••
------"·I-····-·tEL~:~~--- --:= -"----~ .. +_ .. _---- ----'-.--~+-"~--'.'.-~
I ..t. STATUS OFFENSES::1 1- ... _ .... ..,..-_..... --_ .. t ........... + ....... .", ..
i t I I
1988 1989 1990 1991 1992 1993
Source: Table 17.
w r-« a: ~ en a: ~ «
4000.0
FELONY ARRESTS, 1988-1993 Rate per 100,000 Population at Risk
r JUVENILE TOTAL-3000.0 . .J ..... ... ---- 1------ -....... IW- ........
~"""" "'""
2000.0
1000.0 -
.0
1988
ADULT-
f
I 1989 1990
·1···· •••• ifl.·a •• ...
I I ! ,
1991 1992 1993
Source: Table 17.
Felony Arrests
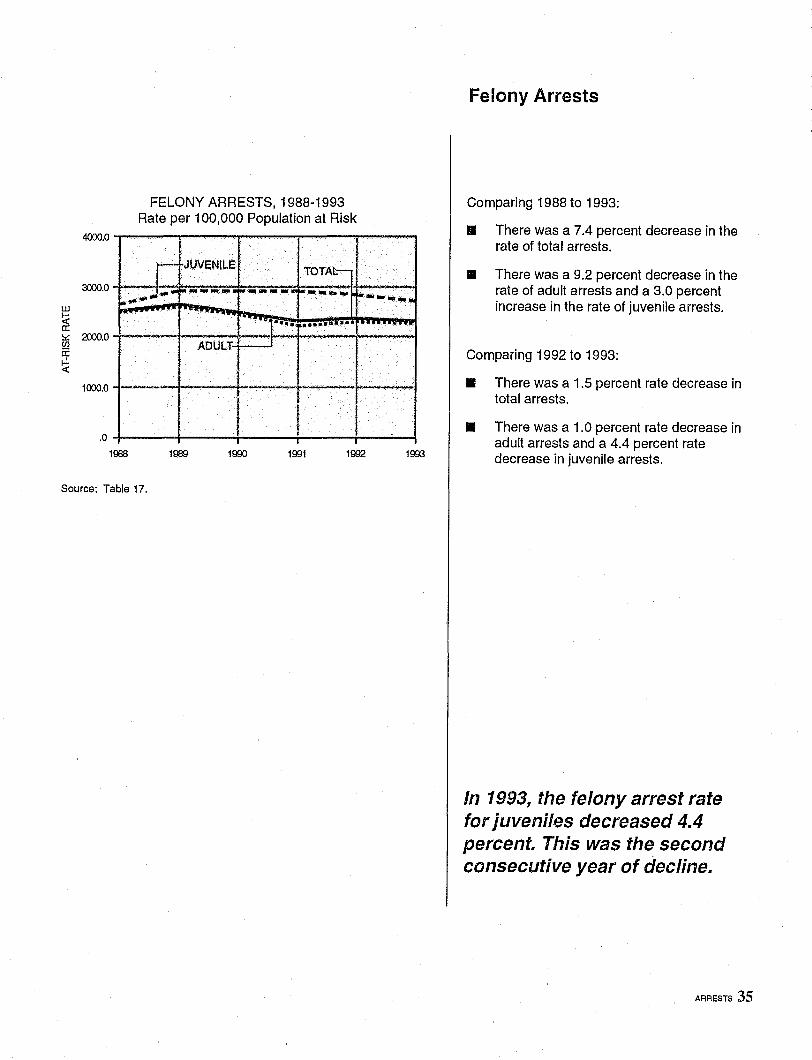
Comparing 1988 to 1993:
• There was a 7.4 percent decrease in the rate of total arrests.
• There was a 9.2 percent decrease in the rate of adult arrests and a 3.0 percent increase in the rate of juvenile arrests.
Comparing 1992 to 1993:
• There was a 1.5 percent rate decrease in total arrests.
• There was a 1.0 percent rate decrease in adult arrests and a 4.4 percent rate decrease in juvenile arrests.
In 1993, the felony arrest rate for juveniles decreased 4.4 percent. This was the second consecutive year of decline.
ARRESTS 35
Felony Arrests (continued)
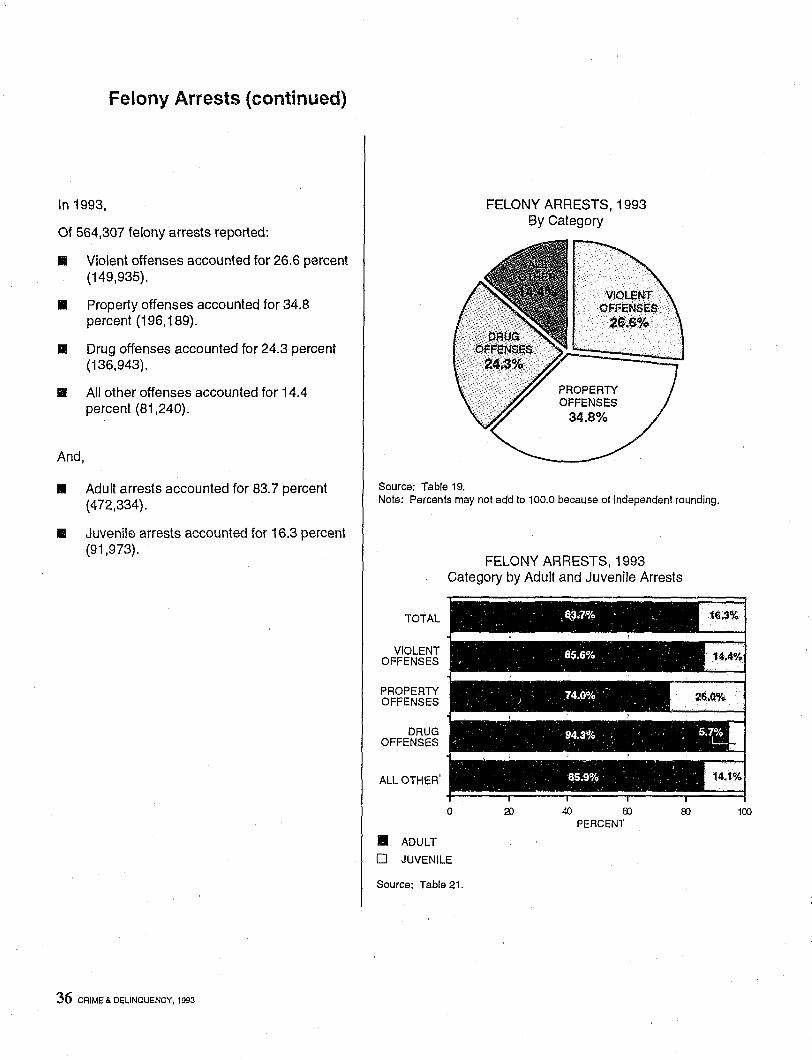
In 1993,
Of 564,307 felony arrests reported:
• Violent offenses accounted for 26.6 percent (149,935).
• Property offenses accounted for 34.8 percent (196,189).
II Drug offenses accounted for 24.3 percent (136.943).
• All other offenses accounted for 14.4 percent (81,240).
And,
• Adult arrests accounted for 83.7 percent (472,334).
• Juvenile arrests accounted for 16.3 percent (91,973).
36 CRIME & DELINQUENCY, 1993
Source: Table 19.
FELONY ARRESTS, 1993 By Category
PROPERTY OFFENSES
34.8%
Note: Percents may not add to 100.0 because of independent rounding.
FELONY ARRESTS, 1993 Category by Adult and Juvenile Arrests
TOTAL
VIOLENT OFFENSES
PROPERTY OFFENSES
DRUG OFFENSES
ALL OTHER'
o
• ADULT o JUVENILE
Source: Table 21.
40 SJ 00 PERCENT
100
FELONY ARRESTS FOR VIOLENT OFFENSES, 1988-1993
Rate per 100,000 Population at Risk 700.0...,.....----.,..---....----....--..---r"'----;
400.0
.0 +----+-i AV--+-i -i----i--i ---l 1988 1989 1990 1991 1992 1993
Source: Table 22.
Arrests for Violent Offenses
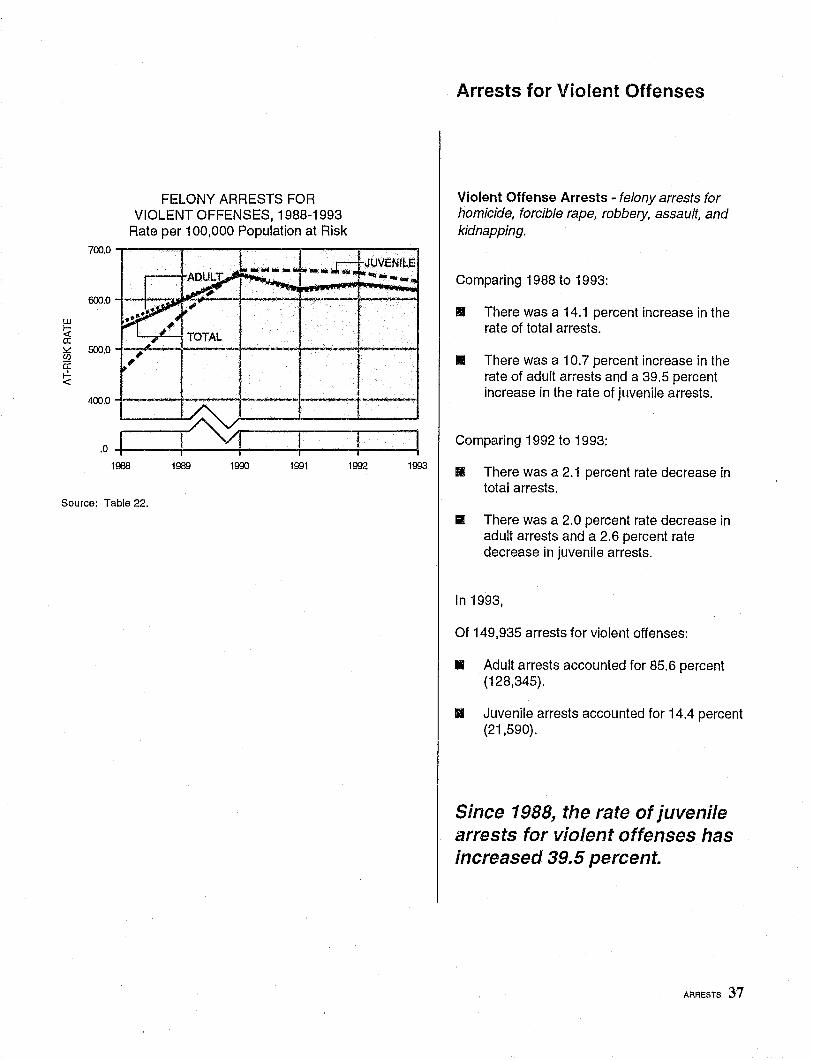
Violent Offense Arrests - felony arrests for homicide, forcible rape, robbery, assault, and kidnapping.
Comparing 1988 to 1993:
II There was a 14.1 percent increase in the rate of total arrests.
1/ There was a 10.7 percent increase in the rate of adult arrests and a 39.5 percent increase in the rate of juvenile arrests.
Comparing 1992 to 1993:
III There was a 2.1 percent rate decrease in total arrests.
• There was a 2.0 percent rate decrease in adult arrests and a 2.6 percent rate decrease in juvenile arrests.
In 1993,
Of 149,935 arrests for violent offenses:
1/ Adult arrests accounted for 85.6 percent (128,345).
III Juvenile arrests accounted for 14.4 percent (21,590).
Since 1988, the rate of juvenile arrests for violent offenses has increased 39.5 percent.
ARRESTS 37
Arrests for Violent Offenses (continued)
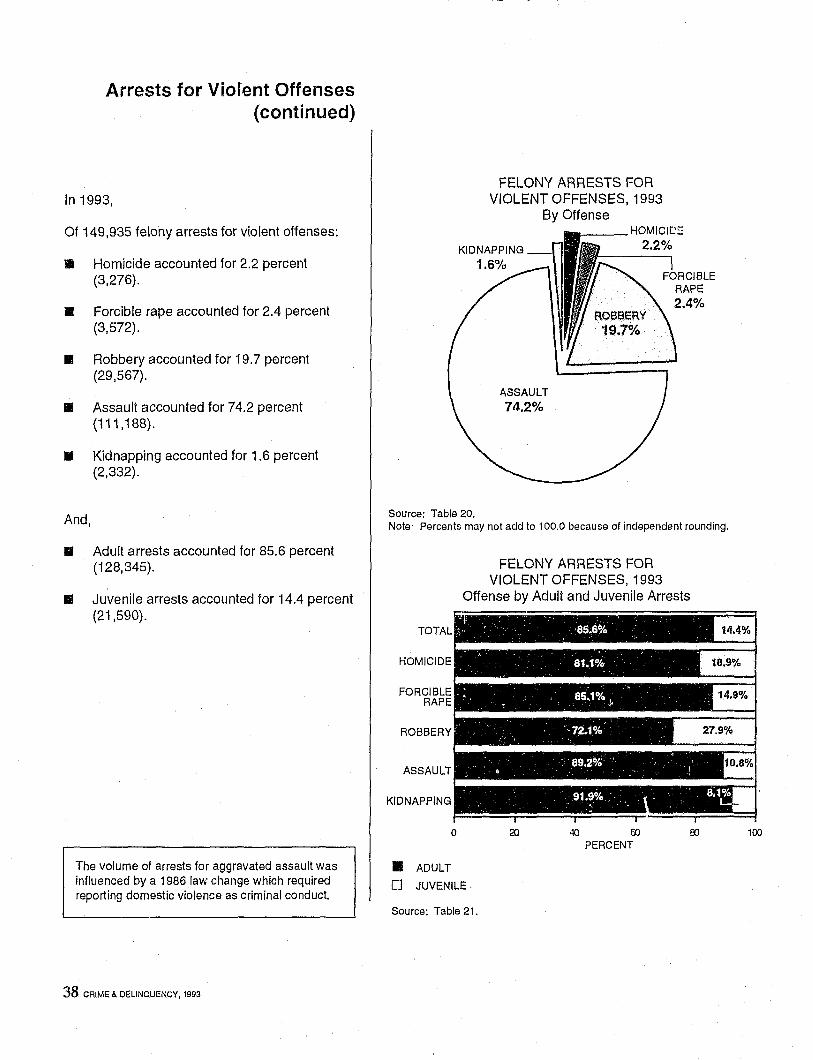
In 1993,
Of 149,935 felony arrests for violent offenses:
II Homicide accounted for 2.2 percent (3,276).
• Forcible rape accounted for 2.4 percent (3,572).
• Robbery accounted for 19.7 percent (29,567).
II Assault accounted for 74.2 percent (111,188).
• Kidnapping accounted for 1.6 percent (2,332).
And,
.. Adult arrests accounted for 85.6 percent (128,345).
• Juvenile arrests accounted for 14.4 percent (21,590).
The volume of arrests for aggravated assault was influenced by a 1986 law change which required reporting domestic violence as criminal conduct.
38 CRIME &. DElINQUENCY. 1993
Source: Table 20.
FELONY ARRESTS FOR VIOLENT OFFENSES, 1993
By Offense
ASSAULT
74.2%
Note' Percents may not add to 100.0 because of independent rounding.
o
• ADULT
FELONY ARRESTS FOR VIOLENT OFFENSES, 1993
Offense by Adult and Juvenile Arrests
40 00 00 PERCENT
[J JUVENILE
Source: Table 21.
100
---------
25.0
20.0
w ~ 15.0 ex: ~ en 0:
10.0 ~
5.0
FELONY ARRESTS FOR HOMICIDE, 1988-1993
Rate per 100,000 Population at Risk
.o+------+----~~----~----_+----~
1008 1989 1990 1991 1992 1993
Source: Table 22.
Homicide Arrests
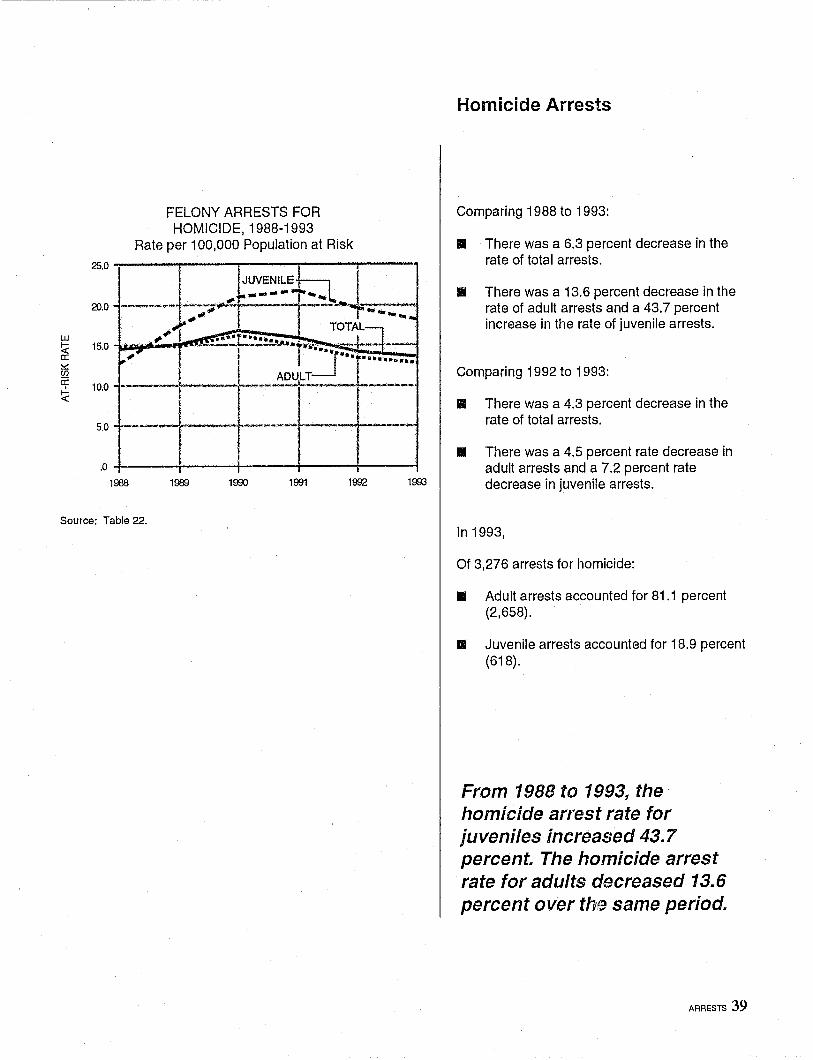
Comparing 1988 to 1993:
• There was a 6.3 percent decrease in the rate of total arrests.
III There was a 13.6 percent decrease in the rate of adult arrests and a 43.7 percent increase in the rate of juvenile arrests.
Comparing 1992 to 1993:
II There was a 4.3 percent decrease in the rate of total arrests.
• There was a 4.5 percent rate decrease in adult arrests and a 7.2 percent rate decrease in juvenile arrests.
In 1993,
Of 3,276 arrests for homicide:
• Adult arrests accounted for 81.1 percent (2,658).
II Juvenile arrests accounted for 18.9 percent (618).
From 1988 to 1993, the homicide arrest rate for juveniles increased 43.7 percent. The homicide arrest rate for adults decreased 13.6 percent over thl~ same period.
ARRESTS 39
--~-.-------.. -----.-- - -
Forcible Rape Arrests
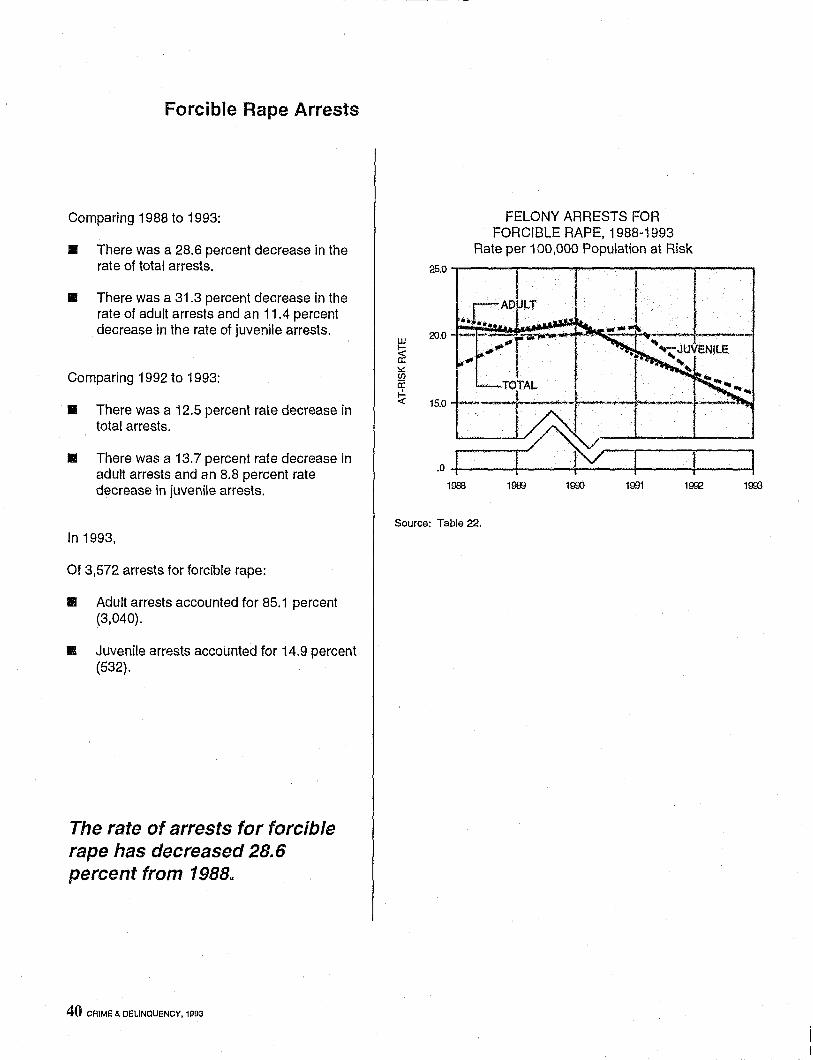
Comparing 1988 to 1993:
• There was a 28.6 percent decrease in the rate of total arrests.
• There was a 31.3 percent decrease in the rate of adult arrests and an 11.4 percent decrease in the rate of juvenile arrests.
Comparing 1992 to 1993:
• There was a 12.5 percent rate decrease in total arrests.
• There was a 13.7 percent rate decrease in adult arrests and an 8.8 percent rate decrease in juvenile arrests.
In 1993,
Of 3,572 arrests for forcible rape:
II Adult arrests accounted for 85.1 percent (3,040).
II! Juvenile arrests accounted for 14.9 percent (532).
The rate of arrests for forcible rape has decreased 28.6 percent from 1988.
40 CRIME & DELINOUENCY, 1993
FELONY ARRESTS FOR FORCIBLE RAPE, 1988-1993
Rate per 100,000 Population at Risk
25.0 -.---.....,..., ----...-------~----.
UJ
~ ~ en a: J-!.
20.0
<t: 15.0
... CADULT
1988 1900
Source: Table 22.
1900 1991 1900
:IDa.0
200.0
100.0
.0
FELONY ARRESTS FOR ROBBERY, 1988-1993
Rate per 100,000 Population at Risk
, l~~:':'~~:J __ L ___ . , .. .... -1-------
" .. ' ~' TOTAL-Cl ----- ....... " ... •••• ~ ••••• L_ ••• ,.. ~~ "'." ..... ~ ••••• _liIfII;=:.. ______ II •••
ADULT- ---.J--
1988 1989 1990 1991 1992 1993
Source: Table 22.
Robbery Arrests
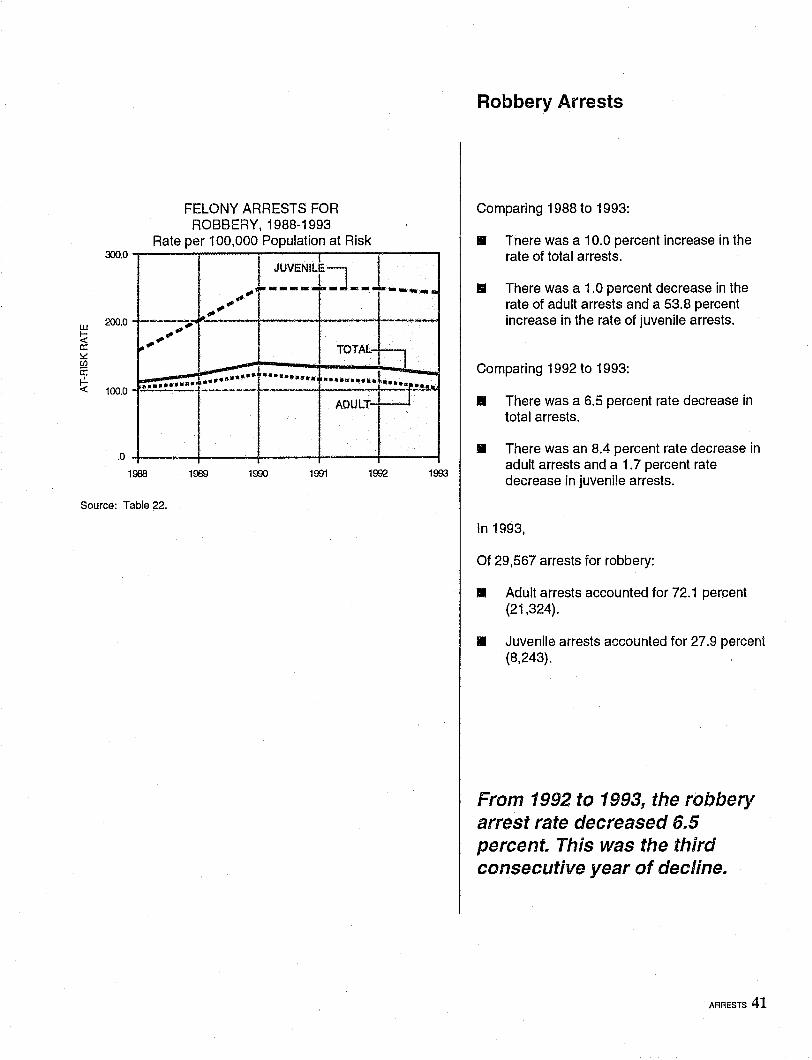
Comparing 1988 to 1993:
• There was a 10.0 percent increase in the rate of total arrests.
• There was a 1.0 percent decrease in the rate of adult arrests and a 53.8 percent increase in the rate of juvenile arrests.
Comparing 1992 to 1993:
• There was a 6.5 percent rate decrease in total arrests.
.. There was an 8.4 percent rate decrease in adult arrests and a 1.7 percent rate decrease in juvenile arrests.
In 1993,
Of 29,567 arrests for robbery:
• Adult arrests accounted for 72.1 percent (21,324).
II Juvenile arrests accounted for 27.9 percent (8,243).
From 1992 to 1993, the robbery arrest rate decreased 6.5 percent. This was the third consecutive year of decline.
ARRESTS 41
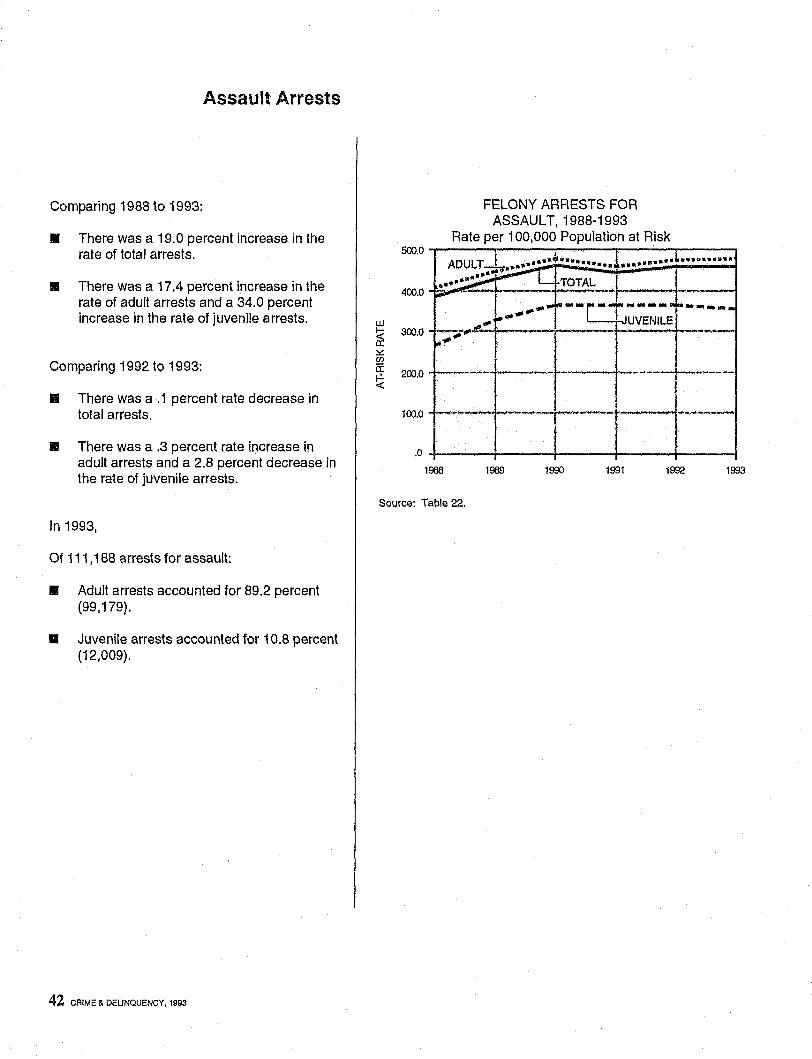
Assault Arrests
Comparing 1988 to 1993:
II There was a 19.0 percent increase in the rate of total arrests.
• There was a 17.4 percent increase in the rate of adult arrests and a 34.0 percent increase in the rate of juvenile arrests.
Comparing 1992 to 1993:
II There was a .1 percent rate decrease in total arrests.
II There was a .3 percent rate increase in adult arrests and a 2.8 percent decrease in the rate of juvenile arrests.
In 1993.
Of 111,188 arrests for assault:
• Adult arrests accounted for 89.2 percent (99,179).
• Juvenile arrests accounted for 10.8 percent (12,009).
42 CRIME & DELINQUENCY, 1993
w
~ !>::: en
FELONY ARRESTS FOR ASSAULT, 1988-1993
Rate per 100,000 Population at Risk 500.0 .,.....-----:~----:----_r_--__r---....,
400.0 ~JI1IIIIlr.:;;;.. ........ f.----+--- 1----+-
300.0
a: r.!. 200.0 «
100.0 .i-----t-.------
.0 4-------~----_+-----~----~------~ 1988 1989 1990 1991 1992 1993
Source: Table 22.
UJ
~ ~ en a: f-!. '<
15.0
12.0
9.0
6.0
3.0
.0
-
FELONY ARRESTS FOR KIDNAPPING, 1988-1993
Rate per 100,000 Population at Risk
r-ADULT 1-•••• ~J •••• ~ •••••• c~ .;-.... .-...... ....... . -.. " _ .... """
'I~ . - ~ -" TOTAL - joO"'" -
- f-;---- ~~1"r-'lIr.. ... - ---+---":'~ ... -.......... ",-""
... "" ... ~ ~~ I-' JUVENILE ... ~ ...... ~ I
-f----- -----_ .....
1988 1989 1990 1991 1992 1993
Source: Table 22.
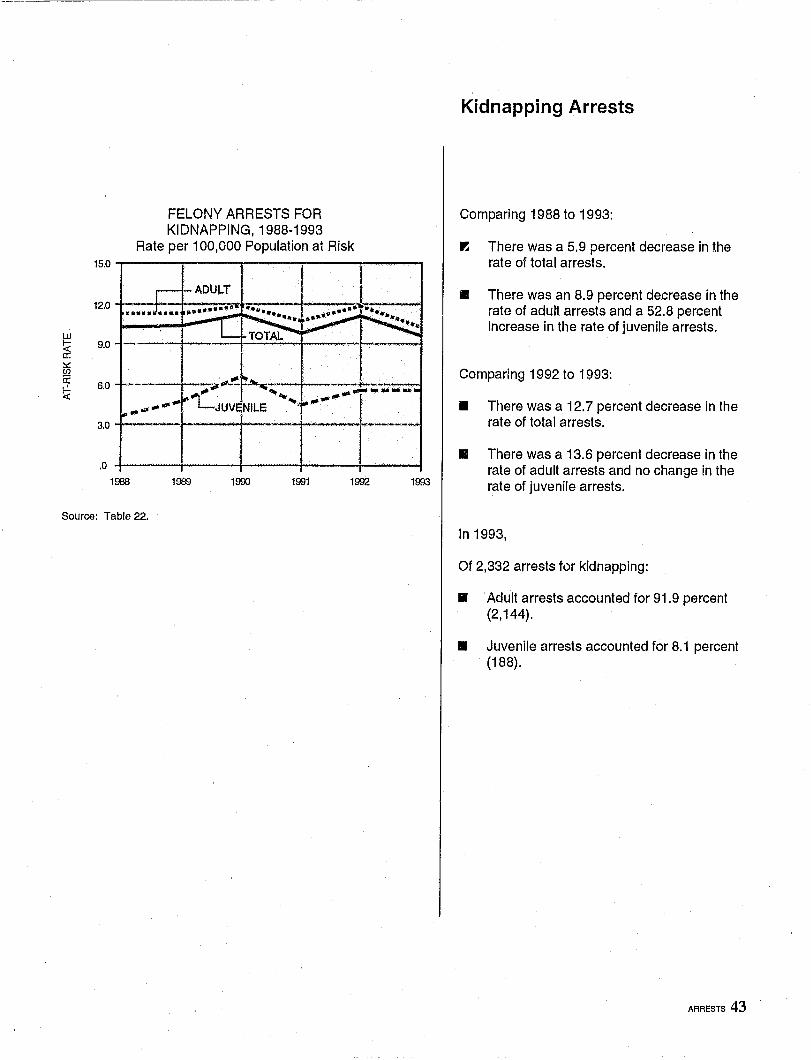
Kidnapping Arrests
Comparing 1988 to 1993:
I'!I There was a 5.9 percent decrease in the rate of total arrests.
• There was an 8.9 percent decrease in the rate of adult arrests and a 52.8 percent increase in the rate of juvenile arrests.
Comparing 1992 to 1993:
• There was a 12.7 percent decrease in the rate of total arrests.
• There was a 13.6 percent decrease in the rate of adult arrests and no change in the rate of juvenile arrests.
In 1993,
Of 2,332 arrests for kidnapping:
• Adult arrests accounted for 91.9 percent (2,144).
• Juvenile arrests accounted for 8.1 percent (188).
ARRESTS 43
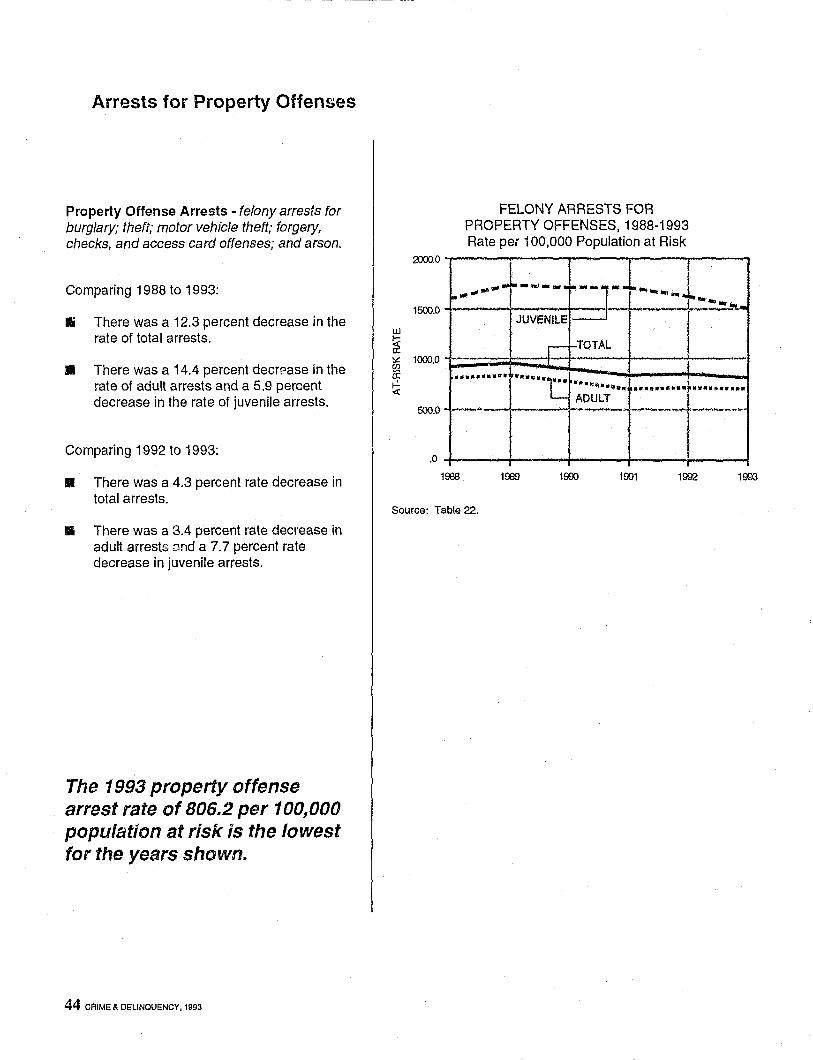
Arrests for Property Offenses
Property Ofiense Arrests - felony arrests for burglary; theN; motor vehicle theft; forgery, checks, and access card offenses; and arson.
Comparing 1988 to 1993:
Ii There was a 12.3 percent decrease in the rate of total arrests.
• There was a 14.4 percent decT?ase in the rate of adult arrests and a 5.9 percent decrease in the rate of juvenile arrests.
Comparing 1992 to 1993:
• There was a 4.3 percent rate decrease in total arrests.
III There was a 3.4 percent rate decrease in adult arrests ~nd a 7.7 percent rate decrease in juvenile arrests.
The 1993 property offense arrest rate of 806.2 per 100,000 population at risk is the lowest for the years shown.
44 CAl ME & DELINQUENCY, 1993
2000.0
1500.0
LU
~ ~ en 1000.0
c: ~
500.0
.0
FELONY ARRESTS FOR PROPERTY OFFENSES, 1988-1993 Rate per 100,000 Population at Risk
I ........ 1-."" ...... 1-· ... 1 ... · "" .......... .1. p.o- • t,:.:,.!:~-· JUVENILE I=::J
r f-TGTAL l ----•••••••• u • • ~ •••• ~ ,
I 1 ... ··.c ...... ··········t··········
___ 1--_ ~OU~T_
-------r-~---I I
1988 1969 1990 1991 1992 1993
Source: Table 22.
FELONY ARRESTS FOR PROPERTY OFFENSES, 1993
By Offense
T - - - - - .- ---~ - --~ ARSON
1.1% I
FORGERY, CHECKS, ACCESS CARDS 7.8%
Source: Table 20.
BURGLARY 38.0%
FELONY ARRESTS FOR PROPERTY OFFENSES, 1993
Offense by Adult and Juvenile Arrests
TOTAL
BURGLARY
THEFT
MOTOR VEHICLE
THEFT FORGERY,
CHECKS, ACCESS CARDS
ARSON
.. ADULT o JUVENILE
Source: Table 21.
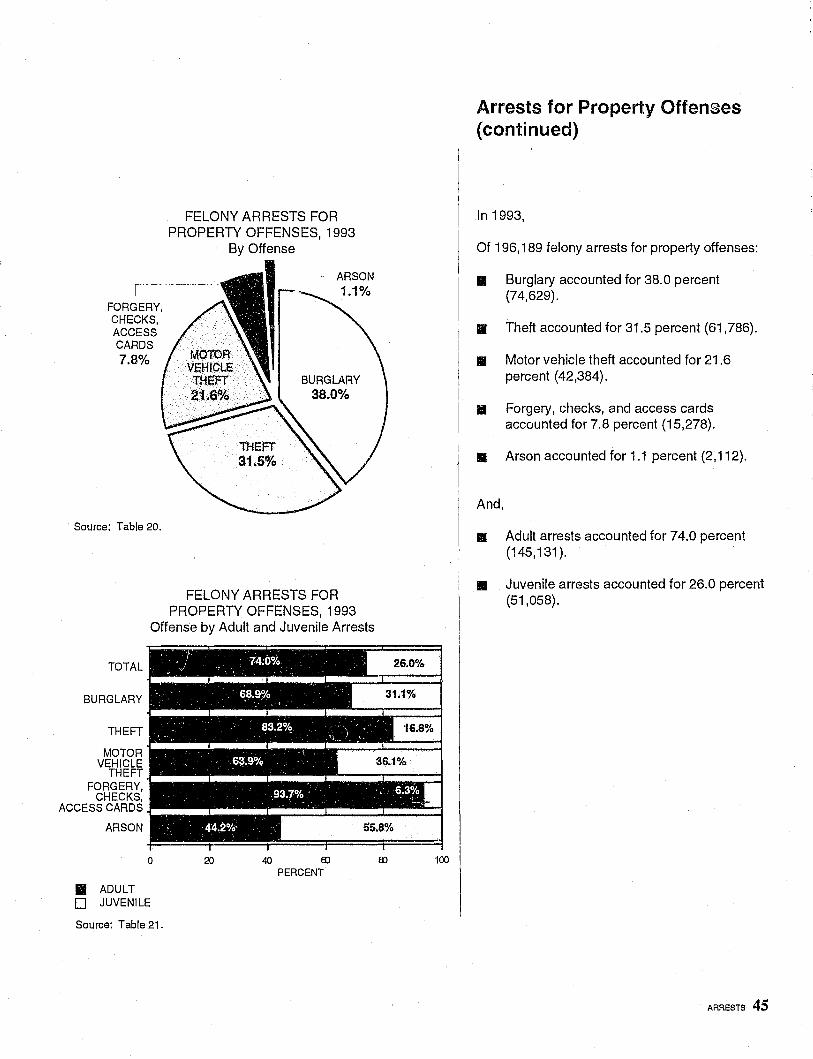
Arrests for Property Offenses (continued)
In 1993,
Of 196,189 felony arrests for property offenses:
• Burglary accounted for 38.0 percent {74,629}.
II Theft accounted for 31.5 percent {61,786}.
II Motor vehicle theft accounted for 21.6 percent (42,384).
iii Forgery, checks, and access cards accounted for 7.8 percent {15,278}.
III Arson accounted for 1.1 percent {2,112}.
And,
• Adult arrests accounted for 74.0 percent (145,131).
II Juvenile arrests accounted for 26.0 percent (51,058).
ARRESTS 45
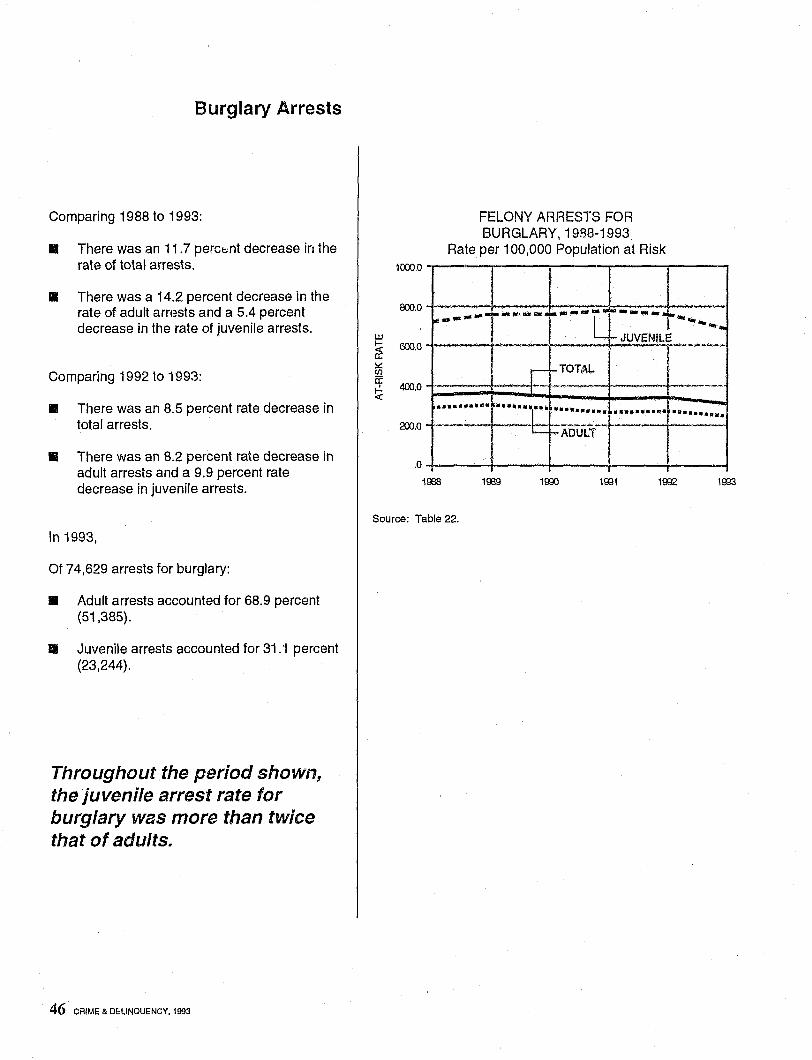
Burglary Arrests
Comparing 1988 to 1993:
• There was an 11 ,7 perct:.:nt decrease in the rate of total arrests,
• There was a 14,2 percent decrease in the rate of adult armsts and a 5.4 percent decrease in the rate of juvenile arrests,
Comparing 1992 to 1993:
• There was an 8,5 percent rate decrease in total arrests,
• There was an 8,2 percent rate decrease in adult arrests and a 9,9 percent rate decrease in juvenile arrests.
In 1993,
Of 74,629 arrests for burglary:
• Adult arrests accounted for 68,9 percent (51,385),
II Juvenile arrests accounted for 31,1 percent (23,244),
Throughout the period shown, the juvenile arrest rate for burglary was more than twice that of adults.
46 CRIME & DELINQUENCY, 1993
w
~ ~ en a: ~ «
FELONY ARRESTS FOR BURGLARY, 1988-1993
Rate per 100,000 Population at Risk 1000.0
800,0
600,0
,.. ... · ..... r-- ...... · ........ _ ... _ ..... ~ ... "lI •
...... - 1 ........ ,------ i- JUVE:NILE ___ ,~ ____
400,0 L r- TOTAL
-.... --- ..... -.-
200,0
........... ·"·····r· .. ··········r·········· ." ......... ----- 1--------- --~ --l..-!-ADULT
,0
1008 1009 11m 1001 1002 1933
Source: Table 22,
500.0
400.0
UJ I- 300.0 oct: a: ~ (j)
a: 200.0 ~
<:
100.0
.0
FELONY ARRESTS FOR THEFT, 1988-1993
Rate per 100,000 Population at Risk
J ~JUVENILE ~:'-';_"'iiii ...... I
r=-~TAL ...... r .... --. ~ ......... """"JIL.!.~~
..... ....... ~ I··~····· ADULT-=':'
p ....... --- ~"""-""'-
--fo------- ---------
!- .... -~""JI!
.... " .. ., ..
-----
1988 1989 1990 1991 1992 '1993
Source: Table 22.
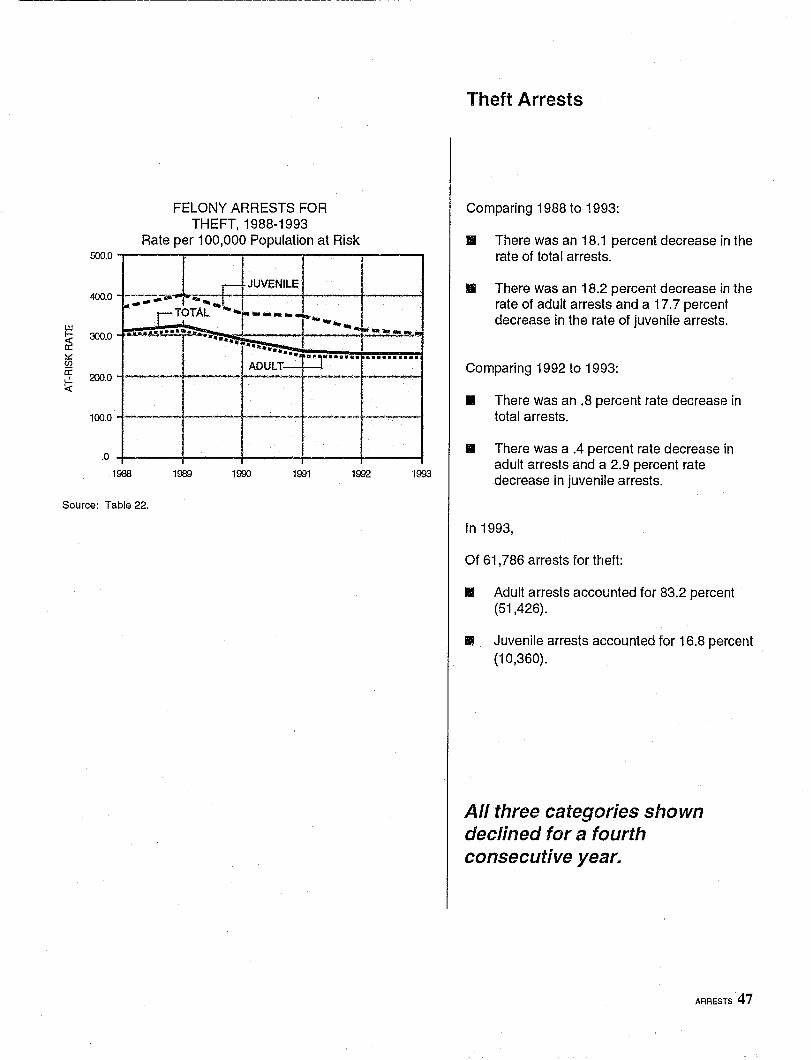
Theft Arrests
Comparing 1988 to 1993:
II There was an 18.1 percent decrease in the rate of total arrests.
.. There was an 18.2 percent decrease in the rate of adult arrests and a 17.7 percent decrease in the rate of juvenile arrests .
Comparing 1992 to 1993:
• There was an .8 percent rate decrease in total arrests.
.. There was a .4 percent rate decrease in adult arrests and a 2.9 percent rate decrease in juvenile arrests.
In 1993,
Of 61 ,786 arrests for theft:
• Adult arrests accounted for 83.2 percent (51,426).
II Juvenile arrests accounted for 16.8 percent (10,360).
All three categories shown declined for a fourth consecutive year.
ARRESTS 47
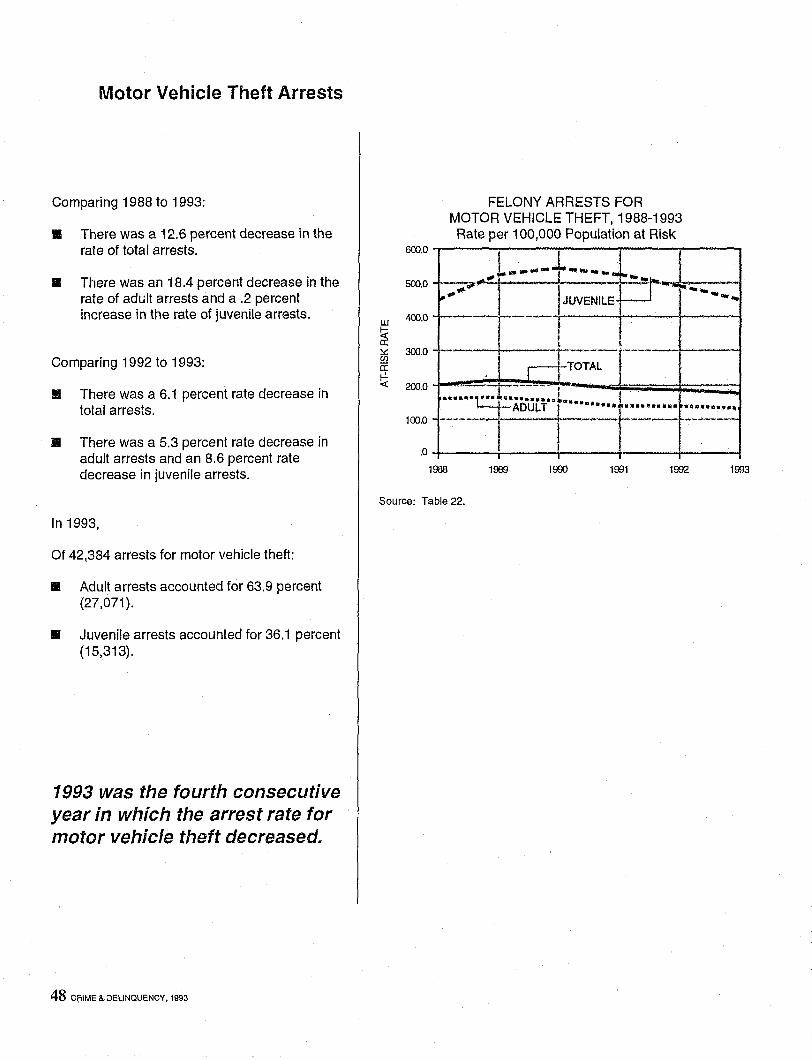
Motor Vehicle Theft Arrests
Comparing 1988 to 1993:
• There was a 12.6 percent decrease in the rate of total arrests.
• There was an 18.4 percent decrease in the rate of adult arrests and a .2 percent increase in the rate of juvenile arrests.
Comparing 1992 to 1993:
• There was a 6.1 percent rate decrease in total arrests.
• There was a 5.3 percent rate decrease in adult arrests and an 8.6 percent rate decrease in juvenile arrests.
In 1993,
Of 42,384 arrests for motor vehicle theft:
• Adult arrests accounted for 63.9 percent (27,071).
• Juvenile arrests accounted for 36.1 percent (15,313).
1993 was the fourth consecutive year in which the arrest rate for motor vehicle theft decreased.
48 CRIME & DELINQUENCY. 1993
600.0
500.0
w 400.0
~ ~ 300.0 en c: ~ -< 200.0
100.0
.0
FELONY ARRESTS FOR MOTOR VEHICLE THEFT, 1988-1993
Rate per 100,000 Population at Risk
_~~L~---+-----b~~ -L-_ .~~ ____ jUVENILE~-----
__ __~ _____ L ___ . J ctTOTAL "'-'-------
...... '.a·t······.· .. t t ADUL.T C·· ........ ·········· • •••••• 11 •• -------- I I· .------ --------
, 1988 1989 1900 1991 1992 1993
Source: Table 22.
llJ
~ ~ UJ if. ~ <C
80.0
60.0
40.0
20.0
FELONY ARRESTS FOR FORGERY,CHECK,AND
ACCESS CARD OFFENSES, 1988-1993 Rate per 100,000 Population at Risk
I
r ADULT •••• 11.
-~ .. .... -----....•.•..• •••••• !I.!.:. ~
....... ~ 1·········.
LTOTAL
rtUVENILE r --~
............ ----"'4-- ... -.. .. _-- .... - ... - ... I ---1---------
.0
1988
L 1989 1990
I 1991 1992 1993
Source: Table 22.
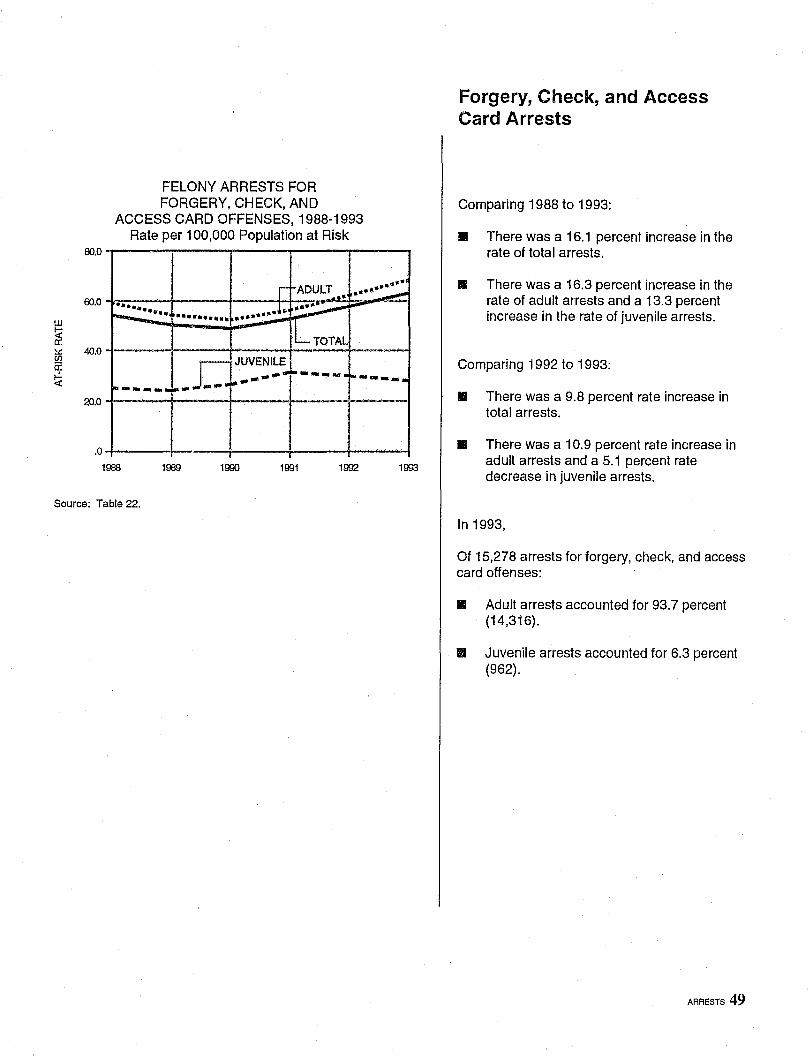
Forgery, Check, and Access Card Arrests
Comparing 1988 to 1993:
II There was a 16.1 percent increase in the rate of total arrests.
II There was a 16.3 percent increase in the rate of adult arrests and a 13.3 percent increase in the rate of juvenile arrests.
Comparing 1992 to 1993:
.. There was a 9.8 percent rate increase in total arrests.
II There was a 10.9 percent rate increase in adult arrests and a 5.1 percent rate decrease in juvenile arrests.
In 1993,
Of 15,278 arrests for forgery, check, and access card offenses:
.. Adult arrests accounted for 93.7 percent (14,316).
II Juvenile arrests accounted for 6.3 percent (962).
ARRESTS 49

Arson Arrests
Comparing 1988 to 1993:
• There was a 3.3 percent decrease in the rate of total arrests.
!!II There was a 23.7 percent decrease in the rate of adult arrests and a 23.6 percent increase in the rate of juvenile arrests.
Comparing 1992 to 1993:
.. There was a 1.1 percent rate decrease in total arrests.
• There was an 11.8 percent rate decrease in adult arrests and a 7.1 percent rate increase in juvenile arrests.
In 1993,
Of 2,112 arrests for arson:
.. Adult arrests accounted for 44.2 percent (933).
• Juvenile arrests accounted for 55.8 percent (1,179).
50 CRIME & DELINQUENCY. 1993
40.0
30.0
w
~ :.::: 20.0 (f)
a: r!-<C
10.0
.0
FELONY ARRESTS FOR ARSON,1988-1993
Rate per 100,000 Population at Risk
'11>'" !- ...... .. ...... 1~ .. -.. -~ .... ..,.'~ --ej~ENi~- .... -1--------
- .------- -______ 1.-_______ --_ ..... _- --.---------
I I-TOTAL
_·········t··CD
•• 1t:: ···~·"····t·········· ,. .•.•...•. I-ADULT ., I
1988 1989 1990 1991 1992 1003
Source: Table 22.
llJ
~ a: l.:: en a: f-!. <I:
1000.0
800.0
600.0
400.0
200.0
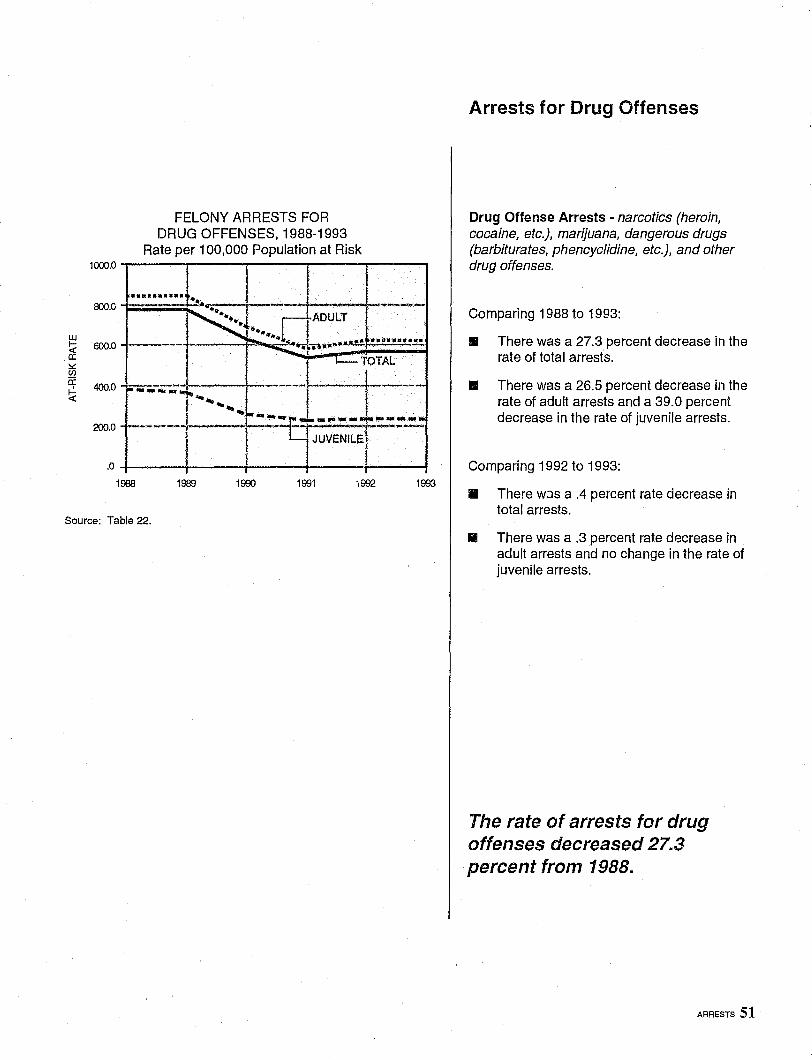
FELONY ARRESTS FOR DRUG OFFENSES, 1988-1993
Rate per 100,000 Population at Risk
.......•.• -" -~
---- ----,-••
••••• ~LT ". ;..,.. 1\1 0$'..- .... J! .. •• ~ ••••• ~. .' ." I
TOTAL
~---,;;;';;"~ . ~----~-I ...... I ..... :-_______ } •• ~ ~ ... ~ .... 1'" ... -.-- ... -----.- ..
JUVENILEr"'---
.0
1988
I I L
1989 1990 1991
I 1993
Source: Table 22.
Arrests for Drug Offenses
Drug Offense Arrests - narcotics (heroin, cocaine, etc.), marijuana, dangerous drugs (barbiturates, phencyclidine, etc.), and other drug offenses.
Comparing 1988 to 1993:
• There was a 27.3 percent decrease in the rate of total arrests.
.. There was a 26.5 percent decrease in the rate of adult arrests and a 39.0 percent decrease in the rate of juvenile arrests.
Comparing 1992 to 1993:
• There WJ.S a .4 percent rate decrease in total arrests.
II There was a .3 percent rate decrease in adult arrests and no change in the rate of juvenile arrests.
The rate of arrests for drug offenses decreased 27.3 percent from 1988.
ARRESTS S1
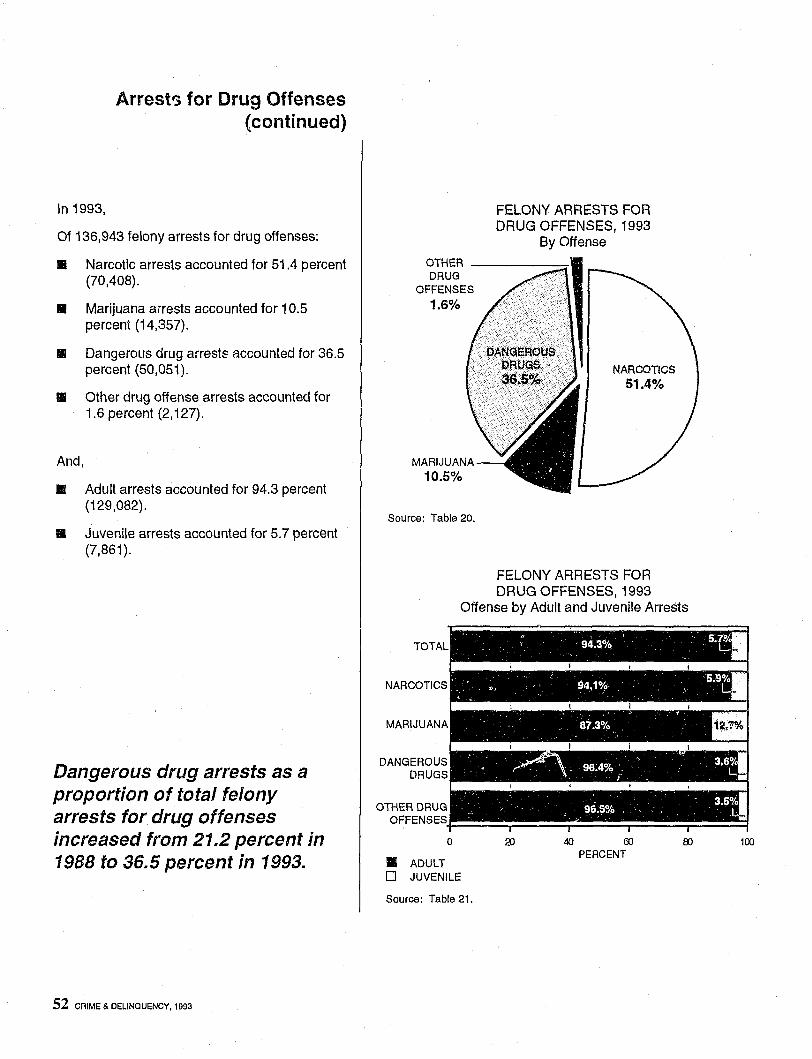
In 1993,
Arrestr.; for Drug Offenses (continued)
Of 136,943 felony arrests for drug offenses:
• Narcotic arrests accounted for 51.4 percent (70,408).
• Marijuana airests accounted for 10.5 percent (14,357).
II Dangerous drug arrest~ accounted for 36.5 percent (50,051).
.. Other drug offense arrests accounted for 1.6 percent (2,127).
FELONY ARRESTS FOR DRUG OFFENSES, 1993
By Offense OTHER ____ ---:-
DRUG OFFENSES
1.6%
NARCOTICS
51.4%
And, MARIJUANA
II Adult arrests accounted for 94.3 percent (129,082).
II Juvenile arrests accounted for 5.7 percent (7,861).
Dangerous drug arrests as a proportion of total felony arrests for drug offenses increased from 21.2 percent in 1988 to 36.5 percent in 1993.
52 CRIME & DELINQUENCY. 1993
10.5%
Source: Table 20.
FELONY ARRESTS FOR DRUG OFFENSES, 1993
Offense by Adult and Juvenile Arrests
• ADULT o JUVENILE
Source: Table 21.
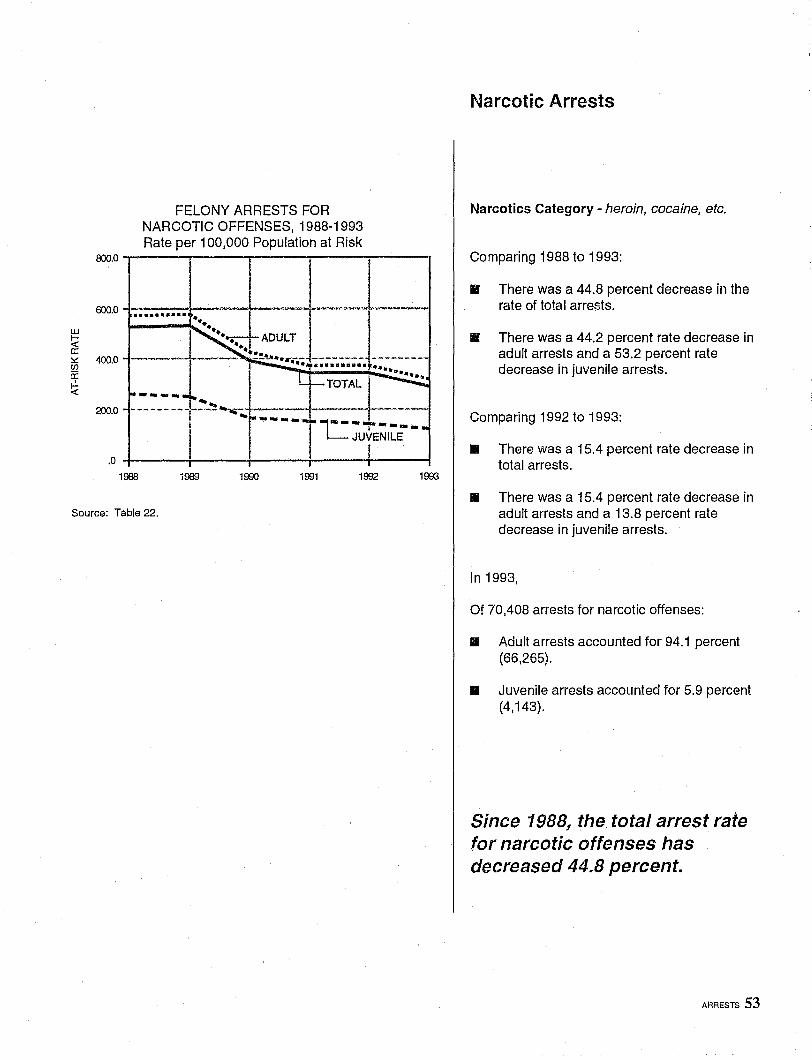
FELONY ARRESTS FOR NARCOTIC OFFENSES, 1988-1993 Rate per 100,000 Population at Risk
800.0 "T""----.---.....---~---_r_--~
600.0 1 ....••..•.•
400.0 ---·-f~~····~··l!:~~:, -------- --------•........... ~.-. ···.tao
=0 -.::.:--= ::'T~~"'~ -_ ;;-~ _ 1T:~A1 ___ _ I I JUVE~ILE" -
.0 ~-------;----~-----;-----+----; 1988 1989 1990 1991 1992 1993
Source: Table 22.
Narcotic Arrests
Narcotics Category - heroin, cocaine, etc.
Comparing 1988 to 1993:
II There was a 44.8 percent decrease in the rate of total arrests.
.. There was a 44.2 percent rate decrease in adult arrests and a 53.2 percent rate decrease in juvenile arrests.
Comparing 1992 to 1993:
• There was a 15.4 percent rate decrease in total arrests.
II There was a 15.4 percent rate decrease in adult arrests and a 13.8 percent rate decrease in juvenile arrests.
In 1993,
Of 70,408 arrests for narcotic offenses:
II Adult arrests accounted for 94.1 percent (66,265).
• Juvenile arrests accounted for 5.9 percent (4,143).
Since 1988, the total arrest rate for narcotic offenses has decreased 44.8 percent.
ARRESTS 53
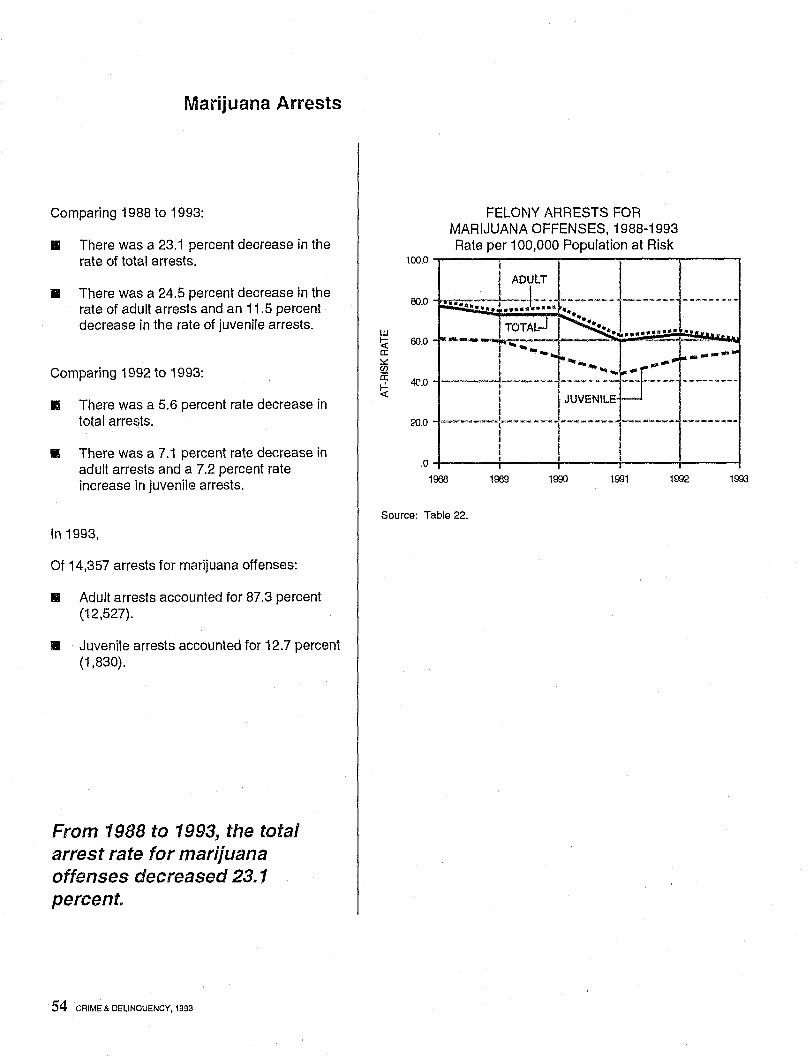
Marijuana Arrests
Comparing 1988 to 1993:
• There was a 23.1 percent decrease in the rate of total arrests.
• There was a 24.5 percent decrease in the rate of adult arrests and an 11.5 percent decrease in the rate of juvenile arrests.
Comparing 1992 to 1993:
JJ There was a 5.6 percent rate decrease in total arrests.
II There was a 7.1 percent rate decrease in adult arrests and a 7.2 percent rate increase in juvenile arrests.
In 1993,
Of 14,357 arrests for marijuana offenses:
II Adult arrests accounted for 87.3 percent (12,527).
!II Juvenile arrests accounted for 12.7 percent (1,830).
From 1988 to 1993, the total arrest rate for marijuana offenses decreased 23.1 percent.
54 CRIME & DELINQUENCY. 1993
FELONY ARRESTS FOR MARIJUANA OFFENSES, 1988-1993 Rate per 100,000 Population at Risk
100.0~----~------~----~------~----~
00.0
UJ ~ 60.0 a:: ~ CI)
0: f-!. 40.0 «
20.0
.-- ... ......
.O~-----;------+------;------+-----~
1988 1969 1990 1991 1992 1993
Source: Table 22.
FELONY ARRESTS FOR DANGEROUS DRUG OFFENSES, 1988-1993
Rate per 100,000 Population at Risk 250.0 ...,..---....,..---~---r-----r-----t
200.0 ~.~....... . ..•......
150.0
100.0
50.0 -- ... JUVENILE
.0 -1----1-;;..;;;..;.==-1----;----1----1 1988 1989 1990 1991 1992 1993
Source: Table 22.
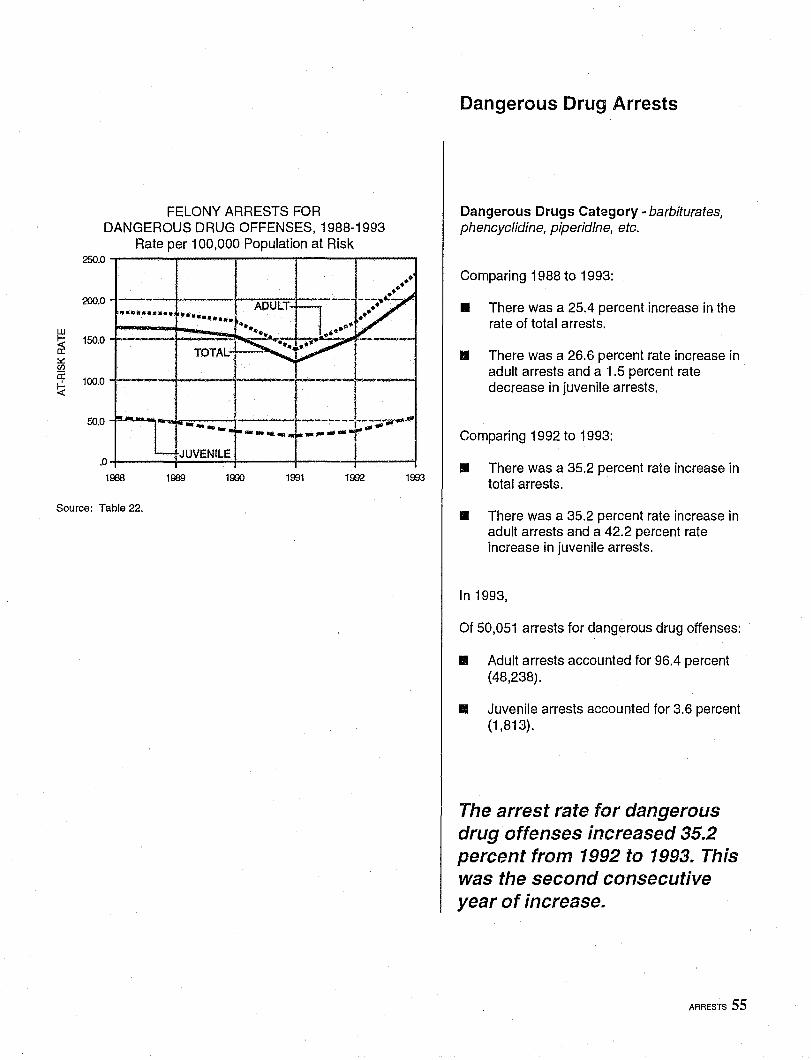
Dangerous Drug Arrests
Dangerous Drugs Category - barbiturates, phencyclidine, piperidine, etc.
Comparing 1988 to 1993:
.. There was a 25.4 percent increase in the rate of total arrests.
.. There was a 26.6 percent rate increase in adult arrests and a 1.5 percent rate decrease in juvenile arrests.
Comparing 1992 to 1993:
II There was a 35.2 percent rate increase in total arrests.
.. There was a 35.2 percent rate increase in adult arrests and a 42.2 percent rate increase in juvenile arrests.
In 1993,
Of 50,051 arrests for dangerous drug offenses:
.. Adult arrests accounted for 96.4 percent (48,238).
.. Juvenile arrests accounted for 3.6 percent (1,813).
The arrest rate for dangerous drug offenses increased 35.2 percent from 1992 to 1993. This was the second consecutive year of increase.
ARRESTS 55
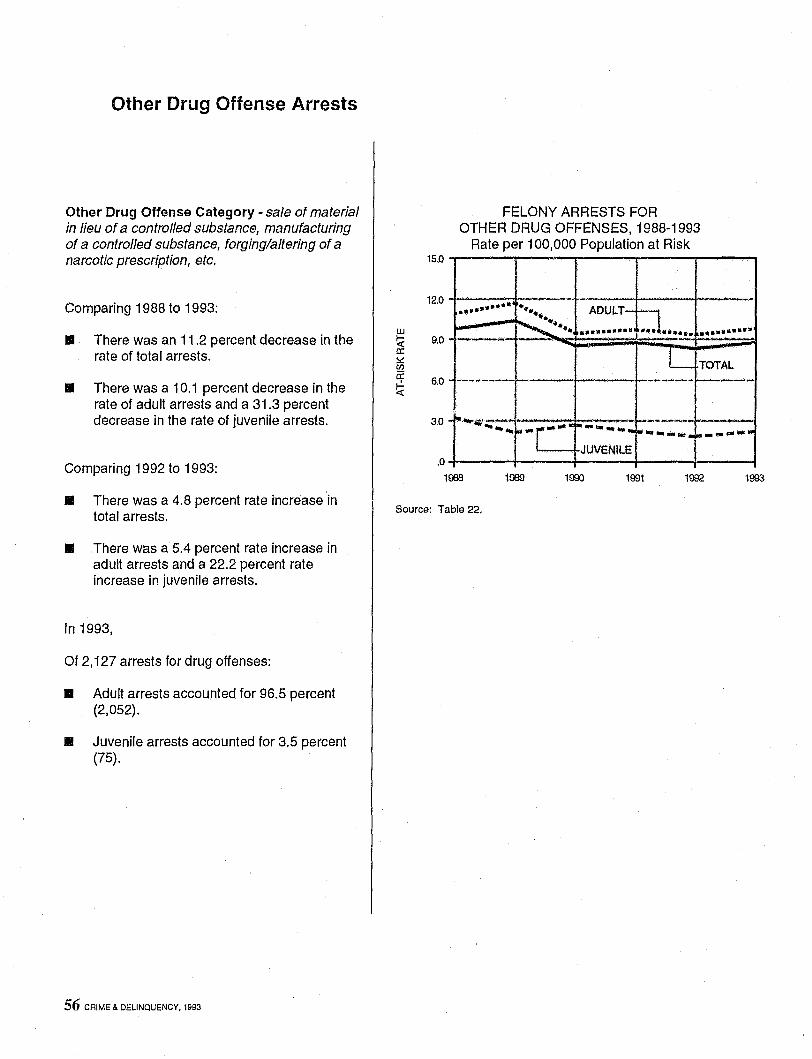
Other Drug Offense Arrests
Other Drug Offense Category - sale of material in lieu of a controlled substance, manufacturing of a controlled substance, forging/altering of a narcotic prescription, etc.
Comparing 1988 to 1993:
• There was an 11.2 percent decrease in the rate of total arrests.
• There was a 10.1 percent decrease in the rate of adult arrests and a 31.3 percent decrease in the rate of juvenile arrests.
Comparing 1992 to 1993:
• There was a 4.8 percent rate increase in total arrests.
• There was a 5A percent rate increase in adult arrests and a 22.2 percent rate increase in juvenile arrests.
In 1993,
Of 2,127 arrests for drug offenses:
• Adult arrests accounted for 96.5 percent (2,052).
• Juvenile arrests accounted for 3.5 percent (75).
56 CAIME & DELINQUENCY, 1993
UJ
~ a: ~ ~ a: ~
15.0
12.0
9.0
6.0
3.0
FELONY ARRESTS FOR OTHER DRUG OFFENSES, 1988-1993
Rate per 100,000 Population at Risk ~.
------ -- -........... ..... ADULT-r-J ...... •••• J-- ~.~. ." ......... !!! ....... ¥ ' .... -~
L TOTAL
-------- --------'~_"i',--","L
i"' ......... : ,..------- --......... r- ... r- ..... !ow- ... "" .. ~- .. ""- .. JUVENilE
.0
1968 i989 1990 1991 1992 1993
Source: Table 22.
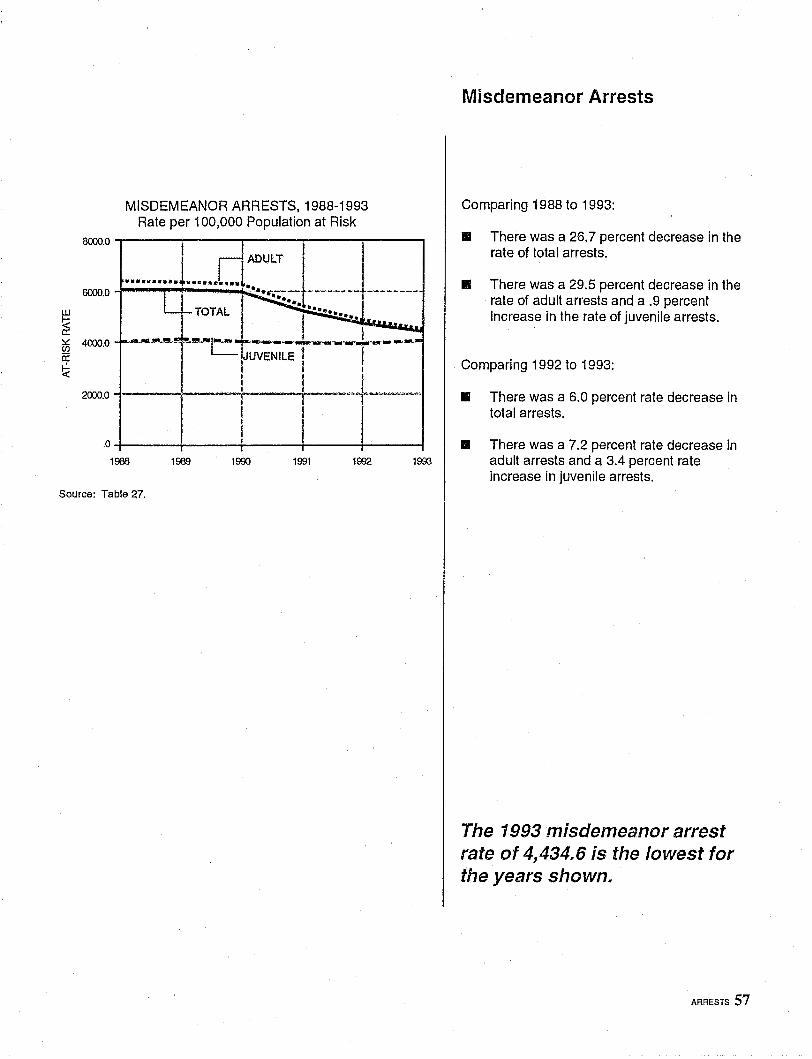
6000.0
llJ
~ ~ 4000.0 en a: f-!, ~
MISDEMEANOR ARRESTS, 1988-1993 Rate per 100,000 Population at Risk
1968 1989 1990 1991 1992
Source: Table 27.
1993
Misdemeanor Arrests
Comparing 1988 to 1993:
• There was a 26.7 percent decrease in the rate of total arrests.
• There was a 29.5 percent decrease in the rate of adult arrests and a .9 percent increase in the rate of juvenile arrests.
Comparing 1992 to 1993:
• There was a 6.0 percent rate decrease in total arrests.
• There was a 7.2 percent rate decrease in adult arrests and a 3.4 percent rate increase in juvenile arrests.
The 1993 misdemeanor arrest rate of 4,434.6 is the lowest for the years shown.
ARRESTS 57
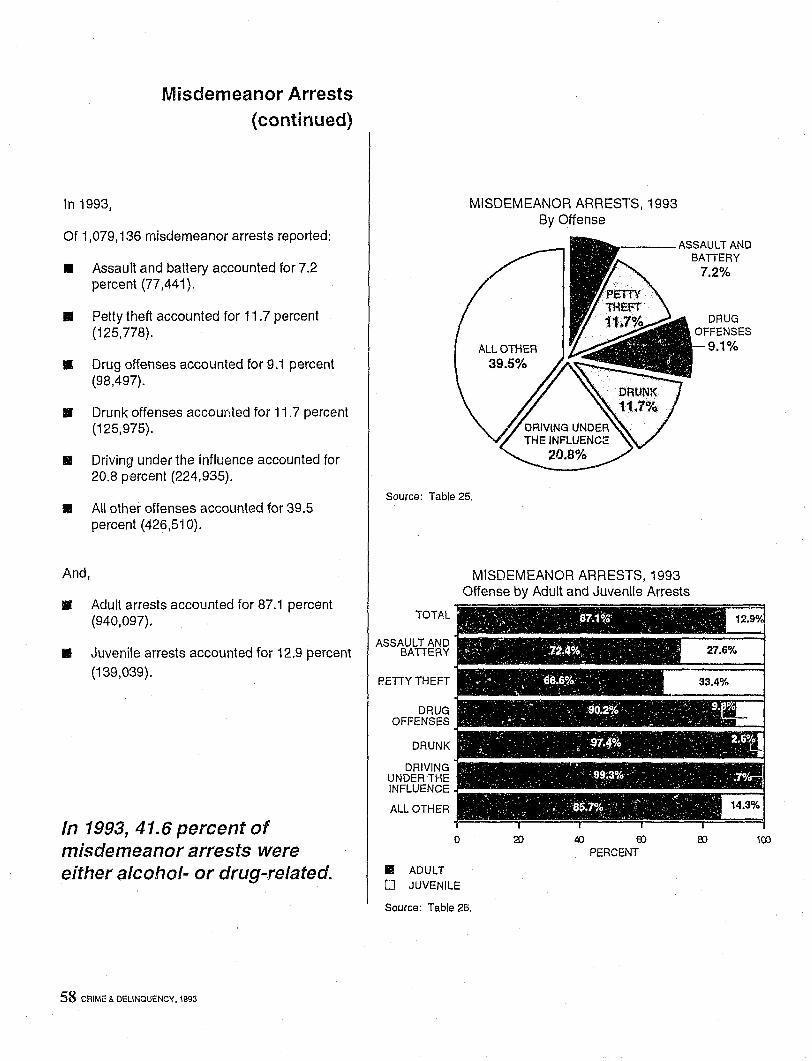
In 1993,
Misdemeanor Arrests ( continued)
Of 1,079,136 misdemeanor arrests reported:
III Assault and battery accounted for 7.2 percent (77,441).
III Petty theft accounted for 11.7 percent (125,778).
• Drug offenses accounted for 9.1 percent (98,497).
III Drunk offenses accounted for 11.7 percent (125,975).
• Driving under the influence accounted for 20.8 percent (224,935).
• All other offenses accounted for 39.5 percent (426,510).
And,
III Adult arrests accounted for 87.1 percent (940,097).
III Juvenile arrests accounted for 12.9 percent
(139,039).
In 1993, 41.6 percent of misdemeanor arrests were either alcohol- or drug-related.
58 CRIMG & DELINQUENCY, 1993
MISDEMEANOR ARRESTS, 1993 By Offense
.._---ASSAULT AND
ALL OTHER 39.5%
Source: Table 25.
TOTAL
ASSAULT AND BATTERY
PETTY THEFT
DRUG OFFENSES
DRUNK
DRIVING UNDER THE INFLUENCE
ALL OTHER
II ADULT o JUVENILE
MISDEMEANOR ARRESTS, 1993 Offense by Adult and Juvenile Arrests
Source: Table 26.
BATTERY 7.2%
DRUG OFFENSES
9.1%
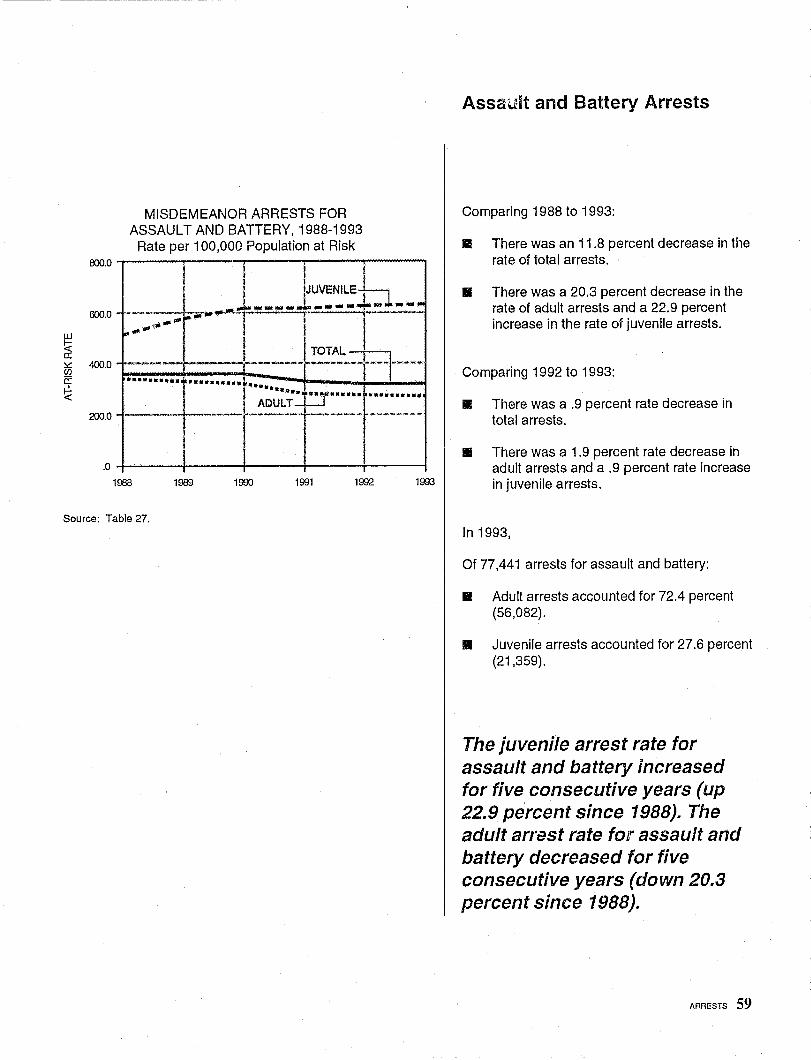
000.0
600.0
w ~ a: ::<: 400.0 en a: f-!. «
200.0
.0
MISDEMEANOR ARRESTS FOR ASSAULT AND BATTERY, 1988-1993
Rate per 100,000 Population at Risk
I I I ! ! j JUVENILEL +-- .1 ____ .1 ____ -!--1----::-;::-.;. ---r I~--
>--+--+----~~":--t---r--· ......... :jf .......... I •••••• I .~ •• ~ ••••••• •••••••••• I ADULT-____ _. __ 1., _________ ~. ____________
I
I r
1008 1989 1990 1991 1992 1993
Source: Table 27.
Assault and Battery Arrests
Comparing 1988 to 1993:
II There was an 11.8 percent decrease in the rate of total arrests.
• There was a 20.3 percent decrease in the rate of adult arrests and a 22.9 percent increase in the rate of juvenile arrests.
Comparing 1992 to 1993:
III There was a .9 percent rate decrease in total arrests.
• There was a 1.9 percent rate decrease in adult arrests and a .9 percent rate increase in juvenile arrests.
In 1993,
Of 77,441 arrests for assault and battery:
.. Adult arrests accounted for 72.4 percent (56,082).
II Juvenile arrests accounted for 27.6 percent (21,359).
The juvenile arrest rate for assault and battery increased for five consecutive years (up 22.9 percent since 1988). The adult arrest rate fOJ! assault and battery decreased for five consecutive years (down 20.3 percent since 1988).
ARRESTS 59
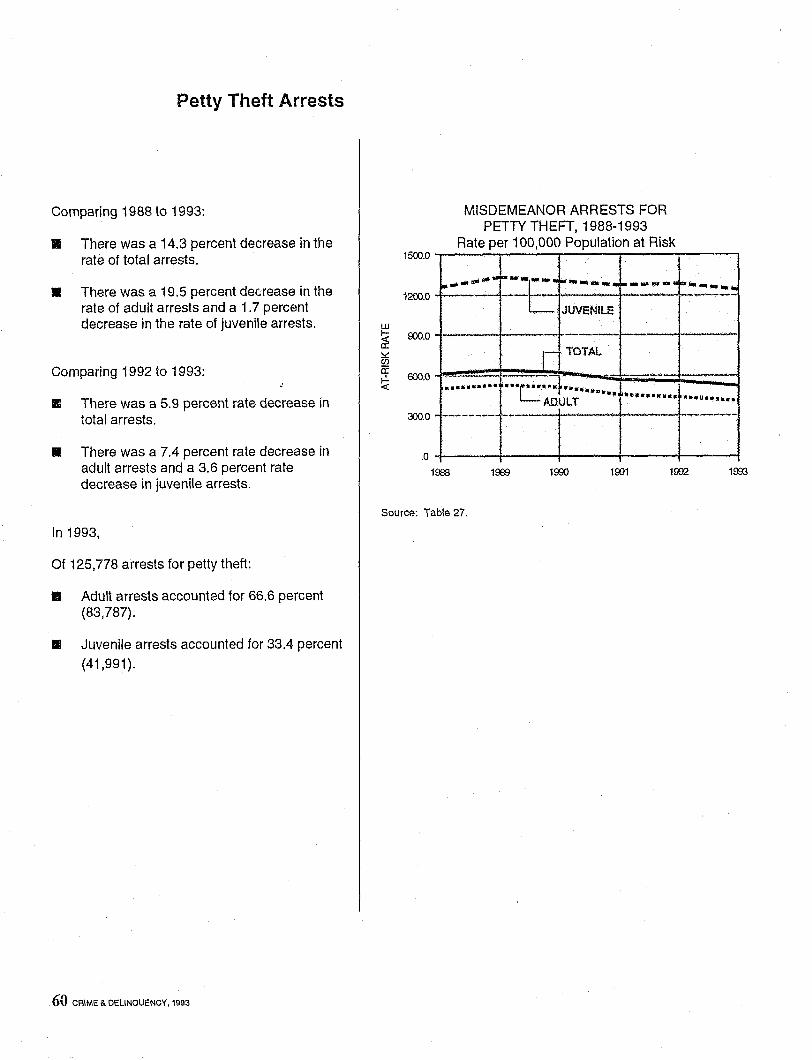
Petty Theft Arrests
Comparing 1988 to 1993:
II There was a 14.3 percent decrease in the rate of total arrests.
• There was a 19.5 percent decrease in the rate of adult arrests and a 1.7 percent decrease in the rate of juvenile arrests.
Comparing 1992 to 1993:
II There was a 5.9 percent rate deCiease in total arrests.
• There was a 7.4 percent rate decrease in adult arrests and a 3.6 percent rate decrease in juvenile arrests.
In 1993,
Of 125,778 arrests for petty theft:
II Adult arrests accounted for 66.6 percent (83,787).
II Juvenile arrests accounted for 33.4 percent
(41,991).
60 CRIME &. DELINOUENCY, 1993
1500.0
1200.0
ill
~ 900.0
~ en a:
600.0 r!--<
300.0
.0
MISDEMEANOR ARRESTS FOR PETTY THEFT, 1988-1993
Rate per 100,000 Population at Risk
"" .... - .. 11" .. 1or·_
I_ .. _ 10<- .. _._ ............
1-. L JUVENILE
~----- '---,- TOTAL
r=~==r --:t- -.......... ···r····~· .» •• •• 11 ••• .., ......... ADULT -------r-
I
I i"' ...... __ !
• •• u •• ,. •••
------
1988 1989 1990 1991 1992 1993
Source: Table 27.
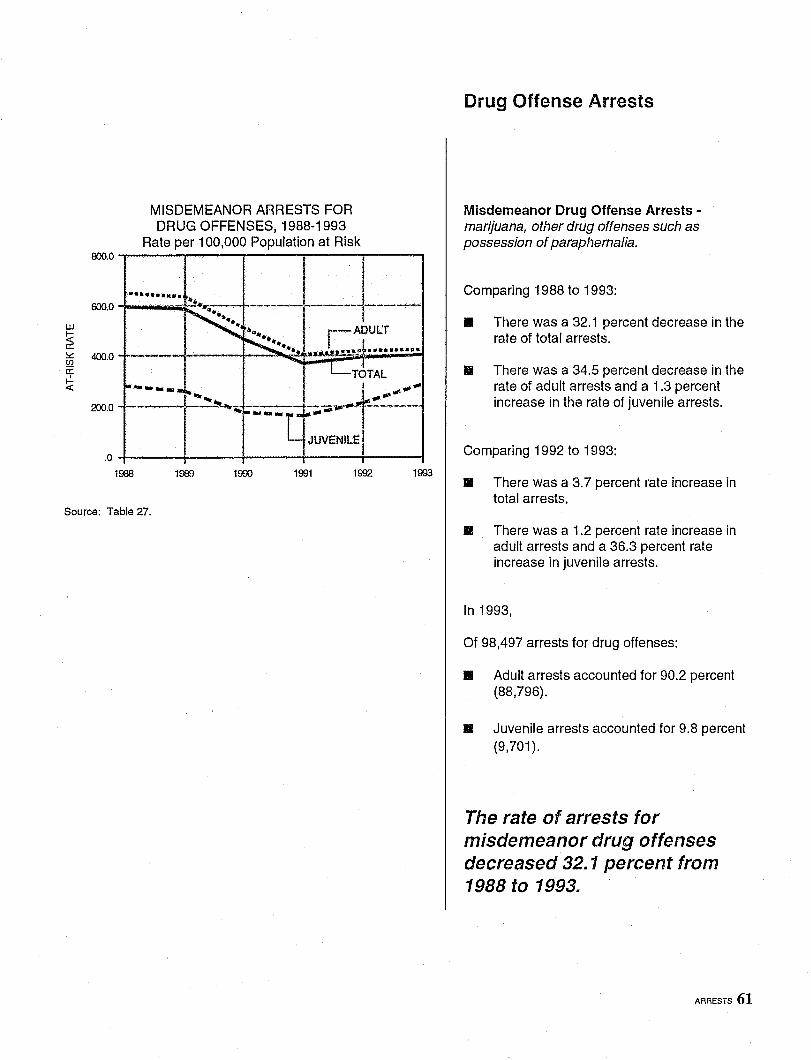
UJ
~ ~ en a: ~
MISDEMEANOR ARRESTS FOR DRUG OFFENSES, 1988-1993
Rate per 100,000 Population at Risk 000.0 -r-----...---r-----r-----:-I-----.
600.0
400.0
............ L -t---iiiiit.;.:--.. ...... -~ -------1 ------
•• .. -"'" rADUl.T
••••• -. ..~~~ ..•..... a.
200.0 ---... · ... t· --::::-:.~ ...... JUVENILEI
.o;------+------r-----~----_+----~
1988 1989 1990 1991 1992 1993
Source: Table 27.
Drug Offense Arrests
Misdemeanor Drug Offense Arrests -marijuana, other drug offenses such as possession of paraphernalia.
Comparing 1988 to 1993:
• There was a 32.1 percent decrease in the rate of total arrests .
.. There was a 34.5 percent decrease in the rate of adult arrests and a 1.3 percent increase in the rate of juvenile arrests.
Comparing 1992 to 1993:
II There was a 3.7 percent rate increase in total arrests.
.. There was a 1.2 percent rate increase in adult arrests and a 36.3 percent rate increase in juvenile arrests.
In 1993,
Of 98,497 arrests for drug offenses:
• Adult arrests accounted for 90.2 percent (88,796).
• Juvenile arrests accounted for 9.8 percent (9,701).
The rate of arrests for misdemeanor drug offenses decreased 32. 1 percent from 1988 to 1993.
ARRESTS 61
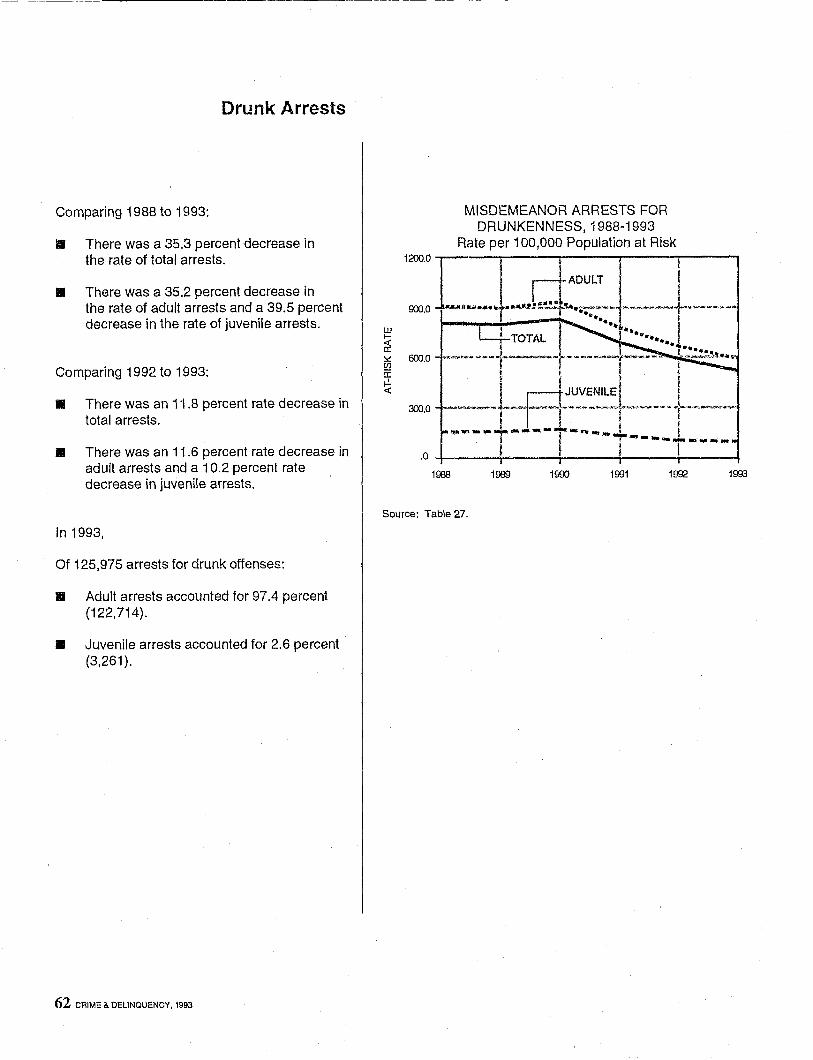
Drunk Arrests
Comparing 1988 to 1993:
II There was a 35.3 percent decrease in the rate of total arrests.
.. There was a 35.2 percent decrease in the rate of adult arrests and a 39.5 percent decrease in the rate of juvenile arrests.
Comparing 1992 to 1993:
II There was an 1'\.8 percent rate decrease in total arrests.
II There was an 11.6 percent rate decrease in adult arrests and a 10.2 percent rate decrease in juvenile arrests.
In 1993,
Of 125,975 arrests for drunk offenses:
.. Adult arrests accounted for 97.4 percent (122,714).
II Juvenile arrests accounted for 2.6 percent (3,261).
62 CRIME & DELINQUENCY, 1993
1988 1989 1900 1991 1992 1900
Source: Table 27.
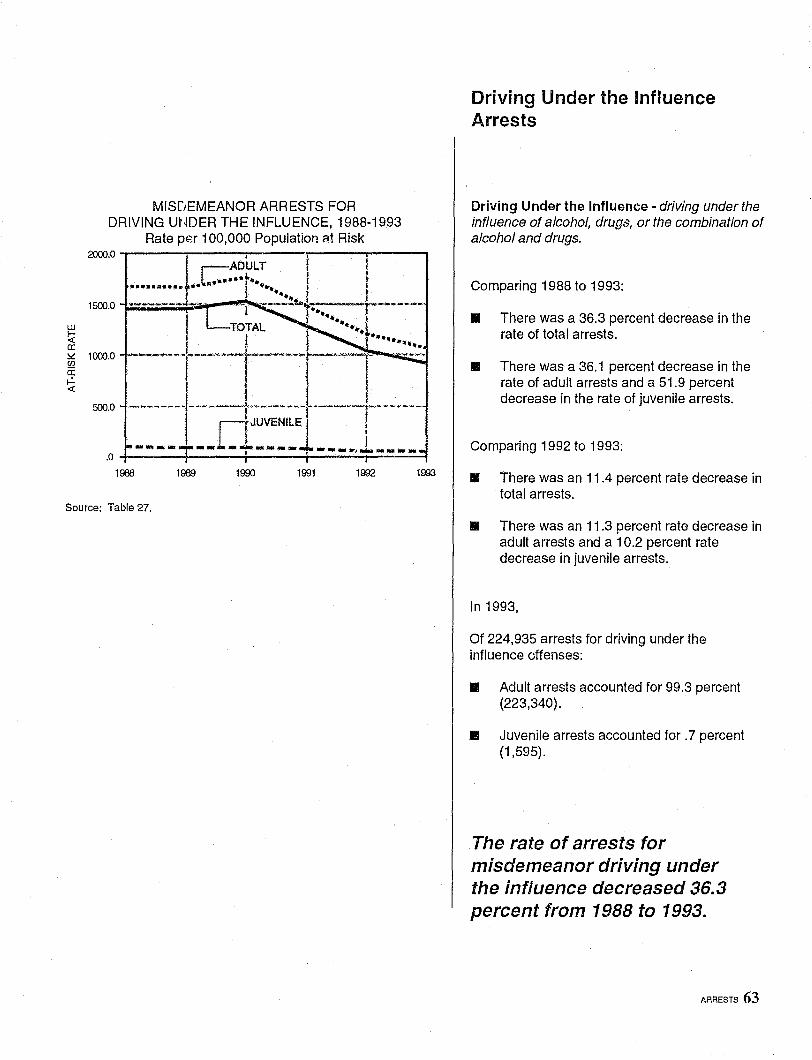
w ~ a: ~ C/)
a: ~ ~
Mlsr,EMEANOR ARRESTS FOR DRIVING UtmER THE INFLUENCE, 1988-1993
Rate p8r 100,000 Population at Risk 2000.0 -.------r---:-. ---1,----..,...----,
ADULT I r-:-....... I •••••••••• ..~ •••• 1 I -.. I
J " •• " t I --.---- _. -, ·-----!.tot ....... """""-r----~--' , TOTAL I ...... J I I [ ••• •• M~" ... ----'-1--11-
-.------ ----t'"·-------~----l--------O
i JUVENILE I I -- --1------+.--- ... ,1 ___ _
.o~---_+------r_----~----~~~~
1500.0
1000.0
500.0
1988 1989 1990 1991 1992 1993
Source: Table 27.
Driving Under the Influence Arrests
Driving Under the Influence - driving under the influence of alcohol, drugs, or the combination of alcohol and drugs.
Comparing 1988 to 1993:
• There was a 36.3 percent decrease in the rate of total arrests.
• There was a 36.1 percent decrease in the rate of adult arrests and a 51.9 percent decrease in the rate of juvenile arrests.
Comparing 1992 to 1993:
• There was an 11.4 percent rate decrease in total arrests.
• There was an 11 .3 percent rate decrease in adult arrests and a 10.2 percent rate decrease in juvenile arrests.
In 1993,
Of 224,935 arrests for driving under the influence offenses:
II Adult arrests accounted for 99.3 percent (223,340).
• Juvenile arrests accounted for .7 percent (1,595).
The rate of arrests for misdemeanor driving under the influence decreased 36.3 percent from 1988 to 1993.
ARRESTS 63
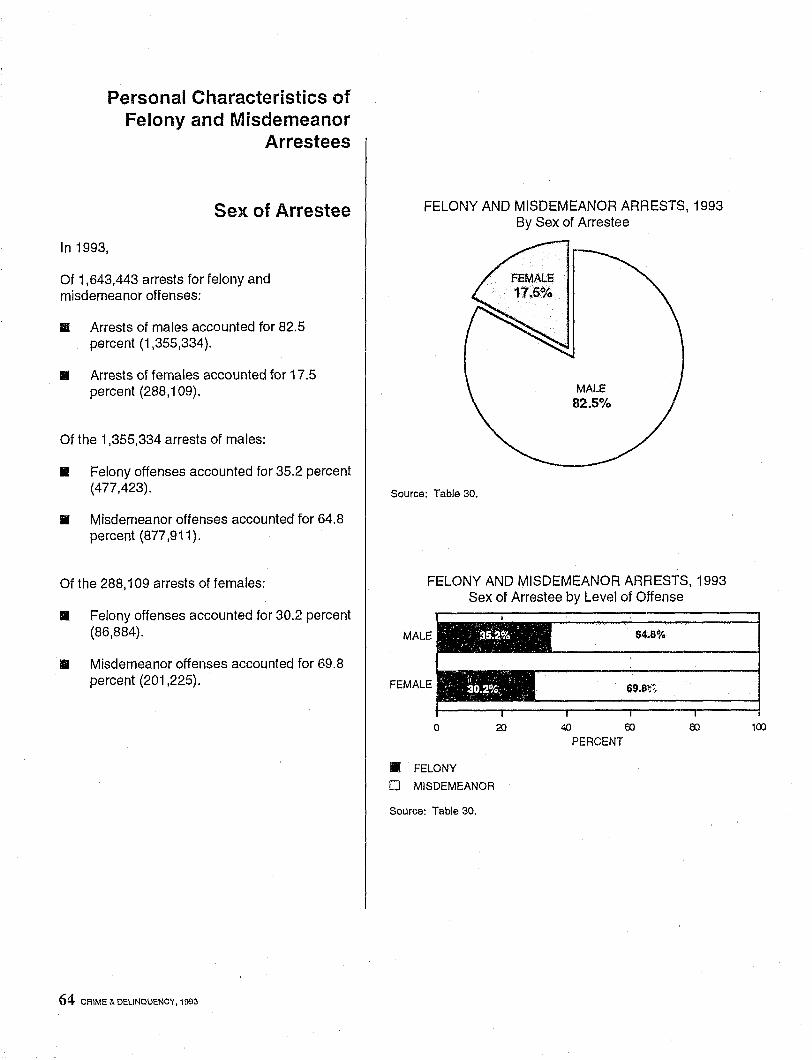
In 1993,
Personal Characteristics of Felony and Misdemeanor
Arrestees
Sex of Arrestee
Of 1,643,443 arrests for felony and misdemeanor offenses:
III Arrests of males accounted for 82.5 percent (1,355,334).
.. Arrests of females accounted for 17.5 percent (288,109).
Of the 1,355,334 arrests of males:
.. Felony offenses accounted for 35.2 percent (477,423).
• Misdemeanor offenses accounted for 64.8 percent (877,911).
Of the 288,109 arrests of females:
.. Felony offenses accounted for 30.2 percent (86,884).
.. Misdemeanor offenses accounted for 69.8 percent (201,225).
64 CRIME & DELINQUENCY,1993
FELONY AND MISDEMEANOR ARRESTS, 1993 By Sex of Arrestee
Source: Table 30.
FELONY AND MISDEMEANOR ARRESTS, 1993 Sex of Arrestee by Level of Offense
MALE
FEMALE
• FELONY
o MISDEMEANOR
Source: Table 30.
100
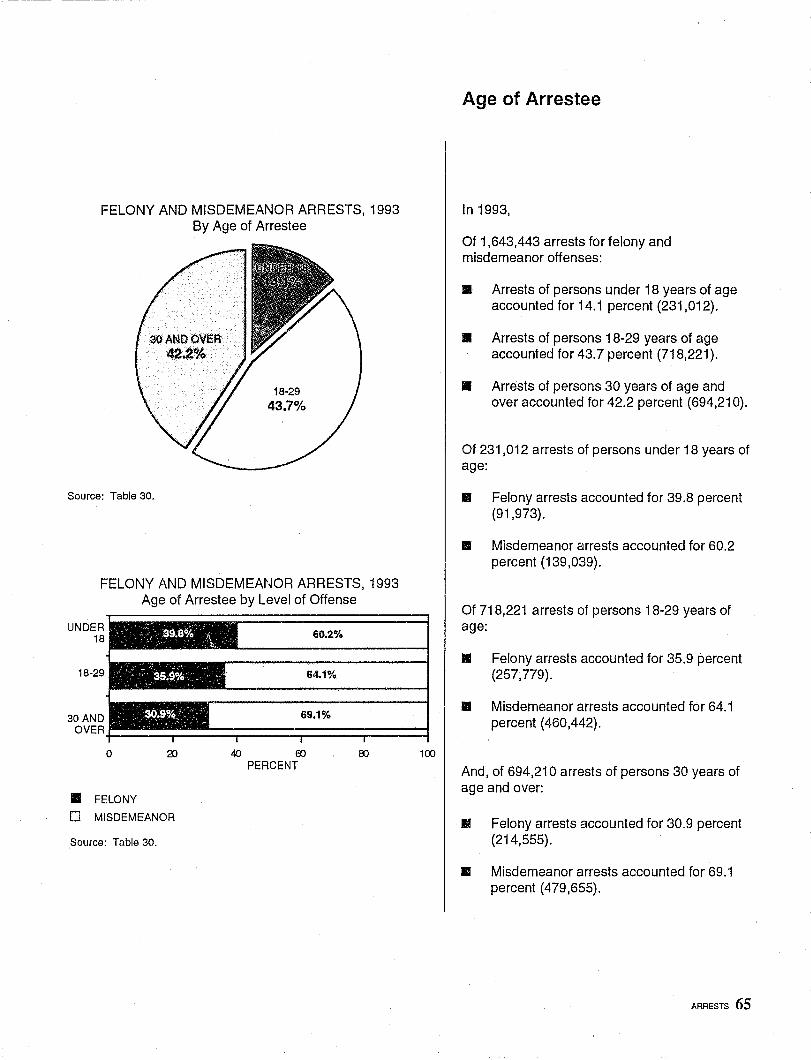
FELONY AND MISDEMEANOR ARRESTS, 1993 By ,I\ge of Arrestee
30 AND OVER 42.2%
Source: Table 30.
FELONY AND MISDEMEANOR ARRESTS, 1993 Age of Arrestee by Level of Offense
UNDER 18
18-29
60.2%
64.1%
69.1% 30AND OVER~~~~~~~======;=====~=====i
o 20 40 00 00 100 PERCENT
• FELONY
o MISDEMEANOR
Source: Table 30.
Age of Arrestee
In 1993,
Of 1,643,443 arrests for felony and misdemeanor offenses:
• Arrests of persons under 18 years of age accounted for 14.1 percent (231,012).
II Arrests of persons 18-29 years of age accounted for 43.7 percent (718,221).
.. Arrests of persons 30 years of age and over accounted for 42.2 percent (694,210).
Of 231,012 arrests of persons under 18 years of age:
II Felony arrests accounted for 39.8 percent (91,973).
.. Misdemeanor arrests accounted for 60.2 percent (139,039).
Of 718,221 arrests of persons 18-29 years of age:
.. Felony arrests accounted for 35.9 percent (257,779).
II Misdemeanor arrests accounted for 64.1 percent (460,442).
And, of 694,210 arrests of persons 30 years of age and over:
II Felony arrests accounted for 30.9 percent (214,555).
11 Misdemeanor arrests accounted for 69.1 percent (479,655).
ARRESTS 65
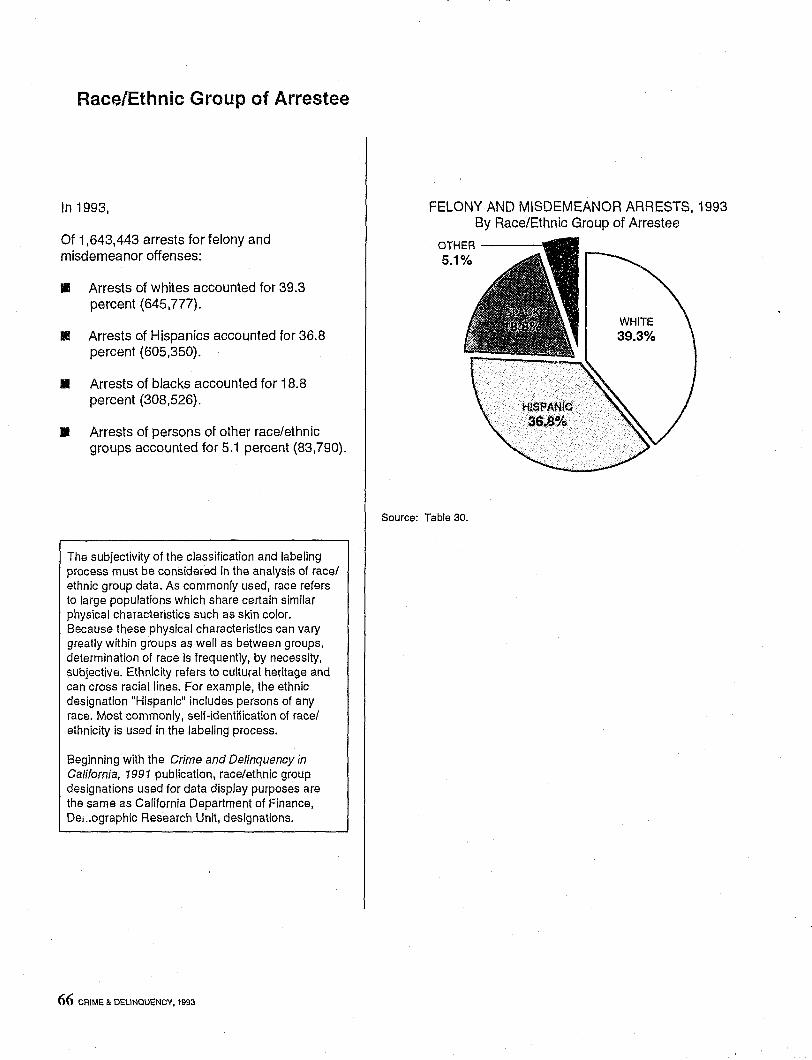
Race/Ethnic Group of Arrestee
In 1993,
Of 1,643,443 arrests for felony and misdemeanor offenses:
• Arrests of whites accounted for 39.3 percent (645,777).
II Arrests of Hispanics accounted for 36.8 percent (605,350).
• Arrests of blacks accounted for 18.8 percent (308,526).
• Arrests of persons of other race/ethnic groups accounted for 5.1 percent (83,790).
The subjectivity of the classification and labeling process must be considered in the analysis of race/ ethnic group data. As commonly used, race refers to large populations which share certain similar physical characteristics such as skin color. Because these physical characteristics can vary greatly within groups as well as between groups, determination of race is frequently, by necessity, subjective. Ethnicity refers to cultural heritage and can cross racial lines. For example, the ethnic designation "Hispanic" includes persons of any race. Most commonly, self-identification of race! ethnicity is used in the labeling process.
Beginning with the Crime and Delinquency in California, 1991 publication, race/ethnic group designations used for data display purposes are the same as California Department of Finance, DeL.ographic Research Unit, designations.
66 CAIME &. DELINQUENCY, 1993
FELONY AND MISDEMEANOR ARRESTS, 1993 By Race/Ethnic Group of Arrestee
OTHER ----, 5.1%
Source: Table 30.
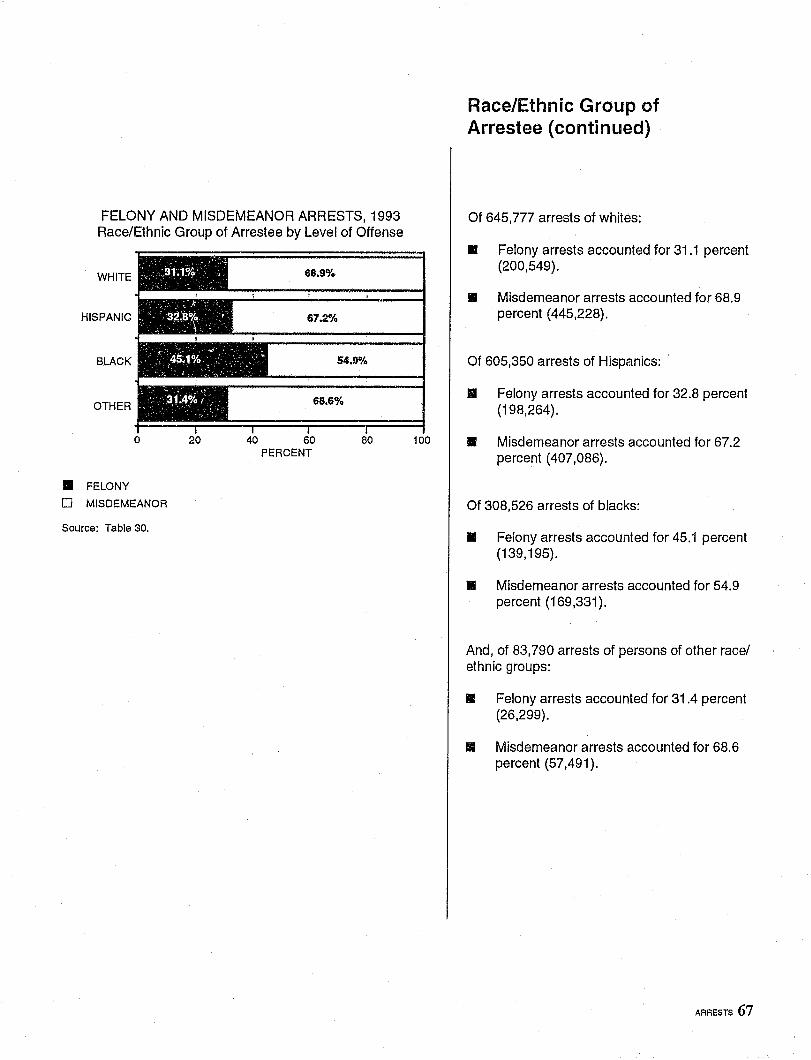
FELONY AND MISDEMEANOR ARRESTS, 1993 Race/Ethnic Group of Arrestee by Level of Offense
WHITE
HISPANIC
BLACK
OTHER
o 20 40 60 80 PERCENT
• FELONY
o MISDEMEANOR
Source: Table 30.
100
Race/Ethnic Group of Arrestee (continued)
Of 645,777 arrests of whites:
II Felony arrests accounted for 31.1 percent (200,549).
• Misdemeanor arrests accounted for 68.9 percent (445,228).
Of 605,350 arrests of Hispanics:
• Felony arrests accounted for 32.8 percent (198,264).
• Misdemeanor arrests accounted for 67.2 percent (407,086) .
Of 308,526 arrests of blacks:
• Felony arrests accounted for 45. i percent (139,195).
• Misdemeanor arrests accounted for 54.9 percent (169,331).
And, of 83,790 arrests of persons of other race/ ethnic groups:
• Felony arrests accounted for 31.4 percent (26,299).
.. Misdemeanor arrests accounted for 68.6 percent (57,491).
ARRESTS 67
'-
- -. ..
! • -1--. - ..- • ~~- T .. - - -
- "'-' "
! --• •
-
~~ • .. -- , • ., .~
• • •
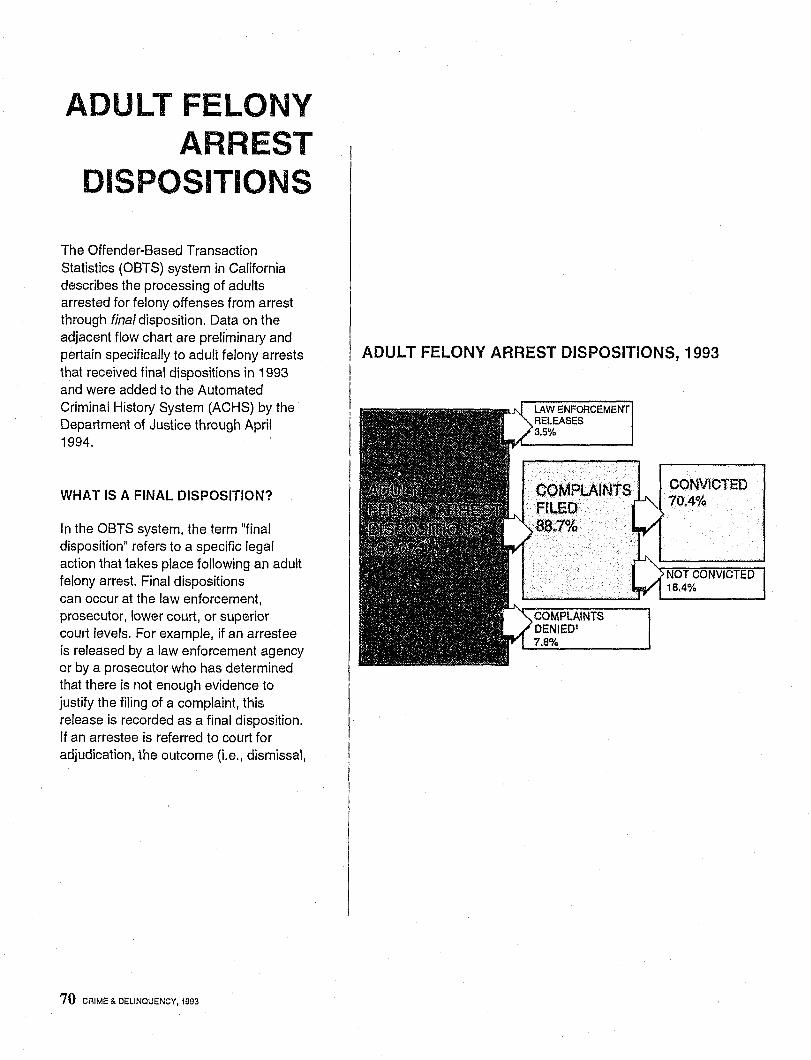
ADULT FELONY ARREST
DISPOSITIONS
The Offender-Based Transaction Statistics (OBTS) system in California describes the processing of adults arrested for felony offenses from arrest through final disposition. Data on the adjacent flow chart are preliminary and pertain specifically to adult felony arrests that received final dispositions in 1993 and were added to the Automated Criminal History System (ACHS) by the Department of Justice through April 1994.
WHAT IS A FINAL DISPOSITION?
In the OBTS system, the term "final disposition" refers to a specific legal action that takes place following an adult felony arrest. Final dispositions can occur at the law enforcement, prosecutor, lower court, or superior couli levels. For example, if an arrestee is released by a law enforcement agency or by a prosecutor who has determined that there is not enough evidence to justify the filing of a complaint, this release is recorded as a final disposition. If an arrestee is referred to court for adjUdication, the outcome (Le., dismissal,
70 CRIME & DELINQUENCY, 1993
ADULT FELONY ARREST DISPOSITIONS, 1993
CONVICTED 70.4%
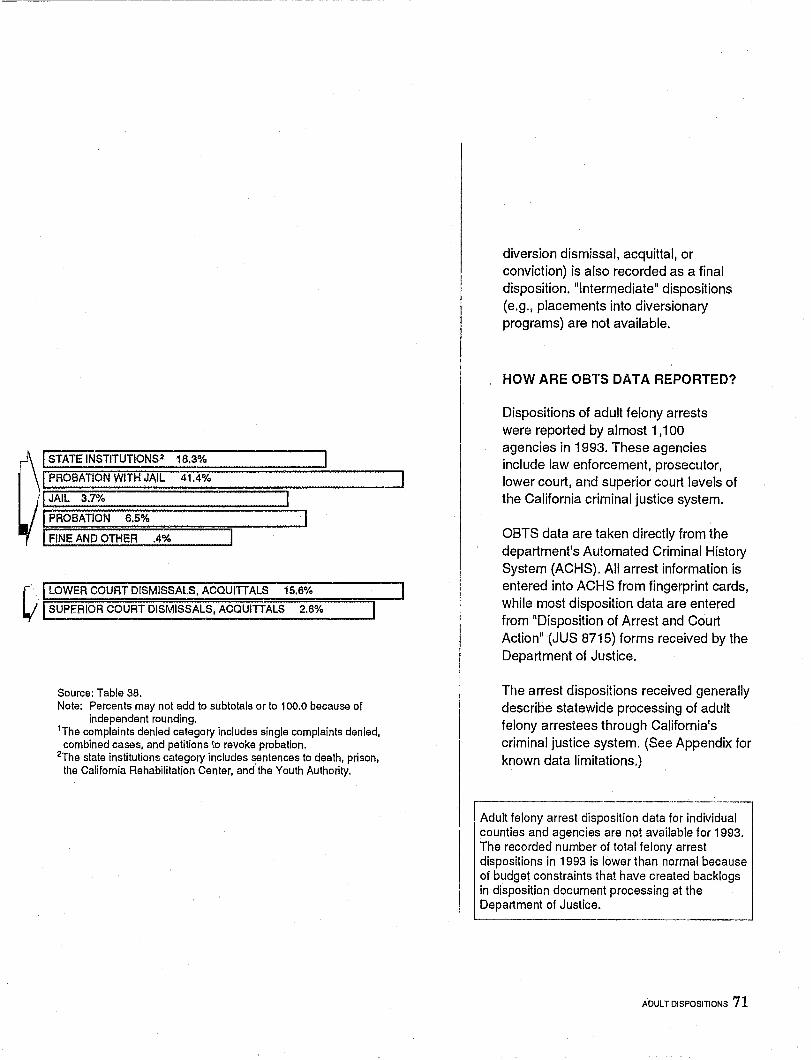
@ATEINSTITUTIONS2 18.3%
I PROBATION WITH JAIL 41.4%
II JAIL 3.7%
[PROBATION 6.5%
( FINE AND OTHER .4%
r .' LOWER COURT DISMISSALS, ACQUITIALS 15.6%
Ly' I SUPERIOR COURT DISMISS!,LS, ACQUITIALS 2.8%
Source: Table 38. Note: Percents may not add to subtotals or to 100.0 because of
independent rounding. 1The complaints denied category includes single complaints denied, combined cases, and petitions to revoke probation.
2The state institutions category includes sentences to death, prison, the Califomia Rehabilitation Center, and the Youth Authority.
diversion dismissal, acquittal, or conviction) is also recorded as a final disposition. "Intermediate" dispositions (e.g., placements into diversionary programs) are not available.
HOW ARE OBTS DATA REPORTED?
Dispositions of adult felony arrests were reported by almost 1 ,100 agencies in 1993. These agencies include law enforcement, prosecutor, lower court, and superior court levels of the California criminal justice system.
OBTS data are taken directly from the department's Automated Criminal History System (ACHS). All arrest information is entered into ACHS from fingerprint cards, while most disposition data are entered from "Disposition of Arrest and Court Action" (JUS 8715) forms received by the Department of Justice.
The arrest dispositions received generally describe statewide processing of adult felony arrestees through California's criminal justice system. (See Appendix for known data limitations.)
I Adult felony arrest disposition data for individual counties and agencies are not available for 1993. The recorded number of tottal felony arrest dispositions in 1993 is lower than normal because of budget constraints that have created backlogs in disposition document processing at the Department of Justice.
ADULT DISPOSITIONS 71
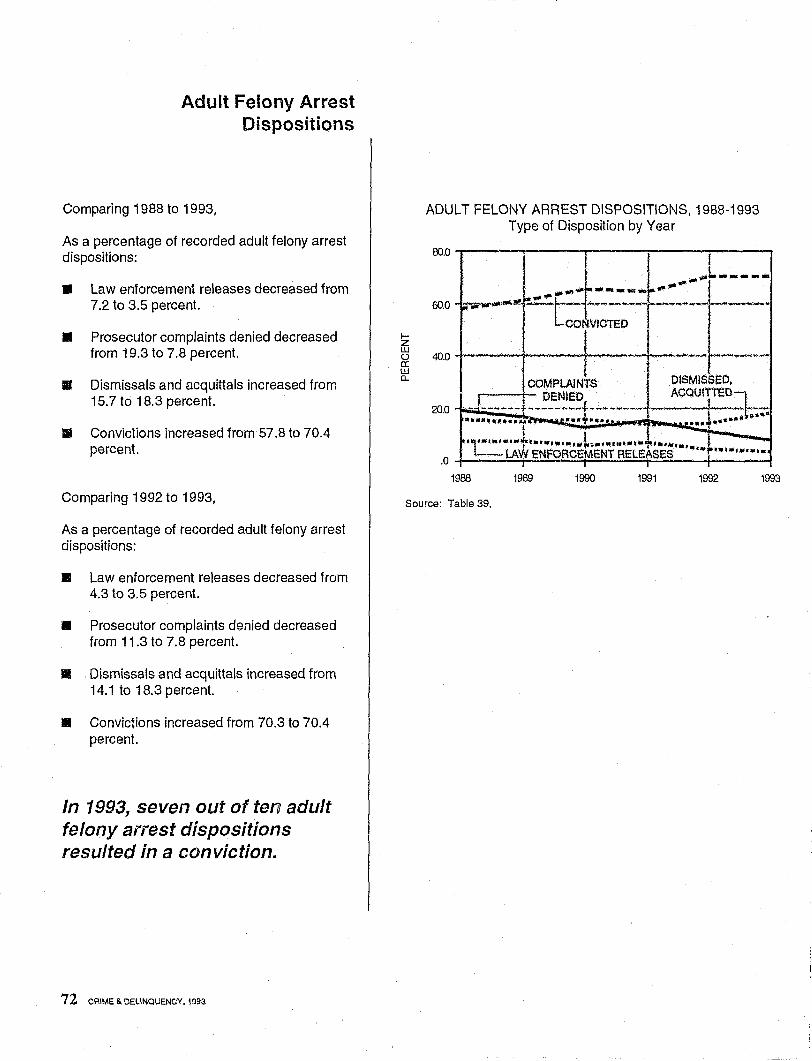
Adult Felony Arrest Dispositions
Comparing 1988 to 1993,
As a percentage of recorded adult felony arrest dispositions:
• Law enforcement releases decreased from 7.2 to 3.5 percent.
• Prosecutor complaints denied decreased from 19.3 to 7.8 percent.
III Dismissals and Clcquittals increased from 15.7 to 18.3 percent.
• Convictions increased from 57.8 to 70.4 percent.
Comparing 1992 to 1993,
As a percentage of recorded adult felony arrest dispositions:
• Law enforcement releases decreased from 4.3 to 3.5 percent.
• Prosecutor complaints denied decreased from 11.3 to 7.8 percent.
II Dismissals and acquittals increased from 14.1 to 18.3 percent.
III Convictions increased from 70.3 to 70.4 percent.
In 1993, seven out of ten adult felony arrest dispositions resulted in a conviction.
72 CAIME&DEUNQUENCY.1993
f-Z UJ 0 a: UJ Cl.
ADULT FELONY ARREST DISPOSITIONS, 1988-1993 Type of Disposition by Year
60.0
80.0 l ~ _-L-----... .,. ................. _- ... • ..,.,....... ..... 1IlI! .... :· ... -=t- -----"'-r-~---I----.. * ..
CONVICTED I
40.0 I ,..;..:--1--------
20.0
• DISMISSED, COMPLAINTS
. d'"-----DENIED, AcaUITTED=h_
---"!"'--~-'t--- ... ,,-----•• III ••• I1 ••• ~.1 , .... .;. ... ... •••••••••••
, 1··· .. ' .. u:i·ENFORCEhENTP.E~E~~ES' .. · .. · .. -• ••••• 1 ....
. 0
1988 1989 1990 1991 1992 1993
Source: Table 39.
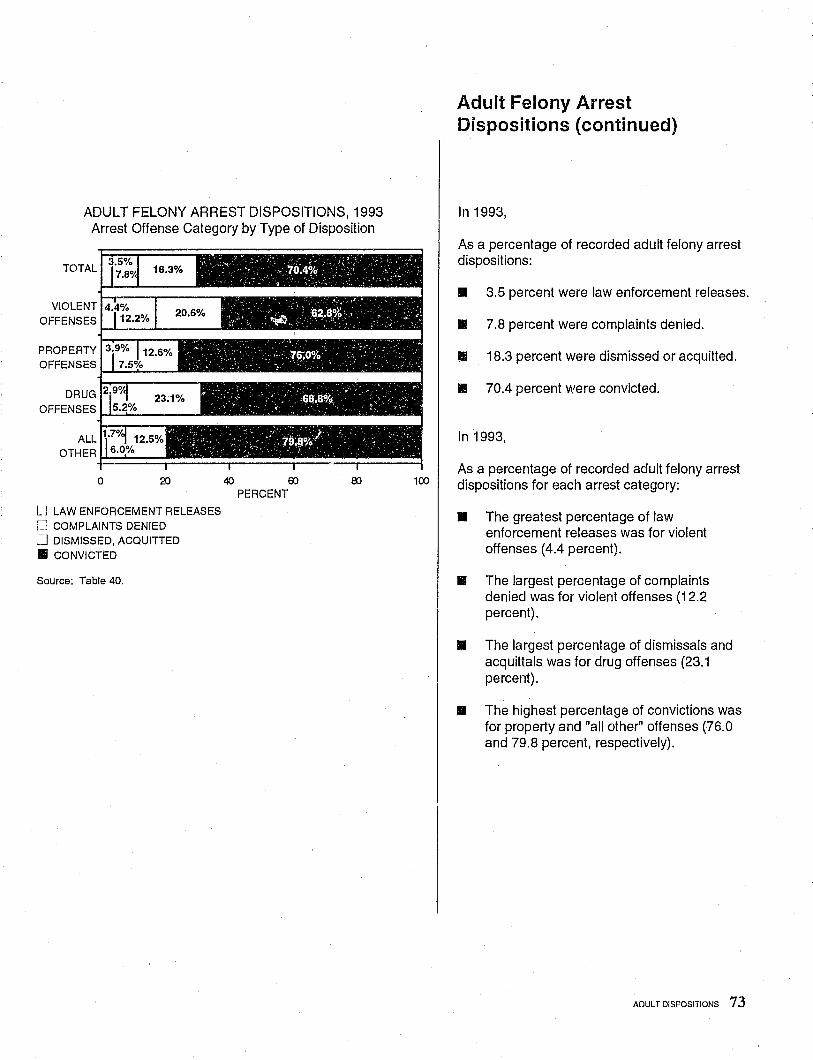
ADULT FELONY ARREST DISPOSITIONS, 1993 Arrest Offense Category by Type of Disposition
TOTAL
VIOLENT
OFFENSES I-I--...L..----
PROPERTY
OFFENSES 1-1~':"':---
DRUG
OFFENSES I--l=-.:.:;.;,;----
o
U LAW ENFORCEMENT RELEASES ~..::: COMPLAINTS DENIED .:J DISMISSED, ACQUITTED .. CONVICTED
Source: Table 40.
40 00 00 PERCENT
100
Adult Felony Arrest Dispositions (continued)
In 1993,
As a percentage of recorded adult felony arrest dispositions:
• 3.5 percent were law enforcement releases.
• 7.8 percent were complaints denied.
.. 18.3 percent were dismissed or acquitted.
II 70.4 percent were convicted.
In 1993,
As a percentage of recorded adult felony arrest dispositions for each arrest category:
.. The greatest percentage of law enforcement releases was for violent offenses (4.4 percent) .
.. The largest percentage of complaints denied was for violent offenses (12.2 percent).
.. The largest percentage of dismissals and acquittals was for drug offenses (23.1 percent).
.. The highest percentage of convictions was for property and "all other" offenses (76.0 and 79.8 percent, respectively).
ADUL T DISPOSITIONS 73
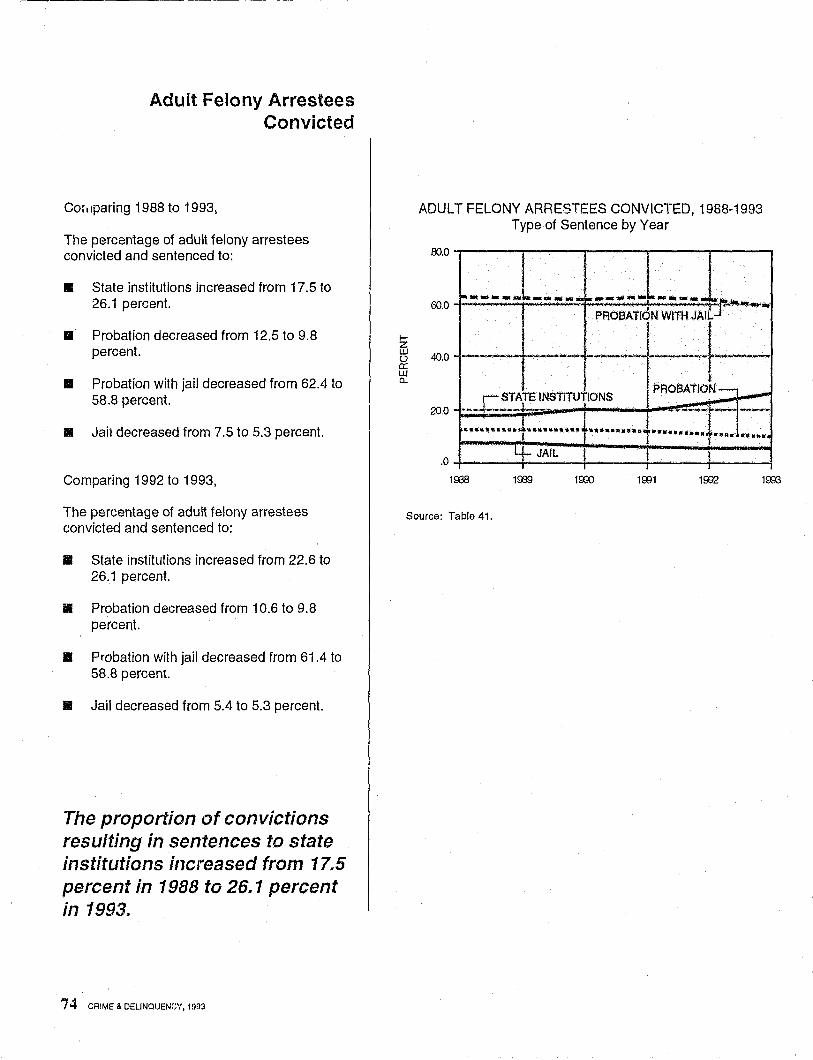
Adult Felony Arrestees Convicted
Cot'lparing 1988 to 1993,
The percentage of adult felony arrestees convicted and sentenced to:
• State institutions increased from 17.5 to 26.1 percent.
II Probation decreased from 12,5 to 9.8 percent.
• Probation with jail decreased from 62.4 to 58.8 percent.
• Jail decreased from 7.5 to 5.3 percent.
Comparing 1992 to 1993,
The percentage of adult felony arrestees convicted and sentenced to:
• State institutions increased from 22.6 to 26.1 percent.
II Probation decreased from 10.6 to 9.8 percent.
• Probation with jail decreased from 61.4 to 58.8 percent.
II Jail decreased from 5.4 to 5.3 percent.
The proportion of convictions resulting in sentences to state institutions increased from 17.5 percent in 1988' to 26.1 percent in 1993.
74 CRIME & DELINQUENCY. 1993
~
ADULT FELONY ARRESTEES CONVICTED, 1988·1993 Type of Sentence by Year
00.0
I 1- .............. 1...- ... _-- "' ... - ........ 1--_ .........
PROBATiON WITH JAIJ...::r-----60.0
~ 40.0 ------ .... ----- -------~+ 0; w a.
__ ._r-.!~!LEINSTiTUTlONS PROaATION- -"'{'--.. -= i"----20,0
.......... c.~ ............ • •••••••• &~ ••••••••••
i lit ••••••••
.0
1008
Source: Tabla 41.
W - JAIL
1009 19XJ
t I
1001 1002 1003
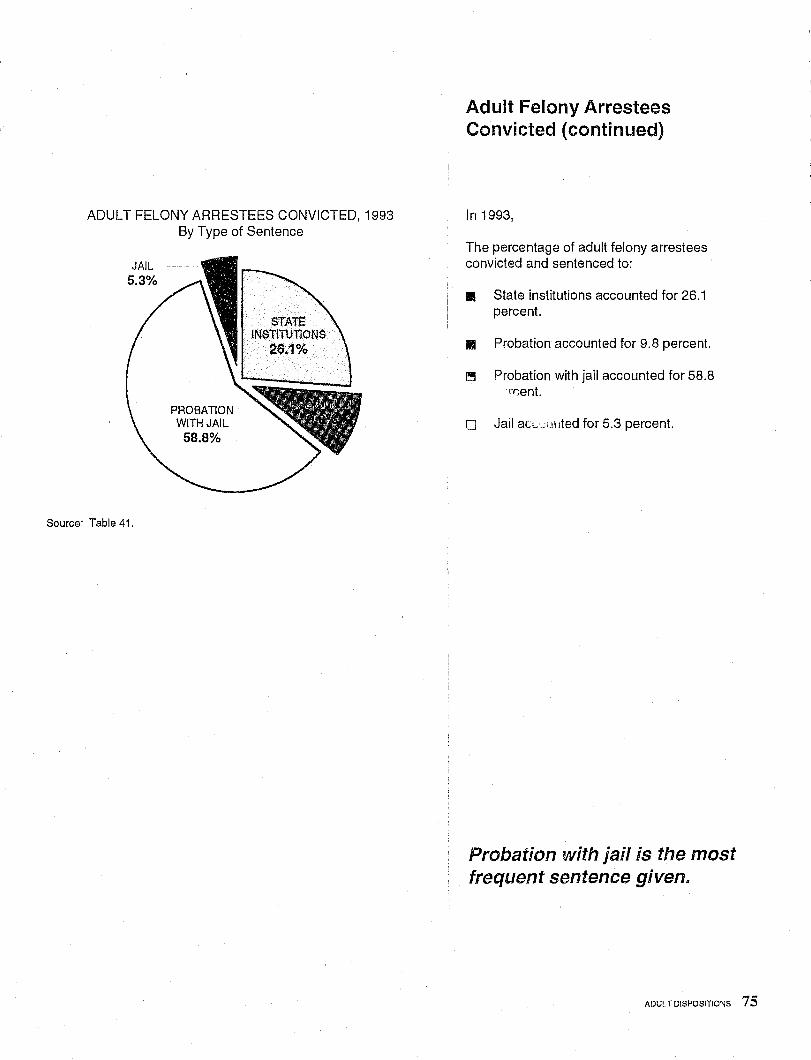
ADULT FELONY ARRESTEES CONVICTED, 1993 By Type of Sentence
JAIL 5.3%
Source: Table 41.
PROBATION WITH JAIL 58.8%
Adult Felony Arrestees Convicted (continued)
In 1993,
The percentage of adult felony arrestees convicted and sentenced to:
.. State institutions accounted for 26.1 percent.
II Probation accounted for 9.8 percent.
!!!I Probation with jail accounted for 58.8 rr,ent.
o Jail aCLLi}ilted for 5.3 percent.
Probation with jail is the most frequent sentence given.
ADUL T DISPOSITIONS 75
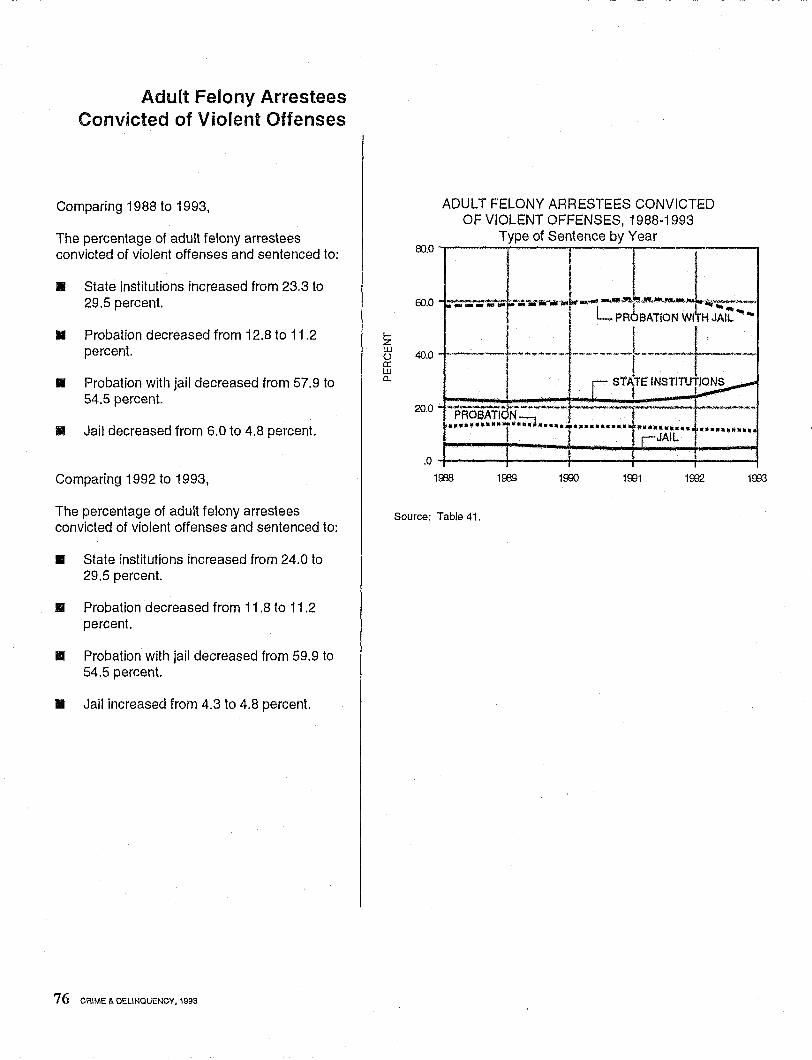
Adult Felony Arrestees Convicted of Violent Offenses
Comparing 1988 to 1993,
The percentage of adult felony arrestees convicted of violent offenses and sentenced to:
II State institutions increased from 23.3 to 29.5 percent.
• Probation decreased from 12.8 to 11.2 percent.
II Probation with jail decreased from 57.9 to 54.5 percent.
II Jail decreased from 6.0 to 4.8 percent.
Comparing 1992 to 1993,
The percentage of adult felony arrestees convicted of violent offenses and sentenced to:
• State institutions increased from 24.0 to 29.5 percent.
II Probation decreased from 11.8 to 11.2 percent.
II Probation with jail decreased from 59.9 to 54.5 percent.
II Jail increased from 4.3 to 4.8 percent.
76 CRIME ~ DELINQUENCY. 1993
~ Z ill () a: ill a.
80.0
60.0
40.0
20.0
ADULT FELONY ARRESTEES CONVICTED OF VIOLENT OFFENSES, 1988-1993
Type of Sentence by Year
-~--.--+~v~+--~-L L PR6BATiON WI~H JAIL ......
. 1 I I .----1-------- __ · _______ I __ w_· ___ ~"I-·
I r ST~TE INSTITUT~ .. ·pRo1ij\fiefN-.... ----;--... ----f ~-....--
·'········~~·~~····l··········~ ";::jAU:··· ....... ., ... 1
.0
1008 1939
"
1000
\ I I
1001 1002 1003
Source: Table 41.
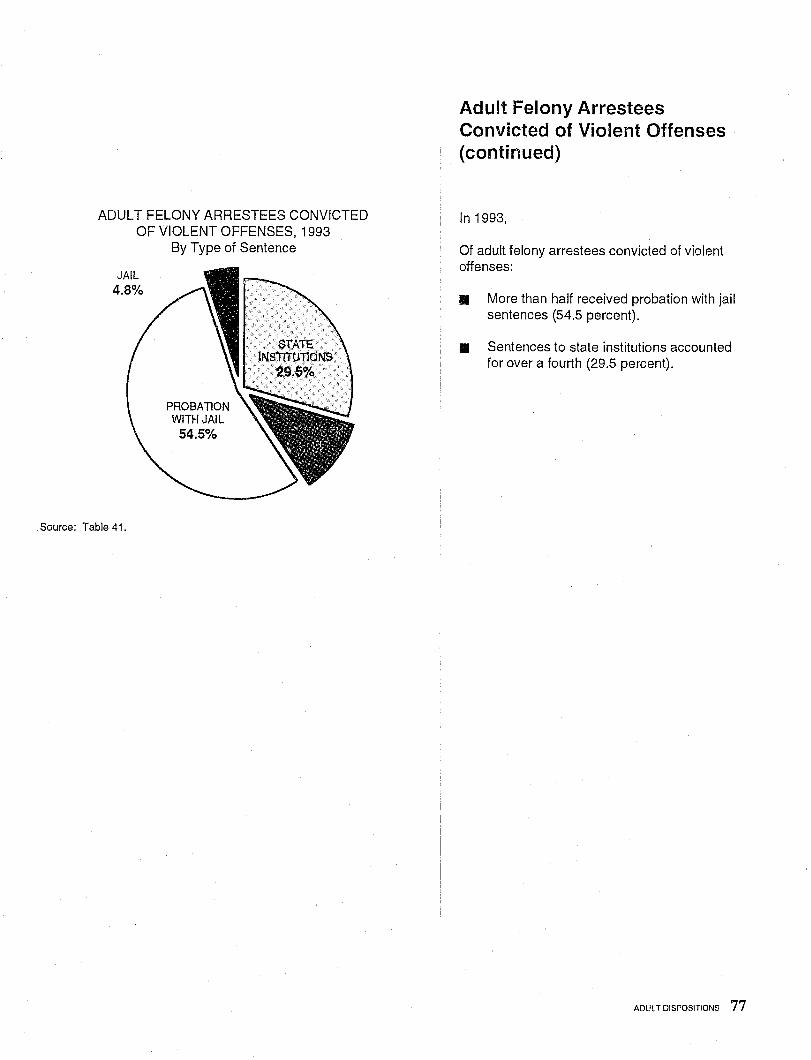
ADULT FELONY ARRESTEES CONVICTED OF VIOLENT OFFENSES, 1993
JAIL 4.8%
Source: Table 41.
By Type of Sentence
PROBATION WITH JAIL 54.5%
Adult Felony Arrestees Convicted of Violent Offenses (continued)
In 1993,
Of adult felony arrestees convicted of violent offenses:
.. More than half received probation with jail sentences (54.5 percent).
• Sentences to state institutions accounted for over a fourth (29.5 percent).
ADUL T DISPOSITIONS 77
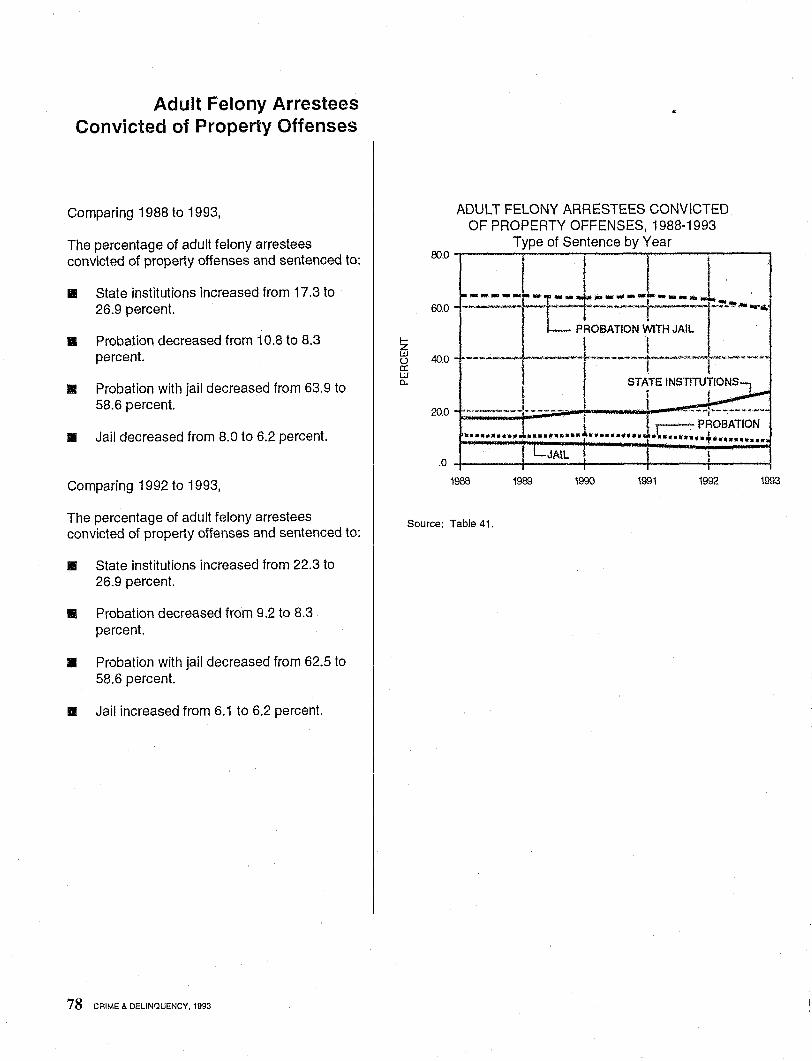
Adult Felony Arrestees Convicted of Property Offenses
Comparing 1988 to 1993,
The percentage of adult felony arrestees convicted of property offenses and sentenced to:
II State institutions increased from 17.3 to 26.9 percent.
.. Probation decreased from 10.8 to 8.3 percent.
II Probation with jail decreased from 63.9 to 58.6 percent.
II Jail decreased from 8.0 to 6.2 percent.
Comparing 1992 to 1993,
The percentage of adult felony arrestees convicted of property offenses and sentenced to:
II State institutions increased from 22.3 to 26.9 percent.
II Probation decreased from 9.2 to 8.3 percent.
II Probation with jail decreased from 62.5 to 58.6 percent.
II Jail increased from 6.1 to 6.2 percent.
78 CRIME & DELINQUENCY, 1993
!z UJ 0 a: UJ a..
ADULT FELONY ARRESTEES CONVICTED OF PROPERTY OFFENSES, 1988-1993
Type of Sentence by Year 00.0 ,---'"""";'..;.....--.,..---~--------.
60.0
40.0
20.0
.----I-i~:~~~E~:---· I 1 1 _ t
.. ~ ... -----!------ I .. '11 ; --;R~;;~~~-"' ..... 11 ••• '" J. ....... II................. .1....... J . • •• 'f ......... ....
. 0 ~-------;------~----~------+-----~ 1900 1989 1990 1991 1992 1993
Source: Table 41.
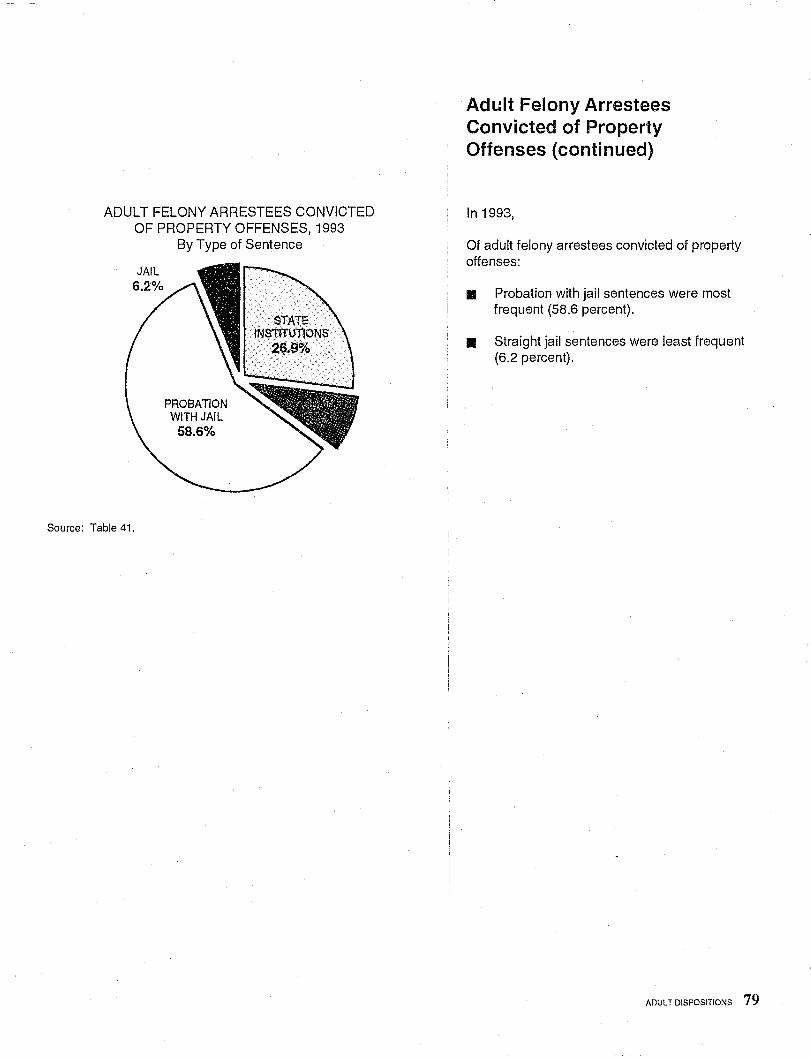
ADULT FELONY ARRESTEES CONVICTED OF PROPERTY OFFENSES, 1993
JAIL
Source: Table 41.
By Type of Sentence
PROBATION WITH JAIL
58.6%
Adult Felony Arrestees Convicted of Property Offenses (continued)
In 1993,
Of adult felony arrestees convicted of property offenses:
.. Probation with jail sentences were most frequent (58.6 percent).
• Straight jail sentences were least frequent {6.2 percent}.
ADUL T DISPOSITIONS 79
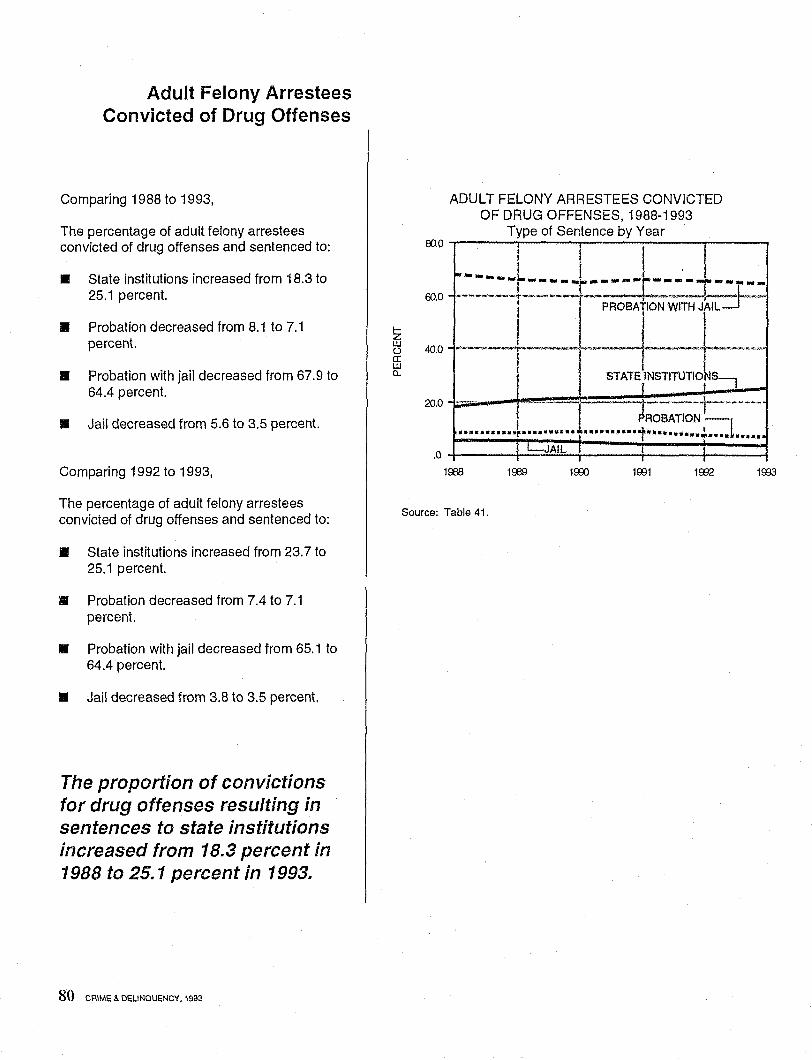
Adult Felony Arrestees Convicted of Drug Offenses
Comparing 1988 to 1993,
The percentage of adult felony arrestees convicted of drug offenses and sentenced to:
.. State institutions increased from 18.3 to 25.1 percent.
.. Probation decreased from 8.1 to 7.1 percent.
.. Probation with Jail decreased from 67.9 to 64.4 percent.
.. Jail decreased from 5.6 to 3.5 percent.
Comparing 1992 to 1993,
The percentage of adult felony arrestees convicted of drug offenses and sentenced to:
.. State institutions increased from 23.7 to 25.1 percent.
• Probation decreased from 7.4 to 7.1 percent.
.. Probation with jail decreased from 65.1 to 64.4 percent.
.. Jail decreased from 3.8 to 3.5 percent.
The proporlion of convictions for drug offenses resulting in sentences to state institutions increased from 18.3 percent in 1988 to 25.1 percent in 1993.
80 CRIME & DELINQUENCY, 1993
I-Z UJ () a: UJ a..
00.0
60.0
40.0
20.0
ADULT FELONY ARRESTEES CONVICTED OF DRUG OFFENSES, 1988-1993
Type of Sentence by Year
! i I + I I I.
~-----r-----r-----~---- ---" ------r----r~rH"jr~ -·-----r--r=t=~o~~--··
" .' --.-~-----t- ----~l -~-~---
.. so no •••• p ......... "I" ......... t~~~~ ~I~~ +::J .......... .0
1008
! L-JAIL I I
1009
I.
1001 1002 1003
Source: Table 41.
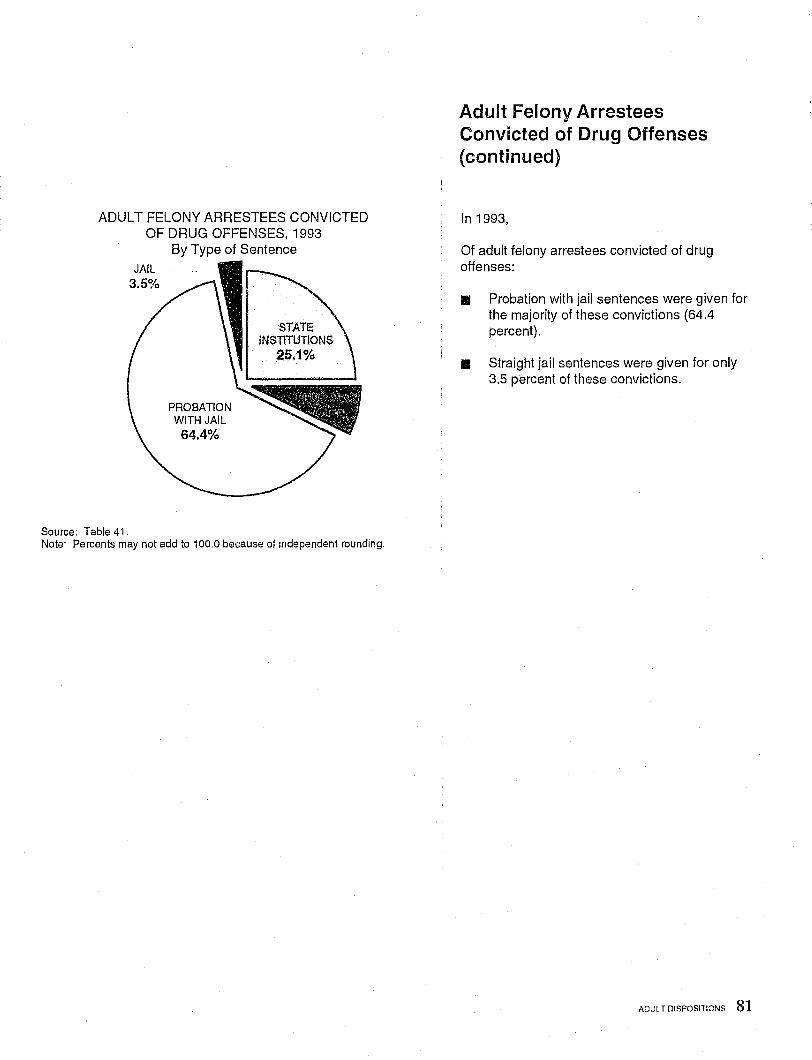
ADULT FELONY ARRESTEES CONVICTED OF DRUG OFFENSES, 1993
JAIL 3.5%
Source: Table 41.
By Type of Sentence
PROBATION WITH JAIL 64.4%
Note: Percents may not add to 100.0 because of independent rounding.
Adult Felony Arrestees Convicted of Drug Offenses (continued)
In 1993,
Of adult felony arrestees convicted of drug offenses:
• Probation with jail sentences were given for the majority of these convictions (64.4 percent).
• Straight jail sentences were given for only 3.5 percent of these convictions.
AOUL T DISPOSITIONS 81
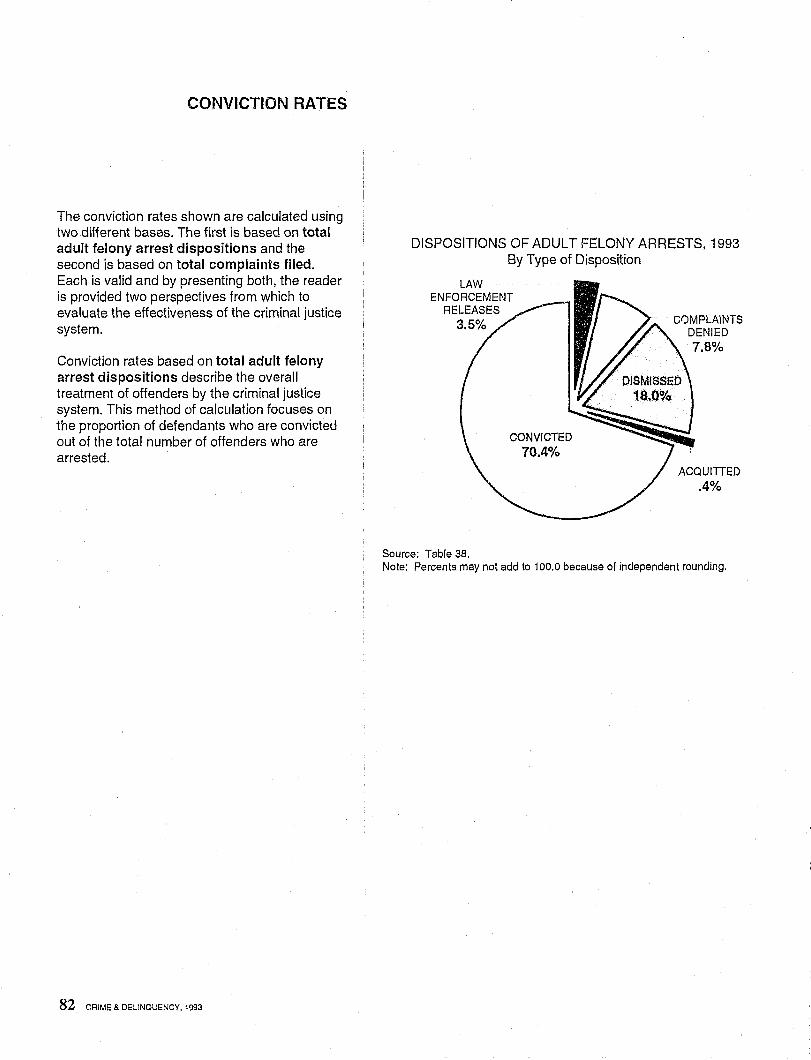
CONVICTION RATES
The conviction rates shown are calculated using two different bases. The first is based on total adult felony arrest dispositions and the second is based on total complaints filed. Each is valid and by presenting both, the reader is provided two perspectives from which to evaluate the effectiveness of the criminal justice system.
Conviction rates based on total adult felony arrest dispositions describe the overall treatment of offenders by the criminal justice system. This method of calculation focuses on the proportion of defendants who are convicted out of the total number of offenders who are arrested.
82 CRIME & DEliNQUENCY. 1993
DISPOSITIONS OF ADULT FELONY ARRESTS, 1993 By Type of Disposition
LAW ENFORCEMENT
RELEASES 3.5%
Source: Table 38.
CONVICTED 70.4%
COMPLAINTS DENIED
ACQUITIED .4%
Note: Percents may not add to 100.0 because of independent rounding.
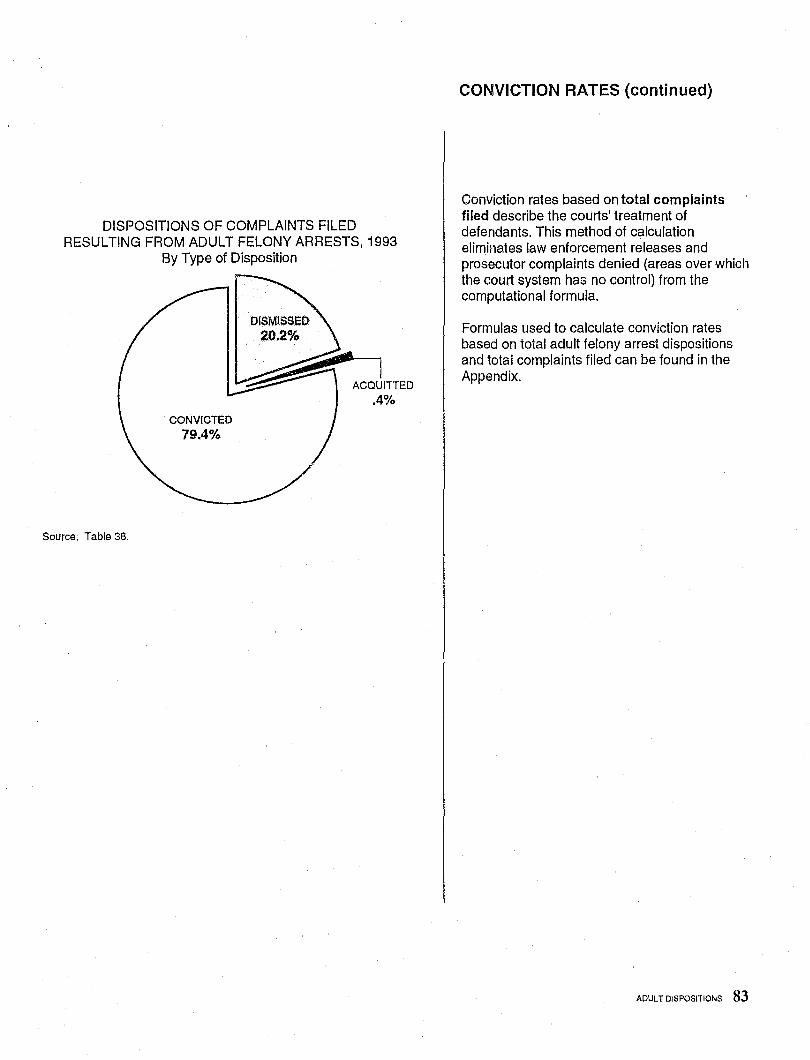
DISPOSITIONS OF COMPLAINTS FILED RESULTING FROM ADULT FELONY ARRESTS, 1993
By Type of Disposition
Source: Table 38.
CONVICTED
79.4%
I ACQUITTED
.4%
CONVICTION RATES (continued)
Conviction rates based on total complaints filed describe the courts' treatment of defendants. This method of calculation eliminates law enforcement releases and prosecutor complaints denied (areas over which the court system has no control) from the computational formula.
Formulas used to calculate conviction rates based on total adult felony arrest dispositions and total complaints filed can be found in the Appendix.
ADULT DiSPOSITIONS 83
..
-. • IV .. • G'_~ --,
.. -. ~ • ~
, • '" .. • ..
., ,'"
• •
.~
~ . . •• , ".
ADULT CORRECTIONS
86 CRIME & DELINQUENCY, 1993
WHAT IS ADULT CORRECTIONS?
Adults convicted in California courts are frequently placed under the jurisdiction of either the state correctional ... ystem or a correctional system operated by local government. The state correctional system provides confinement, rehabilitation, and parole services through the California Department of Corrections (CDC) which includes the California Rehabilitation Center (CRC). The state correctional system also includes the California Youth Authority (CYA) and the California Department of Mental Health (CDMH). Local correctional agencies provide confinement, rehabilitation, and probation services for those sentenced to their care and also house persons awaiting trial or sentencing.
HOW ARE ADULTS UNDER SUPERVISION COUNTED?
Supervision data are obtained annually by taking a one-day count of persons in state or local institutions, or who are on parole, probation, or outpatient status.
WHAT IS A RATE?
A rate describes the number of events that occur within a given population. The formula for calculating an adult correction rate can be found in the Appendix.
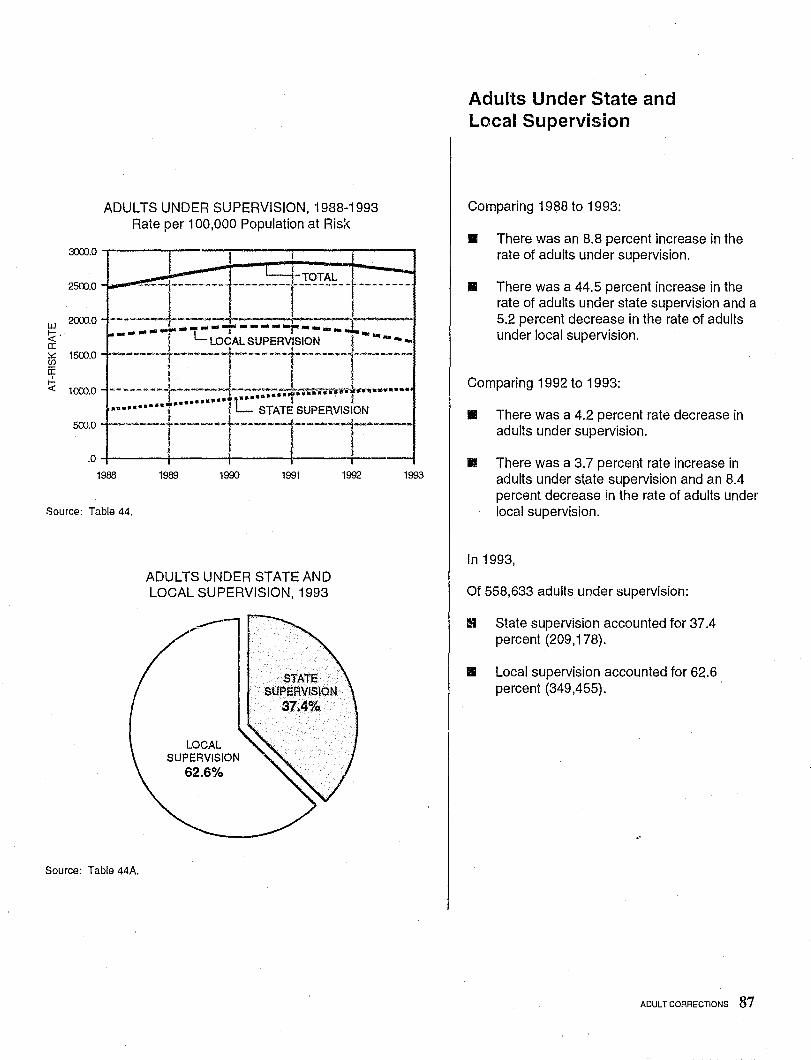
UJ
!::i:' a: ~ en a: ~
3(0).0
251110
2000.0
1500.0
1000.0
500.0
ADULTS UNDER SUPERVISION, 1988-1993 Rate per 100,000 Population at Risk
_~ __ I ____ -,~ __ , jl _________ '~_C'<I~_ -t ___ --__ _ I I
-:-::-::..::--,; - :r==-==-':F:':'':': =±:--! L LOCAL SUPERVISION !"'''''''", -i-----r------r-------l-------
------- --;--------MI--·--I«-~l_,,-~"'-ti:~'i'li.,'if ............ . i ......... _ , •••• " •••• ,........ i
.., ••.••. •. ,.. I L...... STATE SUPERVISION
--------!--------l..--------4------,-1------'I I .04-------~--------~--------~-----_r----~
1988 1989 1990 1991 1992 1993
Source: Table 44.
Source: Table 44A.
ADULTS UNDER STATE AND LOCAL SUPERVISION, 1993
LOCAL SUPERVISION
62.6%
STATE SUPERVISION
37.4%
Adults Under State and Local Supervision
Comparing 1988 to 1993:
• There was an 8.8 percent increase in the rate of adults under supervision.
• There was a 44.5 percent increase in the rate of adults under state supervision and a 5.2 percent decrease in the rate of adults under local supervision.
Comparing 1992 to 1993:
• There was a 4.2 percent rate decrease in adults under supervision.
II There was a 3.7 percent rate increase in adults under state supervision and an 8.4 percent decrease in the rate of adults under local supervision.
In 1993,
Of 558,633 adults under supervision:
It State supervision accounted for 37.4 percent (209,178).
• Local supervision accounted for 62.6 percent (349,455).
ADULT CORRECTIONS 87
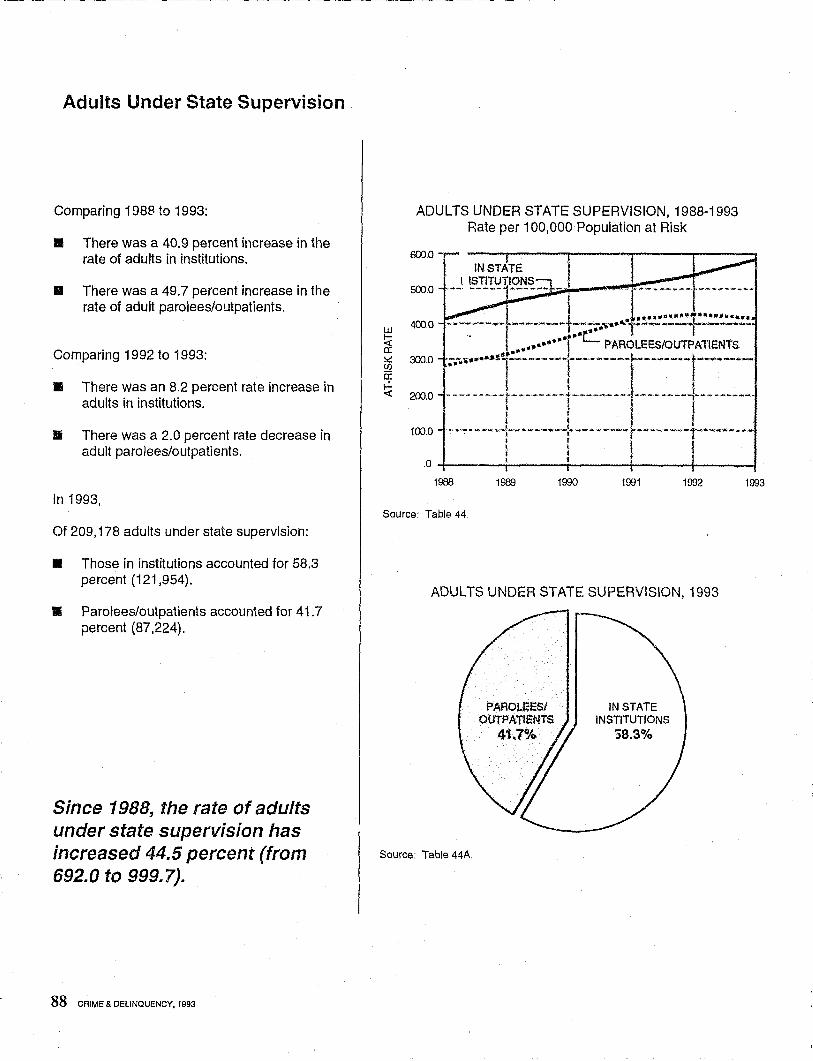
----------------------
Adults Under State Supervision
Comparing 1988 to 1993:
• There was a 40.9 percent increase in the rate of adults in institutions.
.. There was a 49.7 percent increase in the rate of adult parolees/outpatients.
Comparing 1992 to 1993:
II There was an 8.2 percent rate increase in adults in institutions.
II There was a 2.0 percent rate decrease in adult parolees/outpatients.
In 1993,
Of 209,178 adults under state supervision:
• Those in institutions accounted for 58.3 percent (121,954).
II Parolees/outpatients accounted for 41.7 percent (87,224).
Since 1988, the rate of adults under state supervision has increased 44.5 percent (from 692.0 to 999.7).
88 CRIME & DELINQUENCY, 1993
----- -- -- - -
UJ
~ ~ U)
iI
~
ADULTS UNDER STATE SUPERVISION, 1988-1993 Rate per 100,000 Population at Risk
6000
500.0
400.0
300.0
200.0
100.0
.04-----~------~----~------~----~ 1988 1989 1990 1991 1992
Source: Table 44.
ADULTS UNDER STATE SUPERVISION, 1993
Source: Table 44A.
PAROLEESI OUTPATIENTS
41.7%
IN STATE INSTITUTIONS
58.3%
1993
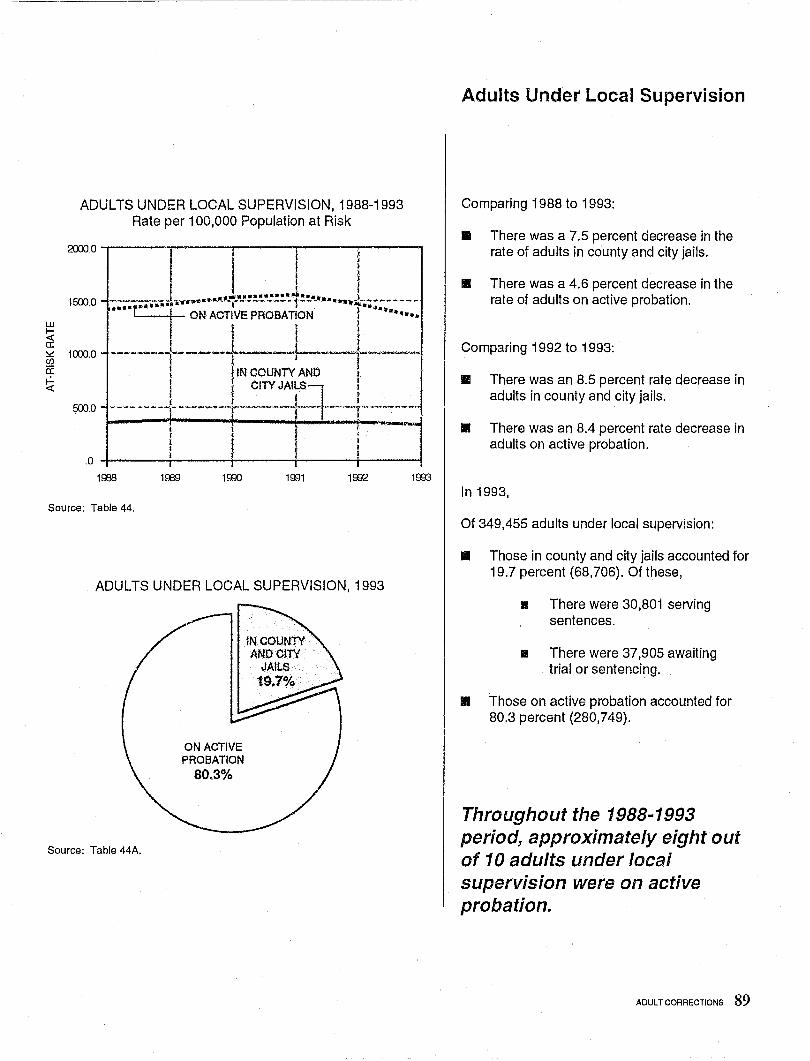
UJ
~ a: ~ Cf)
a: ~
ADULTS UNDER LOCAL SUPERVISION, 1988-1993 Rate per 100,000 Population at Risk
2(XXlO
1500.0
1000.0
500.0
I I I ! " . ..,, __ •• J, __ .... J.'''''.~!! ~1,,· ..... _L ........ .... r' ..... j I ..... ~.
ON ACTIVE PROBATION ! .......... i I I
"'----+---1'-+---I IN COUNTY AND l I CITY JAILS- i ---- -----l- -_ .. -----,·-~"··--~,,-·,-1·-·'"~ • ---w,-·t·" .. -·----
• I
I , I I I I I I
.0
1008 1009 1000 1001 1002 1003
Source: Table 44,
ADULTS UNDER LOCAL SUPERVISION, 1993
Source: Table 44A.
ON ACTIVE PROBATION
80.3%
Adults Under Local Supervision
Comparing 1988 to 1993:
.. There was a 7.5 percent decrease in the rate of adults in county and city jails.
• There was a 4.6 percent decrease in the rate of adults on active probation.
Comparing 1992 to 1993:
• There was an 8.5 percent rate decrease in adults in county and city jails.
• There was an 8.4 percent rate decrease in adults on active probation.
In 1993,
Of 349,455 adults under local supervision:
.. Those in county and city jails accounted for 19.7 percent (68,706). Of these,
II There were 30,801 serving sentences.
II There were 37,905 awaiting trial or sentencing.
• Those on active probation accounted for 80.3 percent (280,749).
Throughout the 1988-1993 period, approximately eight out of 10 adults under local supervision were on active probation.
ADULT CORRECTIONS 89
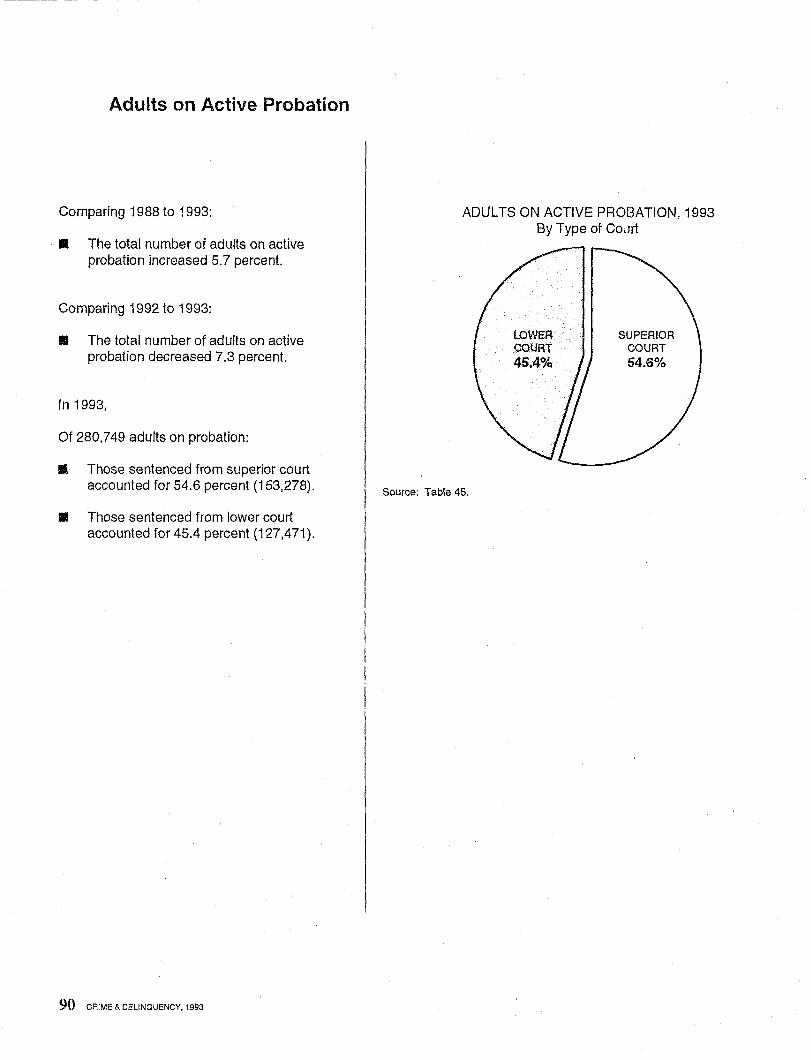
Adults on Active Probation
Comparing 1988 to 1993:
• The total number of adults on active probation increased 5.7 percent.
Comparing 1992 to 1993:
• The total number of adults on active probation decreased 7.3 percent.
In 1993.
Of 280,749 adults on probation:
• Those sentenced from superior court accounted for 54.6 percent (153,278).
• Those sentenced from lower court accounted for 45.4 percent (127,471).
90 CAl ME & DELINQUENCY, 1993
ADULTS ON ACTIVE PROBATION, 1993 By Type of COJrt
Source: Table 45.
LOWER COIJRT 45.4%
SUPERIOR COURT 54.6%
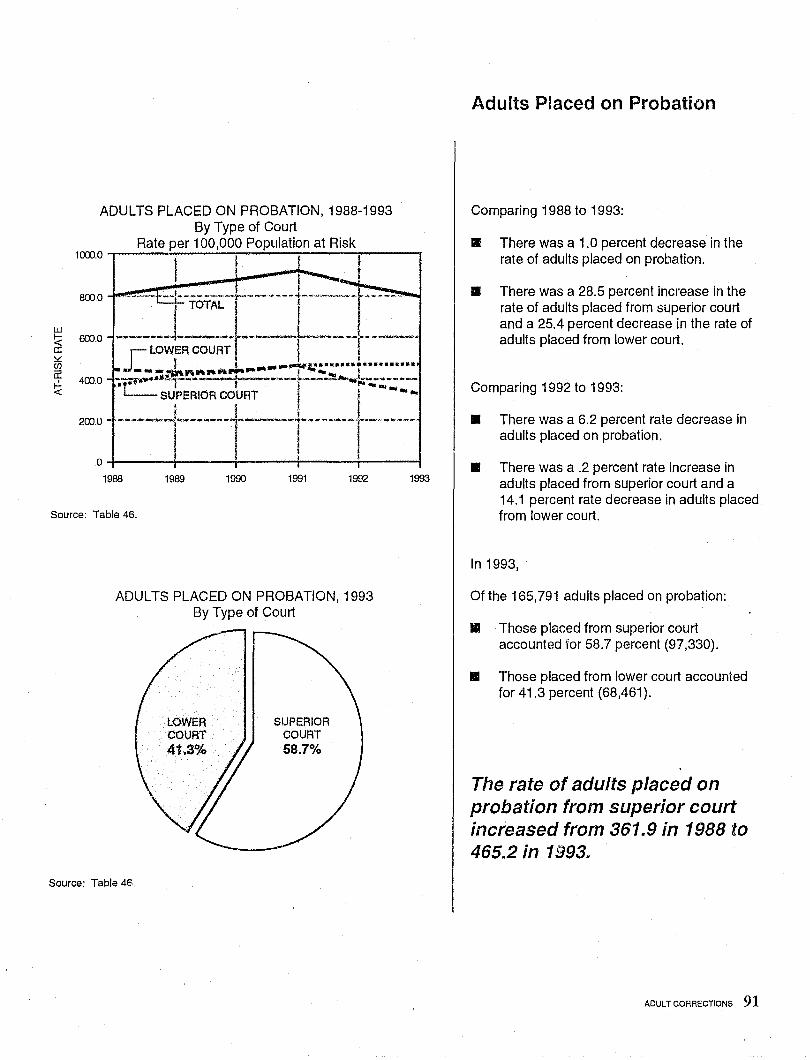
ADULTS PLACED ON PROBATION, 1988-1993 By Type of Court
Rate per 100,000 Population at Risk 1CXXJ.0 -r----=-J--~-;--.....;.---;"'---rl --~
; I ..... !_-800.0 ._. __ M._· _~I _____ '--'--r----'----+--'='-'-~"~-
~ 0».0 .. -~~~l;;~--+--t---Vi r. I I .. __ I: ........ ~ ......... . ~ 400.0 ·L::::J;;;IO;~~t;;----- -------r-:::::.: a: ---~ftl'l .. ft-...... t....... ·
I j. I ~.O ---r-----1--l----r-----
. 0 ! I I
1988 1989 1990 1991 1992
Source: Table 46.
ADULTS PLACED ON PROBATION, 1993 By Type of Court
Source: Table 46 ..
LOWER COURT 41.3%
SUPERIOR COURT 58.7%
1993
Adults Placed on Probation
Comparing 1988 to 1993:
• There was a 1.0 percent decrease in the rate of adults placed on probation.
• There was a 28.5 percent increase in the rate of adults placed from superior court and a 25.4 percent decrease in the rate of adults placed from lower court.
Comparing 1992 to 1993:
• There was a 6.2 percent rate decrease in adults placed on probation .
• There was a .2 percent rate increase in adults placed from superior court and a 14.1 percent rate decrease in adults placed from lower court.
In 1993,
Of the 165,791 adults placed on probation:
II Those plc:ced from superior court accounted 1'0r 58.7 percent (97,330).
• Those placed from lower court accounted for 41.3 percent (68,461).
The rate of adults placed on probation from superior court increased from 361.9 in 1988 to 465.2 in 1993.
ADULT CORRECTIONS 91
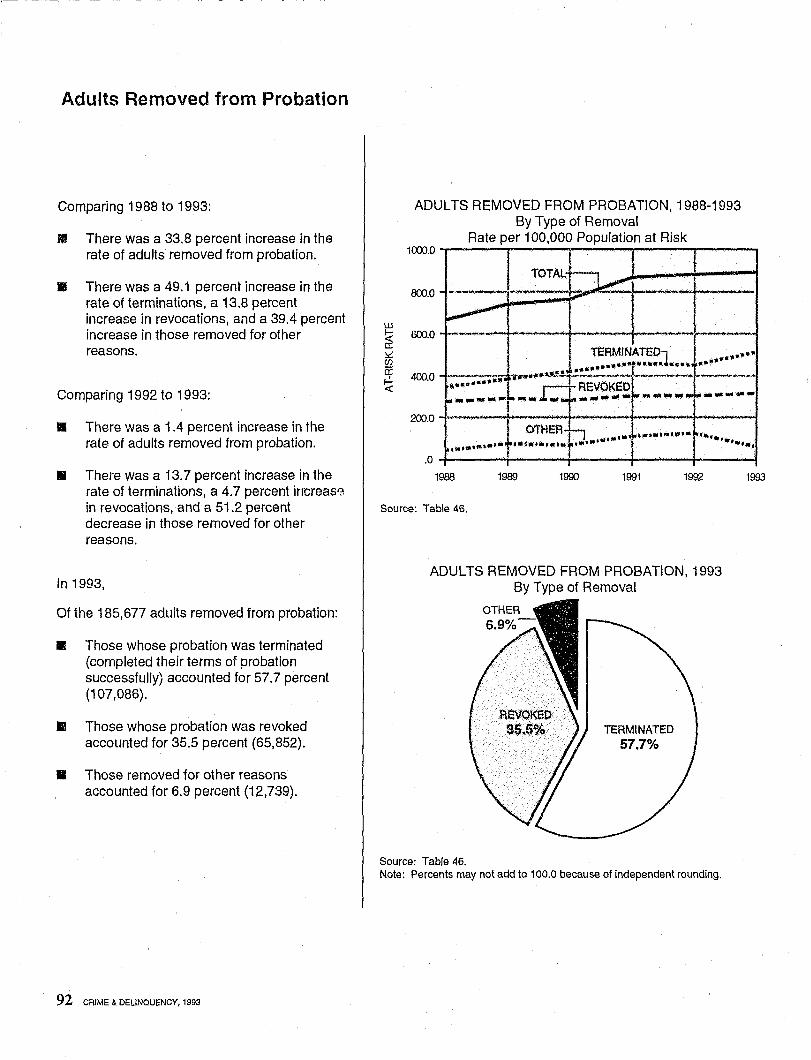
Adults Removed from Probation
Comparing 1988 to 1993:
II There was a 33.8 percent increase in the rate of adults removed from probation.
II There was a 49.1 percent increase in the rate of terminations, a 13.8 percent increase in revocations, and a 39.4 percent increase in those removed for other reasons.
Comparing 1992 to 1993:
• There was a 1.4 percent increase in the rate of adults removed from probation.
• There was a 13.7 percent increase in the rate of terminations, a 4,7 percent increase in revocations, and a 51.2 percent decrease in those removed for other reasons.
In 1993,
Of the 185,677 adults removed from probation:
II Those whose probation was terminated (completed their terms of probation successfully) accounted for 57.7 percent (107,086).
.. Those whose probation was revoked accounted for 35.5 percent (65,852).
• Those removed for other reasons accounted for 6.9 percent (12,739).
92 CRIME & DELINQUENCY, 1993
w
~ ~ rn a: f-.!. «
ADULTS REMOVED FROM PROBATION, 1988-1993 By Type of Removal
Rate per 100,000 Population at Risk l<XXl.O
I
800.0
TOTAL Lk --~ l.O"'" --~
600.0 --,- ---400.0
T.~~:-!~~~:?1 .... . ... .,. ....... .- .... ____ , .. j" ......... o_I::_ .... _~ ------ ----_ ... ..... ...... ,r:: i'" REVOKJ::D ................ ~ ......... -j" ... ... _ ioo"'" WI ..... for .......... -
200.0 I I OTHER 0 .... ·····, ~ ...•... " .. .. ,., .... + .. 1 • .,.' ....
"'-... '.".;., ... I
.0
1988 1900 1990 1991 1992 1993
Source: Table 46.
ADULTS REMOVED FROM PROBATION, 1993 By Type of Removal
Source: Table 46.
TERMINATED 57.7%
Note: Percents may not add to 100.0 because of independent rounding.
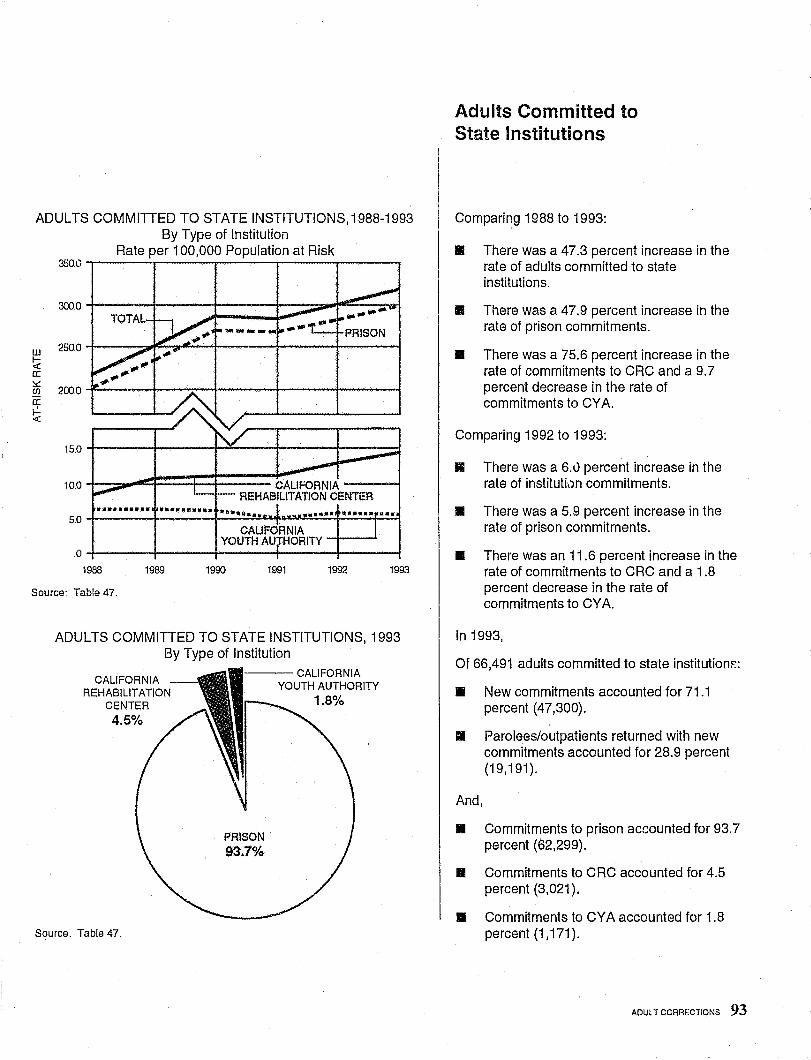
ADULTS COMMITTED TO STATE INSTITUTIONS,1988-1993 By Type of Institution
w ~ a: ~ C/)
a: f-!-«
350,0
300,0
250,0
200,0
15,0
10,0
Rate per 100,000 Population at Risk
-!---"::'---~==4=t==~C~A;L1;;FOANIA ----I L...-.-i---- REHABILITATION CENTER
.•.....••. • ••••••• ~. ••••••• ..~.. • ••••• u •• 5,0 +-_____ I--__ -l_.....;;.=IIJI.II,,~:t.lLlL:=~=~~
CALIFORNIA YOUTH AU HORITY -i-----"
,O+-------I------~------r_----~----~
1988 1989 1990 1991 1992 1993
Source: Table 47,
ADULTS COMMITTED TO STATE INSTITUTIONS, 1993 By Type of Institution
CALIFORNIA REHABILITATION
CENTER
4.5%
Source: Table 47.
--- CALIFORNIA YOUTH AUTHORITY
PRISON 93.7%
1.8%
Adults Committed to State Institutions
Comparing 1988 to 1993:
• There was a 47.3 percent increase in the rate of adults committed to state institutions.
• There was a 47.9 percent increase in the rate of prison commitments.
• There was a 75.6 percent increase in the rate of commitments to CRC and a 9.7 percent decrease in the rate of commitments to CY A.
Comparing 1992 to 1993:
II There was a 6.u percent increase in the rate of institution commitments.
• There was a 5.9 percent increase in the rate of prison commitments.
• There was an 11.6 percent increase in the rate of commitments to CRG and a 1.8 percent decrease in the rate of commitments to CY A.
In 1993,
Of 66,491 adults committed to state institutionf::
• New commitments accounted for 71.1 percent (47,300).
iii Parolees/outpatients returned with new commitments accounted for 28.9 percent (19,191).
And,
• Commitments to prison accounted for 93.7 percent (62,299).
• Commitments to CRG accounted for 4.5 percent (3,021).
• Commitments to GY A accounted for 1.8 percent (1,171).
ADULT CORRECTIONS 93
. .....,.. 1 ,,-
• T -I' , .1 • -.. ... .... •• --. i- • 8 .. .' I ...
'" ...
-~ -. S • ~ '" .. '" ~i
, ... ~ ~t
--
.\
• • • •
-~
-..
- --~ -- - -~'-~I-~-
lit _ _ -...
- -~ ~ ~ • - - .. -
••
CRIMINAL JUSTICE
EXPENDITURES AND
PERSOt~NEL
96 CRIME & DELINQUENCY. 1993
HOW ARE EXPENDITURE AND PERSONNEL DATA REPORTED?
Expenditure data are obtained from the State of California's Governor's BUdget and the annual report of financial transactions concerning cities and counties in California Both reports are provided by the Office of the State Controller.
Included in the criminal justice expenditures are salaries and employee benefits, services, and supplies. Capital expenditures and monies derived from federal and state grants are excluded. Expenditures by the Department of Justice and other regulatory agencies are also excluded.
Personnel data are obtained from the State of California's Governor's Budget, the annual report of the Administrative Office of the Courts, and personnel surveys (one-day counts) conducted by staff of the Department of Justice. Personnel counts for the Department of Justice and other regulatory agencies are not included.
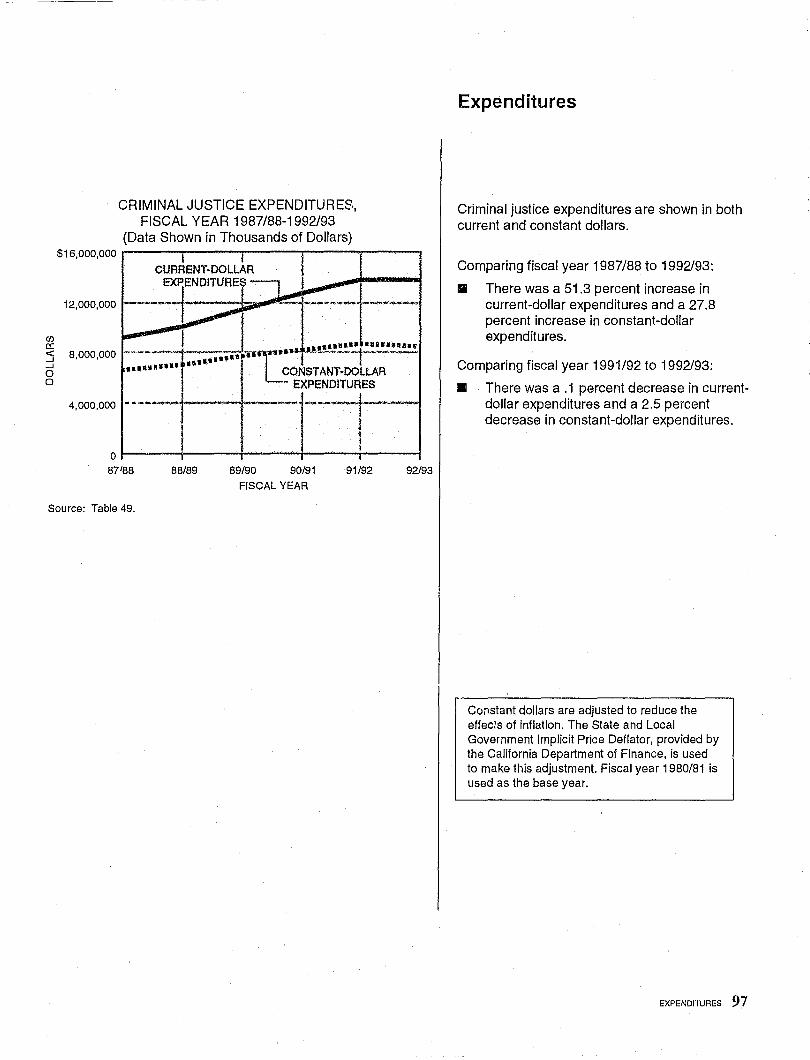
CRIMINAL JUSTICE EXPENDITURES, FISCAL YEAR 1987/88-1992/93
(Data Shown in Thousands of Dollars) $16,000,000 r-----,,----,----..,----r----,
(j) c:
12,000,000
:5 8,000,000 c5 ••••• w •• •• o
4,000,000 - - --.----'1-----+-
0~-----+------4-----~~----~---~
87188 88/89 89/90 90/91 91/92 92/93
FISCAL YEAR
Source: Table 49.
Expenditures
Criminal justice expenditures are shown in both current and constant dollars.
Comparing fiscal year 1987/88 to 1992193:
III There was a 51.3 percent increase in current-dollar expenditures and a 27.8 percent increase in constant-dollar expenditures.
Comparing fiscal year 1991/92 to 1992/93:
• There was a .1 percent decrease in currentdollar expenditures and a 2.5 percent decrease in constant-dollar expenditures.
COl1stant dollars are adjusted to reduce the effec~s of inflation. The State and Local Govemment Implicit Price Deflator, provided by the California Department of Finance, is used to make this adjustment. Fiscal year 1980/81 is used as the base year.
EXPENDITURES 97
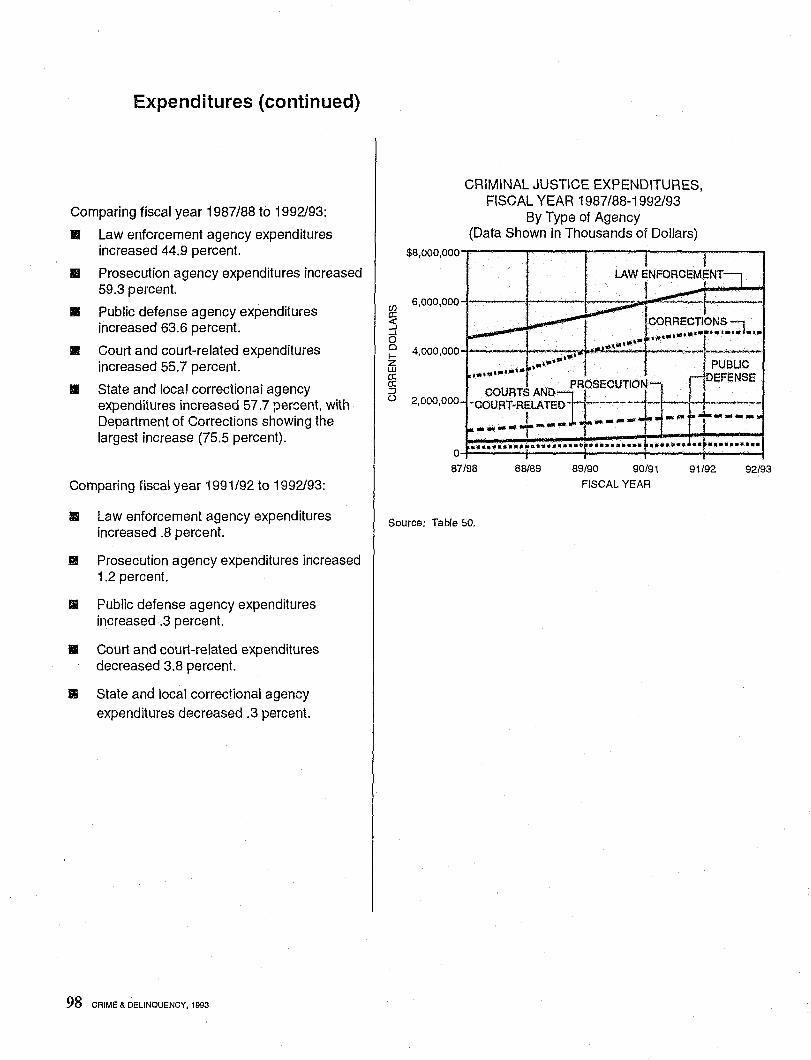
Expenditures (continued)
Comparing fiscal year 1987/88 to 1992193:
II Law enforcement agency expenditures increased 44.9 percent.
1/1 Prosecution agency expenditures increased 59.3 percent. ..
III
II
Public defense agency expenditures increased 63.6 percent.
Court and court-related expenditures increased 55.7 percent.
State and local correctional agency expenditures increased 57.7 percent, with Department of Corrections showing the largest increase (75.5 percent).
Comparing fiscal year 1991/92 to 1992193:
III Law enforcement agency expenditures increased .8 percent.
B Prosecution agency expenditures increased 1.2 percent.
III Public defense agency expenditures increased .3 percent.
• Court and court-related expenditures decreased 3.8 percent.
II State and local correctional agency expenditures decreased .3 percent.
98 CRIME & DELINQUENCY. 1993
CRIMINAL JUSTICE EXPENDITURES, FISCAL YEAR 1987/88-1992/93
By Type of Agency (Data Shown in Thousands of Dollars)
$8.000.000,.----r----.,..---,..-----r-----,
en 6)OOO,ooo-l----·I-----+-----:~> ~!!!!-'--+----l
~ ~ 1~~~~:;~;:~.~ .. ::1.' .. g ..... ····r ~ 4.000.000-f----""".-... -........ -•• -to.· f---~~~- -;~~L;;~-c: /............. . EFENSE § COURTS AND PROSECUTION - l o 2,000,000 ~COURT*R+ELATeD- .--------±..... -1------
.. ---- .. pili I .... ------ ..... 01-------~----_r------+_-----+------4 671gB 88/B9 89/90 90/91 91/92 92/93
FISCAL YEAR
Source: Table 50.
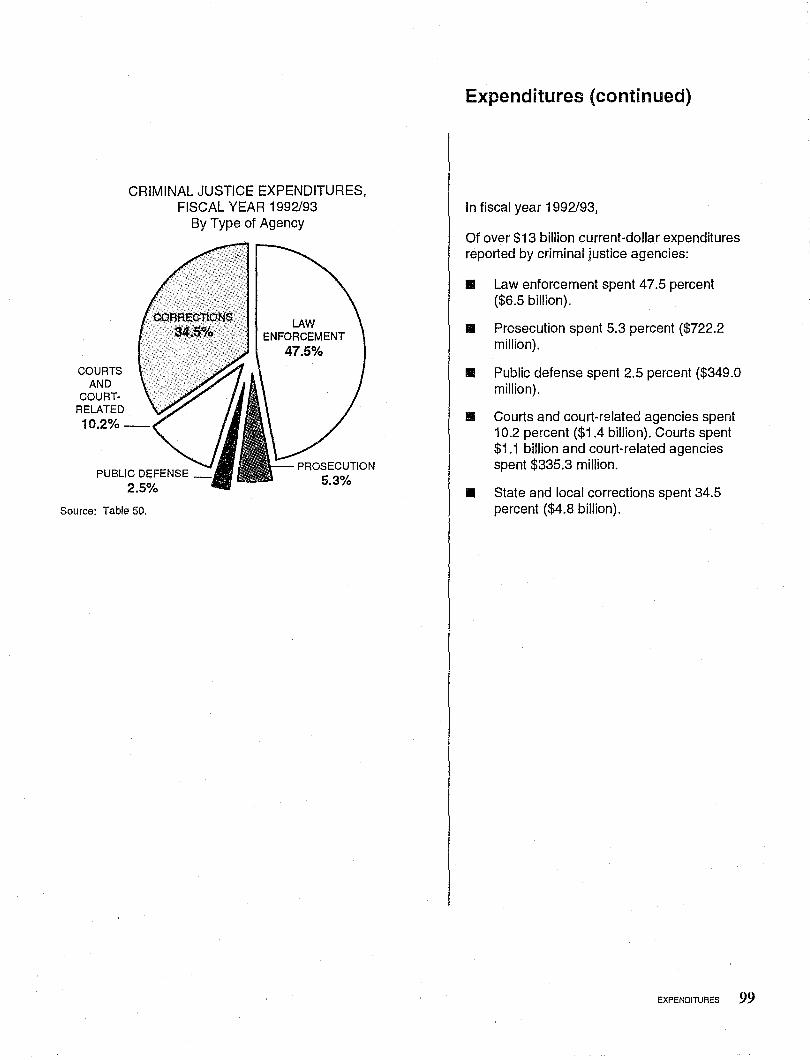
CRIMINAL JUSTICE EXPENDITURES, FISCAL YEAR 1992193
COURTS AND
COURTRELATED 10.2%-
Source: Table 50.
By Type of Agency
LAW ENFORCEMENT
47.5%
Expenditures (continued)
In fiscal year 1992193,
Of over $13 billion current-dollar expenditures reported by criminal justice agencies:
II Law enforcement spent 47.5 percent ($6.5 billion).
II Prosecution spent 5.3 percent ($722.2 million).
• Public defense spent 2.5 percent ($349.0 million).
II Courts and court-related agencies spent 10.2 percent ($1.4 billion). Courts spent $1.1 billion and court-related agencies spent $335.3 million.
• State and local corrections spent 34.5 percent ($4.8 billion).
EXPENDITURES 99
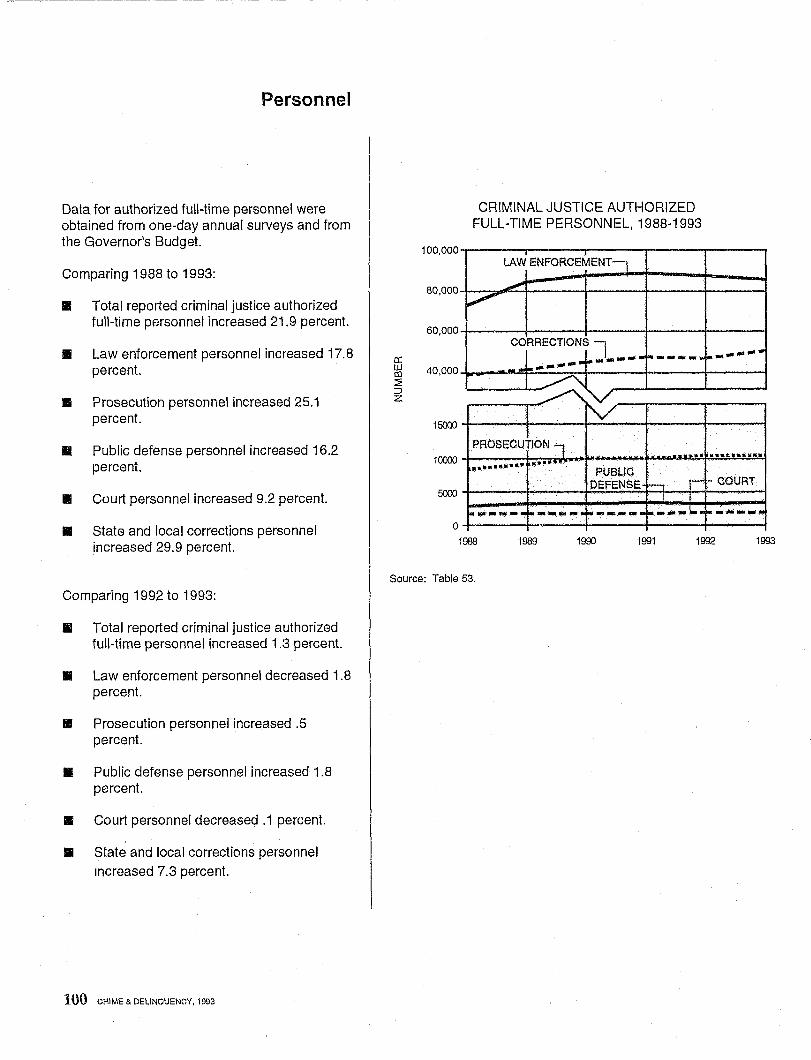
Personnel
Data for authorized full-time personnel were obtained from one-day annual surveys and from the Governor's Budget.
Comparing 1988 to 1993:
II Total reported criminal justice authorized full-time personnel increased 21.9 percent.
II Law enforcement personnel increased 17.8 percent.
.. Prosecution personnel increased 25.1 percent.
.. Public defense personnel increased 16.2 percent.
II Court personnel increased 9.2 percent.
II State and local corrections personnel increased 29.9 percent.
Comparing 1992 to 1993:
II Total reported criminal justice authorized full-time personnel increased 1 .3 percent.
.. Law enforcement personnel decreased 1.8 percent.
III Prosecution personnel increased .5 percent.
II Public defense personnel increased 1.8 percent.
II Court personnel decreased .1 percent.
II State and local corrections personnel
Increased 7.3 percent.
100 CRIME & DELINOUENCY, 1993
ex: UJ co :2 :J z
100,000 -
80,000 -
60,000
40,000
15000
CRIMINAL JUSTICE AUTHORIZED FULL-TIME PERSONNEL, 1988-1993
LAW ENFORCEMENT-l
...."".. ~
CORRECTIONS l ~1IIiI"' __ "" ,.:..--_ ..... 1._---
~
... -..........
0~----_;-~----;_------r_----~----__4
1988 1989 1990 1991 1992 1993
Source: Table 53.
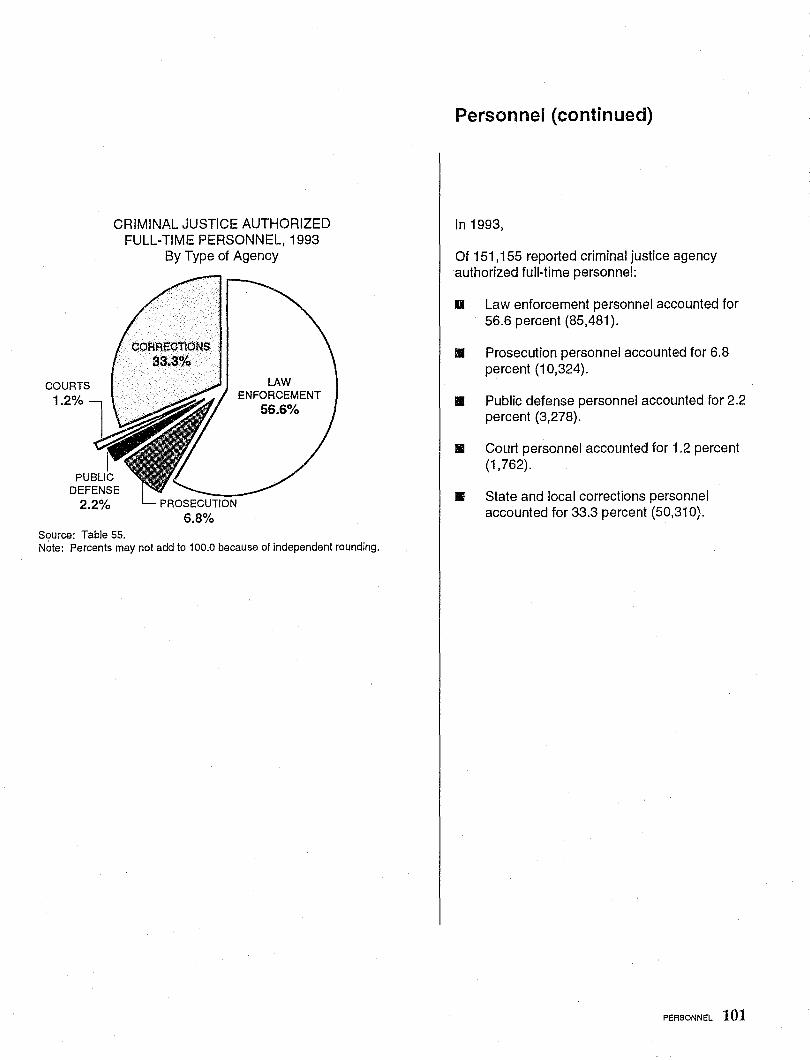
CRIMINAL JUSTICE AUTHORIZED FULL-TIME PERSONNEL, 1993
By Type of Agency
Source: Table 55.
CORRECTIONS 33.3%
LAW ENFORCEMENT
56.6%
Note: Percents may not add to 100.0 because of independent rounding.
Personnel (continued)
In 1993,
Of 151,155 reported criminal justice agency authorized full-time personnel:
II Law enforcement personnel accounted for 56.6 percent (85,481).
• Prosecution personnel accounted for 6.8 percent (10,324).
• Public defense personnel accounted for 2.2 percent (3,278).
II Court personnel accounted for 1.2 percent (1,762).
III State and local corrections personnel accounted for 33.3 percent (50,310).
PERSONNEL I01
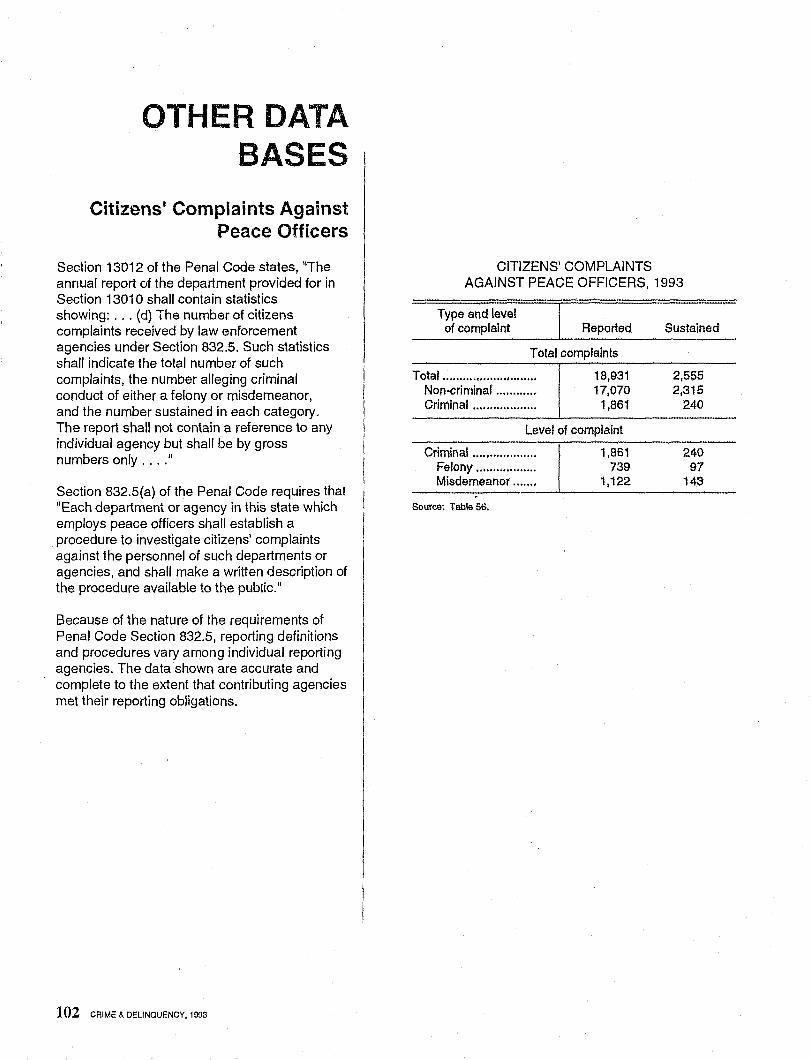
OTHER DATA BASES
Citizens' Complaints Against Peace Officers
Section 13012 of the Penal Code states, liThe annual report of the department provided for in Section 13010 shall contain statistics showing: ... (d) The number of citizens complaints received by law enforcement agencies under Section 832.5. Such statistics shall indicate the total number of such complaints, the number alleging criminal conduct of either a felony or misdemeanor, and the number sustained in each category. The report shall not contain a reference to any individual agency but shall be by gross numbers only .... "
Section 832.5(a) of the Penal Code requires that "Each department or agency in this state which employs peace officers shall establish a procedure to investigate citizens' complaints against the personnel of such departments or agencies, and shall make a written description of the procedure available to the public."
Because of the nature of the requirements of Penal Code Section 832.5, reporting definitions and procedures vary among individual reporting agencies. The data shown are accurate and complete to the extent that contributing agencies met their reporting obligations.
102 CAIME & DELINQUENCY, 1993
CITIZENS' COMPLAINTS AGAINST PEACE OFFICERS, 1993
Type and level of complaint Reported Sustained
Total complaints
Total......... ................... 18,931 2,555 Non-criminal............ 17,070 2,316 Criminal................... 1,861 240
Level of complaint
Criminal .................. . Felony ................. . Misdemeanot ...... .
Source: Table 56.
1,861 739
1,122
240 97
143
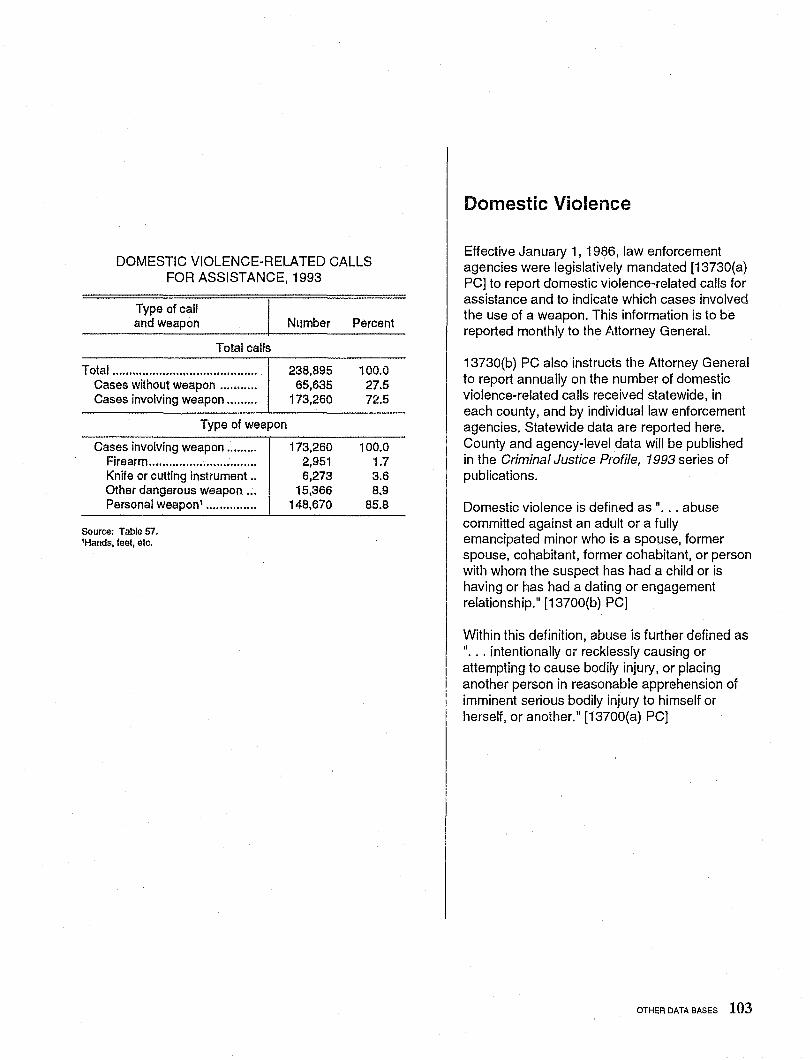
DOMESTIC VIOLENCE-RELATED CALLS FOR ASSISTANCE, 1993
Type of call and weapon
Total calls
Total ......................................... .. Cases without weapon ......... .. Cases involving weapon ....... ..
Type of weapon
Cases involving weapon ........ . Firearm ............................... . Knife or cutting instrument .. Other dangerous weapon .. . Personal weapon' ............. ..
Source: Table 57. 'Hands, feet, etc.
Nllmber Percent
238,895 65,635
173,260
173,260 2,951 6,273
15,366 148,670
100.0 27.5 72.5
100.0 1.7 3.6 8.9
85.8
Domestic Violence
Effective January 1, 1986, law enforcement agencies were legislatively mandated [13730(a) PC] to report domestic violence-related calls for assistance and to indicate which cases involved the use of a weapon. This information is to be reported monthly to the Attorney General.
13730(b) PC also instructs the Attorney General to report annually on the number of domestic violence-related calls received statewide, in each county, and by individual law enforcement agencies. Statewide data are reported here. County and agency-level data will be published in the Criminal Justice Profile, 1993 series of publications.
Domestic violence is defined as " ... abuse committed against an adult or a fully emancipated minor who is a spouse, former spouse, cohabitant, former cohabitant, or person with whom the suspect has had a child or is having or has had a dating or engagement relationship." [13700(b) PC]
Within this definition, abuse is further defined as " ... intentionally OJ recklessly causing or attempting to cause bodily injury, or placing another person in reasonable apprehension of imminent serious bodily injury to himself or herself, or another." [13700(a) PC]
OTHER DATA BASES 103
.. ~",
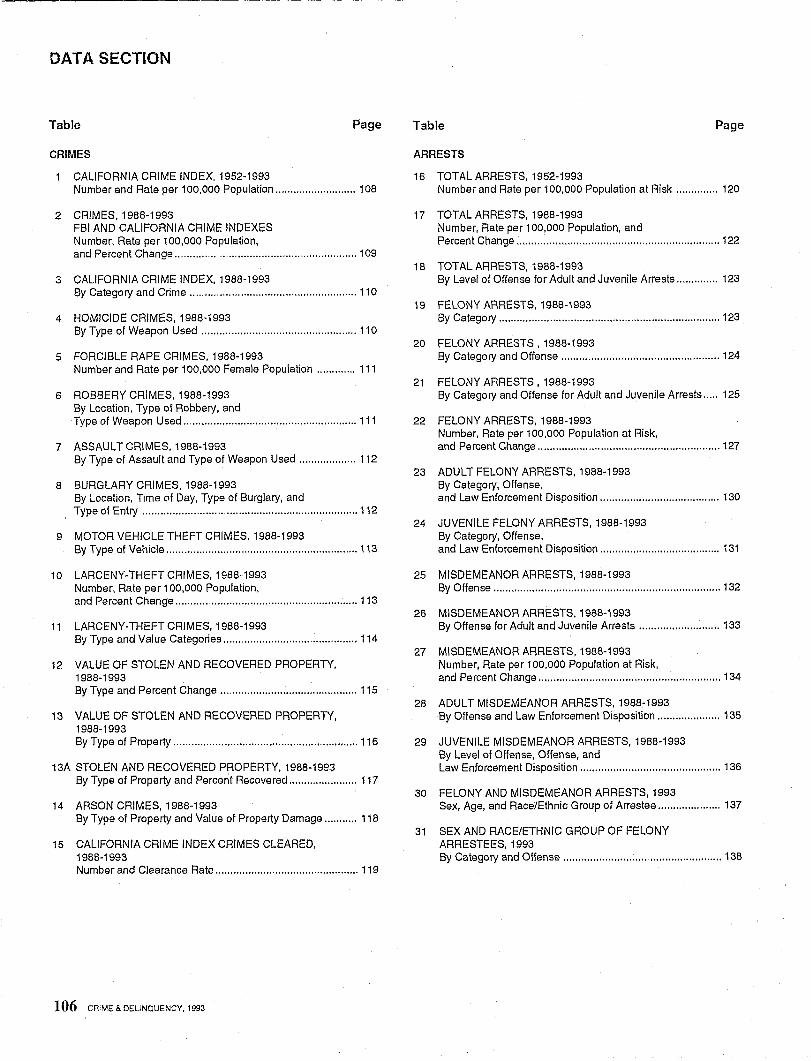
DATA SECTION
Table Page
CRIMES
CALIFORNIA CRIME INDEX, 1952-1993 Number and Rate per 100,000 Population ........................... 108
2 CRIMES, 1988-1993 FBI AND CALIFORNIA CRIME INDEXES Number, Rate per 100,000 Population, and Percent Change ............................................................. 109
3 CALIFORNIA CRIME INDEX, 1988-1993 By Category and Crime ........................................................ 110
4 HOMICIDE CRIMES, 1988·1993 By Type of Weapon Used ................................................... 110
5 FORCIBLE RAPE CRIMES, 1988-1993 Number and Rate per 100,000 Female Population ............. 111
6 ROBBERY CRIMES, 1988-1993 By Location, Type of Robbery, and Type of Weapon Used .......................................................... 111
7 ASSAULT CRIMES, 1988-1993 By Type of Assault and Type of Weapon Used ............... " .. 112
8 BURGLARY CRIMES, 1988-1993 By Location, Time (If Day, Type of Burglary, and Type of Entry ........................................................................ 112
9 MOTOR VEHICLE THEFT CRIMES, 1988-1993 By Type of Vehicle ................................................................ 113
10 LARCENY-THEFT CRIMES, 1988·1993 Number, Rate per 100,000 Population, and Percent Change ............................................................. 113
11 LARCENY·THEFT CRIMES, 1988-1993 By Type and Value Categories ............................................. 114
12 VALUE OF STOLEN AND RECOVERED PROPERTY, 1988·1993 By Type and Percent Change .............................................. 115
13 VALUE OF STOLEN AND RECOVERED PROPERTY, 1988·1993 By Type of Property .............................................................. 116
13A STOLEN AND RECOVERED PROPERTY, 1988-1993 By Type of Property and Percent Recovered ....................... 117
14 ARSON CRIMES, 1988·1993 By Type of Property and Value of Property Damage ........... 118
15 CALIFORNIA CRIME INDEX CRIMES CLEARED, 19BB·1993 Number and Clearance Rate ................................................ 119
106 GRIME & DELINOUENCY. 1993
Table Page
ARRESTS
16 TOTAL ARRESTS, 1952-1993 Number and Rate per 100,000 Population at Risk .............. 120
17 TOTAL ARRESTS, 1988-1993 Number, Rate per 100,000 Population, and Percent Change .................................................................... 122
1 B TOTAL ARRESTS, 1988-1993 By Level of Offense for Adult and Juvenile Arrests .............. 123
19 FELONY ARRESTS, 1988-1993 By Category .......................................................................... 123
20 FELONY ARRESTS, 1988-1993 By Category and Offense .................................................... 124
21 FELONY ARRESTS, 1988-1993 By Category and Offense for Adult and Juvenile Arrests ..... 125
22 FELONY ARRESTS, 1988-1993 Number, Rate per 100,000 Population at Risk, and Percent Change ............................................................. 127
23 ADULT FELONY ARRESTS, 1988·1993 By Category, Offense, and Law Enforcement Disposition ........................................ 130
24 JUVENILE FELONY ARRESTS, 1988-1993 By Category, Offense, and Law Enforcement Disposition ........................................ 131
25 MISDEMEANOR ARRESTS, 1988-1993 By Offense ............................................................................ 132
26 MISDEMEANOR ARRESTS, 1988-1993 By Offense for Adult and Juvenile Arrests ........................... 133
27 MISDEMEANOR ARRESTS, 1988-1993 Number, Rate per 100,000 Population at Risk, and Percent Change ............................................................. 134
28 ADULT MISDEMEANOR ARRESTS, 1988-1993 By Offense and Law Enforcement Disposition ..................... 135
29 JUVENILE MISDEMEANOR ARRESTS, 1988·1993 By Level of Offense, Offense, and Law Enforcement Disposition ............................................... 136
30 FELONY AND MISDEMEANOR ARRESTS, 1993 Sex, Age, and Race/Ethnic G roup of Arrestee ..................... 137
31 SEX AND RACE/ETHNIC GROUP OF FELONY ARRESTEES, 1993 By Category and Offense .................................................... 138
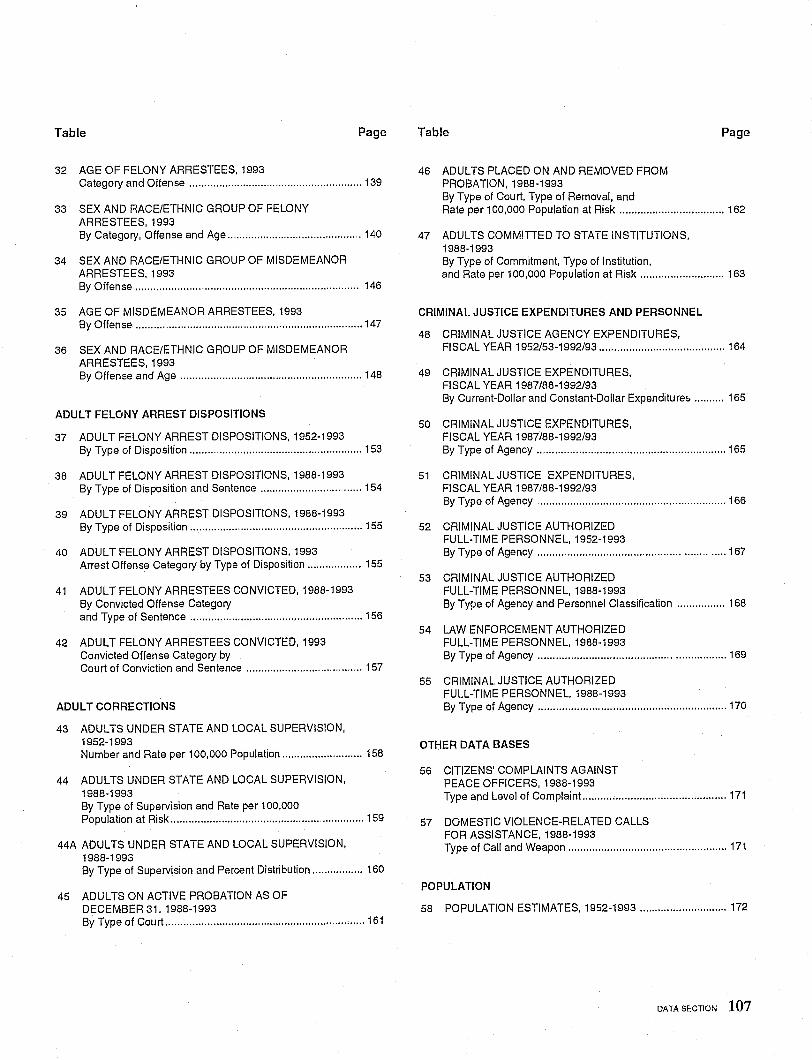
Table Page
32 AGE OF FELONY ARRESTEES, 1993 Category and Offense .......................................................... 139
33 SEX AND RACE/ETHNIC GROUP OF FELONY ARRESTEES, 1993 By Category, Offense and Age ............................................. 140
34 SEX AND RACE/ETHNIC GROUP OF MISDEMEANOR ARRESTEES. 1993 By Offense ........................................................................... 146
35 AGE OF MISDEMEANOR ARRESTEES, 1993 By Offense ............................................................................ 147
36 SEX AND RACE/ETHNIC GROUP OF MISDEMEANOR ARRESTEES, 1993 By Offense and Age ............................................................. 148
ADULT FELONY ARREST DISPOSITIONS
37 ADULT FELONY ARREST DISPOSITIONS, 1952-1993 By Type of Disposition .......................................................... 153
38 ADULT FELONY ARREST DISPOSITIONS, 1988-1993 By Type of Disposition and Sentence .................................. 154
39 ADULT FELONY ARREST DISPOSITIONS, 1988-1993 By Type of Disposition .......................................................... 155
40 ADULT FELONY ARREST DISPOSITIONS, 1993 Arrest Offense Category by Type of Disposition .................. 155
41 ADULT FELONY ARRESTEES CONVICTED, 1988-1993 By Convicted Offense Category and Type of Sentence .......................................................... 156
42 ADULT FELONY ARRESTEES CONVICTED, 1993 Convicted Offense Category by Court of Conviction and Sentence ....................................... 157
ADULT CORRECTIONS
43 ADULTS UNDER STATE AND LOCAL SUPERVISION, 1952-1993 Number and Rate per 100,000 Population ........................... 158
44 ADULTS UNDER STATE AND LOCAL SUPERVISION, 1988-1993 By Type of Supervision and Rate per 100,000 Population at Risk ................................................................. 159
44A ADULTS UNDER STATE AND LOCAL SUPERVISION, 1988-1993 By Type of Supervision and Percent Distribution ................. 160
45 ADULTS ON ACTIVE PROBATION AS OF DECEMBER 31.1988-1993 By Type of Court ........................................................ · .......... 161
Table
46 ADULTS PLACED ON AND REMOVED FROM PROBATION,1988-1993 By Type of Court, Type of Removal, and
Page
Rate per 100,000 Population at Risk ................................... 162
47 ADULTS COMMITIED TO STATE INSTITUTIONS, 1988-1993 By Type of Commitment, Type of Institution, and Rate per 100,000 Population at Risk ............................ 163
CRIMINAL JUSTICE EXPENDITURES AND PERSONNEL
48 CRIMINAL JUSTICE AGENCY EXPENDITURES, FISCAL YEAR 1952153-1992/93 .......................................... 164
49 CRIMINAL JUSTICE EXPENDITURES, FISCAL YEAR 1987/88-1992/93 By Current-Dollar and Constant-Dollar Expenditure& .......... 165
50 CRIMINAL JUSTICE EXPENDITURES, FI SCAL YEAR 1987/88-1992/93 By Type of Agency ............................................................... 165
51 CRIMINAL JUSTICE EXPENDITURES, FI SCAL YEAR 1987/88-1992/93 By Type of Agency ............................................................... 166
52 CRIMINAL JUSTICE AUTHORIZED FULL-TIME PERSONNEL, 1952-1993 By Type of Agency ............................................................. 167
53 CRIMINAL JUSTICE AUTHORIZED FULL-TIME PERSONNEL, 1988-1993 By Type of Agency and Personnel Classification ................ 168
54 LAW ENFORCEMENT AUTHORIZED FULL-TIME PERSONNEL, 1988-1993 By Type of Agency .............................................................. 169
55 CRIMINAL JUSTICE AUTHORIZED FULL-TIME PERSONNEL, 1988-1993 By Type of Agency ............................................................... 170
OTHER DATA BASES
56 CITIZENS' COMPLAINTS AGAINST PEACE OFFICERS, 1988-1993 Type and Level of Complain!. .............................................. 171
57 DOMESTIC VIOLENCE-RELATED CALLS FOR ASSISTANCE, 1988-1993 Type of Call and Weapon ..................................................... 171
POPULATION
58 POPULATION ESTIMATES, 1952-1993 ............................. 172
DATA SECTION 107
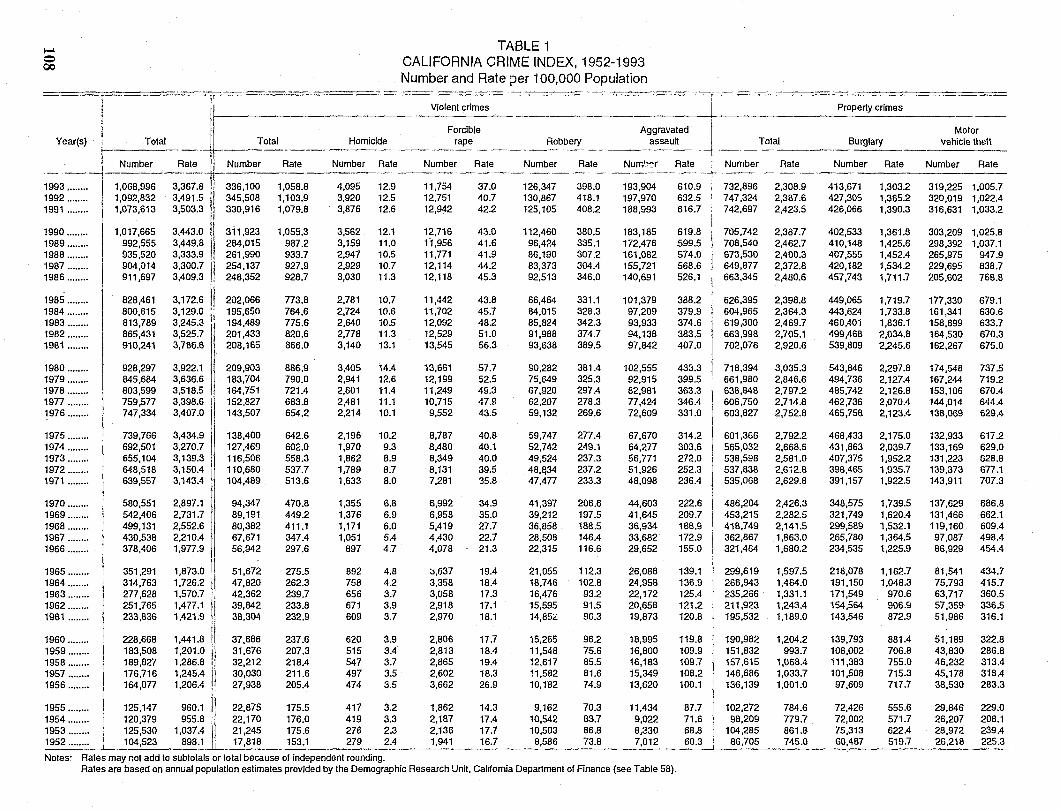
.... o 00
Year(s)
1993 ........ 1992 ........ 1991 ........
1990 ........ 1989 ........ 1988 ........ 1987 ........ 1986 ........
1985 ........ 1984 ........ 1983 ........ 1982 ........ 1981 ........
1980 ........ 1979 ........ 1978 ........ 1977 ........ 1976 ........
1975 ........ 1974 ........ 1973 ........ 1972 ........ 1971 ........
1970 ........ 1969 ........ 1968 ........ 1967 ........ 1966 ........
1965 ........ 1964 ........ 1963 ........ 1962 ........ 1961 ........
1960 ........ 1959 ........ 1958 ........ 1957 ........ 1956 ........
1955 ........ 1954 ........ 1953 ........ 1952 ........
I I I
Total
Number
1,068,996 1,092,832 1,073,613
1,017,665 992,555 935,520 904,014 911,697
828,461 800,615 813,789 865,431 910,241
928,297 845,684 803,599 759,577 747,334
739,766 692,501 655,104 648,518 639,557
580,551 542,406 499,131 430,538 378,406
351,291 314,763 277,628 251,765 233,836
228,668 183,508 189,827 176,716 164,077
125,147 120,379 125,530 104,523
Rate
3,367.8 3,491.5 3,503.3 I 3,443.0 3,449.8 3,333.9 3,300.7 3,409.3
3,172.6 3,129.0 I 3,245.3 3,525.7 3,786.6
3,922.1 3,636.6 3,518.5 3,398.6 3,407.0
3,434.9 3,270.7 3,139.3 3,150.4 3,143.4
2,897.1 2,731.7 2,552.6 2,210.4 1,977.9
11 1,873.0 'I
1,726.2 1,570.7 1,477.1 1,421.9
1,441.8 1,201.0 1,286.8 1,245.4
1,206.4 I 960.1 I 955.8 I
1,037.4 898.1
Total Homicide
Number Rate Number Rate
336,100 1,058.8 4,095 12.9 345,508 1,103.9 3,920 12.5 330,916 1,079.8 3,876 12.6
311,923 1,055.3 3,562 12.1 284,015 987.2 3.159 11.0 261,990 933.7 2,947 10.5 254,137 927.9 2,929 10.7 248,352 928.7 3,030 11.3
202,066 773.8 2,781 10.7 195,650 764.6 2,724 10.6 194,489 775.6 2,640 10.5 201,433 820.6 2,778 11.3 208,165 866.0 3,140 13.1
209,903 886.9 3,405 14.4 183,704 790.0 2,941 12.6 164,751 721.4 2,601 11.4 152,827 683.8 2,481 11.1 143,507 654.2 2,214 10.1
138,400 642.6 2,196 10.2 127,469 602.0 1,970 9.3 116,506 558.3 1,862 8.9 110,680 537.7 1,789 8.7 104,489 513.6 1,633 8.0
94,347 470.8 1,355 6.8 89,191 449.2 1,376 6.9 80,382 411.1 1,171 6.0 67,671 347.4 1,051 5.4 56,942 297.6 897 4.7
51,672 275.5 892 4.8 47,820 262.3 758 4.2 42,362 239.7 656 3.7 39,842 233.8 671 3.9 38,304 232.9 609 3.7
37,686 237.6 620 3.9 31,676 207.3 515 3.4 32,212 218.4 547 3.7 30,030 211.6 497 3.5 27,938 205.4 474 3.5
22,875 175.5 417 3.2 22,170 176.0 419 3.3 21,245 175.6 276 2.3 17,818 153.1 279 2.4
Notes: Rates may not add to subtotals or totat because 01 independent rounding.
TABLE 1 CALIFORNIA CRIME INDEX, 1952-1993 Number and Rate ;:>er 100,000 Population
Violent crimes ~--
Forcible Aggravated rape Robbery assauU
Number Rate Number Rate Nurr.!'~r Rate
11,754 37.0 126,347 398.0 193,904 610.9 12,751 40.7 130,867 418.1 197,970 632.5 12,942 42.2 125,105 408.2 188,993 616.7
12,716 43.0 112,460 380.5 183,185 619.8 11,956 41.6 96,424 335.1 172,476 599.5 11,771 41.9 86,190 307.2 161,082 574.0 12,114 44.2 83,373 304.4 155,721 568.6 12,118 45.3 92,513 346.0 140,691 526.1
11,442 43.8 86,464 331.1 101,379 388.2 11,702 45.7 84,015 328.3 97,209 379.9 12,082 48.2 85,824 342.3 93,933 374.6 12,529 51.0 91,988 374.7 94,138 383.5 13,545 56.3 93,638 389.5 97,842 407.0
13,661 57.7 90,282 381.4 102,555 433.3 12,199 52.5 75,649 325.3 92,915 399.5 11,249 49.3 67,920 297.4 82,981 363.3 10,715 47.9 62,207 278.3 77,424 346.4 9,552 43.5 59,132 269.6 72,609 331.0
8,787 40.8 59,747 277.4 67,670 314.2 8,480 40.1 52,742 249.1 64,277 303.6 8,349 40.0 49,524 237.3 56,771 272.0 8,131 39.5 48,1l34 237.2 51,926 252.3 7,281 35.8 47,477 233.3 48,098 236.4
6,992 34.9 41,397 206.6 44,603 222.6 6,958 35.0 39,212 197.5 41,645 209.7 5,419 27.7 36,858 188.5 36,934 188.9 4,430 22.7 28,508 146.4 33,682 172.9 4,078 21.3 22,315 116.6 29,652 155.0
~,637 19.4 21,055 112.3 26,088 139.1 3,358 18.4 18,746 102.8 24,958 136.9 3,058 17.3 16,476 93.2 22,172 125.4 2,918 17.1 15,595 91.5 20,658 121.2 2,970 18.1 14,85", 90.3 19,873 120.8
2,806 17.7 15,265 96.2 18,995 119.8 2,813 18.4 11,548 75.6 16,800 109.9 2,865 19.4 12,617 85.5 16,183 109.7 2,602 18.3 11,582 81.6 15,349 108.2 3,662 26.9 10,182 74.9 13,620 100.1
1,862 14.3 9,162 70.3 11,434 87.7 2,187 17.4 10,542 83.7 9,022 71.6 2,136 17.7 10,503 86.8 8,330 68.8 1,941 16.7 8,586 73.8 7,012 60.3
Rates are based on annual population estimates provided by the Demographic Research Unit, CalHomia Department of Finance (see Table 58).
I
I Property crimes
LTotal Motor
Burglary vehicle thea
I Number Rate Number Rate Number Rate
I 732,896 2,308.9 413,671 1,303.2 319,225 1,005.7 i 747,324 2,387.6 427,305 1,365.2 320,019 1,022.4
I 742,697 2,423.5 426,066 1,390.3 316,631 1,033.2
I 705,742 2,387.7 402,533 1,361.5 303,209 1,025.8 708,540 2,462.7 410,148 1,425.6 298,392 1,037.1 673,530 2,400.3 407,555 1,452.4 265,975 947.9 649,877 2,372.8 420,182 1,534.2 229,695 838.7 663,345 2,480.6 457,743 1,711.7 205,602 768.8
626,395 2,398.8 449,065 1,719.7 177,330 679.1 604,965 2,364.3 443,624 1,733.8 161,341 630.6 619,300 2,469.7 460,401 1,836.1 158,899 633.7 663,998 2,705.1 499,468 2,034.8 164,530 670.3 702,076 2,920.6 539,809 2,245.6 162,267 675.0
718,394 3,035.3 543,846 2,297.8 174,548 737.5 661,980 2,846.6 494,736 2,127.4 167,244 719.2 638,848 2,797.2 485,742 2,126.8 153,106 670.4 606,750 2,714.8 462,736 2,070.4 144,014 644.4 603,827 2,752.8 465,758 2,123.4 138,069 629.4
601,366 2,792.2 468,433 2,175.0 132,933 617.2 565,032 2,668.6 431,863 2,039.7 133,169 629.0 538,598 2,581.0 407,375 1,952.2 131,223 628.8 537,838 2,612.8 398,465 1,935.7 139,373 677.1 535,068 2,629.8 391,157 1,922.5 143,911 707.3
486,204 2,426.3 348,575 1,739.5 137,629 686.8 453,215 2,282.5 321,749 1,620.4 131,466 662.1 418,749 2,141.5 299,589 1,532.1 119,160 609.4 362,867 1,863.0 265,780 1,364.5 97,087 498.4 321,464 1,680.2 234,535 1,225.9 86,929 454.4
299,619 1,597.5 218,078 1,162.7 81,541 434.7 266,943 1,464.0 191,150 1,048.3 75,793 415.7 235,266 1,331.1 171,549 970.6 63,717 360.5 211,923 1,243.4 154,564 906.9 57,359 336.5 195,532 1,189.0 143,546 872.9 51,986 316.1
190,982 1,204.2 139,793 881.4 51,189 322.8 151,832 993.7 108,002 706.8 43,830 286.8 157,615 1,068.4 111,383 755.0 46,232 313.4 146,686 1,033.7 101,508 715.3 45,178 318.4 136,139 1,001.0 97,609 717.7 38,530 283.3
102,272 784.6 72,426 555.6 29,846 229.0 98,209 779.7 72,002 571.7 26,207 208.1
104,285 861.8 75,313 622.4 28,972 239.4 86,705 745.0 60,487 519.7 26,218 225.3
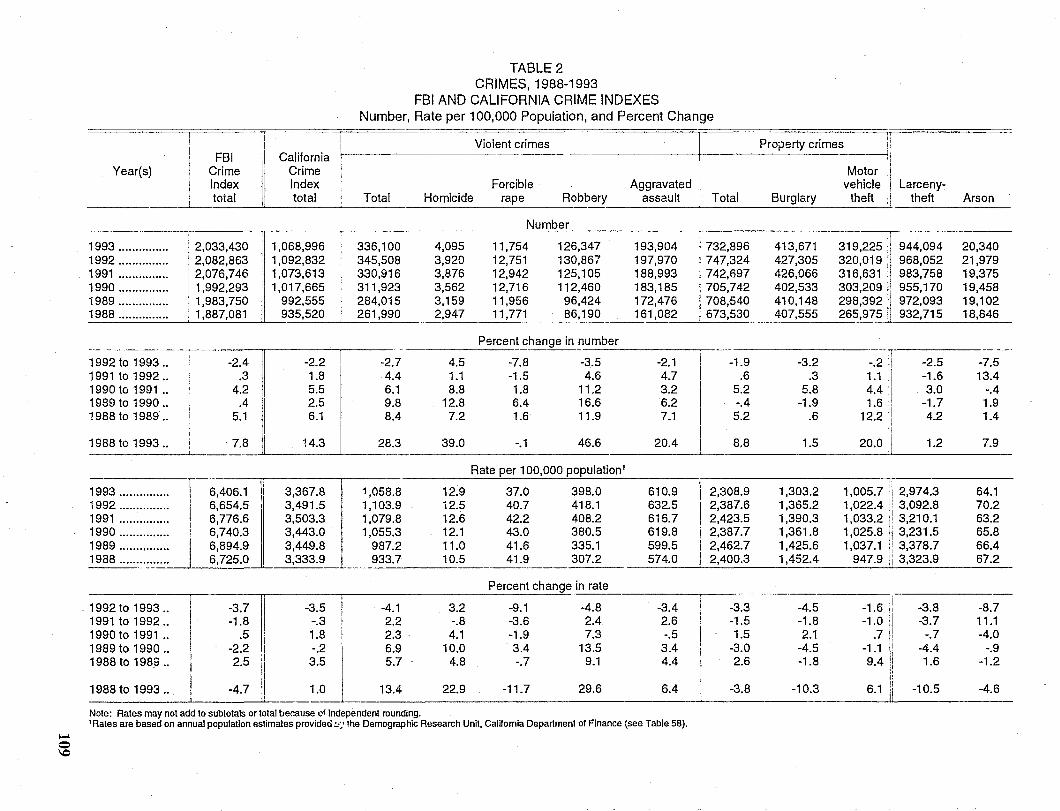
.... o \0
Year(s) FBI
Crime Index total
~ I II California
III' Crime I Index
total
TABLE 2 CRIMES, 1988-1993
FBI AND CALIFORNIA CRIME INDEXES Number, Rate per 100,000 Population, and Percent Change
Property crimes
~ Violent crimes
I " I'
, Motor :1 Aggravated i vehicle il
Robbery assault I Total Burglary theft Forcible
Homicide rape Total Larceny
theft Arson
------------.,---------~--------,------------
~Nu~mb~e~r ______________ -,, ______________________ rrl, __________ _
1993 .............. . 1992 .............. . 1991 .............. . 1990 .............. . 1989 .............. . 1988 .............. .
1992 to 1993 .. 1991 to 1992 .. 1990 to 1991 .. 1989 to 1990 .. 1988 to 1989 ..
1988 to 1993 ..
1993 ............... 1992 ............... 1991 ............... 1990 ............... 1989 ............... 1988 ...............
1992 to 1993 .. 1991 to 1992., 1990 to 1991 .. 1989 to 1990 .. 1988 to 1989 ..
1988 to 1993 ..
2,033,430 1,068,996 336,100 4,095 11,754 126,347 193,904 I 732,896 413,671 319,225 il 944,094 20,340 2,082,863 1,092,832 345,508 3,920 '2,751 130,867 197,970 1747,324 427,305 320,019!1 968,052 2',979 2,076,746 ',073,613 330,916 3,876 12,942 125,105 188,993 'I' 742,697 426,066 316,631 Ii 983,758 19,375 1,992,293 1,017,665 311,923 3,562 12,716 112,460 183,185 ,705,742 402,533 303,20911 955,170 19,458 1,983,750 992,555 284,015 3,159 11,956 96,424 172,476 I 708,540 410,148 298,3921 972,093 19,102 1,887,081 935,520 261,990 2,947 11,771 86,190 161,082 i 673,530 407,555 265,975 932,715 18,846
-2.4 -2.2 .3 1.8
4.2 5.5 .4 2.5
5.1 6.1
7.8 14.3
6,406.1 3,367.8 6,654.5 3,491.5 6,776.6 3,503.3 6,740.3 3,443.0 6,894.9 3,449.8 6,725.0 3,333.9
-3.7 -3.5 -1.8 -.3
.5 1.8 -2.2 -.2 2.5 3.5
-4.7 1.0
-2.7 4.4 6.1 9.8 8.4
28.3
1,058.8 1,103.9 1,079.8 1,055.3
987.2 933.7
-4.1 2.2 2.3 6.9 5.7
13.4
4.5 1.1 8.8
12.8 7.2
39.0
12.9 12.5 12.6 12.1 11.0 10.5
3.2 -.8 4.1
10.0 4.8
22.9
Percent change in n_u~m_b_er _____ __,_----------_____n'i-------
-1.9 -3.2 -.21 1 -7.8 -1.5 1.8 6.4 1.6
-.1
-3.5 4.6
11.2 16.6 11.9
46.6
Rate per 100,000 population 1
37.0 398.0 40.7 418.1 42.2 408.2 43.0 380.5 41.6 335.1 41.9 307.2
Percent change in rate
-9.1 -4.8 -3.6 2.4 -1.9 7.3 3.4 13.5 -.7 9.1
-11.7 29.6
-2.1 4.7 3.2 6.2 7.1
20.4
610.9 632.5 616.7 619.8 599.5 574.0
-3.4 2.6 -.5 3.4 4.4
6.4
-2.5 .6 .3 1.1 I
5.2 5.8 4.4 II -1.6 3.0
-1.7 4.2
-.4 -1.9 1.611 5.2 .6 12.2 ,I
I' 8.8 1.5 20.0 il 1.2
2,308.9 1,303.2 1,005.7 Ii 2,974.3 2,387.6 1,365.2 1,022.4 1: 3,092.8 2,423.5 1,390.3 1,033.2 I: 3,210.1 2,387.7 1,361.8 1,025.8 ii 3,231.5 2,462.7 1,425.6 Ii 1,037.1 I 3,378.7 2,400.3 1,452.4 947.9 Ii 3,323.9
-3.3 -4.5 ii
-3.8 -1.6 I: -1.5 -1.8 -1.0 ,I -3.7 1.5 2.1 .711 -.7
-3.0 -4.5 -1.1 i! -4.4 2.6 -1.8 9.4 Ii 1.6
I' -3.8 -10.3 II -10.5 6.1 Ii
-7.5 13.4
-.4 1.9 1.4
7.9
64.1 70.2 63.2 65.8 66.4 67.2
-8.7 11.1 -4.0
-.9 -1.2
-4.6
Note: Rates may not add to subtotals or total ber.ause cf Independent rounding. 'Rates are based on annual population estimates provided :::,Ihe Demographic Research Unit, California Department of Finance (see Table 58) .
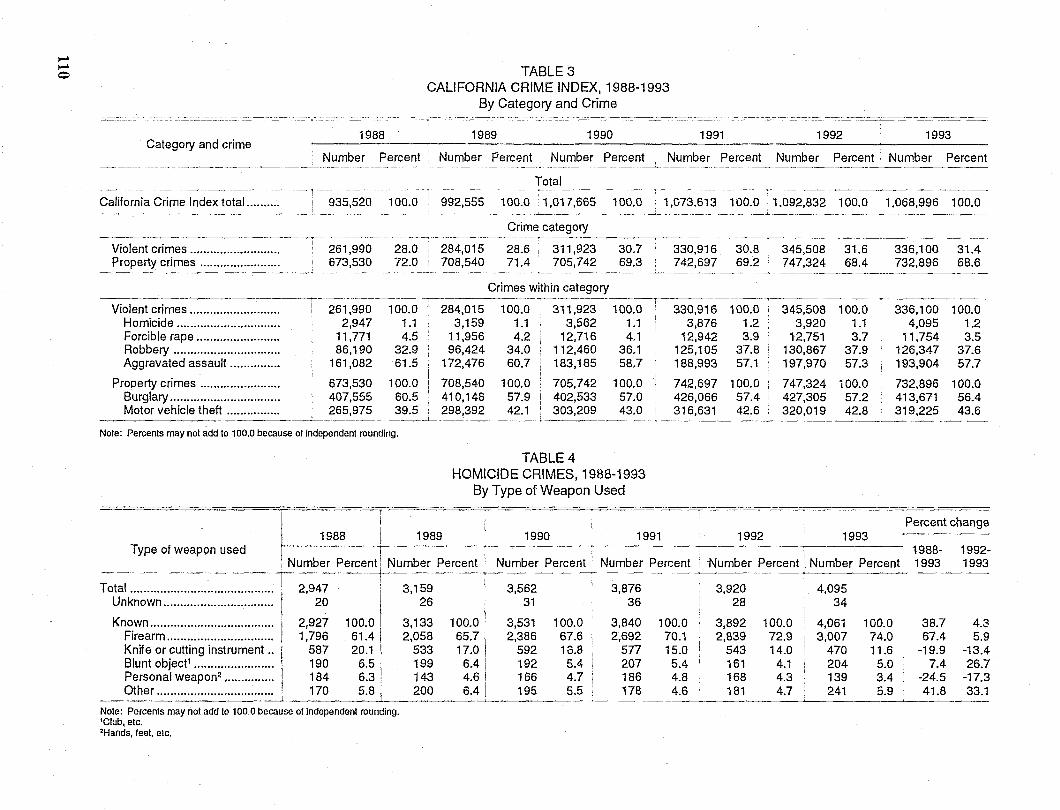
~ ~ Q TABLE 3
CALIFORNIA CRIME INDEX, 1988-1993 By Category and Crime .. ~--=-=--=----::-~-=~.=--::-= =--=-~:::---=:::.-.=--::.=::=:::..=:'--=----=::--=-=--==~--=::;:::------==--==-
Category and crime 1988 1989 1990 1991 1992 1993
Number Percent Number Peicent Number Percent , Number Percent Number Percent Number Percent - -~- -----"-- ._-------
Total
California Crime Index total.......... 935,520 1 00.0 .~ .. -992~555- 100.0~1~1i.665--100~O-·'1.073.613 100.0 , ,092.832 100.0 1.068.996 100.0 --- ---- ----<--~---- - - - ----.-- - ------- --- .-----.-~-- --- ~-.. ---------"----.- -- - - --_._- -~---- - -----
Crime category ................... - -_ ... _ .. _- ....•.. ~ --~~--
Violent crimes ........................... 261.990 28.0 284.015 28.6 311,923 30.7 330.916 30.8 345,508 31.6 336,100 31.4 Property crimes ........................ 673.530 72.0 708,540 71.4 705,742 69.3 742,697 69.2 747,324 68.4 732,896 68.6
_____ ~_~_~ ___ • __ " ___ " ~ __ ---0.-- ______ • __ ._
Crimes within category ---------- ~-~------~--~~-.~--~------~---- --------.------------.--------r---------~------ ...
Violent crimes........................... i 261,990 100.0 i 284,015 100.0: 311,923 100.0 330,916 100.0 345,508 100.0 336,100 100.0 Homicide ...... ,........................ 2,947 1.1 3,159 1.1 3,562 1.1 3,876 1.2 3,920 1.1 4,095 1.2 Forcible rape......................... 11,771 4.5 11,956 4.2 12,716 4.1 12,942 3.9 12,751 3.7 11,754 3.5 Robbery ................................ 86.190 32.9 96,424 34.0 112,460 36,1 125,105 37.8 130.867 37.9 126,347 37.6 Aggravated assault............... 161,082 61.5 172,476 60.7 183,185 58.7 188,993 57.1 197,970 57.3 193,904 57.7
Property crimes ........................ 673.530 100.0 708,540 100.0 705,742 100,0 742,697 100.0 , 747,324 100.0 732,896 100.0 Burglary................................. 407,555 60.5 410,148 57.9 i 402,533 57,0 426,066 57.4 427,305 57.2 413,671 56.4 Motor vehicle theft ................ 265,975 39.5 298,392 42.1! 303.209 43,0 316,631 42.6 320,019 42.8 319,225 43.6
~__ -L. ------L~ ____________ _
Note: Percents may nol add to 100.0 because of independent rounding.
TABLE 4 HOMICIDE CRIMES, 1988-1993
By Type of Weapon Used
! -i .- i
1991 1992 1993 L 1988 I 1989 ! 1990 Type of weapon used lh' I ----+~------------~--.------------------------------~
I Number Percent 'I! Number Percent I Number Percent Number Percent i Number Percent. Number Percent . I . -+ Total........................................... 2,947 i 3,159 I 3,562
Unknown................................. 20 I 26 \ 31
Known ..................................... 2,927 100.0! 3,133 100.0 I 3,531 100.0 Firearm ................................ 1,796 61.4 I 2,058 65.7 I 2,386 67.6 Knife or ~utt)ng instrument.. 587 20.1 I 533 17.0 I 592 Blunt object ........................ j 190 6.5 I 199 6.4 1 192 Personal weapon2 ............... I 184 6.3 I 143 4.6 i 166 Other ................................... , 170 5.8l 200 6.4 I 195
Note: Percents may nol add to 100.0 because of independent rounding. 'Club, etc. 'Hands, feet. eiC.
13.8 5.4 4.7 5.5
3,876 36
3,840 100.0 !
2,692 70.1 577 15.0 207 5.4 186 4.8 178 4.6 '
3,920 4,095 28 34
3,892 100.0 4,061 100.0 2,839 72.9 ' 3,007 74.0
543 14.0 ' 470 11.6 161 4.1 ! 204 5.0 168 4.3 139 3.4 181 4.7 241 5.9
Percent change
1988- 1992-1993 1993
38.7 4.3 67.4 5.9
-19.9 -13.4 7.4 26.7
-24.5 -17.3 41.8 33.1
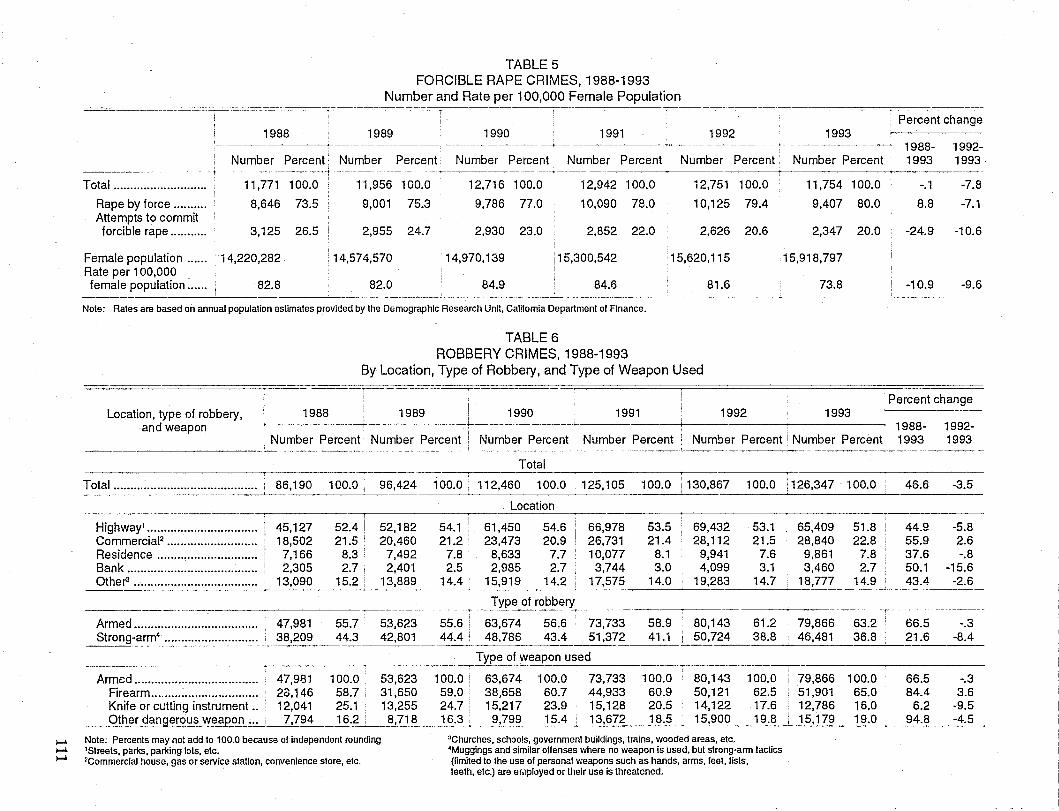
..... .... ....
TABLE 5 FORCIBLE RAPE CRIMES, 1988-1993
Number and Rate per 100,000 Female Population -=:.=:::::::---=---==-=--:.=:-::;:- ----=---=-=--==---~~ .. --=-::~:::.....--=--:-:= :..::--:::-:::::::..::-:::=-----.-:.....::===---=-=~--:---===-=-------==----=----=-:-:-::..---=:-~===:;::::-------=====---------=------=------===-----~-=-
1988 1989 1990 1991 1992 1993
Number Percent· Number Percent j Number Percent Number Percent ~ Number Percent, Number Percent
Percent change ---~-
1988- 1992-1993 1993
~--------+-----.~ . -------- -~---.:.----------- -i------- _ .. - --i--"--~----.-. Total ............................ 11,771 100.0 11,956 100.0
Rape by force .......... 8,646 73.5 9,001 75.3 Attempts to commit forcible rape ........... 3,125 26.5 2,955 24.7
Female population ...... 14,220,282 [14,574,570 Rate per 100,000 female population ...... 82.8 82.0
12,716 100.0 12,942 100.0
9,786 77.0 10,090 78.0
2,930 23.0 2,852 22.0
'14,970,139 15,300,542
84.9 84.6
12,751 100.0
10,125 79.4
2,626 20.6 ,
11,754 100.0 '
9,407 80.0
2,347 20.0
-.1
8.8
-24.9
15,620,115
81.6
'15,918,797
73.8 , -10.9
Note: Rates are based on annual population estimates provided by the Demographic Research Unit, Caltlomia Department of Finance.
TABLE 6 ROBBERY CRIMES, 1988-1993
By Location, Type of Robbery, and Type of Weapon Used
-7.8
-7.1
-10.6
-9.6
I i Percent change ! 1988 1989 Location, type of robbery, 1990 1991 1992 1993 f-- , and weapon , . Number Percent i Number Percent Number Percent Number Percent ! Number Percent i Number Percent
~, -~~'--~-
Total
Total ........................................... ' 86,190 1QO.0: 96,424 100.0 I 112,460 100.0 125,105 100.0 : 130,867 100.0 i 126,347
Location ---~-
Highway1 ................................. 1 45,127 52.4 I 52,182 54.1 61,450 54.6 66,978 53.5 69,432 53.1 65,409 Commercial2 ........................... : 18,502 21.5 • 20,460 21.2: 23,473 20.9 26,731 21.4 28,112 21.5 28,840 Residence .............................. 7,166 8.3 7,492 7.8 : 8,633 7.7 ' 10,077 8.1 ! 9,941 7.6 9,861 Bank ....................................... 2,305 2.7 ! 2,401 2.5 i 2,985 2.7 3,744 3.0 4,099 3.1 3,460 Othefl ..................................... ' 13,090 15.2 • 13,889 14.4 i 15,919 14.2 17,575 14.0 19,283 14.7 i 18,777
--~--~~----
__ . __ ~ __ ~~_--.!ype of robb~
Armed ..................................... , 47,981 55.7 : 53,623 Strong-arm4
............................ i 38,209 44.3 i 42,801
Armed ..................................... 47,981 100.0 53,623 Firearm................................ 28,146 58.7 31,650 Knife or cutting instrument.. 12,041 25.1 13,255 Other d'§!'I'!9.~r:9us w~~on ... i_~~_~._2_. ~ __ !U18
Note: Percents may nol add to 100.0 because 01 independent rounding. 'Streets, parks, parl<ing tots, etc • 'Commercial house, gas or service stalion, convenience store, etc.
55.6 . 63,674 56.6 73,733 58.9 80,143 61.2 44.4 ! 48,786 43.4 51,372 41.1 ! 50,724 38.8
Type of weapon used
100.0 : 63,674 100.0 73,733 100.0 80,143 100.0 59.0 38,658 60.7 44,933 60.9 50,121 62.5 24.7 15,217 23.9 15,128 20.5 14,122 17.6 16.3 , 9,799 15.4 ]3,672 18.5 , 15,900 19.8
'Churches, schools, government buildings, trains. wooded areas, etc . 'Muggings and similar offenses where no weapon is used, but strong·ann tactics (limited to the use 01 personal weapons such as hands, arms, feet, fists, teeth, etc.) are er.lployed or their use is threatened.
79,866 46,481
79,866 51,901 12,786 15,179
100.0
51.8 !
22.8 7.8 2.7
14.9
63.2 36.8
100.0 65.0 16.0 19.0 I
1988- 1992-1993 1993
46.6 -3.5
44.9 -5.8 55.9 2.6 37.6 -.8 50.1 -15.6 43.4 -2.6
66.5 -.3 21.6 -8.4
66.5 -.3 84.4 3.6
6.2 -9.5 94.8 -4.5
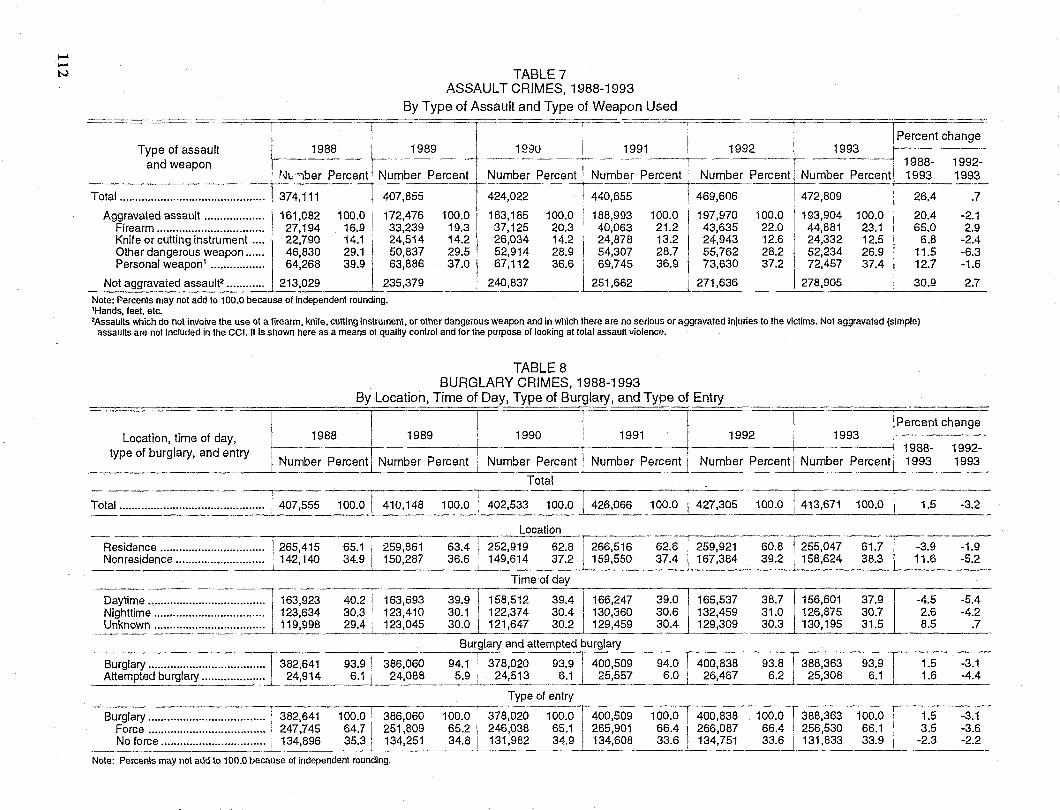
~ ~ N TABLE 7
ASSAULT CRIMES, 1988-1993 By Type of Assault and Type of Weapon Used
Type of assault and weapon
1988 1989 i-- r I I Percent change
1 e9U I 1991 i 1992 \ 1993 \
-.-
I-- I ' 1988- 1992-
]
''iL .,,~er Percent Number Percent-+--Number Percent I Number Percent' Number ~ercent I Number Percent 1993 1993
Total.............................................. 374,111 407,855 424,022 440,655 469,606 : 472,809 26.4.7
Aggravated assault ................... 161,082 100.0 172,476 100.0 183,165 100.0; 188,993 100.0 197,970 100.0 193,904 100.0 20.4 -2.1 Firearm .................................. I 27,194 16.9 33,239 19.3 37,125 20.3! 40,063 21.2 43,635 22.0 44,881 23.1 65.0 2.9 Knife or cutting instrument .... j 22,790 14.1 24,514 14.2 I 26,034 14.2 24,878 13.2 24,943 12.6 24,332 12.5 6.8 -2.4 Other dangerous weapon...... 46,830 29.1 50,837 29.5 52,914 28.9 54,307 28.7 55,762 28.2 52,234 26.9 11.5 -6.3 Personal weapon' ................. 64,268 39.9 63,886 37.0 67,112 36.6 69,745 36.9 73,630 37.2 \ 72,457 37.4 12.7 -1.6
235,379 240,837 251,662 -.L?71,636 I 278,905 30.9 2.7 Not aggravated assault2 ............ 1 213,029 Note: Percents may not add to 100.0 because of independent rounding. 'Hands, feet, etc. 2Assaults which do not invoive the use of a firearm, knife, cutting instrument, or other dangerous weapon and in which there are no serioUS or aggravated injuries to the victims. Not aggravated (Simple)
assaults are not included in Ihe CCI. II is shown here as a means of qualtty control and for the purpose of looking at total assault violence.
TABLE 8 BURGLARY CRIMES, 1988-1993
By Location, Time of Day, Type of Burglary, and Type of Entry ================~========~===
1993 Location, time of day, type of burglary, and entry
I 1988 11989 1990 1991 1992 I
l Number percent! Number Percent Numb~Percent Number Percent 1 Number Percent I Number Percent
Total
I Percent change I
1988- 1992-1993 1993
I I~~' I =-=r Total .............................................. 1407,555 100.0 I 410,148 100.0 I 402,533 100.0 426,066 100.0 I 427,305
r 100.0 I 100.0 I 413,671 1.5 -3.2
Location
61.7 -3.9 -1.9 60.8 I 255,047 39.2 I 158,624 38.3 11.6 -5.2
Reside~ce ................................. )265,415 65.1 i 259,861 63.4 1[, 252,919 62.8 !r266~ 62.Cil 259,921 Nonresidence ............... " ........... \ 142,140 34.9 1 150,287 36.6. 149,614 37.2. 159,550 37.4 j 167,384 ___ ---1. ______ '---____ _
Time of day ~I-------~I--------·-lr---
D~yti~e ..................................... 1163,923 40.2! 163,693 39.9 158,512 39.4 166,247 39.0 165,537 38.7 156,601 Nighttime ................................... i 123,634 30.3! 123,410 30.1 1122,374 30.4 130,360 30.6 132,459 31.0 126,875
37.9 30.7 ::11.5 Unknown ................................... I 119,998 29.4, 123,045 30.0 121,647 30.2 129,459 30.4 129,309 30.3 130,195
Burglary and attempted burglary
Burglary ..................................... i 382,641 93.91 386,060 94.1 I 378,020 93.9 400,509 94.0 400,838 -g;lll 388,363 93.9 Attempted burglary .................... I 24,914 6.1 I 24,088 5.9 I 24,513 6.1 25,557 6.0 26,467 6.2 I 25,308 6.1
Burglary ..................................... 382,641 Force ..................................... 247,745 No force ................................. 134,896
100.0 386,060 64.7 251 ,809 35.3 134,251
Note: Percents may not add to 100.0 because 01 independent rounding.
100.0 65.2 34.8
Type of entry
378,020 100.0 246,038 65.1 131,982 34.9
400,509 265,901 134,608
100.0 66.4 33.6
400,838 266,087 134,751
100.0 66.4 33.6
388,363 100.0 256,530 66.1 131,833 33.9
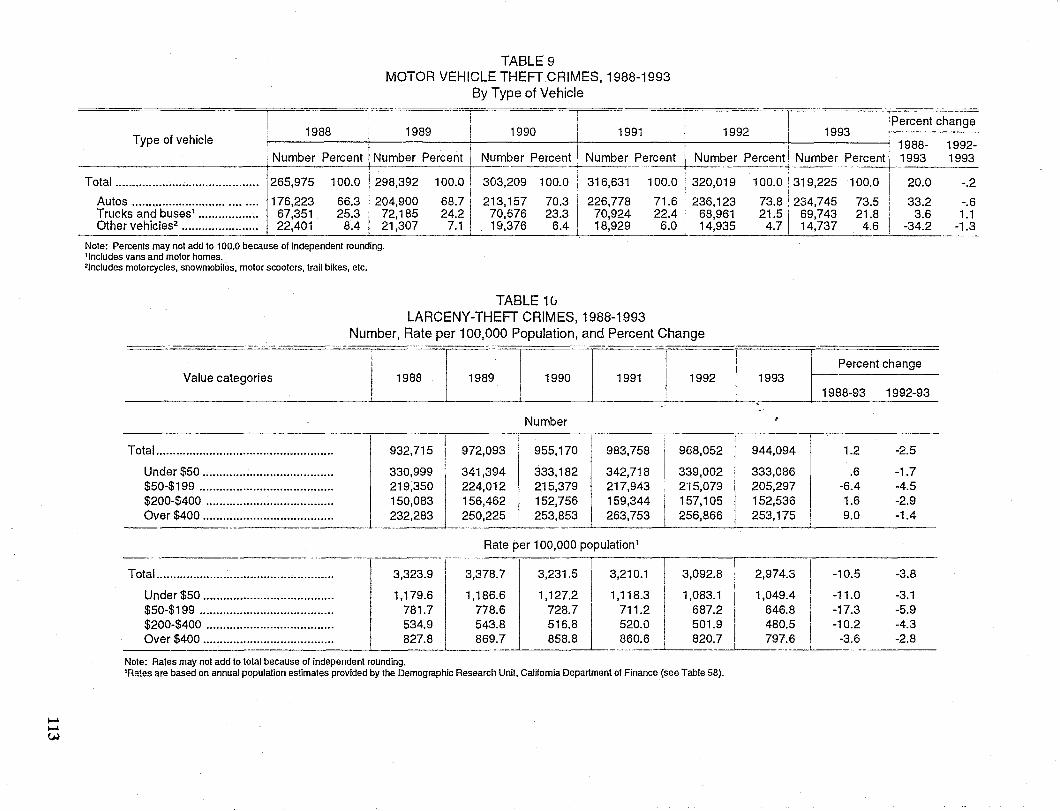
~ ~
~
TABLE 9 MOTOR VEHICLE THEFT CRIMES, 1988-1993
By Type of Vehicle
I ~--------.~--~: ~-.. ----- -iPercent change
I 1988 i 1989 ! 1990 i 1991 1992 1993 ~ I I i I ! I 1988- 1992-I Number Percent I Number Percent i Number Percent; Number Percent I Number Percent I Number Percent I 1993 1993
Type of vehicle
~ I I I I I i
I I I I i I
Total ................................ ~;.i ... :.J ..... 265,975 100.0 298,392 100.0: 303,209 100.0 i 316,631 100.0 1320,019 100.0.319,225 100.0 i 20.0 -.2
Autos .................................... 176,223 66.3 204,900 68.71 213,157 70.3 i 226,778 71.61236.123 73.8 ,234,745 73.5 I 33.2 -.6 Trucks an?bu~esl.................. 67,35~ 25.3 72,185 24.2
1
70,676 23.3 I 70,924 22.4 68,961 21.51 69,743 21.8 _ 3.6 _1.1 Other vehicles ....................... 22,40 I 8.4 I 21,307 7.1 19,376 6.4 i 18,929 ~ 14,935 4.7 14,737 4.6 34.2 1.3
Note: Percents may not add to 100.0 because of independent rounding. 'Includes vans and motor homes. 21ncludes motorcycles, snowmobiles, motor scooters, trail bikes, etc.
TABLE 10 LARCENY-THEFT CRIMES, 1988-1993
Number, Rate per 100,000 Population, and Percent Change
Value categories 1988 1989 1990 1991 1992
Total ................................................... ..
Under $50 ..................................... .. $50-$199 ....................................... . $200-$400 ..................................... . Over $400 ..................................... ..
Total .................................................... .
Under $50 ...................................... . $50-$199 ....................................... . $200-$400 ..................................... . Over $400 ...................................... .
932,715
330,999 219,350 150,083 232,283
3,323.9
1,179.6 781.7 534.9 827.8
Note: Rates may not add to total because of independent rounding.
Number
972,093 955,170 983,758 968,052
341,394 333,182 342,718 339,002 224,012 215,379 217,943 2',5,079 156,462 152,756 159,344 157,105 250,225 253,853 263,753 256,866
Rate per 100,000 population 1
3,378.7
1,186.6 778.6 543.8 869.7
r- -l----~
I 3,210.1 ! 3,092.8 I I 1,118.3 I 1,083.1 I'
I 711.2 687.2 520.0 501.9 I'
I 860.6 820.7 I
'Ra!es are based on annual population estimates provided by the Demographic Research Unit, Calnomia Department of Finance (see Table 58).
Percent change 1993
1988-93 1992-93
944,094 T 333,086 205,297 152,536 253,175
2,974.3
1,049.4 646.8 480.5 797.6
1.2 -2.5
.6 -1.7 -6.4 -4.5 1.6 -2.9 9.0 -1.4
-10.5 -3.8
-11.0 -3.1 -17.3 -5.9 -10.2 -4.3
-3.6 -2.8
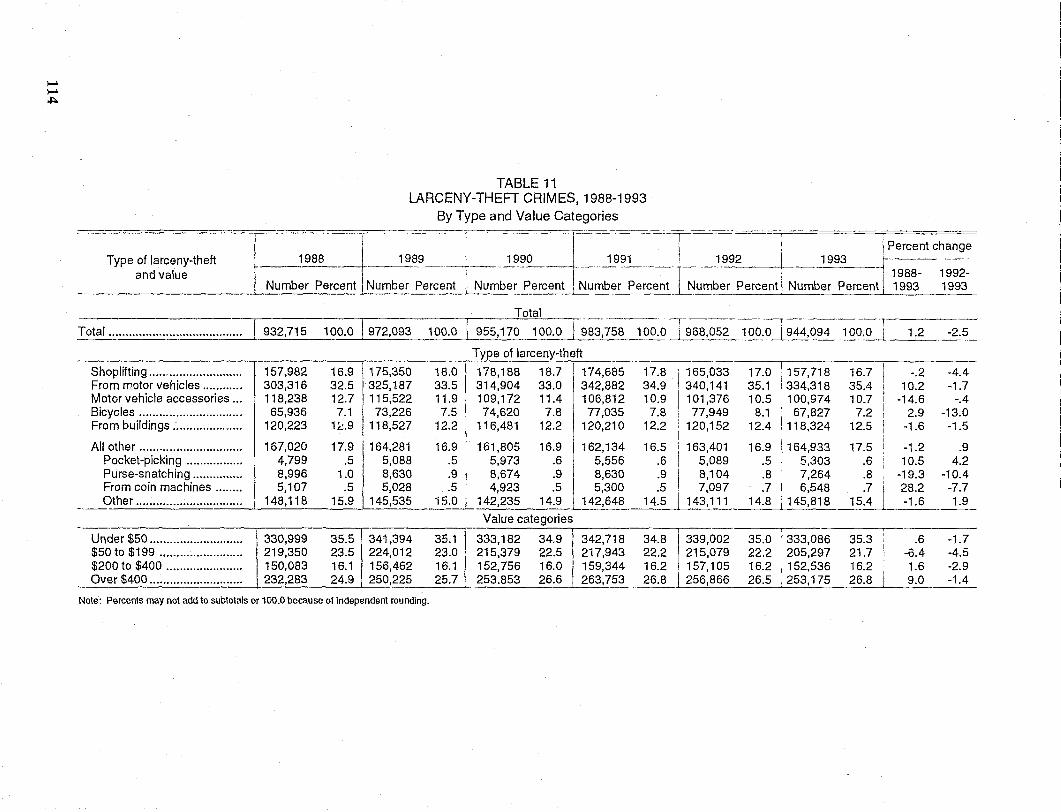
..... I-' J::o.
Type of larceny-theft and value
1988
TABLE 11 LARCENY-THEFT CRIMES, 1988-1993
By Type and Value Categories
T T 1989 ! 1990 1991
Number Percent I Number Percent I Number Percent ! Number Percent
Total
r- ·----~~~1 Percent change
1992 I 1993 ~ I ,1988- 1992-
Number Percent I Number Percent I 1993 1993
Total ........................................ T932,715100.()] 972,093--1()~.ol 95~7~1~O.O-[i8;';S;- 100~T9~;'-052 100.0 ! 944,094 100.0 1.2 -2.5
Shoplifting .... " .................... .. From motor vehicles .......... .. Motor vehicle accessories .. . Bicycles .............................. . From buildings .................... .
All other .............................. . Pocket-picking ................ . Purse-snatching ............. .. From coin machines ....... . Other .............................. ..
Under $50 ............................ $50 to $199 ......................... $200 to $400 ....................... Over $400 ............................
157,982 303,316 118,238 65,936
120,223
167,020 4,799 8,996 5,107
148,118
330,999 219,350 150,083 232,283
16.9 32.5 12.7 7.1
1;;:.9
17.9 .5
1.0 .5
15.9
35.5 23.5 16.1 24.9
175,350 325,187 115,522 73,226
118,527
164,281 5,088 8,630 5,028
145,535
34',394 224,012 156,462 250,225
Note: Percents may not add to subtotals or 100.0 because of independent rounding.
Type of larceny-theft
18.0 I 178,188 1 B.7 174,6B5 33.5 314,904 33.0 342,882 11.9 109,172 11.4 106,812 7.5 74,620 7.B 77,035
12.2 116,481 12.2 120,210
17.8 165,033 34.9 340,141 10.9 101,376 7.8 77,949
12.2 120,152
16.9 I 161,805 16.9 162,134 16.5 163,401 .5 5,973 .6 5,556 .6 5,089 .9 8,674 .9 8,630 .9 8,104 .5 4,923 .5 5,300 .5 7,097
15.0 L J,!2,235 _ 14.9 142,648 1 ~.5 143,111 Value categories
35.1 333,182 34.9 342,718 34.8 339,002 23.0 215,379 22.5 217,943 22.2 215,079 16.1 152,756 16.0 159,344 16.2 157,105 25.7 253.853 26.6 263,753 26.8 256,866
17.0 35.1 10.5
8.1 12.4
16.9 .5 .8 .7
14.8
157,718 334,318 100,974
67,827 118,324
16.7 35.4 10.7 7.2
12.5
164,933 17.5 5,303 .6 7,264 .8 6,548 .7
145,818 15.4
35.0 1333,086 35.3 I 22.2 205,297
I 21.7 I
16.2 1152,536 16.2 I 26.5 253,175 26.8 I -
-.2 10.2
-14.6 2.9
-1.6
-1.2 10.5
-19.3 28.2 -1.6
.6 -6.4 1.6
-4.4 -1.7
-.4 -13.0
-1.5
.9 4.2
-10.4 -7.7 1.9
-1.7 -4.5 -2.9
9.0 -1.4 -----.. ~~
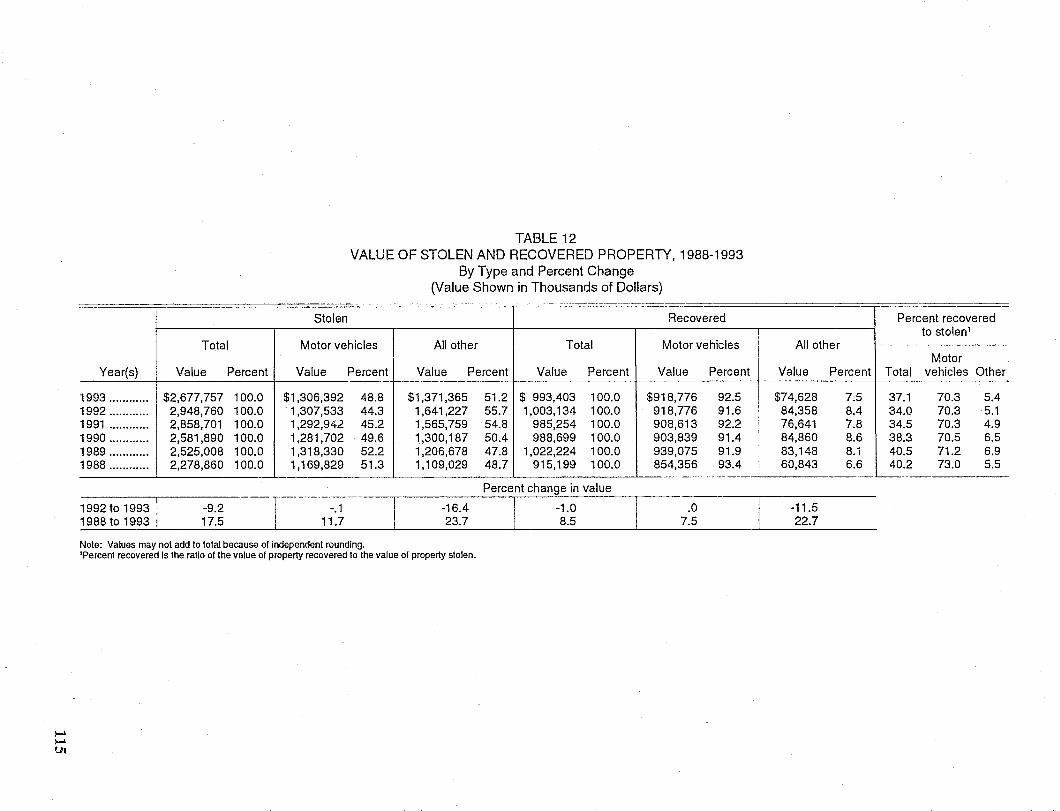
~ .... til
Total
Year(s) Value Percent
1993 ............ I $2,677,757 100.0 1992............ 2,948,760 100.0 1991 ............ 2,858,701 100.0 1990 ............ 2,581,890 100.0 1989 ............ 2,525,008 100.0 1988 ............ 2,278,860 100.0
1992 to 1993 1988 to 1993
-9.2 17.5
TABLE 12 VALUE OF STOLEN AND RECOVERED PROPERTY, 1988-1993
By Type and Percent Change
Stolen
Motor vehicles
Value Percent
$1,306,392 48.8 1,307,533 44.3 1,292,942 45.2 1,281,702 49.6 1,318,330 52.2 1,169,829 51.3
-.1 11.7
(Value Shown in Thousands of Dollars)
Recovered
All other Total Motor vehicles
Value Percent Value Percent I Value Percent
$1,37',365 51.2 1,641,227 55.7 1,565,759 54.8 1,300,187 50.4 1,206,678 47.8 1,109,029 48.7
$ 993,403 100.0 1,003,134 100.0
985,254 100.0 988,699 100.0
1,022,224 100.0 915,199 100.0
Percent change in value
-16.4 23.7
-1.0 8.5
$918,776 918,776 908,613 903,839 939,075 854,356
.0 7.5
92.5 91.6 92.2 91.4 91.9 93.4
Note: Values may not add to total because of independent rounding. 'Percent recovered is the ratio of the value of property recovered to the value of property stolen.
All other
Value
$74,628 84,358 76,641 84,860 83,148 60,843
-11.5 22.7
Percent
7.5 8.4 7.8 8.6 8.1 6.6
Percent recovered to stolen1
Motor Total vehicles Other
37.1 70.3 5.4 34.0 70.3 5.1 34.5 70.3 4.9 38.3 70.5 6.5 40.5 71.2 6.9 40.2 73.0 5.5
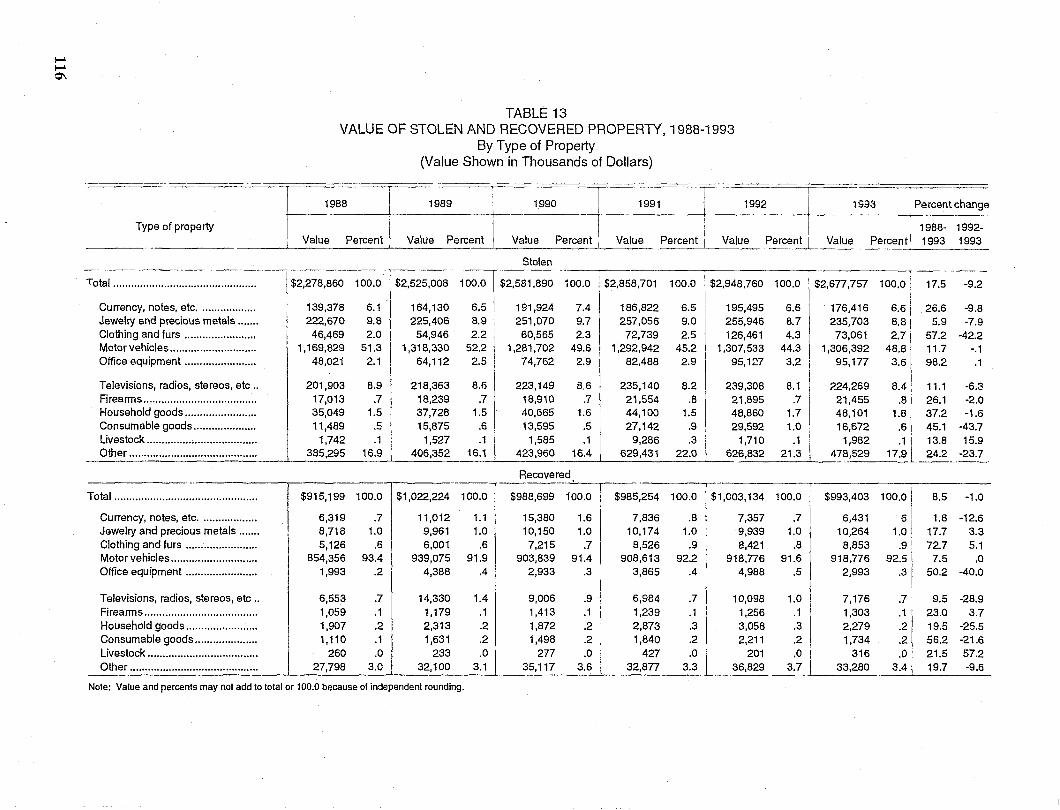
~ ~ 0\
Type of property
Total ............................................... .
Currency, notes, etc .................. . Jewelry and precious metals ..... .. Clothing and furs ...................... .. Motor vehicles ........................... .. Office equipment ...................... ..
Televisions, radios, stereos, etc .. Firearms .................................... .. Household goods ....................... . Consumable goods .................... . Livestock .................................... . Other .......................................... .
Total ................................................
Currency, notes, etc ................... Jewelry and precious metals ....... Clothing and furs ........................ Motor vehicles ............................. Office equipment ........................
Televisions, radios, stereos, etc .. Firearms ...................................... Household goods ........................ Consumable goods ..................... Livestock ..................................... Other ...........................................
TABLE 13 VALUE OF STOLEN AND RECOVERED PROPERTY, 1988-1993
By Type of Property (Value Shown in Thousands of Dollars)
F--
1988 1989 1990 --r- 1991 1992 1993 I Percent change
Value Percent J Value Percent Value
r --- ---~~-T I Value Percent i Value Perc~nt I Value Perc_e_n_t..JI _______ -L ____ _ Percent
$2,278,860 100.0
139,378 222,670
46,469 1,169,829
48,021
201,903 17,013 35,049 11,489
1,742 385,295
$915,199
6,319 8,718 5,126
854,356 1,993
6,553 1,059 1,907 1,110
260 27,798
6.1 9.8 2.0
51.3 2.1
8.9 .7
1.5 .5 .1
16.9
100.0
.7 1.0
.6 9304
.2 !
.7
.1
.2
.1
.0 3.0
$2,525,008
164,130 225,406
54,946 1,318,330
64,112
218,363 18,239 37,728 15,875
1,527 406,352
$1,022,224
11,012 9,961 6,001
939,075 4,388
14,330 1,179 2,313 1,631
233 32,100
Stolen
100.0 $2,581,890 100.0 I $2,858,701 100.0 1$2,94-;,760 100.0 $2,677,757
I 6.5 191,924 704 8.9 251,070 9.7 2.2 60,565 2.3
52.2 1,281,702 49.6 2.5
8.6 .7
1.5 .6 .1
16.1
100.0
1.1
1.0 I .6
91.9
AI 1.4
.1
.2
.2
.0 3.1
74,762
223,149 18,910 40,665 13,595
1,585 423,960
2.9
8.6 .7
1.6 .5 .1
16.4
Recovered
$988,699 100.0
15,380 1.6 10,150 1.0
7,215 .7\ 903,839 91.4
2,933 .3
I 9,006 .9 I 1,413 .1 \ 1,872 .2 1,498 .2 I
277 .0 I 35,117 3.6 ,
I
186,822 257,056
72,739 1,292,942
82,488
235,140 21,554 44,100 27,142
9,286 629,431
$985,254
7,836 10,174
8,526 908,613
3,865
6,984 1,239 2,873 1,840
427 32,877
6.5 9.0 2.5
45.2 2.9
8.2 .8
1.5 .9 .3
22.0
195,495 6.6 176,416 255,946 8.7 235,703 126,461 4.3 73,061
1,307,533 44.3 1,306,392 95,127 3.2 95,177
239,308 21,895 48,860 29,592
1,710 626,832
8.1 .7
1.7 1.0
.1 21.3
224,269 21,455 48,101 16,672
1,982 478,529
100.0 l $1,003,134 100.0 I . 8 I 7,357 .7 .
$993,403
6,431 1.0 9,939 1.0 I 10,264
.9 8,421 .8 8,853 92.2 918,776 91.6 918,776
.4 4,988 .5 2,993
.7 10,098 1.0 7,176
:! I 1,256 .1 3,058 .3
.2 2,211 .2 I
.0 I 201 .0 1
3.3 36,829 3.7 I
1,303 2,279 1,734
316 33,280
100.0 i
6.6 8.8 2.7
48.8 3.6
8.4 .8
1.8 .6 .1
17.9
100.0
6 1.0
.9 92.5
.3
.7
.1
.2
.2
.0 3.4
17.5 -9.2
26.6 -9.8 5.9 -7.9
57.2 -42.2 11.7 -.1 98.2
11.1 26.1 37.2 45.1
.1
-6.3 -2.0 -1.6
-43.7 13.8 15.9 24.2 -23.7
8.5 -1.0
1.8 -12.6 17.7 3.3 72.7 5.1
7.5 .0 50.2 -40.0
9.5 -28.9 23.0 3.7 19.5 -25.5 56.2 -21.6 21.5 57.2 19.7 -9.6
Note: Value and percents may not add to total or 100.0 because of independent rounding.
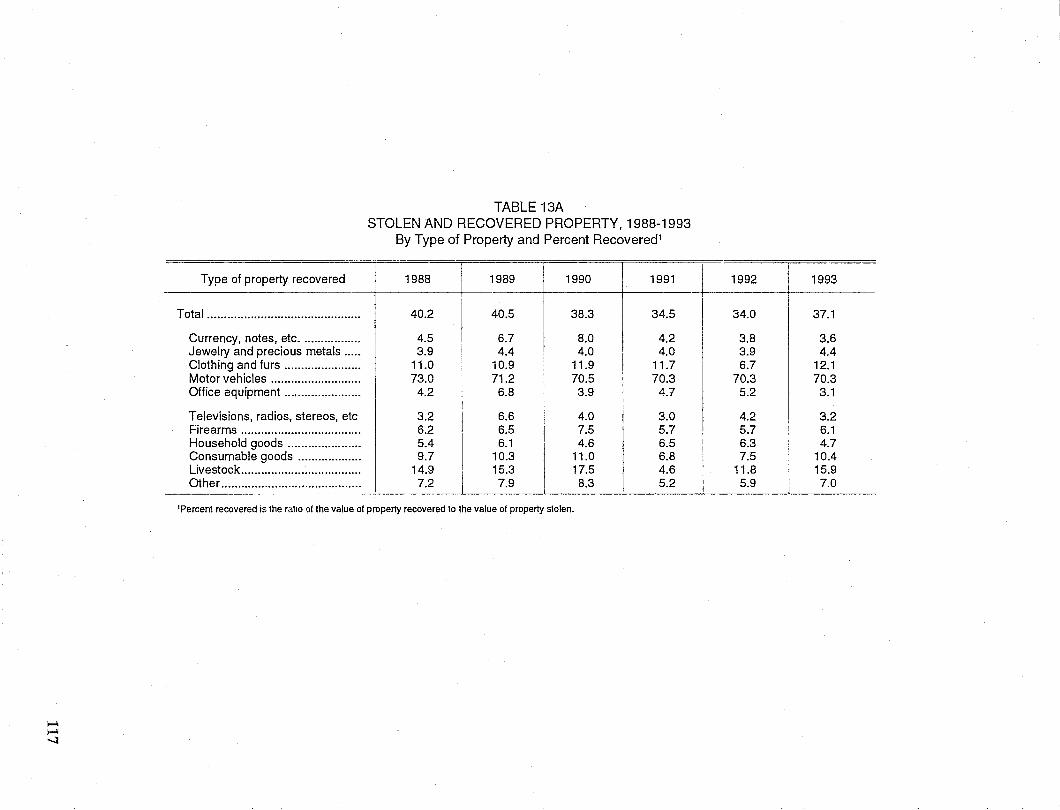
..... ..... --l
Type of property recovered
Total ............................................. .
Currency, notes, etc ................. . Jewelry and precious metals .... . Clothing and furs ...................... . Motor vehicles .......................... . Office equipment ... , .................. .
Televisions, radios, stereos, etc Firearms ................................... . Household goods ..................... . Consumable goods .................. . Livestock ................................... . Other ......................................... .
TABLE 13A STOLEN AND RECOVERED PROPERTY, 1988-1993
By Type of Property and Percent Recovered'
1988
40.2
4.5 3.9
11.0 73.0
4.2
3.2 6.2 5.4 9.7
14.9 7.2
1989
40.5
6.7 4.4
10.9 71.2
6.8
1990
38.3
8.0 4.0
11.9 70.5
3.9
1991
34.5
4.2 4.0
11.7 70.3
4.7
6~ ~o ao 6.5 7.5 5.7 6.1 4.6 6.5
10.3 11.0 6.8 15.3 17.5 4.6 7.9 8.3 5.2
'Percent recovered is the ratio 01 the value 01 property recovered to the value 01 property stolen .
1992 1993
34.0 37.1
3.8 3.6 3.9 4.4 6.7 12.1
70.3 70.3 5.2 3.1
4.2 3.2 5.7 6.1 6.3 4.7 7.5 10.4
11.8 15.9 5.9 7.0
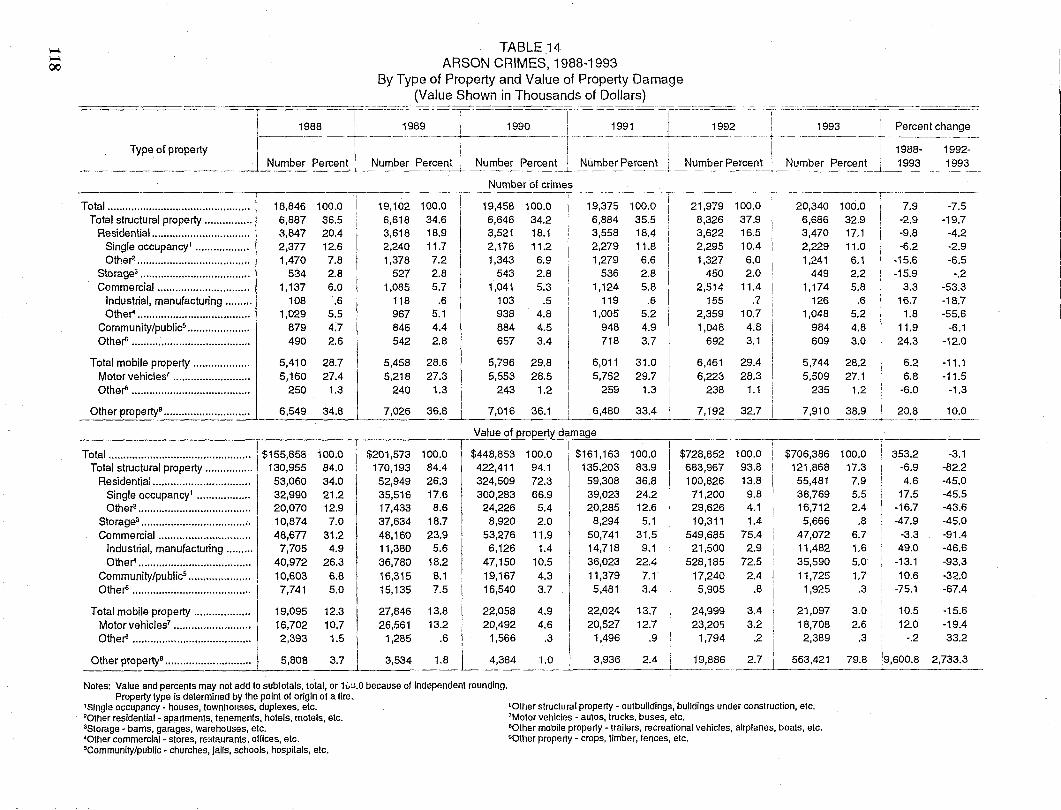
...... ...... 00
TABLE 14 ARSON CRIMES, 1988-1993
By Type of Property and Value of Property Damage (Value Shown in Thousands of Dollars)
~----~----- ~ -- ~ --~--.------
1988 i 1989 1990 -------II I
I 1991 i T--------
----------
1992 1993
I • I Type of property Number Perce~}Jumber yerc~ ! ' Number Percen~L Num~r Perce~~~ber~e!c:e~t~, _~t}mber Percent
Number of crimes ---~--~ -- -~-- r---------Total ................................................ I 18,846 100.0
Total structural property ................ 1 6,887 36.5 Residential................................. 3,847 20.4
Single occupancy' .................. 2,377 12.6
19,102 100.0 19,458 100.0 19,375 100.0' 21,979 6,618 34.6 6,646 34.2 6,884 35.5' 8,326 3,618 18.9 3,521 18.1 3,558 18.4 3,622 2,240 11.7 2,178 11.2 2,279 11.8 2,295
Other2 ...................................... 1,470 7.8 1,378 7.2 1,343 6.9 1,279 6.6 1,327 Storage3 ••••••••••••••••••••••••• ••••••• ..... 534 2.8 527 2.8 543 2.8 536 2.8 450 Commercial............................... 1,137 6.0 1,085 5.7 1,041 5.3 1,124 5.8 2,514
Industrial, manufacturing ......... 108 .6 118.6 103.5 119.6 155 Other' ................. .... .... ............. 1,029 5.5 967 5.1 938 4.8 1,005 5.2 2,359
Community/publiCS .......... ........... 879 4.7 846 4.4 884 4.5 948 4.9 1,048 Other ........................................ 490 2.6 542 2.8 657 3.4 718 3.7 692
Total mobile prope~rty.:.2 ..... ;.~ ...... j.... 5,410 28.7 5,458 28.6 5,796 29.8 6,011 31.0 6,461 Motorvehicles7 .......................... 5,160 27.4 5,218 27.3 5,553 28.5 5,752 29.7 6,223 Other ........................................ 250 1.3 240 1.3 243 1.2 259 1.3 238
Otherproperty9 ............................. 6,54934.8 7,026 36.8~7,016 36.1 6,480 33.4 7,192
Value of property damage
100.0 37.9 16.5 10.4 6.0 2.0
11.4 .7
10.7 4.8 3.1
29.4 28.3
1.1 !
32.7
20,340 6,686 3,470 2,229 1,241
449 1,174
126 1,048
984 609
5,744 5,509
235
7,910
100.0 32.9 17.1 11.0 6.1 2.2 5.8
.6 5.2 4.8 3.0
28.2 27.1
1.2
38.9
Total................................................ $155,856 100.0 $201,573 100.0 $448,853 100.0 I $161,163 100.0 $728,852 100.0 ~706,;86 100.0 Total structural property ................ 130,955 84.0 170,193 84.4 422,411 94.1 135,203 83.9 683,967 93.8 121,868 17.3
ResidentiaL.............................. 53,060 34.0 52,949 26.3 324,509 72.3 59,308 36.8 100,826 13.8 55,481 7.9 Single occupancyl .................. 32,990 21.2 35,516 17.6 300,283 66.9 39,023 24.2 71,200 9.8 38,769 5.5 Other2...................................... 20,070 12.9 17,433 8.6 24,226 5.4 20,285 12.6 29,626 4.1 16,712 2.4
Storage3 ..................................... 10,874 7.0 37,63418.7 8,920 2.0 8,294 5.1 10,311 1.4 5,666 .8 Commercial............................... 48,677 31.2 48,160 23.9 53,276 11.9 50,741 31.5 549,685 75.4 47,072 6.7
Industrial, manufacturing ......... 7,705 4.9 11,380 5.6 6,126 1.4 14,718 9.1 21,500 2.9 11,482 1.6 Other' ...................................... 40,972 26.3 36,780 18.2 47,150 10.5 36,023 22.4 528,185 72.5 35,590 5.0
Community/publics ..................... , 10,603 6.8 16,315 8.1 19,167 4.3 11,379 7.1 17,240 2.4 11,725 1.7 Other ........................................ I 7,741 5.0 15,135 7.5 16,540 3.7 5,481 3.4 5,905 .8 1,925 .3
Total mobile property .................. . Motor vehicles7
......................... .
Other ...................................... ..
19,095 12.3 16,702 10.7 2,393 1.5
27,846 13.8 22,058 4.9 22,024 13.7 24,999 26,561 13.2 20,492 4.6 20,527 12.7 23,205
1,285 .6 1,566 .3 1,496 .9 1,794
3.4 3.2
.2
21,097 18,708 2,389
3.0 2.6
.3
------~-
Percent change
1988- 1992-1993 i993 --"---"------
7.9 -2.9 -9.8 -6.2
-15.6 -15.9
3.3 16.7
1.8 11.9 24.3
6.2 6.8
-6.0
20.8
353.2 -6.9 4.6
17.5 -16.7 -47.9
-3.3 49.0
I -13.1 10.6
-75.1
10.5 12.0
-.2
-7.5 -19.7
-4.2 -2.9 -6.5
-.2 -53.3 -18.7 -55.6
-6.1 -12.0
-11.1 -11.5
-1.3
10.0
-3.1 -82.2 -45.0 -45.5 -43.6 -45.0 -91.4 -46.6 -93.3 -3~.0
-67.4
-15.6 -19.4 33.2
Other property9 ............................ . 5,808 3.7 3,534 1.8 4,384 1.0 3,936 2.4 19,886 2.7 563,421 79.8 :9,600.8 2,733.3
Notes: Value and percents may not add to subtotals, total, or 1':'u.O because of independent rounding. property type is determined by the point of origin of a fire.
'Single occupancy - houses, townhouses, duplexes, elc. 'Other residential - apartments, tenements, hotels, motels, etc. 3Storage - bams, garages, warehouses, etc. 'Other commerclal- stores, restaurants, oUices, etc. 'Community/public - churches, JailS, schools, hospttals, etc.
'Other structural property - outbuildings, buildings under construction, etc. 'Motor vehicles - aulos, trucks. buses, etc. BOther mooile property - trailers, recreational vehicles, airplanes, boats, etc. "Other property - crops, limber, fences, etc.
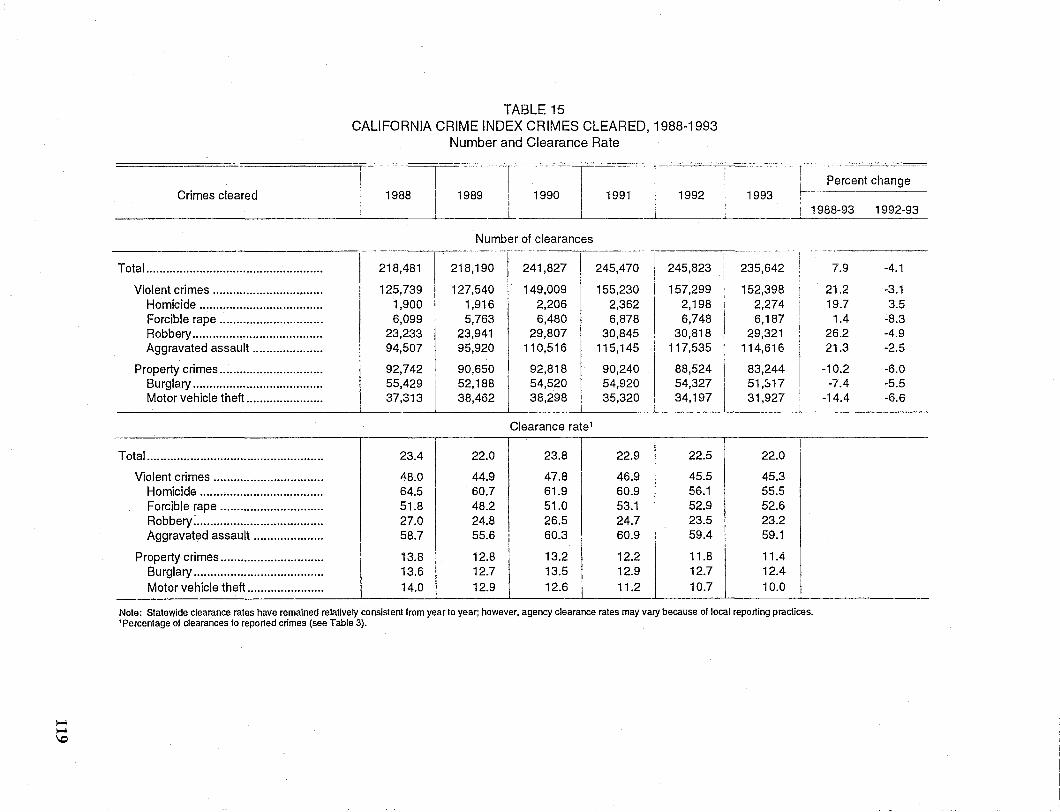
~ .... \C
TABLE 15 CALIFORNIA CRIME INDEX CRIMES CLEARED, 1988-1993
Number and Clearance Rate
Percent change I -T- I -r--- J
Crimes cleared 1988 I 1989 ~ 1990 I 1991 _ i 1992 1993 1988-93 1992-93
Number of clearances
I ' I I i I Total..................................................... 218,481 218,190 241,827 I 245,470 I 245,823 ,235,642 7.9 -4.1
Violent crimes ................................. 125,739 127,540 149,009 'I 155,230 157,299 I 152,398 21.2 -3.1 Hom.icide ..................................... 1,900 1,916 2,206 2,362 I 2,198 I 2,274 19.7 3.5 Forcible rape ............................... 6,099 5,763 6,480 I 6,878 6,748 6,187 1.4 -8.3 Robbery....................................... 23,233 23,941 29,807 30,845 I 30,818 29,321 26.2 -4.9 Aggravated assault ..................... 94,507 95,920 110,516 115,145 I 117,535 114,616 21.3 -2.5
Property crimes ............................... 92,742 90,650 92,818 90,240 \ 88,524 83,244 -10.2 -6.0 Burglary .. :.................................... 55,429 52,188 54,520 54,920 54,327 I' 51,817 -7.4 -5.5 Motor vehicle theft....................... 37,313 38,462 38,298 35,320 I 34,197 31,927 -14.4 -6.6
Clearance rate 1
Total ..................................................... 23.4 22.0 23.8 22.9 22.5 22.0
Violent crimes ................................. 48.0 44.9 47.8 46.9 45.5 45.3 Homicide ..................................... 64.5 60.7 61.9 60.9 56.1 55.5 Forcible rape ............................... 51.8 48.2 51.0 53.1 52.9 52.6 Robbery ....................................... 27.0 24.8 26.5 24.7 23.5 23.2 Aggravated assault ..................... 58.7 55.6 60.3 60.9 59.4 59.1
Property crimes ............................... 13.8 12.8 13.2 12.2 11.8 11.4 Burglary ....................................... 13.6 12.7 13.5 12.9 ;1 12.4 Motor vehicle theft ....................... 14.0 12.9 12.6 11.2 10.7 10.0~
- ---- -- - -------- --~
Note: Statewide clearance rates have remained relatively consistent from year to year; however, agency clearance rates may vary because of local reporting practices. 'Percentage 01 clearances to reported crimes (see Table 3).
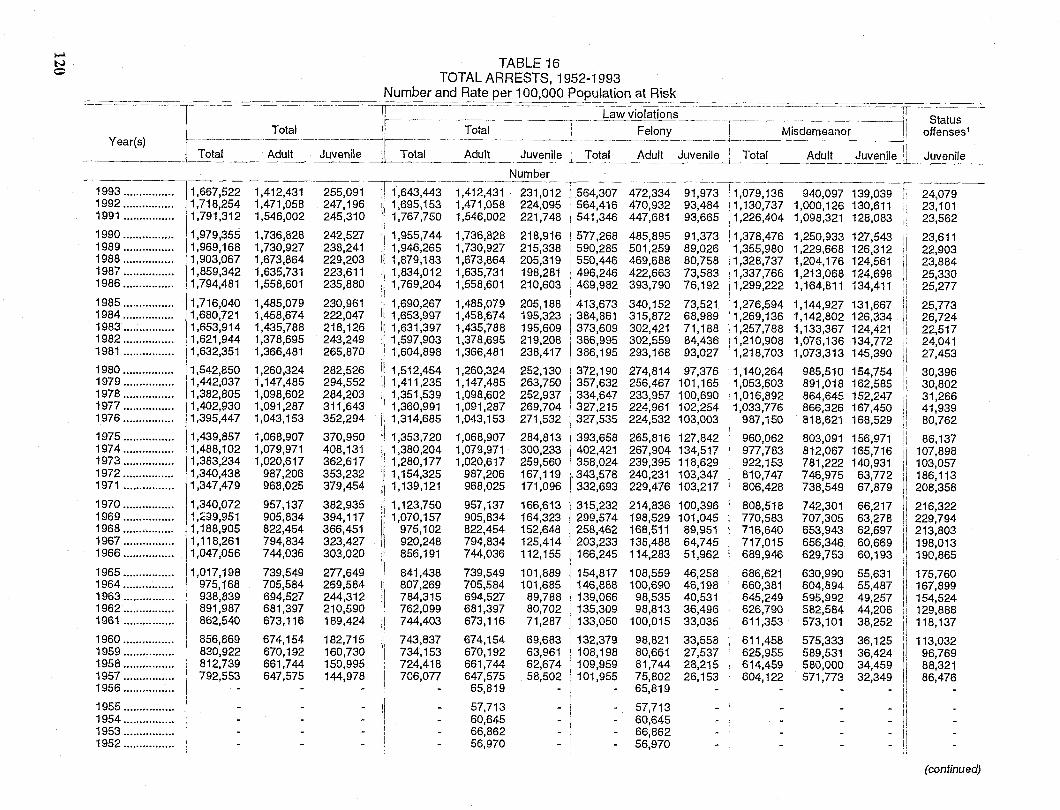
..... N o TABLE 16
TOTAL ARRESTS, 1952-1993 Number and Rate per 100,000 Population at Risk
===--:--~-=---l--~--------------==:====r---~---~===:~ --~~-----_-------"I -c:.-=~ La~_~lO-I~t~~S::-~ __ --=-~-: --=~=~--=~~-~=" =~_~"'1 Status Total i Total I Felony I Misdemeanor !I offenses 1
Year(s) --------- ----------1 -----------------------f-----------------------------l-------~--------------li Total ____ Adult _Juvenile _~.9~a_I __ ~dul!.. ___ Ju~nile I Total __ ~_~~~vBnil~_L2~~ ___ Adu!!. Juvenile II Juvenile
1993 ............... . 1992 .............. .. 1991 .............. ..
1990 ............... . 1989 .............. .. 1988 .............. .. 1987 .............. .. 1986 .............. ..
1985 ............... . 1984 ............... . 1983 ............... . 1982 ............... . 1981 ............... .
1980 ............... . 1979 .............. .. 1978 .............. .. 1977 ............... . 1976 ............... .
1975 ............... . 1974 .............. .. 1973 ............... . 1972 ............... . 1971 ............... .
1970 ............... . 1969 ............... . 1968 ............... . 1967 ............... . 1966 ............... .
1965 .............. .. 1964 ............... . 1963 .............. .. 1962 .............. .. 1961 ............... .
1960 .............. .. 1959 .............. .. 1958 ............... . 1957 .............. .. 1956 ............... .
1955 .............. .. 1954 ............... .
11,667,522 1,412,431 11,718,254 1,471,058 '1,791,312 1,546,002
1,979,355 1,969,168 1,903,067 1,859,342 1,794,481
1,716,040 1,680,721 1,653.914 1,621,944 1,632,351
1,542,850 1,442,037 1,382,805 1,402,930 1,395,447
1,439,857 1,488,102 1,383,234 1,340,438 1,347,479
1,340,072 1,239,951 1,188,905 1,118,261 1,047,056
1,017,198 I 975,168 I 938,839
j 891,987 862,540
856,869 830,922 812,739 792,553
1,736,828 1,730,927 1,673,864 1,635,731 1,558,601
1,485,079 i ,458,674 1,435,788 1,378,695 1,366,481
1,260,324 1,147,485 1,098,602 1,091,287 1,043,153
1,068,907 1,079,971 1,020,617
987,206 968,025
957,137 905,834 822,454 794,834 744,036
739,549 705,584 694,527 681,397 673,116
674,154 670,192 661,744 647,575
1953 ................ , 1952 .............. ..
Number
~il------------------~-----,------------------" -------~- -rr 255,091 1 1,643,443 1,412,431 231,012 1564,307 472,334 91,973 ! 1,079,136 940,097 139,039 Ii
247,196 11,695,153 1,471,058 224,095 I 564,416 470,932 93,484 111 ,130,737 1,000,126 130,611 1: 245,310 11,767,750 1,546,002 221,748 541,346 447,681 93,665,1,226,404 1,098,321 128,083 if 242,527 \1,955,744 1,736,828 218,916 577,268 485,895 91,373 ! 1,378,476 1,250,933 127,543 :1 238,241 11,946,265 1,730,927 215,338 590,285 501,259 89,026 1,355,980 1,229,668 126,312 iI 229,203 1,879,183 1,673,864 205,319 550,446 469,688 80,758 1,328,737 1,204,176 124,561 iI 223,611 1,834,012 1,635,731 198,281 496,246 422,663 73,583 1,337,766 1,213,068 124,698 :: 235,880 11,769,204 1,558,601 210,603 469,982 393,790 76,192 1,299,222 1,164,811 134,411 :! 230,961 11,690,267 1,485,079 205,188 413,673 340,152 73,521 1,276,594 1,144,927 131,667 il 222,047 I" 1,653,997 1,458,674 195,323 384,861 315,872 68,989 1,269,136 1,142,802 126,334 II 218,126 1,631,397 1,435,788 195,609 373,609 302,421 71,188 1,257,788 1,133,367 124,421 Ii 243,249 11,597,903 1,378,695 219,208 386,995 302,559 84,436 1,210,908 1,076,136 134,772 !! 265,870 1,604,898 1,366,481 238,417 386,195 293,168 93,027 1,218,703 1,073,313 145,390 :1 282,526 1,512,454 1,260,324 252,130 372,190 274,814 97,376 1,140,264 985,510 154,754 II 294,552 1,411,235 1,147,485 263,750 357,632 256,467 101,165 1,053,603 891,018 162,585 !i 284,203 1,351,539 1,098,602 252,937 334,647 233,957 100,690 1,016,892 864,645 152,247 Ii 311,643 1,360,991 1,091,287 269,704 327,215 224,961 102,254 1,033,776 866,326 167,450 I! 352,294 )1,314,685 1,043,153 271,532 327,535 224,532 103,003 987,150 818,621 168,529 11
370,950 1,353,720 1,068,907 284,813 393,658 265,816 127,842 960,062 803,091 156,971 Ii 408,131 1,380,204 1,079,971 300,233 402,421 267,904 134,517 977,783 812,067 165,716 ii 362,617 I 1,280,177 1,020,617 259,560 358,024 239,395 118,629 922,153 781,222 140,931 II 353,232 1,154,325 987,206 167,119 343,578 240,231 103,347 810,747 746,975 63,772 II 379,454 1,139,121 968,025 171,096 332,693 229,476 103,217 806,428 738,549 67,879 I 382,935 1,123,750 957,137 166,613 315,232 214,836 100,396 808,518 742,301 66,217 l! 394,117 1,070,157 905,834 164,323 299,574 198,529 101,045 770,583 707,305 63,278 Ii 366,451 975,102 822,454 152,648 258,462 168,511 89,951 716,640 653,943 62,697 II 323,427 920,248 794,834 125,414 203,233 138,488 64,745 717,015 656,346 60,669 :1 303,020 I 856,191 744,036 112,155 166,245 114,283 51,962 689,946 629,753 60,193 :r
277,649 I 841,438 739,549 101,889 154,817 108,559 46,258 686,621 630,990 55,631 Ii 269,584 I, 807,269 705,584 101,685 146,888 100,690 46,198 660,381 604,894 55,487 )1 244,312 II 784,315 694,527 89,788 139,066 98,535 40,531 645,249 595,992 49,257 d 210,590 II! 762,099 681,397 80,702 135,309 98,813 36,496 626,790 582,584 44,206 ii 189,424 ,I 744,403 673,116 71,287 133,050 100,015 33,035 611,353 573,101 38,252 I!
I '!
182,715 ,I 743,837 674,154 69,683 132,379 98,821 33,558 611,458 575,333 36,125 'I 160,730 il 734,153 670,192 63,961 108,198 80,661 27,537 625,955 589,531 36,424 11'
150,995 i'l" 724,418 661,744 62,674 109,959 81,744 28,215 614,459 580,000 34,459 'I 144,978 I 706,077 647,575 58,502 101,955 75,802 26,153 604,122 571,773 32,349 I
ill 65,819 65,819 L I Ii II 57,713 57.713 - Ii i: 60,645 60,645 - Ii :, 66,862 66,862 - Ii '56,970 56,970 _ I i
24,079 23,101 23,562
23,611 22,903 23,884 25,330 25,277
25,773 26,724 22,517 24,041 27,453
30,396 30,802 31,266 41,939 80,762
86,137 107,898 103,057 186,113 208,358
216,322 229,794 213,803 198,013 190,865
175,760 167,899 154,524 129,888 118,137
113,032 96,769 88,321 86,476
(continued)
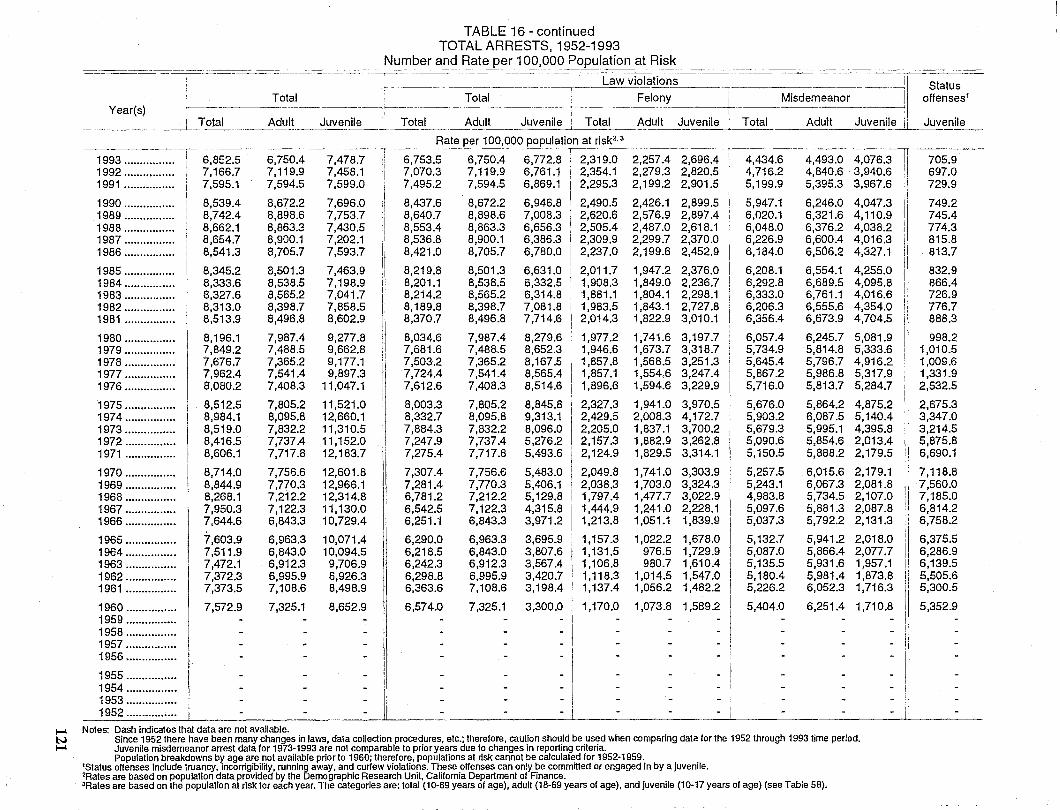
TABLE 16 - continued TOTAL ARRESTS, 1952-1993
Number and Rate per 100,000 Population at Risk ==-=-=--=-=~:===--=-"'==~:-='-CC='CC-=: ::-":L~==C=-=:'c==--=--c:=~=-~~~-~~:==' Law violati~s ---=----==-=-=--=---= -----if Status
y () Total __ ~ ____ L _______ ~ __ Tot~ __ ~ __ . _____ ~ __ ~_. Fel~1"l!' --1. Misdemeanor II offenses1
ear s :, i I I Total Adu~t~_Juveni'-e.._1_ Tot~ __ ~~~I_t ___ ~uvenile I Total . "dult Juvenile I Total Adult Juveni~ Juvenile
-~-.-.-~-----
Ra~ye~ 100,000 E~ulation at risk23 ,
4,493.0 4,076.3 T 705.9 1993 ................ 6,8E2.5 6,750.4 7,478.7 6,753.5 6,750.4 6,772.8 2,319.0 2,257.4 2,696.4 4,434.6 1992 ................ , 7,166.7 7,119.9 7,458.1 7,070.3 7,119.9 6,761.1 ! 2,354.1 2,279.3 2,820.5 4,716.2 4,840.6 3,940.6 ,i 697.0 1991 ................ 7,595.1 7,594.5 7,599.0 7,495.2 7,594.5 6,869.1 2,295.3 2,199.2 2,901.5 5,199.9 5,395.3 3,967.6 Ii 729.9
1990 ................ 8,539.4 8,672.2 7,696.0 8,437.6 8,672.2 6,946.8 2,490.5 2,426.1 2,899.5 5,947.1 6,246.0 4,047.3 II
749.2 Ii 1989 ................ 8,742.4 8,898.6 7,753.7 8,640.7 8,898.6 7,008.3 ' 2,620.6 2,576.9 2,897.4 6,020.1 6,321.6 4,110.9 :1
745.4 1988 ................ 8,662.1 8,863.3 7,430.5 8,553.4 8,863.3 6,656.3 2,505.4 2,487.0 2,618.1 6,048.0 6,376.2 4,038.2 774.3 1987 ................ 8,654.7 8,900.1 7,202.1 8,536.8 8,900.1 6,386.3 2,309.9 2,299.7 2,370.0 6,226.9 6,600.4 4,016.3 il 815.8 1986 ................ 8,541.3 8,705.7 7,593.7 8,421.0 8,705.7 6,780.0 2,237.0 2,199.6 2,452.9 6,184.0 6,506.2 4,327.1 II 813.7
II 1985 ................ 8,345.2 8,501.3 7,463.9 8,219.8 8,501.3 6,631.0 2,011.7 1,947.2 2,376.0 6,208.1 6,554.1 4,255.0
II 832.9
1984 ................ 8,333.6 8,538.5 7,198.9 8,201.1 8,538.5 6,332.5 1,908.3 1,849.0 2,236.7 6,292.8 6,689.5 4,095.8 866.4 1983 ................ 8,327.6 8,565.2 7,041.7 8,214.2 8,565.2 6,314.8 1,881.1 1,804.1 2,298.1 6,333.0 6,761.1 4,016.6 ,I 726.9 1982 ................ 8,313.0 8,398.7 7,858.5 8,189.8 8,398.7 7,081.8 1,983.5 1,843.1 2,727.8 6,206.3 6,555.6 4,354.0 'I 776.7 1981 ................ 8,513.9 8,496.8 8,602.9 8,370.7 8,496.8 7,714.6 2,014.3 1,822.9 3,010.1 6,356.4 6,673.9 4,704.5 'I 888.3 1\
1980 ................ 8,196.1 7,987.4 9,277.8 8,034.6 7,987.4 8,279.6 1,977.2 1,741.6 3,197.7 6,057.4 6,245.7 5,081.9 II 998.2 1979 ................ 7,849.2 7,488.5 9,662.8 7,681.6 7,488.5 8,652.3 1,946.6 1,673.7 3,318.7 5,734.9 5,814.8 5,333.6 !I 1,010.5 1978 ................ 7,676.7 7,365.2 9,177.1 7,503.2 7,365.2 8,167.5 1,857.8 1,568.5 3,251.3 5,645.4 5,796.7 4,916.2 !I 1,009.6 1977 ................ 7,962.4 7,541.4 9,897.3 7,724.4 7,541.4 8,565.4 1,857.1 1,554.6 3,247.4 5,867.2 5,986.8 5,317.9 !I 1,331.9 1976 ................ 8,080.2 7,408.3 11,047.1 7,612.6 7,408.3 8,514.6 1,896.6 1,594.6 3,229.9 5,716.0 5,813.7 5,284.7 'I 2,532.5
1975 ................ 8,512.5 7,805.2 11,521.0 8,003.3 7,805.2 8,845.8 2,327.3 1,941.0 3,970.5 5,676.0 5,864.2 4,875.2 I 2,675.3 1974 ................ 8,984.1 8,095.8 12,660.1 8,332.7 8,095.8 9,313.1 2,429.5 2,008.3 4,172.7 5,903.2 6,087.5 5,140.4 I 3,347.0 1973 ................ 8,519.0 7,832.2 11,310.5 7,884.3 7,832.2 8,096.0 2,205.0 1,837.1 3,700.2 5,679.3 5,995.1 4,395.8 ,i 3,214.5 1972 ................ 8,416.5 7,737.4 11,152.0 7,247.9 7,737.4 5,276.2 2,157.3 1,882.9 3,262.8 5,090.6 5,854.6 2,013.4 'I 5,875.8 1971 ................ 8,606.1 7,717.8 12,183.7 7,275.4 7,717.8 5,493.6 2,124.9 1,829.5 3,314.1 5,150.5 5,888.2 2,179.5 " II 6,690.1
1970 ................ 8,714.0 7,756.6 12,601.8 7,307.4 7,756.6 5,483.0 2,049.8 1,741.0 3,303.9 5,257.5 6,015.6 2,179.1 :1 7,118.8 1969 ................ 8,844.9 7,770.3 12,966.1 7,281.4 7,770.3 5,406.1 2,038.3 1,703.0 3,324.3 5,243.1 6,067.3 2,081.8 " 7,560.0 1968 ................ 8,268.1 7,212.2 12,314.8 6,781.2 7,212.2 5,129.8 1,797.4 i ,477.7 3,022.9 4,983.8 5,734.5 2,107.0 i! 7,185.0 1967 ................ 7,950.3 7,122.3 11,130.0 6,542.5 7,122.3 4,315.8 1,444.9 1,241.0 2,228.1 5,097.6 5,881.3 2,087.8 II 6,814.2 1966 ................ 7,644.6 6,843.3 10,729.4 6,251.1 6,843.3 3,971.2 1,213.8 1,051.1 1,839.9 5,037.3 5,792.2 2,131.3 ii, 6,758.2
1965 ................ 7,603.9 6,963.3 10,071.4 6,290.0 6,963.3 3,695.9 1,157.3 1,022.2 1,678.0 5,132.7 5,941.2 2,018.0 11 6,375.5 1964 ................ 7,511.9 6,843.0 10,094.5 6,218.5 6,843.0 3,807.6 1,131.5 976.5 1,729.9 5,087.0 5,866.4 2,077.7 II 6,286.9 1963 ................ 7,472.1 6,912.3 9,706.9 6,242.3 6,912.3 3,567.4 1,106.8 980.7 1,610.4 5,135.5 5,931.6 1,957.1 Ii 6,139.5 1962 ................ 7,372.3 6,995.9 8,926.3 6,298.8 6,995.9 3,420.7 1,118.3 1,014.5 1,547.0 5,180.4 5,981.4 1,873.8 ii 5,505.6 1961 ................ 7,373.5 7,'IOB.6 8,498.9 6,363.6 7,108.6 3,198.4 1,137.4 1,056.2 1,482.2 I 5,226.2 6,052.3 1,716.3 Ii 5,300.5
7,325.1 8,652.9 6,574.0 7,325.1 3,300.0 1,170.0 1,073.8 I
5,404.0 6,251.4 1,710.8 1,1 5,352.9 1960 ................ 7,572.9 1 ,589.~ i 1959 ................ II 1958 ................ 1957 ................ I - II 1956 ................ I i
- I' , 1955 ................
II
1954 ................ - I 1953 ................ - !; 1952 ................ - il
~ Notes: Dash indicates that data are not available. N Since 1952 there have been many changes in laws, data collection procedures, etc.; therefore, caution should be used when comparing data for the 1952 through 1993 time period. ~ Juvenile misdemeanor arrest data for 1973·1993 are not comparable to prior years due to changes in reporting criteria.
Population breakdowns by age are not available prior to 1960; therefore, populations at risk cannot be calculated for 1952·1959. 'Status offenses include truancy. incorrigibility. running away, and curfew violations. These offenses can only be committed or engaged in by a juvenile. 'Rates are based on population data provided by the Demographic Research Unit, California Department of Finance. 3Rates are based on the population at risk for each year. The categories are: total (l0·69 years of age), adult (18·69 years of age), and juvenile (10·17 years of age) (see Tabie 58).
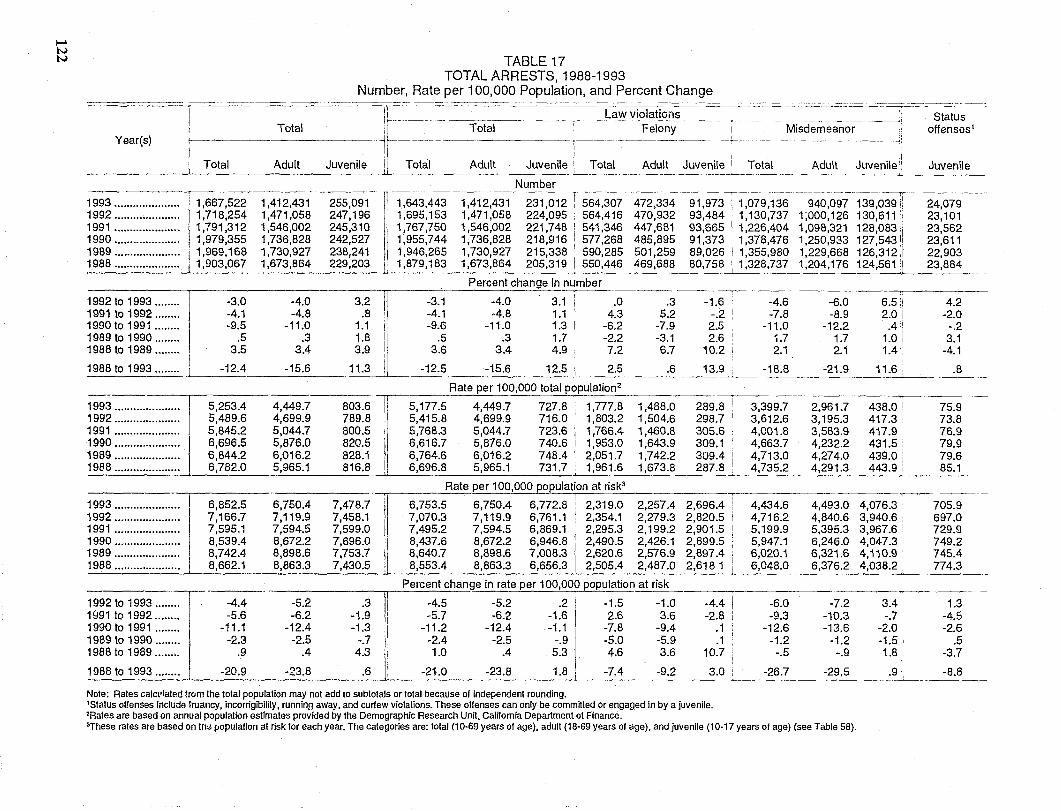
..... N N TABLE 17
TOTAL ARRESTS, 1988-1993 Number, Rate per 100,000 Population, and Percent Change
1 I~=~~== ~~:====--_-==~~~=-:-==-~~~=~iolat[~i1i __ ~=--:=:-~--= cc._.::~= =- - --- - ------.------
I Total :L Total ' Felony Misdemeanor Status
offenses 1
Year(s) 1- l)------- +------~al Adult Juvenile li Total Adult Juven!~e...L~~~
1993 .................... . 1992 .................... . 1991 .................... . 1990 .................... . 1989 .................... . 1988 .................... .
1992 to 1993 ....... . 1991 to 1992 ....... . 1990 to 1991 ....... . 1989 to 1990 ....... . 1988 to 1989 ....... .
1988 to 1993 ....... .
1993 ................... .. 1992 ................... .. 1991 .................... . 1990 .................... . 1989 .................... . 1988 .................... .
1993 .................... . 1992 .................... . 1991 .................... . 1990 .................... . 1989 .................... . 1988 .................... .
1992 to 1993 ....... . 1991 to 1992 ....... . 1990 to 1991 ....... . 1989 to 1990 ....... . 1988 to 1989 ....... .
1988 to 1993 ....... .
~667,522 1,412.431 255:091 -r~43,443 1,718,254 1,471,058 247,196 I 1,695,153 1,791,312 1,546,002 245,310 1,767,750 1,979,355 1,736,828 242,527 Ii 1,955,744
11,969,168 1,730,927 238,241 1,946,265 ! 1,903,067 1,673,864 229,203 Ii 1,879,183
-3.0 -4.0 3.2 -4.1 -4.8 .8 -9.5 -11.0 1.1.
.5 .3 1.8 [I 3.5 3.4 3.9 'I
-12.4 -15.6 11.3 II
5,253.4 5,489.6 5,845.2 6,696.5 6,844.2 6,782.0
4,449.7 4,699.9 5,044.7 5,876.0 6,016.2 5,965.1
803.6 789.8 800.5 820.5 828.1 816.8
-3.1 -4.1 -9.6
.5 3.6
-12.5
5,177.5 5,415.8 5,768.3 6,616.7 6,764.6 6,696.8
Adult Juvenile Total
Number ··~-----------r -------- -.---1,412,431 231,012 I 564,307 472,334 1,471,058 224,095: 564,416 470,932 1,546,002 221,748 i 541,346 447,681 1,736,828 218,916 I 577,268 485,895 1,730,927 215,338 i 590,285 501,259 1,673,864 205,319 I 550,446 469,688
Percent change in number
-4.0 ~-
3.1 I .0 .3 -4.8 1.1 i 4.3 5.2
-11.0 1.3 i -6.2 -7.9 .3 1.7 I -2.2 -3.1
3.4 4.9 I 7.2 6.7
-15.6 12.5 i 2.5 .6
Rate per 100,000 total population2
I 4,449.7 727.8 I 1,777.8 1,488.0 4,699.9 716.0 I 1,803.2 1,504.6 5,044.7 723.6 I 1,766.4 1,460.8 5,876.0 740.6 i 1,953.0 1,643.9 6,016.2 748.4: 2,051.7 1,742.2 5,965.1 731.7 I 1,961.6 1.673.8
-T------- ----91,973 ~, 1,079,136 93,484 ! 1,130,737 93,665 i 1,226.404 91,373 1 1,378,476 89,026 i 1,355,980 80,758 I 1,328,737
~.--
-4.6 -7.8
-11.0 U 2.1
13.9 • -18.8 --
289.8 ~ 3,399.7 298.7 : 3,612.6 305.6 • 4,001.8 309.1 i 4,663.7 309.4 4,713.0 287.8 4,735.2
Rate per 100,000 population at risk3
Adult
940,097 1,000,126 1,098,321 1,250,933 1,229,668 1,204,176 --~
-6.0 -8.9
-12.2 1.7 2.1
-21.9
2,961.7 3,195.3 3,583.9 4,232.2 4,274.0 4,291.3
6,852.5 6,750.4 7,478.7 il 6,753.5 6,750.4 6,772.8 l 2,319.0 2,257.4 2,696.4 4,434.6 4,493.0 7,166.7 7,119.9 7,458.1, 7,070.3 7,119.9 6,761.1 i 2,354.1 2,279.3 2,820.5 4,716.2 4,840.6 7,595.1 7,594.5 7,599.0 17.495.2 7,594.5 6,869.1 1 2,295.3 2,199.2 2,901.5 5,199.9 5,395.3 , I 8,539.4 8,672.2 7,696.0 8,437.6 8,672.2 6,946.8 I 2,490.5 2,426.1 2,899.5 5,947.1 6,246.0 8,742.4 8,898.6 7,753.7 I . 8,640.7 8,898.6 7,008.3 I' 2,620.6 2,576.9 2,897.4 6,020.1 6,321.6 8,662.1 8,863.3 7,430.5 8,553.4 8,863.3 6,656.3 2,505.4 2,487.0 2,618 1 6,048.0 6,376.2
Percent change in rate per 100,000 population at risk
-4.4 -5.6
-11.1 -2.3
.9
-5.2 -6.2
-12.4 -2.5
.4
.3 i -4.5 -5.2 .2 -1.5 -1.0 -4.4 I -1.9 I -5.7 -6.2 -1.6 2.6 3.6 -2.8 : -1.3 I -11.2 -12.4 -1.1 -7.8 -9,4 .1 -.7! -2.4 -2.5 -.9 -5.0 -5.9 .1 4.3 i, 1.0 .4 5.3 4.6 3.6 10.7
-6.0 -9.3
-12.6 -1.2
-.5
-7.2 -10.3 -13.6
-1.2 -.9
-20.9 -23.8 .6 Il -21.0 -23.8 1.8 -7.4 -9.2 3.0 -26.7 -29.5
Note: Rates calcl,lated from the total population may not add 10 subtotals or total because of independent rounding. 'Status oftenses Include truancy, incorrigiblltty, runnin!l away, and cUrfew Violations. These offenses can only be committed or engaged in by a juvenile. 'Rates are based on annual population estimates provided by the Demographic Research Unit, Calffomia Department of Finance.
I Juvenile::
139,039 130,611 128,083
1
127,543 11
126,312 !i 134 ,561,j
6.5 2.0 .4
1.0 :, 1.4 "
11.6 :
438.0,: 417.3 ' 417.9 431.5 439.0 443.9
Juvenile
4.2 -2.0
-.2 3.1
-4.1
.8
75.9 73.8 76.9 79.9 79.6 85.1
4,076.3 705.9 3,940.6 ' 697.0 3,967.6 729.9 4,047.3 749.2 4,110.9, 745.4 4,038.2, 774.3
3.4, -.7 i
-2.0 -1.5 1.8
.9
1.3 -4.5 -2.6
.5 -3.7
-8.8
'These rates are based on ttM population at risk for each year. The categories are: total (10·69 years of age). adult (18·69 years of age), and juvenile (10-17 years of age) (see Table 58),
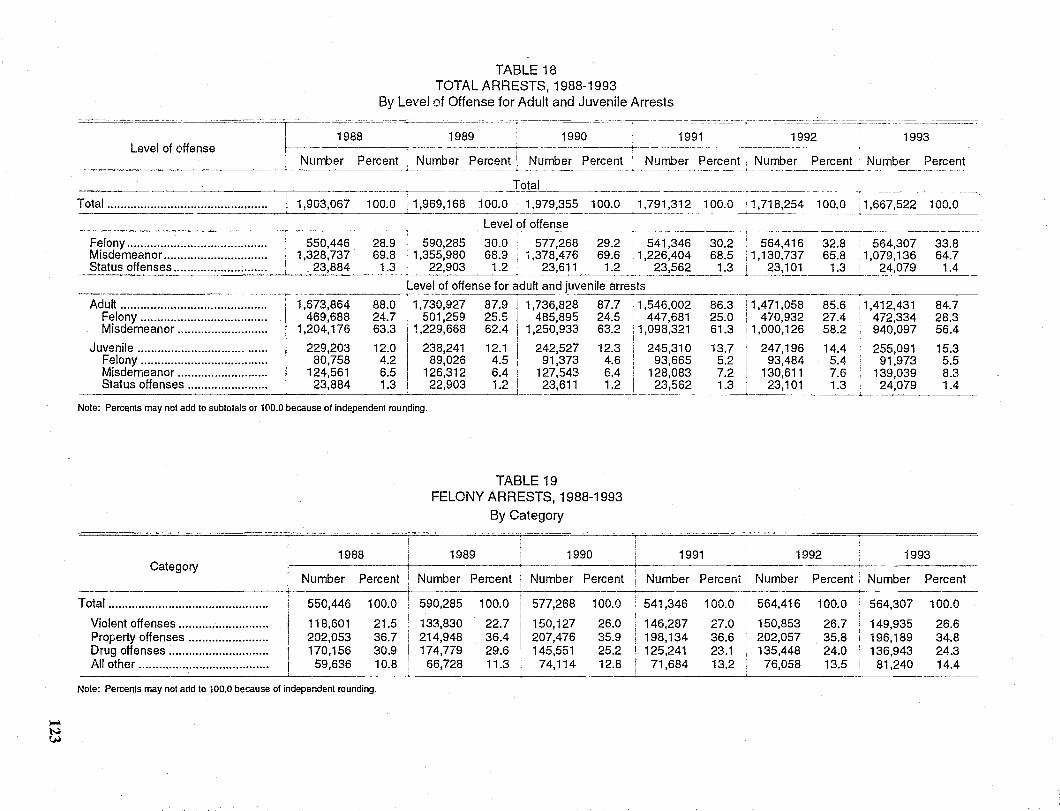
I-' N W
TABLE 18 TOTAL ARRESTS, 1988-1993
By Level of Offense for Adult and Juvenile Arrests
-T 1988 ,1989 1990 1991 1992 1993 Level of offense r-----~------i ~--. - ---------------+---- - -.- ------~-7_---- .---------
I Number Percent 'I Number Percent! Number Percent : Number Percent! Number Percent Number Percent ____ -----.L__ ~~ ___ .. ____ . _________ -40-- ___________ • ____ ---40--_______ • ___ ~ _____ _____________ ~. __ ._. __________ • __ ~ _______ _
Total ,-------~- ---- -~------~---------,-----~ ~-~----~--.- .. ---
Total ".............................................. ! 1.903.067 100.0 ~~9,16~~~~_~,979~5~_~0.0 ~ 1,7~_1~~_~~ __ ~00.0 ~1.7~8.2~4:.~00:O~ __ 1~~67.5~2_100.0 Level of offense
.-r--------,-~---------~---!~------~, --~-----Felony.......................................... 550,446 28.9 I 590.285 30.0! 577.268 29.2 i 541.346 30.2 564,416 Misdemeanor ............................... 1,328,737 69.8 I 1.355.980 68.9 i 1.378,476 69.6 i 1.226,404 68.5 1.130,737 Status offenses ............................ 23.884 1.3 I 22,903 1.2 I 23.611 1.2 i ?3,5~?~~ 1.3 23.101
Adult .......................................... .. Felony ..................................... . Misdemeanor ......................... ..
Juvenile ..................................... . Felony ..................................... . Misdemeanor ......................... .. Status offenses ....................... .
1,673.864 469,688
1.204,176
229.203 80.758
124.561 23.884
88.0 24.7 63.3
12.0 4.2 6.5 1.3
Level of offense for adult and juvenile arrests
[1,730,927 87.9 1,736,828 87.7 '-1-,5-46-.0-0~2-I 501,259 25.5 485.895 24.5 447,681 1'.229.668 62.4 1,250.933 63.2 1.098.321
I 238.241 12.1 242.527 12.3 245.310 I 89,026 4.5 91.373 4.6 93.665 I 126.312 6.4 127,543 6.4 128.083 I 22.903 1.2 23,611 1.2 23.562
Note: Percents may not add to subtotals or 1(10.0 because of independent rounding.
r-- -
TABLE 19 FELONY ARRESTS, 1988-1993
By Category
1990 1991
86.3 : 1,471,058 25.0 470.932 61.3 i1.000.126
13.7 i 247.196 5.2' 93,484 7.2 i 130,611 l'~J 23,101
1992
32.8 65.8
1.3
85.6 27.4 58.2
14.4 5.4 7.6 1.3
564.307 1.079,136
24.079
,1.412,431 , 472.334
940,097
255.091 91,973
139.039 24.079
1993
33.8 64.7
1.4
84.7 28.3 56.4
15.3 5.5 8.3 1.4
Category I 1988 1989
Number Percent I Number Percent i Number Percent; Number Percent I Number Percent Number Percent
Total .............................................. .. 1 -~ 55C,446 100.0 590.285 100.0 I
Violent offenses .......................... . Property offenses ....................... . Drug offenses ............................. . All other ..................................... ..
I 118.601 21.5 133.830 22.7
I 202,053 36.7 214.948 36.4 170,156 30.9 174,779 29.6
I 59,636 10.8 66.728 11.3 -----------------------~I-------Note: Percents may not add to 100.0 because of independent rounding.
577,268 100.0 : 541,346 100.0 ~ 564,416 100.0 564.307 100.0
150,127 207,476 145.551
74,114
26.0 35.9 25.2 12.8
146.287 27.0 198.134 36.6 125.241 23.1
71.684 13.2
150,853 202.057 135,448
76.058
26.7 35.8 24.0 13.5 I
149.935 196,189 136,943
81,240
26.6 34.8 24.3 14.4
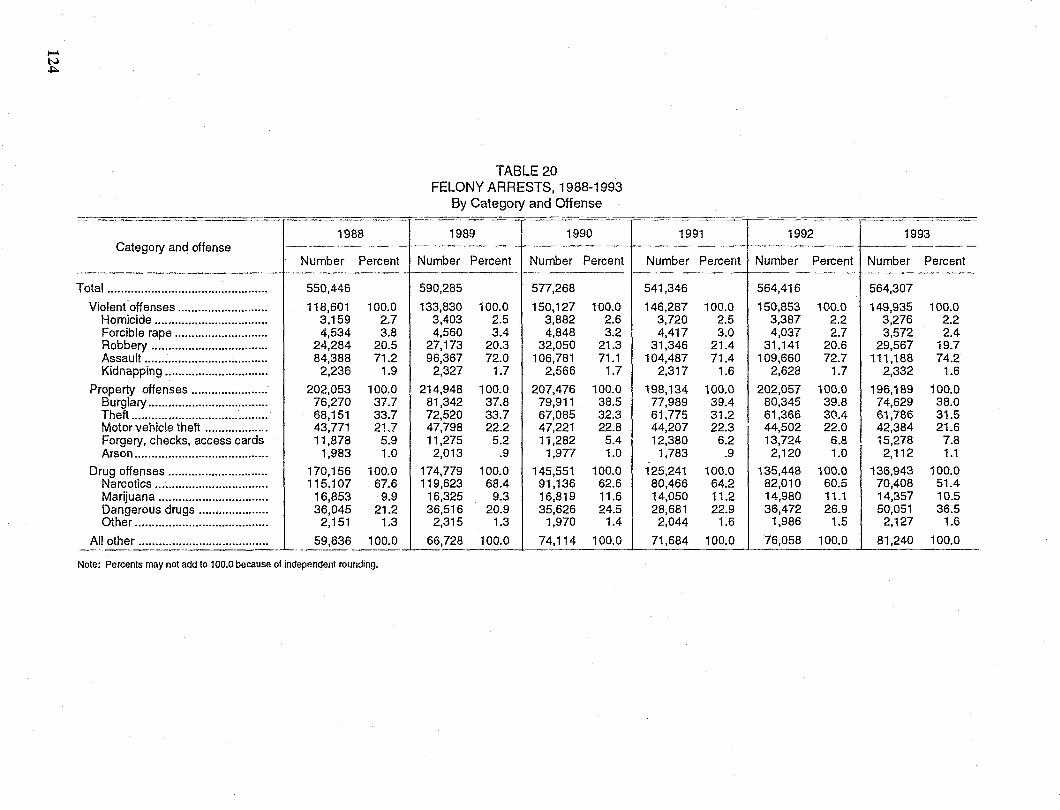
)-4
N ~
1988 Category and offense
Number Percent
T otal ................................................ 550,446
Violent offenses ........................... 118,601 100.0 Homicide .................................. 3,159 2.7 Forcible rape ............................ 4,534 3.8 Robbery ................................... 24,284 20.5 Assault ..................................... 84,388 71.2 Kidnapping ............................... 2,236 1.9
Property offenses ....................... 202,053 100.0 Burglary .................................... 76,270 37.7 Theft ......................................... 68,151 33.7 Motor vehicle theft ................... 43,771 21.7 Forgery, checks, access cards 11,878 5.9 Arson ........................................ 1,983 1.0
Drug offenses .............................. 170,156 100.0 Narcotics .................................. 115,107 67.6 Marijuana ................................. 16,853 9.9 Dangerous drugs ..................... 36,045 21.2 other ........................................ 2,151 1.3
All other ....................................... '- . ~~,636 ~_og~ ---- .. -- ----------_ .. _---_ .. - -- ----_ .. _---_ .... _--
Note: Percents may not add to 100.0 because of independent rounding.
TABLE 20 FELONY ARRESTS, 1988-1993
By Category and Offense
1989 1990
Number Percent Number Percent
590,285 577,268
133,830 100.0 150,127 100.0 3,403 2.5 3,882 2.6 4,560 3.4 4,848 3.2
27,173 20.3 32,050 21.3 96,367 72.0 106,781 71.1
2,327 1.7 2,566 1.7
214,948 100.0 207,476 100.0 81,342 37.8 79,911 38.5 72,520 33.7 67,085 32.3 47,798 22.2 47,221 22.8 11,275 5.2 11,282 5.4
2,013 .9 1,977 1.0
'174,779 100.0 145,551 100.0 119,623 68.4 91,136 62.6
16,325 9.3 16.819 11.6 36.516 20.9 35,626 24.5
2,315 1.3 1,970 1.4
66,728 100.0 74,114 100.0
-I
1991 1992 1993
Number Percent Number Percent Number Percent
541,346 564,416 564,307
146,287 100.0 150,853 100.0 149,935 100.0 3,720 2.5 3,387 2.2 3,276 2.2 4,417 3.0 4,037 2.7 3,572 2.4
31,346 21.4 31,141 20.6 29,567 19.7 104,487 71.4 109,660 72.7 111,188 74.2
2,317 1.6 2,628 1.7 2,332 1.6
198,134 100.0 202,057 100.0 196,189 100.0 77,989 39.4 80,345 39.8 74,629 38.0 61,775 31.2 I 61,366 30.4 61,786 31.5 44,207 22.3 44,502 22.0 42,384 21.6 12,380 6.2 13,724 6.8 15,278 7.8
1,783 .9 2,120 1.0 2,112 1.1
125,241 100.0 135,448 100.0 136,943 100.0 80,466 64.2 82,010 60.5 70,408 51.4 14,050 11.2 14,980 11.1 14,357 10.5 28,681 22.9 36,472 26.9 50,051 36.5
2,044 1.6 1,986 1.5 2,127 1.6
71,684 100.0 76,058 100.0 81,240 100.0
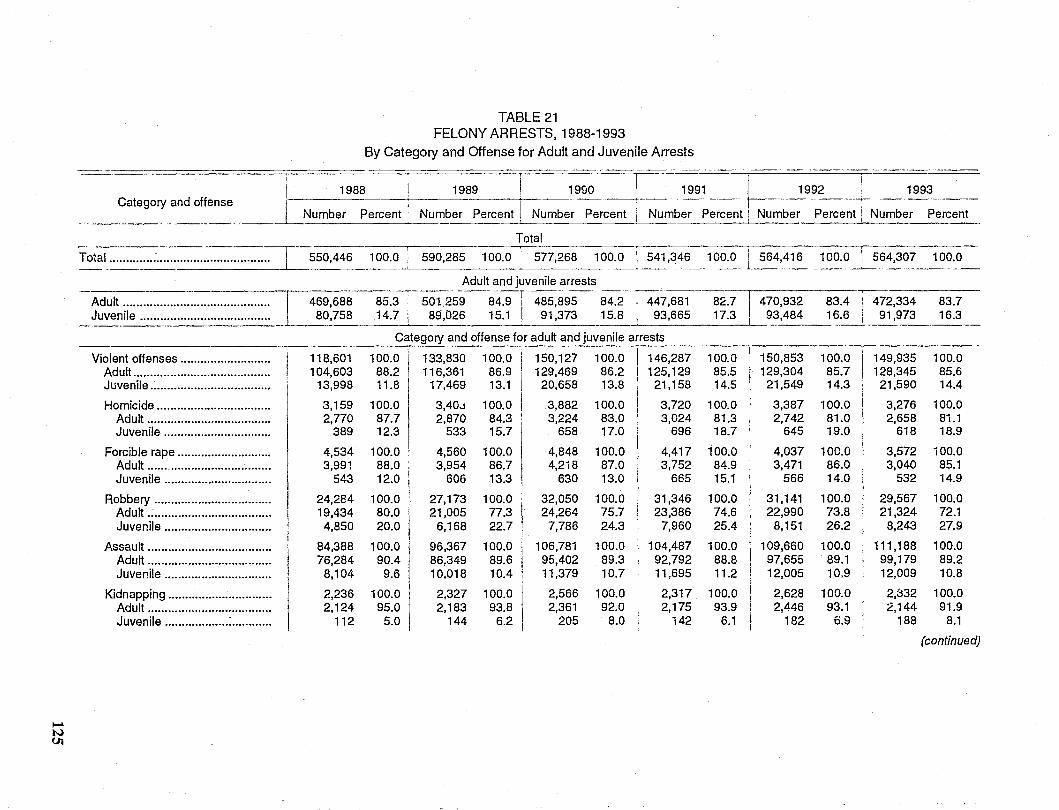
..... N CJi
TABLE 21 FELONY ARRESTS, 1988-1993
By Category and Offense for Adult and Juvenile Arrests
r----- -[
Category and offense I 1988 I 1989 19&0 1991 I 1992 1993
I I I Number Percent I Number Percent Number Percent Number Percent! Number Percent Number Percent
Total
Total................................................ 550,446 100.0 I 590,285 100.0 577,268 100.0 541,346 100.0 564,416 100.0 1 564,307 100.0 ~----------------------~---------~~ ~
Adult ..........•................................. Juvenile ...................................... .
Violent offenses .......................... . Adult ........................................ . Juvenile ...........................•........
Homicide ................................. . Adult .................................... . Juvenile ............................... .
Forcible rape ............•............... Adult ....................................• Juvenile .............................. ..
Robbery ................................. .. Adult .................................... . Juvenile ............................... .
Assault .................................... . Adult .................................... . Juvenile .............................. ..
Kidnapping .............................. . Adult ................................... .. Juvenile .............................. ..
469,688 80,758
118,601 104,603
13,998
3,159 2,770
389
4,534 3,991
543
24,284 19,434
4,850
84,388 76,284
8,104
2,236 2,124
112
Adult and juvenile arrests
85.3 501259 84.9: 485,895 84.2 447,681 82.7 I 470,932 83.4 i 472,334 14.7 89,D26 15.1! 91,373 15.8 93,665 _17.3 __
1 93,484 16.6 I 91,973
Category and offense for adult and juvenile arrests
100.0 133,830 100.0 150,127 100.0 146,287 88.2 116,361 86.9 129,469 86.2 125,129 11.8 17,469 13.1 20,658 13.8 21,158
100.0 3,40,j 100.0 3,882 100.0 3,720 87.7 2,870 84.3 3,224 83.0 3,024 12.3 533 15.7 658 17.0 696
100.0 4,560 100.0 4,848 100.0 4,417 88.0 3,954 86.7 4,218 87.0 3,752 12.0 606 13.3 630 13.0 665
100.0 80.0 20.0
100.0 90.4
9.6
100.0 95.0
5.0
27,173 21,005
6,168
96,367 86,349 10,018
2,327 2,183
144
100.0 77.3 22.7
100.0 89.6 10.4
100.0 93.8
6.2
32,050 24,264
7,786
106,781 95,402 11,379
2,566 2,361
205
100.0 75.7 24.3
100.0 89.3 10.7
100.0 92.0
8.0
31,346 23,386
7,960
104,487 92,792 11,695
2,317 2,175
142
100.0 85.5 14.5
100.0 81.3 18.7
100.0 84.9 15.1
100.0 74.6 25.4
100.0 88.8 11.2
100.0 93.9
6.1
150,853 129,304
21,549
3,387 2,742
645
4,037 3,471
566
31,141 22,990
8,151
109,660 97,655 12,005
2,628 2,446
182
100.0 85.7 14.3
100.0 81.0 19.0
100.0 86.0 14.0
100.0 73.8 26.2
100.0 89.1 10.9
100.0 93.1
6.9
149,935 128,345
21,590
3,276 2,658
618
3,572 3,040
532
29,567 21,324
8,243
111,188 99,179 12,009
2,!:I32 2,144
188
83.7 16.3
100.0 85.6 14.4
100.0 81.1 18.9
100.0 85.1 14.9
100.0 72.1 27.9
100.0 89.2 10.8
100.0 91.9
8.1
(continued)
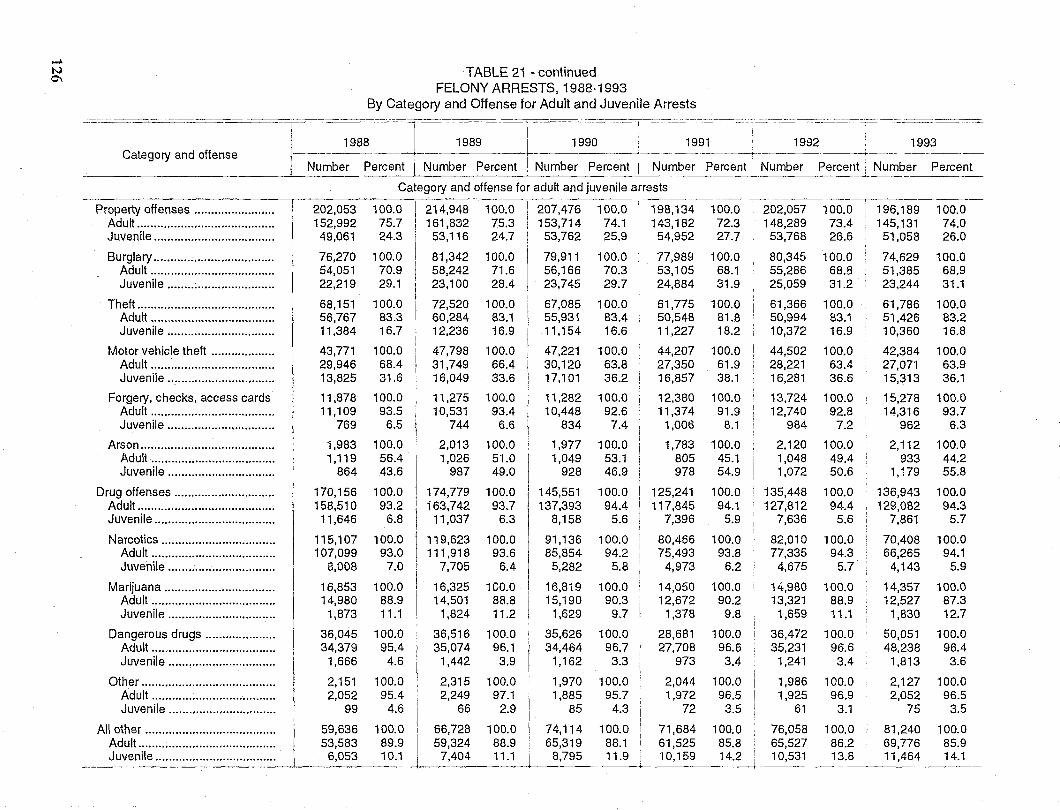
.... N Q\
TABLE 21 - continued FELONY ARRESTS, 1988·1993
By Category and Offense for Adult and Juvenile Arrests
Category and offense
~T ~~9B;~ol_1989 _~ 1990 ~F-=~-~;~~_=-__ ~_+~-_c--_--~~99;~=-=-=-~=c:~ 199~ ,=
i Number Percent I Number Percent I Number Percent i Number Percent LNumber Percent Number Percent --------------------------~-------
Property offenses ....................... . Adult ........................................ . Juvenile ................................... .
Burglary .................... , .............. . Adult ............. , ..................... .. Juvenile ............................... .
Theft ......................... , ............. .. Adult .................................... . Juvenile ............................... .
Motor vehicle theft ................. .. Adult ................................... .. Juvenile .............................. ..
Forgery, checks, access cards Adult .................................... . Juvenile .............................. ..
Arson ...................................... .. Adult ................................... .. Juvenile ............................... .
Drug offenses ............................ .. Adult ........................................ . Juvenile .................................. ..
Narcotics ................................ .. Adult .................................... . Juvenile .............................. ..
Marijuana ............................... .. Adult .................................... . Juvenile .............................. ..
Dangerous drugs .................... . Adult .................................... . Juvenile .............................. ..
Other ....................................... . Adult .................................... . Juvenile ............................... .
All other ..................................... .. Adult ....................................... .. Juvenile ................................... .
202,053 152,992 49,061
76,270 54,051 22,219
68,151 56,767 11,384
43,771 29,946 13,825
11,878 11,109
769
1,983 1,119
864
170,156 158,510
11,646
115,107 107,099
8,008
16,853 14,980
1,873
36,045 34,379
1,666
2,151 2,052
99
59,636 53,583
6,053
Category and offense for adult and juvenile arrests
100.0 75.7 24.3
100.0 70.9 29.1
100.0 83.3 16.7
100.0 68.4 31.6
100.0 93.5
6.5
100.0 56.4 43.6
100.0 93.2
6.8
100.0 93.0
7.0
100.0 88.9 11.1
100.0 95.4
4.6
100.0 95.4
4.6
100.0 89.9 10.1
214,948 161,832
53,116
81,342 58,242 23,100
72,520 60,284 12,236
47,798 31,749 16,049
11,275 10,531
744
2,013 1,026
987
174,779 163,742
11,037
119,623 111,918
7,705
16,325 14,501
1,824
36,516 35,074
1,442
2,315 2,249
66
66,728 59,324
7,404
100.0 75.3 24.7
100.0 71.6 28.4
100.0 83.1 16.9
100.0 66.4 33.6
100.0 93.4
6.6
100.0 51.0 49.0
100.0 93.7
6.3
100.0 93.6
6.4
lCO.O 88.8 11.2
100.0 96.1
3.9
100.0 97.1
2.9
100.0 88.9 11.1
207,476 153,714
53,762
79,911 56,166 23,745
67,085 55,931 11,154
47,221 30,120 17,101
11,282 10,448
834
1,977 1,049
928
145,551 137,393
8,158
91,136 85,854
5,282
16,819 15,190
1,629
35,626 34,464
1,162
1,970 1,885
85
74,114 65,319
8,795
100.0 198,134 74.1 143,182 25.9 54,952
100.0 77,989 70.3 53,105 29.7 24,884
100.0 83.4 16.6
100.0 63.8 36.2 i
100.0 92.6
7.4
100.0 53.1 46.9
100.0 94.4
5.6
100.0 94.2
5.8
100.0 90.3
9.7
100.0 96.7 3.3
100.0 95.7
4.3
100.0 88.1 i
11.9
61,775 50,548 11,227
44,207 27,350 16,857
12,380 11,374
1,006
1,783 805 978
125,241 117,845
7,396
80,466 75,493
4,973
14,050 12,672
1,378
28,681 27,708
973
2,044 1,972
72
71,684 61,525 10,159
100.0 202,057 72.3 148,289 27.7 53,768
100.0 80,345 68.1 55,286 31.9 25,059
100.0 61,366 81.8 50,994 18.2 10,372
100.0 44,502 61.9 28,221 38.1 16,281
100.0 13,724 91.9 12,740
8.1 984
100.0 2,120 45.1 1,048 54.9 1,072
100.0 135,448 94.1 127,812
5.9 7,636
100.0 I
93.8 6.2
100.0 90.2 I
9.8 I
100.0 96.6 3.4
100.0 96.5
3.5 I
100.0 85.8 14.2
82,010 77,335
4,675
14-,980 13,321
1,659
36,472 35,231
1,241
1,986 1,925
61
76,058 65,527 10,531
100.0 73.4 26.6
100.0 68.9 31.2 ;
100.0 83.1 16.9
100.0 63.4 36.6
100.0 \ 92.8
7.2
100.0 49.4 50.6
196,189 145,131
51,058
74,629 51,385 23,244
61,786 51,426 10,360
42,384 27,071 15,313
15,278 14,316
962
2,112 933
1,179
100.0 136,943 94.4 129,082
5.6 i 7,861
100.0 i
94.3 5.7
100.0 88.9 11.1
100.0 96.6 3.4
100.0 96.9
3.1
100.0 86.2 13.8
70,408 66,265
4,143
14,357 12,527
1,830
50,051 48,238
1,813
2,127 2,052
75
81,240 69,776 11,464
100.0 74.0 26.0
100.0 68.9 31.1
100.0 83.2 16.8
100.0 63.9 36.1
100.0 93.7
6.3
100.0 44.2 55.8
100.0 94.3
5.7
100.0 94.1
5.9
100.0 87.3 12.7
100.0 96.4 3.6
100.0 96.5
3.5
100.0 85.9 14.1
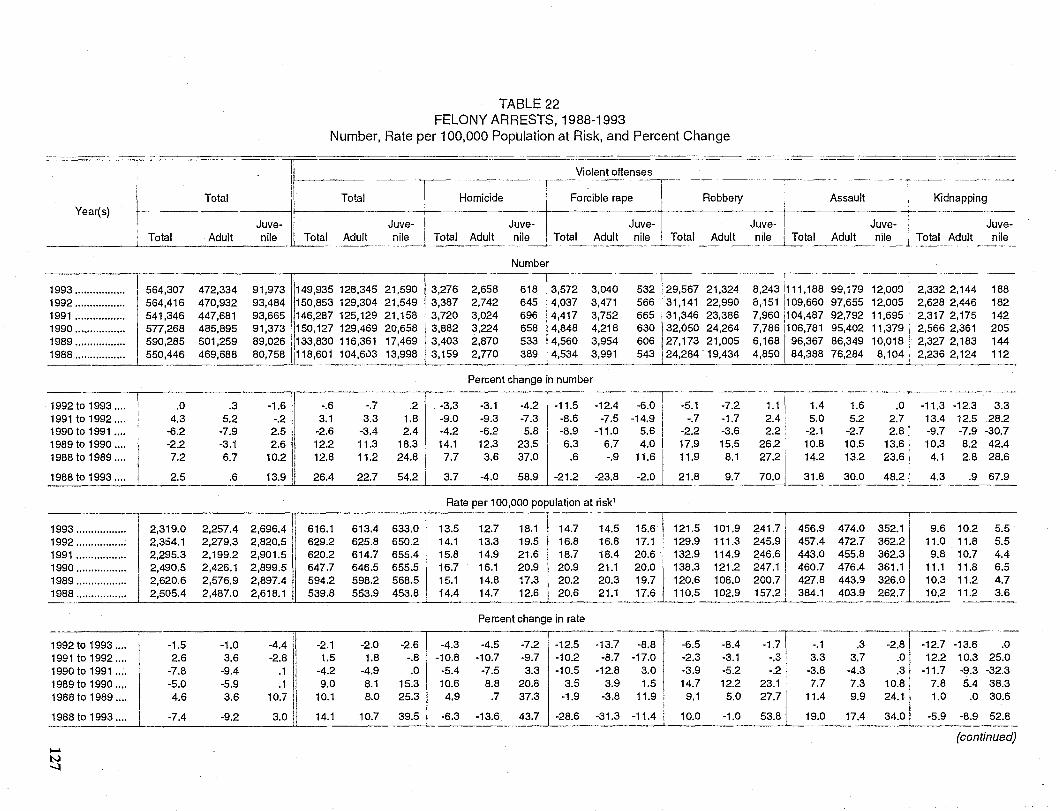
TABLE 22 FELONY ARRESTS, 1988-1993
Number, Rate per 100,000 Population at Risk, and Percent Change
~======-'T'FI =-~==---~-~---~~
l- I Violent offenses
Total Total Homicide I Forcible rape 'I Robbery Assault Kidnapping Year(s) ! _----l. _________ +__ , -
I Juve- Juve- Juve- Juve- I Juve- Juve- I Juve-I Total Adult nile Total Adult nile Total Adult nile I Total Adult nile t Total Adult nile Total Adult nile I Total Adult nile
1993 ................. 1992 ................. 1991 ................. 1990 ................. 1989 ................. 1988 .................
1992 to 1993 .... 1991 to 1992 .... 1990 to 1991 .... 1989 to 1990 .... 1988 to 1989 ....
1988 to 1993 ....
1993 ................. 1992 ................. 1991 ................. 1990 ................. 1989 ................. 1988 .................
1992 to 1993 .... 1991 to 1992 .... 1990 to 1991 .... 1989 to 1990 .... 1988 to 1989 ....
1988 to 1993 ....
~
N -...l
I I
564,307 564,416 541,346 577,268 590,285 550,446
.0 4.3
-6.2 -2.2 7.2
2.5
2,319.0 2,3:;4.1 2,295.3 2,490.5 2,620.6 2,505.4
-1.5 2.6
-7.8 -5.0 4.6
-7.4
472,334 470,932 447,681 485,895 501,259 469,688
.3 5.2
-7.9 -3.1 6.7
.6
2,257.4 2,279.3 2,199.2 2,426.1 2,576.9 2,487.0
-1.0 3.6
-9.4 -5.9 3.6
-9.2
Number
I 618 13,572 532 \ 29,567 21,324
.~-----r--
91,973 149,935 128,345 21,590 13,276 2,658 3,040 8,2431111,188 99,179 12,OOQ i 2,3322,144 188 93,484 150,853 129,304 21,549 3,387 2,742 645 '4,037 3,471 566 31,141 22,990 8,151 i109,660 97,655 12,005 2,628 2,446 182 93,665 146,287 125,129 21,158 3,720 3,024 696 4,417 3,752 665 31,346 23,386 7,9601104,487 92,792 11,695 2,317 2,175 142 91,373 150,127 129,469 20,658 3,882 3,224 658 4,848 4,218 630 32,050 24,264 7,7861106,781 95,402 11,379 2,566 2,361 205 89,026 133,830 116,361 17,469 3,403 2,870 533 4,560 3,954 606 127,173 21,005 6'16~96'367 86,349 10,018 2,327 2,183 144 80,758 1118,601 104,603 13,998 13,159 2,770 389 4,534 3,991 543 24,284 19,434 4,850 84,388 76,284 8,104 2,2362,124 112
.....L_~_. __ ~~ ~~ .. ~_ ... ~_ _
Percent change in number
-6.0 I -1.6 -.6 -.7 .2 -3.3 -3.1 -4.2 -11.5 -12.4 -5. -.2 3.1 3.3 1.8 -9.0 -9.3 -7.3 -8.6 -7.5 -14.91 -2.5 -2.6 -3.4 2.4 -4.2 -6.2 5.8 -8.9 -11.0 5.6 -2.
1 -7.2 1.1 1.4 1.6 .0 -11.3 -12.3 3.3 7 -1.7 2.4 5.0 5.2 2.7 13.4 12.5 28.2 2 -3.6 2.2 -2.1 -2.7 2.8 -9.7 -7.9 -30.7
2.6 12.2 11.3 18.3 14.1 12.3 23.5 6.3 6.7 4.0 I 17. 9 15.5 26.2 10.8 10.5 13.6 10.3 8.2 42.4 10.2 I 12.8 11.2 24.8 7.7 3.6 37.0 .6 -.9 11.61 11.
13.9 26.4 22.7 54.2 3.7 -4.0 58.9 -21.2 -23.8 -2.0 21.
9 8.1 27.2 14.2 13.2 23.6 4.1 2.8 28.6
8 9.7 70.0 31.8 30.0 48.2 4.3 .9 67.9
Rate per 100,000 population at risk'
! I
2,696.4 616.1 613.4 633.0 13.5 12.7 18.1 14.7 14.5 15.6 121.5 101.9 241.7/ 456.9 474.0 352.1 I 9.6 10.2 5.5 2,820.5 629.2 625.8 650.2 14.1 13.3 19.5 16.8 16.8 17.1 129.9 111.3 245.9 457.4 472.7 362.2 11.0 11.8 5.5 2,901.5 620.2 614.7 655.4l'5.' 14.9 21.6 18.7 18.4 20.6 132.9 114.9 246.61 443.0 455.8 362.3 9.8 10.7 4.4 2,899.5 647.7 646.5 655.5 16.7 16.1 20.9 20.9 21.1 20.0 138.3 121.2 247.1 460.7 476.4 361.1 , 11.1 11.8 6.5 2,897.4 594.2 598.2 568.5 15.1 14.8 17.3 20.2 20.3 19.7~ 120.6 108.0 200.71 427.8 443.9 326.0 10.3 11.2 4.7 2,618.1 539.8 553.9 453.8 14.4 14.7 12.6 20.6 21.1 17.6 110.5 102.9 157.2, 384.1 403.9 262.7 10.2 11.2 3.6
_~ ~~_ __~~ __ ~_ f
Percent change in rate
-4.4 -2.1 -2.0 -2.6 -4.3 -4.5 -7.2 -12.5 -13.7 -8.81 -6.5 -8.4 -1.7 -.1 .3 -2.8 -12.7 -13.6 .0 -2.8 I 1.5 1.8 -., 1-,0.' -10.7 -9.7 -10.2 -8.7 -17.0 -2.3 -3.1 -.3 I 3.3 3.7 .0 12.2 10.3 25.0
.1 -4.2 -4.9 .0 -5.4 -7.5 3.3 -10.5 -12.8 3.0 -3.9 -5.2 -.21 -3.8 -4.3 .3 -11.7 -9.3 -32.3
.1 9.0 8.1 15.3 10.6 8.8 20.8 3.5 3.9 1.5 14.7 12.2 23.; 1 7.7 7.3 1°·l'·' 5.4 3S.3 10.7 10.1 8.0 25.3 4.9 .7 37.3 -1.9 -3.8 11.9 9.1 5.0 27.7 11.4 9.9 24.1 1.0 .0 30.6
3.0 14.1 10.7 39.5 -6.3 -13.6 43.7 -28.6 -31.3 -11.4 I 10.0 -1.0 53.8 19.0 17.4 34.0 -5.9 -8.9 52.8 -- ~ - --- --- .---.-~.- -.-~.. ----- .. ~~-.----
(continued)
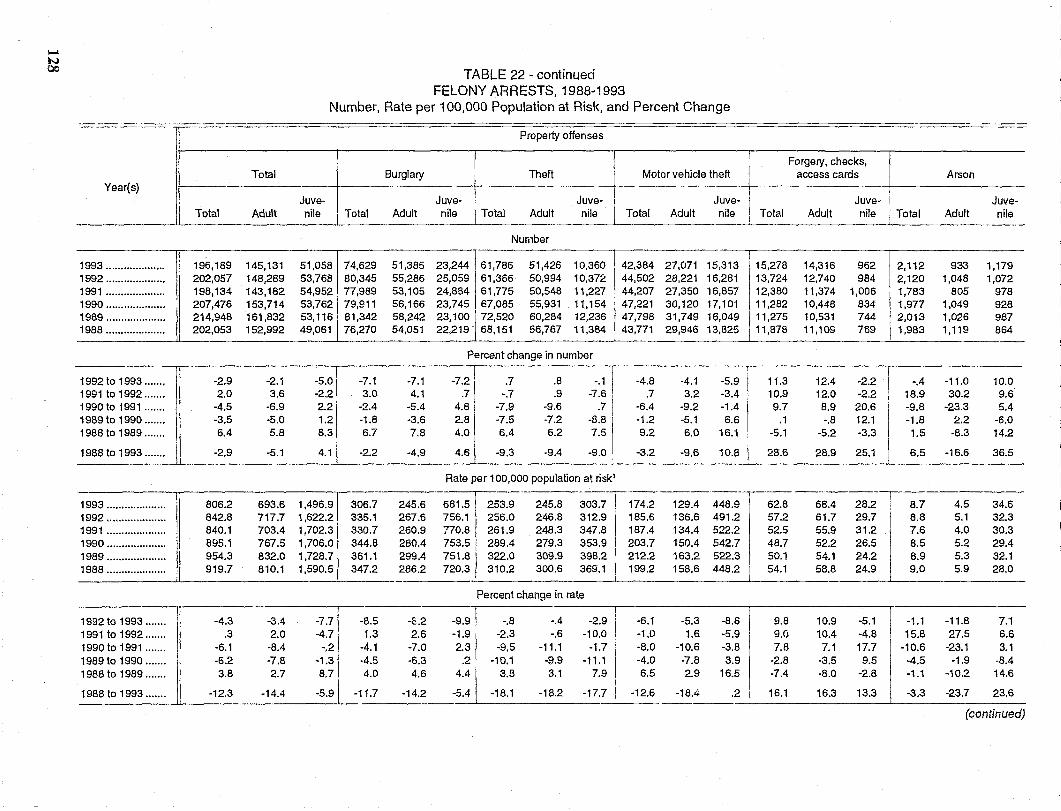
I-" N QO
TABLE 22 - continued FELONY ARRESTS, 1988-1993
Number, Rate per 100,000 Population at Risk, and Percent Change
Property offenses
Total Burglary Theft \ I Forgery, checks, I
Arson Year(s)
I Motor vehicle theft \ access cards j
Juve- Juve- I Total Juve- I Juve- I Juve- ! Juve-
Total Adult nile I Total Adult nile Adult nile I Total Adult nile! Total Adult nile I Total Adult nile
Number
1993 .. . 1992 .. . 1991 .. . 1990 .. . 1989 .. . 1988 .. .
r ,
I
12,112 ................. 196,189 145,131 51,058 74,629 51,385 23,244 61,786 51,426 10,360 1 42,384 27,071 15,313 115,278 14,316 962 933 1,179 ................. 202,057 148,289 53,768 80,345 55,286 25,059 61,366 50,994 10,372 44,502 28,221 16,281 13,724 12,740 984 . 2,120 1,048 1,072 ................. 198,134 143,182 54,952 77,989 53,105 24,884 61,775 50,548 11 ,227 144,207 27,350 16,857 \ 12,380 11,374 1,006 1,783 805 978 ................. 207,476 153,714 53,762 79,911 56,166 23,745 67,085 55,931 11,154 47,221 30,120 17,101 \11,282 10,448 834 1,977 1,049 928 ................. 214,948 161,832 53,116 81,342 58,242 23,100 I 72,520 60,284 12,236 47,798 31,749 16,04U 11,275 10,531 744 2,013 1,026 987 ................. 202,053 152,992 49,061 76,270 54,051 22,219 68,151 56,767 11,384 I 43,771 29,946 13,825 11,878 11,109 769 1,983 1,119 864 --~-.--- ~--~- ~----- ... -... -- .. -- -.~.--~
Percent change in number 1
.72
1
1992 to 1993 ....... -2.9 -2.1 -5.0\ -7.1 -7.1 .7 .8 -.1 ! -4.8 -4.1 -5.9 11.3 12.4 -2.2 -.4 -11.0 10.0 1991 to 1992 ....... 2.0 3.6 -2.2 3.0 4.1 .7 -.7 .9 -7.6 i .7 3.2 -3.4 10.9 12.0 -2.2 18.9 30.2 9.6 1990 tol 991 ....... -4.5 -6.9 2.2 -2.4 -5.4 4.8 -7.9 -9.6 .7 I -6.4 -9.2 -1.4 9.7 8.9 20.6 -9.8 -23.3 5.4 1989 to 1990 ....... -3.5 -5.0 1.2 -1.8 -3.6 2.8 -7.5 -7.2 ~, I -1.2 -5.1 6.6 .1 -.8 12.1 -1.8 2.2 -6.0 1988 to 1989 ....... ~4 5.8 8.3 6.7 7.8 4.0 6.4 6.2 7.5 9.2 6.0 16.1 -5.1 -5.2 -3.3 1.5 -8.3 14.2
1988 to 1993 ....... -2.9 -5.1 4.1 -2.2 -4.9 4.6 -9.3 -9,4 -9.0 1 -3.2 -9.6 10.8 28.6 28.9 25.1 6.5 -16.6 36.5
Rate per 100,000 population at risk'
1993 .................... 806.2 693.6 1,496.9 306.7 245.6 681.5 253.9 245.8 303.7 1 174.2 129.4 448.9 62.8 68.4 282 I 8.7 4.5 34.6
1992 .................... 842.8 717.7 1,622.2 335.1 267.6 756.1 256.0 246.8 312.9 I 185.6 136.6 491.2 57.2 61.7 29.7 8.8 5.1 32.3 1991 .................... 840.1 703.4 1,702.3 330.7 260.9 770.8 261.9 248.3 347.8 187.4 134.4 522.2 52.5 55.9 31.2 7.6 4.0 30.3 1990 .................... I 895.1 767.5 1,706.0 344.8 280.4 753.5 289.4 279.3 353.9 j 203.7 150.4 542.7 48.7 52.2 26.5
I 8.5 5.2 29.4
1989 .................... 954.3 832.0 1,728.7 361.1 299,4 751.8 322.0 309.9 398.2 I 212.2 163.2 522.3 50.1 54.1 24.2 8.9 5.3 32.1 1988 .................... 919.7 810.1 1,590.51 347.2 286.2 720.3 310.2 300.6 369.1 I 199.2 158.6 448.2 I 54.1 58.8 24.9 9.0 5.9 28.0
----.-~-- - ----_ ... __ ... _------------ _ .. _---_._-_ .. _- 'I 1 ~-
Percent change in rate
II 1992 to 1993....... \ -4.3 -3.4 -7.7 -8.5 -£.2 -9.9 -.8 -.4 -2.9 -6.1 -5.3 -8.6 9.8 10.9 -5.1 -1.1 -11.8 7.1 1991 to 1992 ....... .3 2.0 -4.7 1.3 2.6 -1.9 -2.3 -.6 -10.0 -1.0 1.6 -5.9 9.0 10,4 -4.8 15.8 27.5 6.6 1990 to 1991 ....... -6.1 -8,4 -.2 -4.1 -7.0 2.3 -9.5 -11.1 -1.7 -8.0 -10.6 -3.8 7.8 7.1 17.7 -10.6 -23.1 3.1 1989 to 1990 ....... -6.2 -7.8 .,.3
1
-4.5 -6.3 .2 -10.1 -9.9 -11.1 -4.0 -7.8 3.9 -2.8 -3.5 9.5 -4.5 -1.9 -8.4 1988 to 1989 ....... 3.8 2.7 8.7 4.0 4.6 4.4 3.8 3.1 7.9 6.5 2.9 16.5 -7.4 -8.0 -2.8 -1.1 -10.2 14.6
1988 to 1993 ....... -12.3 -14.4 -5.9 -11.7 -14.2 -5.4 -18.1 -18.2 -17.7 -12.6 -18.4 .2 \ 16.1 16.3 13.3 -3.3 -23.7 23.6
(continued)
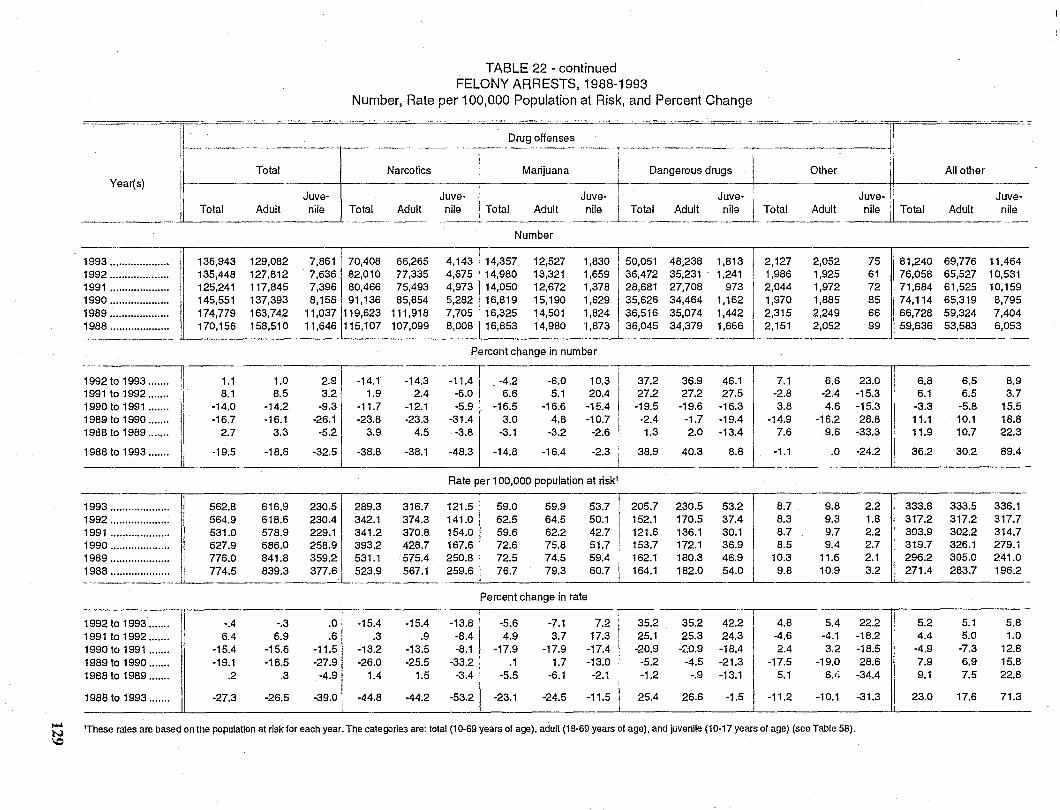
...... ~
lr= I Total
Year(s) I . Juve-
IL Total Aduit nile
1993 ....................
I 136,943 129,082 7,861
1992 .................... 135,448 127,812 7,636 1991 .................... 125,241 117,845 7,396 1990 .................... 145,551 137,393 8,158 1989 .................... 174,779 163,742 11,037 1988 .................... 170,156 158,510 11,646
1992 to 1993 ....... II 1.1 1.0 2.9 1991 to 1992 ....... 8.1 8.5 3.2 1990 to 1991 ....... -14.0 -14.2 -9.3 1989 to 1990 ....... -16.7 -16.1 -26.1 1988 to 1989 ....... 2.7 3.3 -5.2
1988 to 1993 ....... -19.5 -18.6 -32.51
1993 .................... 562.8 616.9 230.5 1992 .................... 564.9 618.6 230.4 1991 .................... 531.0 578.9 229.1 1990 ....................
I 627.9 686.0 258.9,
1989 .................... 776.0 841.8 359.2\ 1988 .................... 774.5 839.3 377.6
1992 to 1993 ....... -.4 -.3 .0 I 1991 to 1992 ....... 6.4 6.9 .6l 1990 to 1991 ....... -15.4 -15.6 -11.51 1989 to 1990 ....... -19.1 -18.5 -27.9 1988 to 1989 ....... .2 .3 -4.91
1988 to 1993 ....... I -27.3 -26.5 -39.0 : - __ .1
TABLE 22 - continued FELONY ARRESTS, 1988-1993
Number, Rate per 100,000 Population at Risk, and Percent Change
Drug offenses
I I Narcotics I Marijuana Dangerous drugs
,
Juve- I Juve- Juve-Total Adult nile I Total Adult nile Total Adult nile
Number
70,408 66,265 4,143 14,357 12,527 1,830 50,051 48,238 1,813 82,010 77,335 4,675 14,980 13,321 1,659 36,472 35,231 1,241 80,466 75,493 4,973 14,050 12,672 1,378 28,681 27,708 973 91,136 85,854 5,282 16,819 15,190 1,629 35,626 34,464 1,162
119,623 111,918 7,705 16,325 14,501 1,824 36,516 35,074 1,442 115,107 107,099 8,008 16,853 14,980 1,873 36,045 34,379 1,666
Percent change in number
-14.1 -14.3 .11.41 -4.2 -6.0 10.3 37.2 36.9 46.1 1.9 2.4 -6.0 6.6 5.1 20.4 27.2 27.2 27.5
-11.7 -12.1 -5.9 -16.5 -16.6 -15.4 -19.5 -19.6 -16.3 -23.8 -23.3 -31.4 3.0 4.8 -10.7 -2.4 -1.7 -19.4
3.9 4.5 -3.8 -3.1 -3.2 -2.6 1.3 2.0 -13.4 I -38.8 -38.1 -48.3 -14.8 -16.4 -2.3 38.9 40.3 8.8J
Rate per 1 00,000 population at risk'
289.3 316.7 121.5 59.0 59.9 53.7 205.7 230.5 53.2 342.1 374.3 141.0 62.5 64.5 50.1 152.1 170.5 37.4 341.2 370.8 154.0 59.6 62.2 42.7 121.6 136.1 30.1 393.2 428.7 167.6 72.6 75.8 51.7 153.7 172.1 36.9 531.1 575.4 250.8 72.5 74.5 59.4 162.1 180.3 46.9 523.9 567.1 259.6 76.7 79.3 60.7 164.1 182.0 54.0
i
Percent change in rate
-15.4 -15.4 -13.8 -5.6 -7.1 7.21 35.2 35.2 42.2 .3 .9 -8.4 4.9 3.7 17.3 1 25.1 25.3 24.3
-13.2 -13.5 -8.1 -17.9 -17.9 -17.4 -20.9 -<:0.9 -18.4 -26.0 -25.5 -33.2 .1 1.7 -13.0 -5.2 -4.5 -21.3
1.4 1.5 -3.4 -5.5 -6.1 -2.1 -1.2 -.9 -13.1
-44.8 -44.2 -53.2 -23.1 -24.5 -11.5 25.4 26.6 -1.5 ____ 1..--
Other
Juve-Total Adult nile
2,127 2,052 75 1,986 1,925 61 2,044 1,972 72 1,970 1,885 85 2,315 2,249 66 2,151 2,052 99
7.1 6.6 23.0 -2.8 -2.4 -15.3 3.8 4.6 -15.3
-14.9 -16.2 28.8 7.6 9.6 -33.3
-1.1 .0 -24.2 -----
8.7 9.8 2.2 8.3 9.3 1.8 8.7 9.7 2.2 8.5 9.4 2.7
10.3 11.6 2.1 9.8 10.9 3.2
4.8 5.4 22.2 -4.6 -4.1 -18.2 2.4 3.2 -18.5
-17.5 -19.0 28.6 5.1 6 ,: -34.4
-11.2 -10.1 -31.3
'These rates are based on the population at risk for each year. The categories are: total (10-69 years of age), adult (18-69 years of age), and juvenile (10-17 years of age) (see Table 58).
~ I I
All other
Juve-Total Adult nile
81,240 69,776 11,464 76,058 65,527 10,531 71,684 61,525 10,159 74,114 65,319 8,795 66,728 59,324 7,404
)59,636 53,583 6,053
6.8 6.5 8.9 6.1 6.5 3.7
-3.3 -5.8 15.5 11.1 10.1 18.8 11.9 10.7 22.3
I 36.2 30.2 89.4 )-----~-~-------
I 333.8 333.5 336.1 317.2 317.2 317.7 303.9 302.2 314.7 319.7 326.1 279.1
I 296.2 305.0 241.0 I _271.4 _~83.7 __ 196.2_
5.2 5.1 5.8 4.4 5.0 1.0
-4.9 -7.3 12.8 7.9 6.9 15.8 9.1 7.5 22.8
23.0 17.6 71.3
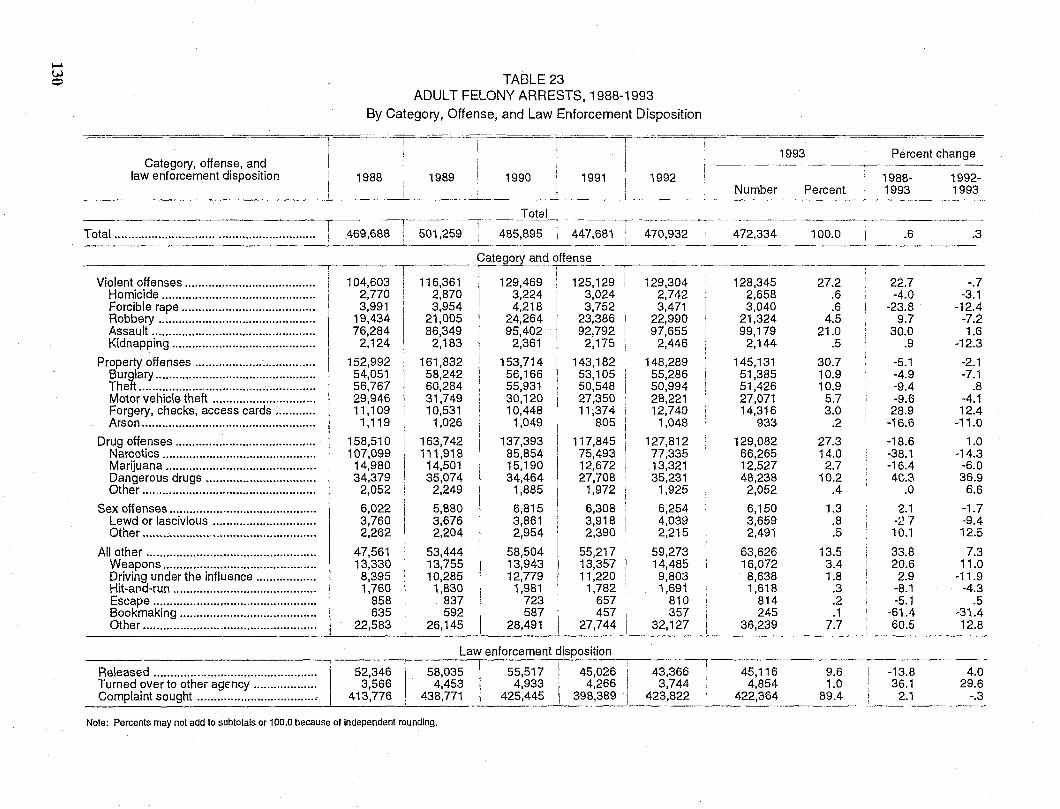
.. w o TABLE 23
ADULT FELONY ARRESTS, 1988-1993 By Category, Offense, and Law Enforcement Disposition
~=====--.--- ~ ~ Category, offense, and
law enforcement disposition I
1988 1989 1990 1991 1992
Total -r------,,--- :-~-'----r
Total............................................................ 469,688 I 501,259 i 485,895 447,681 470,932,
~--------~--r-------Category and offense I "-,--
Violent offenses ... " ................................. . Homicide ............................................. . Forcible rape ....................................... . Robbery .............................................. . Assault ................................................ . Kidnapping .......................................... .
Property offenses .................................. .. Burglary .............................................. .. Theft ................... , ................................ . Motor vehicle theft .............................. . Forgery, checks, access cards ........... . Arson .................................................. ..
Drug offenses ........................................ .. Narcotics ............................................ .. Marijuana ............................................ . Dangerous drugs ................................ . Other .... ,' ............................................. .
Sex offenses ........................................... . Lewd or lascivious ............................. .. Other ..................... ' ............................ ..
All other ................................................. .. Weapons ............................................ .. Driving under the influence ................ .. Hit-and-run .......................................... . Escape ................................................ . Bookmaking ........................................ . Other ................................................... .
Released ................................................ . Turned over to other agency .................. . Complaint sought ............................... " .. .
104,603 2,770 3,991
19,434 76,284
2,124
152,992 54,051 56,767 29,946 11,109
1,119
158,510 107,099 14,980 34,379
2,052
6,022 3,760 2,262
47,561 13,330
8,395 1,760
858 635
22,583
116,361 2,870 3,954
21,005 86,349 2,183
161,832 58,242 60,284 31.749 10,531
1,026
163,742 111,918
14,501 35,074
2,249
5,880 3,676 2,204
53,444 13,755 10,285 1,830
837 592
26,145
I 129,469 i 3,224 t 4,218 I 24,264 I 95,402 i 2,361
153,714 56,166 55,931 30,120 10,448
1,049
137,393 85,854 15,190 34,464
1,885
6,815 3,861 2,954
58,504 13,943 12,779
1,981 723 587
28,491
125,129 3,024 3,752
23,386 92,792 2,175
143,182 53,105 50,548 27,350 11,374
805
117,845 75,493 12,672 27,708
1,972
6,308 i
3,918 2,390
55,217 13,357 11,220
1,782 657 457
27,744
Law enforcement disposition
129,304 2,742 3,471
22,990 97,655
2,446
148,289 55,286 50,994 28,221 12,740 1,048
127,812 77,335 13,321 35,231
1,925
6,254 4,039 2,215
59,273 14,485 9,803 1,691
810 357
32,127
52,346 58,035 55,517 45,026 43,366
I-~- -'-T-- -,--
413,776 438,771 I 425,445 398,389 423,822 3,566 4,453 4,933 4,266 3,744
Note: Percents may not add to subtotals or 100.0 because of independent rounding.
1993 Percent change
Number Percent
472,334
128,345 2,658 3,040
21,324 99,179
2,144
145,131 51,385 51,426 27,071 14,316
933
129,082 66,265 12,527 48,238 2,052
6,150 3,659 2,491
63,626 16,072 8,638 1,618
814 245
36,239
45,116 4,854
422,364
100.0
27.2 .6 .6
4.5 21.0
.5
30.7 10.9 10.9
5.7 3.0
.2 27.3 14.0 2.7
10.2 .4
1.3 .8 .5
13.5 3.4 1.8
.3
.2
.1 7.7
9.6 1.0
89.4
1988- 1992-1993 1993
.6
22.7 -4.0
-23.8 9.7
30.0 .9
-5.1 -4.9 -9.4 -9.6 28.9
-16.6
-18.6 -38.1 -16.4 40.3
.0
2.1 -2 7 10.1
33.8 20.6 2.9
-8.1 -5.1
-61.4 60.5
-13.8 36.1
2.1
.3
-.7 -3.1
-12.4 -7.2 1.6
-12.3
-2.1 -7.1
.8 -4.1 12.4
-11.0
1.0 -14.3
-6.0 36.9
6.6
-1.7 -9.4 12.5
7.3 11.0
-11.9 -4.3
.5 -31.4 12.8
4.0 29.6
-.3
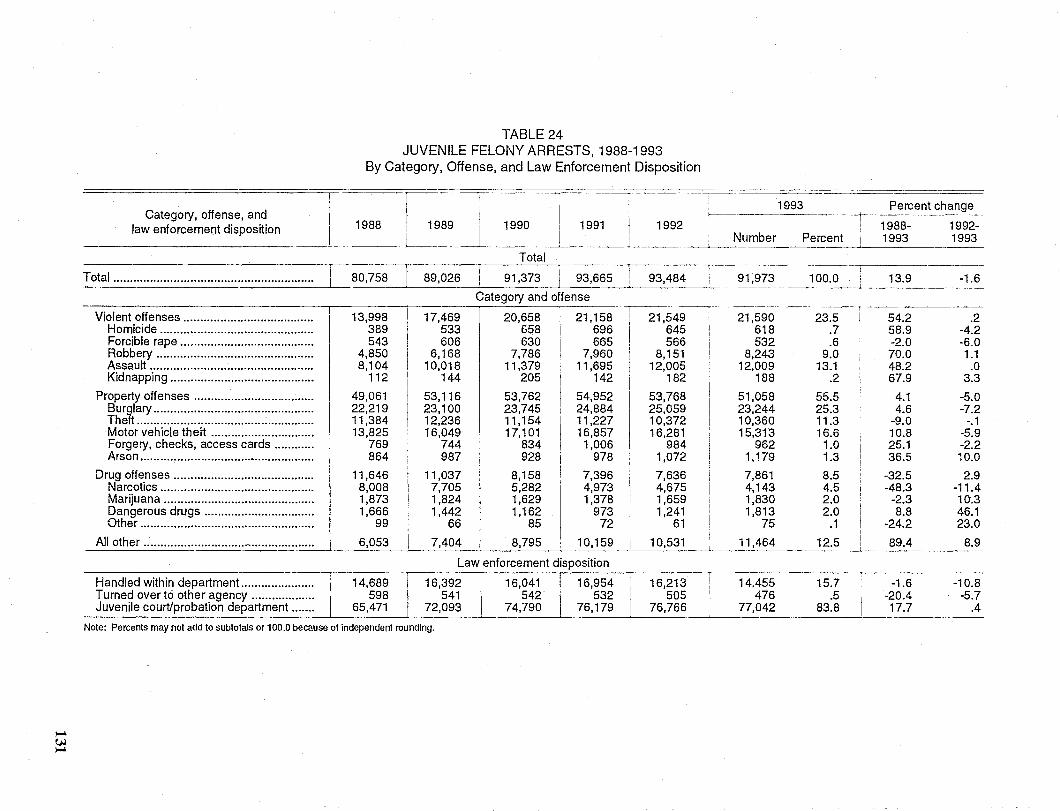
'""" ~ '"""
TABLE 24 JUVENILE FELONY ARRESTS, 1988-1993
By Category, Offense, and Law Enforcement Disposition
I I 1993 I
I Category, offense, and I \----------------t--
1988 1989 1990 1991 I 1992 law enforcement disposition I I I Number Percent
Total
Total ............................................................ 80,758 r 89,026 I 91,373 93,665 93,484 91,973 100.0
Category and offense
Violent offenses ....................................... 13,998 17,469 20,658 21,158 21,549 21,590 23.5 Homicide .............................................. 389 533 658 696 645 618 .7 Forcible rape ........................................ 543 606 630 665 566 532 .6 Robbery ............................................... 4,850 6,168 7,786 7,960 8,151 8,243 9.0 Assault ................................................. 8,104 10,018 11,379 11,695 12,005 12,009 13.1 Kidnapping ........................................... 112 144 205 142 182 188 .2
Property offenses .................................... 49,061 53,116 53,762 54,952 53,768 51,058 55.5 Burglary ................................................ 22,219 23,100 23,745 24,884 25,059 23,244 25.3 Theft ..................................................... 11,384 12,236 11,154 11,227 10,372 10,360 11.3 Motor vehicle theft ............................... 13,825 16,049 17,101 16,857 16,281 15,313 16.6 Forgery, checks, access cards ............ 769 744 834 1,006 984 962 1.0 Arson .................................................... 864 987 928 978 1,072 1,179 1.3
Drug offenses .......................................... 11,646 11,037 8,158 7,396 7,636 7,861 8.5 Narcotics .............................................. 8,008 7,705 5,282 4,973 4,675 4,143 4.5 Marijuana ............................................. 1,873 1,824 1,629 1,378 1,659 1,830 2.0 Dangerous drugs .. _ .............................. 1,666 1,442 1,162 973 1,241 1,813 2.0 Other .................................................... 99 66 85 72 61 75 .1
All other ................................................... 6,053 7,404 8,795 10,159 10,531 11,464 12.5
Law enforcement disposition
I I ------------r-
Handled within department ...................... 14,689 16,392 16,041 16,954 16,213 ! 14,455 15.7 Turned overto other agency ................... 598 541 I 542 I 532 505 476 .5 Juvenile court/probation department ....... 65,471 72,093 74,790 76,179 76,766 77,042 83.8
Note: Percents may not add to SUbtotals or 100.0 because of independent rounding.
Percent change -----
1988- 1992-1993 1993
13.9 -1.6
54.2 .2 58.9 -4.2 -2.0 -6.0 70.0 1.1 48.2 .0 67.9 3.3
4.1 -5.0 4.6 -7.2
-9.0 -.1 10.8 -5.9 25.1 -2.2 36.5 10.0
-32.5 2.9 -48.3 -11.4
-2.3 10.3 8.8 46.1
-24.2 23.0
89.4 8.9
-1.6 -10.8 -20.4 -5.7 17.7 .4
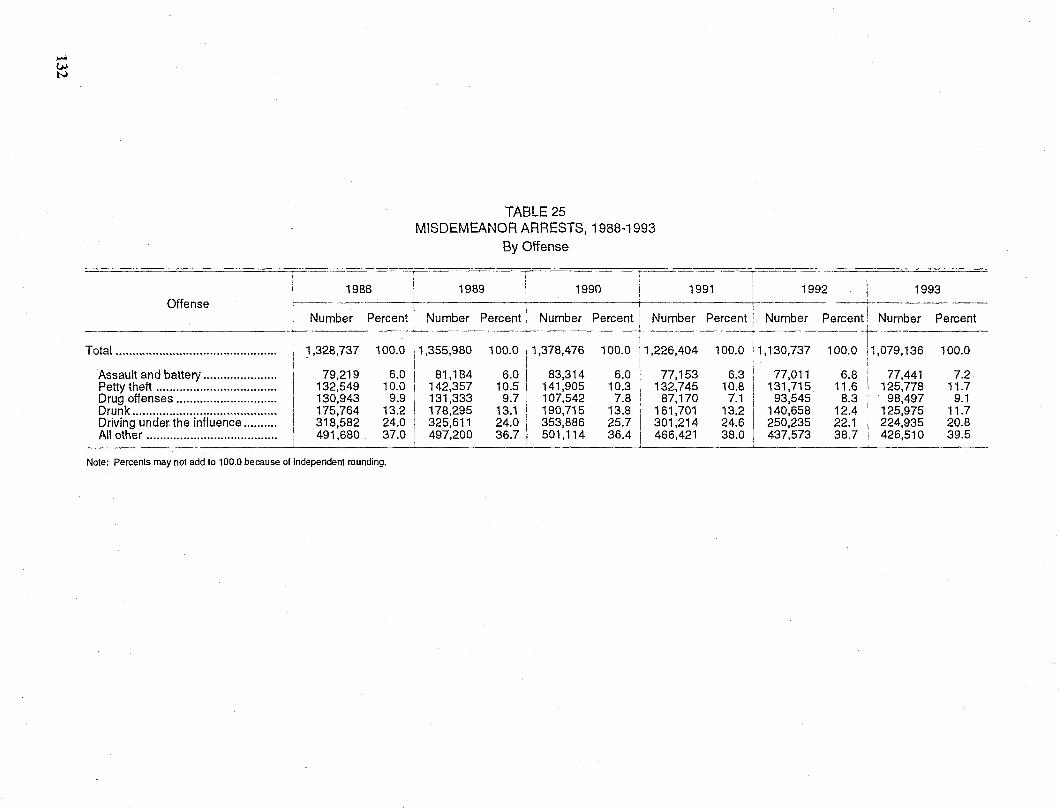
.... {JJ N
TABLE 25 MISDEMEANOR ARRESTS, 1988-1993
By Offense
I ----r-1988 1989 I 1990 1991: 1992 1993
i I '
I I I I Number Percent I Number Percent Number Percent i Number Percent i Number , I I I I I I
Total................................................ 1,328,737 100.0! 1,355,980 100.0.1,378,476 100.0 1,226,404 100.0', 1,130,737 i I
Assault and batter'l...................... 79,219 6.0 I 81,184 6.0 1 83,314 6.0 77,153 6.3 77,011 Petty theft .................................... 132,549 10.0' 142,357 10.51 141,905 10.3 132,745 10.8 131,715 Drug offenses .............................. 130,943 9.9 131,333 9.7 107,542 7.8 87,170 7.1 93,545 Drunk........................................... 175,764 13.2 178,295 13.1 I' 190,715 13.8 161,701 13.2 140,658 Driving under the influence .......... 318,582 24.0 325,611 24.0 353,886 25.7 301,214 24.6 250,235 All other ....................................... 491,680 37.0 497,200 36.7 I 501,114 36.4 466,421 38.0 437,573
Offense
Note: Percents may not add to 100.0 because of independent rounding.
Percent Number
100.0 11,079,136
6.8 11.6
8.3 12.4 22.1 38.7
77,441 125,778
98,497 125,975 224,935 426,510
Percent
100.0
7.2 11.7
9.1 11.7 20.8 39.5
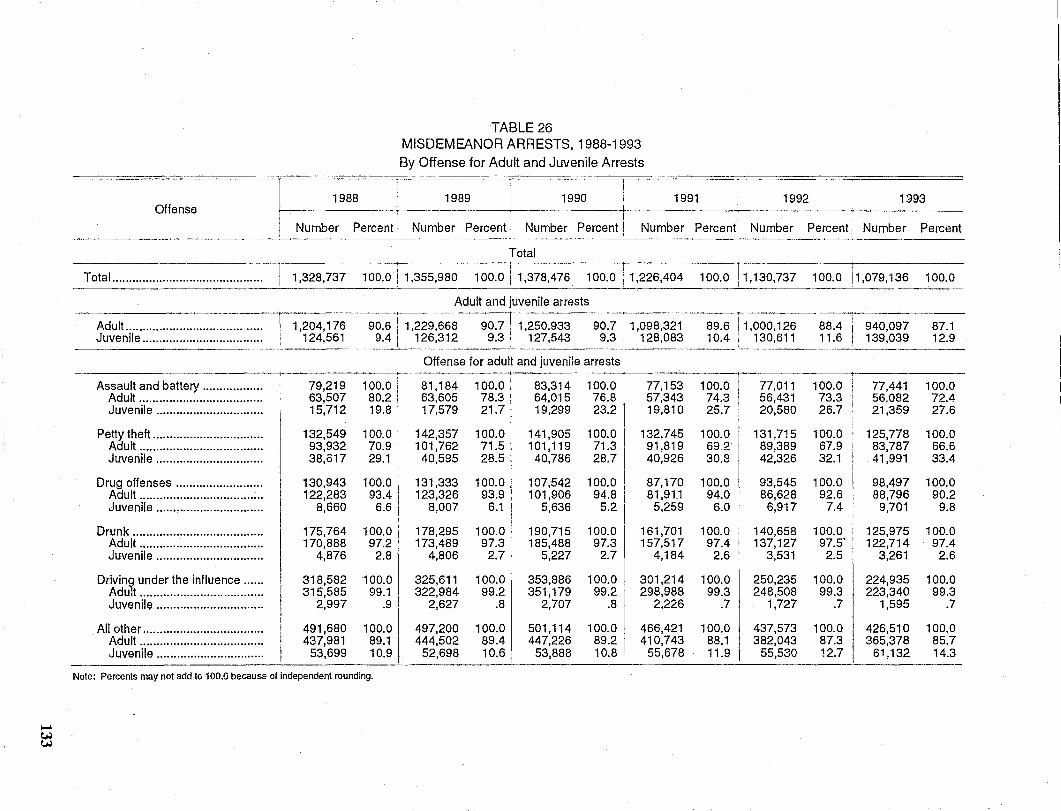
~ ~ ~
TABLE 26 MISDEMEANOR ARRESTS, 1988-1993
By Offense for Adult and Juvenile Arrests
i I
1988 1989 I 1990 , 1991 1992 I HI 93 Offense I -------l. i -t
Number Percent I I
Number Percent! Number Percent Number Percent I Number Percent I Number Percent
Total -;-- ,
I i 100.0 11,130,737
I , I Total ............................................. I 1,328,737 100.0 I 1,355,980 100.0 i 1,378,476 100.0 i 1,226,404 100.0 11,079,136 100.0
Adult and juvenile arrests
I I ,
Adult ......................................... 1,204,176 90.6 I 1,229,668 90.7\1,250,933 90.7 11,098,321 89.6 11,000,126 88.4 940,097 87.1 Juvenile .................................... 124,561 9.4 : 126,312 9.3 127,543 9.3 I 128,083 10.4: 130,611 11.6 139,039 12.9
Offense for adult and juvenile arrests r-- I
Assault and battery .................. 79,219 100.0 i 81,184 100.0 I 83,314 100.0 77,153 100.0 77,011 100.0 77,441 100.0 Adult ..................................... 63,507 80.2 1 63,605 78.3 64,015 76.8 57,343 74.3 56,431 73.3 56,082 72.4 Juvenile ................................ 15,712 19.8 I 17.579 21.71 19,299 23.2 19,810 25.7 20,580 26.7 21,359 27.6
Petty theft ................................. 132,549 100.0 I 142,357 141,905 100.0 132,745 100.0 131,715 100.0 125,778 100.0 100.0 I Adult ..................................... 93,932 70.9 I 101,762 71.5 I 101,119 71.3 91,819 69.2 89,389 67.9 83,787 66.6 Juvenile ................................ 38,617 29.1 I 40,595 28.51 40,786 28.7 40,926 30.S 42,326 32.1 41,991 33.4
Drug offenses .......................... 130,943 100.0 I 131,333 100.0 107,542 100.0 87,170 100.0 93,545 100.0 98,497 100.0 Adult ..................................... 122,283 93.4 i 123,326 93.9 I 101,906 94.8 81,911 94.0 86,628 92.6 88,796 90.2 Juvenile ................................ 8,660 6.6 8,007 6.1 5,636 5.2 5,259 6.0 6,917 7.4 9,701 9.8
I
Drunk ....................................... 175,764 100.0 j 178,295 100.0 190,715 100.0 161,701 100.0 140,658 100.0 125,975 100.0 Adult ..................................... 170,888 97.2 173,489 97.3 185,488 97.3 157,517 97.4 137,127 97.5' I 122,714 97.4 Juvenile ................................ 4,876 2.8 4,806 2.7 5,227 2.7 4,184 2.6 3,531 2.5 , 3,261 2.6
Drivin~ under the influence ...... 318,582 100.0 325,611 100.0 353,886 100.0 301,214 100.0 250,235 100.0 I 224,935 100.0 Adu,t ..................................... 315,585 99.1 322,984 99.2 351,179 99.2 298,988 99.3 248,508 99.3 223,340 99.3 Juvenile ................................ 2,997 .9 ! 2,627 .8 2,707 .8 2,226 .7 1,727 .7 1,595 .7
All other .................................... 491,680 100.0 I 497,200 100.0 501,114 100.0 466,421 100.0 437,573 100.0 426,510 100.0 Adult ..................................... 437,981 89.1 I 444,502 89.4 447,226 89.2 410,743 88.1 382,043 87.3 365,378 85.7 Juvenile ................................ 53,699 10.9 52,698 10.6 53,888 10.8 I 55,678 11.9 55,530 12.7 61,132 14.3
Note: Percents may not add to 100.0 because of independent rounding.
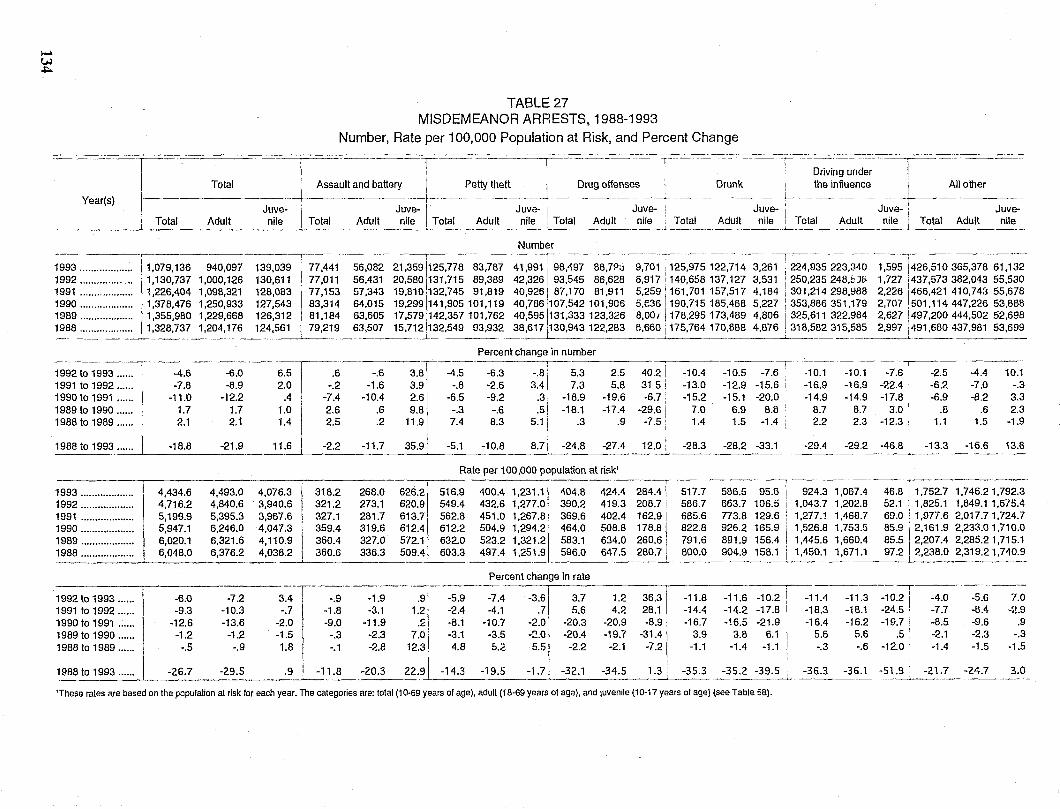
..... tH ,&:;;..
TABLE 27 MISDEMEANOR ARRESTS, 1988-1993
Number, Rate per 100,000 Population at Risk, and Percent Change
Total r:-- ~~--===-=---r-'===-===--=----------,'--~:=::",,--==cc=-T--====-- -~ --~
: I Driving under ! , Assault and battery I Petty theft I Drug offenses Drunk! the infiuence i I ----------t--. ---.- ----.--.--11
- -~ -~·---t----------------+-----------I All other
Year(s) I I Total Adult
Juvenile I Juve-j Juve- Juve- Juve- 1 Juve- i Juve-
Total Adult nile Total Adult nile: Total Adult nile i Total Adult nile ! Total Adult nile I Total Adult nile ______ . __ ~_. ____ ~~ __ .. __ ._~ _______________ ....... ___ ~. ______ ._~ __ .. ..L~ ___ ~ ______ ~ __ ~
Number --~-~t ----~--~-----:-----·~·---------r~------~-.. --~----.---~--.---~-----~--------~. 1993 ................... \ 1,079,136 940,097 139,039 77,441 56,082 21,3591125,778 83,787 41,991198,497 88,79;:; 9,701! 125,975 122,714 3,261 224,935 223,340 1,595 1.426,510365,378 61,132 1992.............. ... 1,130,737 1,000,126 130,611 77,011 56,431 20,5801131,715 89,389 42,326 93,545 86,628 6,917:140,658137,127 3,531 250,235248,bJb 1,727 \437,573382,043 55,530 1991................... 1,226,404 1,098,321 128,083 177.153 57,343 19,810132,745 91,819 40,926187,170 81,911 5,259' 161,701 157,517 4,184 301,214298,988 2,226 1466,421 410,74~i 55,678 1990 ................... (1,378,476 1,250,933 127,543 83,314 64,015 19,2991,41,905101,119 40,786 107,542 101,9~6 5.e3~ 1190.715185,488 5,227 353,886351,179 2,707 i501,l14 447,226 53,888 1989 .................... 1,355,980 1,229,668 126,312 I 81,184 63,605 17,579)'42,357101,762 40,5951131,333 123,3~6 8,00/ 1178,295173,489 4,806 325,611322,984 2,627 :497,200444,50252,698 1988 ................... (1,328,737 1,204,176 124.561 I 79,219 _~3,5~~:~32,549 93,932 38,61.1..:0,94~~~.283 8,6601175,764 170,888 4,876 318,:_82 3!~5~_5_ 2,9!~~1~Bl,680 437,981 53,699
1992 to 1993 ...... 1991 to 1992 , ..... 1990t01991 ...... 1989 to 1990 ...... 1988 to 1989 ......
1988 to 1993 ......
1993 ................... I
1992 ................... 1991 ................... 1990 ................... 1989 ................... 1988 ...................
1992 to 1993 .... .. 1991 to 1992 .... .. 1990 to 1991 .... .. 1989 to 1990 .... .. 1988 to 1989 .... ..
1988 to 1993 ......
Percent change in number .-----------------,- I
------ "
-4.6 -6.0 6.5 1 .6 -.6 3.8 -4.5 -6.3 ;:!\ 5.3 2.5 40.2 -10.4 -10.5 -7.6 -10.1 -10.1 -7.6 : -2.5 -4.4 10.1 -7.8 -8.9 2.0 -.2 -1.6 3.9 -.8 -2.6 7.3 5.8 31.5 -13.0 -12.9 -15.6 -16.9 -16.9 -22.4 I -6.2 -7.0 -.3
-11.0 -12.2 .4 I -7.4 -10.4 2.6 -6.5 -9.2 .3 -18.9 -19.6 -6.7 -15.2 -15.1 -20.0 -14.9 -14.9 -17.8 ; -6.9 -8.2 3.3 1.7 1.7 1.0 I 2.6 .6 9.8 -.3 -.6 .5\ -18.1 -17.4 -29.6 7.0 6.9 8.B B.7 8.7 3.0 I .8 .6 2.3 2.1 2.1 i.4 I 2.5 .2 11.91 7.4 8.3 5.1 i .3 .9 -7.5 1.4 1.5 -1.4 2.2 2.3 -12.3 ! 1.1 1.5 -1.9
11.6 -2.2 -11.7 35.9 [ -5.1 j
-18.8 -21.9 -10.8 8.7! -24.8 -27.4 12.0 -28.3 -28.2 -33.1 -29.4 -29.2 -46.8 ! -13.3 -16.6 13.8
Rate per 100,000 population at risk'
4,434.6 4,493.0 4.076.3 318.2 4,716.2 4,840.6 3,940.6 321.2 5,199.9 5,395.3 3,967.6 327.1 5,947.1 6,246.0 4,047.3 359.4 6,020.1 6,321.6 4,110.9 360.4 6,048.0 6,376.2 4,038.2 360.6
-6.0 -7.2 3.4 -.9 -9.3 -10.3 -.7 \
-12.6 -13.6 -2.0 -1.2 -1.2 -1.5
-.5 -.9 1.8 I
-1.8 -9.0 -.3 -.1
-26.7 -29.5 .. ~l -11.8
268.0 273.1 281.7 319.6 327.0 336.3
-1.9 -3.1
-11.9 -2.3 -2.8
-20.3
626.21 620.9 613.71 612.41 572.1 509.4
.2 7.0
12.3)
22.9
516.9 549.4 562.8 612.2 632.0 603.3
-5.9 -2.4 -8.1 -3.1 4.8
-14.3
-,---- r------~ 400.4 1,231.1 404.8 424.4 284.4\ 517.7 586.5 95.6 I 924.3 1,067.4 46.8 11,752.7 1,746.2 1,792.3 432.6 1,277.0 390.2 419.3 208.71 586.7 663.7 106.5 i 1,043.7 1,202.8 52.1 1,825.1 1,849.11.675.4 451.0 1,267.8 369.6 402.4 162.9 1 685.6 773.8 129.6 : 1,277.1 1,468.7 69.0 i 1,977.6 2,017.71,724.7 504.9 1,294.2 464.0 508.8 178.8 ! 822.8 926.2 165.9 11,526.8 1,753.5 85.9l2,161.9 2,233.01,710.0 523.2 1,321.2 583.1 634.0 260.6; 791.6 891.9 156.4 ; 1,445.6 1.660.4 85.5! 2,207.4 2,285.21,715.1 497.4 1,251.9 596.0 647.5 280.71 800.0 904.9 158.1 I 1,450.1 1,671.1 97.2 I 2,238.0 2,319.21,740.9
Percent change in rate
-7.4 -3.6 3.7 1.2 36.3 -11.8 -11.6 -10.2 -11.4 -11.3 -=-r
-10.2 I -4.0 -5.6 7.0 .. ~!.9
.9 -.3
-4.1 .7 5.6 4.2 28.1 -14.4 -14.2 -17.8 -10.7 -2.0 -20.3 -20.9 -8.9 -16.7 -16.5 -21.9
-3.5 -:'1..0 -20.4 -19.7 -31.4 3.9 3.8 6.1 5.2 5.5 -2.2 -2.1 -7.21 -1.1 -1.4 -1.1
-1.7) -32.1 -34.5 1.31 -35.3 -35.2 -39.5 -19.5
-18.3 -16.4
5.6 -.3
-36.3
-18.1 -16.2
5.6 -.6
-36.1
-24.5 i -19.7 I
.5 i -12.0 ,
-51.91
-7.7 -8.5 -2.1 -1.4
-21.7
-B.4 -9.6 -2.3 -1.5 -1.5
-24.7 3.0
'These rates are based on the population at risk for each year. The categories are: total (10·69 years of age), adult (18-69 years of age), and juvenile (10-17 years of age) (see Table 58).
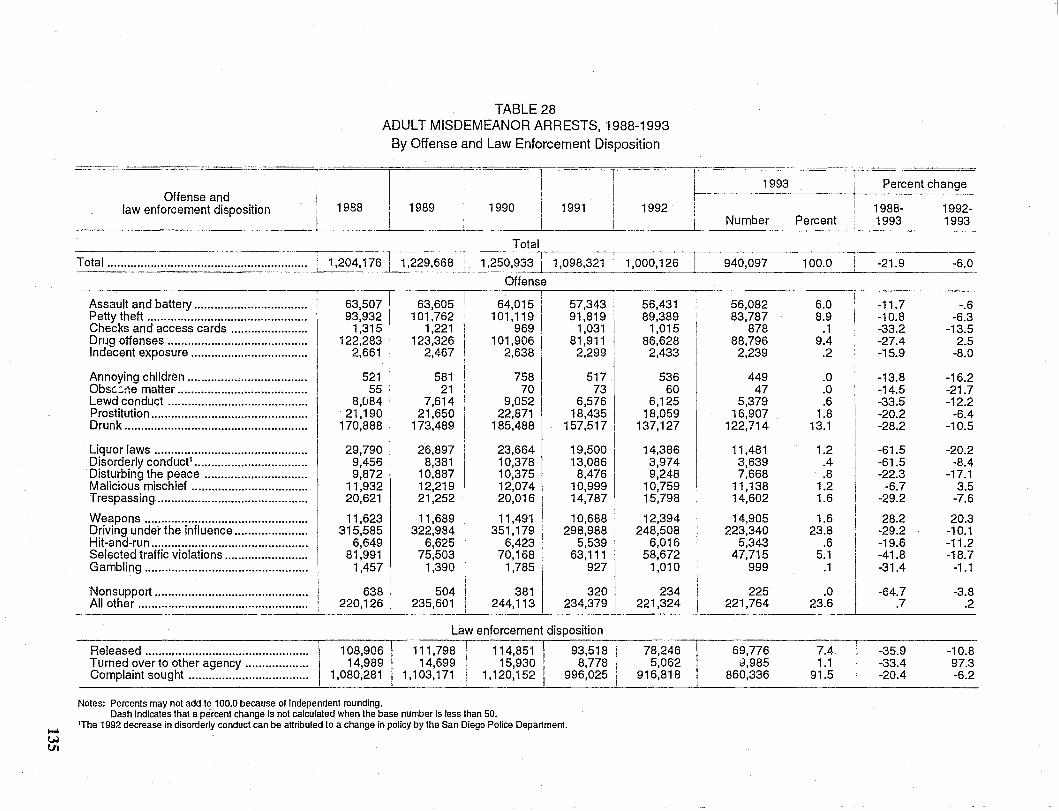
.... t.H f.I1
TABLE 28 ADULT MISDEMEANOR ARRESTS, 1988-1993
By Offense and Law Enforcement Disposition
i I I 1 993 Percent change l ---r- I r Offense and 1 1 I
law enforcement disposition I 1988 1989. 1990 1991 i 1992 i 1988- 1992-i ____ ~_ i, Number Percent 1993 1993
Total ~ -~~~
Total............................................................ 1,204,176 ~229,668 1,250,93~ 1,098,321 1,000,126 940,097 100.0 -21.9 -6.0
Offense
Assault and battery .................................. 63,5071--6;,605 64,015 'II 57,343 56,431 56,082 6.0 -11.7 -.6 Petty theft ................................................ 93,932 101,762 101,119 91,819 89,389 83,787 8.9 -10.8 -6.3 Checksandaccesscards....................... 1,315 1,221 969 1,031 1,015 878 .1 -33.2 -13.5 Drug offenses .......................................... 122,283 123,326 101,906 I 81,911 86,628 88,796 9.4 -27.4 2.5 Indecent exposure ................................... 2,661 2,467 2,638 ; 2,299 . 2,433 2,239 .2 -15.9 -8.0
Annoying children .................................... 521 581 7581 517l 536 449 .0 -13.8 -16.2 Obsc::';:19 matter ....................................... 55 21 70 I 73 I 60 47 .0 -14.5 -21.7 Lewd.co!"duct .......................................... 8,084 7,614 9,052 6,5761 6,125 5,379 .6 -33.5 -12.2 Prostitution ............................................... 21,190 21,650 22,871 18,435 18,059 16,907 1.8 -20.2 -6.4 Drunk....................................................... 170,888 173,489 185,488 157,517 I 137,127 122,714 13.1 -28.2 -10.5
Liquor laws .............................................. 29,790 26,897 23,664 19,500 II' 14,386 11,481 1.2 -61.5 -20.2 Disorderly conductl.................................. 9,456 8,381 10,378 13,086 3,974 3,639 .4 -61.5 -8.4 Disturbing the peace ............................... 9,872 10,887 10,375 8,4761 9,248 7,668 .8 -22.3 -17.1 Malicious.mischief ................................... 11,932 12,219 12,074 10,999 10,759 11,138 1.2 -6.7 3.5 Trespassing ............................................. 20,621 21,252 20,016 14,787 I 15,798 14,602 1.6 -29.2 -7.6
W~C!pons ............ ;.................................... 11,623 11,689 11,491 10,688 I 12,394 14,905 1.6 28.2 20.3 D~lvlng under the Influence ...................... 315,585 322,984 351,179 298,9S8 I 248,508 223,340 23.8 -29.2 -10.1 Hit-and-run ............................................... 6,649 6,625 6,423 5,539 6,016 5,343 .6 -19.6 -11.2 Selected traffic violations......................... 81,991 75,503 70,168 63,111 I 58,672 47,715 5.1 -41.8 -18.7 Gambling ................................................. 1,457 1,390 1,785 927 I 1,010 999 .1 -31.4 -1.1
I Nonsupport .............................................. 638 504 381 320 I' 234 225 .0 -64.7 -3.8 All other ................................................... 220,126 235,601 244,113 234,379 221,324 221,764 23.6 .7 .2
Law enforcement disposition
Released ................................................. 108,906\ 111,798 114,851 93,518 I 78,246 I 69,776 7.4 \ -35.9 -10.8 Turned over to other agency ................... 14,989 14,699 15,930 8,778 5,062 d,985 1.1 -33.4 97.3 Complaint sought .................................... 1,080,281 ! 1,103,171 ',120,152 996,025 I 916,818 860,336 9~L -20.4 -6.2
--------_._--- --_ ... _._ .. _.-
Notes: Percents may not add to 100.0 because of Independent rounding. Dash indicates that a percent change Is not calculated when the base number Is less than 50.
'The 1992 decrease in disorderly conduct can be attributed to a change in policy by the San Diego Police Department.
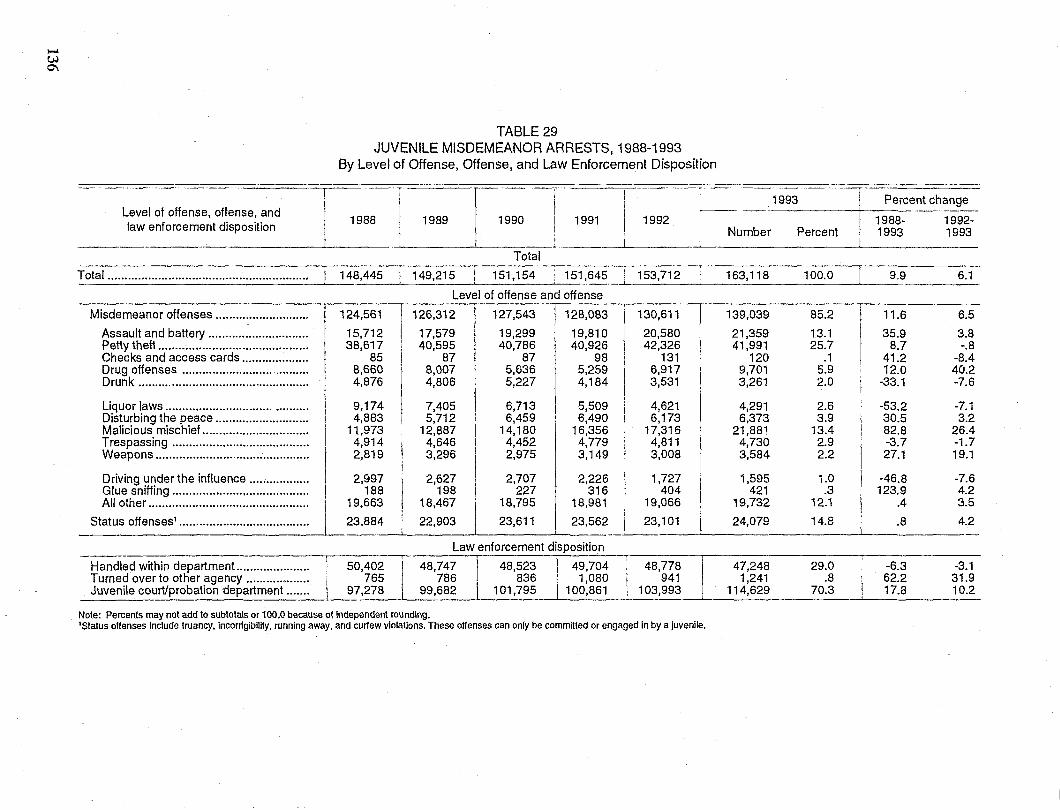
~
W 0\
TABLE 29 JUVENILE MISDEMEANOR ARRESTS, 1988-1993
By Level of Offense, Offense, and Law Enforcement Disposition
1993 Percent change
1988 1989 1990 1991 1992 1988- 1992-Level of offense, offense, and law enforcement disposition
LI I Number Peree~ 1993 1993
--~---------.~--------.--~------~---------------Total
Total ............................................................ [-148,445 149,215 151,154 I 151,645 153,712 163,118 100.0 9.9 6.1
Level of offense and offense
Misdemeanor offenses ............................ r-:-:-
126,312
I 127,543 128,083 130,611 85.2 ! 124,561 139,039 11.6 6.5
Assault and battery .............................. 15,712 17,579 19,299 19,810 20,580 21,359 13.1 35.9 3.8 Petty theft ............................................. I 38,617 40,595 40,786 40,926 42,326 41,991 25.7 8.7 -.8 Checks and access cards .................... 85 87 87 98 131 120 .1 41.2 -8.4 Drug offenses .....................................
I 8,660 8,007 5,636 5,259 6,917 9,701 5.9 12.0 40.2
Drunk ................................................... 4,876 4,806 5,227 4,184 3,531 3,261 2.0 -33.1 -7.6
Liquor laws ..........................................
I 9,174 7,405 6,713 5,509 4,621 4,291 2.6 -53.2 -7.1
Disturbing the peace ............................ 4,883 5,712 6,459 6,490 6,173 6,373 3.9 30.5 3.2 Malicious mischief ................................ I 11,973 12,887 14,180 16,356 17,316 21,881 13.4 82.8 26.4 Trespassing ......................................... 4,914 4,646 4,452 4,779 4,811 4,730 2.9 -3.7 -1.7 Weapons .............................................. 2,819 3,296 2,975 3,149 3,008 3,584 2.2 27.1 19.1
Driving under the influence .................. 2,997 2,627 2,707 2,226 1,727 1,595 1.0 -46.8 -7.6 Glue sniffing ......................................... 188 198 227 316 404 421 .3 123.9 4.2 All other ................................................ 19,663 18,467 18,795 18,981 I 19,066 19,732 12.1 .4 3.5
I I
Status offenses! ....................................... 23.884 I 22,903 23,611 23,562 I 23,101 24,079 14.8 .8 4.2 __ .L--
Law enforcement disposition
Handled within department ...................... 50,402 48,747 48,523 49,704 48,778 47,248 29.0 I -6.3 -3.1 Turned over to other agency ................... 765 786 836 l 1,080 941 1,241 .8 I 62.2 31.9 Juvenile court/probation department ....... 97,278 99,682 101,795 _ 100,861 103,993 114,629 70.3 I 17.8 10.2
_.1 J
Nole: Percents may nat add to subtotals or 100.0 because 01 independent rounding. 'status offenses Include truancy. Incorrigibilny. running away. and cur1ew violations. These offenses can only be committed or engaged In by a juvenile.
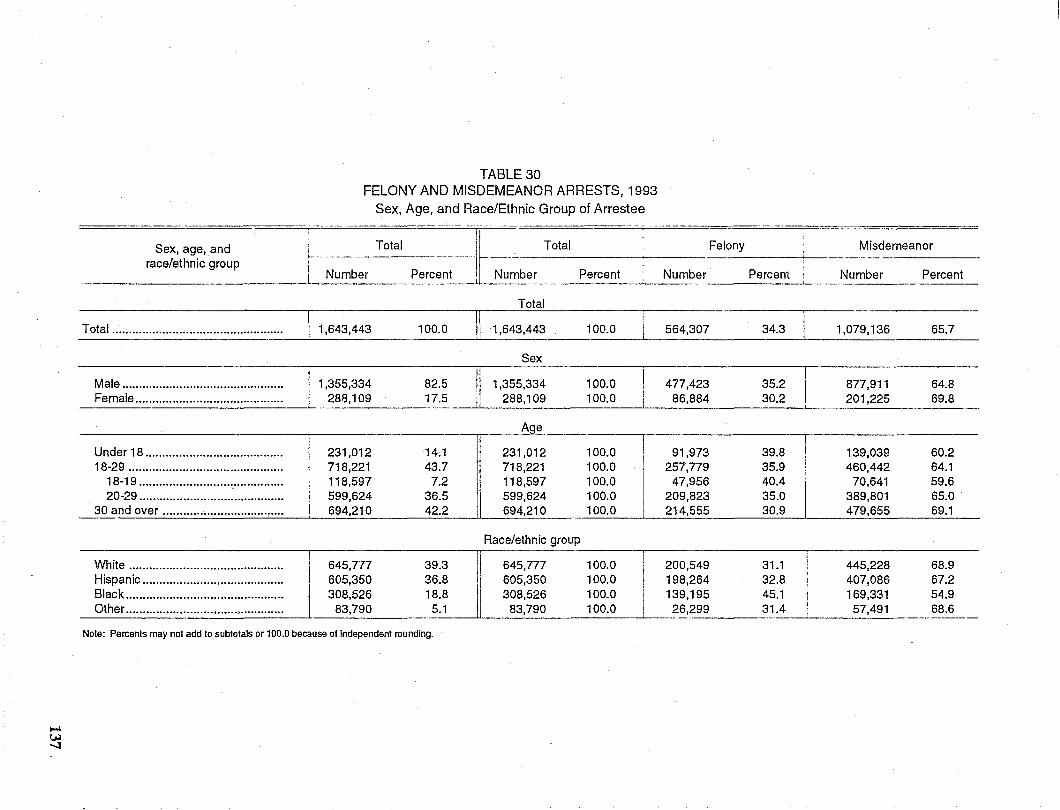
I-< W -..l
TABLE 30 FELONY AND MISDEMEANOR ARRESTS, 1993
Sex, Age, and Race/Ethnic Group of Arrestee
Tc . tal ll~- . -~-- Total r- Felony-l '-"""A. I;A~\J, UoI.Y >--________ _ ______ -+-1 ____ ~ _____ -+
race/ethnic group ---- I I ______________ -'--_Number Percent:1 Number Percent L Number Percent I
Total
Total ................................................. .. L1 ,643~~;3~~ 100.0 II 1,643,443
Male ............................................... . Female ........................................... .
Under 18 ........................................ . 18-29 ............................................ ..
18-19 ......................................... .. 20-29 ......................................... ..
30 and over ................................... .
White ............................................ .. Hispanic ........................................ .. Black ............................................. .. Other ................................ ., ............ .
1,355,334 288,109
231,012 718,221 118,597 599,624 694,210
645,777 605,350 308,526
83,790
82.5 17.5
14.1 43.7
7.2 36.5 42.2
39.3 36.8 18.8
5.1
Note: Percents may not add to subtotals or 100.0 because of Independent rounding.
Sex
1,355,334 288,109
Age I~-·--
I I
II
231,012 718,221 118,597 599,624 694,210
Race/ethnic group
645,777 605,350 308,526
83,790
100.0
100.0 100.0
100.0 100.0 100.0 100.0 100.0
100.0 100.0 100.0 100.0
564,307 34.3
r----~---~ ~-1
: 477,423 35.2 I i 86,884 30.2 I
91,973 39.8 -1 257,779 35.9 I
47,956 40.4 II
209,823 35.0 214,555 30.9 I
200,549 198,264 139,195 26,299
31.1 32.8 45.1 31.4
Misdemeanor
Number
1,079,136
877,911 201,225
139,039 460,442
70,641 389,801 479,655
445,228 407,086 169,331
57,491
Percent
65.7
64.8 69.8
60.2 64.1 59.6 65.0 69.1
68.9 67.2 54.9 68.6
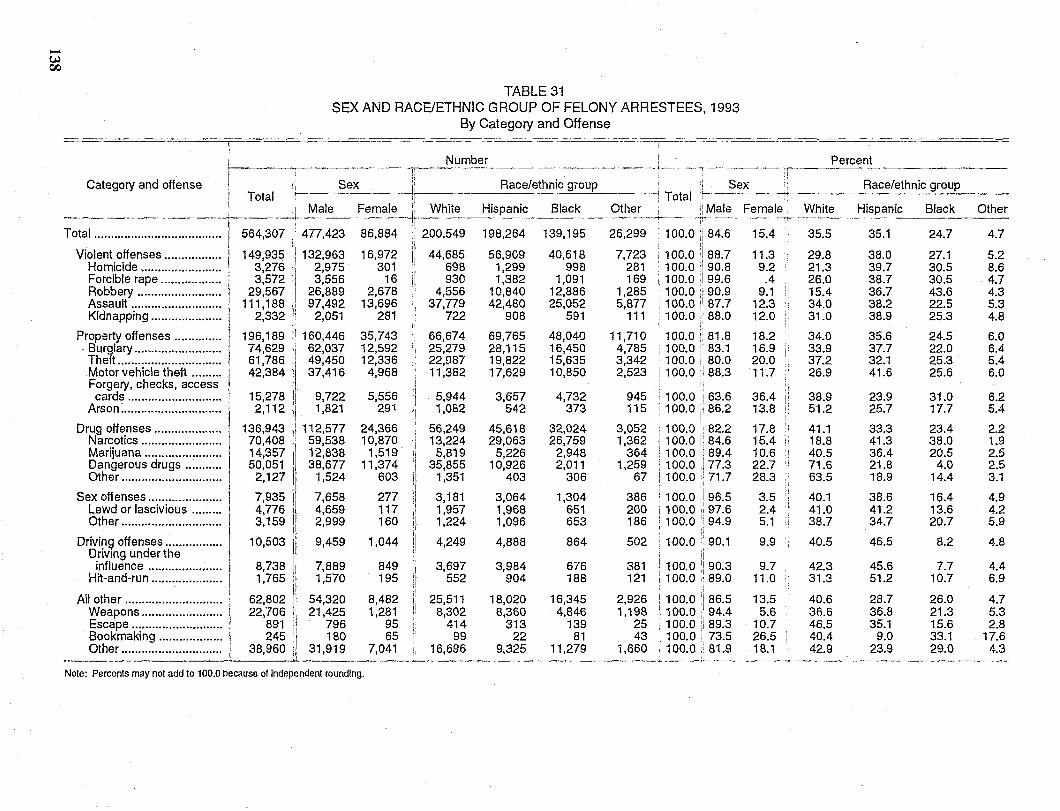
.... w (Xl
Category and offense
TABLE 31 SEX AND RACE/ETHNIC GROUP OF FELONY ARRESTEES, 1993
By Category and Offense
Number
Race/ethnic giOUp Sex
Note: Percents may not add to 100.0 because 01 independent rounding.
l:
~ Percent II -~
---~--~ Race/ethnic group
40.6 36.6 46.5 40.4 42.9
35.1
38.0 39.7 38.7 36.7 38.2 38.9
35.6 37.7 32.1 41.6
23.9 25.7
33.3 41.3 36.4 21.8 18.9
38.6 41.2 34.7
46.5
45.6 51.2
28.7 36.8 35.1
9.0 23.9
24.7
27.1 30.5 30.5 43.6 22.5 25.3
24.5 22.0 25.3 25.6
31.0 17.7
23.4 38.0 20.5
4.0 14.4
16.4 13.6 20.7
8.2
7.7 10.7
26.0 21.3 15.6 33.1 29.0
Other
4.7
5.2 8.6 4.7 4.3 5.3 4.8
6.0 6.4 5.4 6.0
6.2 5.4
2.2 1.9 2.5 2.5 3.1
4.9 4.2 5.9
4.8
4.4 6.9
4.7 5.3 2.8
17.6 4.3
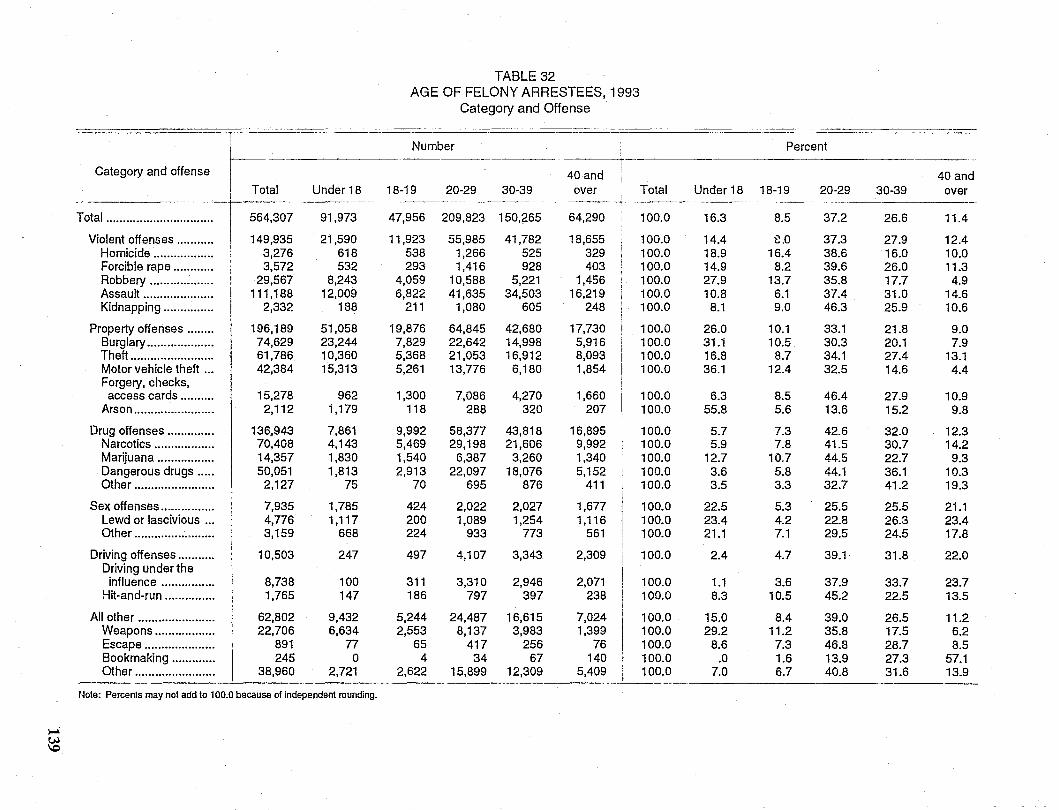
TABLE 32 AGE OF FELONY ARRESTEES, 1993
Category and Offense
ITo"I Number Percent
Category and offense 40 and 40 and Under 18 18-19 20-29 30-39 over Total Under18 18-19 20-29 30-39 over
Total ................................ 564,307 91,973 47,956 209,823 150,265 64,290 100.0 16.3 8.5 37.2 26.6 11.4
Violent offenses ........... 149,935 21,590 11,923 55,985 41,782 18,655 100.0 14.4 i:.0 37.3 27.9 12.4 Homicide .................. 3,276 618 538 1,266 525 329 I 100.0 18.9 16.4 38.6 16.0 10.0 Forcible rape ............ 3,572 532 293 1,416 928 403 100.0 14.9 8.2 39.6 26.0 11.3 Robbery ................... 29,567 8,243 4,059 10,588 5,221 1,456 100.0 27.9 13.7 35.8 17.7 4.9 Assault ..................... 111,188 12,009 6,822 41,635 34,503 16,219 100.0 10.8 6.1 37.4 31.0 14.6 Kidnapping ............... 2,332 188 211 1,080 605 248 100.0 8.1 9.0 46.3 25.9 10.6
Property offenses ........ 196,189 51,058 19,876 64,845 42,680 17,730 I 100.0 26.0 10.1 33.1 21.8 9.0 Burglary .................... 74,629 23,244 7,829 22,642 14,998 5,916 100.0 31.1 10.5 30.3 20.1 7.9 Theft ......................... 61,786 10,360 5,368 21,053 16,912 8,093 100.0 16.8 8.7 34.1 27.4 13.1 Motor vehicle theft ... 42,384 15,313 5,261 13,776 6,180 1,854 100.0 36.1 12.4 32.5 14.6 4.4 Forgery, checks, access cards .......... 15,278 962 1,300 7,086 4,270 1,660 100.0 6.3 8.5 46.4 27.9 10.9
Arson ........................ 2,112 1,179 118 288 320 207 100.0 55.8 5.6 13.6 15.2 9.8
Drug offenses .............. 136,943 7,861 9,992 58,377 43,818 16,895 100.0 5.7 7.3 42.6 32.0 12.3 Narcotics .................. 70,408 4,143 5,469 29,198 21,606 9,992 100.0 5.9 7.8 41.5 30.7 14.2 Marijuana ................. 14,357 1,830 1,540 6,387 3,260 1,340 100.0 12.7 10.7 44.5 22.7 9.3 Dangerous drugs ..... 50,051 1,813 2,913 22,097 18,076 5,152 100.0 3.6 5.8 44.1 36.1 10.3 Other ........................ 2,127 75 70 695 876 411 100.0 3.5 3.3 32.7 41.2 19.3
Sex offenses ................ 7,935 1,785 424 2,022 2,027 1,677 100.0 22.5 5.3 25.5 25.5 21.1 Lewd or lascivious ... 4,776 1,117 200 1,089 1,254 1,116 100.0 23.4 4.2 22.8 26.3 23.4 Other ........................ 3,159 668 224 933 773 561 100.0 21.1 7.1 29.5 24.5 17.8
Driving offenses ........... 10,503 247 497 4,107 3,343 2,309 100.0 2.4 4.7 39.1 31.8 22.0 Driving under the influence ................ 8,738 100 311 3,310 2,946 2,071 100.0 1.1 3.6 37.9 33.7 23.7
Hit-and-run ............... 1,765 147 186 797 397 238 100.0 8.3 10.5 45.2 22.5 13.5
All other ....................... 62,802 9,432 5,244 24,487 16,615 7,024 100.0 15.0 8.4 39.0 26.5 11.2 Weapons .................. 22,706 6,634 2,553 8,137 3,983 1,399 100.0 29.2 11.2 35.8 17.5 6.2 Escape ..................... 891 77 65 417 256 76 100.0 8.6 7.3 46.8 28.7 8.5 Bookmaking ............. 245 0 4 34 67 140 100.0 .0 1.6 13.9 27.3 57.1 Other ........................ 38,960 2,721 2,622 15,899 12,309 5,409 100.0 7.0 6.7 40.8 31.6 13.9
Note: Percents may not add to 100.0 because of independent rounding.
~ t.H \C
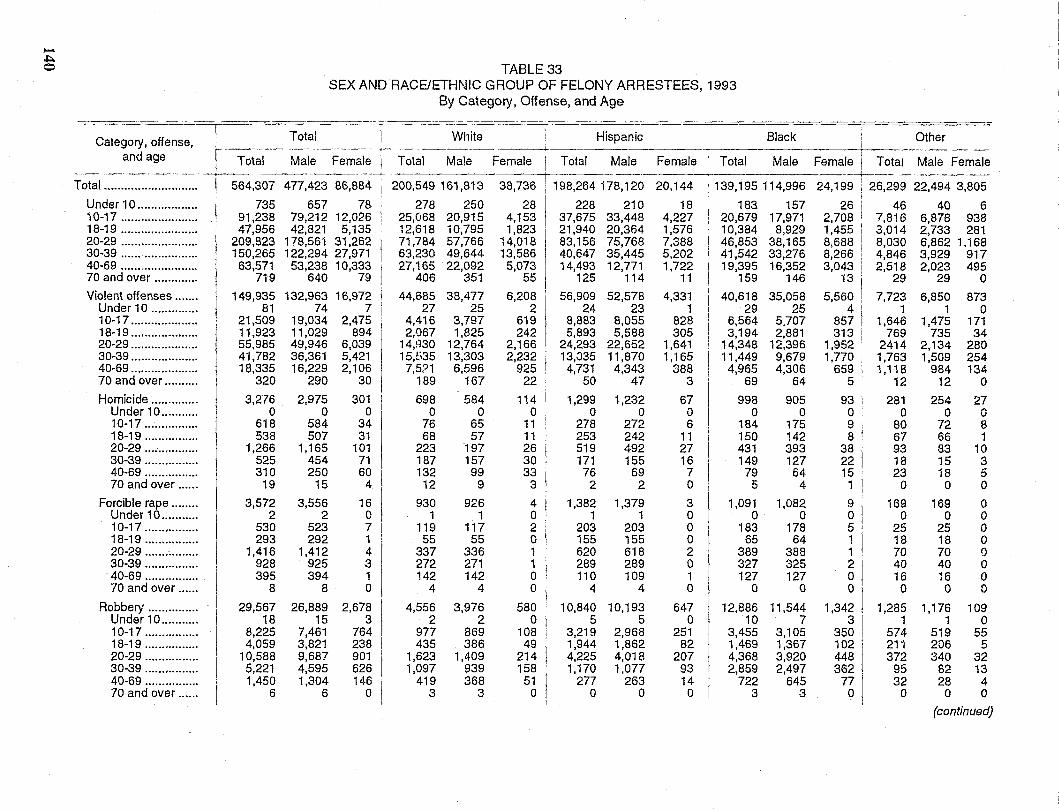
...... .. o TABLE 33
SEX AND RACE/ETHNIC GROUP OF FELONY ARRESTEES, 1993 By Category, Offense, and Age
White Hispanic Black Other Category, offense, r -._- T~tal-- ! and age Total Male Female I Total Male
Total ..... =.=.~~.~.!5 5:6~4,307 477,423 86,8841200.5.49161.813
Female Total Male Female Total Male Female i Total Male Female
Under 10.................. 735 657 78 I 278 250 10-17....................... . 91.238 79.212 12.026 25.068 20.915 18-19 ....................... I 47,956 42,821 5,135 12,618 iO,795 20-29 ....................... 209,823 178,56, 31.262 71.784 57.766 30-39 ...... ................ 150,265 122.294 27,971 63,230 49,644 40-69....................... 63,571 53,238 10,333 27,165 22,092 70 and over ............. 719 640 79 406 351
Violent offenses ....... 149,935 Under 10.............. 81 10-17.................... 21,509 18-19 ......... ........... 11,923 20-29.................... 55,985 30-39.................... 41,782 40-69 .................... 18,335 70 and over .......... 320
Homicide ............. . Under 10 .......... . 10-17 .............. .. 18-19 .............. .. 20-29 ............... . 30-39 ............... . 40-69 .............. .. 70 and over ..... .
Forcible rape ....... . Under 10 ......... .. 10-17 .............. .. 18-19 .............. .. 20-29 .............. .. 30-39 ............... . 40-69 .............. .. 70 and over ..... .
Robbery .............. . Under 10 .......... . 10-17 ............... . 18-19 ............... . 20-29 ............... . 30-39 .............. .. 40-69 ............... . 70 and over .... ..
3,2"76 o
618 538
1,266 525 310
19
3,572 2
530 293
1,416 928 395
8
29,567 18
8,225 4,059
10,588 5,221 1,450
6
132,963 16,972 74 7
19,034 2,475 11,029 894 49,946 6,039 36,361 5,421 16,229 2,106
290 30
2.975 o
584 507
1,165 454 250
15
3,556 2
523 292
1.412 925 394
8
26.889 15
7,461 3,821 9,687 4,595 1,304
6
301 o
34 31
101 71 60
4
16 o 7 1 4 3 1 o
2,678 3
764 238 901 626 146
o
44,685 27
4,416 2,067
14.n30 15,~i35 7,5?1
189
698 o
76 68
223 187 132
12
930 1
119 55
337 272 142
4
4,556 2
977 435
1.623 1.097
419 3
38,477 25
3,797 1.825
12,764 13,303
6,596 167
584 o
65 57
197 157 99
9
926 1
117 55
336 271 142
4
3,976 2
869 386
1,409 939 368
3
38,736
28 4,153 1,823
14,018 13,586
5,073 55
6,208 2
619 242
2,166 2,232
925 22
114 o
11 11 26 30 33
3
4 o 2 o 1 1 o o
580 o
108 49
214 158
51 o
198,264 178,120
228 210 37,675 33,448 21,940 20,364 83,156 75,768 40,647 35,445 14,493 12,771
125 114
56,909 24
8,883 5,893
24,293 13.a35
4.731 50
1,299 o
278 253 519 171
76 2
1,382 1
203 155 620 289 110
4
10,840 5
3,219 1,944 4,225 1.170
277 o
52,578 23
8,055 5,588
22,652 11,870
4,343 47
1,232 o
272 242 492 155
69 2
1,379 1
203 155 618 289 109
4
10.193 5
2,968 1,862 4,018 1,077
263 o
20,144 139,195114,996
18 4,227 1,576 7,388 5,202 1,722
11
4,331 1
828 305
1,641 1,165
388 3
67 o 6
11 27 16
7 o 3 o o o 2 o 1 o
647 o
251 82
207 93 14 o
183 20,679 10,384 46,853 41,542 19,395
159
40,618 29
6,564 3,194
14,348 11,449
4,965 69
998 o
184 150 431 149
79 5
1,091 o
183 65
389 327 127
o 12,886
10 3,455 1,469 4,368 2,859
722 3
157 17,971
8,929 38,165 33,276 16,352
146
35,058 25
5.707 2,881
12,396 9,679 4,306
64
905 o
175 142 393 127
64 4
1,082 o
178 64
388 325 127
o 11,544
7 3,105 1,367 3,920 2,497
645 3
~--~------~
24,199 26,299 22,494 3,805
26 46 40 6 2,708 7,816 6,878 938 1,455 3,014 2,733 281 8,688 8,030 6,862 1,168 8,266 4,846 3,929 917 3,043 2,518 2,023 495
13 29 29 0
5,560 7,723 6,850 873 4 1 1 0
857 1,646 1,475 171 313 769 735 34
1,952 2414 2,134 280 1,770 1,763 1,509 254
659 1,118 984 134 5 12 12 0
93 o 9 8
38 22 15 ,
281 o
80 67 93 18 23 o
254 o
72 66 83 15 18 o
9 169 169 o 0 0 5 25 25 1 18 18 1 70 70 2 40 40 o 16 16 o 0 0
1,342 1,285 1,176 311
350 574 519 102 211 206 448 372 340 362 95 62
77 32 28 o 0 0
27 o 8 1
10 3 5 o o o o o o o o o
109 o
55 5
32 13
4 o
(continued)
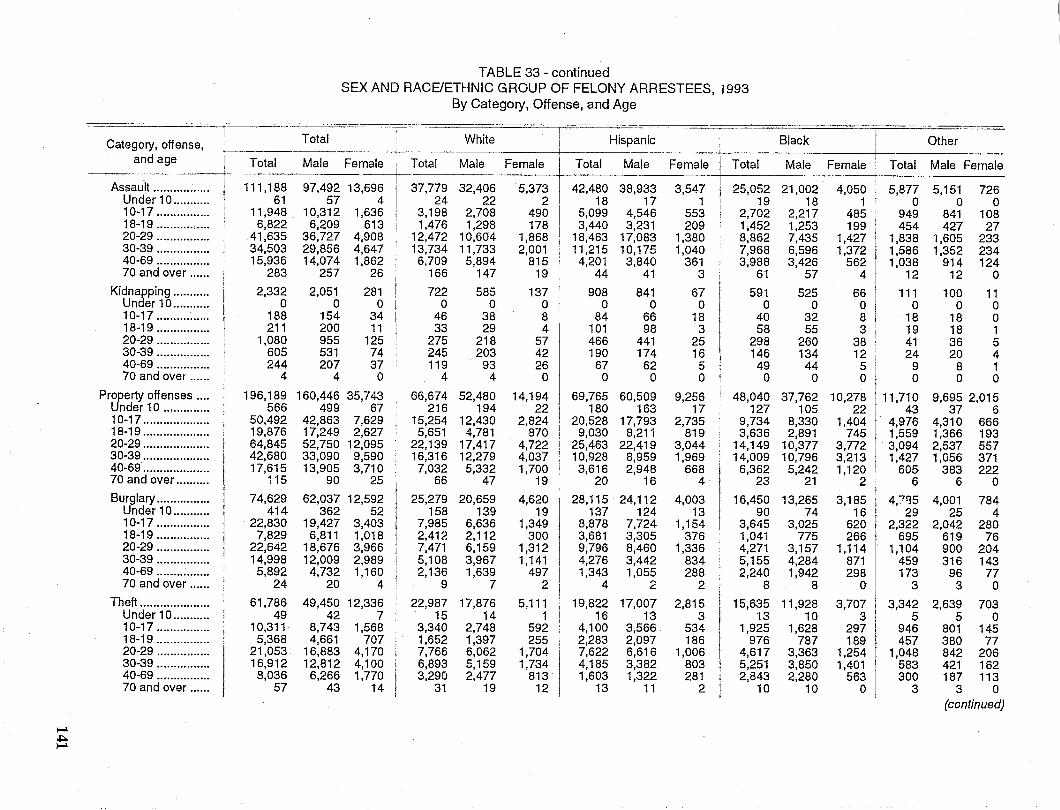
TABLE 33 - continued SEX AND RACE/ETHNIC GROUP OF FELONY ARRESTEES, J 993
By Category, Offense, and Age
I~---- ~ Total White
, Hispanic Black Other Category, offense, I
I I
and age I Total Male Female Total Male Female I Total Male Female Total Male Female Total Male Female I
5,373 I 42,480 38,933 Assault ................. I 111,188 97,492 13,696 37,779 32,406 3,547 25,052 21,002 4,050 5,877 5,151 726 Under 10 ...........
i
61 57 4 24 22 2 18 17 1 19 18 1 0 0 0 10-17 ................ 11,948 10,312 1,636 3,198 2,708 490 I 5,099 4,546 553 2,702 2,217 485 949 841 108 18-19 .......... 00 •••• 6,822 6,209 613 1,476 1,298 178 i 3,440 3,231 209 1,452 1,253 199 454 427 27 20-29 ................ I 41,635 36,727 4,908 12,472 10,604 1,868 i 18,463 17,083 1,380 8,862 7,435 1,427 1,838 1,605 233 30-39 ................ 34,503 29,856 4,647 13,73411,733 2,001 I 11,215 10,175 1,040 7,968 6,596 1,372 1,586 1,352 234 40-69 ................ 15,936 14,074 1,862 6,709 5,894 815 4,201 3,840 361 3,988 3,426 562 1,038 914 124 70 and over ...... 283 257 26 166 147 19 I 44 41 3 61 57 4 12 12 0
Kidnapping ........... 2,332 2,051 281 722 585 137 I 908 841 67 591 525 66 111 100 11 Under 10 ........... 0 0 0 0 0 o I 0 0 0 0 0 0 0 0 0 10-17 ................ 188 154 34 46 38 8 I 84 66 18 40 32 8 18 18 0 18-19 ................ 211 200 11 33 29 4 101 98 3 58 55 3 19 18 1 20-29 ................ 1,080 955 125 275 218 57 466 441 25 298 260 38 41 36 5 30-39 ................ 605 531 74 245 203 42 190 174 16 146 134 12 24 20 4 40-69 ................ 244 207 37 119 93 26 67 62 5 49 44 5 9 8 1 70 and over ...... 4 4 0 4 4 0 0 0 0 0 0 0 0 0 0
PrLfrerty offenses .... 196,189 160,446 35,743 66,674 52,480 14,194 69,765 60,509 9,256 48,040 37,762 10,278 11,710 9,695 2,015 nder 10 .............. 566 499 67 216 194 22 180 163 17 127 105 22 43 37 6
10-17 .................... 50,492 42,863 7,629 15,254 12,430 2,824 20,528 17,793 2,735 9,734 8,330 1,404 4,976 4,310 666 18-19 .................... 19,876 17,249 2,627 5,651 4,781 870 9,030 8,211 819 3,636 2,891 745 1,559 1,366 193 20-29 .................... 64,845 52,750 12,095 22,139 17,417 4,722 25,463 22,419 3,044 14,149 10,377 3,772 3,094 2,537 557 30-39 .................... 42,680 33,090 9,590 16,316 12,279 4,037 10,928 8,959 1,969 14,009 10,796 3,213 1,427 1,056 371 40-69 .................... 17,615 13,905 3,710 7,032 5,332 1,700 3,616 2,948 668 6,362 5,242 1,120 605 383 222 70 and over .......... 115 90 25 66 47 19 20 16 4 23 21 2 6 6 0 Burglary ................ 74,629 62,037 12,592 25,279 20,659 4,620 28,115 24,112 4,003 16,450 13,265 3,185 4,'7% 4,001 784
Under 10 ........... 414 362 52 158 139 19 137 124 13 90 74 16 29 25 4 10-17 ................ 22,830 19,427 3,403 7,985 6,636 1,349 8,878 7,724 1,154 3,645 3,025 620 2,322 2,042 280 18-19 ................ 7,829 6,811 1,018 2,412 2,112 300 3,681 3,305 376 1,041 775 266 695 619 76 20-29 ................ 22,642 18,676 3,966 7,471 6,159 1,312 9,796 8,460 1,336 4,271 3,157 1,114 1,104 900 204 30-39 ................ 14,998 12,009 2,989 5,108 3,967 1,141 4,276 3,442 834 5,155 4,284 871 459 316 143 40-69 ................ 5,892 4,732 1,160 2,136 1,639 497 1,343 1,055 288 2,240 1,942 298 173 96 77 70 and over ...... 24 20 4 9 7 2 4 2 2 8 8 0 3 3 0
Theft ..................... 61,786 49,450 12,336 22,987 17,876 5,111 I 19,822 17,007 2,815 15,635 11,928 3,707 3,342 2,639 703 Under 10 ........... 49 42 7 15 14 1 16 13 3 13 10 3 5 5 0 10-17 ................ 10,311 8,743 1,568 3,340 2,748 592 4,100 3,566 534 1,925 1,628 297 946 801 145 18-19 ................ 5,368 4,661 707 1,652 1,397 255 2,283 2,097 186 976 787 189 457 380 77 20-29 ................ 21,053 16,883 4,170 7,766 6,062 1,704 7,622 6,616 1,006 4,617 3,363 1,254 1,048 842 206 30-39 ................ 16,912 12,812 4,100 6,893 5,159 1,734 4,185 3,382 803 5,251 3,850 1,401 583 421 162 40-69 ................ 8,036 6,266 1,770 3,290 2,477 813 1,603 1,322 281 2,843 2,280 563 300 187 113 70 and over ...... 57 43 14 31 19 12 13 11 2 10 10 0 3 3 0
(continued)
~ A ~
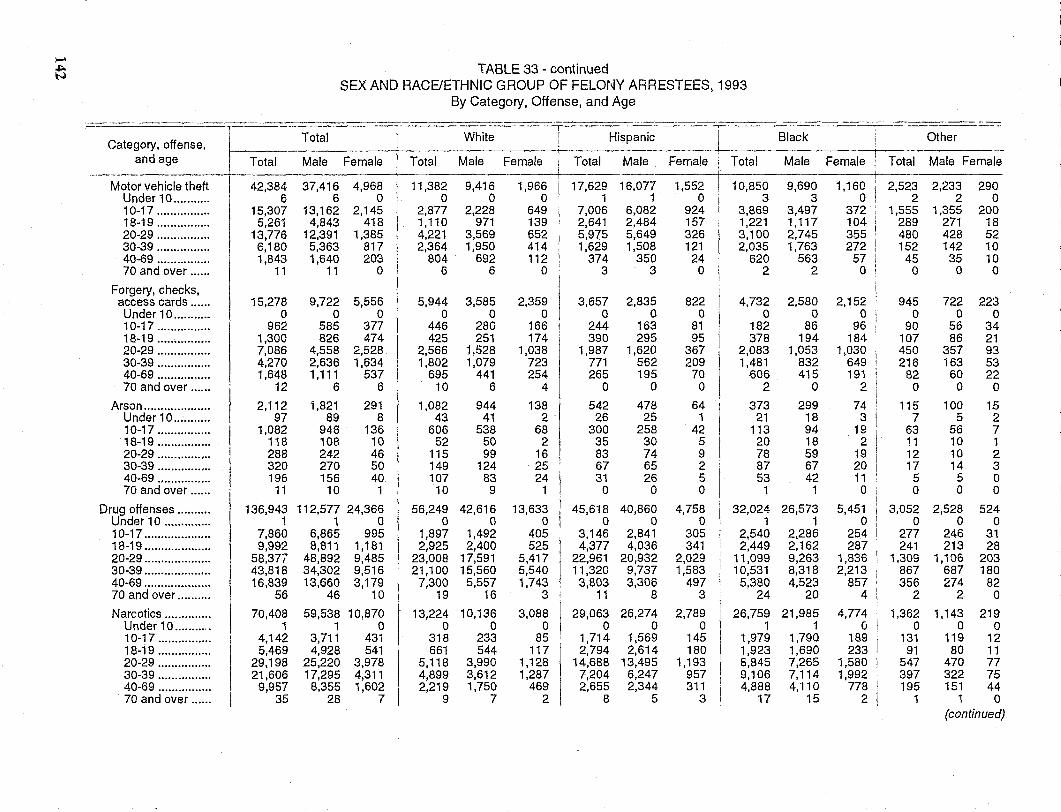
)ool ,i;:o TABLE 33 - continued N
SEX AND RACE/ETHNIC GROUP OF FELONY ARRESTEES, 1993 By Category, Offense, and Age
-------.-Total White I Hispanic Black Other
Category, offense, 1
and age Total Male Female Total Male Female I Total Male Female Total Male Female Total Male Female I
Motor vehicle theft 42,384 37,416 4,968 11,382 9,416 1,966 I 17,629 16,077 1,552 10,850 9,690 1,160 2,523 2,233 290 Under 10 ........... 6 6 0 0 0 o . 1 1 0 3 3 0 2 2 0 10-17 ................ 15,307 13,162 2,145 2,877 2,228 649 7,006 6,082 924 3,869 3,497 372 1,555 1,355 200 18-19 ................ 5,261 4,843 418 1,110 971 139 2,641 2,484 157 1,221 1.117 104 289 271 18 20-29 ................ 13,776 12.391 1,385 4,221 3,569 652 5.975 5,649 326 3,100 2,745 355 480 428 52 30-39 ................ 6,180 5,363 817 2,364 1,950 414 1,629 1,508 121 2,035 1,763 272 i 152 142 10 40-69 ................ 1,843 1,640 203 804 692 112 374 350 24 620 563 57 45 35 10 70 and over ...... 11 11 0 6 6 0 3 3 0 2 2 0 0 0 0
Forgery, checks, access cards ...... 15,278 9,722 5,556 5,944 3,585 2,359 3,657 2,835 822 4.732 2,580 2,152 945 722 223 Under 10 ........... 0 0 0 0 0 0 0 0 0 0 0 0 0 0 0 10-17 ................ 962 585 377 446 280 166 244 163 81 182 86 96 90 56 34 18-19 ................ 1,300 826 474 425 251 174 390 295 95 378 194 184 107 86 21 20-29 ................ 7,086 4,558 2,528 2,566 1,528 1,038 1.987 1,620 367 2,083 1,053 1,030 450 357 93 30-39 ................ 4,270 2,636 1,634 1,802 1,079 723 771 562 209 1,481 832 649 216 163 53 40-69 ................ 1,648 1.111 537 695 441 254 265 195 70 606 415 191 82 60 22 70 and over ...... 12 6 6 10 6 4 0 0 0 2 0 2 0 0 0
Arson .................... 2,112 ',821 291 1,082 944 138 542 478 64 373 299 74 115 100 15 Under 10 ........... 97 89 8 43 41 2 26 25 1 21 18 3 7 5 2 10-17 ................ 1.082 946 136 606 538 68 300 258 42 113 94 19 63 56 7 18-19 ................ 118 108 10 52 50 2 35 30 5 20 18 2 11 10 1 20-29 ................ 288 242 46 115 99 16 83 74 9 78 59 19 12 10 2 30-39 ................ 320 270 50 149 124 25 67 65 2 87 67 20 17 14 3 40-69 ................ 196 156 40 107 83 24 31 26 5 53 42 11 5 5 0 70 and over ...... 11 10 1 10 9 1 0 0 0 1 1 0 0 0 0
Drug offenses .......... 136,943 112,577 24,366 56,249 42.616 13,633 45,618 40,860 4,758 32,024 26,573 5,451 3,052 2,528 524 Under 10 .............. 1 1 0 0 0 0 0 0 0 1 1 0 0 0 0 10-17 .................... 7,860 6,865 995 1,897 1,492 405 ' 3,146 2,841 305 2,540 2,286 254 277 246 31 18-19 .................... 9,992 8,811 1,181 2,925 2,400 525 4,377 4,036 341 2,449 2,162 287 241 213 28 20-29 .................... 58,377 48.892 9,485 I 23,008 17,591 5,417 22,961 20,932 2,029 11,099 9.263 1,836 1,309 1,106 203 30-39 .................... 43,818 34,302 9,516 21,100 15,560 5,540 11.320 9.737 1,583 10,531 8,318 2,213 867 687 180 40-69 .................... 16,839 13,660 3,179 7,300 5,557 1,743 3,803 3,306 497 5,380 4,523 857 356 274 82 70 and over .......... 56 46 10 19 16 3 11 8 3 24 20 4 2 2 0
Narcotics .............. 70,408 59,538 10,870 13,224 10,136 3,088 29,063 26,274 2,789 26,759 21,985 4,774 1,362 1,143 219 Under 10 ........... 1 1 0 0 0 0 0 0 0 1 1 0 0 0 0 10-17 ................ 4,142 3,711 431 318 233 85 1,714 1,569 145 1,979 1,790 189 131 119 12 18-19 ................ 5,469 4,928 541 661 544 117 2,794 2,614 180 1,923 ',690 233 91 80 11 20-29 ................ 29,198 25,220 3,978 5,118 3,990 1,128 14,688 13,495 1.193 8,845 7,265 1,580 547 470 77 30-39 ................ 21,606 17,295 4,311 4,899 3,612 1,287 7,204 6,247 957 9,106 7,114 1,992 397 322 75 40-69 ................ 9,957 8,355 1,602 2,219 1,750 469 2,655 2,344 311 4,888 4,110 778 195 151 44 70 and over ...... 35 28 7 9 7 2 8 5 3 17 15 2 1 1 0
(continued)
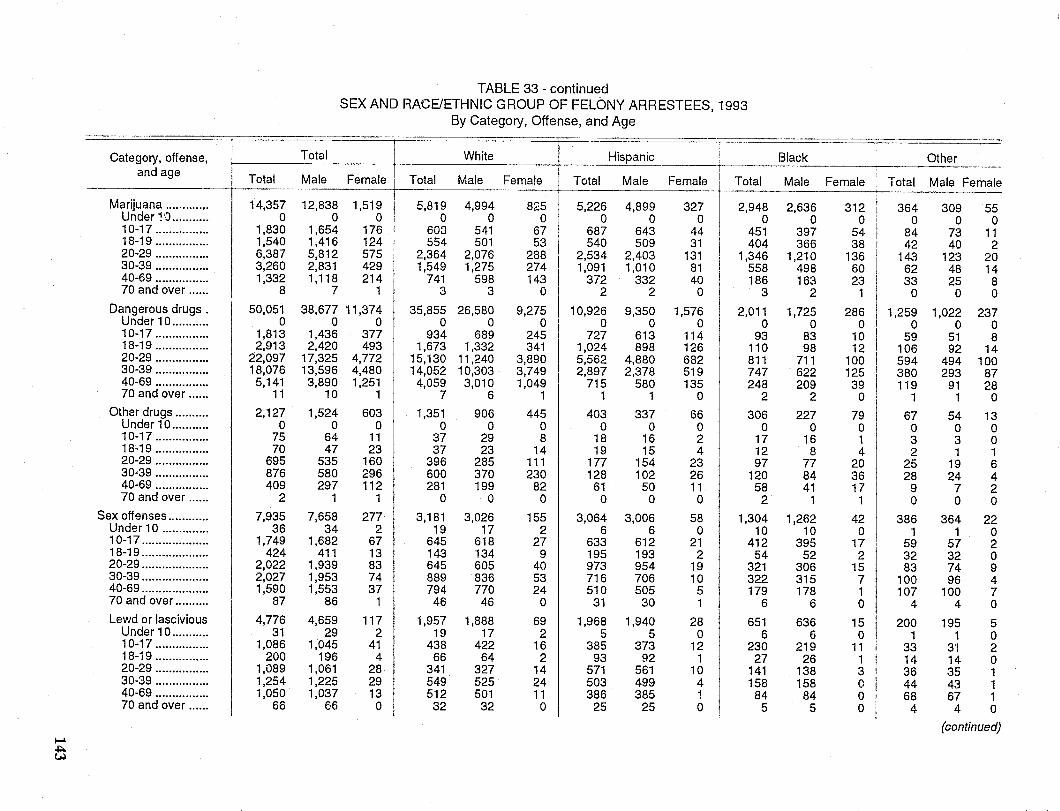
""'" ~ w
-
Category, offense, and age
Marijuana ............. Under ~O ........... 10-17 ................ 18-19 ................ 20-29 ................ 30-39 ................ 40-69 ................ 70 and over ......
I Dangerous drugs . Under 10 ........... 10-17 ................ 18-19 ................ 20-29 ................ 30-39 ................ 40-69 ................ 70 and over ......
Other drugs .......... Under 10 ........... 10-17 ................ 18-19 ................ 20-29 ................ 30-39 ................ 40-69 ................ 70 and over ......
Sex offenses ............ Under 10 .............. 10-17 .................... 18-19 .................... 20-29 .................... 30-39 .................... 40-69 .................... 70 and over ..........
Lewd or lascivious Under 10 ........... 10-17 ................ 18-19 ................ 20-29 ................ 30-39 ................ 40-69 ................ 70 and over ......
Total
14,357 0
1,830 1,540 6,387 3,260 1,332
8
50,051 0
1,813 2,913
22,097 18,076
5,141 11
2,127 0
75 70
695 876 409
2
7,935 36
1,749 424
2,022 2,027 1,590
87
4,776 31
1,086 200
1,089 1,254 1,050
66
TABLE 33 - continued SEX AND RACE/ETHNIC GROUP OF FELONY ARRESTEES, 1993
By Category, Offense, and Age -
! ----r-Total
Female I White Hispanic I
I
! Male Total Male Female Tota!
Male ~"-j Tota,--12,838 1,519 5,819 4,994 825 5,226 4,899 327 2,948
0 0 0 0 0 0 o 0 0 1,654 176 60a 541 67 687 643 44 I 451 1,416 124 554 501 53 540 509 31 I 404 I 5,812 575 2,364 2,076 288 2,534 2,403 131 i 1,346 2,831 429 1,549 1,275 274 1,091 1,010 81 , 558 1,118 214 741 598 143 372 332 40 I 186
7 1 3 3 0 2 2 0 : 3 I I 38,677 11,374 I 35,855 26,580 9,275 10,926 9,350 1,576
I 2,011
o 0 0 0 0 0 0 0 0 1,436 377 934 689 245 727 613 114 93 2,420 493 1,673 1,332 341 1,024 898 126
I
110 17,325 4,772 15,130 11,240 3,890 5,562 4,880 682 811 13,596 4,480 14,052 10,303 3,749 2,897 2,378 519 747 3,890 1,251 4,059 3,010 1,049 I 715 580 135 248
10 1 7 6 1 1 1 0 2 1,524 603 1,351 906 445 403 337 66 306
0 0 0 0 0 0 0 0 0 64 11 37 29 8 18 16 2 17 47 23 37 23 14 19 15 4 12
535 160 396 285 111 177 154 23 97 580 296 600 370 230 128 102 26 120 297 112 281 199 82 61 50 11 58
1 1 0 0 0 0 0 0 2
7,658 277 3,181 3,026 155 3,064 3,006 58 1,304 34 2 19 17 2 6 6 0 10
1,682 67 645 618 27 633 612 21 412 411 13 143 134 9 195 193 2 54
1,939 83 645 605 40 973 954 19 321 1,953 74 889 836 53 716 706 10 322 1,553 37 794 770 24 510 505 5 179
86 1 46 46 0 31 30 1 6
4,659 117 1,957 1,888 69 1,968 1,940 28 I 651 29 2 19 17 2 5 5 0 6
1,045 41 438 422 16 385 373 12 230 196 4 66 64 2 93 92 1 27
1,061 28 341 327 14 571 561 10 141 1,225 29 549 525 24 503 499 4 158 1,037 13 512 501 11 386 385 1 84
66 0 32 32 0 25 25 0 5
Black Other
Male Female Total Male Female
2,636 312 364 309 55 0 0 0 0 0
397 54 84 73 11 366 38 42 40 2
1,210 136 143 123 20 498 60 62 48 14 163 23 33 25 8
2 1 0 0 0
1,725 286 1,259 1,022 237 0 0 0 0 0
83 10 59 51 8 98 12 106 92 14
711 100 594 494 100 622 125 380 293 87 209 39 119 91 28
2 0 1 1 0
227 79 67 54 13 0 0 0 0 0
16 1 3 3 0 8 4 2 1 1
77 20 25 19 6 84 36 28 24 4 41 17 9 7 2
1 1 0 0 0
1,262 42 386 364 22 10 0 1 1 0
395 17 59 57 2 52 2 32 32 0
306 15 83 74 9 315 7 100 96 4 178 1 107 100 7
6 0 4 4 0
636 15 200 195 5 6 0 1 1 0
219 11 33 31 2 26 1 14 14 0
138 3 36 35 1 158 0 44 43 1 84 0 68 67 1
5 0 4 4 0
(continued)
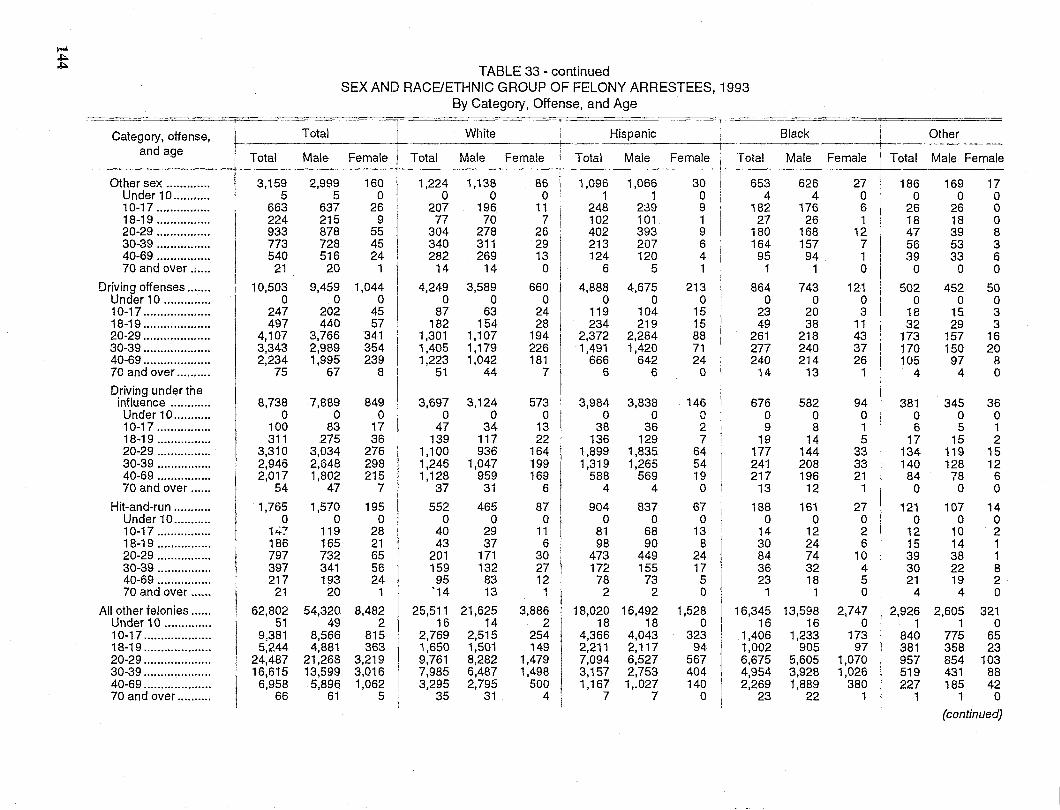
.... ... ... TABLE 33 - continued SEX AND RACE/ETHNIC GROUP OF FELONY ARRESTEES, 1993
By Category, Offense, and Age
Category, offense, Total White Hispanic Black Other
and age Total Male Female Total Male Female Total Male Female Total Male Female Total Male Female I
Other sex ............. r 3,15~ 2,999 160 1,224 1,138 86 1,096 ',066 30 653 626 27 186 169 17 Under 10 ........... 5 0 0 0 0 1 1 0 4 4 0 0 0 0 10-17 ................ 663 637 26 207 196 11 248 239 9 182 176 6 26 26 0 18-19 ................ 224 215 9 77 70 7 102 101 1 27 26 1 18 18 0 20-29 ................ 933 878 55 304 278 26 402 393 9 180 168 12 47 39 8 30-39 ................ 773 728 45 340 311 29 213 207 6 164 157 7 56 53 3 40-69 ................ 540 516 24 282 269 13 124 120 4 95 94 1 39 33 6 70 and over ...... 21 20 1 14 14 0 6 5 1 1 1 0 0 0 0
Driving offenses ....... 10,503 9,459 1,044 4,249 3,589 660 4,888 4,675 213 864 743 '21 502 452 50 Under 10 .............. 0 0 0 0 0 0 0 0 0 0 0 0 0 0 0 10-17 .................... 247 202 45 87 63 24 119 104 15 23 20 3 18 15 3 18-19 .................... 497 440 57 182 154 28 234 219 15 49 38 11 32 29 3 20-29 .................... 4,107 3,766 341 1,301 1,'07 194 2,372 2,284 88 261 218 43 173 157 16 30-39 .................... 3,343 2,989 354 1,405 ',179 226 1,491 1,420 71 277 240 37 170 150 20 40-69 .................... 2,234 1,995 239 1,223 1,042 181 666 642 24 240 214 26 105 97 8 70 and over .......... 75 67 8 51 44 7 6 6 0 '4 13 1 4 4 0
Driving under the influence ............ 8,738 7,889 849 3,697 3,124 573 3,984 3,838 146 676 582 94 381 345 36 Under 10 ........... 0 0 0 0 0 0 0 0 (} 0 0 0 0 0 0 10-17 ................ 100 83 17 47 34 13 38 36 2 9 8 1 6 5 1 18-19 ................ 311 275 36 139 117 22 136 129 7 19 14 5 17 15 2 20-29 ................ 3,310 3,034 276 1,100 936 164 1,899 1,835 64 177 144 33 134 119 15 30-39 ................ 2,946 2,648 298 1,246 1,047 199 1,319 1,265 54 241 208 33 140 128 12 40-69 ................ 2,017 1,802 215 1,128 959 169 588 569 19 217 196 21 84 78 6 70 and over ...... 54 47 7 37 31 6 4 4 0 13 12 1 0 0 0
Hit-and-run ........... 1,765 1,570 195 552 465 87 904 837 67 188 161 27 121 107 14 Under 10 ........... 0 0 0 0 0 0 0 0 0 0 0 0 0 0 0 10-17 ................ 1 '7 Lt. 119 28 40 29 11 81 68 13 14 12 2 12 10 2 18-19 ................ 186 165 21 43 37 6 98 90 8 30 24 6 15 14 1 20-29 ................ 797 732 65 201 171 30 473 449 24 84 74 10 39 38 1 30-39 ................ 397 341 56 159 132 27 172 155 17 36 32 4 30 22 8 40-69 ................ 217 193 24 95 83 12 78 73 5 23 18 5 21 19 2 70 and over ...... 21 20 1 '14 13 -t 2 2 0 1 1 0 4 4 0 ,
All other felonies ...... 62,802 54,320 8,482 25,511 21,625 3,886 18,020 16,492 1,528 16,345 13,598 2,747 2,926 2,605 321 Under 10 .............. 51 49 2 16 14 2 18 18 0 16 16 0 1 1 0 10-17 .................... 9.381 8,566 815 2,769 2,515 254 4,366 4,043 323 1,406 1,233 173 840 775 65 18-19 .................... 5;244 4,881 363 1,650 1,501 149 2,211 2,117 94 1,002 905 97 381 358 23 20-29 .................... 24,487 21,268 3,219 9,761 8,282 1,479 7,094 6,527 567 6,675 5,605 1,070 957 854 103 30-39 .................... 16,615 13,599 3,016 7,985 6,487 1,498 3,157 2,753 404 4,954 3,928 1,026 519 431 88 40-69 .................... 6,958 5,896 1,062 3,295 2,795 500 1,167 1,.027 140 2,269 1,889 380 227 185 42 70 and over .......... 66 61 5 35 31 4 7 7 0 23 22 1 1 1 0
(continued)
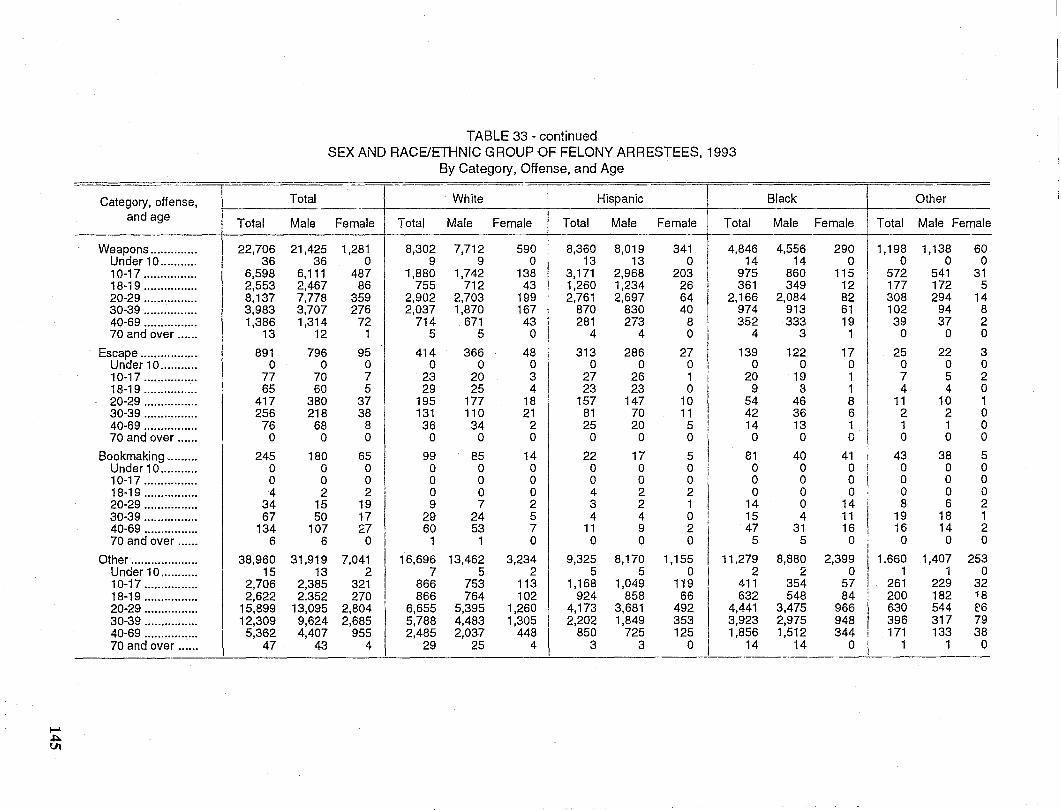
l-" ~ til
Category, offense, and age
Weapons .............. Under 10 ........... 10-17 ................ 18-19 ................ 20-29 ................ 30-39 ................ 40-69 .......... 0 •••••
70 and over ......
Escape ................. Under 10 ........... 10-17 ................ 18-19 ................ 20-29 ................ 30-39 ................ 40-69 ................ 70 and over ......
Bookmaking ......... Under 10 ........... 10-17 ................ 18-19 ................ 20-29 ................ 30-39 ................ 40-69 ................ 70 and over ......
Other .................... Under 10 ........... 10-17 ................ 18-19 ................ 20-29 ................ 30-39 ................ 40-69 ................ 70 and over ......
Total
22,706 36
6,598 2,553 8,137 3,983 1,386
13
891 0
77 65
417 256
76 0
245 0 0 4
34 67
134 6
38,960 15
2,706 2,622
15,899 12,309
5,362 47
Total
Male
21,425 36
6,111 2,467 7,778 3,707 1,314
12
796 0
70 60
380 218
68 0
180 0 0 2
15 50
107 6
31,919 13
2,385 2.352
13,095 9,624 4,407
43
TABLE 33 - continued SEX AND RACE/ETHNIC GROUP OF FELONY ARRESTEES, 1993
By Category, Offense, and Age
White Hispanic
Female TotClI Male Female Total Male Female Total
1,281 8,302 7,712 590 8,360 8,019 341 4,846 0 9 9 0 13 13 0 14
487 1,880 1,742 138 3,171 2,968 203 975 86 755 712 43 1,260 1,234 26 361
359 2,902 2,703 199 2,761 2,697 64
I 2,166
276 2,037 1,870 167 870 830 40 974 72 714 671 43 281 273 8 352
1 5 5 0 4 4 0 4
95 414 366 48 313 286 27 139 0 0 0 0 0 0 0 0 7 23 20 3 27 26 1 20 5 29 25 4 23 23 0 9
37 195 177 18 157 147 10 54 38 131 110 21 81 70 11 42
8 36 34 2 25 20 5 14 0 0 0 0 0 0 0
I 0
65 99 85 14 22 17 5 81 0 0 0 0 0 0 0 0 0 0 0 0 0 0 0 0 2 0 0 0 4 2 2 0
19 9 7 2 3 2 1 14 17 29 24 5 4 4 0 15 27 60 53 7 11 9 2 47
0 1 1 0 0 0 0 5
7,041 16,696 13,462 3,234 9,325 8,170 1,155 11,279 2 7 5 2 5 5 0 2
321 866 753 113 1,168 1,049 119 411 270 866 764 102 924 858 66 632
2,804 6,655 5,395 1,260 4,173 3,681 492 4,44'1 2,685 5,788 4,483 1,305 2,202 1,849 353 3,923
955 2,485 2,037 448 850 725 125 1,856 4 29 25 4 3 3 0 I 14
- _ .. _------ ---- ---
Black Other
Male Female Total Male Female
4,556 290 11 ,19~ 1,138 60 14 0 0 0
860 115 572 541 31 349 12 177 172 5
2,084 82 308 294 14 913 61 102 94 8 333 19 39 37 2
3 1 0 0 0
122 17 25 22 3 0 0 0 0 0
19 1 7 5 2 8 1 4 4 0
46 8 11 10 1 36 6 2 2 0 13 1 1 1 0 0 0 0 0 0
40 41 43 38 5 0 0 i 0 0 0 0 0 0 0 0 0 0 0 0 0 0 14 8 6 2 4 11 19 18 1
31 16 16 14 2 5 0 0 0 0
8,880 2,399 1,660 1,407 253 2 0 1 1 0
354 57 261 229 32 548 84 200 182 18
3,475 966 630 544 f.'6 2,975 948 396 317 79 1,512 344 171 133 38
14 0 1 1 0
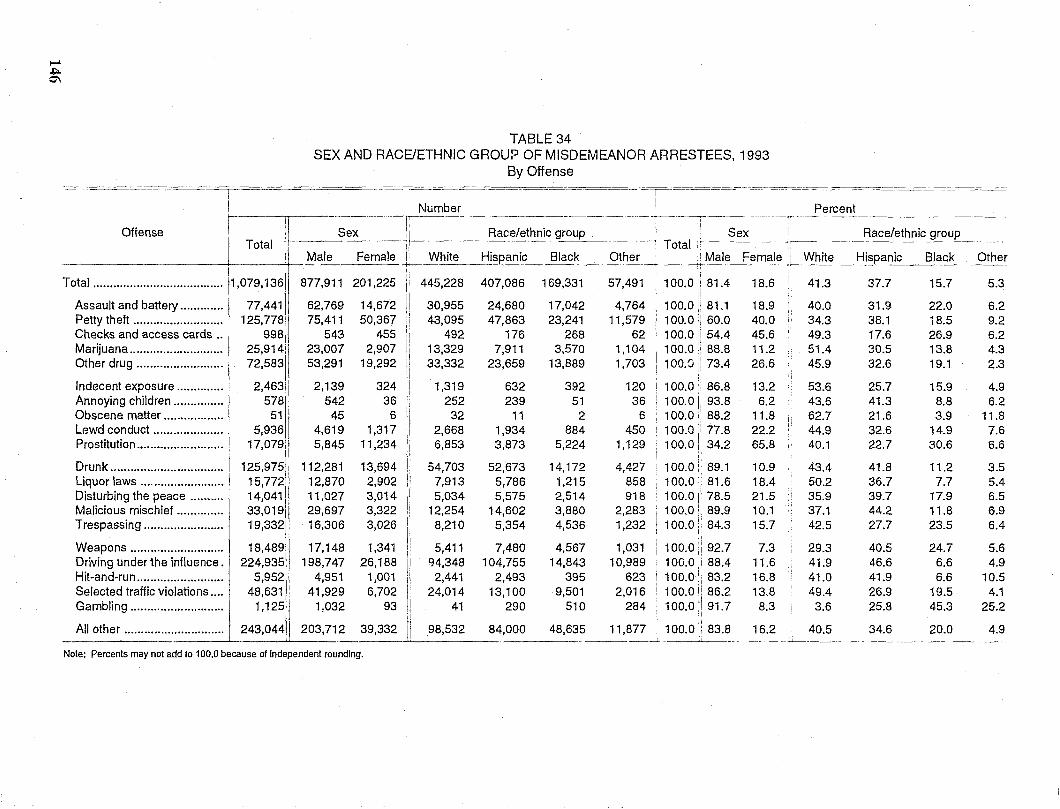
....
.p. CJ\
TABLE 34 SEX AND RACE/ETHNIC GROUi-> OF MISDEMEANOR ARRESTEES, 1993
By Offense -,-- ~-~~I"===--====CC==~_===~===~~--~- --~ - :=======--===:::~
I j I Number Percent I ---~:i~~----~--~-~---~-
Offense Ttl it-- Sex __ i~ __ Rac:.~/ethni~group .-.; Ttl Sex __ -.. _______ Race/ethnic group o a I, L ' 0 a "
Male Female i White Hispanic Black Other Male Female~. White Hispanic Black Other I j --:r-- I:-~--~--·--
Total ....................................... 1,079,136 877,911 201,225 Ii 445,228 407,086 169,331 57,491' 100.0 ii 81.4 18.6 41.3 37.7 15.7 5.3
Assault and battery............. 77,4411 62,769 14,672 I! 30,955 24,680 17,042 4,764 i 100.0ii 81.1 18.9 i 40.0 ~1.9 22.0 6.2 PettYtheft ........................... 125,77811 75,411 50,367 II 43,095 47,863 23,241 11,579 100.0:1 60.0 40.0, 34.3 38.1 18.5 9.2 Checks and access cards.. 998 543 455]1 492 176 268 62 100.0 54.4 45.6' 49.3 17.6 26.9 6.2 Marijuana ............................ 25,9141i 23,007 2,907 t! 13,329 7,911 3,570 1,104 100.0 88.8 11.2 51.4 30.5 13.8 4.3 I ,1 Other drug .......................... 72,583 I 53,291 19,292:i 33,332 23,659 13,889 1,703 100.0 73.4 26.6 45.9 32.6 19.1 2.3
!l II Indec~nt ex~osure .............. 2,4631 2,139 3241 1,319 632 392 120 100.0 86.8 13.2 53.6 25.7 15.9 4.9 AnnOYing chIldren ............... 578 542 36 i 252 239 51 36 100.0 93.8 6.2 43.6 41.3 8.8 6.2 Obscene matter .................. 51 I 45 6 ii 32 11 2 6 ' 100.0 88.2 11.8 I 62.7 21.6 3.9 11.8 Lewd conduct ..................... 5,936 I 4,619 1,317 Ii 2,668 1,934 884 450 ! 100.0 77.8 22.2 44.9 32.6 14.9 7.6 Prostitution.......................... 17,07911 5,845 11,234 Ii 6,853 3,873 5,224 1,129 100.0 34.2 65.8 40.1 22.7 30.6 6.6
II :1 3.5 Drunk.................................. 125,975,1 112,281 13,694 I: 54,703 52,673 14,172 4,427 100.0! 89.1 10.9 43.4 41.8 11.2
II \'
Liquor!aws ......................... 15,7721 12,870 2,902 II 7,913 5,786 1,215 858 I 100.0.81.6 18.4 50.2 36.7 7.7 5.4 Dist.u~bin"'gt~e p~ace .......... 14,0411 11,027 3,014 Ii 5,034 5,575 2,514 918 I 100.0 i 78.5 21.5 35.9 39.7 17.9 6.5 Mahclou", mIschIef .............. 33,019: 29,697 3,322:: 12,254 14,602 3,880 2,283 100.0 89.9 10.1 37.1 44.2 11.8 6.9 Trespassing ........................ 19,3321 16,306 3,026 Ii 8,210 5,354 4,536 1,232 100.0 84.3 15.7 I 42.5 27.7 23.5 6.4
Weapons ............................ 18,489 17,148 1,341 Ii 5,411 7,480 4,567 1,031 100.0 92.7 7.3 29.3 40.5 24.7 5.6 Driving under the influence. 224,935 198,747 26,188 II c)4,348 104,755 14,843 10,989 100.088.4 11.6 41.9 46.6 6.6 4.9 Hit-and-run.......................... 5,952 4,951 1,001 Ii 2,441 2,493 395 623 100.0 83.2 16.8 41.0 41.9 6.6 10.5 Selected traffic violations .... 48,631 I 41,929 6,702 Ii 24,014 13,100 9,501 2,016 100.0 86.2 13.8 49.4 26.9 19.5 4.1 Gambling ............................ 1,12511 1,032 93 I 41 290 510 284 100.0 91.7 8.3 3.6 25.8 45.3 25.2 ;j All other .............................. 243.0441 203,712
Ii 98,532 48,635 11,877 100.0 83.8 40.5 34.6 39,332 II 84,000 16.2 20.0 4.9
----~----------------
Note: Percents may not add \0 100.0 because of Independent rounding.
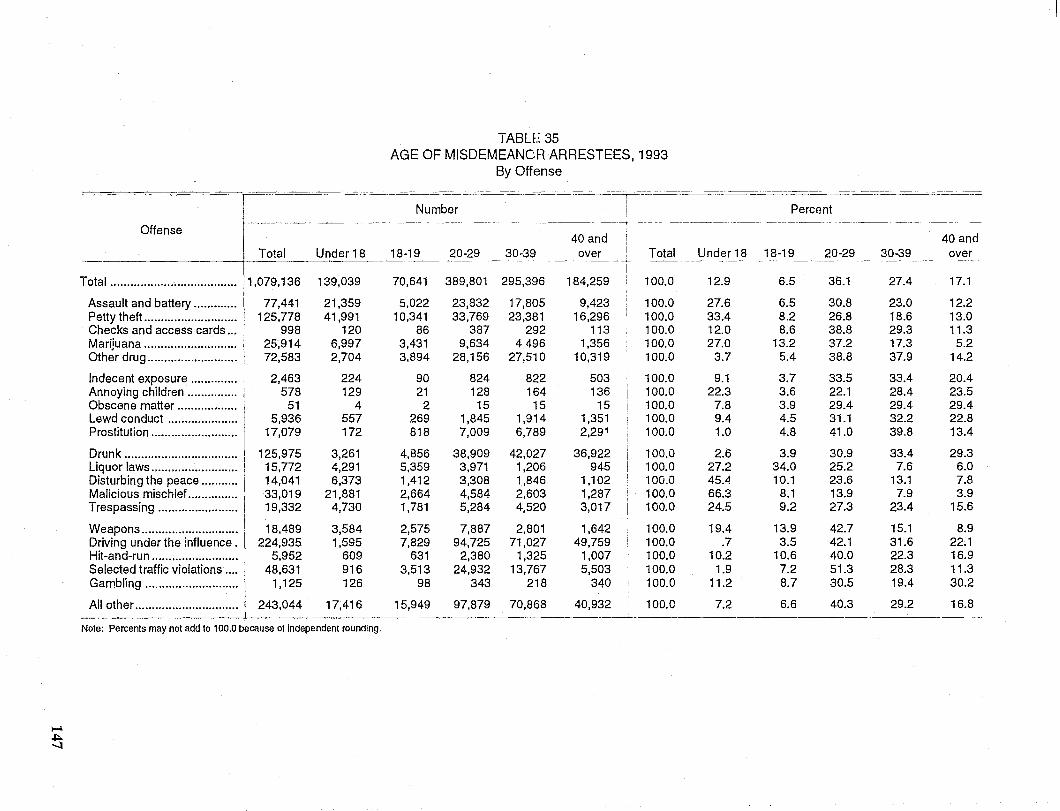
TABLE 35 AGE OF MISDEMEANCH ARRESTEES, 1993
By Offense
r~~-- ----=========: ::=::::=..=:==.::--===-=====:.:-:=--==-==:::---==-===-------:--==-:-:-~-~-------===-=-:==~--=...::::~ i -~--:-::~= ==-.....==::::-:-.:::=======:------...::::.=---=----:..---===:.==--------:-=:-:=~---=--:---
Number Percent ~-----~-~~--~------~~-~-~-~-
Offense 40 and 40 and
I Total Under 18 18-19 20-29 30-39 over Total Under 18 18-19 20-29 30-39 over
I -~-~~
Total ...................................... 11'079'136 139,039 70,641 389,801 295,396 184,259 100.0 12.9 6.5 36.1 27.4 17.1
Assault and battery ............. 77,441 21,359 5,022 23,832 17,805 9,423 100.0 27.6 6.5 30.8 23.0 12.2 Petty theft ............................ I 125,778 41,991 10,341 33,769 23,381 16,296 100.0 33.4 8.2 26.8 18.6 13.0 Checks and access cards ... 998 120 86 387 292 113 100.0 12.0 8.6 38.8 29.3 11.3 Marijuana ............................ I 25,914 6,997 3,431 9,634 4496 1,356 100.0 27.0 13.2 37.2 17.3 5.2 Other drug ............. .............. i 72,583 2,704 3,894 28,156 27,510 10,319 100.0 3.7 5.4 38.8 37.9 14.2
Indecent exposure .............. 2,463 224 90 824 822 503 100.0 9.1 3.7 33.5 33.4 20.4 Annoying children ............... I 578 129 21 128 164 136 100.0 22.3 3.6 22.1 28.4 23.5 Obscene matter .................. I 51 4 2 15 15 15 100.0 7.8 3.9 29.4 29.4 29.4 Lewd conduct .................. '" 5,936 557 269 1,845 1,914 1 ,351 100.0 9.4 4.5 31.1 32.2 22.8 Prostitution .......................... , 17,079 172 818 7,009 6,789 2,291 100.0 1.0 4.8 41.0 39.8 13.4
I Drunk .................................. i 125,975 3,261 4,856 38,909 42,027 36,922 100.0 2.6 3.9 30.9 33.4 29.3 Liquor laws .......................... I 15,772 4,291 5,359 3,971 1,206 945 100.0 27.2 34.0 25.2 7.6 6.0 Disturbing the peace ........... I 14,041 6,373 1,412 3,308 1,846 1,102 100.0 45.4 10.1 23.6 13.1 7.8 Malicious mischief ............... I 33,019 21,881 2,664 4,584 2,603 1,287 100.0 66.3 8.1 13.9 7.9 3.9 Trespassing ........................ I
I 19,332 4,730 1,781 5,284 4,520 3,017 100.0 24.5 9.2 27.3 23.4 15.6
Weapons ............................. ,
18,489 3,584 2,575 7,887 2,801 1,642 100.0 19.4 13.9 42.7 15.1 8.9 Driving under the influence. 224,935 1,595 7,829 94,725 71,027 49,759 100.0 .7 3.5 42.1 31.6 22.1 Hit-and-run .......................... 5,952 609 631 2,380 1,325 1,007 100.0 10.2 10.6 40.0 22.3 16.9 Selected traffic violations .... 48,631 916 3,513 24,932 13,767 5,503 100.0 1.9 7.2 51.3 28.3 11.3 Gambling ............................ 1,125 126 98 343 218 340 100.0 11.2 8.7 30.5 19.4 30.2
I
All other ............................... I 243,044 17,416 15,949 97,879 70,868 40,932 100.0 7.2 6.6 40.3 29.2 16.8
Note: Percents may not add to 100.0 because of independent rounding.
~
~
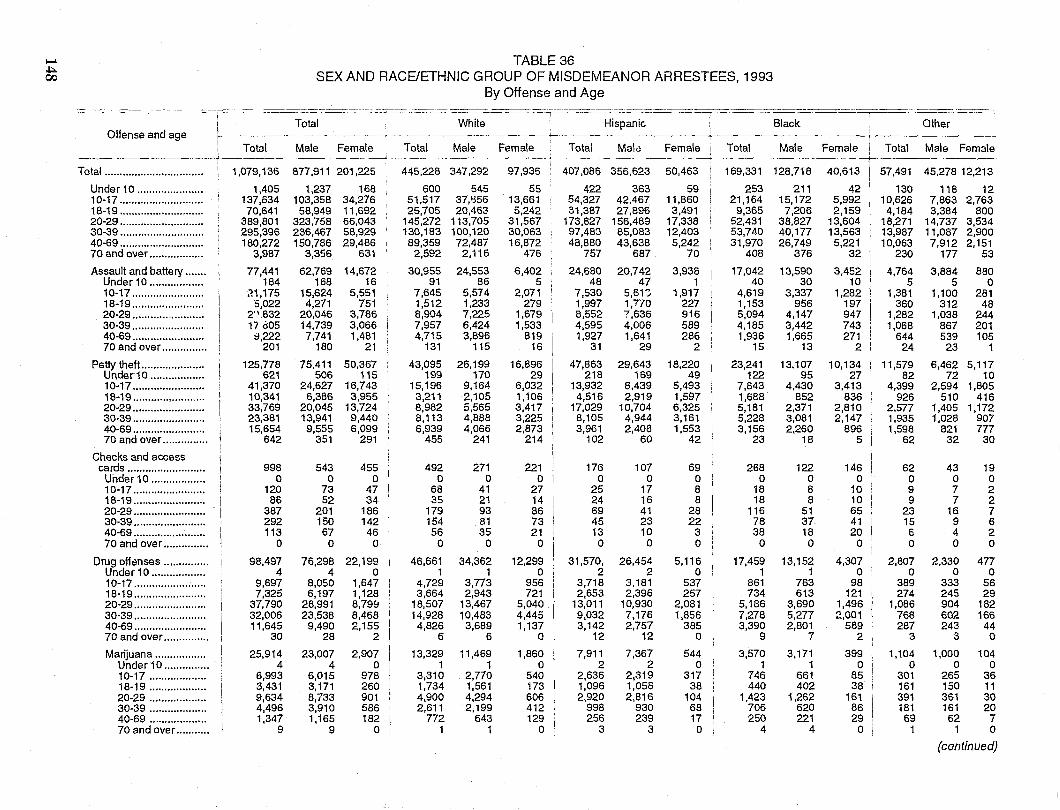
I-A TABLE 36 ~
SEX AND RACE/ETHNIC GROUP OF MISDEMEANOR ARRESTEES, 1993 00
By Offense and Age ~-~~------- ._-- ----- ------~-~-----~~--- -. -------- _._-. - ,----------.------.----------------~ ---- _~ _______ -~ ___ .___ _ __ . __ .,.. ____ --~ _________ ~----- ---r--'----- ----"
~ -I--~ --------------------~~----~-.--------
Total White Hispanic Black Other Offense and age ~----~~--.--~--- .. --- .. ------ ~ --------------...j------------ . --------------r----
Total Male Female Total Male Female . Total Maicl Female! Total Male Female Total Male Female ---------------_ .... ~--.--------~--~-----.~ ------------ -----;------~-.--~--
Total ................................. 1,079,136 877 ,911 201,225 445,228 347,292 97,936 407,086 356,623 50,463 169,331 128,718 40,613 57,491 45,278 12,213
Under 10 ...................... 1,405 1,237 168 600 545 55 422 363 59 253 211 42 130 118 12 10-17 ............................ 137,634 103,358 34,276 51,517 37,B56 13,661 54,327 42,467 11,860 21,164 15,172 5,992 10,626 7,863 2,763 18-19 ............................ 70,641 58,949 11,692 25,705 20,463 5,242 31,387 27,896 3,491 9,365 7,206 2,159 4,184 3,384 800 20-29 ............................ 389,801 323,758 66,043 145,272 113,705 31,567 173,827 156,489 17,338 52,431 38,827 13,604 18,271 14,737 3,534 30-39 ............................ 295,396 236,467 58,929 ' 130,183 100,120 30,063 97,483 85,083 12,403 53,740 40,177 13,563 13,987 11,087 2,900 40-69 ............................ 180,272 150,786 29,486 89,359 72,487 16,872 48,880 43,638 5,242 i 31,970 26,749 5,221 10,063 7,912 2,151 70 and over .................. 3.987 3.356 631
, 2.592 2,116 476 757 687 70 408 376 32 230 177 53
Assault and battery ....... 77,441 62.769 14,672 30,955 24,553 6,402 24,680 20,742 3.938 17.042 13,590 3,452 4,764 3,884 880 Under 10 .................. 184 168 16 91 86 5 48 47 1 40 30 10 5 5 0 10-17 ........................ .~1.175 15.624 5,551 7,645 5.574 2,071 7,530 5.6n 1,917 4.619 3.337 1.282 1.381 1.100 281 18-19 ........................ 5,022 4,271 751 1,512 1,233 279 1,997 1,7/0 227 1.153 956 197 360 312 48 20-29 ........................ 2'1.832 20.046 3,786 8.904 7.225 1,679 8,552 7.636 916 5.094 4.147 947 1,282 1,038 244 30-39 ........................ 17 605 14,739 3,066 7.957 6,424 1.533 4,595 4,006 589 4,185 3,442 743 1,068 867 201 40-69 ........................ ::1.222 7,741 1,481 4.715 3.896 819 1,927 1,641 286 1.936 1.665 271 644 539 105 70 and over ............... 201 180 21 131 115 16 31 29 2 i 15 13 2 24 23 1
Petty theft. .................... 125,778 75,411 50,367 43,095 26,199 16,896 47.863 29,643 18,220 23.241 13,107 10.134 11.579 6,462 5,117 Under 10 .................. 621 506 115 199 170 29 218 169 49 122 95 27 82 72 10 10-17 ........................ 41,370 24.627 16.743 15.196 9,164 6.032 13,932 8,439 5,493 7,843 4,430 3,413 4.399 2,594 1,805 18-19 ........................ 10.341 6.386 3.955 3,211 2,105 1.106 4.516 2.919 1.597 1.688 852 836 926 510 416 20-29 ........................ 33.769 20.045 13,724 8.982 5,565 3,417 17,029 10.704 6,325 5,181 2.371 2,810 2,577 1,405 1,172 30-39 ........................ 23,381 13.941 9,440 8,113 4,888 3,225 8,105 4,944 3,161 5,228 3.081 2,147 1,935 1,028 907 40-69 ........................ 15.654 9,555 6,099 6.939 4,066 2.873 3,961 2,408 1,553 3,156 2,260 896 1.598 821 777 70 and over ............... 642 351 291 455 241 214 102 60 42 23 18 5 62 32 30
Checks and access cards .......................... 998 543 455 492 271 221 176 107 69 268 122 146 62 43 19
Under 10 .................. 0 0 0 0 0 0 0 0 0 0 0 0 0 0 0 10-17 ........................ 120 73 47 68 41 27 25 17 8 18 8 10 9 7 2 18-19 ........................ 86 52 34 35 21 14 24 16 8 18 8 10 9 7 2 20-29 ........................ 387 201 186 179 93 86 69 41 28 116 51 65 23 16 7 30-39 ........................ 292 150 142 154 81 73 45 23 22 78 37 41 15 9 6 40-69 ........................ 113 67 46 56 35 21 13 10 3 38 18 20 6 4 2 70 and over ............... 0 0 0 0 0 0 0 0 0 0 0 0 0 0 0
Drug off~nses ............... 98,497 76,298 22.199 46.661 34,362 12,299 31.570. 26,454 5.116 17,459 13.152 4.307 2,807 2,330 477 Under 10 .................. 4 4 0 1 1 0 2 2 0 1 1 0 0 0 0 10-17 ........................ 9,697 8,050 1,647 4,729 3.773 956 3.718 3,181 537 861 763 98 389 333 56 18-19 ........................ 7.325 6.197 1,128 3,664 2.943 721 2.653 2,396 257 734 613 121 274 245 29 20-29 ........................ 37.790 28,991 8.798 18.507 13,467 5.040 13.011 10.930 2.081 5.186 3.690 1,496 1,086 904 182 30-39 ........................ 32.006 23,538 8,468 I 14,928 10,483 4.445 9,032 7,176 1,856 7.278 5,277 2,001 768 602 166 40-69 ........................ 11.645 9,490 2,155 4,826 3,689 1.137 3.142 2.757 385 3,390 2.801 589 287 243 44 70 and over ............... 30 28 2 6 6 0 12 12 0 9 7 2 3 3 0
Marijuana ................. 25,914 23,007 2,907 13.329 11,469 1.860 7,911 7.367 544 3,570 3,171 399 1.104 1,000 104 Under10 ............... 4 4 0 1 1 0 2 2 0 1 1 0 0 0 0 10-17 ................... 6.993 6,015 978 3.310 2.770 540 2,636 2.319 317 746 661 85 301 265 36 18-19 ................... 3,431 3.171 260 1.734 1,561 173 1.096 1.058 38 440 402 38 161 150 11 20-29 ................... 9.634 8.733 901 4,900 4.294 606 2,920 2,816 104 1,423 1.262 161 391 361 30 30-39 ................... 4,496 3,910 586 2.611 2,199 412 998 930 68 706 620 86 181 161 20 40-69 ................... 1,347 1,165 182 772 643 129 256 239 17 250 221 29 69 62 7 70 and over. .......... 9 9 0 1 1 0 3 3 0 4 4 0 1 1 0
(continued)
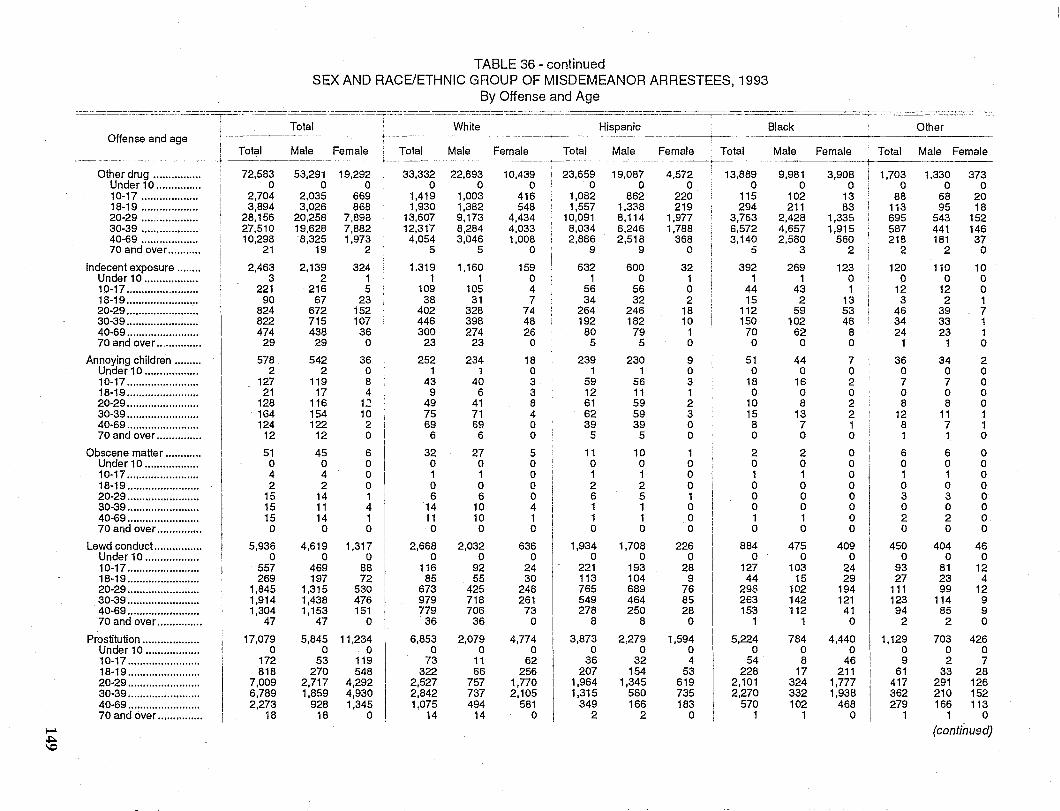
TABLE 36 - continued SEX AND RACE/ETHNIC GROUP OF MISDEMEANOR ARRESTEES, 1993
By Offense and Age "~.-. - .-~---- --- -- ------------ --.---.--~-.-------------~----.---- ------------------"---_ ... ----- -- -------_.- ----------- -----------,... - _._-_._----------
Total White Hispanic Black Other Offense and age .--------------_.- - --~---------- -+--------------------- -- ---- _."------ - ....----------_._- - ------ ---+-------
I Total Male Female Total Male Female Total Male Female i Total Male Female . Total Male Female
-r------------- -~-- +--
Other drug ................ 72,583 53,291 19,292 33,332 22,893 10,439 I 23,659 19,087 4.572 13,889 9,981 3,908 1,703 1,330 373 Under 10 ............... 0 0 0 0 0 0 0 0 0 0 0 0 0 0 0 10-17 ................... 2,704 2,035 669 1,419 1.003 416 1,082 862 220 115 102 13 88 68 20 18-19 ................... 3,894 3,026 868 1,930 1,382 548 1,557 1.338 219 294 211 83 113 95 18 20-29 ................... 28,156 20,258 7.89a 13,607 9,173 4,434 10,091 8,114 1,977 3,763 2,428 1,335 695 543 152 30-39 ................... 27,510 19,628 7,882 12,317 8,284 4,033 8,034 6,246 1,788 6,572 4,657 1,915 587 441 146 40-69 ................... 10,298 8,325 1,973 4,054 3,046 1,008 2,886 2,518 368 3,140 2,580 560 218 181 37 70 and over. .......... 21 19 2 I 5 5 0 9 9 0 :; 3 2 2 2 0
Indecent exposure ........ 2,463 2,139 324 1.319 1,160 159 632 600 32 392 269 123 120 110 10 Under 10 .................. 3 2 1 1 1 0 1 0 1 1 1 0 0 0 0 10-17 ....................... 221 216 5 109 105 4 56 56 0 44 43 1 12 12 0 18-19 ........................ 90 67 23 38 31 7 34 32 2 15 2 13 3 2 1 20-29 ........................ 824 672 152 402 328 74 264 246 18 112 59 53 46 39 7 30-39 ........................ 822 715 107 446 398 48 192 182 10 150 102 48 34 33 1 40-69 ........................ 474 438 36 300 274 26 80 79 1 70 62 8 24 23 1 70 and over ............... 29 29 0 23 23 0 5 5 0 0 0 0 1 1 0
Annoying children ......... 578 542 36 252 234 18 239 230 9 51 44 7 36 34 2 Under 10 .................. 2 2 0 1 1 0 1 1 0 0 0 0 0 0 0 10-17 ........................ 127 119 8 43 40 3 59 56 3 18 16 2 7 7 0 18-19 ........................ 21 17 4 9 6 3 12 11 1 0 0 0 0 0 0 20-29 ........................ 128 116 12 49 41 8 61 59 2 10 8 2 8 8 0 30-39 ........................ 164 154 10 75 71 4 62 59 3 15 13 2 12 11 1 40-69 ........................ 124 122 2 69 69 0 39 39 0 8 7 1 8 7 1 70 and over ............... 12 12 0 6 6 0 5 5 0 0 0 0 1 1 0
Obscene matter ............ 51 45 6 32 27 5 11 10 1 2 2 0 6 6 0 Under 10 .................. 0 0 0 0 0 0 0 0 0 0 0 0 0 0 0 10-17 ........................ 4 4 0 1 1 0 1 1 0 1 1 0 1 1 0 18-19 ........................ 2 2 0 0 0 0 2 2 0 0 0 0 0 0 0 20-29 ........................ 15 14 1 6 6 0 6 5 1 0 0 0 3 3 0 30-39 ........................ 15 11 4 14 10 4 1 1 0 0 0 0 0 0 0 40-69 ........................ 15 14 1 11 10 1 1 1 0 1 1 0 2 2 0 70 and over ............... 0 0 0 0 0 0 0 0 0 0 0 0 0 0 0
Lewd conduct. ............... 5,936 4,619 1,317 2,668 2,032 636 1,934 1,708 226 884 475 409 450 404 46 Under 10 .................. 0 0 0 0 0 0 0 0 0 0 0 0 0 0 0 10-17 ........................ 557 469 88 116 92 24 221 193 28 127 103 24 93 81 12 18-19 ........................ 269 197 72 85 55 30 113 104 9 44 15 29 27 23 4 20-29 ........................ 1,845 1,315 530 673 425 248 765 689 76 295 102 194 111 99 12 30-39 ........................ 1,914 1,438 476 979 718 261 549 464 85 263 142 121 123 114 9 40-69 ........................ 1,304 1,153 151 779 706 73 278 250 28 153 112 41 94 85 9 70 and over ............... 47 47 0 36 36 0 8 8 0 1 1 0 2 2 0
Prostitution ................... 17,079 5,845 11,234 6,853 2,079 4,774 3,873 2,279 1,594 5,224 784 4,440 1,129 703 426 Under 10 .................. 0 0 0 0 0 0 0 0 0 0 0 0 0 0 0 10-17 ........................ 172 53 119 73 11 62 36 32 4 54 8 46 9 2 7 18-19 ........................ 818 270 548 322 66 256 207 154 53 228 17 211 61 33 28 20-29 ........................ 7,009 2,717 4,292 2,527 757 1,770 1,964 1,345 619 2,101 324 1,777 417 291 126 30-39 ........................ 6,789 1,859 4,930 2,842 737 2,105 1,315 580 735 2,270 332 1,938 362 210 152 40-69 ........................ 2,273 928 1,345 1,075 494 581 349 166 183 570 102 468 279 166 113 70 and over ............... 18 18 0 14 14 0 2 2 0 1 1 0 1 1 0
..... (continued) A \C
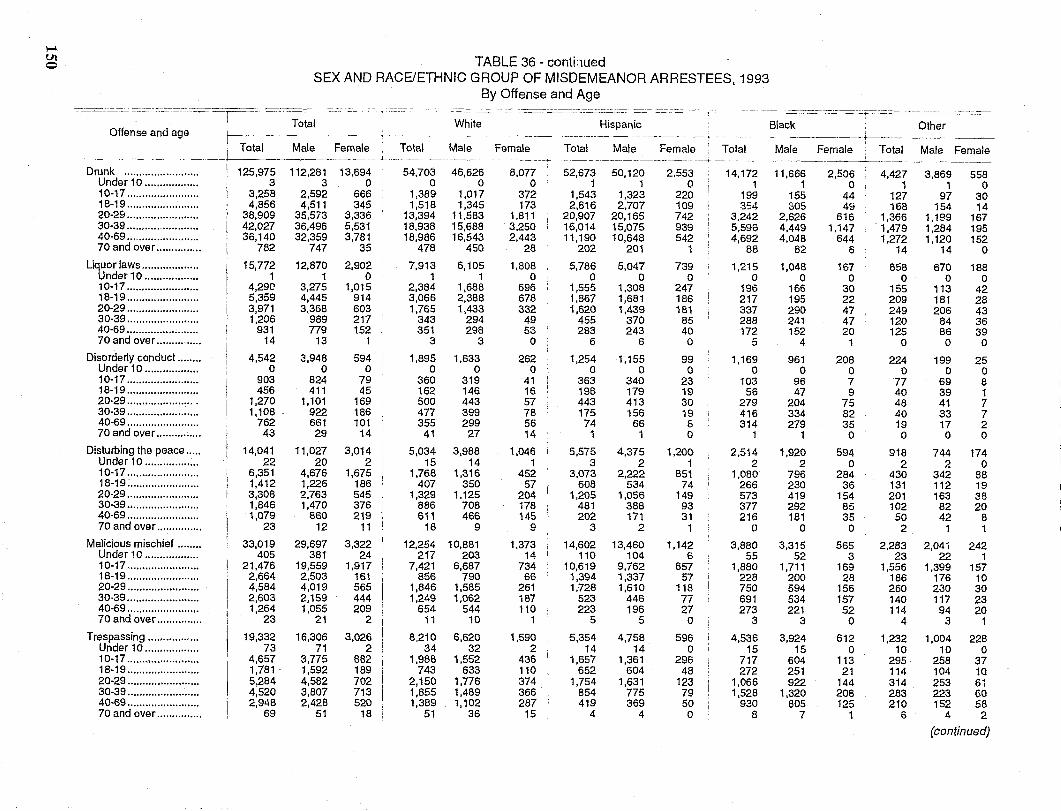
l-l til ~ TABLE 36 - conthued
SEX AND RACE/ETHNIC GROUP OF MISDEMEANOR ARRESTEES, 1993 By Offense and Age
=== =-:'=---·cc:c.--=---==-:.=c---r-~-==---=-c·==-'====-- -I Total White
Offense and age r--~~--"-"-- -- ~- .. "-' '-'-" -.-'-~' . Total Male Female. Total Male Female Total
Drunk ....................... .. Under 10 ................ .. 10-17 ....................... . 18-19 ....................... . 20-29 ...................... .. 30-39 ...................... . 40-69 ....................... . 70 and over .............. .
Liquor laws .................. . Under 10 ................. . 10-17 ...................... .. 18-19 ....................... . 20-29 ....................... . 30-39 ...................... .. 40-69 ....................... . 70 and over .............. .
Disorderly conduct ....... . Under 10 ................ .. 10-17 ....................... . 18-19 ...................... .. 20-29 ...................... . 30-39 ....................... . 40-69 ....................... . 70 and over .............. .
Disturbing the peace ... .. Under 10 ................. . 10-17 ....................... . 18-19 ...................... .. 20-29 ....................... . 30-39 ....................... . 40-69 ...................... .. 70 and over .............. .
Malicious mischief ...... .. Under 10 ................. . 10-17 ....................... . 18-19 ...................... .. 20-29 ...................... .. 30-39 ...................... .. 40-69 ....................... . 70 and over .............. .
Trespassing ............... .. Under 10 ................. . 10-17 ....................... . 18-19 ....................... . 20-29 ....................... . 30-39 ....................... . 40-69 ....................... . 70 and over .............. .
I .. ---' ... --.. ~. --- ---'--' -.---.---- --. -----+-.-j
, 125,975 112,281 13,694 54,703 46,626 8,077 52,673 3 30 0 0 0 1
3,258 2,592 666 1,389 1,017 372 1,543 4,856 4,511 345 1,518 1,345 173 2,816
38,909 35,573 3,336 I 13,394 11,583 1,811 20,907 42,027 36,496 5,531 18,938 15,688 3.250 16,014 36,140 32,3593,781 18,98616,543 2.443 11,190
782 747 35 478 450 28 202
15,772 12,870 2,902 7,913 6,105 1,808 5,786 1 1 0 1 1 1 0 0
4,290 3,275 1,015 I 2,384 1,688 696 1,555 5,359 4,445 914 3,066 2,388 678 1,867 3,971 3,368 603 1,765 1,433 332 1,620 1,206 989 217 343 294 49 1 455
931 779 152 351 298 53 1 283 14 13 1 3 3 0 6
4,542 o
903 456
1,270 1,108
762 43
14,041 22
6,351 1,412 3,308 1,846 1,079
23
33,019 405
21,476 2,664 4,584 2,603 1,264
23
19,332 73
4,657 1,781 5,284 4,520 2,948
69
3,948 o
824 411
1,101 922 661 29
11,027 20
4,676 1,226 2,763 1,470
860 12
29,697 381
19,559 2,503 4,019 2,159 1,055
21
16,306 71
3,775 1,592 4,582 3,807 2,428
51
594 i o
79 , 45 !
169 186 101
14 i
3,014 2
1,675 186 545 376 219
11
3,322 24
1,917 161 565 444 209
2
3,026 2
882 189 702 713 520
18
1,895 1,633 262 1,254 o 0 0 0
360 319 41 363 162 146 16 198 500 443 57 443 477 399 78 175 355 299 56: 74
41 27 14 I 1
5,034 15
1,768 407
1,329 886 611
18
12,254 217
7,421 856
1,846 1,249
654 11
8,210 34
1,988 743
2,150 1,855 1,389
51
3,988 1,046 5,575 14 1 3
1,316 452 3,073 350 57 608
1,125 204 1,205 708 178 481 466 145 202
9 9 3
10,881 1,373 14,602 203 14 110
6,687 734 10,619 790 66 1,394
1,585 261 1,728 1,062 187 523
544 110 223 10 1 5
6,620 1,590 5,354 32 2 14
1,552 436 1,657 633 110 652
1,776 374 1,754 1,489 366 854 1,102 287 419
36 15 4
Hispanic
Male
50,120 1
1,323 2,707
20,165 15,075 10,648
201
5,047 o
1,308 1,681 1,439
370 243
6
1,155 o
340 179 413 156
66 1
4,375 2
2,222 534
1,056 388 171
2
13,460 104
9,762 1,337 1,610
446 196
5
4,758 14
1,361 604
1,631 775 369
4
Female
2.553 o
220 109 742 939 542
1
739 o
247 186 181
85 40 o
99 o
23 19 30 19
5 o
1,200 1
851 74
149 93 31
1
1,142 6
857 57
118 77 27 o
596 o
296 48
123 79 50 o
Total
14,172 1
199 354
3,242 5,596 4,692
88
1,215 o
196 217 337 288 172
5
1,169 o
103 56
279 416 314
1
2,514 2
1,080 266 573 377 216
o 3,880
55 1,880
228 750 691 273
3
4,536 15
717 272
1,066 1,528
930 8
~-------.--------.. -----~--------------------------+-- ~---------~-.--
Black
Male Female
11,666 1
155 305
2,626 4,449 4,048
82
1,048 o
166 195 290 241 152
4
961 o
96 47
204 334 279
1
1,920 2
796 230 419 292 181
o 3,315
52 1,711
200 594 534 221
3
3,924 15
604 251 922
1,320 805
7
2,506 o
44 49
616 1.147
644 6
167 o
30 22 47 47 20
1
208 o 7 9
75 82 35 o
594 o
284 36
154 85 35 o
565 3
169 28
156 157 52 o
612 o
113 21 i
144 208 125 I
1
Other
Total Male Female
4,427 1
127 168
1,366 1,479 1,272
14
858 o
155 209 249 120 125
o 224
o 77 40 48 40 19 o
918 2
430 131 201 102 50 2
2,283 23
1,556 186 260 140 114
4
1,232 10
295 114 314 283 210
6
3,869 1
97 154
1,189 1,284 1,120
14
670 o
113 181 206
84 86 o
199 o
69 39 41 33 17 o
744 2
342 112 163 82 42
1
2,041 22
1,399 176 230 117 94
3
558 o
30 14
167 195 152
o 188
o 42 28 43 36 39 o
25 o 8 1 7 7 2 o
174 o
88 19 38 20
8 1
242 1
157 10 30 23 20
1
1,004 228 10 0
258 37 104 10 253 61 223 60 152 58
4 2
(continued)
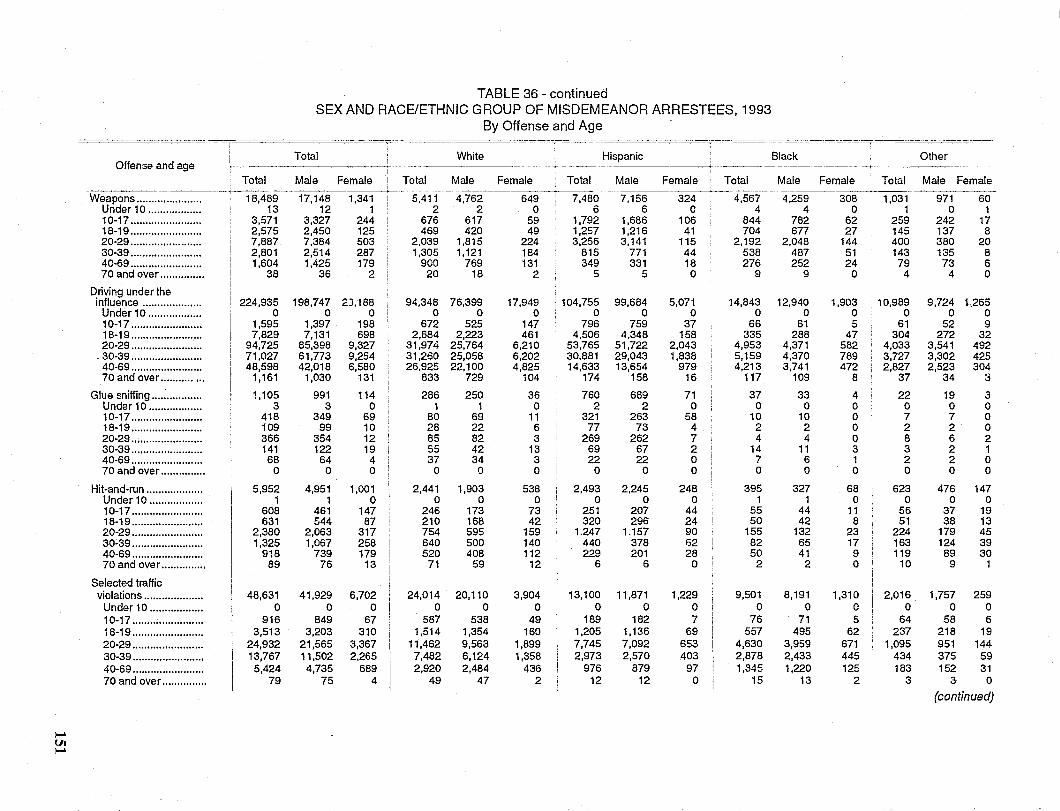
TABLE 36 - continued SEX AND RACE/ETHNIC GROUP OF MISDEMEANOR ARRESTEES. 1993
By Offense and Age - - --- -- ----~---~~----------,---------- ----- -------~---.------~ •• """T-- •• ----- ------_ .. ---==---====-~~-------=--~....:=:--=::-:=----
Total White Hispanic Black Other Offense and age -------------+-.- - ~-- -- -- ---
Total Male Female Total Male Female , Total Male Female Total Male Female Total Male Female i
Weapons ...... : . .:-............ --~ -- ~--- -------~--~------ ---'"---."--.-.-.-~--~-. ---- ------_.
18,489 17.148 1,341 5,411 4,762 649 7,480 7,156 324 4,567 4,259 308 1,031 971 60 Under 10 .................. 13 12 1 2 2 0 6 6 C 4 4 0 1 0 1 10-17 ........................ 3,571 3,327 244 676 617 59 1,792 1,686 106 844 782 62 259 242 17 18-19 ........................ 2,575 2,450 125 469 420 49 1,257 1,216 41 704 677 27 145 137 8 20-29 ........................ 7,887 7,384 503 2,039 1,815 224 3,256 3,141 115 2,192 2,048 144 400 380 20 30-39 ........................ 2,801 2,514 287 1,305 1,121 184 815 771 44 538 487 51 143 135 8 40-69 ........................ 1,604 1,425 179 900 769 131 349 331 18 276 252 24 79 73 6 70 and over ............... 38 36 2 20 18 2 5 5 0 9 9 0 4 4 0
Driving under the influence .................... 224,935 198,747 ~J,188 94,348 76,399 17,949 104,755 99,684 5,071 14,843 12,940 1,903 ' 10,989 9,724 1,265
Under 10 .................. 0 0 0 0 0 0 0 0 0 0 0 0 0 0 0 10-17 ........................ 1,595 1,397 198 672 525 147 796 759 37 66 61 5 61 52 9 18-19 ........................ 7,829 7.131 698 2,684 2,223 461 4,506 4,348 158 335 288 47 304 272 32 20·29 ........................ 94,725 85,398 9,327 31,974 25,764 6,210 53,765 51,722 2,043 4,953 4,371 582 4,033 3,541 492 30-39 ........................ 71,027 61,773 9,254 31,260 25,058 6,202 ' 30,881 29,043 1,838 5,159 4,370 789 , 3,727 3,302 425 40-69 ........................ 48,598 42,018 6,580 26,925 22,100 4,825 14,633 13,654 979 4,213 3,741 472 2,827 2,523 304 70 and over ............... 1,161 1,030 131 833 729 104 174 158 16 117 109 8 37 34 3
Glue sniffing ................. 1,105 991 114 286 250 36 760 689 71 37 33 4 22 19 3 Under 10 .................. 3 3 0 1 1 0 2 2 0 0 0 0 0 0 0 10-17 ........................ 418 349 69 80 69 11 321 263 58 10 10 0 7 7 0 18-19 ........................ 109 99 10 28 22 6 77 73 4 2 2 0 2 2 0 20-29 ........................ 366 354 12 85 82 3 269 262 7 4 4 0 8 6 2 30-39 ........................ 141 122 19 55 42 13 69 67 2 , 14 11 3 3 2 1 40-69 ........................ 68 64 4 37 34 3 22 22 0 7 6 1 2 2 0 70 and over ............... 0 0 0 0 0 0 0 0 0 0 0 0 0 0 0
Hit-and·run ................... 5,952 4,951 1,001 2,441 1,903 538 2,493 2,245 248 395 327 68 623 476 147 Under 10 .................. 1 1 0 0 0 0 0 0 0 1 1 0 0 0 0 10-17 ........................ 608 461 147 246 173 73 251 207 44 55 44 11 56 37 19 18-19 ........................ 631 544 87 210 168 42 320 296 24 50 42 8 51 38 13 20-29 ........................ 2,380 2,063 317 754 595 159 1.247 1.157 90 155 132 23 224 179 45 30-39 ........................ 1,325 1,067 258 640 500 140 440 378 62 82 65 17 163 124 39 40-69 ........................ 918 739 179 520 408 112 229 201 28 50 41 9 119 89 30 70 and over ............... 89 76 13 71 59 12 6 6 0 2 2 0 10 9 1
Selected traffic violations .................... 48,631 41,929 6,702 24,014 20,110 3,904 13,100 11,871 1,229 9,501 8,191 1,310 2,016 1,757 259
Under 10 .................. 0 0 0 0 0 0 0 0 0 0 0 0 0 0 0 10-17 ........................ 916 849 67 587 538 49 189 182 7 76 71 5 64 58 6 18-19 ........................ 3,513 3,203 310 1,514 1,354 160 1,205 1,136 69 557 495 62 237 218 19 20-29 ........................ 24,932 21,565 3,367 11,462 9,563 1,899 7,745 7,092 653 4,630 3,959 671 1,095 951 144 30-39 ........................ 13,767 11,502 2,265 7,482 6,124 1,358 2,973 2,570 403 2,878 2,433 445 434 375 59 40-69 ........................ 5,424 4,735 689 2,920 2,484 436 976 879 97 1,345 1,220 125 183 152 31 70 and over ............... 79 75 4 49 47 2 12 12 0 15 13 2 3 3 0
(continued)
...... til ......
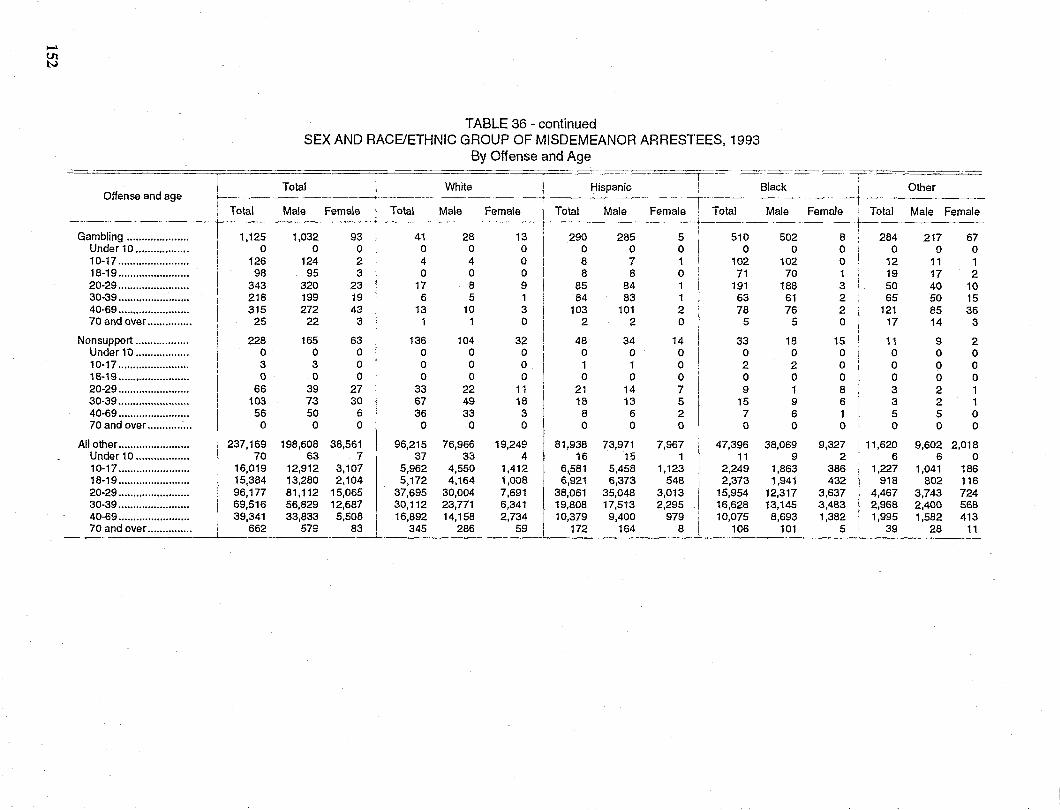
I-' U1 N
Offense and age 1
TABLE 36 - continued SEX AND RACE/ETHNIC GROUP OF MISDEMEANOR ARRESTEES, 1993
By Offense and Age
Total White Hispanic
Male
Black Other
Male Female Total rTotal Fema'el-~ota'---Male -~ema!e Total Male Female Total --------------------~--------------- ~ ~---------------------+-----------------
Gambling ..................... 1,125 1,032 93 I 41 28 13 290 285 5 510 502 8 284 217 67
Male Female
Under 10 .................. 0 0 0 i 0 0 0 0 0 0 0 0 0 0 0 0 10-17........................ 126 124 2 i 4 4 0 8 7 1 102 102 0 12 11 1 18-19........................ 98 95 3 I 0 0 0 8 8 0 71 70 1 19 17 2 20-29........................ 343 320 23 ') 17 8 9 85 84 1 191 188 3 50 40 10 30-39........................ 218 199 19 6 5 1 84 83 1 63 61 2 65 50 15 40-69........................ 315 272 43 13 10 3 103 101 2 78 76 2 121 85 36 70 and over .......... ..... 25 22 3 i 1 1 0 2 2 0 5 5 0 17 14 3
I Nonsupport .................. 228 165 63! 136 104 32 48 34 14 33 18 15 11 9 2
Under 10 .................. 0 0 0 I 0 0 0 0 0 0 0 0 0 0 0 0 10-17........................ 3 3 0 I 0 0 0 1 1 0 2 2 0 0 0 0 18-19........................ 0 0 0 1 0 0 ° 0 0 0 0 0 0 0 0 0 20-29........................ 66 39 27 33 22 11 21 14 7 9 1 8 3 2 1 30-39.. ...................... 103 73 30) 67 49 18 18 13 5 15 9 6 3 2 1 40-69.. ...................... 56 50 6 36 33 3 8 6 2 7 6 1 5 5 0 70 and over ............... 0 0 O! 0 0 0 0 0 0 0 0 0 0 0 0
I AIIother........................ 237,169 198,608 38,561 96,215 76,966 19,249 81,938 73,971 7,967 47,396 38,069 9,327 11,620 9,602 2,018
Under 10 .................. 70 63 7 37 33 4 16 15 1 11 9 2 6 6 0 10-17........................ 16,019 12,912 3,107 5,962 4,550 1,412 6,581 5,458 1,123 2,249 1,863 386 1,227 1,041 186 18-19........................ 15,384 13,280 2,104 5,172 4,164 1,008 6;921 6,373 548 2,373 1,941 432 918 802 116 20-29........................ 96,177 81,112 15,065 37,695 30,004 7,691 38,061 35,048 3,013 15,954 12,317 3,637 4,467 3,743 724 30-39........................ 69,516 56,829 12,687 30,112 23,771 6,341 19,808 17.513 2.295 16,628 13,145 3,483 2,968 2,400 568 40-69........................ 39,341 33,833 5,508 16,892 14,158 2,734 10,379 9,400 979 10,075 8,693 1,382 1,995 1,582 413 70 and over............... 662 579 83 345 286 59 172 164 8 106 101 5 39 28 11
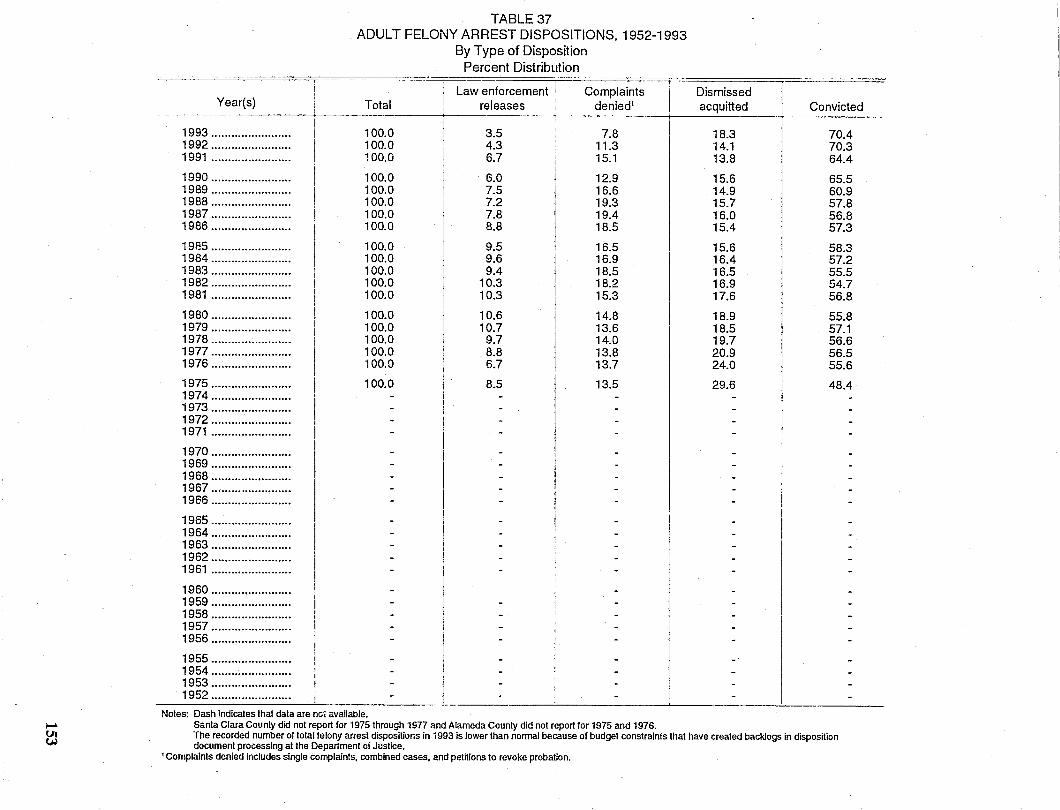
~ 01 tJJ
Year(s}
1993 ....................... . 1992 ....................... . 1991 ...................... ..
1990 ....................... . 1989 ...................... .. 1988 ....................... . 1987 ....................... . 1986 ...................... ..
1985 ...................... .. 1984 ....................... . 1983 ....................... . 1982 ....................... . 1981 ....................... .
1980 ....................... . 1979 ....................... . 1978 ....................... . 1977 ....................... . 1976 ....................... .
1975 ....................... . 1974 ....................... . 1973 ....................... . 1972 ....................... . 1971 ....................... .
1970 ....................... . 1969 ...................... .. 1968 ....................... . 1967 ...................... .. 1966 ....................... .
1965 ...................... .. 1964 ....................... . 1963 ....................... . 1962 ....................... . 1961 ....................... .
1960 ....................... . 1959 ...................... .. 1958 ...................... .. 1957 ...................... .. 1956 ....................... .
1955 ...................... .. 1954 ...................... .. 1953 ...................... .. 1952 ....................... .
TABLE 37 ADULT FELONY ARREST DISPOSITIONS, 1952-1993
By Type of Disposition Percent Distribution
Law enforcement Complaints Total releases denied!
100.0 3.5 7.8 100.0 4.3 11.3 100.0 6.7 15.1
100.0 6.0 12.9 100.0 7.5 16.6 100.0 7.2 19.3 100.0 7.8 19.4 100.0 8.8 18.5
100.0 9.5 16.5 100.0 9.6 16.9 100.0 9.4 18.5 100.0 10.3 18.2 100.0 10.3 15.3
100.0 10.6 14.8 100.0 10.7 13.6 100.0 9.7 14.0 100.0 8.8 13.8 100.0 6.7 13.7
100.0 8.5 13.5
Notes: Dash Indicates that data are nGi available. Santa Clara County did not report for 1975 through 19n and Alameda County did not report for 1975 and 1976.
Dismissed acquitted Convicted
18.3 70.4 14.1 70.3 13.8 64.4
15.6 65.5 14.9 60.9 15.7 57.8 16.0 56.8 15.4 57.3
15.6 58.3 16.4 57.2 16.5 55.5 16.9 54.7 17.6 56.8
18.9 55.8 18.5 57.1 19.7 56.6 20.9 56.5 24.0 55.6
29.6 48.4
The recorded number of total felony arrest dispositions in 1993 Is lower than normal because of budget constraints that have created backlogs in disposition document processing at the Department of Justice.
1 Complaints denied includes single complaints, combined cases, and petnions to revoke probation.
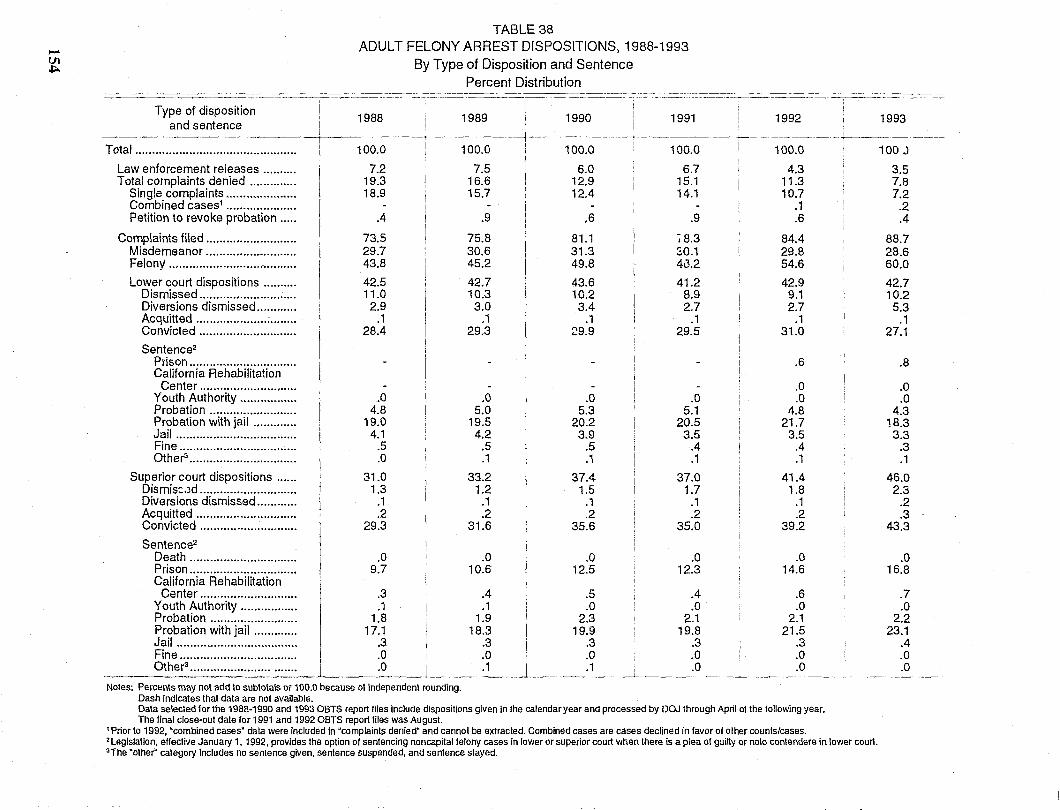
~
Ul J;;o.
TABLE3B ADULT FELONY ARREST DISPOSITIONS, 1988-1993
By Type of Disposition and Sentence Percent Distribution
--~~~------------.---~-.----~-----------~~--.----- .--------------------~.-.-~--- ----------------------'---- -- ~----~-~----~-
Type of disposition and sentence
1988 1989 1990 1991 1992 1993 ,
~-------+-- --+---~ ----~-----~-----
Total .................. " ........................... . 100.0 I 100.0 100.0 100.0 100.0
Law enforcement releases ......... . 7.2 7.5 6.0 6.7 4.3 Total complaints denied ............. .
Single complaints .................... . Combined cases1 .................... .
19.3 16.6 12.9 15.1 18.9 15.7 12.4 14.1
11.3 10.7
.1 Petition to revoke probation ... .. .4 .9 .6 .9 .6
Complaints filed ......................... .. 73.5 75.8 81.1 i8.3 84.4 Misdemeanor .......................... . 29.7 30.6 31.3 ::.0.1 29.8 Felony .................................... .. 43.8 45.2 49.8 413.2 54.6
Lower court dispositions ......... . Dismissed ............................ .
42.5 42.7 43.6 41.2 11.0 10.3 10.2 8.9
42.9 9.1
Diversions dismissed ........... . 2.9 3.0 3.4 2.7 2.7 Acquitted ............................. . .1 .1 .1 .1 .1 Convicted ............................ . 28.4 29.3 29.9 29.5 31.0
Sentence2
Prison .......................... " .. .. .6 California Rehabilitation
Center ............................ . .0 Youth Authority ................ . Probation ......................... .
.0 .0 .0 .0 4.8 5.0 5.3 5.1
.0 4.8
Probation with jail ............ . Jail ................................... .
19.0 19.5 20.2 20.5 4.1 4.2 3.9 3.5
21.7 3.5
Fine ................................. .. .5 .5 .5 .4 .4 Other3
............................... . .0 .1 .1 .1 .1
Superior court dispOSitions .... .. Dismis::.)d ............................ .
31.0 33.2 37.4 37.0 1.3 1.2 1.5 1.7
41.4 1.8
Diversions dismissed .......... .. .1 .1 .1 .1 .1 Acquitted ............................ .. Convicted ........................... ..
.2 .2 .2 .2 29.3 31.6 35.6 35.0
.2 39.2
Sentence2
Death .............................. .. .0 .0 .0 .0 .0 Prison .............................. .. 9.7 10.6 12.5 12.3 14.6 California Rehabilitation
Center ............................ . .3 .4 .5 .4 .6 Youth Authority ................ . Probation ......................... .
.1 .1 .0 .0 1.8 1.9 2.3 2.1
.0 2.1
Probation with jail ........... .. Jail .................................. ..
17.1 18.3 19.9 19.8 .3 .3 .3 .3
21.5 .3
Fine .................................. . .0 .0 .0 .0 .0 Other3 .............................. . .0 .1 .1 i .0 .0
-L----
Notes: Percents may not add to subtotals Of 100.0 because 01 independent rounding. Dash Indicates that data are not available. Data selected lor the 1988-1990 and 1993 09TS report files include dispositions given In the calendar year and processed by DOJ through April 01 the following year. The I1nal close-out date for 1991 and 1992 09TS report files was August.
t Prior to 1992, 'comblned cases' data were included in 'complaints denied' and cannot be extracted. Combined cases are cases declined in favor of other counts/cases. ~ Legislation, effective January 1, 1992, provides the option 01 sentencing noncapilalfelony cases In lower or superior court wl1en there is a plea of gul"y or noto contendere in lower court. 'The 'other" category Includes no sentence given, sentence suspended, and sentence stayed.
100 J
3.5 7.8 7.2
.2
.4
88.7 28.6 60.0
42.7 10.2
5.3 .1
27.1
.8
.0
.0 4.3
18.3 3.3
.3
.1
46.0 2.3
.2
.3 43.3
.0 16.8
.7
.0 2.2
23.1 .4 .0 .0
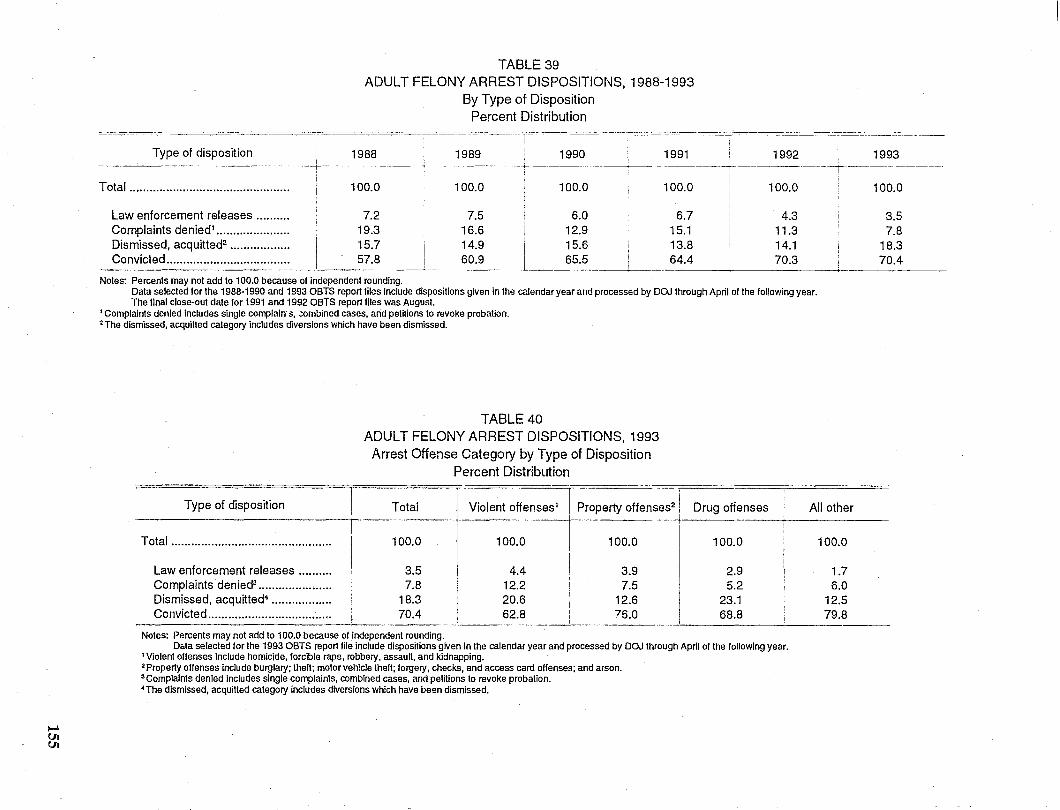
)oool
til til
TABLE 39 ADULT FELONY ARREST DISPOSITIONS, 1988-1993
By Type of Disposition Percent Distribution
------~"---. -------~--.--.----~- ---------_.~-------"- -_._---"---- ------- -- -- "-----------_.- -.-~---------~-----~-.-----------------.-~--------.-~--------- --------- -- -- 1------~-.--~------- ---.----- ---------~-- ------- --------------
Type of disposition . 1988 1989 1990 1991 1992 1993 I . . .
--,--------+------------+- ~------.--------------r----.------_r------.---_r_.----.-----
: I , , I .
Total ............................................... . i 100.0 ' 100.0 : 100.0 ' 100.0 I 100.0 : 100.0
Law enforcement releases ......... . Complaints denied1 ••••••••••••••••••••••
Dismissed, acquitted2 ................. .
Convicted ................................... ..
i I i
I
7.2 19.3 15.7 57.8
Notes: Percents may not add to 100.0 because of independent rounding.
7.5 16.6 14.9 60.9
6.0 12.9 15.6 65.5
6.7 15.1 13.8 64.4
4.3 11.3 14.1 70.3
Data selected for the 1988·1990 and 1993 08TS report files Include dispositions given in the calendar year and processed by DOJ through April of the following year. The finai close·out date for 1991 and 1992 08TS report files was August.
1 Complaints denied includes single complalrr s, .:ombined cases, and pemions to revoke probation. 'The dismissed, acquitted category includes diversions which have been dismissed.
TABLE 40 ADULT FELONY ARREST DISPOSiTIONS, 1993
Arrest Offense Category by Type of Disposition Percent Distribution
Type of disposition ! Total Violent offenses 1 I Property offenses2 i Drug offenses All other I - I I
Total ................................................ 100.0 100.0 100.0 I 100.0
Law enforcement releases .......... 3.5 4.4 I 3.9 I 2.9 Complaints denied3
...................... 7.8 12.2 I 7.5 i 5.2 Dismissed, acquitted4 .................. 18.3 20.6 I 12.6 23.1 Convicted ..................................... 70.4 62.8 I 76.0 68.8
Notes: Percents may not add to 100.0 because of independent rounding. Data selected for the 1993 08TS report liIe include dispositions given in the calendar year and processed by DOJ through April of the following year.
1 Violent offenses Include homicide, forcible rape, robbery, assaun, and kidnapping. 2 Property offenses include burglary; theft; motor vehicle theft; forgery, checks, and access card offenses; and arson. o Complaints denied includes single complaints, combined cases, and petitions to revoke probation. • The dismissed, acquitted category Includes diversions which have been dismissed.
100.0
1.7 6.0
12.5 79.8
3.5 7.8
18.3 70.4
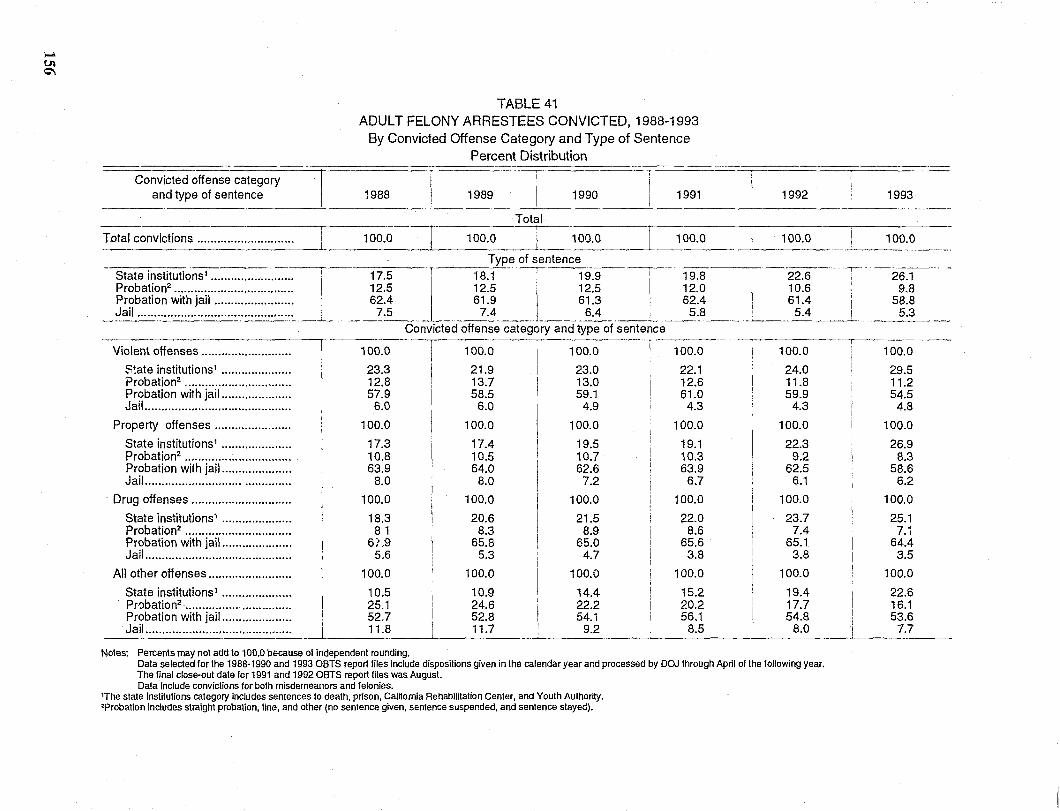
)"""
UJ
'"
-Convicted offense category
and type of sentence
TABLE 41 ADULT FELONY ARRESTEES CONVICTED, 1988-1993
By Convicted Offense Category and Type of Sentence Percent Distribution
i 1990 1991 1988 1989 I
---------------------~------Total
Total convictions ............................. 100.0 100.0 100.0 I 100.0
Type of sentence
1992
100.0
State institutions 1 ........................ . 1--- 17.5 - ---------r-~- 18.1---1 19.9 ------,--
Probation2 ................................... .
Probation with jail ....................... . Jail ............................................. ..
I 12.5 12.5 12.5
I 62.4 61.9 61.3 ~5 ~4 ~4
--------------------------~---- Convicted offense category and type of sentence
Violent offenses ......................... .. - I
1~0 1~0 1~0 .
8tate institutions1 ................... .. 23.3 21.9 23.0 ?robation2
.............................. .. 12.8 13.7 13.0 Probation with jail ................... .. Jail ........................................... .
57.9 58.5 59.1 6.0 6.0 4.9
Property offenses ..................... .. 100.0 100.0 100.0
State institutions1 .................... . 17.3 17.4 19.5 Probation2 .............................. .. 10.8 10.5 10.7 Probation with jail .................... . Jail ....... , .................................. .
63.9 64.0 62.6 8.0 8.0 7.2
Drug offenses ............................. . 100.0 100.0 100.0
State institutions1 .................... . 18.3 20.6 21.5 Probation2 ............................... . 81 8.3 8.9 Probation with jail ................... .. Jail ........................................... .
67.9 65.8 65.0 5.6 5.3 4.7
All other offenses ....................... .. 100.0 100.0 100.0
State institutions1 .................... . 10.5 10.9 14.4 Probation2
............................... . 25.1 24.6 22.2 Probation with jail .................... . 52.7 52.8 54.1 Jail .......................................... .. 11.8 11.7 9.2
Notes: Percents may nol add 10100.0 because of independent rounding.
19.8 12.0 62.4 5.8
100.0
22.1 12.6 61.0
4.3
100.0
19.1 10.3 63.9
6.7
100.0
22.0 8.6
65.6 3.8
100.0
15.2 20.2 56.1
8.5
22.6 10.6 61.4
5.4
100.0
24.0 11.8 59.9
4.3
100.0
22.3 9.2
62.5 6.1
100.0
23.7 7.4
65.1 3.8
100.0
19.4 17.7 54.8
8.0
Data selected lor the 1988-1990 and 1993 OBTS report files include dispositions given in the calendar year and processed by DOJ through April of the following year. The linal close-out date lor 1991 and 1992 OBTS report files was August. Data include convictions lor both misdemeanors and lelonies.
'The state institutions category includes semences to death, prison, CalifornIa Rehabilitation Center, and Youth Authorfty. 'Probation includes straight probation, line, and other (no sentence given, sentence suspended, and sentence stayed).
-,----
1993
100.0
26.1 9.8
58.8 5.3
100.0
29.5 11.2 54.5
4.8
100.0
26.9 8.3
58.6 6.2
100.0
25.1 7.1
64.4 3.5
100.0
22.6 16.1 53.6
7.7
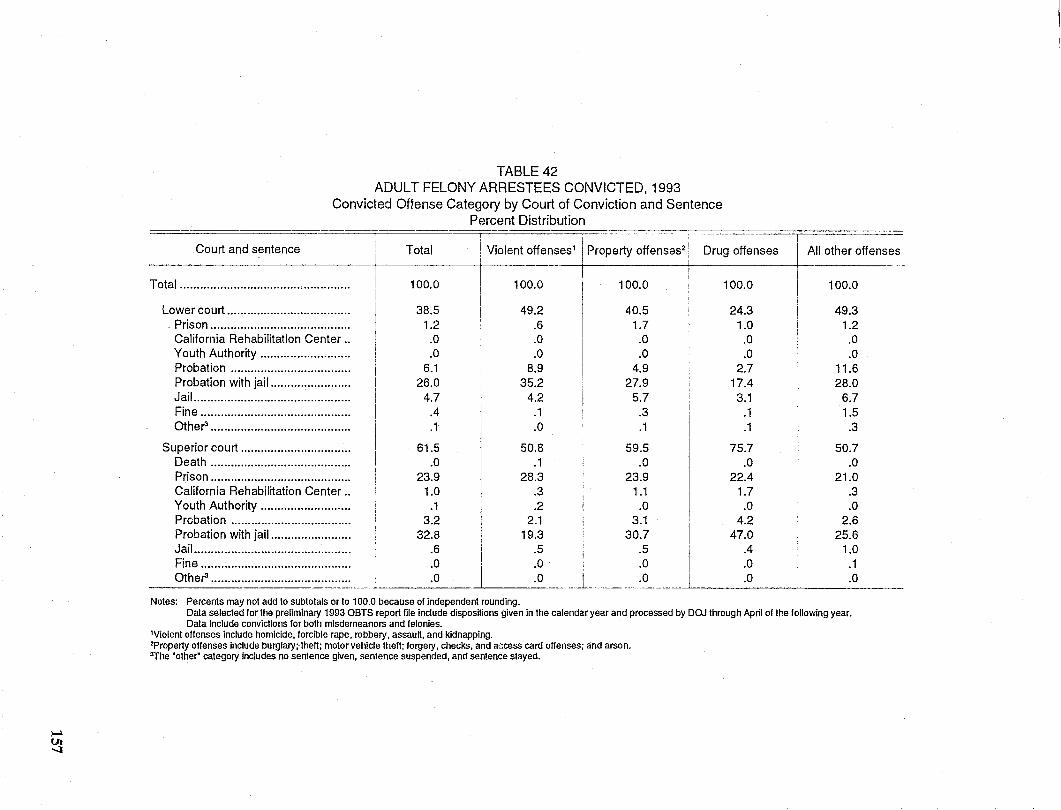
~
~
TABLE 42 ADULT FELONY ARRESTEES CONVICTED, 1993
Convicted Offense Category by Court of Conviction and Sentence Percent Distribution
Court and sentence
Total .................................................. .
Lower court .................................... . Prison ......................................... . California Rehabilitation Center .. Youth Authority .......................... . Probation ................................... . Probation with jail ...................... .. Jail ............................................. .. Fine ............................................ . Othefl ......................................... .
Superior court ............................... .. Death ......................................... . Prison ......................................... . California Rehabilitation Center .. Youth Authority .......................... . Probation .................................. .. Probation with jail ...................... .. Jail .............................................. . Fine ............................................ . Othefl ........................................ ..
• I ! Total Violent offenses' I Property offenses2 Drug offenses T
100.0
38.5 1.2
.0
.0 6.1
26.0 4.7
.4
.1
61.5 .0
23.9 1.0
.1 3.2
32.8 .6 .0 .0
100.0
49.2 .6 .0 .0
8.9 35.2
4.2 .1 .0
100.0
40.5 1.7 .0 .0
4.9 27.9
5.7 .3 .1
100.0
24.3 1.0
.0
.0 2.7
17.4 3.1
.1
.1
50.8 59.5 75.7 .1 .0 .0
28.3 23.9 22.4 .3 1.1 1.7 .2 .0 .0
2.1 3.1 4.2 19.3 30.7 47.0
.5 .5 .4
.0 .0 .0
.0 .0 .0
Notes: Percents may not add to subtotals or to 100.0 because of independent rounding.
All other offenses
100.0
49.3 1.2
.0
.0 11.6 28.0
6.7 1.5 .3
50.7 .0
21.0 .3 .0
2.6 25.6
1.0 .1 .0
Data selected for the preliminary 1993 OBTS report file include dispositions given in the calendar year and processed by DOJ through April of the following year. Data Include convictions for both misderneanors and felonies.
'Violent offenses include homicide, forcible rape, robbery, assautt, and kidnapping. 'Property offenses include burglary; theft; motor vehicle theft; forgery, checks, and a,~cess card offenses; and arson. "The ·other· category Includes no sentence given, sentence suspended, and sentence stayed.
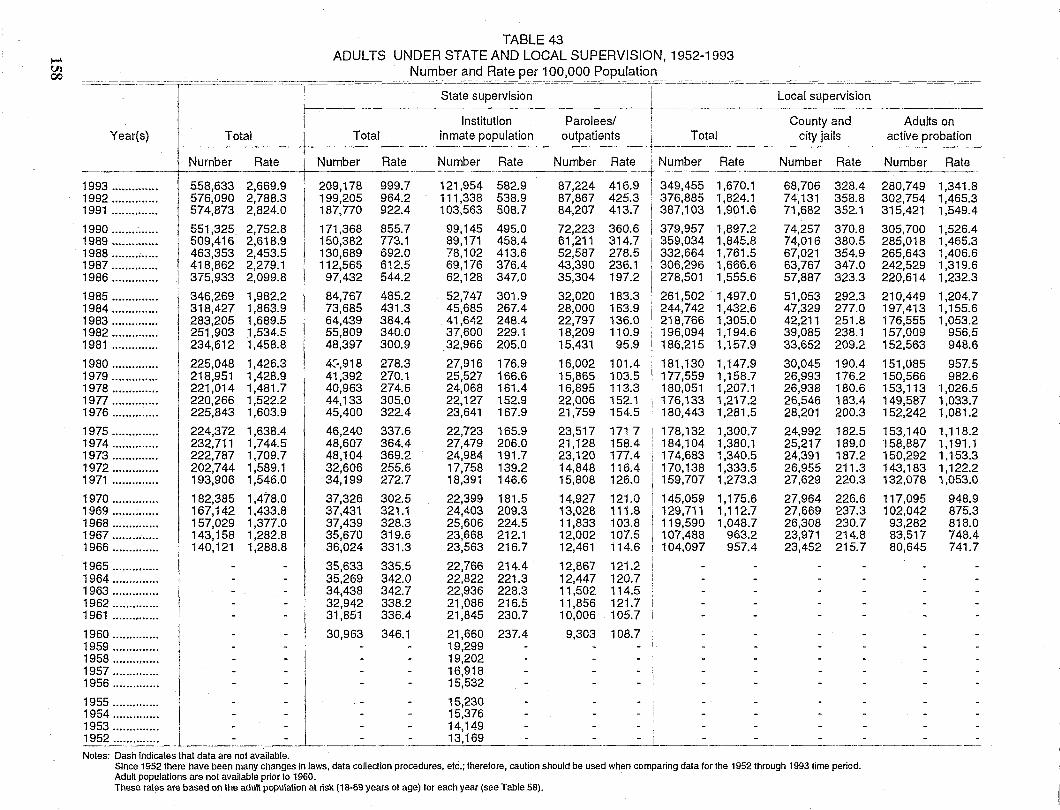
TABLE 43
...... ADULTS UNDER STATE AND LOCAL SUPERVISION, 1952-1993 Ul Number and Rate per 100,000 Population 00
c=-==~~-=l==--=-=.c=-===~~~==-~-====='~"~----~~7; su~ervisjo~ --c='~i--=-===-~-'-==_-=C Local supervision
---~~-~--"------"-"~----~---~~-- ~--r--- ----~-----~--~~- -------
! ,
Institution Parolees/ I County and Adults on Year(s) Total ~ Total inmate population outpatients i Total city jails active probation
~----- -+------~--.----------------
Number Rate Number Rate Number Rate Number Rate ~umber Rate Number Rate Number Rate
1993 .............. 558,633 2,669.9 I 209,178 999.7 121,954 582.9 87,224 416.9 ; 349,455 1,670.1 68,706 328.4 280,749 1,341.8 1992 .............. 576,090 2,788.3 199,205 964.2 111,338 538.9 87,867 425.3 . 376,885 1,824.1 74,131 358.8 302,754 1,465.3 1991 .............. 574,873 2,824.0 187,770 922.4 103,563 508.7 84,207 413.7 387,103 1,901.6 71,682 352.1 315,421 1,549.4
1990 .............. 551,325 2,752.8 171,368 855.7 99,145 495.0 72,223 360.6 379,957 1,897.2 74,257 370.8 305,700 1.526.4 1989 .............. 509,416 2,618.9 150,382 773.1 89,171 458.4 61,211 314.7 359,034 1,845.8 74,016 380.5 285,018 1,465.3 1988 .............. 463,353 2,453.5 130.689 692.0 78,102 413.6 52,587 278.5 332,664 1,761.5 67,021 354.9 265.643 1,406.6 1987 .............. 418,862 2,279.1 112,566 612.5 69,176 376.4 43,390 236.1 306,296 1,666.6 63,767 347.0 242,529 1,319.6 1986 .............. 375,933 2,099.8 97,432 544.2 62,128 347.0 35,304 197.2 278,501 1,555.6 57,887 323.3 220,614 1,232.3
1985 .............. 346,269 1,982.2 84,767 485.2 52,747 301.9 32,020 183.3 261,502 1,497.0 51,053 292.3 210,449 1,204.7 1984 ....... m .... 318,427 1,863.9 73,685 431.3 45,685 267.4 28,000 163.9 244,742 1,432.6 47,329 277.0 197,413 1,155.6 1983 .............. 283,205 1,689.5 64,439 384.4 41,642 248.4 22,797 136.0 218,766 1,305.0 42,211 251.8 176,555 1,053.2 1982 .............. 251,903 1,534.5 55,809 340.0 37,600 229.1 18,209 110.9 196,094 1,194.6 39,085 238.1 157,009 956.5 1981 .............. 234,612 1,458.8 48,397 300.9 32,966 205.0 15,431 95.9 186,215 1,157.9 33,652 209.2 152,563 948.6
1980 .............. 225,048 1,426.3 4~·,918 278.3 27,916 176.9 16,002 101.4 181,130 1,147.9 30,045 190.4 151,085 957.5 1979 .............. 218,951 1,428.9 41,392 270.1 25,527 166.6 15,865 103.5 177,559 1,158.7 26,993 176.2 150,566 982.6 1978 .............. 221,014 1,481.7 40,963 274.6 24,068 161.4 16,895 113.3 180,051 1,207.1 26,938 180.6 153,113 1,026.5 1977 .............. 220,266 1,522.2 44.133 305.0 22,127 152.9 22,006 152.1 176.133 1.217.2 26,546 183.4 149,587 1,033.7 1976 .............. 225,843 1,603.9 45,400 322.4 23,641 167.9 21,759 154.5 180,443 1,281.5 28,201 200.3 152,242 1,081.2
1975 .............. 224,372 1,638.4 46,240 337.6 22,723 165.9 23,517 1717 178,132 1,300.7 24,992 182.5 153,140 1,118.2 1974 .............. 232,711 1,744.5 48,607 364.4 27,479 206.0 21,128 158.4 184,104 1,380.1 25,217 189.0 158,887 1,191.1 1973 .............. 222,787 1,709.7 48,104 369.2 24.984 191.7 23,120 177.4 174,683 1,340.5 24,391 187.2 150,292 1,153.3 1972 .............. 202,744 1,589.1 32,606 255.6 17,758 139.2 14,848 116.4 170,138 1,333.5 26,955 211.3 143,183 1,122.2 1971 .............. 193,906 1,546.0 34,199 272.7 18,391 146.6 15,808 126.0 159,707 1,273.3 27,629 220.3 132,078 1,053.0
197O ....... , ...... 182,385 1,478.0 37,326 302.5 22,399 181.5 14,927 121.0 145,059 1,175.6 27,964 226.6 117,095 948.9 1969 .............. 167,142 1,433.8 37,431 321.1 24,403 209.3 13,028 111.8 129,711 1,112.7 27,669 237.3 102,042 875.3 1968 ....... , ...... 157,029 1,377.0 37,439 328.3 25,606 224.5 11,833 103.8 119,590 1,048.7 26,308 230.7 93.282 818.0 1967 .............. 143,158 1,282.8 35,670 319.6 23,668 212.1 12,002 107.5 107,488 963.2 23,971 214.8 83,517 748.4 1966 .............. 140,121 1,288.8 36,024 331.3 23,563 216.7 12,461 i 14.6 104,097 957.4 23,452 215.7 80,645 741.7
1965 .............. 35,633 335.5 22,766 214.4 12,867 121.2 1964 .............. 35,269 342.0 22,822 221.3 12,447 120.7 1963 .............. 34,438 342.7 22,936 228.3 11,502 114.5 1962 .............. 32,942 338.2 21,086 216.5 11,856 121.7 1961 ....... , ...... 31,851 336.4 21,845 230.7 10,006 105.7
1960 .............. 30,963 346.1 21,660 237.4 9,303 108.7 1959 .............. 19,299 - ! 1958 .............. 19,202 1957 .............. 16,918 1956 .............. 15,532
1955 .............. 15,230 1954 .............. 15,376 1953 .............. 14.149 1952 .............. 13,169 _~_-~i __ ~~ ___ ~ _______ ~ _______ ~~ __ ~ ___
Notes: Dash indicates that data are not available. Since 1952 there have been many changes in laws, data collection procedures, etc.; therefore, caution should be used when comparing data for the 1952 through 1993 time period. Adutt populations are not available prlorl0 1960. These rates are based on the adult population at risk (18·69 years of age) lor each year (see Table 58).
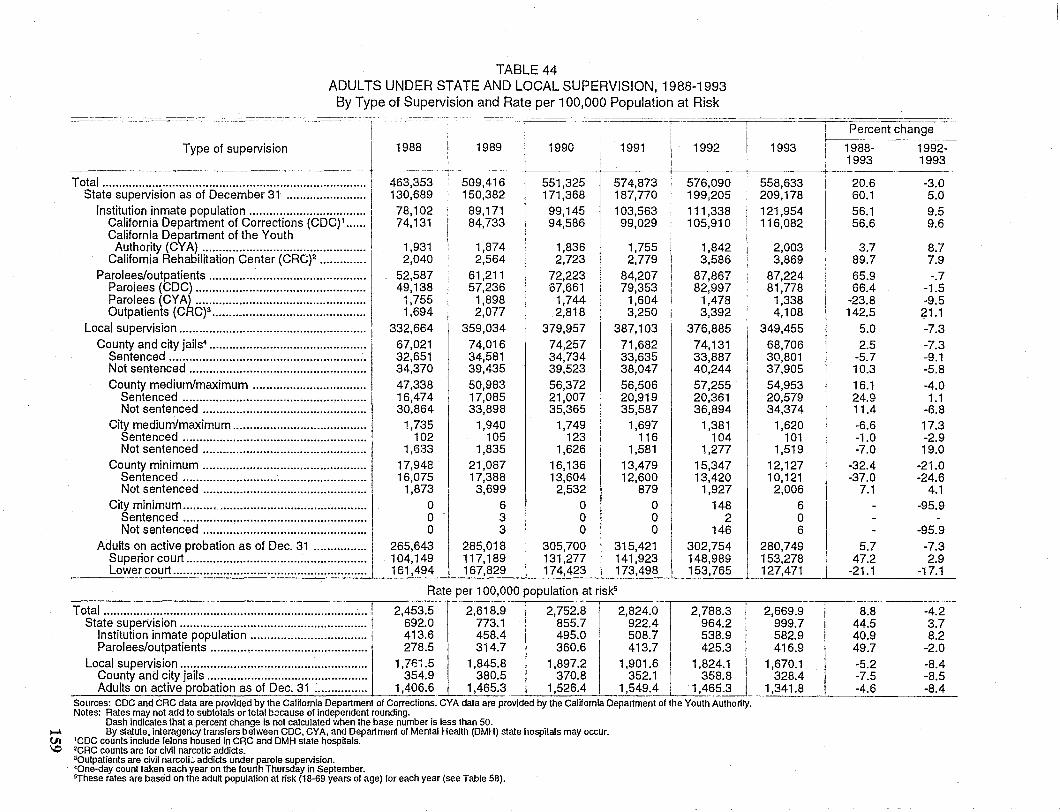
TABLE 44 ADULTS UNDER STATE AND LOCAL SUPERVISION, 1988-1993
By Type of Supervision and Rate per 100,000 Population at Risk =-----.. -------------~--::=----==--===-:..:~-==:.==-==--- I ~-~===---=-:.=--=--=-=---.-==--~--====-=--==-::-=-=---~ 1-- ·-=·-=-=---------=:::::;=-~~---·-r---:--:------======-~----- ~~------- --
I ! I Iii Percent change
TY. pe of supervision --+-1 1988 ; 1989 ! 1990 i 1 991 ~i 1992 I 1993 1988~~-199~ \ I 1 1993 1993
--~-~------- ------.- --------r------ - --.---- ---------Total ............................................................................... 1 463,353 509,416 551,325 I 574,873 I 576,090 II 558,633 20.6 -3.0
State supervision as of December 31 ........................ \ 130,689 150,382 171,368 I 187,770 199,205 209,178 60.1 5.0 Institution inmate population ................................... 1 78,102 89,171 99,145 I 103,563 111,338 I 121,954 56.1 9.5
CaliforniaDepartmentofCorrectionS(CDC)l ...... ! 74,131 84,733 94,586' 99,029 105,9101
116,082 56.6 9.6 California Department of the Vouth
Authority (CVA) ................................................. 1,931 1,874 1,836 1,755 1,842 I 2,003 3.7 8.7 California Rehabilitation Center (CRC)2 .............. 2,040 2,564 2,723 2,779 3,586 I 3,869 89.7 7.9
Parolees/outpatients ............................................... 52,587 61,211 72,223 84,207 87,867 87,224 65.9 -.7 Parolees (CDC) ................................................... 49,138 57,23667,661 79,353 82,997 81,778 66.4 -1.5 Parolees (CVA) ................................................... 1,755 1,898 1,744 1,604 1,478 1,338 -23.8 -9.5 Outpatients (Cf:lC)3.............................................. 1,694 2,077 2,818 3,250 3,392 4,108 142.5 21.1
Local supervision ........................................................ 332,664 359,034 379,957 387,103 376,885 349,455 5.0 -7.3 County and city jails4 ............................................... 67,021 74,016 74,257 71,682 74,131 68,706 2.5 -7.3
Sentenced ........................................................... 32,651 34,581 34,734 33,635 33,887 30,801 -5.7 -9.1 Not sentenced ..................................................... 34,370 39,435 39,523 38,047 40,244 37,905 10.3 -5.8 County medium/maximum .................................. 47,338 50,983 56,372 56,506 57,255 54,953 16.1 -4.0
Sentenced ....................................................... 16,474 17,085 21,007 20,919 20,361 20,579 24.9 1.1 Not sentenced ................................................. 30,864 33,898 35,365 35,587 36,894 34,374 11.4 -6.8
City medium/maximum ........................................ 1,735 1,940 1,749 1,697 1,381 1,620 -6.6 17.3 Sentenced ....................................................... 102 105 123 116 104 101 -1.0 -2.9 Not sentenced ................................................. 1,633 1,835 1,626 1,581 1,277 1,519 -7.0 19.0
County minimum ................................................. 17,948 21,087 16,136 13,479 15,347 12,127 -32.4 -21.0 Sentenced ....................................................... 16,075 17,388 13,604 12,600 13,420 10,121 -37.0 -24.6 Not sentenced ................................................. 1,873 3,699 2,532 879 1,927 2,006 7.1 4.1
City minimum ....................................................... I ° 6 ° ° 148 6 -95.9 Sentenced .. ..................... ................................ 0 3 0 0 2 0 Not sentenced ................................................. 0 3 0 0 146 6 -95.9
Adults on active probation as of Dec. 31 ................ 265,643 I 285,018 305,700 302,754 280,749 5.7 -7.3 Superior court ...................................................... 104,149 117,189 131,277 148,989 153,278 47.2 2.9 Lower court.......................................................... 161,494 167,829 174,423 153,765 127,471 -21.1 -17.1
Rate per 100,000 population at risJ<5
2,453.5 692.0 773.1 413.6 278.5
1,761.5 354.9
1,406.6
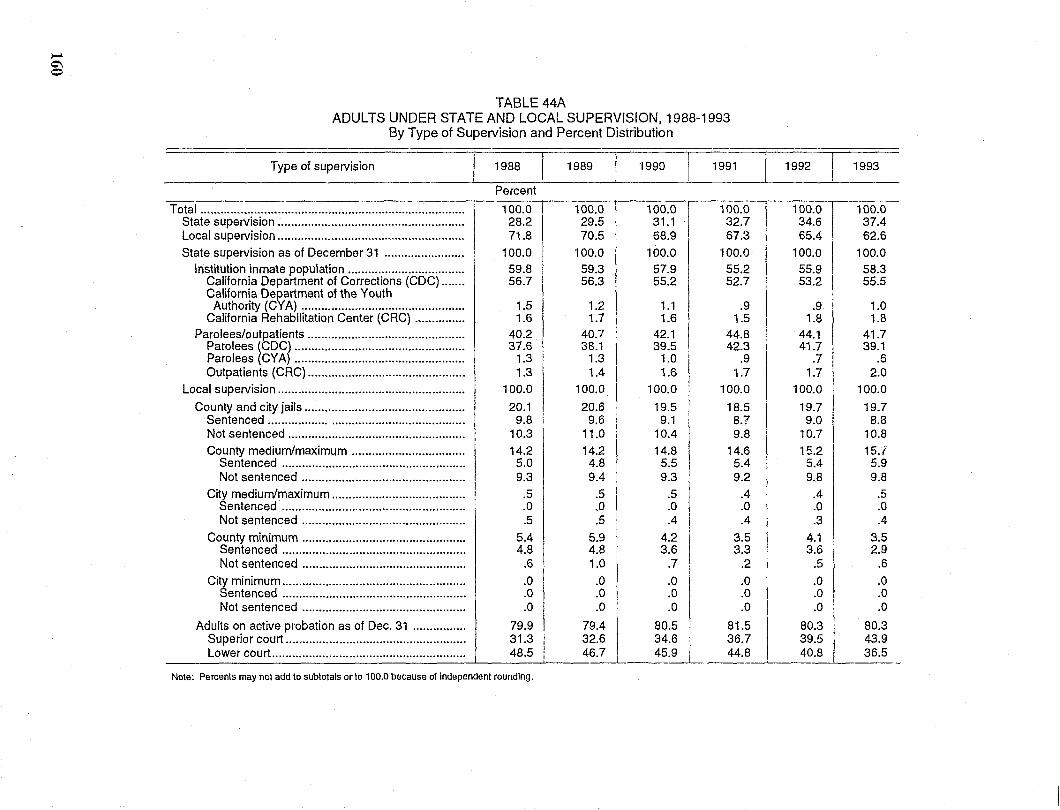
.... 0\ o
TABLE 44A ADULTS UNDER STATE AND LOCAL SUPERVISION, 1988-1993
By Type of Supervision and Percent Distribution
Type of supervision ,- . -~ 988-T· 1989 .1-1-9;0 --I 1991
Percent
Total ............................................................................... 100.0 100.0 100.0 100.0 State supervision ........................................................ 28.2 29.5 31.1 32.7 Local supervision ........................................................ 71.8 70.5 68.9 67.3 State supervision as of December 31 ........................ 100.0 100.0 100.0 100.0
Institution inmate population ................................... 59.8 59.3 57.9 55.2 California Department of Corrections (CDC) ....... 56.7 56.3 55.2 52.7
CA~i~~\~ ~Cy~~~~:.~~.:~~.~~~~~ ...................... 1.5 1.2 1.1 .9 California Rehabilitation Center (CRC) ............... 1.6 1.7 1.6 1.5
Parolees/outpatients ............................................... 40.2 40.7 42.1 44.8 Parolees (CDC) ................................................... 37.6 38.1 39.5 42.3 Parolees (CY A) ................................................... 1.3 1.3 1.0 .9 Outpatients (CRC) ............................................... 1.3 1.4 1.6 1.7
Local supervision ........................................................ 100.0 100.0 100.0 100.0
County and city jails ................................................ 20.1 20.6 19.5 18.5 Sentenced .......................................................... 9.8 9.6 9.1 8.? Not sentenced ..................................................... 10.3 11.0 10.4 9.8 County medium/maximum .................................. 14.2 14.2 14.8 14.6
Sentenced ....................................................... 5.0 4.8 5.5 5.4 Not sentenced ................................................. 9.3 9.4 9.3 9.2
City medium/maximum ........................................ .5 .5 .5 .4 Sentenced ....................................................... .0 .0 .0 .0 Not sentenced ................................................. .5 .5 .4 .4
County minimum ................................................. 5.4 5.9 4.2 3.5 Sentenced ....................................................... 4.8 4.8 3.6 3.3 Not sentenced ................................................. .6 1.0 .7 .2
City minimum ....................................................... .0 .0 .0 .0 Sentenced ....................................................... .0 .0 .0 .0 Not sentenced ................................................. .0 .0 .0 .0
Adults on active probation as of Dec. 31 ................ 79.9 79.4 80.5 81.5 Superior court ...................................................... 31.3 32.6 34.6 36.7 Lower court .......................................................... 48.5 46.7 45.9 44.8
Note: Percents may not add to sublotals orto 100.0 because of independent rounding.
1992 1993
100.0 100.0 34.6 37.4 65.4 62.6
100.0 100.0 55.9 58.3 53.2 55.5
.9 1.0 1.8 1.8
44.1 41.7 41.7 39.1
.7 .6 1.7 2.0
100.0 100.0
19.7 19.7 9.0 8.8
10.7 10.8 15.2 15.1
5.4 5.9 9.8 9.8
.4 .5
.0 .0
.3 .4 4.1 3.5 3.6 2.9
.5 .6
.0 .0
.0 .0
.0 .0
80.3 80.3 39.5 43.9 40.8 36.5
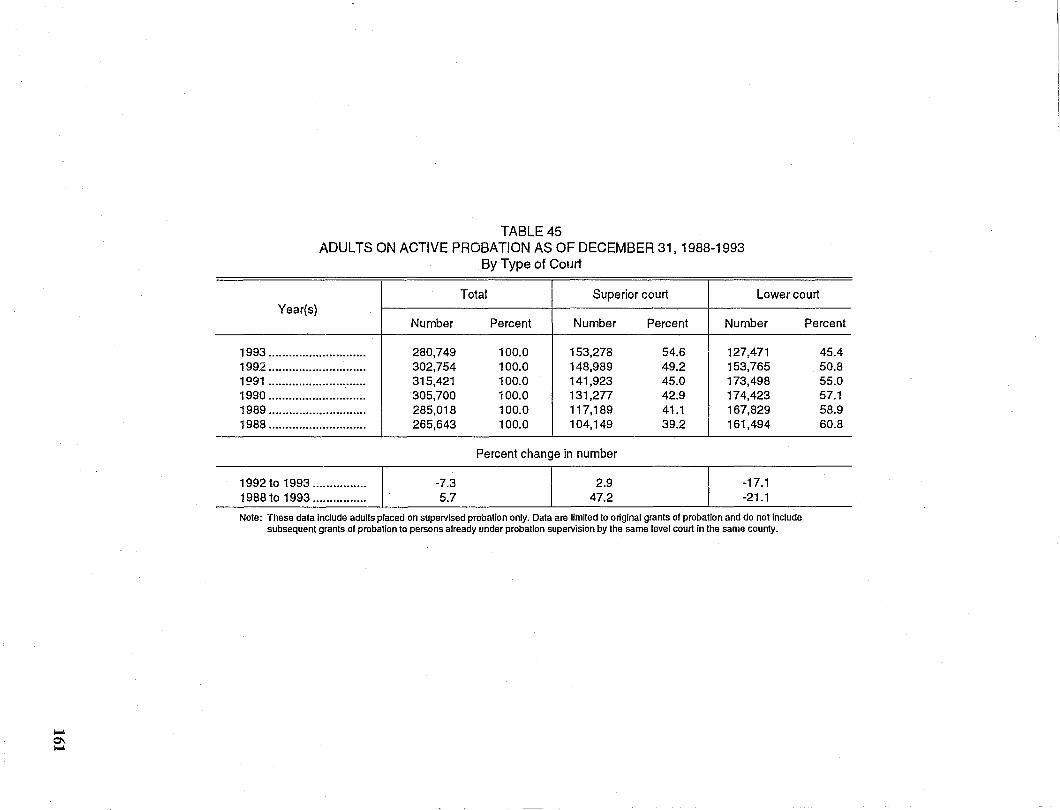
..... Q\ .....
TABLE 45 ADULTS ON ACTIVE PROBATION AS OF DECEMBER 31,1988-1993
By Type of Court
Total Superior court Lower court Year{s}
1993 ............................. 199.2 ............................. 1 £191 ............................. 1990 ............................. 1989 ............................. 1988 .............................
1992 to 1993 .............. .. 1988 to 1993 .............. ..
Number
280,749 302,754 315,421 305,700 285,018 265,643
-7.3 5.7
Percent Number
100.0 153,278 100.0 148,989 100.0 141,923 100.0 131,277 100.0 117,189 100.0 104,149
---
Percent change in number
2.9 47.2
Percent Number
54.6 127,471 49.2 153,765 45.0 173,498 42.9 174,423 41.1 167,829 39.2 161,494
------_ .. - ------
-17.1 -21.1
Note: These data indude adults placed on supervised probation only. Data are limited to original grants of probation and do not include subsequent grants 01 probation to persons already under probation supervision by the same level court in the same county •
Percent
45.4 50.8 55.0 57.1 58.9 60.8 ---
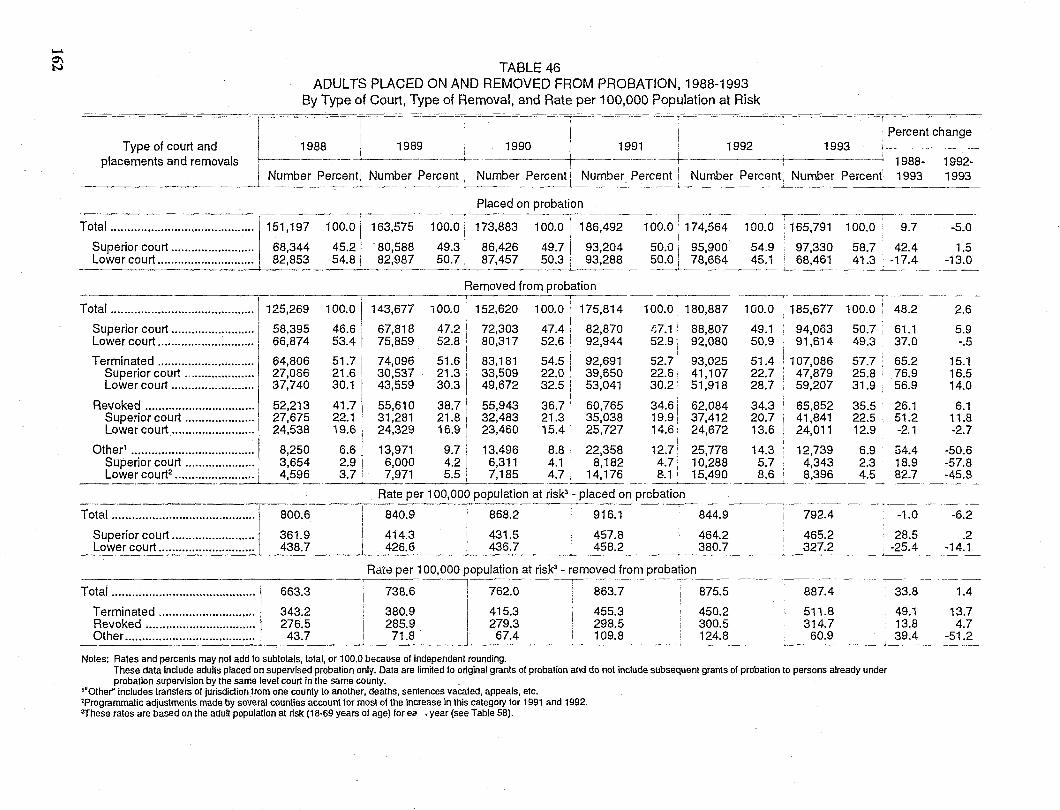
...... a-, N TABLE 46
ADULTS PLACED ON AND REMOVED FROM PROBATION, 1988-1993 By Type of Court, Type of Removal, and Rate per 100,000 Population at Risk
-~--==~=CC-_I~-=-=-=--~-~-===_=CC=---=_'CC_- ,,:=ccc-=-,,~-:====-,-;~-=---=-=-:~=-c--=---r---=-c.-c=.-==----=
i I ! . i Percent change Type of court and 1988 1989 1990 I 1991 1992. 1993
placements and removals I-t----~-----T 1 -----------+ i---: 1988- 1992-__________ ~ --.l Number Percent! Number~:rcent i_Number Percent! Number Pe~ce~t~umb~!_=~:~~s~umber~ercent! 199~~993
Placed on probation . ---,------------~-----~-----------,--------
Total ......................................... j. ' 151 ,197 100.0 I 163,575 100.0 i 173,883 100.0! 186,492 100.01
174,564 100.0' 165,791 100.0 9.7
Superior court ......................... 68,344 45.21 80,588 49.3 [i 86,426 49.7 I 93,204 50.0 I 95,900 54.~ 97,330 58.7 42.4 Lower court............................. 82,853 54.8 I 82,987 50.7
1 87,457 50.3! 93,288 50.0 i 78,664 45.1 68,461 41.3 -17.4
Removed from probation
-5.0
1.5 -13.0
Total ................. ·-.· ....................... 1125,269 100.°1143,677 100.0 1152,620 100.0 i 17-5-,8-14---1-00-.~~80,887 -.~--,----~-----~-----.-
Superior court ......................... j 58,395 46.6 i ~7,818 ~7.2! 72,303 47.4 1 82,870 a.1· 88,807 Lower court .............................
j
66,874 53.41 15,859 52.8 i 80,317 52.6 92,944 52.9 i 92,080
Termina!ed ............................. 64,806 51.7 I! 74,096 51.6 I 83,181 54.5 92,691 52.71
93,025 Superior court ..................... 27,066 21.6 I 30,537 21.3 I 33,509 22.0 39,650 22.6, 41,107 Lower court ......................... 37,740 30.1 I 43,559 30.3 I 49,672 32.5 i 53,041 30.21 51,918
I I I •
Revoked ................................. 52,213 41.7 \ 55,610 38.71
55,943 36.7! 60,765 34.6 62,084 Superior court ................... 1.· 27,675 22.1 I 31,281 21.8 i 32,483 21.3! 35,038 19.9. 37,412 Lower court ......................... 24,538 19.6 i 24,329 16.9 I 23,460 15.4: 25,727 14.6 I 24,672
Other' .. ;.................................. 8,250 6.6 j 13,971 9.7! 13.496 8.8 i. 22,358 12.7[ 25,778 Superior court ..................... 3,654 2.9 ! 6,000 4.2 I 6,311 4.1 I 8,182 4.7 , 10,288 Lower court2
........................ 4,596 3.7 I 7,971 5.5 I 7,185 4.7 i 14,176 8.1 I 15,490
Rate per 100,000 population at risk3 - placed on probation
-T-ot-a-l.-... -.. -... -.. -... -.. -... -.. -... -... -.. -... -.. -... -... -.. '.1--8-00-.-6-----.j--8-4-0.=---9 I 868.2 1 916.1
Superior court ......................... !" 361.9 [414.3 431.5 457.8 Lower court............................. 438.7) 426.6 436.7 458.2
Rd'ce per 100,000 population at risk3 - removed from probation
844.9
464.2 380.7
100.0 : 185,677
49.1 94,063 50.9 91,614
51.4 i 107,086 22.7 : 47,879 28.7 59,207
34.3 I
20.7 13.6
14.3 5.7 8.6
65,852 41,841 24,011
12,739 4,343 8.396
792.4
465.2 327.2
--------~-------------'I--~--------~--~-------,I------------~--
Total ........................................... I 663.3 738.6 '762.0 863.7 875.5 887.4
511.8 314.7
Terminated ............................. 1 343.2 380.9 415.3 455.3 450.2
100.0: 48.2
50.7 61.1 49.3 37.0
57.7 65.2 25.8. 76.9 31.9 56.9
35.5 26.1 22.5 51.2 12.9 -2.1
6.9 54.4 2.3 18.9 4.5 82.7
-1.0
28.5 -25.4
33.8
49.1 13.8 39.4
Revoked ................................. 1 276.5 285.9 279.3 298.5 300.5 Other....................................... 43.7 71.8 67.4 109.8 12~ ___ ~ ____ ~ ___ ~_ 60.9
Notes: Rates and percents may not add to subtotals, total, or 100.0 because of independent rounding. These data include adults placed on supervised probation only. Data are limned to original grants of probation and do not include subsequent grants of probation to persons already under probation supervision by the same level court in the same county.
"Other" includes transfers of jurisdiction from one county to another, deaths. sentences vacated, appeals, etc. 'Programmatic adjustments made by several counties account for most 01 the increase in this category lor 1991 and 1992. "These rates are based on the adutt population at risk (18·69 years of age) for ea ,year (see Table 58).
2.6
5.9 -.5
15.1 16.5 14.0
6.1 11.8 -2.7
-50.6 -57.8 -45.S
-6.2
.2 -14.1 -----
-~---~-
1.4
13.7 4.7
-51.2
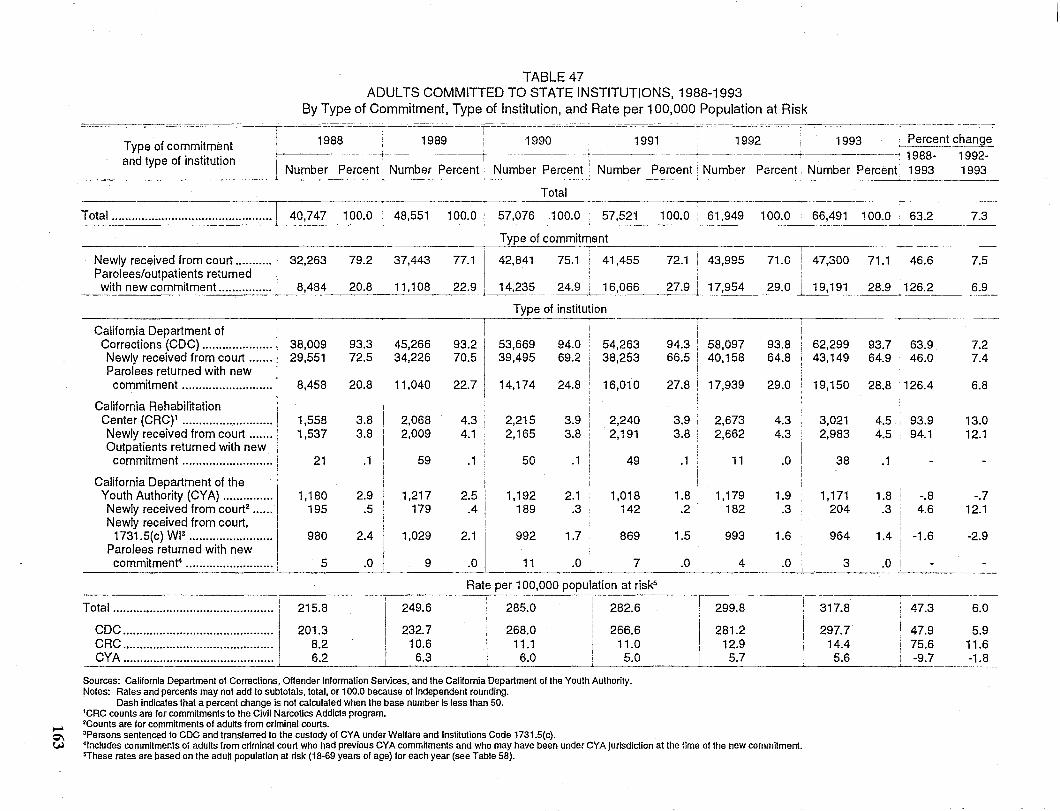
...... Q'\ ~
TABLE 47 ADULTS COMMITTED TO STATE INSTITUTIONS. 1988-1993
By Type of Commitment, Type of Institution. and Rate per 100,000 Population at Risk i ""'=,,==-===--,,--=-c=-=--==T'-=~=~CC-=-=c-=,-=c"-=C:C--====---===---=--===-=~-~c=--=="===----==_=-==c_==-c==-==-'-' === I 1988 1989 1990 1991 1992 1993 ~_ferce:_n.!.<:bange Type of commitment
and type of institution r -~-----:---------t----------+ '~,----'-'--------+- ----~ 1988- 1992-I Number Percent; Number Percent! Number Percent J Number Percent: Number Percent i Number Percent 1993 1993 . ___ ~ ______ ~---1-~ _________ L_~.
Total --------r~--~---,- .. ------ ----.-,---. ---------
Total ................................................ ! 40,747 100.0 48,551 100.0 i 57,076 100.0 57,521 100.0' 61,949 100.0 66,491 100.0 63.2 __________ -------'-______________ .L _~_~ ___ . ______ • __ . __ ~ __ _
Newly received from court ........... 32.263 Parolees/outpatients returned with new commitment ................ 8,484
California Department of Corrections (CDC) .................... . Newly received from court ...... . Parolees returned with new commitment ......................... ..
California Rehabilitation Center (CRC)1 ......................... .. Newly received from court ..... .. Outpatients returned with new
commitment ......................... ..
California Department of the Youth Authority (CYA) ............... 1 Newly received from court2 .... ..
Newly received from court, I 1731.5(c) WP ......................... I
Parolees returned with new I commitment' .......................... I
i Total ................................................ I
CDC ........................................... .. CRC ............................................ . CYA ............................................ .
38,009 29.551
8,458
1,558 1.537
21
1,180 195
980
5
215.8
201.3 8.2 6.2
79.2
20.8
93.3 72.5
20.8
3.8 3.8
.1
2.9 .5
2.4
.0
37,443
11,108
Type of commitment
42,841 77.1 I 22~ 14,235 24.9
,-- ---, 41,455 72.1! 43,995 71.0' 47,300 71.1 46.6
,
16,066 27.9 i 17,954 29.0 I 19.191 28.9: 126.2
75.1
Type of institution -~------~-~- ,
45.266 34.226
11,040
2,068 2,009
59
1,217 179
1.029
9
249.6
232.7 10.6
6.3
93.2 II
70.5 I
22.7 I
4.3 4.1
I
I
.1 !
2.5 .4
2.1
.0
53,669 39,495
14,174
2.215 2,165
50
1,192 189
992
11
94.0 54,263 69.2 38,253
24.8 16,010
3.9 2,240 3.8 2,191
.1 49
2.1 1.018 .3 142
1.7 I 869
.0 7
Rate per 100,000 population at riskS
285.0
268.0 11.1
6.0
282.6
266.6 11.0 5.0
94.3 : 58.097 66.5 i 40,158
27.8 I 17,939
3.9 2,673 3.8 2,662
.1 11
1.8 i 1,179 .2 ! 182
1.5 I 993
.0 ! 4
-----, I 299.8
93.8 64.8
29.0
4.3 4.3
.0
1.9 .3
1.6
.0
62,299 43,149
19.150
3,021 2.983
38
1,171 204
964
3
93.7 63.9 64.9 46.0
28.8 126.4
4.5 93.9 4.5 94.1
.1
1.8 i -.8 .3 4.6
1.4 -1.6
.0 I
317.8 47.3
281.2 297.7 47.9 12.9 14.4 75.6
5.7 5.6 i -9.7
7.3
7.5
6.9
7.2 7.4
6.8
13.0 12.1
-.7 12.1
-2.9
6.0
5.9 11.6 -1.8 ________________________ ~ __________ ~ ____________ ~ __________ ~ _____________ ~ __________ -L __________ ~ ______ __
Sources: California Department 01 Corrections, Offender Information Services, and the CalHornia Department of the Youth Authority. Notes: Rates and percents may not add to subtotals, total, or 100.0 because of independent rounding.
Dash indicates that a percent change is not calculated When the base number Is less than 50. 'CRC counts are for commitments to the Civil Narcotics Addicts program. 'Counts are for commitments of aduHs from criminal courts . 'Persons sentenced to CDC and transferred to the custody of CYA under Welfare and Institutions Code 1731.5(c). 'Includes commltmer.ls of adults from criminal court who had previous CY A commitments and who may have been under CYA Jurisdiction at the lime of the new commitment. 'These rates are based on the adun population at risk (18-69 years of age) lor each year (see Table 58).
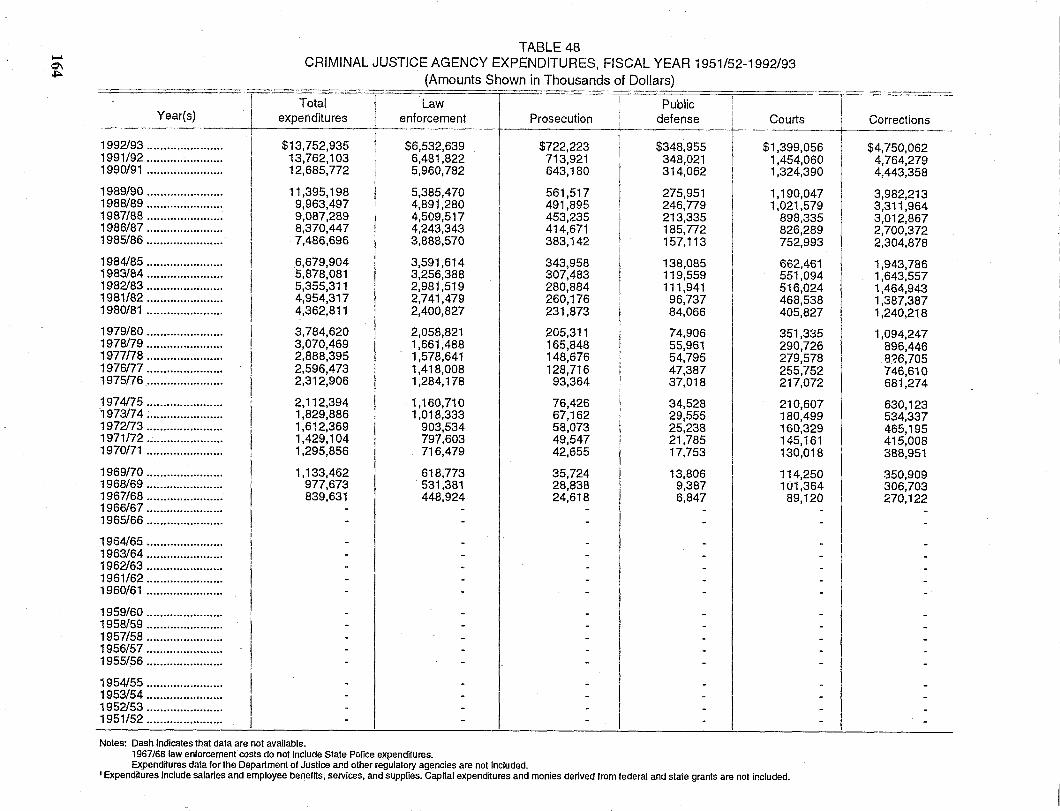
~
'" ,&::.
TABLE 48 CRIMINAL JUSTICE AGENCY EXPENDITURES, FISCAL YEAR 1951/52-1992193
(Amounts Shown in Thousands of Dollars)
Year(s) Total
Law 4-expenditures enforcement Prosecution
$13,752,935 $6,532,639 I $722,223 13,762,103 6,481,822 713,921 12,685,772 5,960,782 643,180
1992/93 ...................... . 1991/92 ...................... . 1990/91 ...................... .
11,395,198 5,385,470 561,517 9,963,497 4,891,280 491,895 9,087,289 4,509,517 453,235 8,370,447 4,243,343 414,671 7,486,696 3,888,570 383,142
1989/90 ...................... . 1988/89 ...................... . 1987/88 ..................... .. 1986/87 ...................... . 1985/86 ...................... .
6,679,904 3,591,614 343,958 5,878,081 3,256,388 307,483 5,355,311 2,981,519 280,884 4,954,317 2,741,479 260,176 4,362,811 2,400,827 231,873
1984/85 ...................... . 1983/84 ..................... .. 1982/83 ...................... . 1981/82 ...................... . 1980/81 ...................... .
3,784,620 2,058,821 205,311 3,070,469 1,661,488 165,848 2,888,395 1,578,641 148,676 2,596,473 1,418,008 128,716 2,312,906 1,284,178 93,364
1979/80 ...................... . 1978/79 ...................... . 1977/78 ..................... .. 1976/77 ...................... . 1975/76 ..................... ..
2,112,394 1,160,710 76,426 1,829,886 1,018,333 67,162 1,612,369 903,534 58,073 1,429,104 797,603 49,547 1,295,856 716,479 42,655
1974/75 ...................... . 1973/74 ..................... .. 1972/73 ...................... . 1971/72 ...................... . 1970/71 ..................... ..
1,133,462 618,773 35,724 977,673 531,381 28,838 839,631 448,924 24,618
1969/70 ...................... . 1968/69 ...................... . 1967/68 ...................... . 1966/67 ...................... . 1965/66 ...................... .
1964/65 ...................... . 1963/64 ...................... . 1962/63 ...................... . 1961/62 ..................... .. 1960/61 ..................... ..
1959/60 ...................... . 1958/59 ...................... . 1957/58 ..................... .. 1956/57 ..................... .. 1955/56 ...................... .
1954/55 ..................... .. 1953/54 ...................... . 1952/53 ...................... . 1951/52 ..................... ..
Notes: Dash indicates that data are not available. 1967/68 law enforcement costs do not include State POlice expendtlures. Expend»ures data for the Department of Justice and other regulatory agencies are not included.
I Public I defense I
--+-----I I $348,955 I
I 348,021 314,062
I 275,951 246,779 213,335 185,772 157,113
138,085 119,559 111,941
96,737 84,066
74,906 55,961 54,795 47,387 37,018
34,528 29,555 25,238 21,785 17,753
13,806 9,387 6,847
Courts
$1,399,056 1,454,060 1,324,390
1,190,047 1,021,579
898,335 826,289 752,993
662,461 551,094 516,024 468,538 405,827
351,335 290,726 279,578 255,752 217,072
210,607 180,499 160,329 145,161 130,018
114,250 101,364
89,120
1 ExpendHures include salaries and employee benetns, services, and supplies. Capnal expenditures and monies derived from federal and state grants are not included.
Corrections
$4,750,062 4,764,279 4,443,358
3,982,213 3,311,964 3,012,867 2,700,372 2,304,878
1,943,786 1,643,557 1,464,943 1,387,387 1,240,218
1,094,247 896,446
.B'-?6,705 746,610 681,274
630,123 534,337 465,195 415,008 388,951
350,909 306,703 270,122
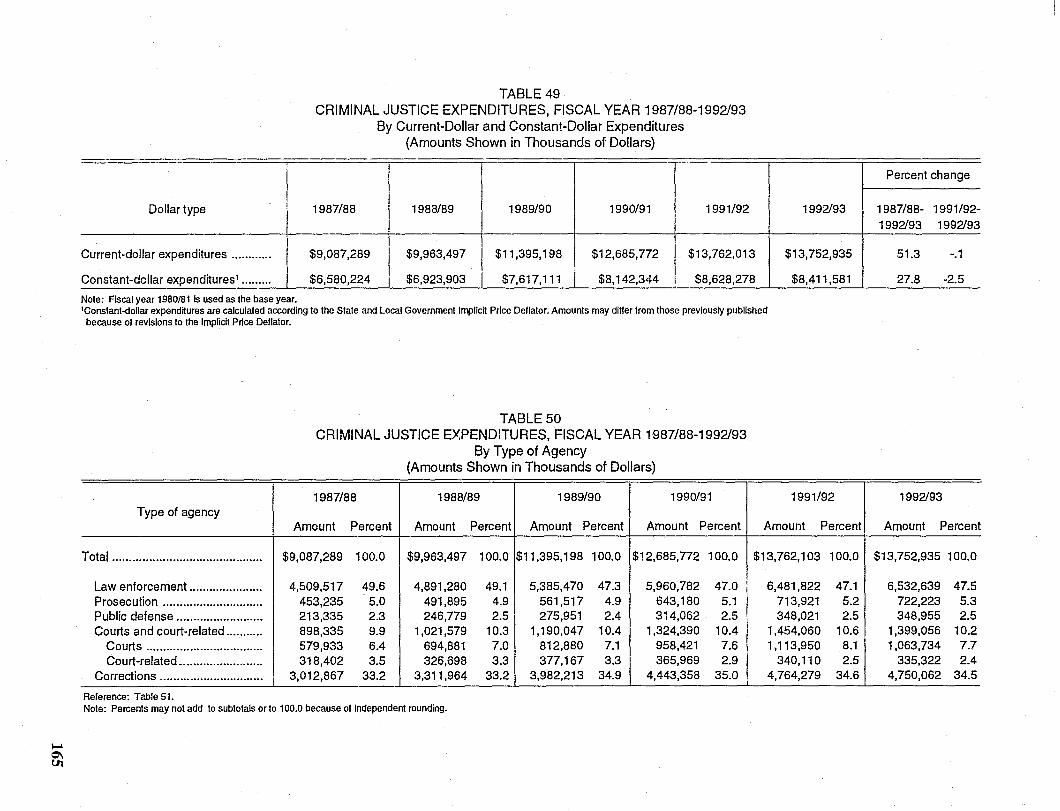
~
~
Dollar type
TABLE 49 CRIMINAL JUSTICE EXPENDITURES, FISCAL YEAR 1987/88-1992193
By Current-Dollar and Constant-Dollar Expenditures (Amounts Shown in Thousands of Dollars)
-- --- ----_ .. _--
1987/88 1988/89 1989/90 1990/91 1991/92 1992/93
Current-dollar expenditures ............ $9,087,289 $9,963,497 $11,395,198 $12,685,772 $13,762,013 $13,752,935
Constant-dollar expend~uresl ......... $6,580,224 $6,923,903 $7,617,111 l $8,142,344 __ ~~~~8,278 _ ,---~411,5~ -- - ---- ---_ .. - --- --- - ---- -_ ... -------
Note: Fiscal year 1980/81 is used as the base year. 'Constant·dollar expendnures are calculated according to the State and Local Government Impllcn Price Deflator. Amounts may diHer from those previously published
because of revisions to the Implidt Price Dellator.
Type of agency
Total .............................................
Law enforcement ...................... Prosecution .............................. Public defense .......................... Courts and court-related ...........
Courts ................................... Court-related •........................
Corrections ............................... --
Reference: Table 51.
TABLE 50 CRIMINAL JUSTICE EXPENDITURES, FISCAL YEAR 1987/88-1992193
By Type of Agency (Amounts Shown in Thousands of Dollars)
1987/88 1988/89 1989/90 1990/91
Amount Percent Amount Percent Amount Percent Amount Percent
$9,087,289 100.0 $9,963,497 100.0 $11,395,198 100.0 $12,685,772 100.0
4,509,517 49.6 4,891,280 49.1 5,385,470 47.3 5,960,782 47.0 453,235 5.0 491,895 4.9 561,517 4.9 643,180 5.1 213,335 2.3 246,779 2.5 275,951 2.4 314,062 2.5 898,335 9.9 1,021,579 10.3 1,190,047 10.4 1,324,390 10.4 579,933 6.4 694,881 7.0 812,880 7.1 958,421 7.6 318,402 3.5 326,698 3.3 377,167 3.3 365,969 2.9
3,012,867 33.2 3,311,964 33.2 3,982,213 34.9 4,443,358 35.0 ------ --- ---
Note: Percents may not add to subtotals or to 100.0 because 01 Independent rounding.
1991/92
Amount Percent
$13,762,103 100.0
6,481,822 47.1 713,921 5.2 348,021 2.5
1,454,060 10.6 1,113,950 8.1
340,110 2.5 4,764,279 34.6
Percent change
1987/88- 1991/92-1992/93 1992/93
51.3 -.1
27.8 -2.5 - ---- ------_.-
1992/93
Amount Percent
$13,752,935 100.0
6,532,639 47.5 722,223 5.3 348,955 2.5
1,399,056 10.2 1,063,734 7.7
335,322 2.4 4,750,062 34.5
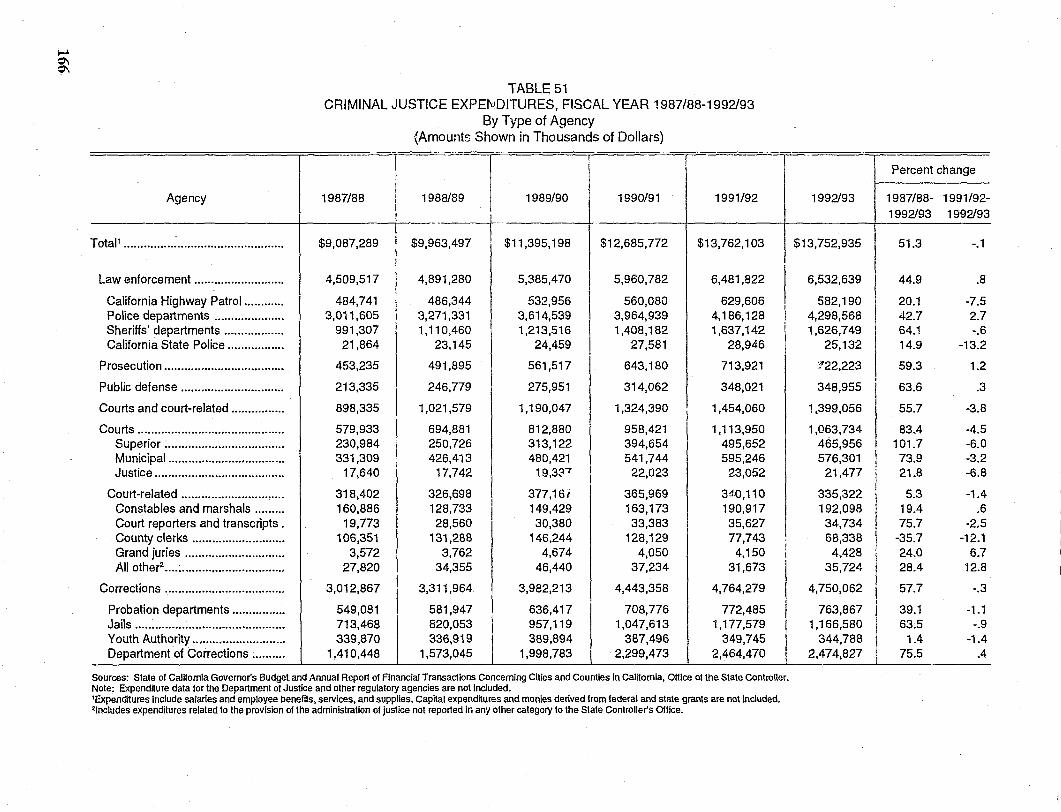
J-ol
~ TABLE 51
CRIMINAL JUSTICE EXPENDITURES, FISCAL YEAR 1987/88-1992193 By Type of Agency
(Amounts Shown in Thousands of Dollars) -----_ .. _------ ~- ------------ -~--.---.----- .. -----
Agency 1987/88 I 1988/89 1989/90 1990/91 1991/92
Total! ................................................ $9,087,289 $9,963,497 $11,395,198 $12,685,772 $13,762,103
Law enforcement ..•..................•..... 4,509,517 I 4,891,280 5,385,470 5,960,782 6,481,822
California Highway Patrol ............ 484,741 486,344 532,956 560,080 629,606 Police departments ..................... 3,011,605 3,271,331 3,614,539 3,964,939 4,186,128 Sheriffs' departments .................. 991,307 1,110,460 1,213,516 1,408,182 1,637,142 California State Police ................. 21,864 23,145 24,459 27,581 28,946
Prosecution .................................... 453,235 491,895 561,517 643,180 713,921
Public defense •.............................. 213,335 246,779 275,951 314,062 348,021
Courts and court-related ................ 898,335 1,021,579 1,190,047 1,324,390 1,454,060
Courts ............................................ 579,933 694,881 812,880 958,421 1,113,950 Superior .................................... 230,984 250,726 313,122 394,654 495,652 Municipal ................................... 331,309 426,413 480,421 541,744 595,246 Justice ....................................... 17,640 17,742 19,3~'1 22,023 23,052
Court-related ............................... 318,402 326,698 377,16i 365,969 3d.0,110 Constables and marshals ......... 160,886 128,733 149,429 163,173 190,917 Court reporters and transcripts. 19,773 28,560 30,380 33,383 35,627 County clerks ............................ 106,351 131,288 146,244 128,129 77,743 Grand juries .............................. 3,572 3,762 4,674 4,050 4,150 All other2 .................................... 27,820 34,355 46,440 37,234 31,673
Corrections .................................... 3,012,867 3,311,964 3,982,213 4,443,358 4,764,279
Probation departments ................ 549,081 581,947 636,417 708,776 772,485 Jails ............................................. 713,468 820,053 957,119 1,047,613 1,177,579 Youth Authority ............................ 339,870 336,919 389,894 387,496 349,745 Department of Corrections .......... 1,410,448 1,573,045 ,--~98,783_L ~299,~73 __ 2,464,470
- -- - ---------- - ------ ----_ ... - - L-______________ '-- --------- --
Sources; State of California Governor's Budget and Annual Report of Financial Transactions Concerning Cities and Counties in Caitlomia, Oitice otthe State Controller. Note: Expendnure data for the Department 01 Justice and other regulatory agencies are not induded. 'Expendnures include salaries and employee benetns, services, and supplies. Capital expenditures and monies derived from federal and stale grants are nol induded. 'Includes expenditures related to the provision of the administration 01 justice not reported In any other category to the Slate Controller'S Ofllce.
Percent change
1992193 1987/88- 1991/92-1992193 1992193
$13,752,935 51.3 -.1
6,532,639 44.9 .8
582,190 20.1 -7.5 4,298,568 42.7 2.7 1,626,749 64.1 -.6
25,132 14.9 -13.2
'/22,223 59.3 1.2
348,955 63.6 .3
1,399,056 55.7 -3.8
1,063,734 83.4 -4.5 465,956 101.7 -6.0 576,301 73.9 -3.2
21,477 21.8 -6.8
335,322 5.3 -1.4 192,098 19.4 .6
34,734 I
75.7 ·2.5 68,338 -35.7 -12.1
4,428 24.0 6.7 35,724 28.4 12.8
4,750,062 I 57.7 -.3 I
763,867 39.1 -1.1 1,166,580 63.5 -.9
344,788 1.4 -1.4 2,474,827 ~ 75.5 .4 -------~ ---_ ... _ ... _- - --- .-
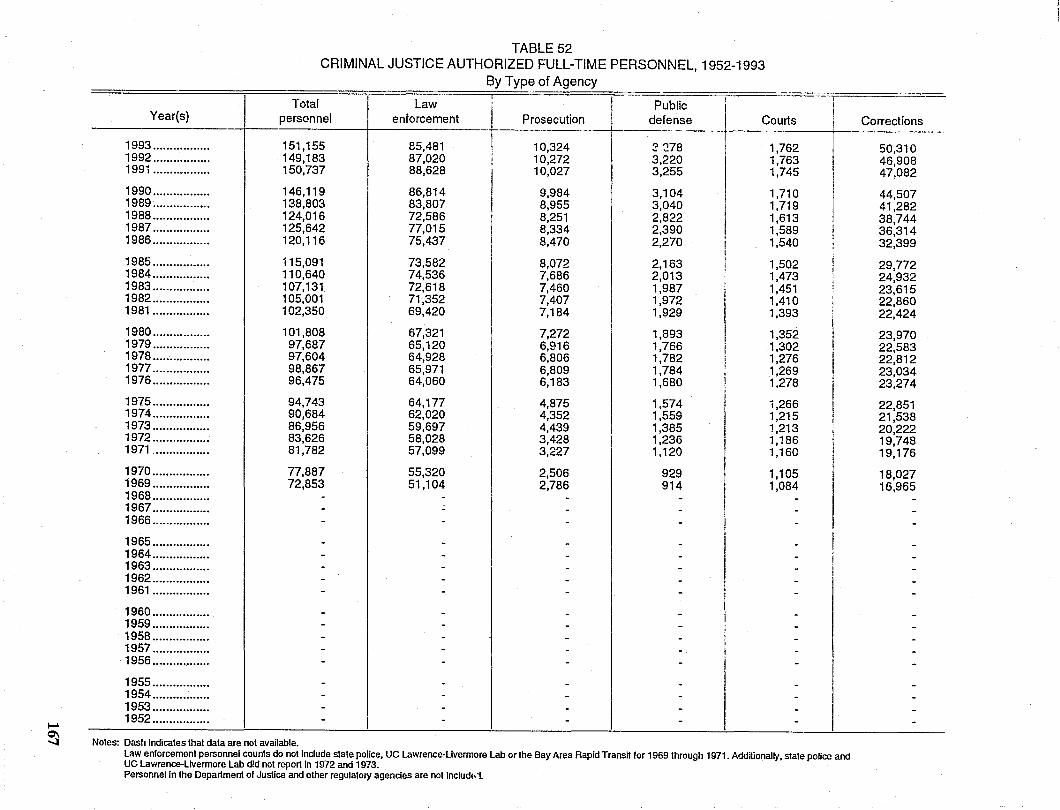
~
~
Total
TABLE 52 CRIMINAL JUSTICE AUTHORIZED FULL-TIME PERSONNEL, 1952-1993
By Type of Agency
Law I Public I
I Year(s) personnel enforcement Prosecution I defense I Courts
1993 ................. 151,155 85,481 10,324 3~78 1,762 1992 ................. 149,183 87,020 10,272 3,220 1,763 1991 ................. 150,737 88,628 10,027 3,255 1,745
1990 ................. 146,119 86,814 9,984 3,104 1,710 1989 ................. 138,803 83,807 8,955 3,040 1 1,719 1988 ................. 124,016 72,586 8,251 2,822
I 1,613
1987 ................. 125,642 77,015 8,334 2,390 1,589 1986 ................. 120,116 75,437 8,470 2,270 1,540
1985 ................. 115,091 73,582 8,072 2,163 1,502 1984 ................. 110,640 74,536 7,686 2,013 1,473 1983 ................. 107,131 72,618 7,460 1,987 1,451 1982 ................. 105,001 71,352 7,407 1,972
I 1,410
1981 ................. 102,350 69,420 7,184 1,929 1,393
1980 ................. 101,808 67,321 7,272 1,893
I 1,352
1979 ................. 97,687 65,120 6,916 1,766 1,302 1978 ................. 97,604 64,928 6,806 1,782 1,276 1977 ................. 98,867 65,971 6,809 1,784 1,269 1976 ................. 96,475 64,060 6,183 1,680 1,278
1975 ................. 94,743 64,177 4,875 1,574 1,266 1974 ................. 90,684 62,020 4,352 1,559 1,215 1973 ................. 86,956 59,697 4,439 1,385 1,213 1972 ................. 83,626 58,028 3,428 1,236 1,186 1971 ................ 81,782 57,099 3,227 1,120 1,160
1970 ................. 77,887 55,320 2,506 929 1,105 1969 ................. 72,853 51,104 2,786 914 1,084 1968 ................. - - - -1967 ................. - - - -1966 ................. - - - - I
1965 ................. - - - -1964 ................. - - I - -1963 ................. - - - -1962 ................. - - - -1961 ................. - - - - !
I 1960 ................. - - - -1959 ................. - - - -1958 ................. - - - -1957 ................. - - - -1956 .................. - - - -1955 ................. - - - -1954 ................. - - - -
I 1953 ................. - - - -1952 ................. - - - -
Notes: Dash indicates that data are not available. Law enforcement personnel counts do not Include state police, UC Lawrence-Livermore lab or the Bay Area Rapid Transit for 1969 through 1971. Additionally, state police and UC Lawrence·Livermore Lab did not report In 1972 and 1973. Personnel In the Department of Justice and other regulatory agencies are not includ!'.1.
Corrections
50,310 46,908 47,082
44,507 41,282 38,744 36,314 32,399
29.772 24;932 23,615 22,860 22,424
23,970 22,583 22,812 23,034 23,274
22,851 21,538 20,222 19,748 19,176
18,027 16,965
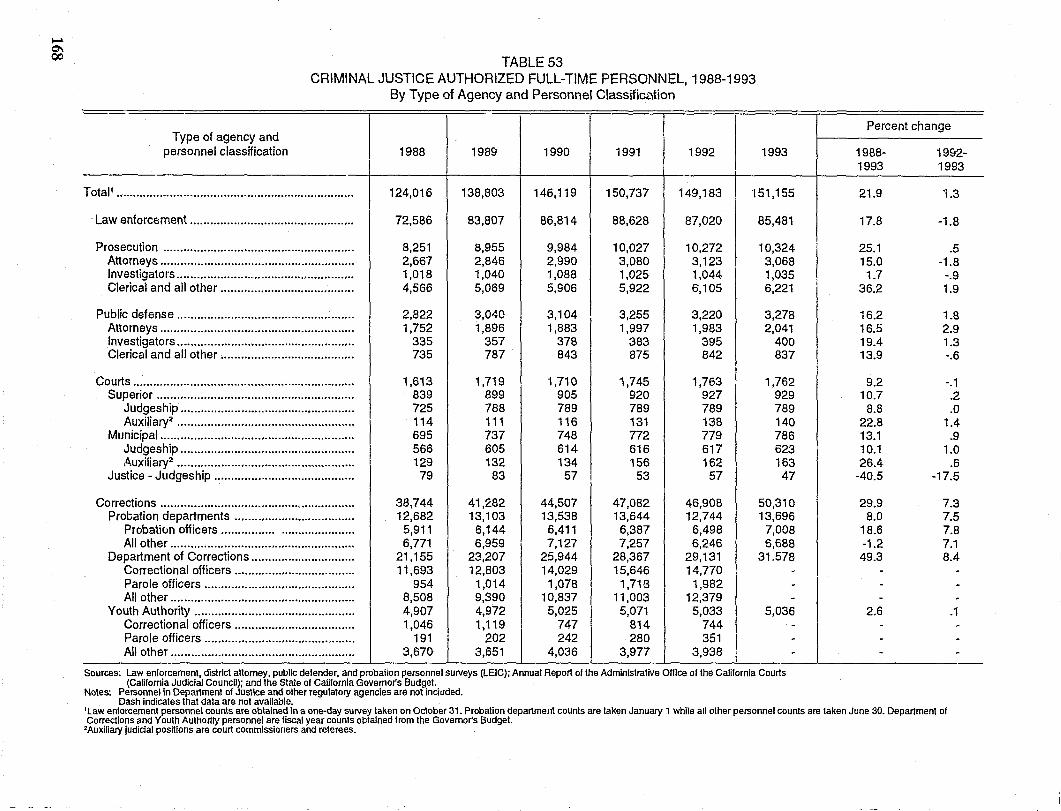
~ 0'\ QC:i
--- ... _- ---- .... -.-----~----.---
Type of agency and personnel classification
TABLE 53 CRIMINAL JUSTICE AUTHORIZED FULL-TIME PERSONNEL, 1988-1993
By Type of Agency and Personnel Classification ------- .~--- --------- --~--
1988 1989 1990 1991 1992 1993
TotaP ....................................................................... 124,016 138,803 146,119 150,737 149,183 '\51,155
Law enforcement ................................................. 72,586 83,807 86,814 88,628 87,020 85,481
Prosecution ....................................................... ,. 8,251 8,955 9,984 10,027 10,272 10,324 Attorneys .......................................................... 2,667 2,846 2,990 3,080 3,123 3,068 Investigators ..................................................... 1,018 1,040 1,088 1,025 ',044 1,035 Clerical and all other ........................................ 4,566 5,069 5,906 5,922 6,105 6,221
Public defense ..................................................... 2,822 3,040 3,104 3,255 3,220 3,278 Attorneys .......................................................... 1,752 1,896 1,883 1,997 1,983 2,041 Investigators •.•........••...•.....•.............................. 335 357 378 383 395 400 Clerical and all other ........................................ 735 787 843 875 842 837
Courts .................................................................. 1,613 1,719 1,710 1,745 1,763 1,762 Superior ........................................................... 839 899 905 920 927 929
Judgeship .................................................... 725 788 789 789 789 789 Auxiliary2 .............•.....•.............••....••.•......••.. 114 111 116 131 138 140
Municipal .......................................................... 695 737 748 772 779 786 Judgeship .................................................... 566 605 614 616 617 623 Auxiliary2 ..................................................... 129 132 134 156 162 163
Justice - Judgeship .......................................... 79 83 57 53 57 47
Corrections .......................................................... 38,744 41,282 44,507 47,082 46,908 50,310 Probation departments .................................... 12,682 13,103 13,538 13,644 12,744 13,696
Probation officers ....................................... 5,911 6,144 6,411 6,387 6,498 7,008 All other ....................................................... 6,771 6,959 7,127 7,257 6,246 6,688
Department of Corrections ............................... 21,155 23,207 25,944 28,367 29,131 31.578 Correctional officers .................................... 11,693 12,803 14,029 15,646 14,770 -Parole officers ............................................. 954 1,014 1,078 1,718 1,982 -All other ....................................................... 8,508 9,390 10,837 11,003 12,379 -
Youth Authority ................................................ 4,907 4,972 5,025 5,071 5,033 5,036 Correctional officers .................................... 1,046 1,119 747 814 744 -Parole officers ............................................. 191 202 242 280 351 -All other ....................................................... 3,670 3,651 4,036 3,977 3,938 -
Sources: law enforcement, district attorney, public defender, and probation personnel surveys (LEIC); Annual Report of the AdministratiVe Office of the California Courts (California Judicial Council); and the State of California Governor's Budget.
Notes: Personnel In Department of Justice and other regulatory agencies are not incitlded. Dash Indicates that data are not available.
Percent change
1988- 1992-1993 1993
21.9 1.3
17.8 -1.8
25.1 .5 15.0 -1.8
1.7 -.9 36.2 1.9
16.2 1.8 16.5 2.9 19.4 1.3 13.9 -.6
9.2 -.1 10.7 .2
8.8 .0 22.8 1.4 13.1 .9 10.1 1.0 26.4 .6
-40.5 -17.5
29.9 7.3 8.0 7.5
18.6 7.8 -1.2 7.1
49.3 8.4 - -- -- -
2.6 .1 - -- -- -
'law enforcement personnel counts are obtained In a one-day survey taken on October 31. Probation department counts are taken January 1 while all other personnel counts are taken June 30. Department of Corrections and Youth Authority personnel are fiscal year counts obtained from the Governor's Budget.
2Auxiliary IUdidal posHions are court commissioners and referees.
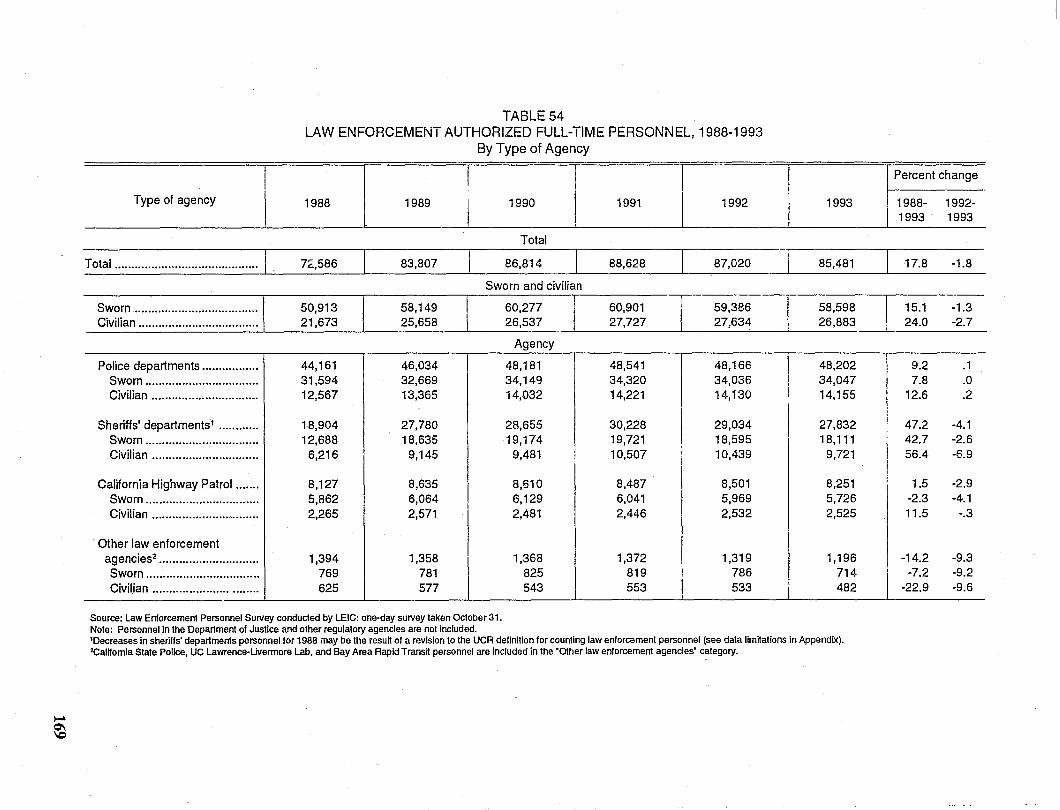
..... ~
Type of agency
TABLE 54 LAW ENFORCEMENT AUTHORIZED FULL-TIME PERSONNEL, 1988-1993
By Type of Agency
1988 1989 1990 1991 1992
Percent change
1993 1988- 1992-I ~_~_~~ ~ _~ __ L_ ~ __ ~_I ~~93 _2~93_
- --'-----~
Total
Total ........................................... I 72,586 83,807 86,814
Sworn and civilian
Sworn ..................................... 1 50,913 58,149 Civilian .................................... 21,673 25,658
Police departments ................. 44,161 46,034 Sworn .................................. 31,594 32,669 Civilian ................................ 12,567 13,365
Sheriffs'departments! ............ 18,904 27,780 Sworn .....•............................ 12,688 18,635 Civilian ................................ 6,216 9,145
California Highway Patrol ....... 8,127 8,635 I Sworn .................................. 5,862 6,064 I Civilian .......................•........ 2,265 2,571
Other law enforcement • 2 agencies .............................. 1,394 1,358
Sworn .................................. 769 781 Civilian ............................... 625 577
---- ----- -------
Source: Law Enforcement Personnel Survey conducted by LEIC: one-day survey taken October 31. Note: Personnel In the Department of Justice and other regulatory agencies are not included.
60,277 26,537
Agency
48,181 34,149 14,032
28,655 19,174
9,481
8,610 6,129 2,481
1,368 825 543
88,628 87,020 85,481
60,901 59,386 58,598 27,727 27,634 26,883
48,541 48,166 !
48,202 34,320 34,036 34,047 14,221 14,130 14,155
30,228 29,034 27,832 19,721 18,595 18,111 10,507 10,439 9,721
8,487 8,501 8,251 6,041 5,969 5,726 2,446 2,532 2,525
1,372 1,319
I 1,196
819 786 714 553 533 I 482
'Decreases in sheriffs' departments personnel for 1988 may be the resutt of a revision to the UCR definition for counting law enforcement personnel (see data limttations in Appendix). 'California State Police, UC Lawrence-Livermore Lab, and Bay Area Rapid Transit personnel are included in the "Other law enforcement agencies" category •
17.8 -1.8
15.1 -1.3 24.0 -2.7
9.2 .1 7.8 .0
12.6 .2
47.2 -4.1 42.7 -2.6
I 56.4 -6.9
1.5 -2.9 -2.3 -4.1 11.5 -.3
-14.2 -9.3 -7.2 -9.2
-22.9 -9.6
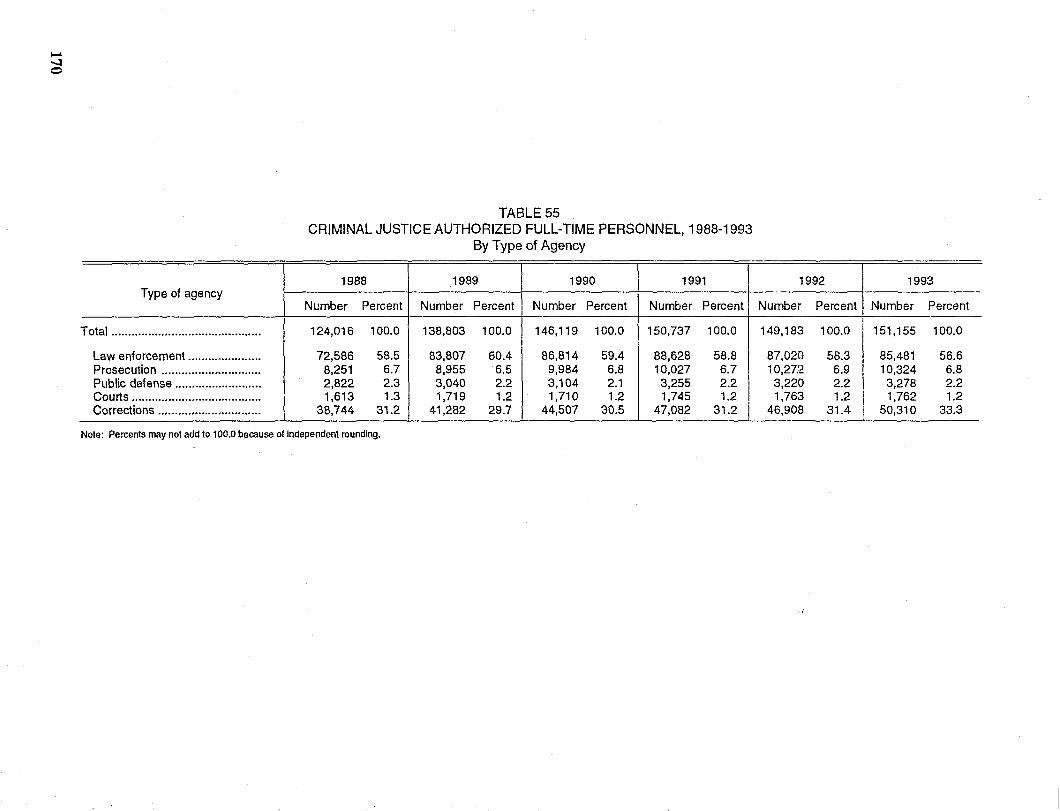
'""" ....;a o
-------~ ... _- ------- -----
Type of agency
Total .............................................
Law enforcement ...................... Prosecution .............................. Public defense .......................... Courts .......................................
I Corrections ............................... ---- -----
TABLE 55 CRIMINAL JUSTICE AUTHORIZED FULL-TIME PERSONNEL, 1988-1993
By Type of Agency ----- -
1988 1989 1990 1991
Number Percent Number Percent Number Percent Number Percent
124,016 100.0 138,803 100.0 146,119 100.0 150,737 100.0
72,586 58.5 83,807 60.4 86,814 59.4 88,628 58.8 8,251 6.7 8,955 6.5 9,984 6.8 10,027 6.7 2,822 2.3 3,040 2.2 3,104 2.1 3,255 2.2 1,613 1.3 1,719 1.2 1,710 1.2 1,745 1.2
38,744 31.2 1 41,282 29.7 44,507 30.5 47,082 31.2
Note: Percents may not add to 100.0 because of independent rounding.
-
1992 1993
Number Percent Number Percent
149,183 100.0 151,155 100.0
87,020 58.3 85,481 56.6 10,272 6.9 10,324 6.8
3,220 2.2 3,278 2.2 1,763 1.2 1,762 1.2
46,908 31.4 50,310 33.3
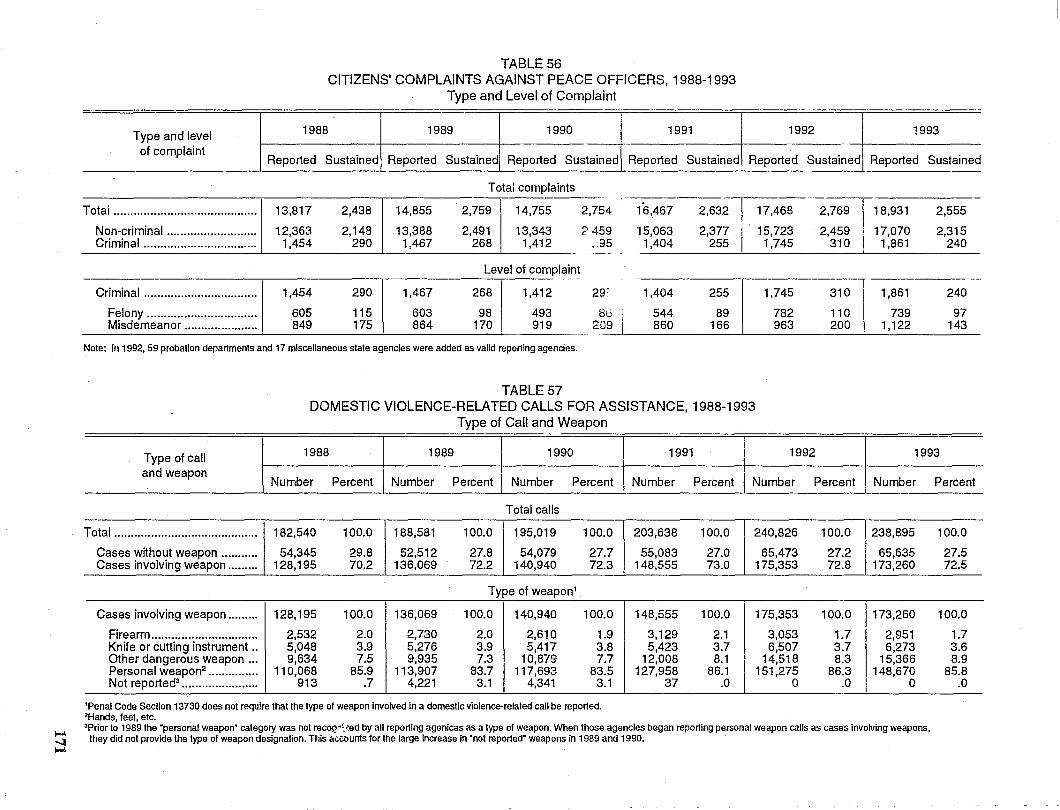
,.... -..l ~
TABLE 56 CITIZENS' COMPLAINTS AGAINST PEACE OFFICERS, 1988-1993
Type and Level of Complaint --~~- ----------.-~- -- -- -- --- --_ ... _------ ---------- - -----_ .... -.--- ------ -~-- .. ---- -_ ... - -------------- --- ~~-~ - .... ~- ~--~-.---.-
Type and level 1988 1989 1990 1991 1992
of complaint Reported Sustained Reported Sustained Reported Sustained Reported Sustained Reported Sustained
Total complaints
Total ........................................... 13,B17 2,438 14,855 2,759 14,755 2,754 16,467 2,632 17,468 2,769
Non-criminal ........................... 12,363 2,148 13,388 2,491 13,343 2459 15,063 2,377 15,723 2,459 Criminal .................................. 1,454 290 1,467 268 1,412 __ 95 1,404 255 1,745 310
Level of complaint
Criminal .................................. 1,454 290 1,467 268 1,412 29: 1,404 255 1,745
~ Felony ................................. 605 115 603 98 493 86 544 89 782 110 Misdemeanor ...................... 849 175 864 170 919 209 860 166 963 200
Note: In 1992, 59 probation departments and 17 mIscellaneous state agencies were added as valid reporting agencies.
Type of call and weapon
TABLE 57 DOMESTIC VIOLENCE-RELATED CALLS FOR ASSISTANCE, 1988-1993
Type of Call and Weapon
1988 1989 I 1990 1991
!
-- ----
1992
Number Percent Number Percent I Number Percent Number Percent Number Percent ---_ .. _-- -----
Total calls
1993
Reported Sustained
18,931 2,555
17,070 2,315 1,861 240
1,861 240
739 97 1,122 143
----- ------
1993
Number Percent ~---------~~-
I Total........................................... 182,540 100.0 188,581 100.0 195,019 100.0 203,638 100.0 240,826 100.0 238,895 100.0
Cases without weapon ........... 54,345 29.8 52,512 27.8 54,079 27.7 55,083 27.0 65,473 27.2 65,635 27.5 _Cases invoJving weapon ..... =-_ ~~ 128,195 .~~~ 70.2 _ 136,069 72.~ 140,940 _~2.3 ~~8,555 ~_!3.0 _ ~!5,353_ 72.8 .173,~6~ 72.5
Type of weapon1
Cases involving weapon ......... 128,195 100.0 136,069 100.0 140,940 100.0
Firearm ................................ 2,532 2.0 2,730 2.0 2,610 1.9 Knife or cutting instrument .. 5,048 3.9 5,276 3.9 5,417 3.8 Other dangerous weapon ... 9,634 7.5 9,935 7.3 10,879 7.7 Personal weapon2 ••••••••••••••• 110,068 85.9 113,907 83.7 117,693 83.5 Not reported3 ••••••••••••••••••••••• 913 .7 4,221 3.1 4,341 3.1
--~
'Penal Code Section 13730 does not require that the type 01 weapon Involved in a domestic violence-related call be reported. 'Hands, leet, etc.
148,555 100.0 175,353 100.0 173,260
3,129 2.1 3,053 1.7 2,951 5,423 3.7 6,507 3.7 6,273
12,008 8.1 14,518 8.3 15,366 127,958 86.1 151,275 86.3 148,670
37 .0 0 .0 0 --~
'Prior to 1989 the ·personal weapon" category was not recoQ-:~ed by all reporting agenices as a type 01 weapon. When those agencies began reporting personal weapon calls as cases involving weapons, they did not provide the type 01 weapon designation. This iic.\;bUnts lor the large increase in "not reported" weapons in 1989 and 1990.
100.0
1.7 3.6 8.9
85.8 .0
-
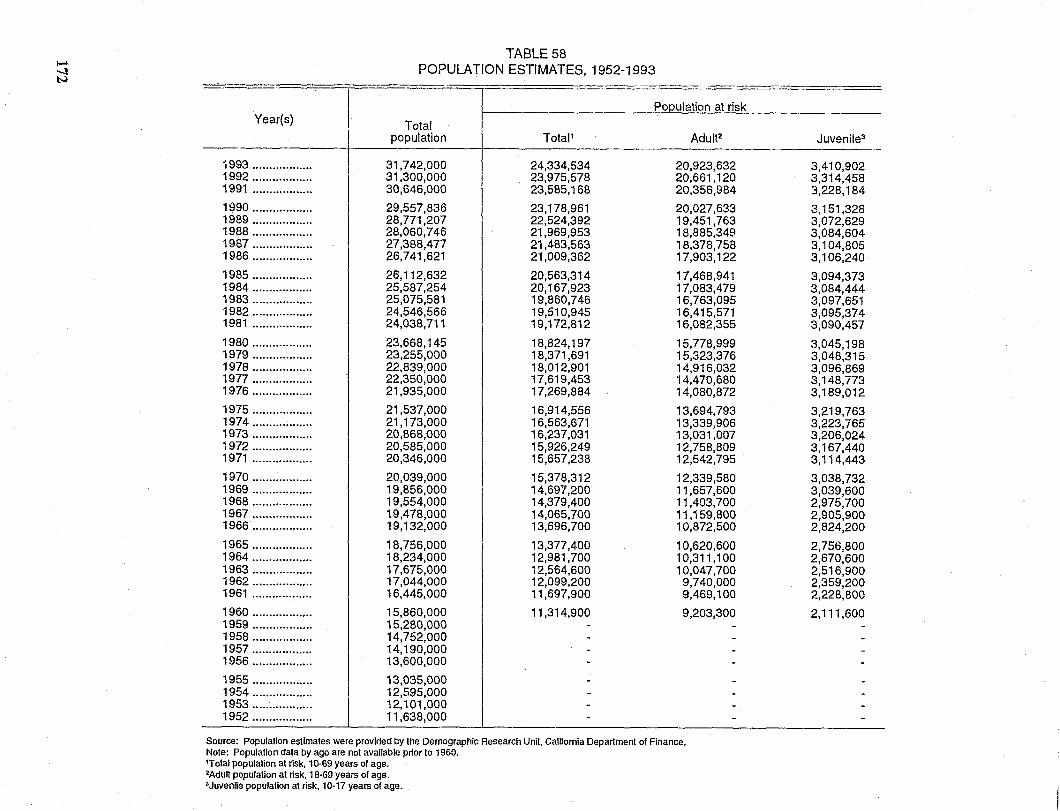
.... '! N
TABLE 58 POPULATION ESTIMATES, 1952-1993
--------Population atJisk
Year(s) Total population TotaP AdulF
,993 .................. 31,742,000 24,334,534 20,923,632 1992 .................. 31,300,000 23,975,578 20,661,120 1991 .................. 30,646,000 23,585,168 20,356,984
1~90 .................. 29,557,836 23,178,961 20,027,633 1989 .................. 28,771,207 22,524,392 19,451,763 1988 .................. 28,060,746 21,969,953 18,885,349 1987 .................. 27,388,477 21,483,563 18,378,758 1986 .................. 26,741,621 21,009,362 17,903,122
1985 .................. 26,112,632 20,563,314 17,468,941 1984 .................. 25,587,254 20,167,923 17,083,479 1983 .................. 25,075,581 19,860,746 16,763,095 1982 .................. 24,546,566 19,510,945 16,415,571 1981 .................. 24,038,711 19,172,812 16,082,355
1980 .................. 23,668,145 18,824,197 15,778,999 1979 .................. 23,255,000 18,371,691 15,323,376 1978 .................. 22,839,000 18,012,901 14,916,032 1977 .................. 22,350,000 17,619,453 14,470,680 1976 .................. 21,935,000 17,269,884 14,080,872
1975 .................. 21,537,000 16,914,556 13,694,793 1974 .................. 21,173,000 16,563,671 13,339,906 1973 .................. 20,868,000 16,237,031 13,031,007 1972 .................. 20,585,000 15,926,249 12,758,809 1971 .................. 20,346,000 15,657,238 12,542,795
1970 .................. 20,039,000 15,378,312 12,339,580 1969 .................. 19,856,000 14,69'7,200 11,657,600 1968 .................. 19,554,000 14,379,400 11,403,700 1967 .................. 19,478,000 14,065,700 11,159,800 1966 .................. 19,132,000 13,696,700 10,872,500
1965 .................. 18,756,000 13,377,400 10,620,600 1964 .................. 18,234,000 12,981,700 10,311,100 1963 .................. 17,675,000 12,564,600 10,047,700 1962 .................. 17,044,000 12,099,200 9,740,000 1961 .................. 16,445,000 11,697,900 9,469,100
1960 .................. 15,860,000 11,314,900 9,203,300 1959 .................. 15,280,000 1958 .................. 14,752,000 1957 .................. 14,190,000 1956 .................. 13,600,000
1955 .................. 13,035,000 1954 .................. 12,595,000 1953 .................. 12,101,000 1952 .................. 11,638,000
Source: Population estimates were provided by the Demographic Research Unit. California Department of Finance. Note: Population data by age are not available prior to 1960. 'Total population at risk, 10-69 years of age. 2Adutt population at risk, 18-69 years of age. 'Juvenile population at risk. 10-17 years of age.
Juvenile3
3,410,902 3,314,458 3,228,184
3,151,328 3,072,629 3,084,604 3,104,805 3,106,240
3,094,373 3,084,444 3,097,651 3,095,374 3,090,457
3,045,198 3,048,315 3,096,869 3,148,773 3,189,012
3,219,763 3,223,765 3,206,024 3,167,440 3,114,443
3,038,732 3,039,600 2,975,700 2,905,900 2,824,200
2,7513,800 2,670,600 2,516,900 2,359,200 2,228,800
2,111,600
· ~,
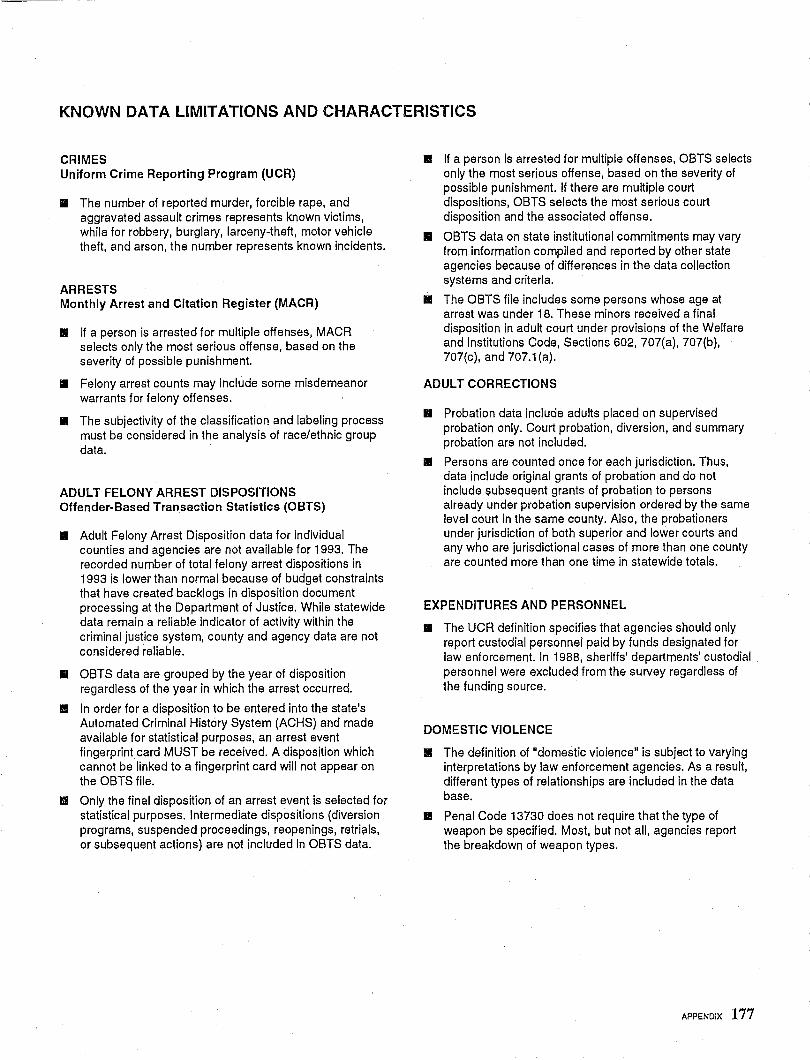
KNOWN DATA LIMITATIONS AND CHARACTERISTICS
CRIMES Uniform Crime Reporting Program (UCR)
.. The number of reported murder, forcible rape, and aggravated assault crimes represents known victims, while for robbery, burglary, larceny-theft, motor vehicle theft, and arson, the number represents known incidents.
ARRESTS Monthly Arrest and Citation Register (MACR)
• If a person is arrested for multiple offenses, MACR selects only the most serious offense, based on the severity of possible punishment.
III Felony arrest counts may include some misdemeanor warrants for felony offenses.
.. The subjectivity of the classification and labeling process must be considered in the analysis of race/ethnic group data.
ADULT FELONY ARREST DISPOSITIONS Offender-Based Transaction Statistics (OBTS)
• Adult Felony Arrest Disposition data for individual counties and agencies are not available for 1993. The recorded number of total felony arrest dispositions in 1993 is lower than normal because of budget constraints that have created backlogs in disposition document processing at the Department of Justice. While statewide data remain a reliable indicator of activity within the criminal justice system, county and agency data are not considered reliable.
.. OBTS data are grouped by the year of disposition regardless of the year in which the arrest occurred.
II In order for a disposition to be entered into the state's Automated Criminal History System (ACHS) and made available for statistical purposes, an arrest event fingerprint card MUST be received. A disposition which cannot be linked to a fingerprint card will not appear on the OBTS file.
1'.11 Only the final disposition of an arrest event is selected for statistical purposes. Intermediate dispositions (diversion programs, suspended proceedings, reopenings, retrials, or subsequent actions) are not included in OBTS data.
III If a person is arrested for multiple offenses, OBTS selects only the most serious offense, based on the severity of possible punishment. If there are multiple court dispositions, OBTS selects the most serious court disposition and the associated offense.
.. OBTS data on state institutional commitments may vary from information compiled and reported by other state agencies because of differences in the data collection systems and criteria.
III The OBTS file includes some persons whose age at arrest was under 18. These minors received a final disposition in adult court under provisions of the Welfare and Institutions Code, Sections 602, 707(a), 707(b), 707(c), and 707.1 (a).
ADULT CORRECTIONS
.. Probation data include adults placed on supervised probation only. Court probation, diversion, and summary probation are not included.
ill Persons are counted once for each jurisdiction. Thus, data include original grants of probation and do not include subsequent grants of probation to persons already under probation supervision ordered by the same level court in the same county. Also, the probationers under jurisdiction of both superior and lower courts and any who are jurisdictional cases of more than one county are counted more than one time in statewide totals.
EXPENDITURES AND PERSONNEL
.. The UCH definition specifies that agencies should only report custodial personnel paid by funds designated for law enforcement. In 1988, sheriffs' departments' custodial personnel were excluded from thl:: survey regardless of the funding source.
DOMESTIC VIOLENCE
III The definition of "domestic violence" is subject to varying int~rpretations by law enforcement agencies. As a result, different types of relationships are included in the data base.
• Penal Code 13730 does not require that the type of weapon be specified. Most, but not all, agencies report the breakdown of weapon types.
APPENDIX 177
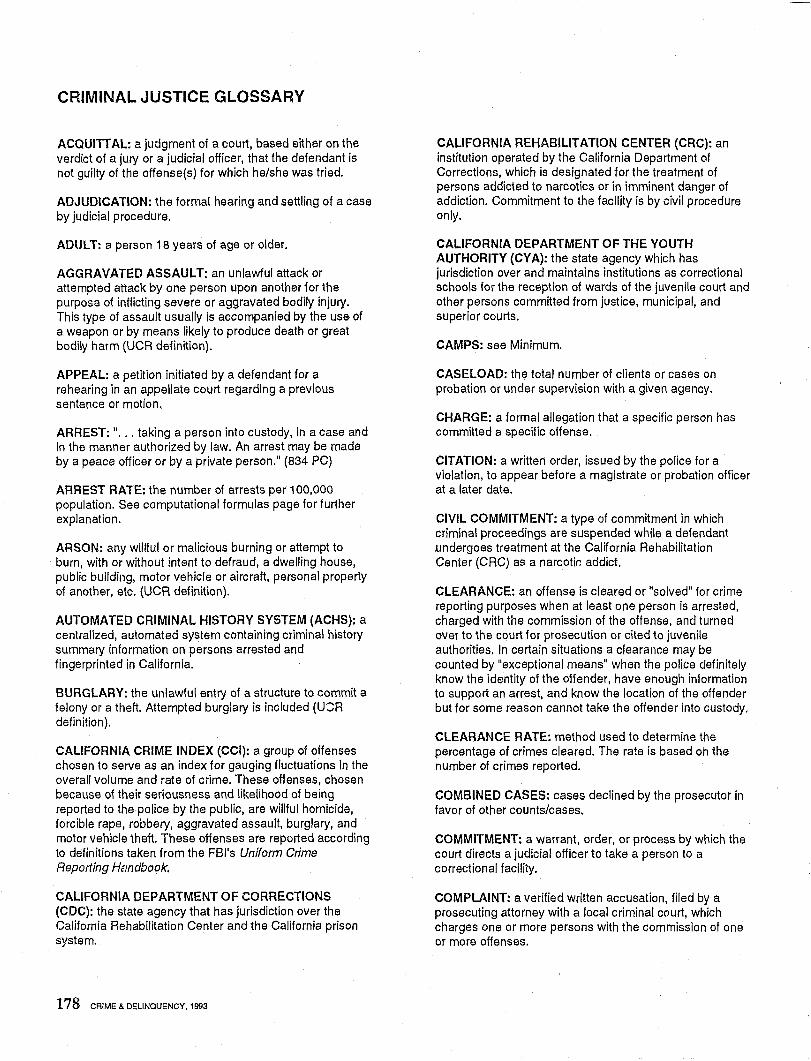
-------- -- -------
CRIMINAL JUSTICE GLOSSARY
ACQUITI AL: a judgment of a court, based either on the verdict of a jury or a judicial officer, that the defendant is not guilty of the offense(s) for which he/she was tried.
ADJUDICATION: the formal hearing and settling of a case by judicial procedure.
ADULT: a person 18 years of age or older.
AGGRAVATED ASSAULT: an unlawful attack or attempted attack by one person upon another for the purpose of inflicting severe or aggravated bodily injury. This type of assault usually is accompanied by the use of a weapon or by means likely to produce death or great bodily harm (UCR definition).
APPEAL: a petition initiated by a defendant for a rehearing in an appellate court regarding a previous sentence or motion.
ARREST: " ... taking a person into custody, in a case and in the manner authorized by law. An arrest may be made by a peace officer or by a private person." (834 PC)
ARREST RATE: the number of arrests per 100,000 popUlation. See computational formulas page for further explanation.
ARSON: any willful or malicious burning or attempt to burn, with or without intent to defraud, a dwelling house, public building, motor vehicle or aircraft, personal property of another, etc. (UCR definition).
AUTOMATED CRIMINAL HISTORY SYSTEM (ACHS): a centralized, automated system containing criminal history summary information on persons arrested and fingerprinted in California.
BURGLARY: the unlawful entry of a structure to commit a felony or a theft. Attempted burglary is included (USR definition).
CALIFORNIA CRIME INDEX (CCI): a group of offenses chosen to serve as an index for gauging fluctuations in the overall volume and rate of crime. These offenses, chosen because of their seriousness and likelihood of being reported to the police by the public, are willful homicide, forcible rape, robbery, aggravated assault, burglary, and motor vehicle theft, These offenses are reported according to definitions taken from the FBI's Uniform Crime Reporting H.mdbook.
CALIFORNIA DEPARTMENT OF CORRECTIONS (CDC): the state agency that has jurisdiction over the California Rehabilitation Center and the California prison system.
178 CRIME & DELINQUENCY, 1993
CALIFORNIA REHABILITATION CENTER (CRC): an institution operated by the California Department of Corrections, which is designated for the treatment of persons addicted to narcotics or in imminent danger of addiction. Commitment to the facility is by civil procedure only.
CALIFORNIA DEPARTMENT OF THE YOUTH AUTHORITY (CY A): the state agency which has jurisdiction over and maintains institutions as correctional schools for the reception of wards of the juvenile court and other persons committed from justice, municipal, and superior courts.
CAMPS: see Minimum,
CASELOAD: the total number of clients or cases on probation or under supervision with a given agency.
CHARGE: a formal allegation that a specific person has committed a specific offense.
CITATION: a written order, issued by the police for a violation, to appear before a magistrate or probation officer at a later date.
CIVil COMMITMENT: a type of commitment in which criminal proceedings are suspended while a defendant undergoes treatment at the California Rehabilitation Center (CRe) as a narcotic. addict.
CLEARANCE: an offense is cleared or "solved" for crime reporting purposes when at least one person is arrested, charged with the commission of the offense, and turned over to the court for prosecution or cited to juvenile authorities. In certain situations a clearance may be counted by "exceptional means" when the police definitely know the identity of the offender, have enough information to support an arrest, and know the location of the offender but for some reason cannot take the offender into custody.
CLEARANCE RATE: method used to determine the percentage of crimes cleared. The rate is based on the number of crimes reported.
COMBINED CASES: cases declined by the prosecutor in favor of other counts/cases.
COMMITMENT: a warrant, order, or process by which the court directs a judicial officer to take a person to a correctional facility.
COMPLAINT: a verified written accusation, filed by a prosecuting attorney with a local criminal court, which charges one or more persons with the commission of one or more offenses.
CONTROLLED SUBSTANCE: a drug, substance, or immediate precursor which is included in Schedules I through V inclusive, as set forth in Health and Safety Code Sections 11054 through 11058. These woule include heroin, marijuana, amphetamines, barbiturates, and psychedelics.
CONVICTION: a judgment, based either on the verdict of a jury or a judicial officer or on the guilty plea of the defendant, that the defendant is guilty.
CORRECTIONS: those agencies or facilities concerned with the custody, confinement, supervision, or treatment of alleged or adjudicated offenders.
COURT: an agency of the judicial branch of government, authorized or established by statut(\ or constitution, having one or more judicial officers on its staff. A court has the authority to decide upon controversies in law and disputed matters of fact brought before it.
CRC: see California Rehabilitation Center.
CRIME: n ••• an act committed or omitted in violation of a law forbidding or commanding it. ... n (15 PC)
CRIME INDEX: crimes chosen to serve as an index for gauging fluctuations in the overall volume and rate of crime. See California Crime Index and FBI Crime Index.
CRIME RATE: the number of reported crimes per 100,000 general population. See computational formulas page for further explanation.
CRIMINAL COMMITMENT: a type of commitment which results when a defendant is sentenced to prison or the California Department of the Youth Authority.
CYA: see California Department of the Youth Authority.
DEFENDANT: a person against whom a criminal proceeding is pending.
DEFERRED PAROLE REVOCATION: action taken by a prosecutor to revoke the parole status of an offender to return the subject to state prison in lieu of filing new charges.
DELINQUENT ACTS: those acts described under Welfare and Institutions Code Section 602 which involve violations by a juvenile of any law or ordinance defining crime, or the violation of a court order of the juvenile court.
DETERMINATE SENTENCING: sentencing Which, by law, requires imposition of a prescribed term of imprisonment.
DISMISSAL: a decision by a judicial officer to terminate a case without a determination of guilt or innocence.
DISPOSITION - COURT: an action taken as the result of an appearance in court by a defendant. Examples are:
adults -dismissed, acquitted, or convicted and sentenced; juveniles -dismissed, transferred, remanded to adult court, placed on probation, or sentenced to the California Department of the Youth Authority.
DISPOSITION - LAW ENFORCEMENT: an action taken as the result of an arrest. Examples of police dispositions are: adults - released by law enforcement, referred to another jurisdiction, or a misdemeanor or felony complaint sought; juveniles - handled within the department, referred to another agency, or referred to the probation department or juvenile court.
DISPOSITION - PROSECUTOR: an action taken as the result of complaints which were requested by the arresting agency. Dispositions include granting a misdemeanor or a felony complaint, or denying a complaint for such reasons as lack of corpus, lack of sufficient evidence, interest of justice, complainant refuses to testify, witness unavailable, inadmissible search, deferred parole revocation, prefiling deferral and other.
DIVERSION: a disposition of a criminal defendant either before adjudication or following adjudication but prior to sentencing, in which the court directs the defendant to participate in a work, educational, or rehabilitation program.
DIVERSION DISMISSED: the successful completion of a diversion program.
DRUGS: see Controlled Substance.
FBI CRIME INDEX: the FBI chose seven crimes to serve as an index for gauging fluctuations in the overall volume and rate of crime. These offenses include homicide, forcible rape, robbery, aggravated assault, burglary, larceny-theft, and motor vehicle theft. By congressional mandate, arson was added as the eighth index offense in 1979.
FELONY: a crime which is punishable with death or by imprisonment in the state prison. (17 & 18 PC)
FILING: a document filed with the municipal court clerk or C01l1'ty clerk by a prosecuting attorney alleging that a persun committed or attempted to commit a crime.
FINE: the penalty imposed upon a convicted person by a court requiring the payment of a specified sum of money.
FORCIBLE RAPE: the carnal knowledge of a female forcibly and against her will. Assaults or attempts to commit rape by force or threat of force are included (UCR definition).
GRANT: the act of placing an adult on probation.
GUILTY PLEA: a defendant's formal answer in open court to charge(s) in a complaint, indictment, or information,
APPENDIX 179
stating that the charge(s) is true and that he/she has committed the offense(s) as charged.
HOMICIDE: the willful (non negligent) killing of one human being by another. Murder and nonnegligent manslaughter are included (UCR definition).
INCIDENT·BASED DATA SYSTEM: a data collection method which provides unique data for each recorded event (e.g., Monthly Arrest and Citation Register data base).
INFRACTION: an offense punishable by fine or other penalty, but not by incarceration.
JAIL: a county or city facility for incarceration of sentenced and unsentenced persons. Also known as type I or II facility (Section 1006 California Code of Regulations). See Medium-Maximum and Minimum.
JURISDICTION: the territory, subject matter, or person over which lawful authority may be exercised.
JUSTICE COURT: see Lower Court.
JUVENILE: a person under the age of 18.
LARCENY·THEFT: the unlawful taking, carrying, leading, or riding away of property from the possession of another (except embezzlement, fraud, forgery, and worthless checks) (UCR definition).
LOCAL SUPERVISION: local correctional agencies provide confinement. rehabilitation. and probation services for those sentenced to their care and also house persons awaiting trial or sentencing.
LOWER COURT: the court of original or trial jurisdiction for the prosecution of persons accused of misdemeanor or certain felony offenses. Also, lower courts may sentence certain felony offenders as well as conduct preliminary hearings to determine probable cause in cases where felony offenders are subject to jurisdiction of superior courts.
MANDATORY SENTENCING: sentencing mandated by law which limits judicial discretion for specific offenses and/or convicted offenders.
MEDIUM·MAXIMUM: a county or city facility for incarceration of sentenced and unsentenced persons. Also known as jail or type lor II facility. (Section 1006 California Code of Regulations)
MINIMUM: a county or city facility for the incarceration of sentenced and unsentenced persons. Also known as type III or IV facility. (Section 1006 California Code of Regulations)
MISDEMEANOR: a crime punishable by imprisonment in a county jail for up to one year.
180 CRIME & DELINQUENCY. 1993
MONTHLY ARREST AND CITATION REGISTER (MACR): a reporting system used to collect information on adult and juvenile arrests and citations by police and sheriffs' departments. This register contains data on arrest offenses, arrestee characteristics (age, sex, and racel ethnic group), and law enforcement dispositions.
MOTOR VEHICLE THEFT: the theft or attempted theft of a motor vehicle (UCR definition).
MUNICIPAL COURT: see Lower Court.
NOT AGGRAVATED (SIMPLE) ASSAULT: assaults and attempted assaults where no weapon is used and which do not result in serious or aggravated injury to the victim (UCR definition).
OFFENDER·BASED TRANSACTION STATISTICS (OBTS): a system designed to collect statistical information on the various processes within the criminal justice system that occur between the point of the felony arrest of an adult and the point of final disposition.
OFFENSE: the charged offense is the crime for which the defendant was arrested or filed on by the district attorney. The convicted offense is the offense the deferldant was convicted of or pled guilty to in court. The sustained offense is the offense for which the juvenile court sustains a petition.
OUTPATIENT: a period of supervision following release from the California Rehabilitation Center (CRC).
PAROLE: an added period of control following release from prison. (3000(a) PC)
PAROLE VIOLATION: violation of one or more of the conditions of parole or an illegal act for which parole is revoked rather than proceeding with criminal prosecution. See Deferred Parole Revocation.
PC (PENAL CODE): the California Penal Code contains statutes that define criminal offenses and specify corresponding punishments along with criminal justice system mandates and procedures.
PETITION TO REVOKE PROBATION: action taken by a prosecutor to revoke the probation status of an offender to return the subject ,to county jailor state prison.
POPULATION AT RISK: that portion of the total population. who be,:ause of like characteristics to the specific study group, are considered "at risk." For example, jf one were studying juvenile arrestees, a" persons between 10 and 17 years of age would constitute the at-risk population.
PRE·FILING DEFERRAL: action taken by a prosecutor to defer the filing of felony charges against a first-time offender who committed a less serious felony. A case is
filed but there is no further disposition until the subject completes the diversionary program (e.g., support group, rehabilitation program).
PRISON: a state correctional facility where persons are confined following conviction for a felony offense.
PROBATION: a judicial requirement that a person fulfill certain conditions of behavior in lieu of a sentence to confinement. See Straight Probation.
PROBATION WITH JAIL: a type of disposition given upon conviction which imposes a jail term as a condition of probation.
PROBATION REVOCATION: see Petition to Revoke Probation.
PROPERTY CRIMES: crimes against property. This category includes burglary and motor vehicle theft.
PROPERTY OFFENSES: arrest offenses for crimes against property. This category includes burglary; motor vehicle theft; forgery, check, and access card offenses; and arson.
PROSECUTOR: an attorney employed by a governmental agency whose official duty is to initiate and maintain criminal proceedings on behalf of the government against persons accused of committing criminal offenses.
PUNISHMENT: varies by type of crime. See Felony, Misdemeanor, and Infraction.
RATE: a comparison of a number of events to a population.
REMOVAL: a case removed from an active caseload and no longer under the supervision of the probation department, or a case not removed but escalated to a more advanced level of supervision.
REVOCATION: cancellation or suspension of parole or probation.
REVOKE: to withdraw, repeal, or cancel probation or parole for an adult.
ROBBERY: the taking or attempting to take anything of value from the care, custody, or control of a person or persons by force or threat of force or violence and/or by creating fear in the victim (UCR definition).
SECONDARY GRANT: a subsequent grant of probation in the same court for an adult still on prr' ,ation for the initial grant.
SENTENCE: the penalty imposed by a court upon a convicted person.
STATE INSTITUTION: a facility for housing defendants who are under the jurisdiction of state correctional or treatment programs.
STATE SUPERVISION: the state correctional system provides confinement, rehabilitation, and parole services. The principal provider of these services for adults is the California Department of Corrections (CDC), which includes the California Rehabilitation Center (CRC). Based on special circumstances, some adult offenders are placed in the California Youth Authority (CY A) and California Department of Mental Health (COM H).
STATUS OFFENDER: a juvenile who has been adjudicated by a judicial officer of a juvenile court, as having committed a status offense.
STATUS OFFENSE: an act or conduct, described by Welfare and Institutions Code Section 601, which is declared by statute to be an offense, but only when committed or engaged in by a juvenile, and which can be adjudicated only by a juvenile court.
STRAIGHT PROBATION: probation granted to adults without condition or stipulation that the defendant serve time in jail as a cQJ:)dition of probation.
SUBSEQUENT DISPOSITION: a judicial decision or sentence given at the time of a court return.
SUBSEQUENT GRANT: see Secondary Grant.
SUMMARY DATA SYSTEM: a data collection method based on the sum of the number of events/counts which occur in a specified period of time (e.g., Uniform Crime Reporting data base).
SUPERIOR COURT: the court of original or trial jurisdiction for felony cases and all juvenile hearings. Also, the first court of appeal for municipal or justice court cases.
SUSTAINED: to affirm or approve, as when an appellate court sustains the decision of a lower court.
SWORN PERSONNEL: a full-time employee of a law enforcement agency who has sworn to carry out law enforcement duties and has full arrest powers.
TERMINATED: satisfactorily completed specified term of probation.
UNIFORM CRIME REPORTING (UCR): a federal reporting system which provides data on crime based on police statistics submitted by law enforcement agencies throughout the nation. DOJ administers and forwards the data for California to the federal program.
VIOLATION: breach or infringement of the terms or conditions of probation.
VIOLENT CRIMES: crimes against people. This category includes homicide, forcible rape, robbery, and aggravated assault.
VIOLENT OFFENSES: arrest offenses for crimes against people. This category includes homicide, forcible rape, robbery, aggravated assault, and kidnapping.
YOUTH AUTHORITY: see California Department of the Youth Authority.
APPE7NDIX 181
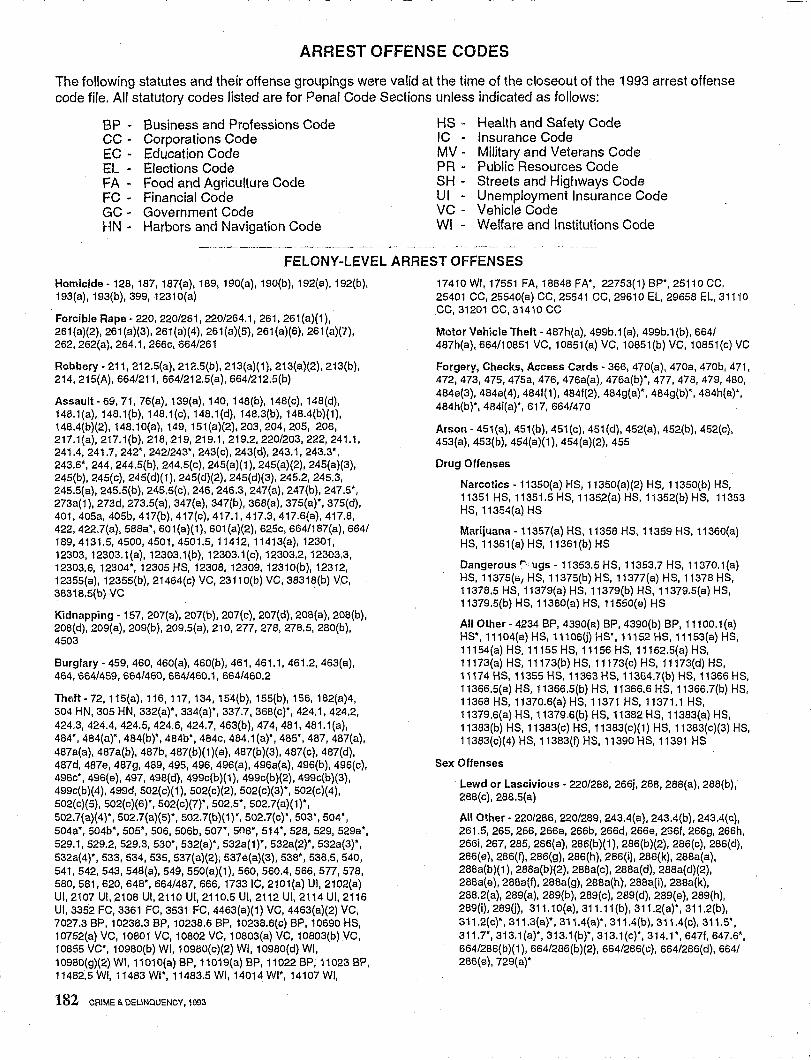
ARREST OFFENSE CODES
The following statutes and their offense groupings were valid at the time of the closeout of the 1993 arrest offense code file. All statutory codes listed are for Penal Code Sections unless indicated as follows:
BP - Business and Professions Code HS· Health and Safety Code CC - Corporations Code IC - Insurance Code EC - Education Code MV - Military and Veterans Code EL - Elections Code PR - Public Resources Code FA - Food and Agriculture Code SH - Streets and Highways Code FC· Financial Code UI - Unemployment Insurance Code GC· Government Code VC - Vehicle Code HN - Harbors and Navigation Code WI • Welfare and Institutions Code
FELONY-LEVEL ARREST OFFENSES
Homicide - 128, 187, 187(a), 189, 190(a), 190(b), 192(a). 192(b). 193(a), 193(b), 399, 12310(a)
Forcible Rape - 220,220/261,220/264.1,261, 261(a)(1), 261 (a)(2), 261 (a)(3), 261 (a)(4), 261 (a)(5), 261 (a)(6), 261 (a)(7), 262, 262(a), 264.1, 266c, 664/261
Robbery - 211, 212.5(a), 212.5(b), 213(a)(1), 213(a)(2), 213(b), 214, 215(A), 664/211, 664/212.5(a), 664/212.5(b)
Assault - 69, 71, 76(a), 139(a), 140, 148(b), 148(c), 148(d}, 148.1(a}, 148.1(b), 148.1(c}, 148.1(d}, 148.3(b), 148.4(b)(1), 148.4(b)(2), 148.10(a), 149, 151(a)(2), 203, 204, 205, 206, 217.1{a), 217.1(b), 218, 219, 219.1, 219.2, 220/203, 222,241.1, 241.4,241.7,242',242/243', 243(c), 243(d), 243.1, 243.3*, 243.6*,244, 244.5(b), 244.5(c), 245(a)(1), 245(a)(2), 245(a)(3), 245(b), 245(c), 245(d)(1), 245(d)(2), 245(d)(3), 245.2, 245.3, 245.5(a), 245.5(b), 245.5{c), 246, 246.3, 247(a), 247(b), 247.5*, 273a(1), 273d, 273.5(a), 347(a), 347(b), 368(a), 375(a)*, 375(d), 401, 405a, 405b, 417(b), 417(c), 417.1, 417.3, 417.6(a), 417.8, 422, 422.7(a), 588a*, 601(a)(1), 601 (a)(2), 625c, 664/187(a), 664/ 189,4131.5,4500,4501,4501.5,11412, 11413(a), 12301, 12303, 1230:.3.1 (a), 12303.1(b), 12303.1(c), 12303.2, 12303.3, 12303.6, 12304*, 12305 HS, 12308,12309, 12310(b}, 12312, 12355(a}, 12355(b), 21464(c} VC, 23110(b) VC, 38318(b) VC, 38318.5(b} VC
Kidnapping - 157, 207(a}, 207(b), 207(c), 207(d), 208(a), 208(b), 208(d), 209(a), 209(b), 209.5(a), 210, 277, 278,278.5, 280(b), 4503
Burglary - 459, 460, 460(a), 460(b), 461, 461.1, 461.2, 463(a), 464,664/459,664/460, 664/460.1, 664/460.2
The:ft -72, 115(a), 116, 117, 134, 154(b), 155(b), 156, 182(a)4, 304 HN, 305 HN, 332(a)*, 334(a)*, 337.7, 368(c)*, 424.1,424.2, 424.3,424.4,424.5,424.6,424.7, 463(b), 474, 481, 481.1(a), 484*, 484(a}*, 484(b}*, 484b', 484c, 484.1 (a)*, 485*, 487, 487(a), 487a(a), 487a(b), 487b, 487(b)(1)(a), 487(b)(3), 487(c), 487(d), 487d, 487e, 487g, 489,495,496, 496(a), 496a(a), 496(b), 496(c), 496c', 496(e), 497, 498(d), 499c(b)(1), 499c(b)(2), 499c(b)(3), 499c(b)(4), 499d, 502(c)(1), 502(c}(2}, 502(c)(3}" 502(c}(4), 502(c)(5}, 502(c)(6)', 502(c}(7)', 502.5', 502.7(a}(1)·, 502.7(a)(4}*, 502.7(a)(5)', 502.7(b)(1)" 502.7(c)*, 503*, 504', 504a*, 504b', 505*, 506, 506b, 507*, 508", 514*, 528, 529, 529a*, 529.1,529.2,529.3,530', 532(a)*, 532a(1)*, 532a(2}', 532a(3)*, 532a(4)" 533, 534, 535, 537(a)(2), 537e(a)(3), 538', 538.5,540, 541,542,543, 548(a), 549, 550(a}(1), 560, 560.4, 566, 577, 578, 580,581,620,648" 664/487, 666, 1733tC, 2101(a) UI, 2102(a) Ut, 2107 Ut, 2108 Ut, 2110 Ut, 2110.5 UI, 2112 Ut, 2114 ut, 2116 UI, 3352 FC, 3361 FC,3531 FC, 4463(a}(1) VC, 4463(a}(2) VC, 7027.3 BP, 10238.3 BP, 10238.6 BP, 10238.6(c) BP, 10690 HS, 1 0752 (a) VC, 10801 VC, 10802 VC, 10803(a) VC, 10803(b) VC, 10855 VC', 10980(b) WI, 10980(c}(2} WI, 10980(d} WI, 10980(g)(2) WI, 11 01 O(a) BP, 11019(a) BP, 11022 BP, 11023 BP, 11482.5 WI, 11483 W'*, 11483.5 WI, 14014 WI', 14107 WI,
182 CRIME & DELINQUENCY, 1993
17410 WI, 17551 FA, 18848 FA', 22753(1) BP*, 25110 CC, 25401 CC, 25540(a) CC, 25541 CC, 29610 EL, 29658 EL, 31110 CC, 31201 CC, 31410 CC
Motor Vehicle Theft - 487h(a), 499b.1 (a), 499b.1 (b), 6641 487h(a), 664/10851 VC, 10851 (a) VC, 10851(b) VC, 10851(c) VC
Forgery, Checks, Access Ca.rds - 366, 470(a), 470a, 470b, 471, 472, 473, 475, 475a, 476, 476a(a), 476a(b)', 477, 478, 479, 480, 484a(3), 484e(4), 4841(1), 4841(2), 484g(a)', 484g(b)*, 484h(a}" 484h(b)" 484i(a)', 617, 664/470
Arson - 451(a), 451(b), 451(c), 451(d), 452(a), 452(b), 452(c), 453(a}, 453(b}, 454(a)(1), 454(a)(2}, 455
Drug Offenses
Narcotics - 11350(a) HS, 11350(a)(2) HS, 11350(b} HS, 11351 HS, 11351.5 HS, 11352(a) HS, 11352(b} HS, 11353 HS, 11354(a) HS
Marijuana - 11357(a) HS, 11358 HS, 11359 HS, 11360(a) HS, 11361(a) HS, 11361(b) HS
Dangerous r·, ugs - 11353.5 HS, 11353.7 HS, 11370.1 (a) HS, 11375(i:lJ HS, 11375(b) HS, 11377(a) HS, 11378 HS, 11378.5 HS, 11379(a) HS,11379(b) HS, 11379.5(a) HS, 11379.5(b) HS, 11380(a) HS, 11550(e) HS
All Other - 4234 BP, 4390(a) BP, 4390(b) BP, 11100.1 (a) HS', 11104(a) HS, 111060) HS*, 11152 HS, 11153(a} HS, 11154(a) HS, 11155 HS, 11156 HS, 11162.5(a} HS, 11173(a) HS, 11173(b} HS, 11173(c} HS, 11173(d} HS, 11174 HS, 11355 HS, 11363 HS, 11364.7(b) HS, 11366 HS, 11366.5(a) HS, 11366.5(b} HS, 11366,6 HS, 11366.7(b) HS, 11368 HS, 11370.6(a) HS, 11371 HS, 11371.1 HS, 11379.6(a) HS, 11379.6(b) HS, 11382 HS, 11383(a) HS, 11383(b) HS, 11383(c} HS, 11383(c)(1) HS, 11383(c}(3} HS, 11383(c)(4) HS, l1383(f} HS, 11390 HS, 11391 HS
Sex Offenses
Lewd or Lascivious· 220/288, 266j, 288, 288(a), 288(b), 288(c), 288.5(a)
All Other - 220/286, 2201289, 243.4(a). 243.4(b), 243.4(c), 261.5,265,266, 266a, 266b, 266d, 266e, 2661, 266g, 266h, 266i, 267, 285, 266(a), 286(b)(1), 286(b)(2), 286(c), 286(d), 286(e), 286(f), 286(g), 286(h), 2860), 286(k), 288a(a), 288a(b}(1), 288a(b}(2), 288a(c), 288a(d), 288a(d)(2), 288a(e), 288a(f), 288a(9), 288a(h), 288a(i), 288a(k), 288.2(a), 289(a), 289(b}, 289(c), 289(d), 289(e), 289(h}, 289(i),2890), 311.10(a), 311.11 (b), 311.2(a)*, 311.2(b), 311.2(c)*, 311.3(a)·, 311.4(a)', 311.4(b),311.4(c}, 311S, 311.7*, 313.1(a)·, 313.1(b)*, 3l3.1(c}', 314.1', 6471, 647.6*, 664/286{b)(1}, 664/286(b}(2), 664/286(C}, 664/286(d}, 664/ 286(a), 729(a)'
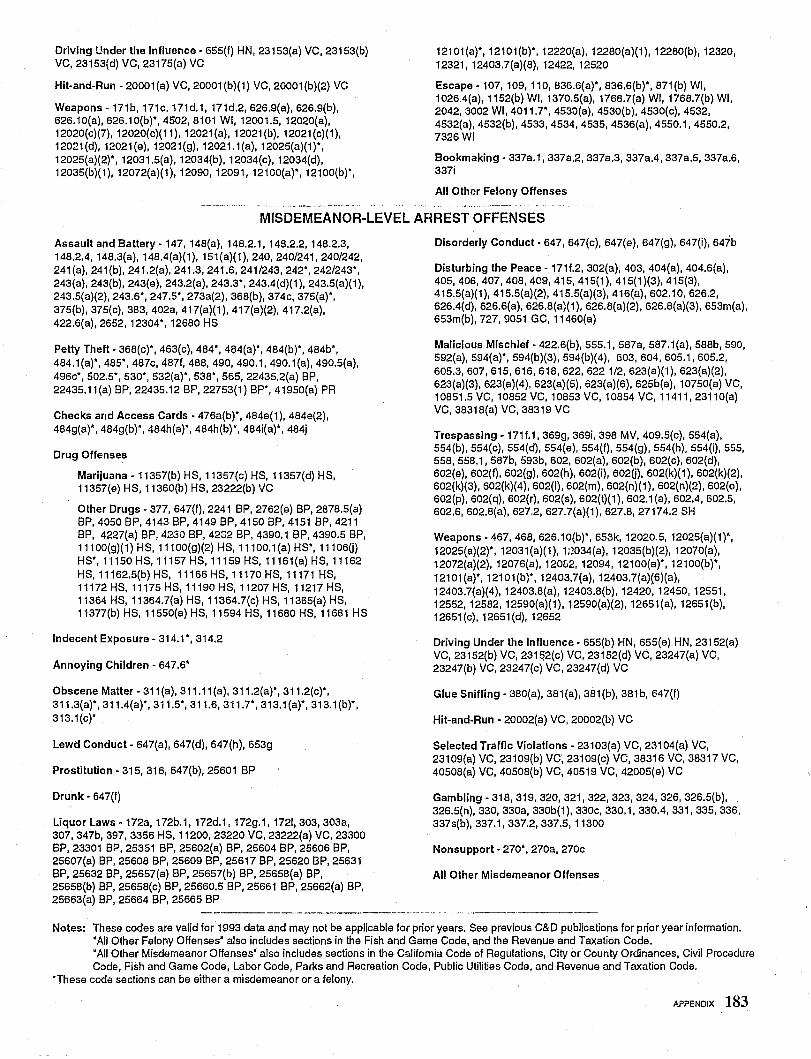
Driving Under the Influence - 655(1) HN, 23153(a) VC, 23153(b) VC, 23153(d) VC, 23175(a) VC
Hit-and-Run - 20001 (a) VC, 20001 (b)(1) VC, 20001 (b)(2) VC
Weapons -171b, 171c, 171d.1, 171d.2,626.9(a), 626.9(b), 626.10(a), 626.10(b)*, 4502, 8101 WI, 12001.5, 12020(a), 12020(c)(7), 12020(c)(11), 12021 (a), 12021 (b), 12021 (c)(1), 12021(d), 12021(9), 12021(g), 12021.1(a),12025(a)(1)*, 12025(a)(2)*, 12031.5(a), 12034(b), 12034(c), 12034(d), 12035(b)(1), 12072(a)(1), 12090, 12091, 12100(a)*, 12100(b)*,
12101(a)*, 12101(b)*, 12220(a), 12280(a)(1), 12280(b), 12320, 12321, 12403.7(a)(8), 12422, 12520
Escape - 107, 109, 110, 836.6(a)*, 836.6(b)*, 871 (b) WI, 1026.4(a), 1152(b) WI, 1370.5(a), 1768.7(a) WI, 1768.7(b) WI, 2042,3002 WI, 4011.7*, 4530(a), 4530(b), 4530(c), 4532, 4532(a), 4532(b), 4533, 4534, 4535, 4536(a), 4550.1, 4550.2, 7326 WI
Bookmaking - 337a.1, 337a.2, 337a.3, 337aA, 337a.5, 337a.6, 337i
All Other Felony Offenses
MISDEMEANOR-LEVEL ARREST OFFENSES
Assault and Battery - 147, 148(a), 148.2.1, 148.2.2, 148.2.3, 148.2.4, 148.3(a), 148A(a)(1), 151(a)(1), 240, 240/241, 240/242, 241 (a), 241 (b), 241.2(a), 241.3, 241.6, 241/243,242*, 242/243*, 243(a), 243(b), 243(e), 243.2(a), 243.3*, 243.4(d)(1), 243.5(a)(1), 243.5(a)(2), 243.6*, 247.5*, 273a(2), 368(b), 374c, 375(a)*, 375(b), 375(c), 383, 402a, 417(a)(1), 417(a)(2), 417.2(a), 422.6(a), 2652, 12304*, 12680 HS
Petty Theft - 368(c)*, 463(c), 484*, 484(a)*, 484(b)*, 484b*, 484.1 (a)*, 485*, 487c, 4871, 488, 490, 490.1, 490.1 (a), 490.5(a), 496c*, 502.5*, 530*, 532(a)*, 538*, 565, 22435.2(a) BP, 22435.11 (a) BP, 22435.12 BP, 22753(1) BP*, 41950(a) PR
Checks and Access Cards - 476a(b)*, 484e(1), 484e(2), 484g(a)*, 484g(b)*, 484h(a)*, 484h(b)*, 484i(a)*, 484j
Drug Offenses
Marijuana - 11357(b) HS, 11357(c) HS, 11357(d) HS, 11357(e) HS, 11360(b) HS, 23222(b) VC
Other Drugs - 377, 647(1), 2241 BP, 2762(e) BP, 2878.5(a) BP, 4050 BP, 4143 BP, 4149 BP, 4150 BP, 4151 BP,4211 BP, 4227(a) BP, 4230 BP, 4282 BP, 4390.1 BP, 4390.5 BP, 11100(g)(1) HS,11100(g)(2) HS,11100.1(a) HS*, 11106Q) HS*, 11150 HS, 11157 HS, 11159 HS, 11161(a) HS, 11162 HS,11162.5(b) HS, 11166 HS,11170 HS,11171 HS, 11172 HS, 11175 HS, 11190 HS, 11207 HS, 11217 HS, 11364 HS, 11364.7(a) HS, 11364.7(c) HS, 11365(a) HS, 11377(b) HS, 11550(a) HS, 11594 HS, 11680 HS, 11681 HS
Indecent Exposure - 314.1*, 314.2
Annoying Children - 647.6*
Obscene Matter - 311(a), 311.11(a), 311.2(a)*, 311.2(c)*, 311.3(al*, 311.4(a)*, 311.5*, 311.6, 311.7*, 313.1 (a)*, 313.1 (b)*, 313.1(c)*
Lewd Conduct - 647(a), 647(d), 647(h), 6539
Prostitution - 315, 316, 647(b), 25601 BP
Drunk - 647(f)
Liquor Laws -172a, 172b.l, 172d.l, 172g.1, 1721,303, 303a, 307, 347b, 397, 3356 HS, 11200,23220 VC, 23222(a) VC, 23300 BP, 23301 BP, 25351 BP, 25602(a) BP, 25604 BP, 25606 BP, 25607(a) BP, 25608 BP, 25609 BP, 25617 BP, 25620 BP, 25631 BP, 25632 BP, 25657(a) BP, 25657(b) BP, 25658(a) BP, 25658(b) BP, 25658(c) BP, 25660.5 BP, 25661 BP, 25662(a) BP, 25663(a) BP, 25664 BP, 25665 BP
Disorderly Conduct - 647, 647(c), 647(e), 647(g), 647(i), 647b
Disturbing the Peace - 1711.2, 302(a), 403, 404(a), 404.6(a), 405,406,407,408,409,415,415(1),415(1)(3),415(3), 415.5(a)(1), 415.5(a)(2), 415.5(a)(3), 416(a), 602.10,626.2, 626.4(d), 626.6(a), 626.8(a)(1), 626.8(a)(2), 626.8(a)(3), 653m(a), 653m(b), 727, 9051 GC, 11460(a)
Malicious Mischief - 422.6(b), 555.1, 587a, 587.1(a), 588b, 590, 592(a), 594(a)*, 594(b)(3), 594(b)(4), 603,604,605.1,605.2, 605.3,607,615,616,618,622,6221/2, 623(a)('t), 623(a)(2), 623(a)(3), 623(a)(4), 623(a)(5), 623(a)(6), 625b(a), 10750(a) VC, 10851.5 VC, 10852 VC, 10853 VC, 10854 VC, 11411, 23110(a) VC, 38318(a) VC, 38319 VC
Trespassing -1711.1, 369g, 369i, 398 MV, 409.5(c), 554(a), 554(b), 554(c), 554(d), 554(e), 554(1), 554(g), 554(h). 554(i), 555, 558,558.1, 587b, 593b, 602, 602(a), 602(b), 602(c), 602(d), 602(e), 602(1),602(9), 602(h), 602(i), 6020), 602(k)(1), 602(k)(2), 602(k)(3), 602(k)(4), 602(1), 602(m), 602(n)(1), 602(n)(2), 602(0), 602(p), 602(q), 602(r), 602(s), 602(t)(1), 602.1(a), 602.4, 602.5, 602.6, 602.8(a), 627.2, 627.7(a)(1), 627.8, 27174.2 SH
Weapons - 467, 468, 626.10(b)*, 653k, 12020.5, 12025(a)(1 )*, 12025(a)(2)*, 12031(a)(1), 1:W34(a), 12035(b)(2), 12070(a), 12072(a)(2), 12076(a), 120£'2, 12094, 12100(a)*, 12100(b)*, 12101(a)*, 12101(b}*, 12403.7(a), 12403.7(a)(6)(a), 12403.7(a)(4), 12403.8(a), 12403.8(b), 12420, 12450, 12551, 12552,12582, 12590(a)(1), 12590(a)(2), 12651(a), 12651(b), 12651 (c), 12651 (d), 12652
Driving Under the Influence - 655(b) HN, 655(e) HN, 23152(a) VC, 23152(b) VC, 23152(c) VC, 23152(d) VC, 23247(a) VC, 23247(b) VC, 23247(c) VC, 23247(d) VC
Glue Sniffing - 380(a), 381(a), 381(b), 381b, 647(1)
Hit-and-Run - 20002(a) VC, 20002(b) VC
Selected Traffic Violations - 23103(a) VC, 231 04(a) VC, 23109(a) VC, 23109(b) VC, 23109(c) VC, 38316 VC, 38317 VC, 40508(a) VC, 40508(b) VC, 40519 VC, 42005(e) VC
Gambling - 318,319,320, 321,322,323,324, 326, 326.5(b), 326.5(n), 330, 330a, 330b(1), 330c, 330.1, 330.4, 331, 335, 336, 337s(b), 337.1, 337.2, 337.5, 11300
Nonsupport - 270', 270a, 270c
All Other Misdemeanor Offenses
Notes: These codes are valid ior 1993 data and may not be applicable for prior years. See previous C&D publications for prior year information. 'All Other Felony Offenses' also includes sections in the Fish and Game Code, and the Revenue and Taxation Code. 'All Other Misdemeanor Offenses' also includes sections in the California Code of Regulations, City or County Ordinances, Civil Procedure Code, Fish and Game Code, Labor Code, Parks and Recreation Code, Public Utilities Code, and Revenue and Taxation Code.
'These code sections can be either a misdemeanor or a felony.
APPENDIX 183
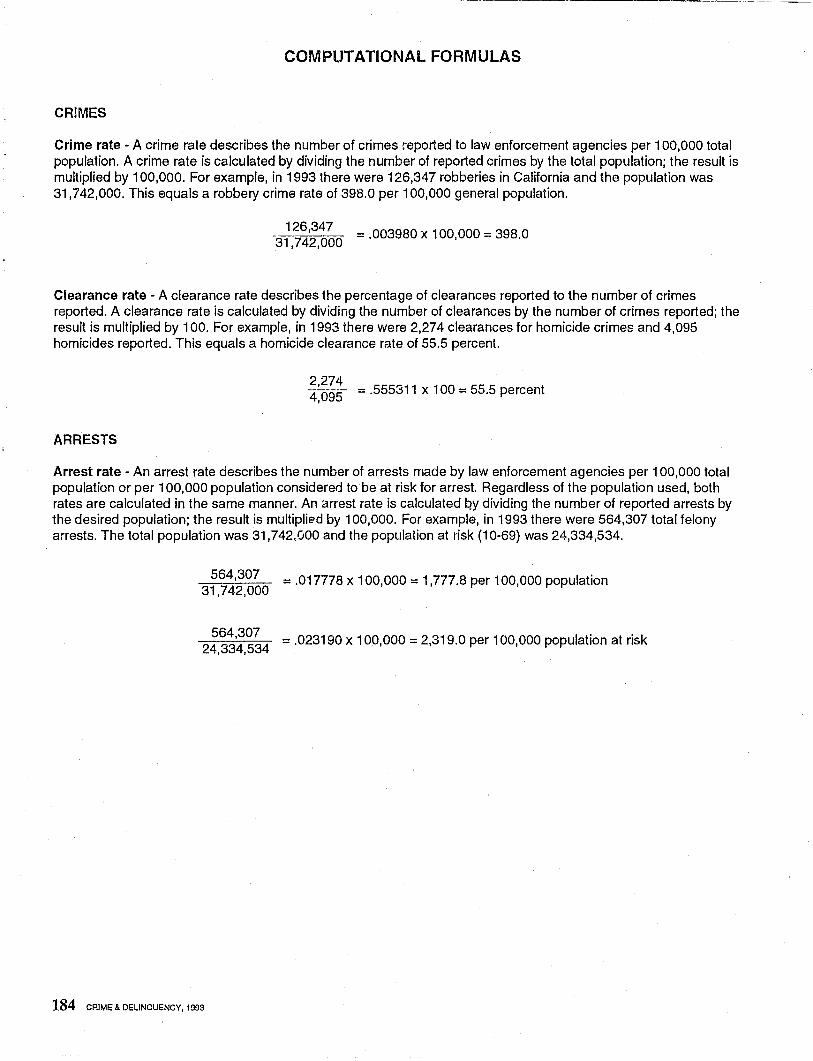
--- --~ ~ ~--
COMPUTATIONAL FORMULAS
CRIMES
Crime rate - A crime rate describes the number of crimes reported to law enforcement agencies per 100,000 total population. A crime rate is calculated by dividing the number of reported crimes by the total population; the result is multiplied by 100,000. For example, in 1993 there were 126,347 robberies in California and the population was 31,742,000. This equals a robbery crime rate of 398.0 per 100,000 general population.
126,347 31,742,000 = .003980 x 100,000 = 398.0
Clearance rate - A clearance rate describes the percentage of clearances reported to the number of crimes reported. A clearance rate is calculated by dividing the number of clearances by the number of crimes reported; the result is multiplied by 100. For example, in 1993 there were 2,274 clearances for homicide crimes and 4,095 homicides reported. This equals a homicide clearance rate of 55.5 percent.
2,274 4,095 = .555311 x 100 = 55.5 percent
ARRESTS
Arrest rate - An arrest rate describes the number of arrests made by law enforcement agencies per 100,000 total population or per 100,000 population considered to be at risk for arrest. Regardless of the population used, both rates are calculated in the same manner. An arrest rate is calculated !:?y dividing the number of reported arrests by the desired population; the result is multiplied by 100,000. For example, in 1993 there were 564,307 total felony arrests. The total population was 31,742.000 and the population at risk (10-69) was 24,334,534.
564,307 = .017778 x 100,000 = 1,777.8 per 100,000 population 31,742,000
2:,~~':,~~4 = .023190 x 100,000 = 2,319.0 per 100,000 population at risk
184 CRIME & DELINQUENCY. 1993
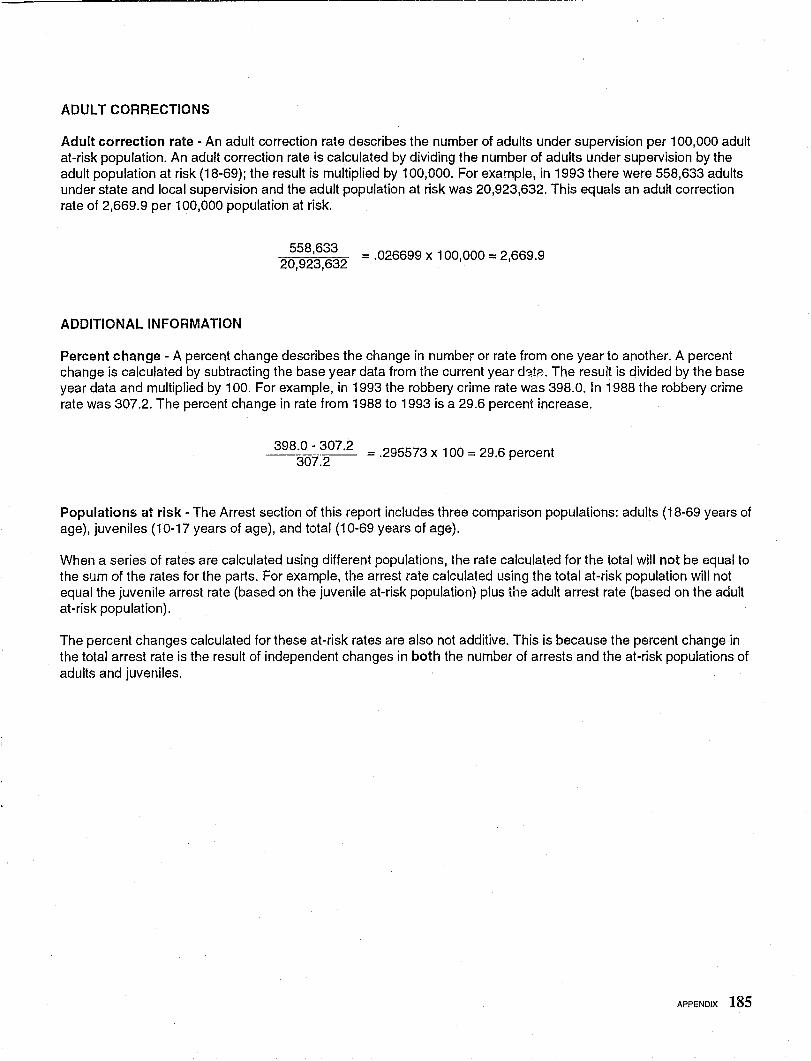
ADULT CORRECTIONS
Adult correction rate - An adult correction rate describes the number of adults under supervision per 100,000 adult at-risk population. An adult correction rate is calculated by dividing the number of adults under supervision by the adult population at risk (18-69); the result is multiplied by 100,000. For example, in 1993 there were 558,633 adults under state and local supervision and the adult population at risk was 20,923,632. This equals an adult correction rate of 2,669.9 per 100,000 population at risk.
ADDITIONAL INFORMATION
558,633 = .026699 x 100,000 = 2,669.9 20,923,632
Percent change - A percent change describes the change in number or rate from one year to another. A percent change is calculated by subtracting the base year data from the current year d~t~. The result is divided by the base year data and multiplied by 100. For example, in 1993 the robbery crime rate was 398.0. In 1988 the robbery crime rate was 307.2. The percent change in rate from 1988 to 1993 is a 29.6 percent increase.
398.0 - 307.2 ---=3-=-07=.2 = .295573 x 100 = 29.6 percent
Populations at risk - The Arrest section of this report includes three comparison popUlations: adults (18-69 years of age), juveniles (10-17 years of age), and total (10-69 years of age).
When a series of rates are calculated using different populations, the rate calculated for the total will not be equal to the sum of the rates for the parts. For example, the arrest rate calculated using the total at-risk population will not equal the juvenile arrest rate (based on the juvenile at-risk population) plus the adult arrest rate (based on the adult at-risk population).
The percent changes calculated for these at-risk rates are also not additive. This is because the percent change in the total arrest rate is the result of independent changes in both the number of arrests and the at-risk populations of adults and juveniles.
APPENDIX 185
ACKNOWLEDGEMENTS
Crime and Delinquency in California, 1993 is the result of the combi!1ed efforts of many dedicated people who do the work of processing agency reports, initiating computer runs, checking and re-checking numbers, and all the other work necessary to maintain a smooth operation. They are:
from the Statistical Data Center:
Martin Balcazar Debra Calla hand Marta Cozakas Mae Fong Sylvia Gonzalez Christina Helsley
from the S:.3.tistical Analysis Center:
Shirley Anderson Tricia Clark Bonnie Collins
Dorothy Kendall Penny Miles Toni Rose Darlene Schatz Robin Tipton
Vicki Louie Sandra Owens Michelle Rose
,i,