Embed Size (px)
Citation preview
27/04/16
1
CORPORATE PRESENTATION1Q 2016 Results Briefing – 27th April 2016
Aerial view of Phase I of Sembcorp Marine Tuas Boulevard Yard
1
Aerial view of Tuas Boulevard Yard Phase I and II
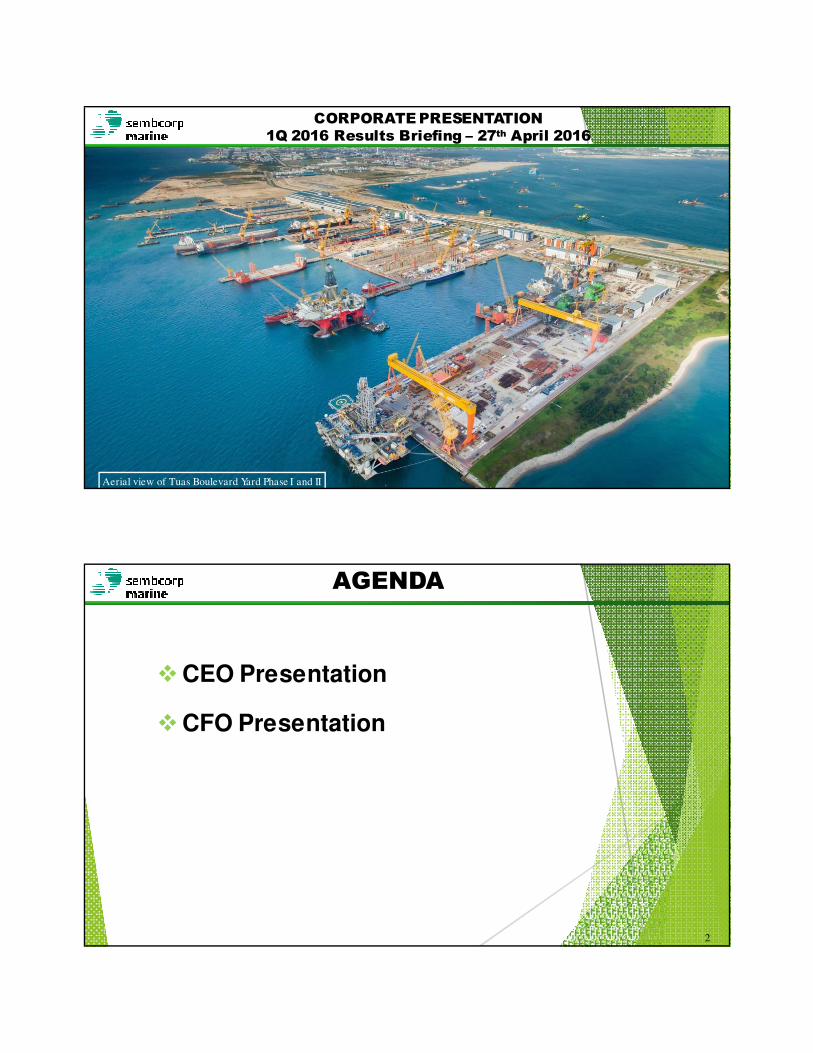
�CEO Presentation
�CFO Presentation
AGENDA
2

27/04/16
2
CEO ADDRESS
� Macro Environment remains challenging
� Update on Sete Brasil and other rig projects
� Deliveries and other activities
� Outlook and Prospects
3
� Upstream oil & gas industry
into second year of weak
prices and capex cuts.
� Market equilibrium in the oil &
gas industry remains elusive.
� Offshore rig charter rates and
utilization continue to slide.
Market equilibrium remains elusive
4Source: Reuters

27/04/16
3
Key Highlights for 1Q 2016:
� Total revenue of $918 million.
� Net Profit was S$55 million.
Financial Performance
5
106
55
1304
918
0
20
40
60
80
100
120
0
200
400
600
800
1000
1200
1400
1Q 2015 1Q 2016
S$ million
S$ million
1Q 2016 Revenue and Profit performance
Net Profit Revenue
� Brazil political upheaval continues unabated; drive to
impeach current President and deteriorating economy
adding to volatility and uncertainty.
� Sete Brasil shareholders have approved resolution to file
for judicial recovery.
� Sembcorp Marine has commenced arbitration proceedings
against various subsidiaries of Sete Brasil to preserve the
Group’s interest under the Sete Contracts.
� We believe provisions of S$329 million made in 4Q 2015
are adequate under present circumstances.
Update on Sete Brasil drillships contracts
6

27/04/16
4
� Marco Polo Drilling failed to take delivery of its rig. We have
terminated the contract and taken legal action to recover the
balance due from the customer.
� All completed rigs technically accepted by customers.
Sembcorp Marine has finalised or are finalising mutually
acceptable solutions for delivery deferment requests.
� Provisions of S$280 million taken in 4Q 2015, in case of
prolonged deferment or possible cancellation of rigs, should be
adequate under current circumstances.
Update on other drilling rig contracts
7
� Key deliveries in 1Q 2016 include the Safe Zephyrus to
Prosafe in end-January 2016 as well as the FPSO Ghana
Ten to Modec.
� Secured creditable S$60 million in new orders (all non-
drilling solutions), despite very tough market conditions.
We expect to continue to grow our orderbook.
� Net orderbook at S$9.7 billion as at March 31, 2016.
Other Operations Review
8

27/04/16
5
� Down cycle expected to be more protracted than previous
cycles.
� Sembcorp Marine prepared to face and overcome the
challenges ahead
� Acquisition of an additional 44% stake in Gravifloat on March
9, 2016 raises Sembcorp Marine’s stake to 56%
� Headcount optimization ongoing.
� Active management of balance sheet to maintain healthy
financial position.
� Foundations laid for future growth through strategic
investments in hard and soft infrastructure.
Outlook & Prospects
9
Increased stake in Gravifloat to 56% after buying an additional 44% for US$38 million
• Under the agreement, the Company will eventually increase its stake by a further 44% to 100% through an equity purchase at the same price.
• Grav iFloat was formed to design, deliver and operate re-deployable, gravity-based, modularised LNG and LPG Terminals for installation in shallow waters.
• Incorporated in Norway in 2006 as a spin-off of LMG Marin (a marine & engineering and naval architecture company), GraviFloat is headquartered in Bergen.
• Grav iFloat technology allows the LNG terminal to be fully built and completed at a shipyard and installed in shallow waters to facilitate direct ship loading of LNG.
• It offers a more cost effective solution compared with FSRU (floating, storage and regasification units) and land terminals, and can be designed for both liquefaction and receiving terminal services.
10
Growing nonGrowing non--drilling solutions drilling solutions -- GravifloatGravifloat

27/04/16
6
CFO Presentation
� Earnings Performance
� Financial Position
11
Key highlights:
For the 3 months to March 2016:
� Turnover totalled $918 million, down 30% from 1Q 2015’s $1.3 billion.
� Gross profit of $81 million on earnings recognition of ongoing
projects and deliveries.
� Group EBITDA of $106 million.
� Net profit attributable to shareholders of $55 million
� Group net orderbook stands at S$9.7 billion, including S$60 million
in new contracts secured in 1Q 2016.
Performance Highlights
12

27/04/16
7
13
FINANCIAL HIGHLIGHTS
1Q2016 TURNOVER: S$918 million
14
943 1,050 1,335 1,304
918
1,217 1,124
1,341 1,208
892 1,659
1,712
1,130
1,378
1,693
1,445
1,327
4,430
5,526 5,832
4,968
-
1,000
2,000
3,000
4,000
5,000
6,000
7,000
2012 2013 2014 2015 2016
$ m
illi
on
1Q 2Q 3Q 4Q

27/04/16
8
1Q2016 Net Profit at S$55 million
15
113 119 122 106 106 46
145 122 132 109 109
116 130 132
49 70
126 182 174
-535
99
38
-19
9
538 556 560
-290384
55
-800
-600
-400
-200
0
200
400
600
800
2012 2013 2014 2015 2015 excluding provisions and
non-operating items
2016
$ m
illi
on
1Q 2016 Net Profit: S$55 million
1Q 2Q 3Q 4Q NOI
Rigs & Floaters
59%
Repairs & Upgrades
11%
Offshore Platforms
28%
Other Activities
2%
1Q 2016 Turnover: $918 million
Rigs & Floaters
73%
Repairs & Upgrades
8%
Offshore Platforms
18%
Other Activities
1%
1Q 2015 Turnover: $1,304 million
Business Review: Turnover by Segments
16
Turnover (S$ million) 1Q 2016 1Q 2015 % change
Rigs & Floaters 540 947 (43)
Repairs & Upgrades 99 100 (1)
Offshore Platforms 261 237 10
Other Activities 18 20 (10)
TOTAL 918 1,304 (30)

27/04/16
9
17
862943
737
554644
707
459
72986 1,129 866 695 708 844 587 81
15.1
20.7
18.6
12.511.7 12.1
8.97.8
17.2
24.8
21.9
15.7
12.8
14.5
11.4
8.8
0
5
10
15
20
25
30
0
200
400
600
800
1000
1200
2009 2010 2011 2012 2013 2014 2015(excl. provisions)
1Q 2016
% m
arg
ins
$ m
illio
n
Operating Profit $m
Gross Profit $m
Operating Profit Margin %
Gross Profit Margin %
Gross and operating profit margins
0
100
200
300
400
500
600
700
800
2009 2010 2011 2012 2013 2014 2015 1Q 2016
706
646 644 642681
622
557
99
Ship repair revenue ($million)
Core Business: Repairs & Upgrades
18
Year 1Q 2016 1Q 2015 % change
No. of v essels repaired 125 121 +3
Av erage v alue per v essel ($m) 0.8 0.8 -
Total repair rev enue contribution ($m) 99 100 -1

27/04/16
10
• Rig building revenue fell 58% yoy to S$317 million in 1Q 2016,accounting for 35% of total group revenue.
• Delivered one Prosafe accommodation semi-sub in 1Q 2016.
2,127
1,108797
2,0012,295
1,803
670
150
1,508
1,940
1,408
127
836
980
447
156
228
433 996
1311
11
3635
3048
22052356
3564
3779
2428
317
0
500
1,000
1,500
2,000
2,500
3,000
3,500
4,000
2009 2010 2011 2012 2013 2014 2015 1Q 2016
S$ MILLION
Jack-up SemiSub- drilling, accomodation, well intervention, crane Drillship
Core Business: Rig Building
JACK-UP RIGS SCHEDULE
No. delivered in 1Q 2016 Nil-
No. of projects in WIP 8
* Oro Negro Vastus JU
* PC400 Jack-up, Perisai Pacific 102
* PC400 JU, Oro Negro P2045
* PC400 JU, Oro Negro P2046
* MSC CJ 70 JU, Noble Mariner
* F&G JU2000E JU, Hercules
* PC400 JU , Perisai Pacific 103
* PC400 JU, BOTL/JDC Hakuryu 14 JU 2
SEMI-SUBS / DRILLSHIPS
No. of projects delivered in 1Q 2016 1 * Prosafe accommodation semi 1
No of projects in WIP stage13 * Drillship 1st unit, SeteBrasil, Arpoador
* Helix semi-well intervention 2 (Q7000)
* Harsh-environment CS60 semi-submersible rig, Seadrill* Drillship 2
ndunit, Sete Brasil
* Prosafe accommodation semi 2
* Drillship 3rd unit, Sete Brasil• Drillship 4
thunit, Sete Brasil
* Drillship 5th
unit, Sete Brasil* Drillship 6
thunit, Sete Brasil
* Drillship 7th
unit, Sete Brasil
* 1st drillship - Transocean, JE III
* 2nd drillship for Transocean, JE III* Heerema new semi-s crane vessel
19
• Floaters revenue increased 15% yoy to $223 million in 1Q 2016
• FPSO Ghana Ten recently delivered in 1Q 2016.
• 7 projects in WIP & Planning stages
Core Business: Floaters revenue robust
-
100
200
300
400
500
600
700
800
900
2009 2010 2011 2012 2013 2014 2015 1Q 2016
599
501
719
621
336
428
891
223
$ MILLION
Revenue – Floaters ($m) Offshore conversionsNo. of
projects Brief description
No. of Projects recently delivered 1 * Ghana Ten
No. of projects in the WIP and
Planning & Engineering Stage 6 * FSO Gina Krog
* P68 FPSO for Petrobras* P71 FPSO for Petrobras
* FPSO Norte - Kaombo(Olympia)
* FPSO Libra
* FPSO Sul - Kaombo(Antartica)
No. of Projects in Planning & Engineering Stage
1 * FPSO Culzean Modec
20

27/04/16
11
-
200
400
600
800
1,000
1,200
2009 2010 2011 2012 2013 2014 2015 1Q 2016
744
319 354
774 868
925 1,017
261
Revenue - Offshore Platforms ($m)
Core Business: Offshore Platforms sales in healthy uptrend
Offshore PlatformsNo. of
projects Brief description
Number of projects delivered in 1Q 2016 - Nil
Number of projects in the WIP stage 5 * Ivar Aasen
* Wheatstone
* Siemens Dudgeon
Number of projects in Planning and
Engineering stage 1
* Maersk Culzeantopsides
* Yamal LNG Batch 3* Yamal PAU module
21
• Offshore Platforms revenue increased 10% yoy to $261 million in 1Q 2016
• 6 projects in WIP & Planning and Engineering stages.
CAPITAL, GEARING &ROE
22
Group (S$ million) Mar-16 Mar-15 % change
Shareholders' Funds 2,553 3,106 (18)
Net Debt 2,945 908 n.m.
Net Working Capital 1,888 1,204 57
Return on Equity (ROE) (%) (Annualised) 8.7 14.0 (38)
ROE - exclude NOI (%) (Annualised) 7.2 13.9 (48)
Net Asset Value (cents) 122.2 148.7 (18)
Return on Total Assets (ROTA) (%) (Annualised) 3.1 5.7 (46)
ROTA - exclude NOI (%) (Anualised) 2.7 5.7 (53)

27/04/16
12
23
CASHFLOW
Group (S$ million) 1Q 2016 1Q 2015 % change
Operating profit before working capital changes 84 174 (52)
Net cash outflow from operating activities (73) (50) 46
Net cash outflow from investing activities (149) (221) (33)
Net cash inflow from financing activities 572 306 87
Cash & cash equivalents 957 1,126 (15)
Borrowings (3,902) (2,034) 92
Net Debt (2,945) (908) n.m.
Progress Billing > WIP 336 917 (63)
292 556 693 1,009 -
1,643
314
723 -
376 1,557 439
1,292
-
1,935
1,875 1,335
871
-
1,245
3,041
3,724
10,979
4,194 4,172
3,171
60-
2,000
4,000
6,000
8,000
10,000
12,000
2009 2010 2011 2012 2013 2014 2015 2016 YTD
New Contracts Secured by Product (excludes Repairs and Upgrades)
Floaters
Offshore Platforms
Semi-submersible/intervention/crane
Jack Up
Drillship
New Contracts Secured by Product Type ($million)
24* Semisubmersibles include drilling, well intervention, accommodation and crane units

27/04/16
13
797 647 765 1,352 968
2,232 1,876 1,655 409 638 1,070
782 1,267
887 1,832 1,659
871 1,642
2,775 2,020 2,398
1,591 625 513 3,463 1,491
486 1,908 1,608
660 1,533 1,408
6,666 6,096
6,062 4,502
4,461
5,540
4,418
5,096
12,728 12,337
11,432
10,368
9,696
-
2,000
4,000
6,000
8,000
10,000
12,000
14,000
2009 2010 2011 2012 2013 2014 2015 2016 YTD
Net Order Book (excludes Repairs and Upgrades)
Floaters Offshore Platform
Jack Up Semi-submersible*
Drillship
* Semisubmersibles include drilling, well intervention, accommodation and crane units
Net Order Book at $9.7 billion
25
26
OFFSHORE PLATFORMS
18%
RIGS & FLOATERS
82%
Offshore Platforms
18%
Floaters18%
Jackup6%
* Semisubs15%
Drillships43%
At 31 Dec 2015
Total $10.4 billion
OFFSHORE PLATFORMS
17%
RIGS & FLOATERS
83%
Offshore Platforms
17%
Floaters17%
Jackup5%
* Semisubs15%
Drillships46%
At 31 March 2016
Total $9.7 billion
Net order backlog by division and product type
* Semisubmersibles include drilling, well intervention, accommodation and crane units

27/04/16
14
1Q 2016 ResultsAppendix
27
ROBUST BUSINESS MODEL

27/04/16
15
FOUR KEY CAPABILITIES
Leaders in offshore marine engineering solutions
30
27/04/16
16
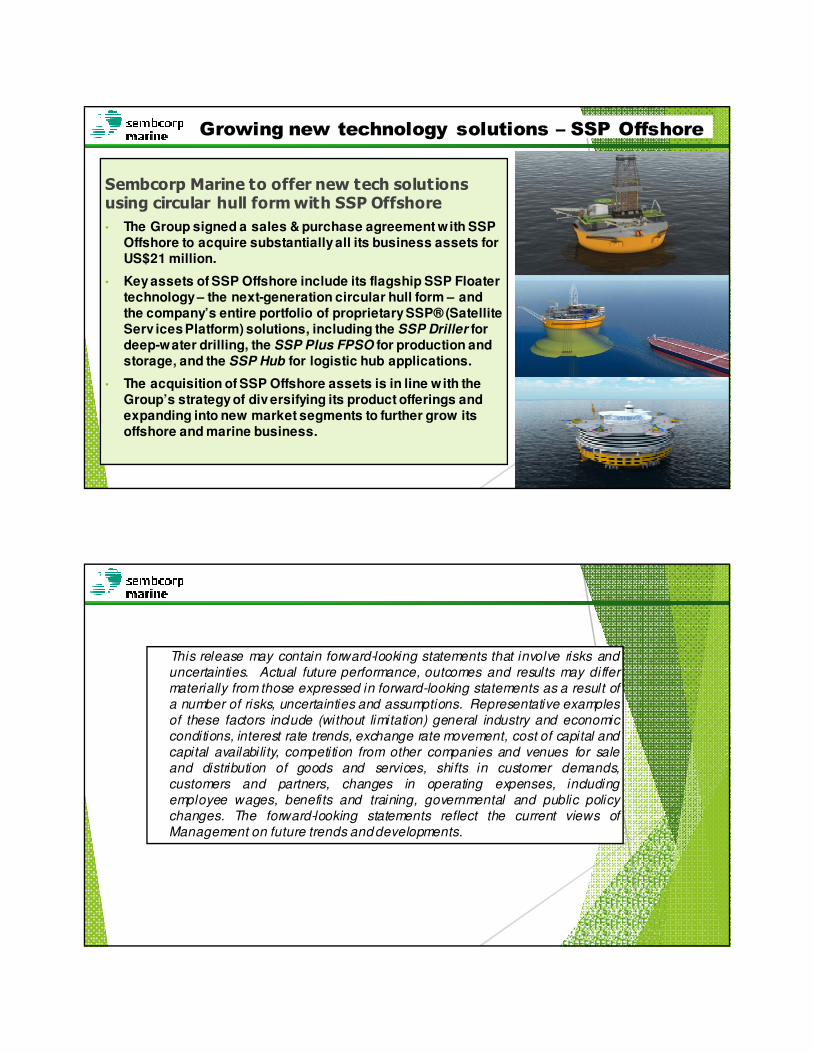
Growing new technology solutions – SSP Offshore
Sembcorp Marine to offer new tech solutions using circular hull form with SSP Offshore
• The Group signed a sales & purchase agreement with SSP Offshore to acquire substantially all its business assets for US$21 million.
• Key assets of SSP Offshore include its flagship SSP Floater technology – the next-generation circular hull form – and the company’s entire portfolio of proprietary SSP® (Satellite Serv ices Platform) solutions, including the SSP Driller for deep-water drilling, the SSP Plus FPSO for production and storage, and the SSP Hub for logistic hub applications.
• The acquisition of SSP Offshore assets is in line with the Group’s strategy of div ersifying its product offerings and expanding into new market segments to further grow its offshore and marine business.
31
This release may contain forward-looking statements that involve risks and
uncertainties. Actual future performance, outcomes and results may differ
materially from those expressed in forward-looking statements as a result of
a number of risks, uncertainties and assumptions. Representative examples
of these factors include (without limitation) general industry and economic
conditions, interest rate trends, exchange rate movement, cost of capital and
capital availability, competition from other companies and venues for sale
and distribution of goods and services, shifts in customer demands,
customers and partners, changes in operating expenses, including
employee wages, benefits and training, governmental and public policy
changes. The forward-looking statements reflect the current views of
Management on future trends and developments.