Embed Size (px)
Citation preview
CEO’s Power of Influence on Board of
Directors and its Impact on Capital
Structure
Agnieszka Trzeciakiewicz1
December 15, 2011
Abstract
This paper investigates the influence of the Chief Executive Officer on
capital structure. To quantify the magnitude of this impact the board
capture measure is constructed on the basis of CEO’s tenure,
ownership and past performance. The broader contribution of this
paper is to show that the spread of power between CEO and CFO can
in part explain the capital structure decision. It is found that the CEO’s
board capture is negatively associated with leverage and this relation
may be constrained by a strong CFO. Moreover the impact of the CFO
becomes more significant in the period of financial crisis.
Keywords: capital structure, corporate governance, financial crisis, board of
directors, agency theory.
EFM Classification: 140, 110, 150
JEL: G32, G34, G39, G01
1 Agnieszka Trzeciakiewicz; affiliation: Hull University Business School, The University of Hull,
Cottingham Road, Hull, HU6 7RX; e-mail: [email protected]; phone: (+44)
7956449100.
2
1. Introduction
Since the seminal work of Modigliani and Miller (1958) financial economists
have strongly developed research on the determinants of the capital
structure. Next to tax advantage and bankruptcy costs a commonly discussed
determinant is the manager-shareholder conflict, which in the literature is
called the agency problem (Jensen & Meckling, 1976). The agency problem is
the manager-shareholder conflict that appears in a large publicly listed firm
due to separation of ownership and control. Thus, ownership is in the hands
of shareholders who are represented by the board of directors, who have
ultimate decision-making authority. The board consists of managing
executives together with controlling and disciplining non-executive directors.
The agency costs appear as a result of conflicting interests, as the board of
directors may not act in the best interest of shareholders, but in their own.
Indeed, it cannot be expected that executives would watch over the company
as if it was their own. This risk of wealth expropriation is costly for
shareholders as they need to employ monitoring mechanisms apart from the
non-executive part of the board. The functionality of boards of directors is
questioned because of the information asymmetry that affects it. In this
regard, Monks (2008) argues that most shareholders have little control over
boards, who themselves are so weakly informed that they have reduced
ability to analyse a management’s behaviour.
The twofold impact of the agency conflict on leverage (Jensen, 1986)
dominates the literature. The theory suggests that on the one hand managers
3
would try to avoid high levels of leverage as it induces constraints on them.
On the other hand shareholders want to increase leverage to the optimal
level to reduce the agency costs and increase firm value.
This paper explores the impact of characteristics of executives on the
corporate leverage decision by focusing on the fact that managers are
heterogeneous regarding their attitude towards optimal leverage and
therefore may pursue different leverage policies. Contrary to the assumption
that managers are a homogeneous body, in line with more recent studies
(e.g., Graham, Harvey, & Puri, 2010; Wang, Shin, & Francis, 2011) we
distinguish between managers with regard to their power, responsibilities
and incentives towards financial decision making. In general executives work
in a hierarchy that provides board of directors with the greatest power of
control and the chief executive officer (CEO) with the ability to influence
corporate financial and investment decisions. In this paper, we explore the
impact of CEOs on the leverage decision. The extent of the CEO’s influence on
the decisions is determined by his power on the board. By ‘power’ is meant
the degree of influence exerted by the CEO on boards’ corporate leverage
decision. Following Hermalin & Weisbach (1998) and Masulis & Mobbs (2011)
the CEO’s power is estimated by the ‘board capture’ index. The board capture
is determined by tenure (measured by number of years), past performance
(measured by ratio of operating cash flow to total assets), and ownership
(measured by percentage shares outstanding). It increases over CEO’s tenure,
is enlarged by good past performance, and is incentivised by the CEO’s
4
ownership in the company. The more powerful the CEO becomes, the greater
is his influence on leverage decisions. Our main hypothesis in the paper is
that the CEO’s board capture is expected to be negatively associated with
leverage as higher leverage limits managerial discretion2.
Clearly, the leverage decision is not entirely determined by the CEO. The
executive that also influences the firm’s leverage policy is normally the Chief
Financial Officer (CFO) that is the other executive considered in this paper.
The CFO is in charge of the financial reporting process, which gives him a
considerable insight into the firm’s financial issues. Despite greater levels of
interest and involvement in the leverage decision making process, the degree
of his influence is determined by his power on the board in relation to the
influence (power) of the CEO.
The spread of power between the two executives (CEO and CFO) gains
relevance in terms of capital structure, considering the diverse preferences
they are likely to have towards the firm’s leverage policy3. More specifically,
the CFO in a comparison to the CEO has additional reputation incentives that
make him adhere to an optimal leverage policy (Jian & Lee, 2011). The CFO is
not at the top of a company’s hierarchy and hence the promotional
incentives are of special importance. Thus, as his appraisal is based on the
2 Moreover the main criterion of CEO’s assessment is not based on leverage policy but firm’s
performance; therefore the CEO naturally cares more about the latter. 3 Naturally, it may be the case that the CFO colludes with the CEO in determining leverage
and they act homogeneously as the agency theory predicts. Namely, the CEO and the CFO
avoid leverage. In these circumstances the spread of power between the executives loses
importance. Still, in this paper the alternative situation is explored, where the actions and
incentives of the CEO and CFO do not coincide.

5
quality of the financial policies, he would pay closer attention to the
relevance and impact of leverage policies on, for example, firm value. The
assessment of the CEO is however more likely to depend on a firm
performance. CFOs are likely to exercise monitoring using leverage that
reduce the degree of CEO’s entrenchment and hence constraints his ability to
use free cash flow freely. In other words the increase of leverage to a higher
level may be used by the CFO as a corporate governance mechanism against
the CEO’s self-serving behaviour. Furthermore, in these circumstances the
level of leverage which is desired by the CFO is more optimal in comparison
to the one preferred by the CEO, and therefore it is in line with shareholders’
preferences.
Considering the above it is argued that the impact of the CEO’s board capture
on leverage is influenced by the presence of a strong CFO. The influence of a
CEO with high board capture on leverage is more significant when the
position of CFO on the board is weaker. To assess the strength of the CFO’s
position on a board in comparison to that of the CEO the ‘CFO Index’ is
estimated.
The estimation of the CFO’s power differs from the creation of the board
capture index (from now on BC). This is driven by two aspects that underline
major differences in the CEO and CFO’s positions in a firm. Firstly, the CFO
unlike the CEO is not assessed on past performance – i.e. stronger attention
is directed towards financial policies like leverage, dividends, and investment.
Hence, past performance does not influence his power as significantly as in

6
the case of the CEO. Secondly, the CFO normally comes after the CEO in the
firm’s hierarchy. Therefore, to be strongly influential on the board he must be
independent of the CEO and stronger than he is. Thus measures used in the
creation of BC, i.e. tenure (measured by number of years as in BC) and
ownership (in percentage of shares outstanding) are not sufficient proxies.
Instead, to estimate the power of the CFO in relation to the CEO, their
attributes regarding tenure, ownership, and age are compared and captured
by the corresponding dummy variables. Also, to indicate the independence of
the CFO the number of his external affiliations is measured. A set of dummy
variables is included in the CFO Index.
The first dummy captures the CFO’s tenure – introduced as a measure of
director’s independence by Landier, Sraer, & Thesmar (2006)4. The CFO is
classified as an independent of the CEO if his tenure is longer than the CEO’s.
Longer tenure guarantees that the CEO did not participate in the CFO’s
recruitment process and therefore the risk that the CFO deepens the CEO’s
entrenchment is diminished (Fracassi & Tate, 2011).
The second dummy is based on CFO’s age, which was analysed by Acharya,
Myers, & Rajan (2011) in their analysis of executive suite based on different
time horizons of executives. The CFO’s age increases his power if he is older
than the CEO, and so carries longer work experience.
4 In Landier et al (2006) a top executive is ‘’independent from the CEO’’ if he joined the firm
before the current CEO was appointed. Therefore in the robustness test we introduce the
total number of years in a firm of CFO, including years prior the position of financial
executive.

7
The third dummy variable is derived from the CFO’s ownership, which
constitutes a sign of greater power than that of the CEO if it is larger than the
CEO’s, as it gives a greater impression of enhanced control (Denis, Denis, &
Sarin, 1997) and leads to better goals’ alignment (Jensen & Meckling, 1976).
Finally, a dummy variable is created on the basis of the number of the CFO’s
external directorships, which was introduced by Jian & Lee (2011) as a
measure of executive reputation, and by Masulis & Mobbs (2011) as a
measure of director’s quality. Having one or more external directorships by
CFO indicates his greater career independence of the CEO. Continuously he is
more likely to take a stance on the board against the CEO and thereby he
performs better as a monitor.
The analysed spread of power between the executives gains relevance in a
period of unstable economic conditions, when prompt adaptation to change
is required; for instance in the period of the recent financial crisis. Since the
monitoring efficiency of non-executive directors is adversely affected by
information asymmetry, in the need of immediate change it may decrease
significantly. Therefore in a period of financial crisis the corporate decisions
(including leverage) may be left to be made by the executive suite. Hence,
the CEO, advantaged by access to all available information, may influence
decisions to a greater extent. In contrast the CFO may be the one to be able
to determine whether the CEO’s actions are in the best interests of the firm.
As a result of possessing different incentives from the CEO, he can monitor
and influence the CEO’s impact on leverage and other financial decisions.
8
For empirical purposes both indexes (BC and CFO Index) are created with the
application of Principal Component Analysis (PCA). PCA is a system that seeks
a linear combination of variables so that the maximum variance is extracted.
Once the system extracts the maximum variance it excludes it and seeks the
next one. In this analysis the first components are used as indexes. Using an
index helps to control for multicollinearity problems that may arise when
several determinants are used in cross-sectional analysis (Florackis & Ozkan,
2009; Fracassi & Tate, 2011). Additionally, as it decreases dimensions in the
data it eases the interpretation of results.
This research strongly contributes to the corporate finance literature.
Specifically, in one of the first academic attempts, the effect of a powerful
CEO on the leverage policy conditional on the presence of a stronger CFO is
analysed. Consequently, the outcomes of this research contribute to the
recent stream of research in the area of corporate governance that
investigates the executive part of the board (Acharya, et al., 2011; Chava &
Purnanandam, 2010; Fracassi & Tate, 2011; Hermalin & Weisbach, 1998;
Landier, et al., 2006; Masulis & Mobbs, 2011; Wang, Shin, & Francis, 2011).
The examination of the CEO’s power explores the board capture measure
introduced by Hermalin & Weisbach (1998) and Masulis & Mobbs (2011).
Also, this research adds value to the emerging stream of literature that
proves the importance of managerial characteristics’ impact on corporate
decisions (Baker et al., 2005; Bertrand and Schoar, 2003; Graham et al., 2008;
Malmendier et al., 2010; Malmendier and Tate, 2005). The distinctive feature
9
of this research is that it not only considers the CEO’s characteristics as in
Malmendier, et al. (2010) and Malmendier & Tate (2005) but it also
introduces the features of the CFO. Previous studies did not consider them
simultaneously because of data unavailability. More to the point,
Malmendier, et al. (2010) and Malmendier & Tate (2005) support their
analysis by the assumption that normally the CEO and the CFO agree on
financial decisions, and so the features of the CEO should be the most
important managerial characteristics in determining the level of leverage.
However in this paper an alternative situation is analysed, that is when the
CEO and the CFO do not agree on financial decisions.
Furthermore in this paper, light is shed on the spread of power between CEO
and CFO and its impact on leverage in conditions of financial crisis –
conditions in which information asymmetry has particular impact. This
develops the idea initiated by Landier, Sraer and Thesmar (2006) who argue
that in unstable economic conditions the presence of strong executives in the
means of corporate governance becomes even more relevant than the
independent boards of directors. The test of a strong CFO presence on the
board during the period 2007-2009 builds on the research of Schoar and
Washington (2011), who suggest that good corporate governance practices
are born in bad times. Also the study benefits from the UK data, which is
affected by the British regulatory system that fails to enforce the duties of
non-executive directors and consequently leads to their passive approach
10
and facilitates the greater entrenchment of the CEO (Franks, Mayer, &
Renneboog, 2001).
The remainder of the paper is structured as follows. Section 2 develops the
hypotheses. Section 3 defines the main variables and describes the dataset
used. Section 4 presents empirical analysis. Section 5 concludes.
2. Hypothesis development
2.1. CEO’s characteristics and its impact on leverage
The structure of responsibility and power of decision making in publicly
traded companies is hierarchical. Executives in these firms work in a
hierarchy with the CEO at the top. As a result the CEO is the most powerful
individual on the board regarding financial decision making (Graham, Harvey,
& Puri, 2010; Wang, et al., 2011). He is the one that can make the decision
himself, or delegate it to a subordinate, who in the significant majority of
cases is the CFO. If the CEO decides on leverage he has incentives to have a
lower leverage than preferred by shareholders (Berger, Ofek, & Yermack,
1997), because a high level of debt in the capital structure reduces
managerial discretion and flexibility. Whether he delegates the decision or
not depends on his abilities to use the discretion as well as his influence on
the board of directors. As his power increases and other directors are under
his influence, the possibility of leverage delegation declines. The CEO’s
strength is also associated with lower effectiveness of the board of directors,
as the CEO’s subordinates, being under his influence, are less likely to take a
11
stance on the board to challenge him (Masulis & Mobbs, 2011). This
inefficiency suggests an alternative explanation of the negative association
between CEO’s power and leverage, namely, excessive influence of the CEO
on the board may be badly perceived by the market, which would result in
higher costs of borrowing. Consequently that would reduce firm’s ability to
borrow and leverage would decrease.
To quantify the dominance of the CEO, the board capture (BC) index is
constructed. The term ‘board capture’ comes from the agency theory
literature and has been developed by Hermalin & Weisbach (1998) and
Masulis & Mobbs (2011). It expresses the power of the CEO to influence the
decision making of the board. High board capture is also associated with
lower efficiency of subordinates in terms of interactions with the CEO.
Specifically, subordinates who are strongly influenced by the CEO are less
likely to take a stance on the board to challenge him.
The BC proxy consists of three components as suggested by Hermalin &
Weisbach (1998) and Masulis & Mobbs (2011), i.e. CEO’s tenure, ownership
and past performance. Following, the relationships between the components
and BC are examined.
Firstly the CEO’s tenure is discussed. Over the tenure the CEO participates in
the recruitment processes of more inside directors; hence he may select the
kind of directors that will be loyal to him and more importantly will facilitate
his entrenchment. Individuals chosen by the CEO are less likely to act against
12
him, and as a result board indepenedence declines over the course of the
CEO’s tenure. The tenure improves the experience of the CEO, which
consequently decreases his relience on subordinates and so makes
delegation of decisions (including leverage) less frequent (Berger, et al., 1997;
Frank & Goyal ,2007; Graham, et al., 2010). Therefore a positive relationship
between tenure and BC is expected.
The second component of the board capture is CEO’s ownership. In the Board
Capture Index the ownership is used as a proxy for the managerial ability of
financial decisions making. Therefore the prediction is in line with the
argument, which suggests that shareholders and subordinates trust a CEO
with greater ownership as he bears part of the residual risk. This confidence
in the CEO results in lower turnover of CEOs. Moreover, from the perspective
of the CEO it implies an impression of enhanced control (Denis, et al., 1997;
Eckbo & Thorburn, 2003; Mikkelson & Partch, 1997). Thus it can be expected
that ownership positively influences board capture and so, negatively impacts
leverage. The counter argument that uses ownership as the managerial
incentive proxy comes from the seminal work of Jensen & Meckling (1976).
This traditional approach indicates that ownership’s relation with leverage is
non-monotonic. That is, at lower levels it may help to align the CEO’s
interests with those of shareholders. Managers bearing part of cost of their
action would not favour value-decreasing activities; in this case, decrease of
leverage. Hence, at lower levels, ownership is positively associated with
leverage. However, when ownership reaches a higher level it may lead to
13
managerial entrenchment, which would encourage decrease of the level of
leverage in a firm. The third analysed component of board capture is the
CEO’s past performance. Empirical evidence suggests that past performance
increases the CEO’s power by giving him greater influence on financial
decisions (Hermalin & Weisbach, 1998; Jian & Lee, 2011; Masulis & Mobbs,
2011). Moreover a CEO with good past performance faces lower risk of
replacement. Hence, it is expected that good past performance positively
contributes to the board capture. In conclusion, all three CEO’s
characteristics collectively are expected to contribute positively to the board
capture index, and hence negatively to the level of leverage.
H1. The board capture of CEO is associated negatively with leverage.
2.2. Efficiency of the independent board in monitoring
CEO’s power and its impact on leverage.
The important issue related to the agency conflict between the CEO and
shareholders is the composition of the board. Specifically, the board’s
independence proxied by a percentage share of non-executives (outside
directors) on the board is expected to have an influence on managerial
incentives (Hermalin & Weisbach, 2003). Independent boards are employed
to monitor the executives so they act in the best interest of shareholders
(Mayers, Shivdasani, & Smith, 1997), and hence they have incentives to
monitor the CEO (Fama & Jensen, 1983). Therefore, in case the CEO acts in
his best interest and decreases leverage, an independent board is expected
to signal this behaviour or to constrain it. For this purpose outside directors

14
may employ leverage policy, and by increasing it reduce agency costs created
by CEO, and simultaneously increase the firm’s value. The monitoring quality
of managers by independent directors is positively associated with the
percentage share of the outside directors on the board (Rosenstein & Wyatt,
1990). Hence, a positive relation between percentage share of the outside
directors on the board and leverage is expected (Berger, et al., 1997;
Rosenstein & Wyatt, 1990; Weisbach, 1988).
H2. The independence of the board of directors (measured by NED) is
positively associated with leverage.
Nonetheless, there exists evidence that independent boards of directors as a
corporate governance mechanism have several inefficiencies (Acharya, et al.,
2011; Agrawal & Knoeber, 1996; Franks, et al., 2001; Monks, 2008). Firstly
the quality of monitoring is strongly affected by the information assymetry
between boards and management. Outside directors are mainly criticised for
lack of information about the firm (Hermalin & Weisbach, 1991). Because of
low frequency of meetings, the information flow is poor and board decisions
may be taken by the executive part of the board which is more competent
and well informed. Secondly, shareholders do not have control over boards
because of their dispersion.
2.3. The importance of CFO index in affecting CEO’s
board capture and its impact on leverage.
Considering the above mentioned inefficiency of the independent part of the
board, the recent corporate governance research directs attention to the
15
composition of the executive suite (Acharya, et al., 2011; Fracassi & Tate,
2011; Jian & Lee, 2011; Landier, et al., 2006; Masulis & Mobbs, 2011). The
combination of executives that creates the executive part of the board is of
special importance as it determines the quality of information that is
provided to the board, and is fundamental for the decision making process. In
this paper it is leverage decision that is explored. Therefore the attention is
drawn towards the two executive directors most important in deciding on
leverage, not the whole executive suite. These are the CEO - the top
executive director, whose power was discussed in section 2.1; and the CFO -
who is in charge of the financial reporting process, which gives him
considerable insights into a firm’s financial issues. As discussed above the
CEO may decide on leverage by himself or to some extent allow this decision
to be influenced by the CFO. The degree of influence on the decision by the
CFO depends on his power on the board relative to the influence of the CEO.
The spread of power between the two executives is of special importance
because of various policies that they may have incentives to adhere.
Specifically, the CFO may prefer a higher level of leverage than the CEO to
reduce the CEO’s entrenchment. The difference of preferences towards
leverage between CEO and CFO is caused by the CFO’s greater attention to
his reputation, on which his promotion depends. The CFO is assessed on the
basis of the financial policies (including leverage); therefore normally he
would treat them with special vigilance.
16
To quantify if the CFO is powerful enough to dominate CEO’s decisions or at
least influence him the CFO Index is constructed. The index is constructed on
the basis of previous studies (Acharya, et al., 2011; Jian & Lee, 2011; Landier,
et al., 2006; Masulis & Mobbs, 2011; Wang, et al., 2011) that underline the
importance of individual features of the total executive suite (or CEO’s
subordinates), in addition to data analysis. Therefore the CFO Index
incorporates the following components: age, tenure, and ownership, which
compare the CEO to CFO, and number of external directorships, which
indicates CFO’s independence.
The first component is tenure. It is incorporated in the index as a dummy
variable which takes a value of one if the CFO has longer tenure than the CEO.
There are two reasons why longer tenure contributes to a greater CFO index.
Firstly, longer tenure in comparison to the CEO gives the CFO greater
experience, which gives him superior power to make financial decisions (as a
result of delegation by a less experienced CEO). Secondly the fact that the
CFO has worked in a company for a longer period of time means that the CEO
did not participate in his recruitment process, and so the possibility that the
CFO was chosen to enlarge the current CEO’s power may be excluded
(Acharya, Myers and Rajan, 2011; Berger, Ofek and Yermack, 1997; Frank and
Goyal, 2007; Landier, Sraer and Thesmar, 2006; Masulis and Mobbs, 2011).
The second component compares CEO and CFO in terms of age. The value of
one is given if the CFO is older than the CEO. In general, the older a manager
gets, the more power he gains; which puts him in a good position in front of

17
the board and shareholders. The greater power comes with all the
characteristics that are associated with larger expertise, life experience and
stability. Hence, older age should improve the CFO’s dominance over CEO
(Bryan, Hwang, & Steven, 2000; Carlson & Karlsson, 1970; Hambrick & Mason,
1984).
The third component compares ownership of the CEO and CFO. If the CFO
has larger ownership it contributes in a positive way to the CFO index. The
argument follows the above discussion of the CEO’s ownership where it was
indicated that an ownership is a measure of the managerial ability. Therefore
the CFO’s ownership is positively associated with residual risk and so it aligns
the CFO’s goals with shareholders’ (Jensen and Meckling (1976 ) in a drive
towards an optimal capital structure. Additionally larger ownership may
indicate the CFO’s greater compensation for the value he adds to the board,
and so may indicate larger impact on decision making. Also it is associated
with greater exposure of the CFO, therefore his moves are more carefully
observed.
The fourth and the last component of the CFO index is the presence of his
external directorships in listed companies5. The CFO’s holding of external
directorships presents his greater career independence of CEO, as it creates
additional opportunities for promotion (Fama & Jensen, 1983; Jian & Lee,
2011; Masulis & Mobbs, 2011). Also it increases the value of reputation for
5 In this paper external directorships are not classified in any other way than directorship in a
listed firm, i.e. there is no difference between non-executive and executive directorship.
Hence, this may be an interesting direction for further research.
18
the CFO as he is exposed to more firms. As a result it creates an additional
incentive to act in the best interest of shareholders. A CFO with external
directorship also has greater impact on the CEO, as being reputable he is
likely to be promoted within the firm. Therefore, the generated risk of
replacement negatively affects CEO’s entrenchment.
In conclusion, a high CFO index is expected to impact leverage in a more
positive way than CEO’s board capture, especially if BC reaches a high level as
at this point the CEO may try to enforce the entrenched behaviour. When the
power of the CEO’s influence is too high, the CFO to keep a good reputation
needs to create constraints to optimise the CEO’s behaviour. In addition, the
high level of the CFO index represents a presence of an independent
executive aligned with shareholders. Hence, it is associated with optimal
financial policies (including leverage), and information asymmetry is
improved by the quality of the financial information reported to the board.
Therefore it should be desirable in the governance structure.
H3. CFO Index is positively associated with leverage, when level of BC is
high.
2.4. Effectiveness of regulating CEO’s board capture by
independent boards and CFO in times of financial
crisis
As in a period of financial crisis the reaction to change needs to be prompt,
the monitoring function of boards of directors may fail because of low
frequency of meetings and the consequent increase in information assymetry.
19
Subsequently, the independence of the board (measured by share of non-
executive directors) becomes less relevant in determining leverage (Monks,
2008). Instead, what becomes more important is the executive part of the
board, which consists of executives that have a vital knowledge of company’s
insights and who decide on financial policies in these unstable circumstances
(Acharya, et al., 2011; Graham, et al., 2010; Jian & Lee, 2011; Landier, et al.,
2006; Masulis & Mobbs, 2011; Wang, et al., 2011). Hence it is expected that
the CFO, being closer to daily operations of a company, is able to monitor the
CEO’s power more efficiently than the board of directors (and especially
more than its non-executive part). Therefore in this paper it is argued that in
a period of financial crisis, the impact of the independent board is reduced
and the influence of the CFO gains in significance, not only in regulating the
power of the CEO but also in determining leverage.
H4. The direct impact of the independent board on leverage becomes less
significant in a period of financial crisis
H5. The indirect impact of the independent board through interaction with
the CEO) on leverage is less significant in a period of financial crisis.
H6. The significance of CFO’s direct influence on leverage increases in a
period of financial crisis.
H7. The significance of CFO’s monitoring of CEO (CFO indirect impact on
leverage) increases in a period of financial crisis.
20
3. Sample selection and data description
3.1. Dataset
For the empirical analysis a sample is used that comprises 2279 firm-year
observations on 330 firms listed on the London Stock Exchange over the
period from year 2000 to 2009. Part of the empirical analysis is exploring the
data with division for three generated sub-periods. Sub-periods accumulate
data in the following manner: period 1 (normal period) include the years
from 2000 until 2004; period 2 (pre-crisis period) contains data from 2005
until 2006; period 3 (crisis period) includes data from the remaining years, i.e.
2007-2009. Accounting and market variables are obtained from
DATASTREAM. Specifically DATASTREAM is used to collect long term debt,
earnings before interest and taxation (EBIT), total assets, net cash flow from
operating activities, market value of equity, property plant and equipment
expenses, number of shares outstanding and industry classification.
Information on CEO and CFO ownership and board characteristics is obtained
manually from Corporate Register6, Thomson One Banker, and BoardEx. In
particular these sources are used to extract the following information: CEO
and CFO tenure, age, and ownership; CFO’s number of external directorships;
number of executive and non-executive directors on a board. Definitions of
all variables used in the analysis together with specified data sources are
presented on Table 1.
6 As the Corporate Register is issued on a quarterly basis the December issue of each year is
used as annual data. Also Thomson One Banker provides ownership data in quartiles; hence
if data was missing in the Corporate Register, the 4th
quartile of the year from Thomson One
is used to complete the record.
21
Several screening criteria were applied to the data before carrying out the
empirical analysis. Firstly all firms from the financial sector were excluded
because of their regulatory conditions and difference from corporations’
policies and financial ratios. Secondly the dataset was cleared from outliers
(that lie outside the 1st
and 99th
percentile). Finally, to allow for more
efficient analysis of unbalanced panel, only those corporations that had a
minimum of four uninterrupted years of observations were kept in the
dataset.
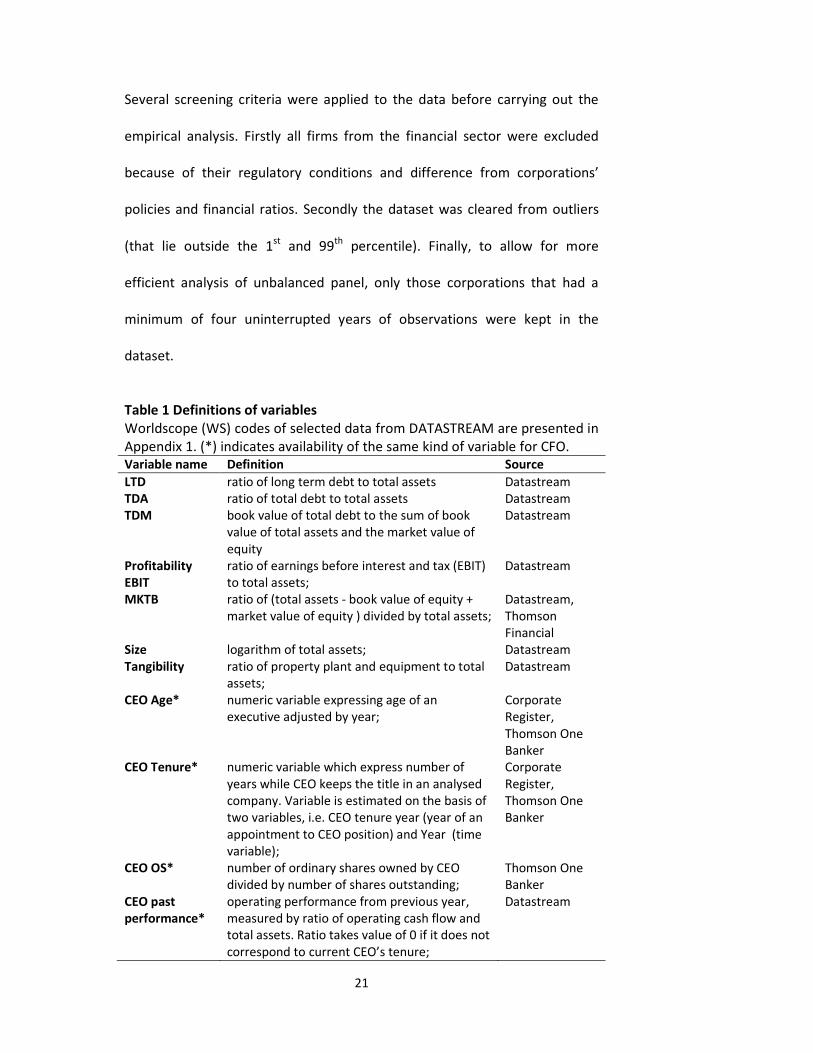
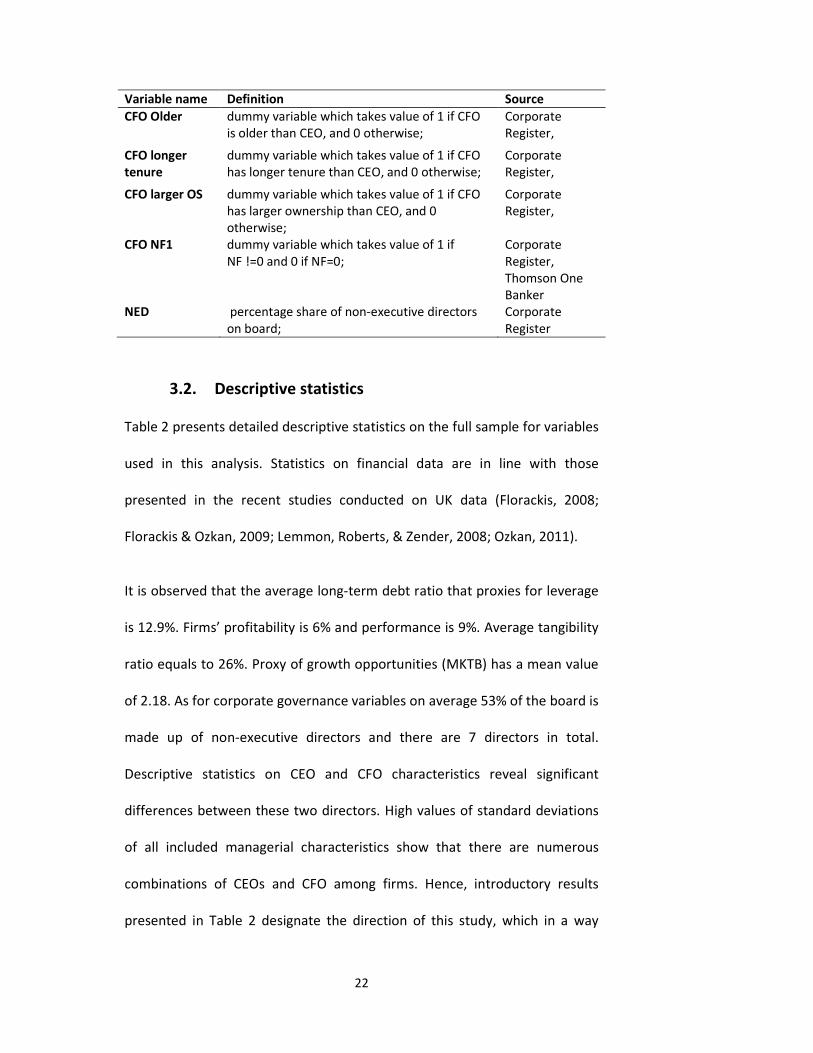
Table 1 Definitions of variables
Worldscope (WS) codes of selected data from DATASTREAM are presented in
Appendix 1. (*) indicates availability of the same kind of variable for CFO.
Variable name Definition Source
LTD ratio of long term debt to total assets Datastream
TDA ratio of total debt to total assets Datastream
TDM book value of total debt to the sum of book
value of total assets and the market value of
equity
Datastream
Profitability
EBIT
ratio of earnings before interest and tax (EBIT)
to total assets;
Datastream
MKTB ratio of (total assets - book value of equity +
market value of equity ) divided by total assets;
Datastream,
Thomson
Financial
Size logarithm of total assets; Datastream
Tangibility ratio of property plant and equipment to total
assets;
Datastream
CEO Age* numeric variable expressing age of an
executive adjusted by year;
Corporate
Register,
Thomson One
Banker
CEO Tenure* numeric variable which express number of
years while CEO keeps the title in an analysed
company. Variable is estimated on the basis of
two variables, i.e. CEO tenure year (year of an
appointment to CEO position) and Year (time
variable);
Corporate
Register,
Thomson One
Banker
CEO OS* number of ordinary shares owned by CEO
divided by number of shares outstanding;
Thomson One
Banker
CEO past
performance*
operating performance from previous year,
measured by ratio of operating cash flow and
total assets. Ratio takes value of 0 if it does not
correspond to current CEO’s tenure;
Datastream
22
Variable name Definition Source
CFO Older dummy variable which takes value of 1 if CFO
is older than CEO, and 0 otherwise;
Corporate
Register,
CFO longer
tenure
dummy variable which takes value of 1 if CFO
has longer tenure than CEO, and 0 otherwise;
Corporate
Register,
CFO larger OS dummy variable which takes value of 1 if CFO
has larger ownership than CEO, and 0
otherwise;
Corporate
Register,
CFO NF1 dummy variable which takes value of 1 if
NF !=0 and 0 if NF=0;
Corporate
Register,
Thomson One
Banker
NED percentage share of non-executive directors
on board;
Corporate
Register
3.2. Descriptive statistics
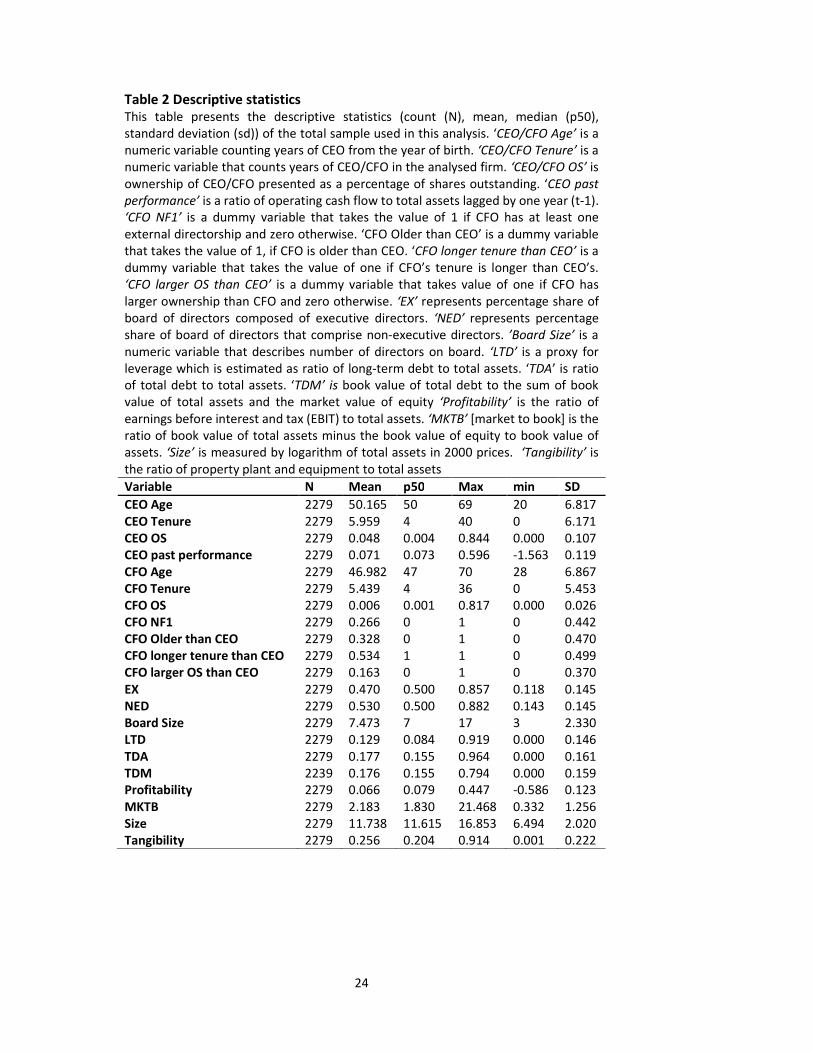
Table 2 presents detailed descriptive statistics on the full sample for variables
used in this analysis. Statistics on financial data are in line with those
presented in the recent studies conducted on UK data (Florackis, 2008;
Florackis & Ozkan, 2009; Lemmon, Roberts, & Zender, 2008; Ozkan, 2011).
It is observed that the average long-term debt ratio that proxies for leverage
is 12.9%. Firms’ profitability is 6% and performance is 9%. Average tangibility
ratio equals to 26%. Proxy of growth opportunities (MKTB) has a mean value
of 2.18. As for corporate governance variables on average 53% of the board is
made up of non-executive directors and there are 7 directors in total.
Descriptive statistics on CEO and CFO characteristics reveal significant
differences between these two directors. High values of standard deviations
of all included managerial characteristics show that there are numerous
combinations of CEOs and CFO among firms. Hence, introductory results
presented in Table 2 designate the direction of this study, which in a way
23
explores interaction between CEO and CFO. The differences are indicated by
mean values of the complete sample. On average CEO is 4 years older than
CFO and also has longer tenure (CEO’s tenure = 5.96; CFO’s tenure= 5.44).
Differences are also visible in ownerships held by them. Specifically CEOs hold
4.84% of shares outstanding, which is almost ten times larger equity
ownership than that of CFOs, who hold on average 0.59% of shares
outstanding. External directorships are held by 27% of CFOs in the analysed
dataset.
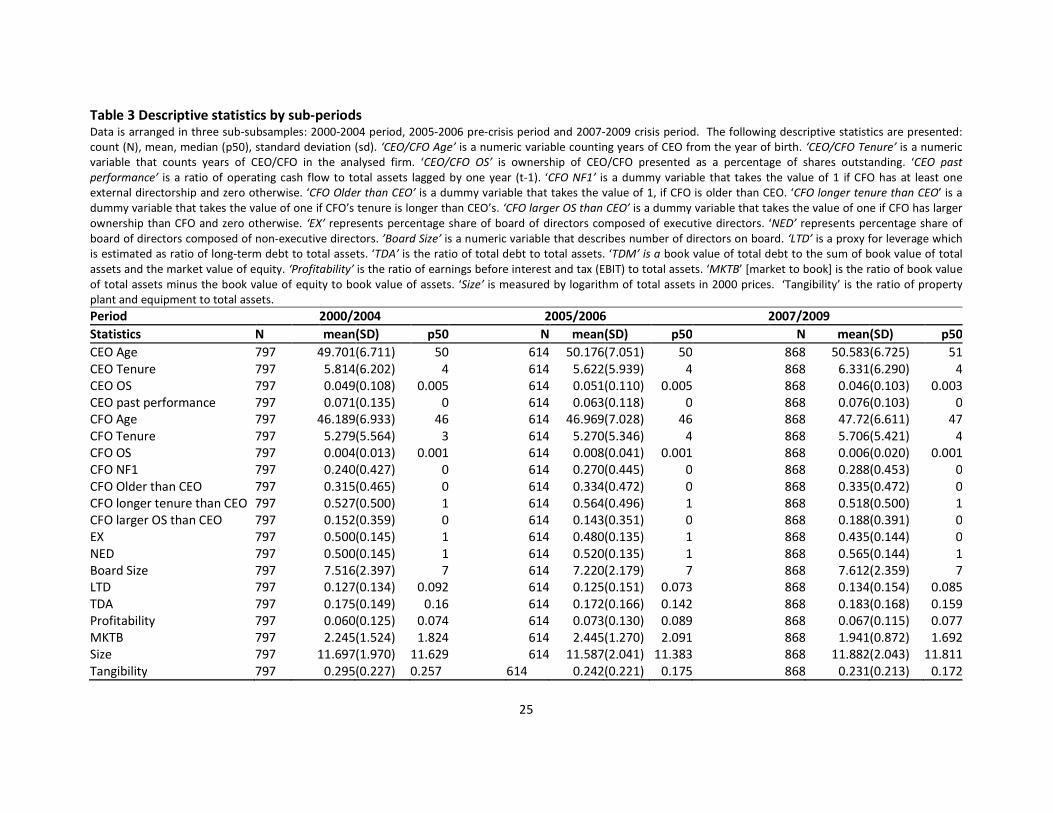
By sorting firms within each sub-period (i.e. 2000/2004, 2005/2006,
2007/2009) it is possible to control for cross-period differences in the capital
structure and its determinants, as it is summarised in Table 3. So, the level of
leverage measured by all three proxies rises (LTD from 12.7% in period 1 to
13.4% in period 3; TDA from 17.5% to 18.3%, and TDM from 17.3% to 18.2%).
Changes are also visible among controlling financial determinants, where for
instance level of profitability falls from 7.3% in the pre-crisis period to 6.7% in
the crisis. Level of growth opportunities also falls from 2.445 mean value
prior to the crisis to 1.941 in the crisis. The analysis of changes between
personal characteristics of CEO and CFO will be more interpretable once
accumulated into indexes in section 4.1
24
Table 2 Descriptive statistics This table presents the descriptive statistics (count (N), mean, median (p50),
standard deviation (sd)) of the total sample used in this analysis. ‘CEO/CFO Age’ is a
numeric variable counting years of CEO from the year of birth. ‘CEO/CFO Tenure’ is a
numeric variable that counts years of CEO/CFO in the analysed firm. ‘CEO/CFO OS’ is
ownership of CEO/CFO presented as a percentage of shares outstanding. ‘CEO past
performance’ is a ratio of operating cash flow to total assets lagged by one year (t-1).
‘CFO NF1’ is a dummy variable that takes the value of 1 if CFO has at least one
external directorship and zero otherwise. ‘CFO Older than CEO’ is a dummy variable
that takes the value of 1, if CFO is older than CEO. ‘CFO longer tenure than CEO’ is a
dummy variable that takes the value of one if CFO’s tenure is longer than CEO’s.
‘CFO larger OS than CEO’ is a dummy variable that takes value of one if CFO has
larger ownership than CFO and zero otherwise. ‘EX’ represents percentage share of
board of directors composed of executive directors. ‘NED’ represents percentage
share of board of directors that comprise non-executive directors. ’Board Size’ is a
numeric variable that describes number of directors on board. ‘LTD’ is a proxy for
leverage which is estimated as ratio of long-term debt to total assets. ‘TDA’ is ratio
of total debt to total assets. ‘TDM’ is book value of total debt to the sum of book
value of total assets and the market value of equity ‘Profitability’ is the ratio of
earnings before interest and tax (EBIT) to total assets. ‘MKTB’ [market to book] is the
ratio of book value of total assets minus the book value of equity to book value of
assets. ‘Size’ is measured by logarithm of total assets in 2000 prices. ‘Tangibility’ is
the ratio of property plant and equipment to total assets
Variable N Mean p50 Max min SD
CEO Age 2279 50.165 50 69 20 6.817
CEO Tenure 2279 5.959 4 40 0 6.171
CEO OS 2279 0.048 0.004 0.844 0.000 0.107
CEO past performance 2279 0.071 0.073 0.596 -1.563 0.119
CFO Age 2279 46.982 47 70 28 6.867
CFO Tenure 2279 5.439 4 36 0 5.453
CFO OS 2279 0.006 0.001 0.817 0.000 0.026
CFO NF1 2279 0.266 0 1 0 0.442
CFO Older than CEO 2279 0.328 0 1 0 0.470
CFO longer tenure than CEO 2279 0.534 1 1 0 0.499
CFO larger OS than CEO 2279 0.163 0 1 0 0.370
EX 2279 0.470 0.500 0.857 0.118 0.145
NED 2279 0.530 0.500 0.882 0.143 0.145
Board Size 2279 7.473 7 17 3 2.330
LTD 2279 0.129 0.084 0.919 0.000 0.146
TDA 2279 0.177 0.155 0.964 0.000 0.161
TDM 2239 0.176 0.155 0.794 0.000 0.159
Profitability 2279 0.066 0.079 0.447 -0.586 0.123
MKTB 2279 2.183 1.830 21.468 0.332 1.256
Size 2279 11.738 11.615 16.853 6.494 2.020
Tangibility 2279 0.256 0.204 0.914 0.001 0.222
25
Table 3 Descriptive statistics by sub-periods Data is arranged in three sub-subsamples: 2000-2004 period, 2005-2006 pre-crisis period and 2007-2009 crisis period. The following descriptive statistics are presented:
count (N), mean, median (p50), standard deviation (sd). ‘CEO/CFO Age’ is a numeric variable counting years of CEO from the year of birth. ‘CEO/CFO Tenure’ is a numeric
variable that counts years of CEO/CFO in the analysed firm. ‘CEO/CFO OS’ is ownership of CEO/CFO presented as a percentage of shares outstanding. ‘CEO past
performance’ is a ratio of operating cash flow to total assets lagged by one year (t-1). ‘CFO NF1’ is a dummy variable that takes the value of 1 if CFO has at least one
external directorship and zero otherwise. ‘CFO Older than CEO’ is a dummy variable that takes the value of 1, if CFO is older than CEO. ‘CFO longer tenure than CEO’ is a
dummy variable that takes the value of one if CFO’s tenure is longer than CEO’s. ‘CFO larger OS than CEO’ is a dummy variable that takes the value of one if CFO has larger
ownership than CFO and zero otherwise. ‘EX’ represents percentage share of board of directors composed of executive directors. ‘NED’ represents percentage share of
board of directors composed of non-executive directors. ’Board Size’ is a numeric variable that describes number of directors on board. ‘LTD’ is a proxy for leverage which
is estimated as ratio of long-term debt to total assets. ‘TDA’ is the ratio of total debt to total assets. ‘TDM’ is a book value of total debt to the sum of book value of total
assets and the market value of equity. ‘Profitability’ is the ratio of earnings before interest and tax (EBIT) to total assets. ‘MKTB’ [market to book] is the ratio of book value
of total assets minus the book value of equity to book value of assets. ‘Size’ is measured by logarithm of total assets in 2000 prices. ‘Tangibility’ is the ratio of property
plant and equipment to total assets.
Period 2000/2004 2005/2006 2007/2009
Statistics N mean(SD) p50 N mean(SD) p50 N mean(SD) p50
CEO Age 797 49.701(6.711) 50 614 50.176(7.051) 50 868 50.583(6.725) 51
CEO Tenure 797 5.814(6.202) 4 614 5.622(5.939) 4 868 6.331(6.290) 4
CEO OS 797 0.049(0.108) 0.005 614 0.051(0.110) 0.005 868 0.046(0.103) 0.003
CEO past performance 797 0.071(0.135) 0 614 0.063(0.118) 0 868 0.076(0.103) 0
CFO Age 797 46.189(6.933) 46 614 46.969(7.028) 46 868 47.72(6.611) 47
CFO Tenure 797 5.279(5.564) 3 614 5.270(5.346) 4 868 5.706(5.421) 4
CFO OS 797 0.004(0.013) 0.001 614 0.008(0.041) 0.001 868 0.006(0.020) 0.001
CFO NF1 797 0.240(0.427) 0 614 0.270(0.445) 0 868 0.288(0.453) 0
CFO Older than CEO 797 0.315(0.465) 0 614 0.334(0.472) 0 868 0.335(0.472) 0
CFO longer tenure than CEO 797 0.527(0.500) 1 614 0.564(0.496) 1 868 0.518(0.500) 1
CFO larger OS than CEO 797 0.152(0.359) 0 614 0.143(0.351) 0 868 0.188(0.391) 0
EX 797 0.500(0.145) 1 614 0.480(0.135) 1 868 0.435(0.144) 0
NED 797 0.500(0.145) 1 614 0.520(0.135) 1 868 0.565(0.144) 1
Board Size 797 7.516(2.397) 7 614 7.220(2.179) 7 868 7.612(2.359) 7
LTD 797 0.127(0.134) 0.092 614 0.125(0.151) 0.073 868 0.134(0.154) 0.085
TDA 797 0.175(0.149) 0.16 614 0.172(0.166) 0.142 868 0.183(0.168) 0.159
Profitability 797 0.060(0.125) 0.074 614 0.073(0.130) 0.089 868 0.067(0.115) 0.077
MKTB 797 2.245(1.524) 1.824 614 2.445(1.270) 2.091 868 1.941(0.872) 1.692
Size 797 11.697(1.970) 11.629 614 11.587(2.041) 11.383 868 11.882(2.043) 11.811
Tangibility 797 0.295(0.227) 0.257 614 0.242(0.221) 0.175 868 0.231(0.213) 0.172
26
4. Empirical analysis
4.1. Principal Component Analysis
The crux of the research is to identify influence of the board capture on the
capital structure in presence of the strong CFO. Simultaneous incorporation
of separate CEO and CFO characteristics that would determine powers of CEO
and CFO to the cross-sectional regression is not an efficient estimation. It not
only introduces many dimensions to the interpretation of results, but also
raises multicollinearity problem. To avoid these issues two indexes are
constructed that proxy for CEO’s board capture (BC) and CFO’s power (CFO
Index) using Principal Component Analysis (Jolliffe, 2002). Principal
Component Analysis (PCA) has been used in similar contexts by Florackis
(2008), Florackis & Ozkan (2009), and Masulis & Mobbs (2011). It is a factor
analysis that is performed on the correlation matrix of variables. It seeks a
linear combination of components by applying weights to each of them. The
procedure firstly extracts a combination with the maximum variance, which
results in the first principal component. In this paper the first principal
component is taken as an index in both instances (creation of BC and CFO
27
Index) as it meets the Kraiser criterion7 and is indicated by Humphrey-Ilgen
parallel analysis8 .
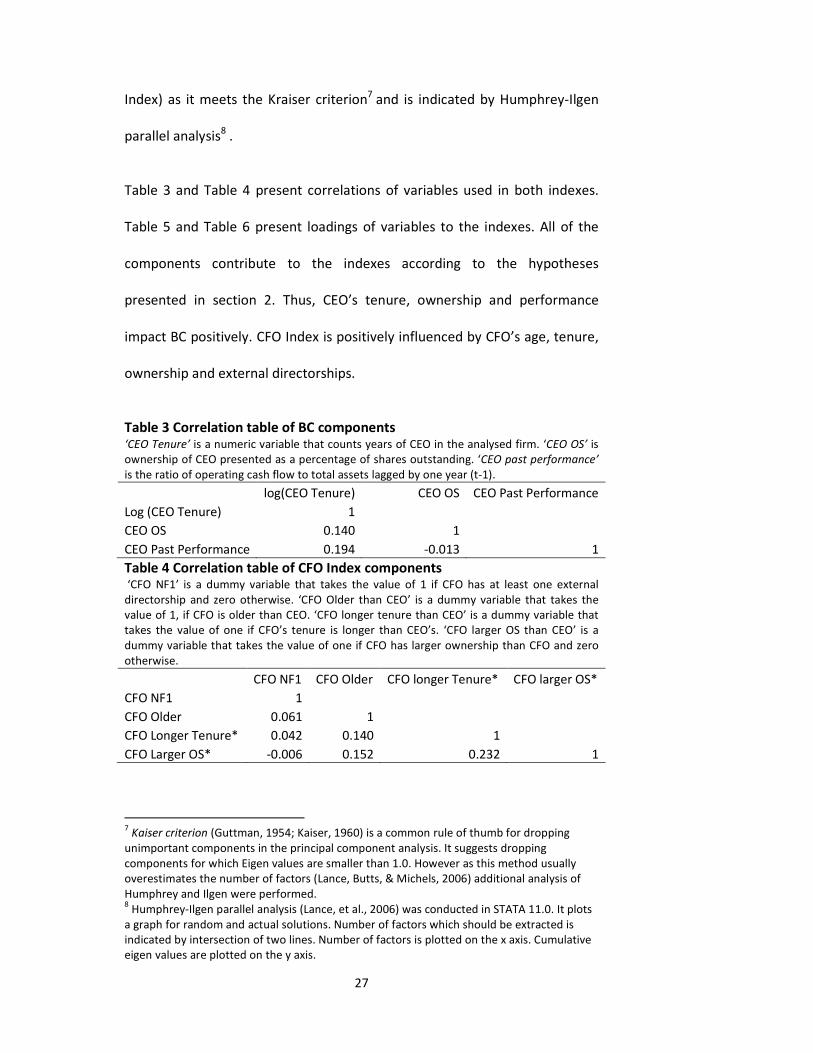
Table 3 and Table 4 present correlations of variables used in both indexes.
Table 5 and Table 6 present loadings of variables to the indexes. All of the
components contribute to the indexes according to the hypotheses
presented in section 2. Thus, CEO’s tenure, ownership and performance
impact BC positively. CFO Index is positively influenced by CFO’s age, tenure,
ownership and external directorships.
Table 3 Correlation table of BC components ‘CEO Tenure’ is a numeric variable that counts years of CEO in the analysed firm. ‘CEO OS’ is
ownership of CEO presented as a percentage of shares outstanding. ‘CEO past performance’
is the ratio of operating cash flow to total assets lagged by one year (t-1).
log(CEO Tenure) CEO OS CEO Past Performance
Log (CEO Tenure) 1
CEO OS 0.140 1
CEO Past Performance 0.194 -0.013 1
Table 4 Correlation table of CFO Index components ‘CFO NF1’ is a dummy variable that takes the value of 1 if CFO has at least one external
directorship and zero otherwise. ‘CFO Older than CEO’ is a dummy variable that takes the
value of 1, if CFO is older than CEO. ‘CFO longer tenure than CEO’ is a dummy variable that
takes the value of one if CFO’s tenure is longer than CEO’s. ‘CFO larger OS than CEO’ is a
dummy variable that takes the value of one if CFO has larger ownership than CFO and zero
otherwise.
CFO NF1 CFO Older CFO longer Tenure* CFO larger OS*
CFO NF1 1
CFO Older 0.061 1
CFO Longer Tenure* 0.042 0.140 1
CFO Larger OS* -0.006 0.152 0.232 1
7 Kaiser criterion (Guttman, 1954; Kaiser, 1960) is a common rule of thumb for dropping
unimportant components in the principal component analysis. It suggests dropping
components for which Eigen values are smaller than 1.0. However as this method usually
overestimates the number of factors (Lance, Butts, & Michels, 2006) additional analysis of
Humphrey and Ilgen were performed. 8 Humphrey-Ilgen parallel analysis (Lance, et al., 2006) was conducted in STATA 11.0. It plots
a graph for random and actual solutions. Number of factors which should be extracted is
indicated by intersection of two lines. Number of factors is plotted on the x axis. Cumulative
eigen values are plotted on the y axis.

28
Table 5 Board Capture loadings. PCA Index ‘CEO Tenure’ is a numeric variable that counts years of CEO in the analysed firm. ‘CEO OS’ is
ownership of CEO presented as a percentage of shares outstanding. ‘CEO past performance’
is a ratio of operating cash flow to total assets lagged by one year (t-1).
Prediction Loading
Ln(CEO Tenure) + 0.716
CEO OS + 0.399
CEO past OCF + 0.573
Table 6 CFO Power loadings. PCA Index CFO NF1’ is a dummy variable that takes the value of 1 if CFO has at least one external
directorship and zero otherwise. ‘CFO Older than CEO’ is a dummy variable that takes the
value of 1, if CFO is older than CEO. ‘CFO longer tenure than CEO’ is a dummy variable that
takes the value of one if CFO’s tenure is longer than CEO’s. ‘CFO larger OS than CEO’ is a
dummy variable that takes the value of one if CFO has larger ownership than CFO and zero
otherwise.
Prediction Loading
CFO NF1 + 0.148
CFO Older + 0.510
CFO longer tenure + 0.600
CFO larger OS + 0.599
Table 7 Descriptive statistics of BC and CFO Index.
Sample N mean p50 Min Max Sd
BC Total 2279 -3.18E-10 0.020 -7.909 4.248 1.111
2000/2004 797 -0.036 0.013 -7.909 4.248 1.186
2005/2006 614 -0.072 -0.065 -3.691 3.869 1.100
2007/2009 868 0.084 0.091 -3.373 3.525 1.040
CFO Index Total 2279 3.06E-09 -0.148 -1.351 2.891 1.166
2000/2004 797 -0.049 -0.148 -1.351 2.891 1.137
2005/2006 614 0.012 -0.148 -1.351 2.891 1.140
2007/2009 868 0.037 -0.148 -1.351 2.891 1.210
As a result two indexes are created. Their description is provided on
Table 7. In addition Table 9 presents introductory statistics for
hypotheses regarding behaviour of CEO when his board capture is
high, and CFO when he dominates CEO. Sub-samples of BC and CFO
index are created on the basis of the median value. The above median
group represents a high level of an index, and the below median
group – low level. The cross tabulation provide preliminary evidence
consistent with the main research hypothesis. Explicitly the increase
of leverage in crisis and post crisis periods is higher in a group of firms
29
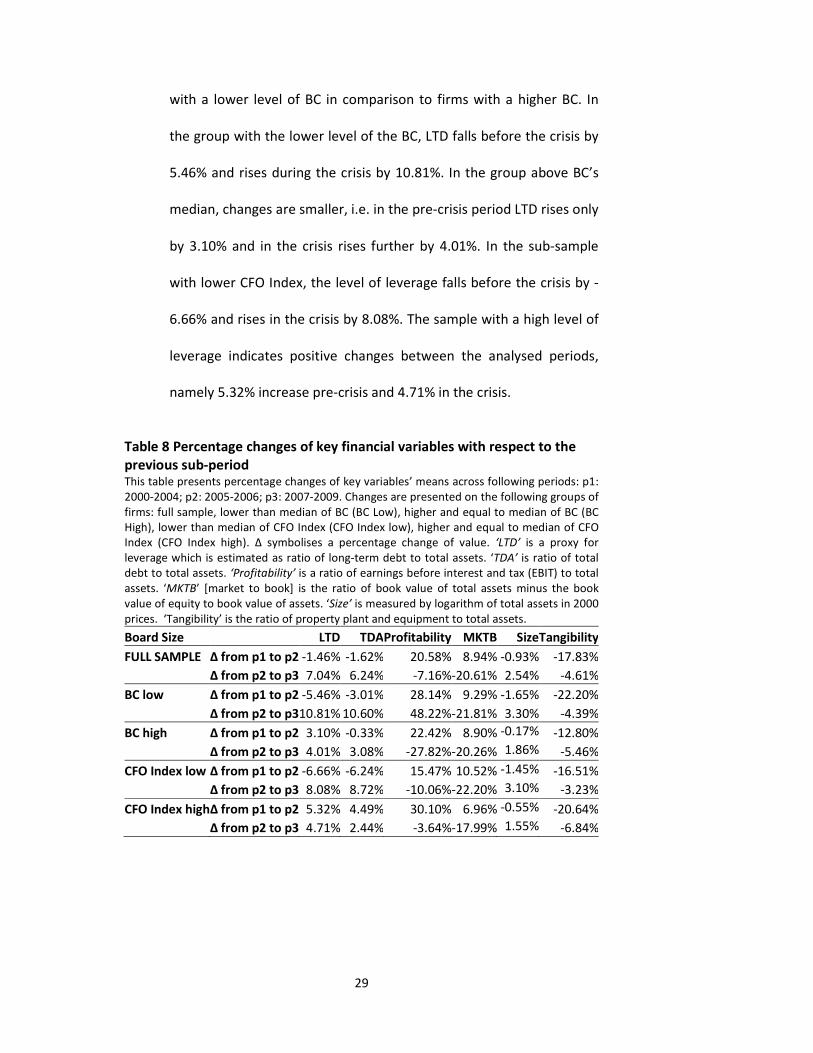
with a lower level of BC in comparison to firms with a higher BC. In
the group with the lower level of the BC, LTD falls before the crisis by
5.46% and rises during the crisis by 10.81%. In the group above BC’s
median, changes are smaller, i.e. in the pre-crisis period LTD rises only
by 3.10% and in the crisis rises further by 4.01%. In the sub-sample
with lower CFO Index, the level of leverage falls before the crisis by -
6.66% and rises in the crisis by 8.08%. The sample with a high level of
leverage indicates positive changes between the analysed periods,
namely 5.32% increase pre-crisis and 4.71% in the crisis.
Table 8 Percentage changes of key financial variables with respect to the
previous sub-period This table presents percentage changes of key variables’ means across following periods: p1:
2000-2004; p2: 2005-2006; p3: 2007-2009. Changes are presented on the following groups of
firms: full sample, lower than median of BC (BC Low), higher and equal to median of BC (BC
High), lower than median of CFO Index (CFO Index low), higher and equal to median of CFO
Index (CFO Index high). ∆ symbolises a percentage change of value. ‘LTD’ is a proxy for
leverage which is estimated as ratio of long-term debt to total assets. ‘TDA’ is ratio of total
debt to total assets. ‘Profitability’ is a ratio of earnings before interest and tax (EBIT) to total
assets. ‘MKTB’ [market to book] is the ratio of book value of total assets minus the book
value of equity to book value of assets. ‘Size’ is measured by logarithm of total assets in 2000
prices. ‘Tangibility’ is the ratio of property plant and equipment to total assets.
Board Size
LTD TDAProfitability MKTB Size Tangibility
FULL SAMPLE ∆ from p1 to p2 -1.46% -1.62% 20.58% 8.94% -0.93% -17.83%
∆ from p2 to p3 7.04% 6.24% -7.16% -20.61% 2.54% -4.61%
BC low ∆ from p1 to p2 -5.46% -3.01% 28.14% 9.29% -1.65% -22.20%
∆ from p2 to p310.81% 10.60% 48.22% -21.81% 3.30% -4.39%
BC high ∆ from p1 to p2 3.10% -0.33% 22.42% 8.90% -0.17% -12.80%
∆ from p2 to p3 4.01% 3.08% -27.82% -20.26% 1.86% -5.46%
CFO Index low ∆ from p1 to p2 -6.66% -6.24% 15.47% 10.52% -1.45% -16.51%
∆ from p2 to p3 8.08% 8.72% -10.06% -22.20% 3.10% -3.23%
CFO Index high∆ from p1 to p2 5.32% 4.49% 30.10% 6.96% -0.55% -20.64%
∆ from p2 to p3 4.71% 2.44% -3.64% -17.99% 1.55% -6.84%

30
4.2. Univariate Analysis
Univariate analysis explores differences between mean values of variables
across four sub-groups, which in the first part (Panel A) constitute quartiles of
leverage, and in the second part (Panel B) quartiles of CEO’s board capture.
Quartiles are presented in ascending order in both panels. For instance, in
panel A, Q1 includes firms with the lowest level of leverage; Q4 includes firms
with the highest level of leverage. The last column presents t values of a
mean comparison test done to compare the first and the fourth quartile of
leverage.
Table 9 presents some valuable preliminary results consistent with the main
hypothesis, i.e. it indicates that size, tangibility of assets, and percentage of
non-executive directors on board, are positively correlated with leverage.
Consequently, the negative correlation is observed between market to book
ratio, board capture and leverage. Interestingly, there is no significant
association between CFO Index and leverage; however there is a significant
and negative relation between the first and the fourth quartile of the board
capture in terms of CFO Index, indicating that in general, with the growth of
the CEO’s dominance on the board, the power of the CFO decreases. This
result confirms the board capture hypothesis, proving that degree of
influence on the board rises with BC. Results regarding individual
characteristics influencing leverage are in line with predictions except CEO’s
tenure, which is expected to have a positive association with leverage. The
alternative hypothesis may indicate that close to retirement, the CEO loses
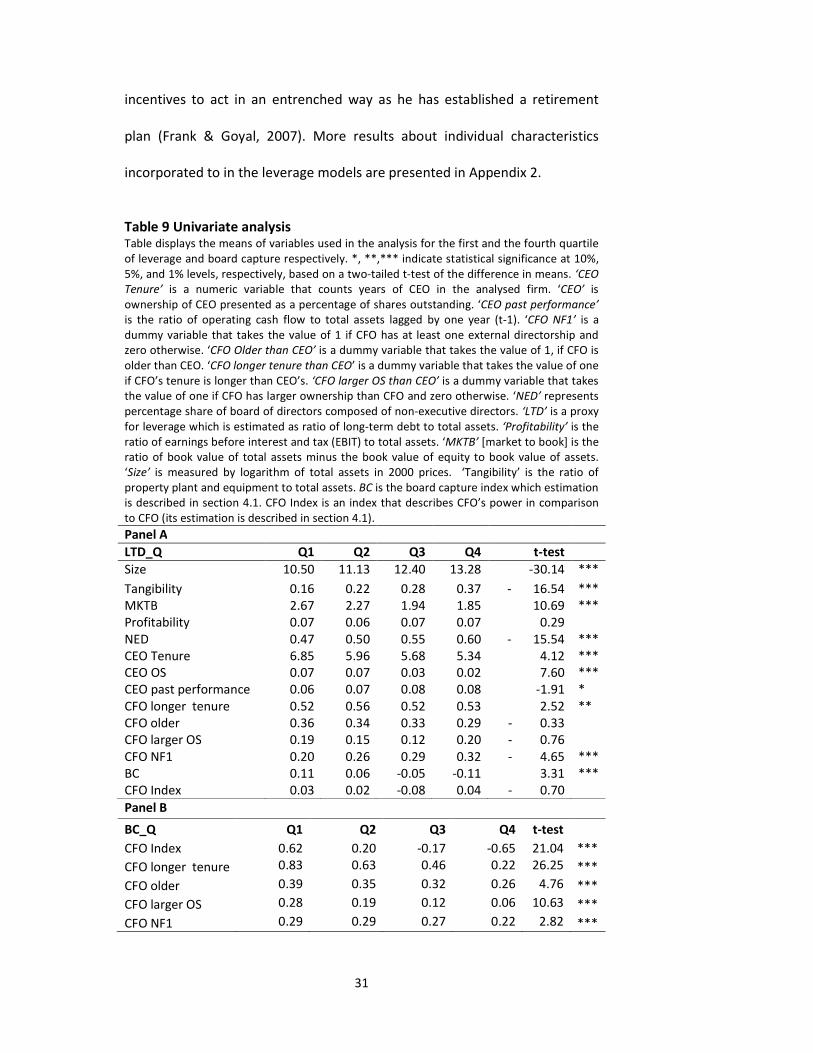
31
incentives to act in an entrenched way as he has established a retirement
plan (Frank & Goyal, 2007). More results about individual characteristics
incorporated to in the leverage models are presented in Appendix 2.
Table 9 Univariate analysis Table displays the means of variables used in the analysis for the first and the fourth quartile
of leverage and board capture respectively. *, **,*** indicate statistical significance at 10%,
5%, and 1% levels, respectively, based on a two-tailed t-test of the difference in means. ‘CEO
Tenure’ is a numeric variable that counts years of CEO in the analysed firm. ‘CEO’ is
ownership of CEO presented as a percentage of shares outstanding. ‘CEO past performance’
is the ratio of operating cash flow to total assets lagged by one year (t-1). ‘CFO NF1’ is a
dummy variable that takes the value of 1 if CFO has at least one external directorship and
zero otherwise. ‘CFO Older than CEO’ is a dummy variable that takes the value of 1, if CFO is
older than CEO. ‘CFO longer tenure than CEO’ is a dummy variable that takes the value of one
if CFO’s tenure is longer than CEO’s. ‘CFO larger OS than CEO’ is a dummy variable that takes
the value of one if CFO has larger ownership than CFO and zero otherwise. ‘NED’ represents
percentage share of board of directors composed of non-executive directors. ‘LTD’ is a proxy
for leverage which is estimated as ratio of long-term debt to total assets. ‘Profitability’ is the
ratio of earnings before interest and tax (EBIT) to total assets. ‘MKTB’ [market to book] is the
ratio of book value of total assets minus the book value of equity to book value of assets.
‘Size’ is measured by logarithm of total assets in 2000 prices. ‘Tangibility’ is the ratio of
property plant and equipment to total assets. BC is the board capture index which estimation
is described in section 4.1. CFO Index is an index that describes CFO’s power in comparison
to CFO (its estimation is described in section 4.1).
Panel A
LTD_Q Q1 Q2 Q3 Q4 t-test
Size 10.50 11.13 12.40 13.28 -30.14 ***
Tangibility 0.16 0.22 0.28 0.37 - 16.54 ***
MKTB 2.67 2.27 1.94 1.85 10.69 ***
Profitability 0.07 0.06 0.07 0.07 0.29
NED 0.47 0.50 0.55 0.60 - 15.54 ***
CEO Tenure 6.85 5.96 5.68 5.34 4.12 ***
CEO OS 0.07 0.07 0.03 0.02 7.60 ***
CEO past performance 0.06 0.07 0.08 0.08 -1.91 *
CFO longer tenure 0.52 0.56 0.52 0.53 2.52 **
CFO older 0.36 0.34 0.33 0.29 - 0.33
CFO larger OS 0.19 0.15 0.12 0.20 - 0.76
CFO NF1 0.20 0.26 0.29 0.32 - 4.65 ***
BC 0.11 0.06 -0.05 -0.11 3.31 ***
CFO Index 0.03 0.02 -0.08 0.04 - 0.70
Panel B
BC_Q Q1 Q2 Q3 Q4 t-test
CFO Index 0.62 0.20 -0.17 -0.65 21.04 ***
CFO longer tenure 0.83 0.63 0.46 0.22 26.25 ***
CFO older 0.39 0.35 0.32 0.26 4.76 ***
CFO larger OS 0.28 0.19 0.12 0.06 10.63 ***
CFO NF1 0.29 0.29 0.27 0.22 2.82 ***
32
4.3. OLS Regression Analysis
Relying on the vast body of literature on the capital structure (Chava &
Purnanandam, 2010; Frank & Goyal, 2009; Frank & Goyal, 2009; Rajan &
Zingales, 1995; Titman & Wessels, 1988) the following control variables are
chosen for all models firm’s size, tangibility (assets available for collateral),
profitability and market to book ratio (proxy for growth). Definitions of all
control variables are presented in Table 1. The dependent variable for all
analysis regressions is leverage measured as ratio of long-term debt to total
assets. To control for industry and time effects, dummy variables are used. All
significance levels are computed using robust standard errors. Table 11
provides results of models estimated using pooled ordinary least –squares
(OLS) estimator. All variables included in the first model are in the same time
t. In models 2 and 3 control variables are included in time t-1 and the board
capture and dependent variable - leverage at time t. The estimated
coefficients are in line with those in previous literature (Chava &
Purnanandam, 2010; Florackis & Ozkan, 2009; Murray Z. Frank & Goyal, 2009;
Rajan & Zingales, 1995).The results of all models indicate that impact of size
and tangibility on leverage is positive and significant at 1% level impact,
suggesting that larger firms with more tangible assets, that easily can be
treated as collateral, increase reputation and trust in a company. The impact
of market-to-book ratio is negative and significant at the 1 % level, which is in
line with agency theory (high growth firms choose lower leverage, not to
overlook investment opportunities). Additionally profitability has some
negative impact but only in models 1 and 4, suggesting that firms prefer
33
retained earnings than leverage to finance their investments (pecking order
theory). Last but not least, the board capture (BC) influences leverage
negatively and significantly that is in line with the first hypothesis. The result
suggests that as the CEO gains power on a board he naturally induces lower
level of leverage. Also it may indicate that too excessive power of CEO may
be perceived as the bad practice which would result in higher costs of
borrowing or even a limitation to borrowing ability; therefore BC should be
negatively associated with leverage.
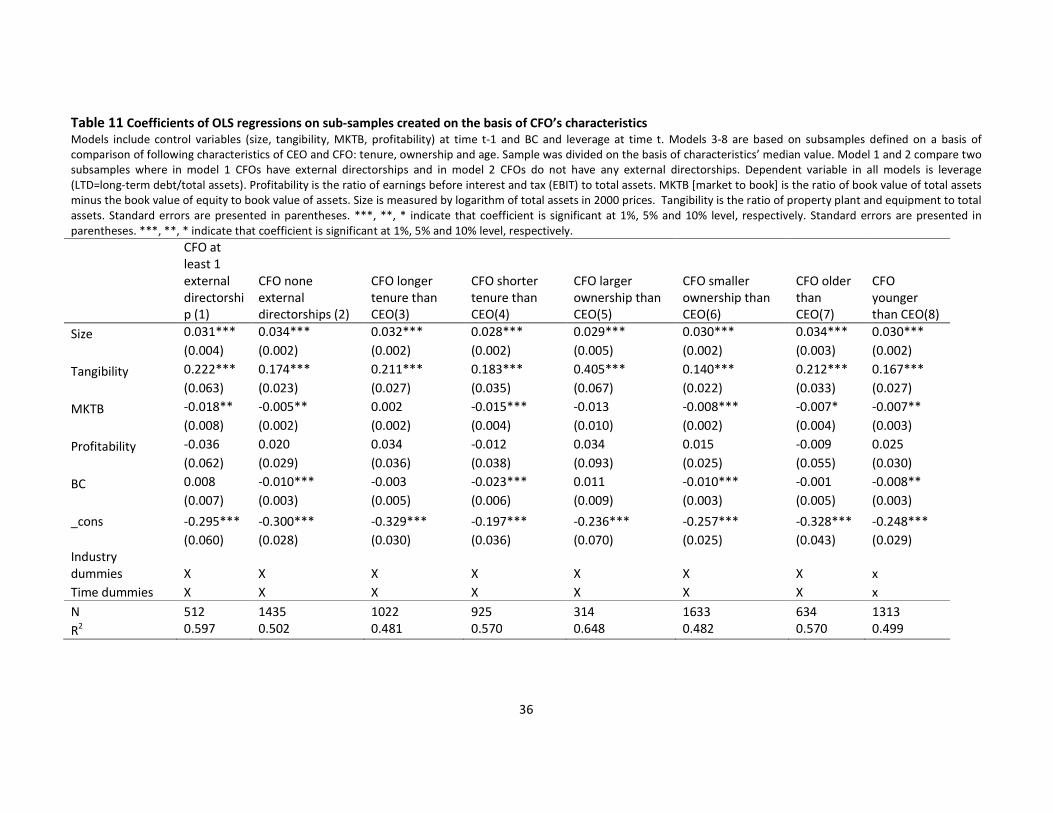
Table 11 introduces impacts of presence of strong CFOs on the basis of
subsamples generated on the basis of components used for creation of the
CFO Index. Models 1 and 2 compare samples where CFOs have (model 1) or
do not have external directorship (model 2); models 3 and 4 compare
samples where CFO has longer tenure than CEO (model 3) or not (model 4);
in models 5 and 6 compare sub-samples where CFO has larger ownership
than CEO (model 5) and the other way round (model 6); and finally in models
7 and 8 compare a sample, where CFO is older than CEO (model7) with a
sample where CEO is older than CFO (model 8). All eight models presented in
Table 11 confirm hypotheses about the CFO’s dominance features, indicating
that in firms where the CFO has external directorship, longer tenure, larger
ownership, or is older than the CEO, impact of BC on leverage is not
significant, although still negative.
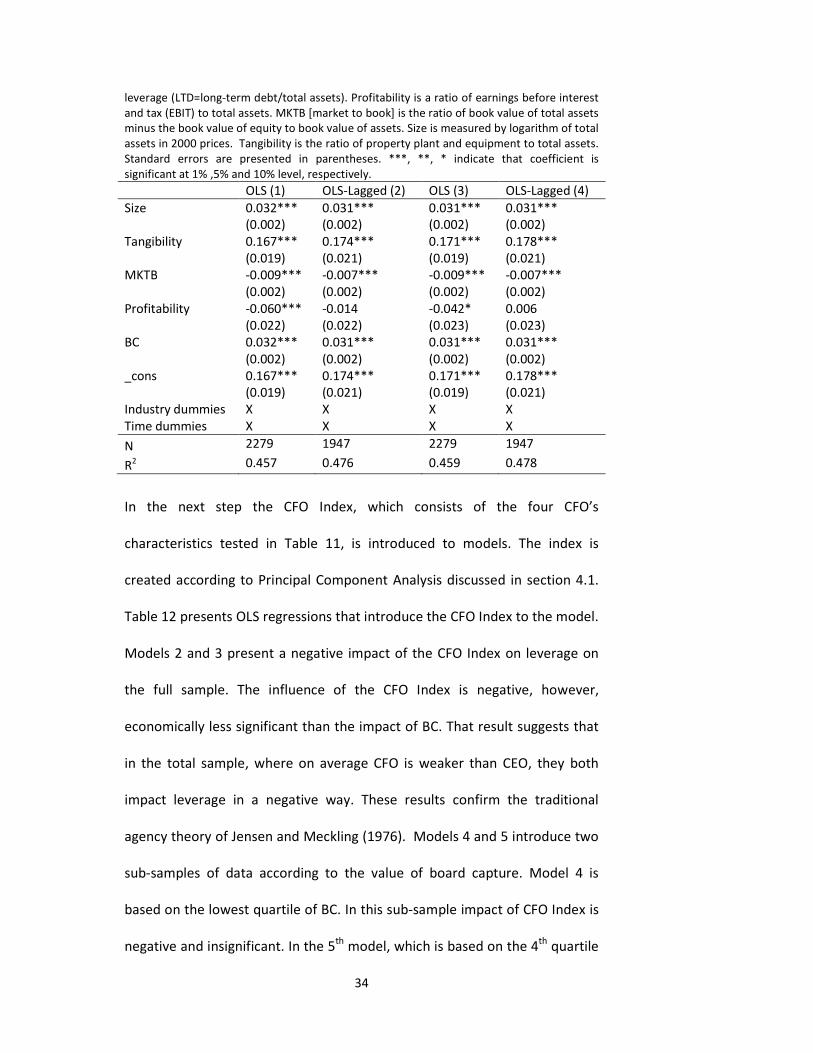
Table 10 Coefficients of OLS analysis based on the full sample (2000-2009). Models 1 and 3 include all dependent and independent variables in time t. Models 2 and 4
include lagged by one year (t-1) size, tangibility, MKTB and profitability and BC and leverage
variables at time t. All models include industry and time dummies. Dependent variable is
34
leverage (LTD=long-term debt/total assets). Profitability is a ratio of earnings before interest
and tax (EBIT) to total assets. MKTB [market to book] is the ratio of book value of total assets
minus the book value of equity to book value of assets. Size is measured by logarithm of total
assets in 2000 prices. Tangibility is the ratio of property plant and equipment to total assets.
Standard errors are presented in parentheses. ***, **, * indicate that coefficient is
significant at 1% ,5% and 10% level, respectively.
OLS (1) OLS-Lagged (2) OLS (3) OLS-Lagged (4)
Size 0.032*** 0.031*** 0.031*** 0.031***
(0.002) (0.002) (0.002) (0.002)
Tangibility 0.167*** 0.174*** 0.171*** 0.178***
(0.019) (0.021) (0.019) (0.021)
MKTB -0.009*** -0.007*** -0.009*** -0.007***
(0.002) (0.002) (0.002) (0.002)
Profitability -0.060*** -0.014 -0.042* 0.006
(0.022) (0.022) (0.023) (0.023)
BC 0.032*** 0.031*** 0.031*** 0.031***
(0.002) (0.002) (0.002) (0.002)
_cons 0.167*** 0.174*** 0.171*** 0.178***
(0.019) (0.021) (0.019) (0.021)
Industry dummies X X X X
Time dummies X X X X
N 2279 1947 2279 1947
R2 0.457 0.476 0.459 0.478
In the next step the CFO Index, which consists of the four CFO’s
characteristics tested in Table 11, is introduced to models. The index is
created according to Principal Component Analysis discussed in section 4.1.
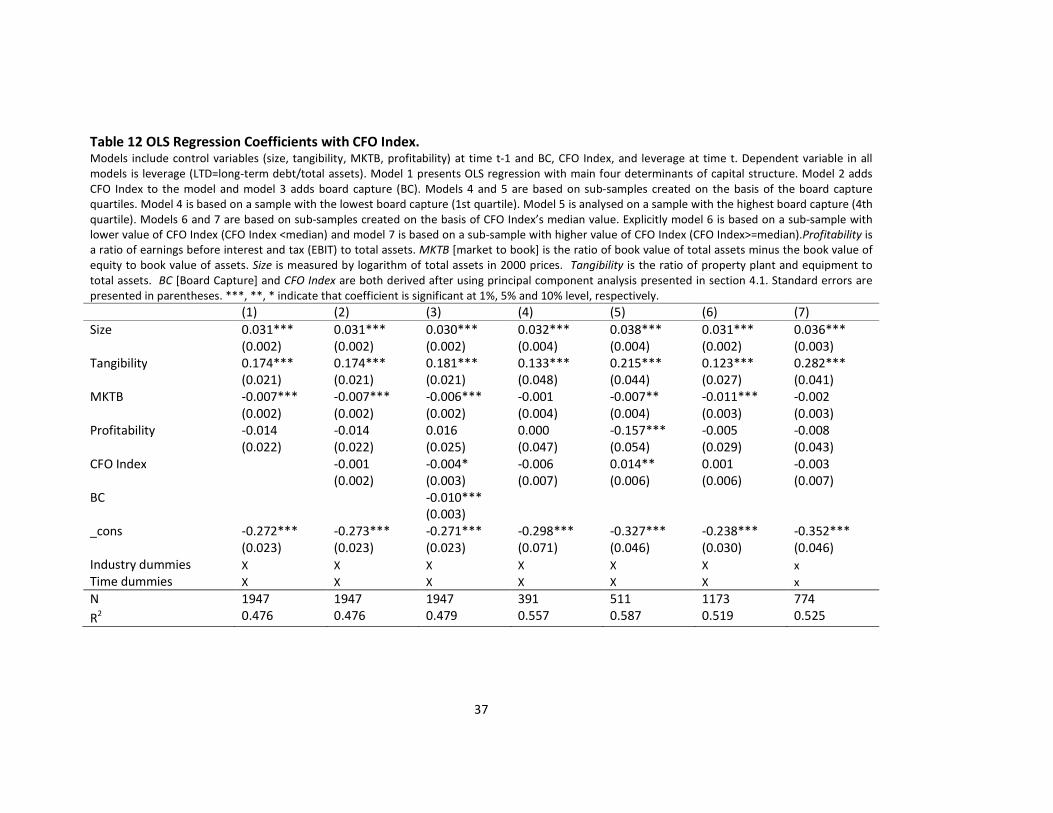
Table 12 presents OLS regressions that introduce the CFO Index to the model.
Models 2 and 3 present a negative impact of the CFO Index on leverage on
the full sample. The influence of the CFO Index is negative, however,
economically less significant than the impact of BC. That result suggests that
in the total sample, where on average CFO is weaker than CEO, they both
impact leverage in a negative way. These results confirm the traditional
agency theory of Jensen and Meckling (1976). Models 4 and 5 introduce two
sub-samples of data according to the value of board capture. Model 4 is
based on the lowest quartile of BC. In this sub-sample impact of CFO Index is
negative and insignificant. In the 5th
model, which is based on the 4th
quartile
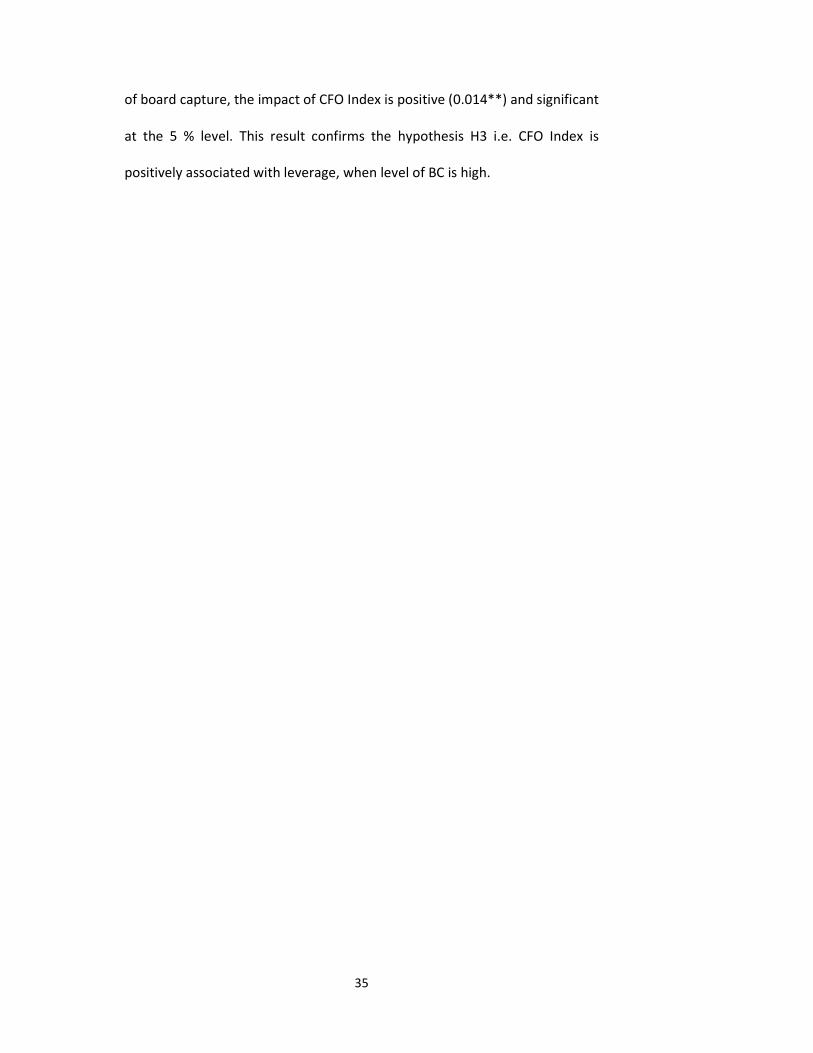
35
of board capture, the impact of CFO Index is positive (0.014**) and significant
at the 5 % level. This result confirms the hypothesis H3 i.e. CFO Index is
positively associated with leverage, when level of BC is high.
36
Table 11 Coefficients of OLS regressions on sub-samples created on the basis of CFO’s characteristics
Models include control variables (size, tangibility, MKTB, profitability) at time t-1 and BC and leverage at time t. Models 3-8 are based on subsamples defined on a basis of
comparison of following characteristics of CEO and CFO: tenure, ownership and age. Sample was divided on the basis of characteristics’ median value. Model 1 and 2 compare two
subsamples where in model 1 CFOs have external directorships and in model 2 CFOs do not have any external directorships. Dependent variable in all models is leverage
(LTD=long-term debt/total assets). Profitability is the ratio of earnings before interest and tax (EBIT) to total assets. MKTB [market to book] is the ratio of book value of total assets
minus the book value of equity to book value of assets. Size is measured by logarithm of total assets in 2000 prices. Tangibility is the ratio of property plant and equipment to total
assets. Standard errors are presented in parentheses. ***, **, * indicate that coefficient is significant at 1%, 5% and 10% level, respectively. Standard errors are presented in
parentheses. ***, **, * indicate that coefficient is significant at 1%, 5% and 10% level, respectively.
CFO at
least 1
external
directorshi
p (1)
CFO none
external
directorships (2)
CFO longer
tenure than
CEO(3)
CFO shorter
tenure than
CEO(4)
CFO larger
ownership than
CEO(5)
CFO smaller
ownership than
CEO(6)
CFO older
than
CEO(7)
CFO
younger
than CEO(8)
Size 0.031*** 0.034*** 0.032*** 0.028*** 0.029*** 0.030*** 0.034*** 0.030***
(0.004) (0.002) (0.002) (0.002) (0.005) (0.002) (0.003) (0.002)
Tangibility 0.222*** 0.174*** 0.211*** 0.183*** 0.405*** 0.140*** 0.212*** 0.167***
(0.063) (0.023) (0.027) (0.035) (0.067) (0.022) (0.033) (0.027)
MKTB -0.018** -0.005** 0.002 -0.015*** -0.013 -0.008*** -0.007* -0.007**
(0.008) (0.002) (0.002) (0.004) (0.010) (0.002) (0.004) (0.003)
Profitability -0.036 0.020 0.034 -0.012 0.034 0.015 -0.009 0.025
(0.062) (0.029) (0.036) (0.038) (0.093) (0.025) (0.055) (0.030)
BC 0.008 -0.010*** -0.003 -0.023*** 0.011 -0.010*** -0.001 -0.008**
(0.007) (0.003) (0.005) (0.006) (0.009) (0.003) (0.005) (0.003)
_cons -0.295*** -0.300*** -0.329*** -0.197*** -0.236*** -0.257*** -0.328*** -0.248***
(0.060) (0.028) (0.030) (0.036) (0.070) (0.025) (0.043) (0.029)
Industry
dummies X X X X X X X x
Time dummies X X X X X X X x
N 512 1435 1022 925 314 1633 634 1313
R2 0.597 0.502 0.481 0.570 0.648 0.482 0.570 0.499
37
Table 12 OLS Regression Coefficients with CFO Index. Models include control variables (size, tangibility, MKTB, profitability) at time t-1 and BC, CFO Index, and leverage at time t. Dependent variable in all
models is leverage (LTD=long-term debt/total assets). Model 1 presents OLS regression with main four determinants of capital structure. Model 2 adds
CFO Index to the model and model 3 adds board capture (BC). Models 4 and 5 are based on sub-samples created on the basis of the board capture
quartiles. Model 4 is based on a sample with the lowest board capture (1st quartile). Model 5 is analysed on a sample with the highest board capture (4th
quartile). Models 6 and 7 are based on sub-samples created on the basis of CFO Index’s median value. Explicitly model 6 is based on a sub-sample with
lower value of CFO Index (CFO Index <median) and model 7 is based on a sub-sample with higher value of CFO Index (CFO Index>=median).Profitability is
a ratio of earnings before interest and tax (EBIT) to total assets. MKTB [market to book] is the ratio of book value of total assets minus the book value of
equity to book value of assets. Size is measured by logarithm of total assets in 2000 prices. Tangibility is the ratio of property plant and equipment to
total assets. BC [Board Capture] and CFO Index are both derived after using principal component analysis presented in section 4.1. Standard errors are
presented in parentheses. ***, **, * indicate that coefficient is significant at 1%, 5% and 10% level, respectively.
(1) (2) (3) (4) (5) (6) (7)
Size 0.031*** 0.031*** 0.030*** 0.032*** 0.038*** 0.031*** 0.036***
(0.002) (0.002) (0.002) (0.004) (0.004) (0.002) (0.003)
Tangibility 0.174*** 0.174*** 0.181*** 0.133*** 0.215*** 0.123*** 0.282***
(0.021) (0.021) (0.021) (0.048) (0.044) (0.027) (0.041)
MKTB -0.007*** -0.007*** -0.006*** -0.001 -0.007** -0.011*** -0.002
(0.002) (0.002) (0.002) (0.004) (0.004) (0.003) (0.003)
Profitability -0.014 -0.014 0.016 0.000 -0.157*** -0.005 -0.008
(0.022) (0.022) (0.025) (0.047) (0.054) (0.029) (0.043)
CFO Index -0.001 -0.004* -0.006 0.014** 0.001 -0.003
(0.002) (0.003) (0.007) (0.006) (0.006) (0.007)
BC -0.010***
(0.003)
_cons -0.272*** -0.273*** -0.271*** -0.298*** -0.327*** -0.238*** -0.352***
(0.023) (0.023) (0.023) (0.071) (0.046) (0.030) (0.046)
Industry dummies X X X X X X x
Time dummies X X X X X X x
N 1947 1947 1947 391 511 1173 774
R2 0.476 0.476 0.479 0.557 0.587 0.519 0.525
38
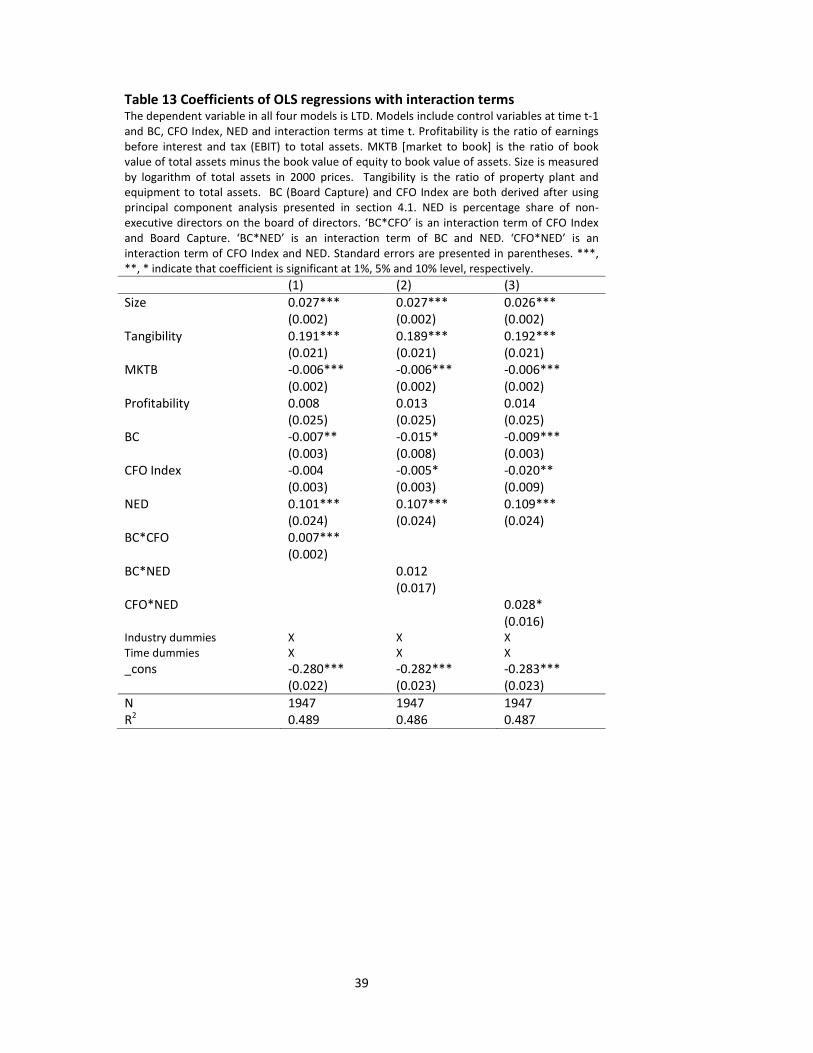
Finally models 6 and 7 present an alternative analysis where model 6 is based
on a sub-sample with a lower level of CFO Index and model 7 on a sub-
sample with a higher level of CFO Index. Models indicate that in the presence
of a strong CFO (model 6) the impact of BC on leverage is not significant and
positive, and negative and significant otherwise (model 7). High level of CFO
Index indicates relatively low level of the CEO’s power. Also in these
circumstances the CFO has greater ability to impact leverage, and
consequently does not allow the CEO to influence this decision. The results
presented in Table 13 indicate that impact of the CFO Index on leverage is
conditional on board capture. This specification is additionally captured by
including an interaction term between the board capture and CFO index,
which is presented in column 1 of Table 14. The interaction term has small
but significant impact on the adjusted R2. The negative impact of BC on LTD
rises by 0.007 per unit increase of CFO index. In other words a positive
coefficient on the interaction term indicates that presence of a strong CFO
can mitigate the effect of CEO’s board capture on leverage.
39
Table 13 Coefficients of OLS regressions with interaction terms The dependent variable in all four models is LTD. Models include control variables at time t-1
and BC, CFO Index, NED and interaction terms at time t. Profitability is the ratio of earnings
before interest and tax (EBIT) to total assets. MKTB [market to book] is the ratio of book
value of total assets minus the book value of equity to book value of assets. Size is measured
by logarithm of total assets in 2000 prices. Tangibility is the ratio of property plant and
equipment to total assets. BC (Board Capture) and CFO Index are both derived after using
principal component analysis presented in section 4.1. NED is percentage share of non-
executive directors on the board of directors. ‘BC*CFO’ is an interaction term of CFO Index
and Board Capture. ‘BC*NED’ is an interaction term of BC and NED. ‘CFO*NED’ is an
interaction term of CFO Index and NED. Standard errors are presented in parentheses. ***,
**, * indicate that coefficient is significant at 1%, 5% and 10% level, respectively.
(1) (2) (3)
Size 0.027*** 0.027*** 0.026***
(0.002) (0.002) (0.002)
Tangibility 0.191*** 0.189*** 0.192***
(0.021) (0.021) (0.021)
MKTB -0.006*** -0.006*** -0.006***
(0.002) (0.002) (0.002)
Profitability 0.008 0.013 0.014
(0.025) (0.025) (0.025)
BC -0.007** -0.015* -0.009***
(0.003) (0.008) (0.003)
CFO Index -0.004 -0.005* -0.020**
(0.003) (0.003) (0.009)
NED 0.101*** 0.107*** 0.109***
(0.024) (0.024) (0.024)
BC*CFO 0.007***
(0.002)
BC*NED 0.012
(0.017)
CFO*NED 0.028*
(0.016)
Industry dummies X X X
Time dummies X X X
_cons -0.280*** -0.282*** -0.283***
(0.022) (0.023) (0.023)
N 1947 1947 1947
R2
0.489 0.486 0.487
40
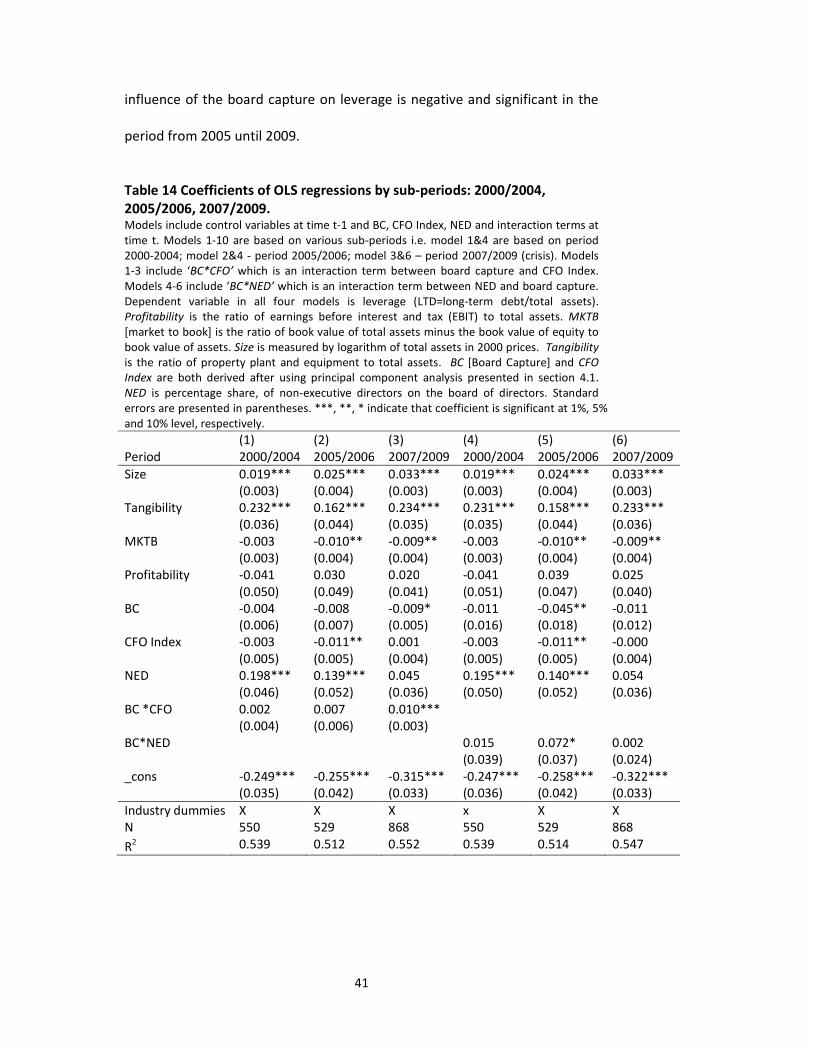
In section 2.4 it is suggested that the corporate governance role of the CFO
becomes even more relevant than traditionally independent boards (proxied
by NED) in a period of the financial crisis. To study the effect of CFO Index
and NED on the board capture in the various economic conditions,
interaction terms between them are added to models, and analysis is
performed on the data from the following periods: 2000-2004, 2005-2006,
2007-2009 (models are presented in Table 14). The results are consistent
with hypotheses Error! Reference source not found., Error! Reference
source not found., and Error! Reference source not found.; but do not
confirm Error! Reference source not found.. And so, the direct impact of the
independent boards on the leverage becomes less significant in a period of
the financial crisis. NED’s coefficients in model 3 and 6, which are based on
the financial crisis period, are insignificant. In the remaining periods (models
1, 2, 4, 5) they are significant. Also, the indirect impact of the non-executive
suite measured by the interaction term of BC and NED (BC* NED) is
significant. The significance of the CFO’s monitoring of the CEO measured by
the interaction term between BC and CFO Index (BC*CFO) is positive and
significant in the period of 2007-2009. Additionally, in Table 15 an alternative
approach is presented. The sample is divided on the basis of median value of
CFO Index. The above median group is presented in the last three columns of
Table 14. This sub-sample includes firms, in which CFO Index is strong.
Consequently, the influence of BC on leverage is not significant, and positive.
On the other hand, in the sub-group that includes firms with weaker CFOs the
41
influence of the board capture on leverage is negative and significant in the
period from 2005 until 2009.
Table 14 Coefficients of OLS regressions by sub-periods: 2000/2004,
2005/2006, 2007/2009. Models include control variables at time t-1 and BC, CFO Index, NED and interaction terms at
time t. Models 1-10 are based on various sub-periods i.e. model 1&4 are based on period
2000-2004; model 2&4 - period 2005/2006; model 3&6 – period 2007/2009 (crisis). Models
1-3 include ‘BC*CFO’ which is an interaction term between board capture and CFO Index.
Models 4-6 include ‘BC*NED’ which is an interaction term between NED and board capture.
Dependent variable in all four models is leverage (LTD=long-term debt/total assets).
Profitability is the ratio of earnings before interest and tax (EBIT) to total assets. MKTB
[market to book] is the ratio of book value of total assets minus the book value of equity to
book value of assets. Size is measured by logarithm of total assets in 2000 prices. Tangibility
is the ratio of property plant and equipment to total assets. BC [Board Capture] and CFO
Index are both derived after using principal component analysis presented in section 4.1.
NED is percentage share, of non-executive directors on the board of directors. Standard
errors are presented in parentheses. ***, **, * indicate that coefficient is significant at 1%, 5%
and 10% level, respectively.
(1) (2) (3) (4) (5) (6)
Period 2000/2004 2005/2006 2007/2009 2000/2004 2005/2006 2007/2009
Size 0.019*** 0.025*** 0.033*** 0.019*** 0.024*** 0.033***
(0.003) (0.004) (0.003) (0.003) (0.004) (0.003)
Tangibility 0.232*** 0.162*** 0.234*** 0.231*** 0.158*** 0.233***
(0.036) (0.044) (0.035) (0.035) (0.044) (0.036)
MKTB -0.003 -0.010** -0.009** -0.003 -0.010** -0.009**
(0.003) (0.004) (0.004) (0.003) (0.004) (0.004)
Profitability -0.041 0.030 0.020 -0.041 0.039 0.025
(0.050) (0.049) (0.041) (0.051) (0.047) (0.040)
BC -0.004 -0.008 -0.009* -0.011 -0.045** -0.011
(0.006) (0.007) (0.005) (0.016) (0.018) (0.012)
CFO Index -0.003 -0.011** 0.001 -0.003 -0.011** -0.000
(0.005) (0.005) (0.004) (0.005) (0.005) (0.004)
NED 0.198*** 0.139*** 0.045 0.195*** 0.140*** 0.054
(0.046) (0.052) (0.036) (0.050) (0.052) (0.036)
BC *CFO 0.002 0.007 0.010***
(0.004) (0.006) (0.003)
BC*NED 0.015 0.072* 0.002
(0.039) (0.037) (0.024)
_cons -0.249*** -0.255*** -0.315*** -0.247*** -0.258*** -0.322***
(0.035) (0.042) (0.033) (0.036) (0.042) (0.033)
Industry dummies X X X x X X
N 550 529 868 550 529 868
R2 0.539 0.512 0.552 0.539 0.514 0.547
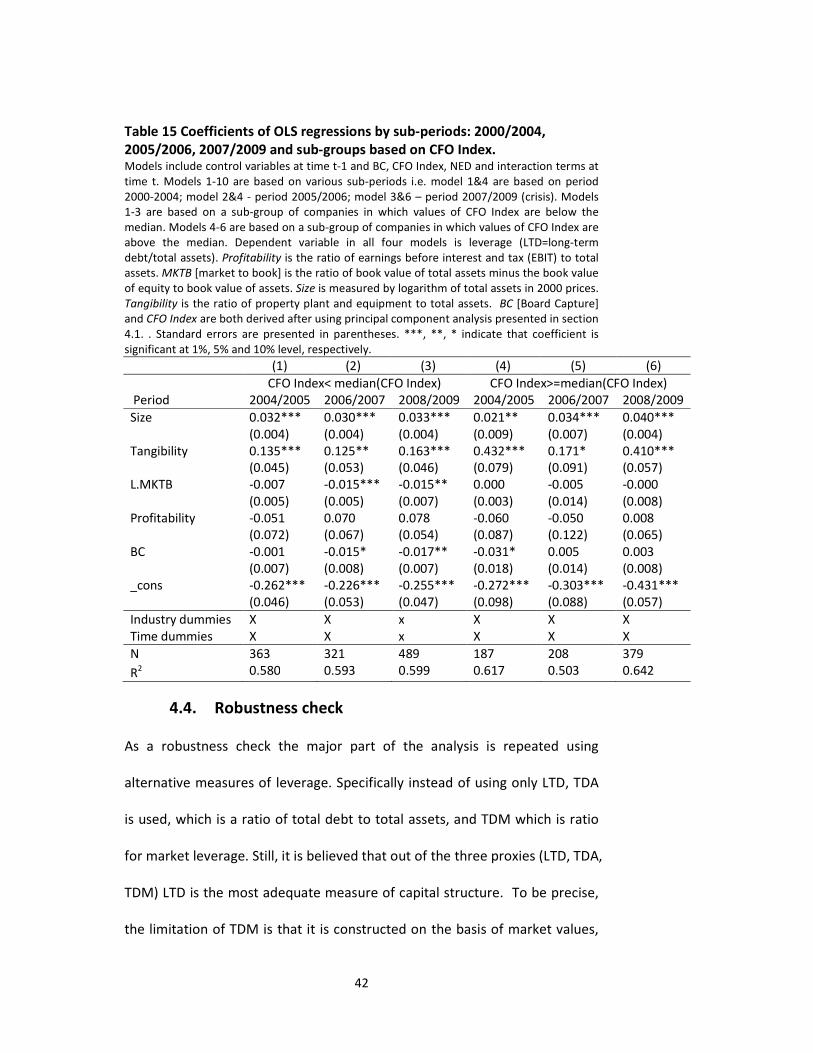
42
Table 15 Coefficients of OLS regressions by sub-periods: 2000/2004,
2005/2006, 2007/2009 and sub-groups based on CFO Index. Models include control variables at time t-1 and BC, CFO Index, NED and interaction terms at
time t. Models 1-10 are based on various sub-periods i.e. model 1&4 are based on period
2000-2004; model 2&4 - period 2005/2006; model 3&6 – period 2007/2009 (crisis). Models
1-3 are based on a sub-group of companies in which values of CFO Index are below the
median. Models 4-6 are based on a sub-group of companies in which values of CFO Index are
above the median. Dependent variable in all four models is leverage (LTD=long-term
debt/total assets). Profitability is the ratio of earnings before interest and tax (EBIT) to total
assets. MKTB [market to book] is the ratio of book value of total assets minus the book value
of equity to book value of assets. Size is measured by logarithm of total assets in 2000 prices.
Tangibility is the ratio of property plant and equipment to total assets. BC [Board Capture]
and CFO Index are both derived after using principal component analysis presented in section
4.1. . Standard errors are presented in parentheses. ***, **, * indicate that coefficient is
significant at 1%, 5% and 10% level, respectively.
(1) (2) (3) (4) (5) (6)
CFO Index< median(CFO Index) CFO Index>=median(CFO Index)
Period 2004/2005 2006/2007 2008/2009 2004/2005 2006/2007 2008/2009
Size 0.032*** 0.030*** 0.033*** 0.021** 0.034*** 0.040***
(0.004) (0.004) (0.004) (0.009) (0.007) (0.004)
Tangibility 0.135*** 0.125** 0.163*** 0.432*** 0.171* 0.410***
(0.045) (0.053) (0.046) (0.079) (0.091) (0.057)
L.MKTB -0.007 -0.015*** -0.015** 0.000 -0.005 -0.000
(0.005) (0.005) (0.007) (0.003) (0.014) (0.008)
Profitability -0.051 0.070 0.078 -0.060 -0.050 0.008
(0.072) (0.067) (0.054) (0.087) (0.122) (0.065)
BC -0.001 -0.015* -0.017** -0.031* 0.005 0.003
(0.007) (0.008) (0.007) (0.018) (0.014) (0.008)
_cons -0.262*** -0.226*** -0.255*** -0.272*** -0.303*** -0.431***
(0.046) (0.053) (0.047) (0.098) (0.088) (0.057)
Industry dummies X X x X X X
Time dummies X X x X X X
N 363 321 489 187 208 379
R2 0.580 0.593 0.599 0.617 0.503 0.642
4.4. Robustness check
As a robustness check the major part of the analysis is repeated using
alternative measures of leverage. Specifically instead of using only LTD, TDA
is used, which is a ratio of total debt to total assets, and TDM which is ratio
for market leverage. Still, it is believed that out of the three proxies (LTD, TDA,
TDM) LTD is the most adequate measure of capital structure. To be precise,
the limitation of TDM is that it is constructed on the basis of market values,

43
and managers are more likely to be focused on measures in book values as
they are more important for bank loan agreements (Harvey, Lins, & Roper, 2004).
The shortcoming of TDA is a failure to incorporate the fact that there are assets
which are balanced by specific non-debt liabilities (Rajan & Zingales, 1995); for
example TDA is negatively affected by gross value of trade credit.
In the analysis so far, control variables at time t-1 and the remaining variables
at time t, were used. For robustness purposes, to reduce the extent of the
endogeneity problem that arises from simultaneous determination; all
independent variables are used at time t-1. Still this OLS approach controls
for endogeneity due to reverse causality.
As Table 15 indicates, OLS estimates hold with prediction on LTD when
alternative measures of leverage are used in models 2 and 3. The three
columns presented confirm the core findings from the main part of this paper.
Specifically, there is a negative and significant impact of board capture on
leverage and interaction between this proxy and CFO Index is positive,
indicating that presence of strong CFO reduces the impact of CEO on the
capital structure. Table 17 extends the main model by division for shorter
periods (2000/2004; 2005/2006; 2007/2009). Again we find a confirmation
that as a good corporate governance mechanism, as discussed, the presence
of a strong CFO gains in relevance in bad times such as the recent financial
crisis (Schoar & Washington, 2011).
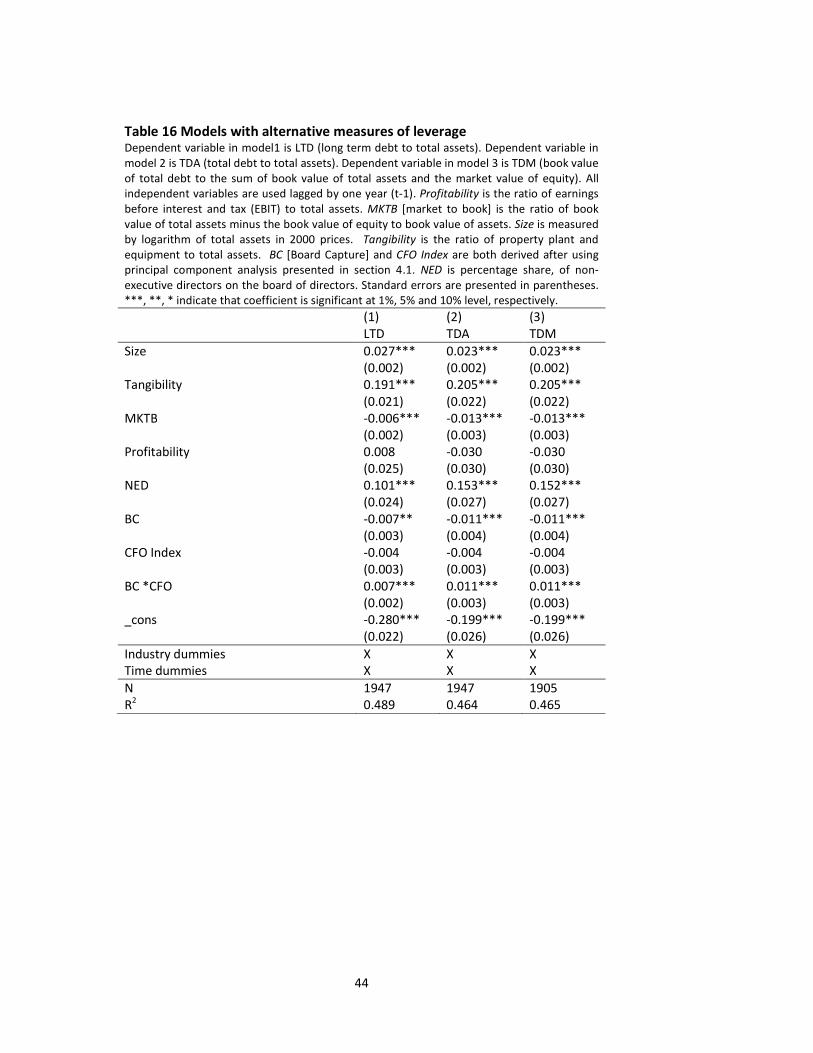
44
Table 16 Models with alternative measures of leverage Dependent variable in model1 is LTD (long term debt to total assets). Dependent variable in
model 2 is TDA (total debt to total assets). Dependent variable in model 3 is TDM (book value
of total debt to the sum of book value of total assets and the market value of equity). All
independent variables are used lagged by one year (t-1). Profitability is the ratio of earnings
before interest and tax (EBIT) to total assets. MKTB [market to book] is the ratio of book
value of total assets minus the book value of equity to book value of assets. Size is measured
by logarithm of total assets in 2000 prices. Tangibility is the ratio of property plant and
equipment to total assets. BC [Board Capture] and CFO Index are both derived after using
principal component analysis presented in section 4.1. NED is percentage share, of non-
executive directors on the board of directors. Standard errors are presented in parentheses.
***, **, * indicate that coefficient is significant at 1%, 5% and 10% level, respectively.
(1) (2) (3)
LTD TDA TDM
Size 0.027*** 0.023*** 0.023***
(0.002) (0.002) (0.002)
Tangibility 0.191*** 0.205*** 0.205***
(0.021) (0.022) (0.022)
MKTB -0.006*** -0.013*** -0.013***
(0.002) (0.003) (0.003)
Profitability 0.008 -0.030 -0.030
(0.025) (0.030) (0.030)
NED 0.101*** 0.153*** 0.152***
(0.024) (0.027) (0.027)
BC -0.007** -0.011*** -0.011***
(0.003) (0.004) (0.004)
CFO Index -0.004 -0.004 -0.004
(0.003) (0.003) (0.003)
BC *CFO 0.007*** 0.011*** 0.011***
(0.002) (0.003) (0.003)
_cons -0.280*** -0.199*** -0.199***
(0.022) (0.026) (0.026)
Industry dummies X X X
Time dummies X X X
N 1947 1947 1905
R2
0.489 0.464 0.465
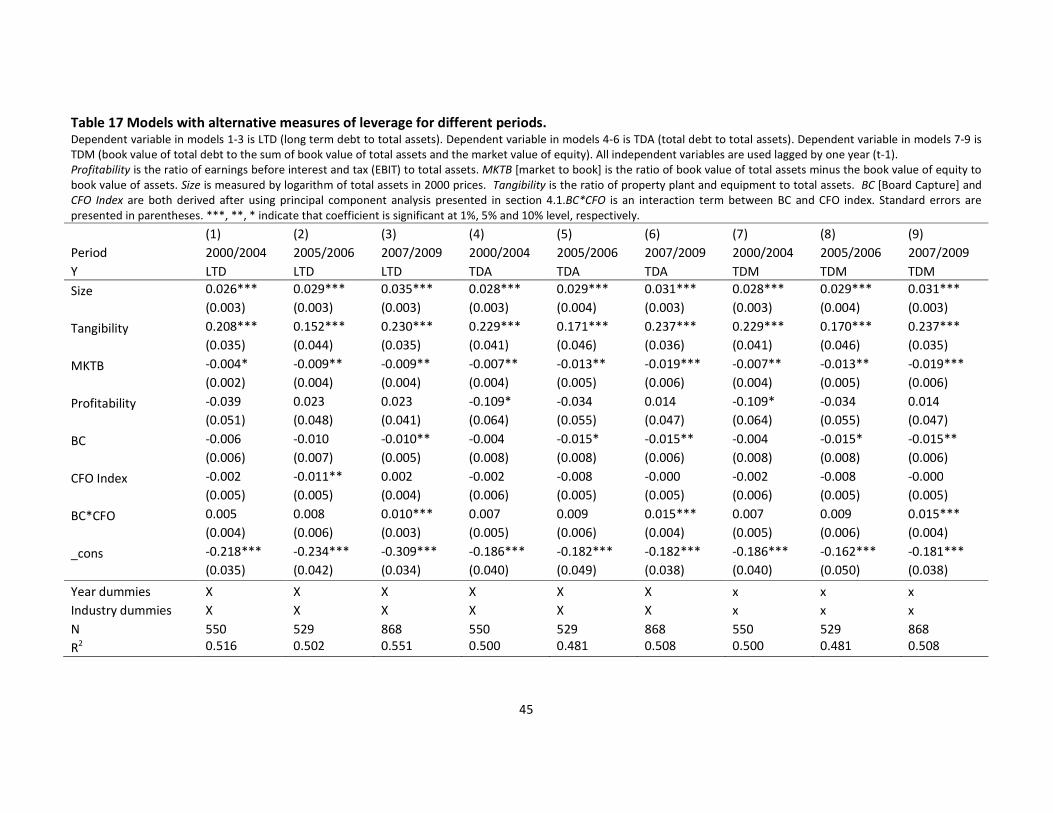
45
Table 17 Models with alternative measures of leverage for different periods. Dependent variable in models 1-3 is LTD (long term debt to total assets). Dependent variable in models 4-6 is TDA (total debt to total assets). Dependent variable in models 7-9 is
TDM (book value of total debt to the sum of book value of total assets and the market value of equity). All independent variables are used lagged by one year (t-1).
Profitability is the ratio of earnings before interest and tax (EBIT) to total assets. MKTB [market to book] is the ratio of book value of total assets minus the book value of equity to
book value of assets. Size is measured by logarithm of total assets in 2000 prices. Tangibility is the ratio of property plant and equipment to total assets. BC [Board Capture] and
CFO Index are both derived after using principal component analysis presented in section 4.1.BC*CFO is an interaction term between BC and CFO index. Standard errors are
presented in parentheses. ***, **, * indicate that coefficient is significant at 1%, 5% and 10% level, respectively.
(1) (2) (3) (4) (5) (6) (7) (8) (9)
Period 2000/2004 2005/2006 2007/2009 2000/2004 2005/2006 2007/2009 2000/2004 2005/2006 2007/2009
Y LTD LTD LTD TDA TDA TDA TDM TDM TDM
Size 0.026*** 0.029*** 0.035*** 0.028*** 0.029*** 0.031*** 0.028*** 0.029*** 0.031***
(0.003) (0.003) (0.003) (0.003) (0.004) (0.003) (0.003) (0.004) (0.003)
Tangibility 0.208*** 0.152*** 0.230*** 0.229*** 0.171*** 0.237*** 0.229*** 0.170*** 0.237***
(0.035) (0.044) (0.035) (0.041) (0.046) (0.036) (0.041) (0.046) (0.035)
MKTB -0.004* -0.009** -0.009** -0.007** -0.013** -0.019*** -0.007** -0.013** -0.019***
(0.002) (0.004) (0.004) (0.004) (0.005) (0.006) (0.004) (0.005) (0.006)
Profitability -0.039 0.023 0.023 -0.109* -0.034 0.014 -0.109* -0.034 0.014
(0.051) (0.048) (0.041) (0.064) (0.055) (0.047) (0.064) (0.055) (0.047)
BC -0.006 -0.010 -0.010** -0.004 -0.015* -0.015** -0.004 -0.015* -0.015**
(0.006) (0.007) (0.005) (0.008) (0.008) (0.006) (0.008) (0.008) (0.006)
CFO Index -0.002 -0.011** 0.002 -0.002 -0.008 -0.000 -0.002 -0.008 -0.000
(0.005) (0.005) (0.004) (0.006) (0.005) (0.005) (0.006) (0.005) (0.005)
BC*CFO 0.005 0.008 0.010*** 0.007 0.009 0.015*** 0.007 0.009 0.015***
(0.004) (0.006) (0.003) (0.005) (0.006) (0.004) (0.005) (0.006) (0.004)
_cons -0.218*** -0.234*** -0.309*** -0.186*** -0.182*** -0.182*** -0.186*** -0.162*** -0.181***
(0.035) (0.042) (0.034) (0.040) (0.049) (0.038) (0.040) (0.050) (0.038)
Year dummies X X X X X X x x x
Industry dummies X X X X X X x x x
N 550 529 868 550 529 868 550 529 868
R2 0.516 0.502 0.551 0.500 0.481 0.508 0.500 0.481 0.508
46
5. Conclusion
The primary objective of this paper is to document the CEO’s power of
influence on the board of directors and its impact on leverage. In doing so the
board capture index is established as a proxy for CEO’s power using principal
component analysis. Specifically CEO’s tenure, ownership and past
performance are combined to create the index. It is found that CEO’s board
capture is negatively associated with leverage, as together with increasing
CEO’s power on the board he pursues a leverage policy according to his
preferences more easily. A powerful CEO normally prefers a lower level of
leverage than shareholders, as a high level of debt in the capital structure
generates additional constraints. The evidence is consistent with the agency
theory (Jensen & Meckling, 1976). Also in this paper, the importance of
spread of power between CEO and CFO is explored. A CFO Index is created
that compares him to the CEO in terms of age, tenure and ownership and
indicates CFO’s independence by including a proxy for his external
directorships. It is found that the presence of a strong chief financial officer
limits CEO’s board capture if the latter reaches a high level. Finally, using data
from 330 firms listed on London Stock Exchange from the period of 2000-
2009, the above mentioned issues are examined in the context of the recent
financial crisis. It is found that the regulatory role of the CFO over the CEO
gains in relevance in the period of crisis, whereas the traditional corporate
governance mechanism of an independent board of directors loses
importance. Taken as a whole, the results indicate that it is not desirable to
have too powerful CEO, who primarily determines the level of leverage.

47
The results add to the literature that examines the influence of
characteristics of the CEO on capital structure policies in firms they manage
(Bertrand & Schoar, 2003; Malmendier et al, 2010; Malmendier & Tate, 2005)
and provide additional insights into the presence of a strong CFO that
modifies the CEO’s influence. Hence, this paper contributes to the emerging
body of literature that explores the executive suite (Acharya, et al., 2011;
Masulis & Mobbs, 2011; Wang, et al., 2011) by providing empirical evidence
that the spread of power between executive directors (CEO and CFO) has
significant influence on corporate financial policies.
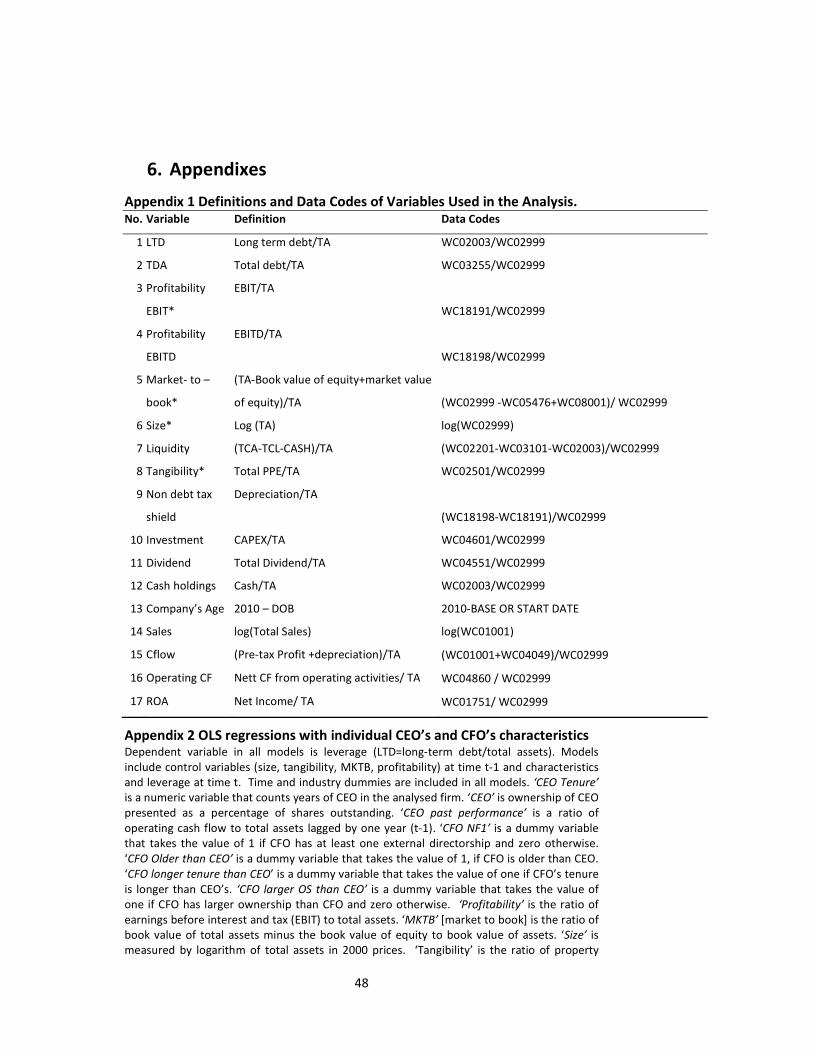
48
6. Appendixes
Appendix 1 Definitions and Data Codes of Variables Used in the Analysis. No. Variable Definition Data Codes
1 LTD Long term debt/TA WC02003/WC02999
2 TDA Total debt/TA WC03255/WC02999
3 Profitability
EBIT*
EBIT/TA
WC18191/WC02999
4 Profitability
EBITD
EBITD/TA
WC18198/WC02999
5 Market- to –
book*
(TA-Book value of equity+market value
of equity)/TA (WC02999 -WC05476+WC08001)/ WC02999
6 Size* Log (TA) log(WC02999)
7 Liquidity (TCA-TCL-CASH)/TA (WC02201-WC03101-WC02003)/WC02999
8 Tangibility* Total PPE/TA WC02501/WC02999
9 Non debt tax
shield
Depreciation/TA
(WC18198-WC18191)/WC02999
10 Investment CAPEX/TA WC04601/WC02999
11 Dividend Total Dividend/TA WC04551/WC02999
12 Cash holdings Cash/TA WC02003/WC02999
13 Company’s Age 2010 – DOB 2010-BASE OR START DATE
14 Sales log(Total Sales) log(WC01001)
15 Cflow (Pre-tax Profit +depreciation)/TA (WC01001+WC04049)/WC02999
16 Operating CF Nett CF from operating activities/ TA WC04860 / WC02999
17 ROA Net Income/ TA WC01751/ WC02999
Appendix 2 OLS regressions with individual CEO’s and CFO’s characteristics Dependent variable in all models is leverage (LTD=long-term debt/total assets). Models
include control variables (size, tangibility, MKTB, profitability) at time t-1 and characteristics
and leverage at time t. Time and industry dummies are included in all models. ‘CEO Tenure’
is a numeric variable that counts years of CEO in the analysed firm. ‘CEO’ is ownership of CEO
presented as a percentage of shares outstanding. ‘CEO past performance’ is a ratio of
operating cash flow to total assets lagged by one year (t-1). ‘CFO NF1’ is a dummy variable
that takes the value of 1 if CFO has at least one external directorship and zero otherwise.
‘CFO Older than CEO’ is a dummy variable that takes the value of 1, if CFO is older than CEO.
‘CFO longer tenure than CEO’ is a dummy variable that takes the value of one if CFO’s tenure
is longer than CEO’s. ‘CFO larger OS than CEO’ is a dummy variable that takes the value of
one if CFO has larger ownership than CFO and zero otherwise. ‘Profitability’ is the ratio of
earnings before interest and tax (EBIT) to total assets. ‘MKTB’ [market to book] is the ratio of
book value of total assets minus the book value of equity to book value of assets. ‘Size’ is
measured by logarithm of total assets in 2000 prices. ‘Tangibility’ is the ratio of property
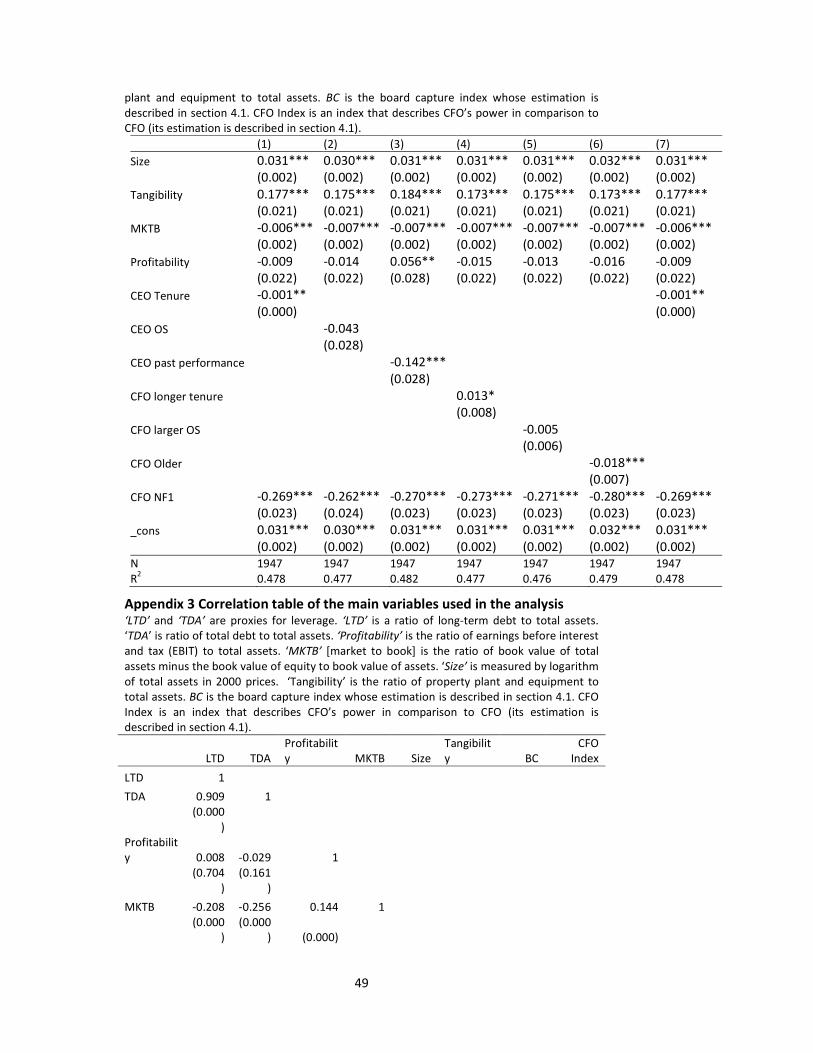
49
plant and equipment to total assets. BC is the board capture index whose estimation is
described in section 4.1. CFO Index is an index that describes CFO’s power in comparison to
CFO (its estimation is described in section 4.1).
(1) (2) (3) (4) (5) (6) (7)
Size 0.031*** 0.030*** 0.031*** 0.031*** 0.031*** 0.032*** 0.031***
(0.002) (0.002) (0.002) (0.002) (0.002) (0.002) (0.002)
Tangibility 0.177*** 0.175*** 0.184*** 0.173*** 0.175*** 0.173*** 0.177***
(0.021) (0.021) (0.021) (0.021) (0.021) (0.021) (0.021)
MKTB -0.006*** -0.007*** -0.007*** -0.007*** -0.007*** -0.007*** -0.006***
(0.002) (0.002) (0.002) (0.002) (0.002) (0.002) (0.002)
Profitability -0.009 -0.014 0.056** -0.015 -0.013 -0.016 -0.009
(0.022) (0.022) (0.028) (0.022) (0.022) (0.022) (0.022)
CEO Tenure -0.001** -0.001**
(0.000) (0.000)
CEO OS -0.043
(0.028)
CEO past performance -0.142***
(0.028)
CFO longer tenure 0.013*
(0.008)
CFO larger OS -0.005
(0.006)
CFO Older -0.018***
(0.007)
CFO NF1 -0.269*** -0.262*** -0.270*** -0.273*** -0.271*** -0.280*** -0.269***
(0.023) (0.024) (0.023) (0.023) (0.023) (0.023) (0.023)
_cons 0.031*** 0.030*** 0.031*** 0.031*** 0.031*** 0.032*** 0.031***
(0.002) (0.002) (0.002) (0.002) (0.002) (0.002) (0.002)
N 1947 1947 1947 1947 1947 1947 1947
R2
0.478 0.477 0.482 0.477 0.476 0.479 0.478
Appendix 3 Correlation table of the main variables used in the analysis ‘LTD’ and ‘TDA’ are proxies for leverage. ‘LTD’ is a ratio of long-term debt to total assets.
‘TDA’ is ratio of total debt to total assets. ‘Profitability’ is the ratio of earnings before interest
and tax (EBIT) to total assets. ‘MKTB’ [market to book] is the ratio of book value of total
assets minus the book value of equity to book value of assets. ‘Size’ is measured by logarithm
of total assets in 2000 prices. ‘Tangibility’ is the ratio of property plant and equipment to
total assets. BC is the board capture index whose estimation is described in section 4.1. CFO
Index is an index that describes CFO’s power in comparison to CFO (its estimation is
described in section 4.1).
LTD TDA
Profitabilit
y MKTB Size
Tangibilit
y BC
CFO
Index
LTD 1
TDA 0.909 1
(0.000
)
Profitabilit
y 0.008 -0.029 1
(0.704
)
(0.161
)
MKTB -0.208 -0.256 0.144 1
(0.000
)
(0.000
) (0.000)

50
Size 0.511 0.462 0.180 -0.163 1
(0.000
)
(0.000
) (0.000)
(0.000
)
Tangibility 0.362 0.341 0.067 -0.165 0.258 1
(0.000
)
(0.000
) (0.001)
(0.000
)
(0.000
)
BC -0.070 -0.097 0.321 0.046 -0.028 0.050 1
(0.001
)
(0.000
) (0.000)
(0.030
)
(0.175
) (0.017)
CFO Index 0.022 0.029 -0.005 -0.022 0.030 0.014 -0.418 1
(0.304
)
(0.169
) (0.801)
(0.293
)
(0.157
) (0.497)
(0.000
)
References
Acharya, V. V., Myers, S. C., & Rajan, R. (2011). The Internal Governance of
Firms. The Journal of Finance, LXVI, 689-720.
Agrawal, A., & Knoeber, C. R. (1996). Firm performance and mechanisms to
control agency problems between managers and shareholders.
Journal of Financial and Quantitative Analysis, 31, 377-397.
Berger, P. G., Ofek, E., & Yermack, D. L. (1997). Managerial Entrenchement
and Capital Structure Decisions. Journal of Finance, 52, 1411-1438.
Bertrand, M., & Schoar, A. (2003). Managing with Style: the Effects of
Managers on Firm Policies Quarterly Journal of Economics, CXVIII,
1169-1207.
Bryan, S., Hwang, L., & Steven, L. (2000). CEO Stock-Based Compensation: An
Empirical Analysis of Incentive-Intensity, Relative Mix and Economic
Determinants. The Journal of Business, 73, 661-693.
Carlson, G., & Karlsson, K. (1970). Age, cohorts and the generation of
generations. American Sociological Review, 35, 710-718.
Chava, S., & Purnanandam, A. (2010). CEOs versus CFOs: Incentives and
corporate policies. Journal of Financial Economics, 97, 263-278.
51
Denis, D. J., Denis, D. K., & Sarin, A. (1997). Ownership structure and top
executive turnover. Journal of Financial Economics, 45.
Eckbo, B. E., & Thorburn, K. S. (2003). Control benefits and CEO discipline in
automatic bankrupcy actions. Journal of Financial Economics, 69, 227-
258.
Fama, E. F., & Jensen, M. C. (1983). Separation of ownership and control.
Journal of Law and Economics, 26, 301–325.
Florackis, C. (2008). Agency costs and corporate governance mechanisms:
evidence for UK firms. International Journal of Managerial Finance, 4,
37-59.
Florackis, C., & Ozkan, A. (2009). Managerial incentives and corporate
leverage: evidence from the United Kingdom. Accounting and Finance,
49, 531-553.
Fracassi, C., & Tate, G. A. (2011). External Networking and Internal Firm
Governance Journal of Finance, Forthcoming.
Frank, M. Z., & Goyal, V., K. (2009). Capital Structure Decisions: Which Factors
are Reliably Important? Financial Management, 38, 1-37.
Frank, M. Z., & Goyal, V. K. (2007). Corporate Leverage: How Much do
Managers Really Matter? In SSRN.
Franks, J., Mayer, C., & Renneboog, L. (2001). Who disciplines management in
poorly performing companies? Journal of Financial Intermediation, 10.
52
Graham, J. R., Harvey, C. R., & Puri, M. (2010). Capital Allocation and
Delegation of Decision-Making Authority within Firms. In SSRN.
Guttman, L. (1954). Some Necessary Conditions for Common-Factor Analysis
Psychometrika, 19, 149-161.
Hambrick, D. C., & Mason, P. A. (1984). Upper Echelons: The Organization as
a Reflection of Its Top Managers. The Academy of Management
Review, 9, 193-206.
Harvey, C. R., Lins, K. V., & Roper, A. H. (2004). The effect of capital structure
when expected agency costs are extreme. Journal of Financial
Economics, 74, 3-30.
Hermalin, B. E., & Weisbach, M. S. (1991). The effects of board composition
and direct incentives on firm performance. Financial Management, 20,
101-112.
Hermalin, B. E., & Weisbach, M. S. (1998). Endogenously Chosen Boards of
Directors and Their Monitoring of the CEO. The American Economic
Review, 88, 96-118.
Hermalin, B. E., & Weisbach, M. S. (2003). Boards of directors as an
edogeneously determined institution: A survey of the economic
literature. FRBNY Economic Policy Review, 9, 7-26.
Jensen, M. C. (1986). Agency cost of free cash flow, corporate finance, and
takeovers. American Economic Review, 76, 831-880.
53
Jensen, M. C., & Meckling, W. H. (1976). Theory of the Firm: Managerial
Behaviour Agency Costs and Ownership Structure. Journal of Financial
Economics, 3, 305-360.
Jian, M., & Lee, K. W. (2011). Does CEO Reputation Matter for Capital
Investments? Journal of Corporate Finance, 17, 929-946.
Jolliffe, I. T. (2002). Principal Component Analysis (2 ed.). New York (USA):
Springer Science + Business Media
Kaiser, H. F. (1960). VARIMAX Solution for Primary Mental Abilities
Psychometrika, 25, 153-158.
Lance, C. E., Butts, M. M., & Michels, L. C. (2006). The Sources of Four
Commonly Reported Cutoff Criteria. What Did They Really Say?
Organizational Research Methods, 9, 202-220.
Landier, A., Sraer, D., & Thesmar, D. (2006). Bottom-up governance. In
Working paper NYU.
Malmendier, U., Tate, G., & Yan, J. (2010). Managerial Beliefs and Corporate
Financial Policies. National Bureau of Economic Research.
Malmendier, U., & Tate, G. A. (2005). CEO overconfidence and corporate
investment. The Journal of Finance, 60, 2661-2700.
Masulis, R. W., & Mobbs, S. (2011). Are All Inside Direstors the Same?
Evidence from the External Directorship Market. The Journal of
Finance, LXVI, 823-862.

54
Mayers, D., Shivdasani, A., & Smith, C. (1997). Board composition and
corporate control: Evidence from the insurance industry. Journal of
Business, 70, 33-62.
Mikkelson, W., & Partch, M. (1997). The decline of takeovers and disciplinary
managerial turnover. Journal of Financial Economics, 44, 205-228.
Modigliani, F., & Miller, M. H. (1958). The cost of capital, corporation finance
and the theory of investment. American Economic Review, 48, 261-
297.
Monks, R. A. G. (2008). How CEOs and the Business Rountable Hijacked the
Worlds Greatest Wealth Machine - And How to Get It Back. New York.
Rajan, G., Raghuram, & Zingales, L. (1995). What Do We Know about Capital
Structure? Some Evidence form International Data. The Journal of
Finance, 50, 1421-1460.
Rosenstein, S., & Wyatt, J. C. (1990). Outside directors, board effectiveness
and shareholder wealth. Journal of Financial Economics, 26, 175-191.
Schoar, A., & Washington, E. L. (2011). Are the Seeds of Bad Governance
Sown in Good Times? In NBER Working Paper Series.
Titman, S., & Wessels, R. (1988). The Determinants of Capital Structure
Choice. Journal of Finance, 43, 1-21.
Wang, W., Shin, Y.-C., & Francis, B. B. (2011). Are CFO's Trades More
Informative than CEO's Trades? Journal of Financial and Quantitative
Analysis, Forthcoming.

55
Weisbach, M. S. (1988). Outside directors and CEO turnover. Journal of
Financial Economics, 20, 431-460.