Embed Size (px)
Citation preview
Universidade de Lisboa
Faculdade de Ciências
Departamento de Biologia Animal
“Cephalopod Fauna in the Southern Ocean using the diet of wandering
albatrosses Diomedea exulans: a stable isotopes approach”
Miguel Fernandes Guerreiro
Dissertação
Mestrado em Ecologia Marinha
2012
1
Universidade de Lisboa
Faculdade de Ciências
Departamento de Biologia Animal
“Cephalopod Fauna in the Southern Ocean using the diet of wandering
albatrosses Diomedea exulans: a stable isotopes approach”
Miguel Fernandes Guerreiro
Dissertação Orientada pelo Prof. Doutor Rui Rosa da Faculdade de Ciências da Universidade de
Lisboa e Doutor José Xavier do Instituto do Mar em Coimbra e do British Antarctic Survey
Mestrado em Ecologia Marinha
2012
2
Á memória de Josefa Esteves Afonso (17/03/1933 - 23/09/2011),
carinhosamente chamada por avó.
3
AGRADECIMENTOS
Quero agradecer ao meu orientador externo Dr. José Xavier pela oportunidade em fazer uma tese
desta escala, e focada na Antártida. Foi um excelente orientador, já que me guio em todo o
processo do desenvolvimento de uma dissertação cientifica e todo o processo por detrás desta, e
levou-me aos melhores locais da Europa (e senão do Mundo) para se fazer ciência Polar e
apresentou-me os maiores especialistas na matéria. Para rematar, e citando o mesmo, foi um
orientador “Brutal” (Xavier, 2007).
Ao meu orientador interno Dr. Rui Rosa, que puxou por mim, e me “puxou pelas orelhas”
quando foi preciso.
Ao Dr. Yves Cherel, pelos seus comentários, perspectivas e conhecimentos que me passou
fundamentais para a minha dissertação.
Ao Dr. Filipe Ceia, pela sua paciência e compreensão no laboratório de Coimbra (IMAR). Se não
fosse ele, provávelmente os meus resultados estariam todos contaminados devido á minha
inexperiência.
Á Dr. Alexandra e á Dr. Gabriela (IMAR), por correr as análises de isótopos estáveis e “tomar
contar” da minha equipa de trabalho respectivamente.
Á minha equipa de trabalho (Pedro Alvito e José Seco), pela a ajuda no processamento de
mandíbulas de cefalópodes em Coimbra.
Á minha irmã pela ajuda na formatação do texto da tese.
Á minha Familia, e ao meu grupo de amigos, ambos por me ouvirem um bilião de vezes a falar
de isótopos, e responderem-me de volta, e claro, pela afeição que nutrem por mim.
4
ABSTRACT
The Southern Ocean is a key component in the climatic and ecological global system.
Cephalopods play an important task in this ecosystem. However, they are difficult to collect and
therefore the basic knowledge regarding their ecology is scarce. The wandering albatross,
Diomedea exulans, is a cephalopod predator. Here I characterize the cephalopod component of
D. exulans diet by collecting boluses and regurgitates of chicks from around the ocean, in South
Georgia, Crozet and Kerguelen Islands. By using stable isotopes analyses of Nitrogen and
Carbon on the squids found on the diet, I can determine the distribution and trophic level of
them, an approach that may provide important information about the threats of D. exulans.
D. exulans fed predominantly in Onychoteuthid and Histioteuthid squids and secondarily on
cranchiids and giant squids. Kerguelen diet differs from the others due to the influence of these
large bodied squids, further proving the idea that much of the diet of these seabirds comes from
scavenging.
Cephalopods of the Southern Ocean were distributed within three water masses (Subtropical,
Subantarctic and Antarctic), except for South Georgia (Antarctic and Subantarctic). Much of the
previous biogeographic distributions of these squids in the Indian sector were confirmed or
expanded north, for the subantarctic region. Cephalopods on the Southern Ocean occupy a great
trophic span, from Martialia hyadesi (3.52±0.25 TL) to Taningia danae (6.01±0.15 TL).Thus,
squids play a key role in the trophic ecology of D. exulans, that feeds mainly of Antarctic and
Subantarctic and secondarily of Subtropical squids.
Based on these findings, we may argue that D. exulans have different threats within the Southern
Ocean: in the Atlantic, Longliners operating in the nearby shelves are the main threat; In the
Indian sector, there is different contributions from Subtropical Tuna fishing and longliners in the
shelves, at the two studied islands.
Key-Words: Cephalopods, Southern Ocean, Stable Isotopes, Diomedea exulans.
5
RESUMO
O Oceano Antártico, também conhecido como Oceano Austral e Oceano Glacial Antártico, é
constituído por uma série de bacias abissais oceânicas, interrompidas pelas cristas oceânicas de
Scotia e Macquarie e pela plataforma continental de Kerguelen.
Este oceano representa um importante componente tanto do Clima e Oceano global, como
também da Bioesfera. É aqui que se inicia a corrente termohalina profunda, fundamental para a
vida submarina planetária devido ao abastecimento de oxigénio às camadas mais profundas do
oceano, e para a vida à superfície, visto que transporta nutrientes das profundezas para os
produtores primários pelágicos. Também é nesta região que se encontra a corrente circumpolar
antártica, acompanhada pelas vagas e ventos de oeste que aumentam a profundidade da camada
homogénea superficial (conceito fundamental em produção primária). Para a existência destes
fenómenos fundamentais e para a manutenção da calote glacial é essencial que as temperaturas
registadas na Antártida permaneçam abaixo de zero.
Deste Oceano dependem vários animais para se reproduzirem e alimentarem, nomeadamente a
ave com maior envergadura de asas do nosso planeta, o Albatroz-Errante (Diomedea exulans).
Esta espécie está, segundo a União Internacional para a Conservação da Natureza (I.U.C.N),
vulnerável à extinção, em muito devido à mortalidade que advém da interação desta ave com
barcos de pesca que operam nas suas áreas de alimentação. Os aparelhos atualmente utilizados
para seguir estes animais quando partem para o mar em busca de alimento apenas nos fornecem
dados de localização e massa do alimento, mas nada acerca de intensidade ou frequência de itens
ingeridos, nem a categoria taxonómica a que esses itens pertencem.
Uma dessas categorias taxonómicas, a teutofauna, é composta pelos cefalópodes (lulas e polvos),
que, no oceano Austral apresentam um alto grau de endemismo, e muitas divisões taxonómicas
não se encontram aqui presentes, como é o caso dos chocos e lulas Myopsidas. Teoriza-se que a
teutofauna seja responsável por uma cadeia trófica alternativa ao Krill (Euphausia superba) e
que substitua o nicho alimentar dos grandes peixes epipelágicos. Estes moluscos são muito
esquivos, conseguindo evadir-se muito eficazmente à captura por métodos tradicionais tanto
pelos cruzeiros científicos, como por barcos de pesca, daí a informação atualmente disponível
relativamente a estes animais nesta região ser reduzida.
6
Nos últimos anos têm sido desenvolvidas técnicas e metodologias com isótopos estáveis de
Carbono e Azoto que pemitem averiguar a partir das assinaturas destes elementos (razão entre a
concentração do isótopo mais pesado sobre a do mais leve) nas mandibulas inferiores das lulas, a
distribuição latitudinal e posição trófica (respetivamente) destes animais. A assinatura de
Carbono é caracteristico de cada latitude neste Oceano, logo informa onde as lulas se
alimentaram, e como a assinatura de Azoto enriquece de uma forma mais ou menos linear de
nível trófico em nível trófico, é possivel calcular níveis tróficos com esta assinatura.
Assim, este estudo pretende averiguar a intensidade de captura de cefalópodes pelo D. exulans ao
longo do oceano em estudo, através da caracterização da dieta em cefalópodes deste e averiguar
a distribuição geográfica (e trófica) destes cefalópodes, e finalmente, inferir a partir desta
informação consequências conservacionistas para o D. exulans.
Para tal, obtiveram-se regurgitações induzidas e boluses de crias de D. exulans nas ilhas da
Geórgia do sul, Crozet e Kerguelen, donde se recolheram as mandíbulas dos cefalópodes usadas
neste estudo. Através da identificação de cada mandíbula e uso de equações alométricas para
estrapolar o peso da lula a partir do tamanho da mandíbula, foi possível obter valores da
abundância numérica e em massa das várias espécies, e assim caracterizar a dieta.
Para averiguar a distribuição latitudinal das lulas, foram consideradas as assinaturas de Carbono
superiores a -19,5‰ e inferiores a -22,3‰ como subtropicais e antárticas, respetivamente, e as
que se encontravam entre estes limites, como subantárticas. Enquanto que para o cálculo do nível
trófico, foi usada uma função linear que transforma a assinatura de Azoto da mandíbula em nível
trófico.
Com os dados obtidos nas alíneas anteriores, foi possível obter a latitude média em que os
cefalópodes da dieta vivem, através do cálculo da média da assinatura de Carbono das lulas
encontradas na dieta, ponderando-a com o peso (neste caso a percentagem de indivíduos) que as
espécies têm na dieta.
A dieta na Geórgia do sul e Crozet foi dominada em número pelas lulas Kondakovia longimana
(24,2% e 33,7%), Taonius sp B (Voss) (23,7% na Geórgia do sul), Galiteuthis glacialis (8,8%
em Crozet) e Histioteuthis eltaninae (10,6% e 25,3%).
7
Em Kerguelen, a ordem de importância do contributo em número é o inverso da observada nas
outras ilhas, com Histioteuthis atlantica (29,9%) a dominar, seguida por G. glacialis (12,2%) e
finalmente K. longimana (10,0%).
Em todas as ilhas, K. longimana destacou-se como a principal espécie a contribuir para a massa
encontrada na dieta (75.5%, 76.0% e 31.0% na Geórgia da sul, Crozet e Kerguelen
respetivamente), mas em Kerguelen verificou-se que lulas gigantes (Architeuthis dux e Taningia
danae) também contribuem com alguma importância para a massa total da dieta (15,0% e
13,2%). A espécie Histioteuthis atlantica, devido ao grande número de individuos encontrado
em Kerguelen , acabou por ter um grande contributo por massa (12,9%).
As diferenças verificadas nas dietas sustentam que no setor atlântico deste Oceano, os albatrozes
dependem mais de Taonius sp. B (Voss), Gonatus antarcticus e Mastigoteuthis sp. A (Clarke)
que no setor Indico, pois neste último setor os albatrozes têm disponível uma maior variedade de
lulas devido à proximidade aos subtrópicos. Foram verificados indícios de necrofagia, pois várias
lulas encontradas pesavam várias vezes mais que um albatroz adulto (aproximadamente 45 Kg e
12 Kg respetivamente).
As lulas analisadas neste estudo apresentam distribuição desde a zona Subtropical á Antártica.
As espécies identificadas como subtropicais foram a H. atlantica, Cycloteuthis akimushkini e
Taonius sp. (Clarke), e como espécies antárticas foram identificadas a Batoteuthis skolops e
Gonatus antarcticus. K. longimana e Moroteuthis knipovitchi também se encontraram em águas
antárticas, mas em alguns locais da amostragem mostraram distribuição subantártica devido ao
efeito que a proximidade à costa tem sobre a assinatura isotópica de Carbono, e também ao facto
de já terem sido observadas a norte da frente polar antártica. Todas as espécies apresentaram a
mesma distribuição que a previamente observada, exceto G. antarcticus que foi observada no
Antártico e Galiteuthis glacialis com a Alluroteuthis antarcticus no subantártico perto da frente
subtropical.
As lulas analisadas distribuem-se por 3 níveis tróficos diferentes, desde o final do terceiro até ao
início do sexto, com a Martialia hyadesi a representar o terceiro nível (alimentando-se
potencialmente de copépodes e krill), seguida no quarto pela K. longimana e Moroteuthis ingens
(alimentando-se potencialmente de mictófideos e outros peixes mesopelágicos). No início do
quinto nível estavam presentes várias espécies que são características do meio mesopelágico
8
como H. eltaninae e Haliphron atlanticus e a meio deste nível encontra-se B. skolops e M. sp. A
(Clarke), duas espécies muito similares, e que provavelmente têm a mesma estratégia alimentar
que outros Mastigoteuthideos, ou seja, alimentam-se de zooplânton bentopelágico. Nos níveis
tróficos mais elevados, encontra-se G. antarcticus, T. sp. B (Voss) e Taningia danae, que se
alimentam de presas com assinaturas de Azoto elevadas devido a encontrarem-se em cadeias
tróficas muito inefecientes ou a serem predadores de topo. Não foi possível a determinação de
níveis tróficos na zona subtropical, mas C. akimushkini apresenta a assinatura de Azoto mais
alta, e H. atlantica mais baixa. A espécie H. atlantica revela um crescimento da assinatura de
Azoto com o aumento do tamanho do animal.
A média ponderada da assinatura de Carbono das dietas dos albatrozes em lulas e a assinatura de
Carbono das principais lulas da dieta mostrou que na Georgia do sul os albatrozes se alimentam
em média na zona da frente polar, limitando-se mais a água subantárticas e proximas das
plataformas continentais desta região, onde ocorre a pesca do Bacalhau da Patagónia
(Dissostichus eleginoides), enquanto que no setor indico, alimentam-se mais a norte na zona
subantártica, perto da plataforma continental das ilhas Kerguelen (onde opera a pesca ao D.
eleginoides), ou no mar aberto entre estas e as Crozet.
Em Kerguelen, se os dados da dieta estiverem certos acerca da importância da H. atlantica, estas
aves alimentam-se principalmente na zona subtropical onde ocorre a pesca ao atum Thunnus
maccoyii e secundariamente na plataforma continental da ilha onde são residentes (onde opera a
pesca ao D. eleginoides), se H .atlantica afinal não for tão importante, a principal zona de
alimentação será mesmo a plataforma continental, com os seus respetivos perigos.
Assim, K. longimana domina a dieta de D. exulans, com diferentes contribuições das outras
familias de lulas nas várias ilhas. As lulas presentes na dieta vêm desde a zona subtropical até á
Antártida com exceção na Geórgia do sul, onde não se registaram lulas dos subtrópicos. A
importância na cadeia trófica destes animais foi confirmada, encontrando-se animais de vários
níveis tróficos. A principal ameaça ao D. exulans é a pesca dos palangreiros nas plataformas
continentais desta região, e em Kerguelen, a pesca ao Atum Thunnus maccoyii.
Palavras-Chave: Cefalópodes, Antártico, Isótopos estáveis, Diomedea exulans.
9
TABLE OF CONTENTS
1. Introduction ........................................................................................................................... 15
1.1 Southern Ocean oceanography and climate.................................................................... 15
1.2 Southern Ocean cephalopods.......................................................................................... 17
1.3 Wandering albatrosses as a sampling predator of cephalopods ..................................... 18
1.4 Using stable isotopic signatures of cephalopods beaks .................................................. 19
1.5 Objectives ....................................................................................................................... 20
2. Material and Methods............................................................................................................ 21
2.1 Study Area and sampling ................................................................................................ 21
2.2 Characterization of cephalopod component in the albatross’ diet .................................. 21
2.3 Stable isotopes analysis .................................................................................................. 23
2.3.1 Isotope Modeling..................................................................................................... 24
2.4 Statistical Analyses ......................................................................................................... 24
3. Results ................................................................................................................................... 26
3.1 Overall ............................................................................................................................ 26
3.1.1 Diet .......................................................................................................................... 26
3.1.2 Stable isotopes ......................................................................................................... 26
3.2 South Georgia ................................................................................................................. 27
3.2.1 Diet .......................................................................................................................... 27
3.2.2 Stable isotopes ......................................................................................................... 33
3.3 Crozet ............................................................................................................................. 36
3.3.1 Diet .......................................................................................................................... 36
3.3.2 Stable Isotopes......................................................................................................... 37
3.4 Kerguelen........................................................................................................................ 40
10
3.4.1 Diet .......................................................................................................................... 40
3.4.2 Stable Isotopes......................................................................................................... 41
3.5 Comparison between islands .......................................................................................... 44
3.5.1 Diet indexes ............................................................................................................. 44
3.5.2 Diversity and cumulative curves ............................................................................. 44
3.5.3 Spatial differences of cephalopod species parameters and signatures .................... 46
3.5.4 Overall trophic level assessment ............................................................................. 49
3.5.5 Isotope modeling of wandering albatrosses foraging waters .................................. 50
4. Discussion ............................................................................................................................. 51
4.1 Methodological limitations ............................................................................................. 51
4.2 Spatial differences in the cephalopod diet of wandering albatrosses ............................. 53
4.3 Cephalopod habitats in the Southern Ocean and adjacent waters .................................. 55
4.4 Cephalopod trophic position in the Southern Ocean and adjacent waters ..................... 57
4.5 Implications on the conservation of wandering albatrosses ........................................... 60
5. Final considerations............................................................................................................... 62
6. Bibliography .......................................................................................................................... 63
7. annexs .................................................................................................................................... 71
11
LIST OF FIGURES
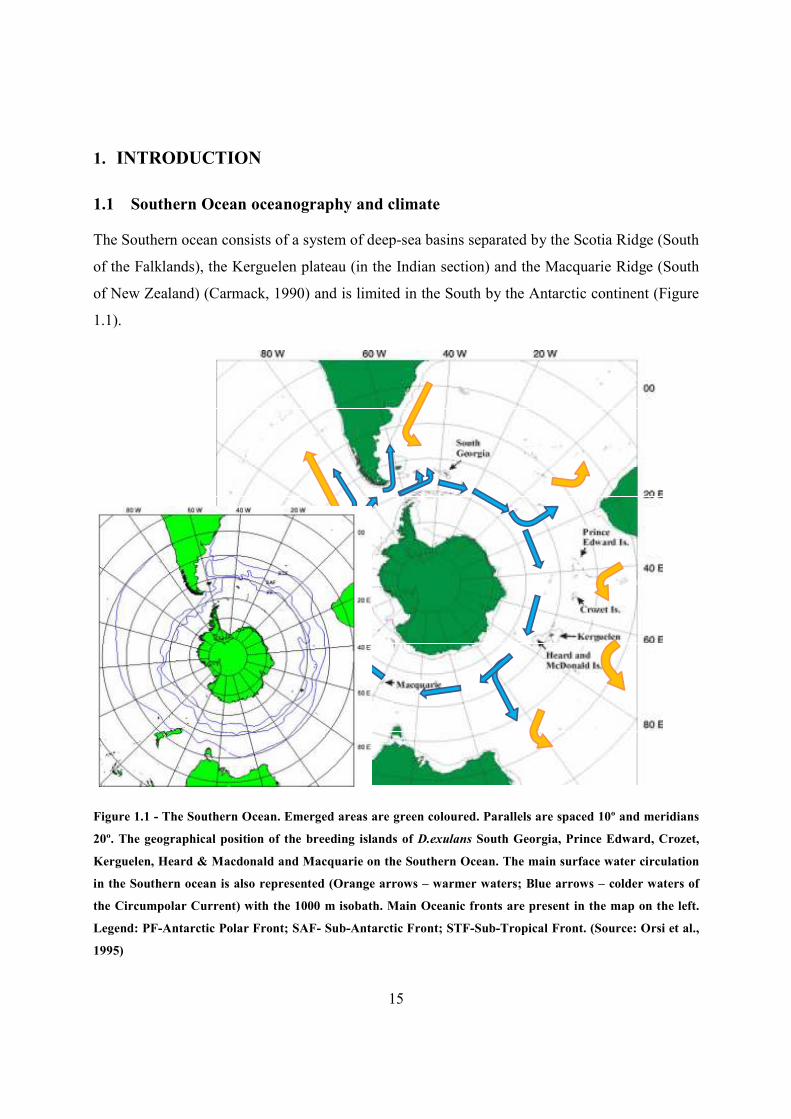
Figure 1.1 - The Southern Ocean. Emerged areas are green coloured. Parallels are spaced 10º and
meridians 20º. The geographical position of the breeding islands of D.exulans South Georgia,
Prince Edward, Crozet, Kerguelen, Heard & Macdonald and Macquarie on the Southern Ocean.
The main surface water circulation in the Southern ocean is also represented (Orange arrows –
warmer waters; Blue arrows – colder waters of the Circumpolar Current) with the 1000 m
isobath. Main Oceanic fronts are present in the map on the left. Legend: PF-Antarctic Polar
Front; SAF- Sub-Antarctic Front; STF-Sub-Tropical Front. (Source: Orsi et al., 1995) .............. 15
Figure 3.1 - Lower Rostral Length (LRL) distribution of the squids found on the diet of
Wandering Albatross in South Georgia, Crozet and Kerguelen. .................................................. 26
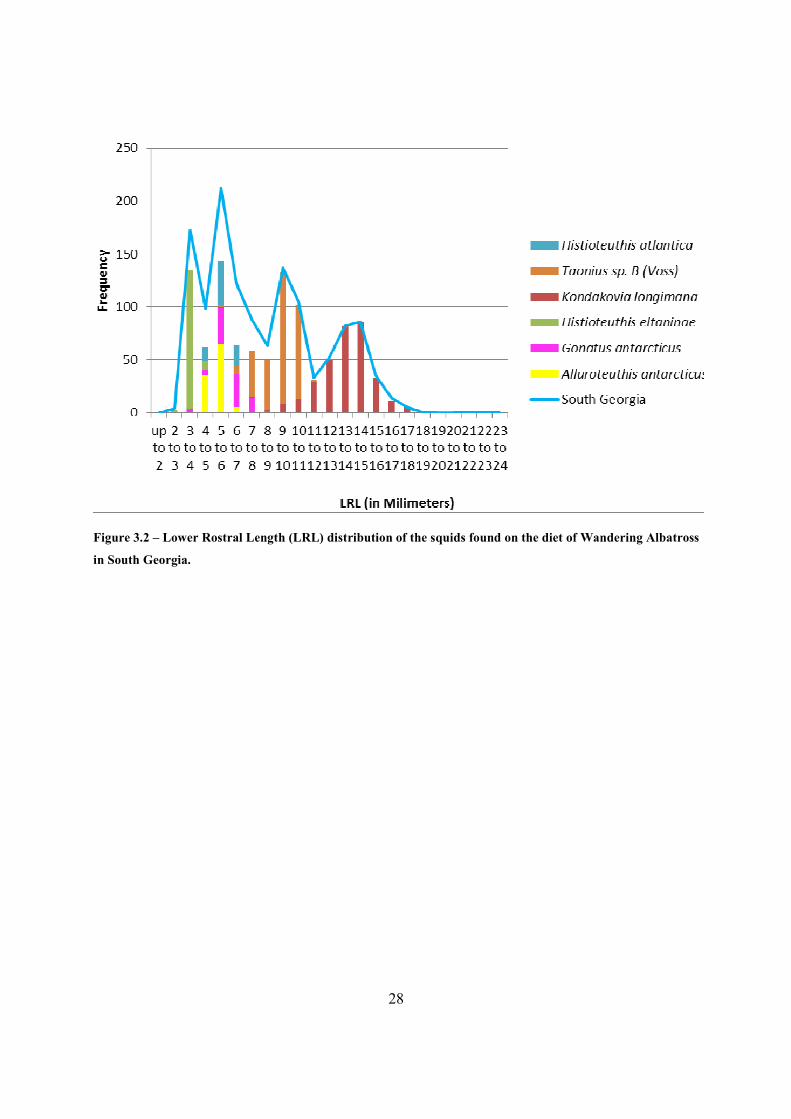
Figure 3.2 – Lower Rostral Length (LRL) distribution of the squids found on the diet of
Wandering Albatross in South Georgia. ....................................................................................... 28
Figure 3.3 - Distribution of the stable isotopes signatures of the squids of South Georgia. Top
panel shows the Carbon signature(Red line and Blue line correspond to Subtropical and Polar
fronts respectively from ( Cherel & Hobson, 2007)) and in the Bottom panel the Nitrogen
signature. "L" and "S" in front of Histioteuthis atlantica stand for large and small specimens
respectively.................................................................................................................................... 35
Figure 3.4 - Lower Rostral Length (LRL) distribution of the squids found on the diet of
Wandering Albatross in Crozet. .................................................................................................... 36
Figure 3.5 - Distribution of the stable isotopes signatures of the squids of Crozet. Top panel
shows the Carbon signature (Red line and Blue line correspond to Subtropical and Polar fronts
respectively from ( Cherel & Hobson, 2007)) and in the Bottom panel the Nitrogen signature. . 39
Figure 3.6 - Lower Rostral Length (LRL) distribution of the squids found on the diet of
Wandering Albatross in Kerguelen. .............................................................................................. 40
Figure 3.7 - Distribution of the stable isotopes signatures of the squids of Kerguelen. Top panel
shows the Carbon signature (Red line and Blue line correspond to Subtropical and Polar fronts
respectively from ( Cherel & Hobson, 2007)) and in the Bottom panel the Nitrogen signature.
"L" and "S" in front of Histioteuthis atlantica stand for large and small specimens respectively.
....................................................................................................................................................... 43
12
Figure 3.8 - Coleman Curves of the squid diversity in South Georgia, Crozet and Kerguelen. ... 45
13
LIST OF TABLES
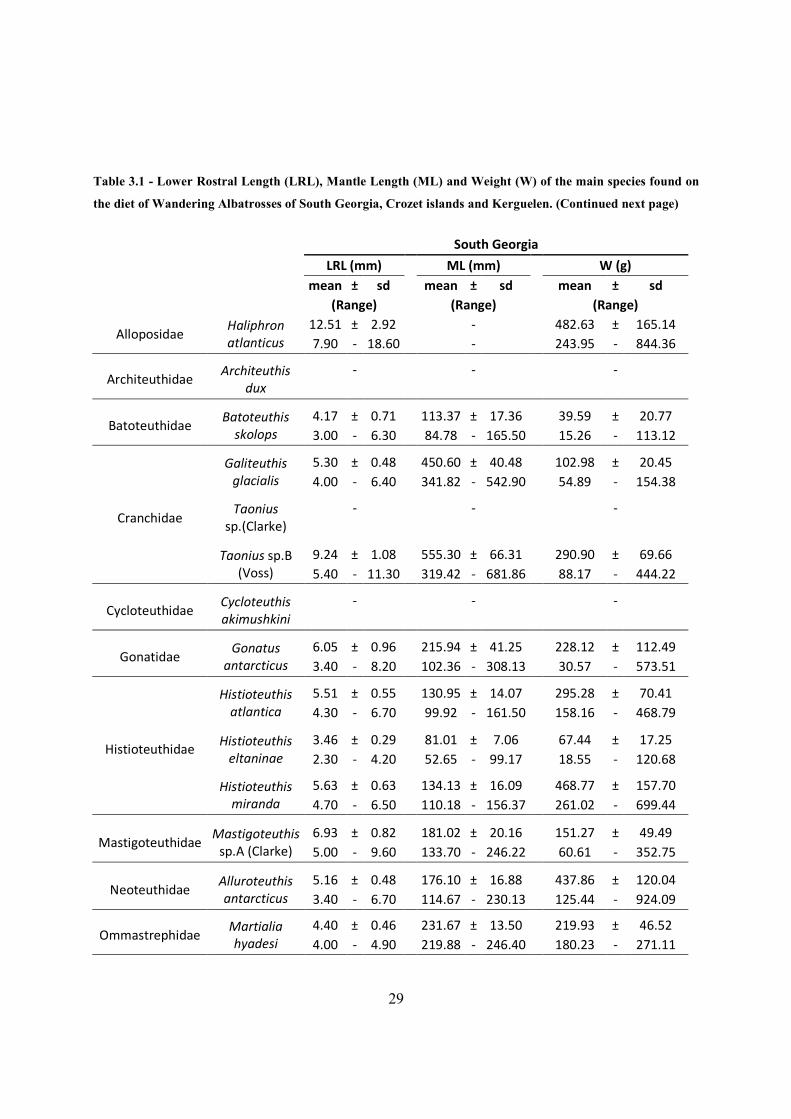
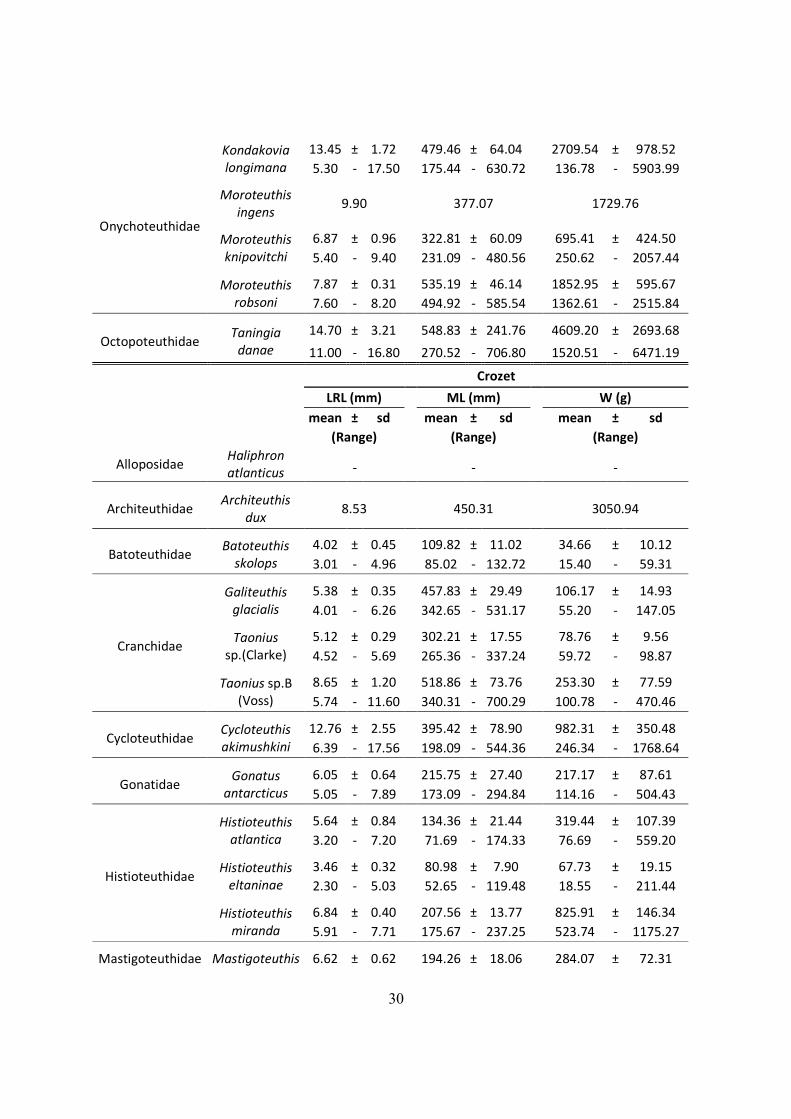
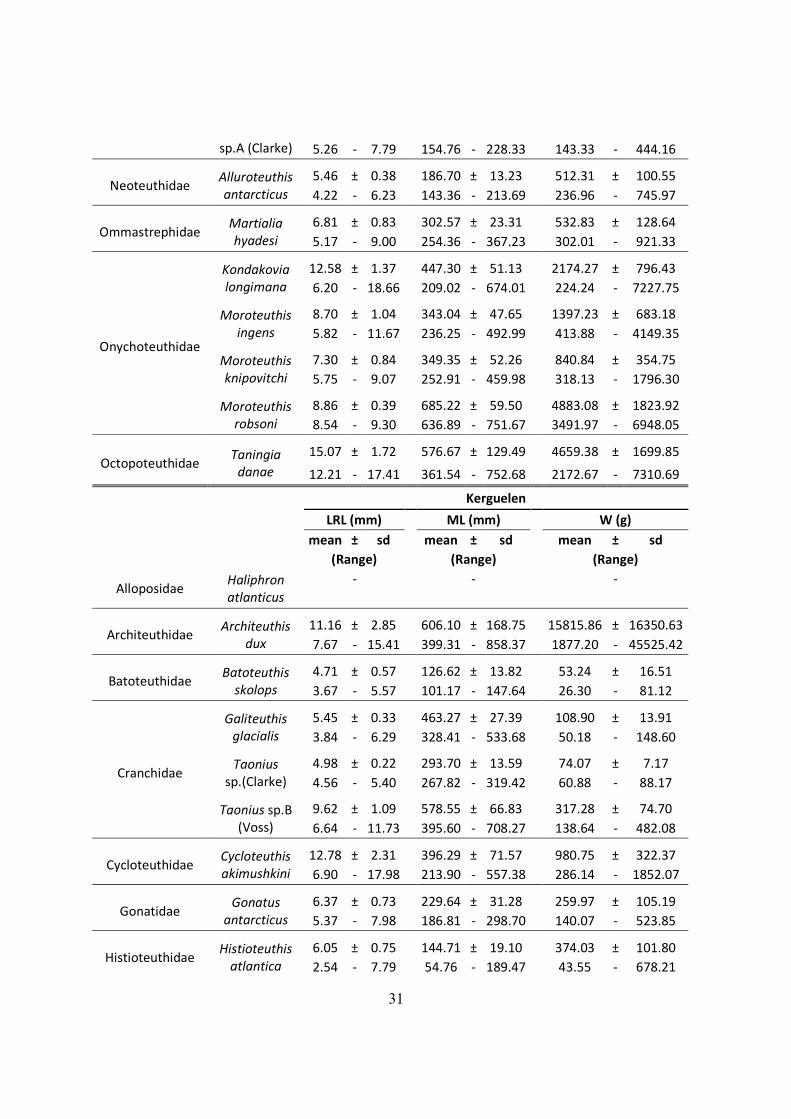
Table 3.1 - Lower Rostral Length (LRL), Mantle Length (ML) and Weight (W) of the main
species found on the diet of Wandering Albatrosses of South Georgia, Crozet islands and
Kerguelen. (Continued next page) ................................................................................................ 29
Table 3.2 - Frequency of occurrence (F%), number of beaks (N%) and estimated mass(W%) of
the main species contributing to the diet of Wandering Albatross in South Georgia, Crozet and
Kerguelen. All species in Table 7.3 in annex. ............................................................................... 33
Table 3.3 - Lower Rostral Length (LRL), Nitrogen and Carbon stable isotopes signatures of the
main species found on the diet of Wandering Albatrosses of South Georgia. .............................. 34
Table 3.4 - Lower Rostral Length(LRL), Nitrogen and Carbon stable isotopes signatures of the
main species found on the diet of Wandering Albatrosses of Crozet. .......................................... 38
Table 3.5 - Lower Rostral Length(LRL), Nitrogen and Carbon stable isotopes signatures of the
main species found on the diet of Wandering Albatrosses of Kerguelen. .................................... 42
Table 3.7 - Tests results of the Nitrogen stable isotopes signatures of the squid species analysed.
Legend: A – Anova; T – T-test; T(EXP) – T-test, to exponentially transformed data. ................ 47
Table 3.8 - Tests results of the Carbon stable isotopes signatures of the squid species analysed.
Legend: A – Anova; T – T-test. .................................................................................................... 48
Table 3.9 - Trophic level of the main Antarctic and Sub-Antarctic species found on the diet of
Wandering Albatrosses of South Georgia, Crozet and Kerguelen. ............................................... 49
Table 3.10 - Mean Stable isotopes signatures of carbon and Nitrogen of the cephalopod
component of the diet of Wandering Albatrosses of South Georgia, Crozet and Kerguelen. ...... 50
Table 7.1 – Alometric equations chosen from Xavier & Cherel (2009). Legend: a- Chiroteuthid
family formula; b- Brachioteuthid family formula; c- Cranchiid family formula; d- Taonius spp.
formula; e- Gonatus spp. Formula; f- Cycloteuthis akimushkini formulas; g- Galiteuthis glacialis
formula. ......................................................................................................................................... 72
Table 7.2 – Distribution of mantle length (ML), weight (W) and LRL from all squids found on
D. exulans diet in the South Georgia, Crozet and Kerguelen islands. .......................................... 75
14
Table 7.3 – All squid items found on the D. exulans diet throughout the three studied isands, and
their respective contributions to the diet in terms of frequency, numeric and mass indexes. ....... 84
Table 7.4 – Chi-squared results on the diet indexes (Frequency of occurrence (F%), numeric
(N%) and mass (W%) indexes). .................................................................................................... 88
15
1. INTRODUCTION
1.1 Southern Ocean oceanography and climate
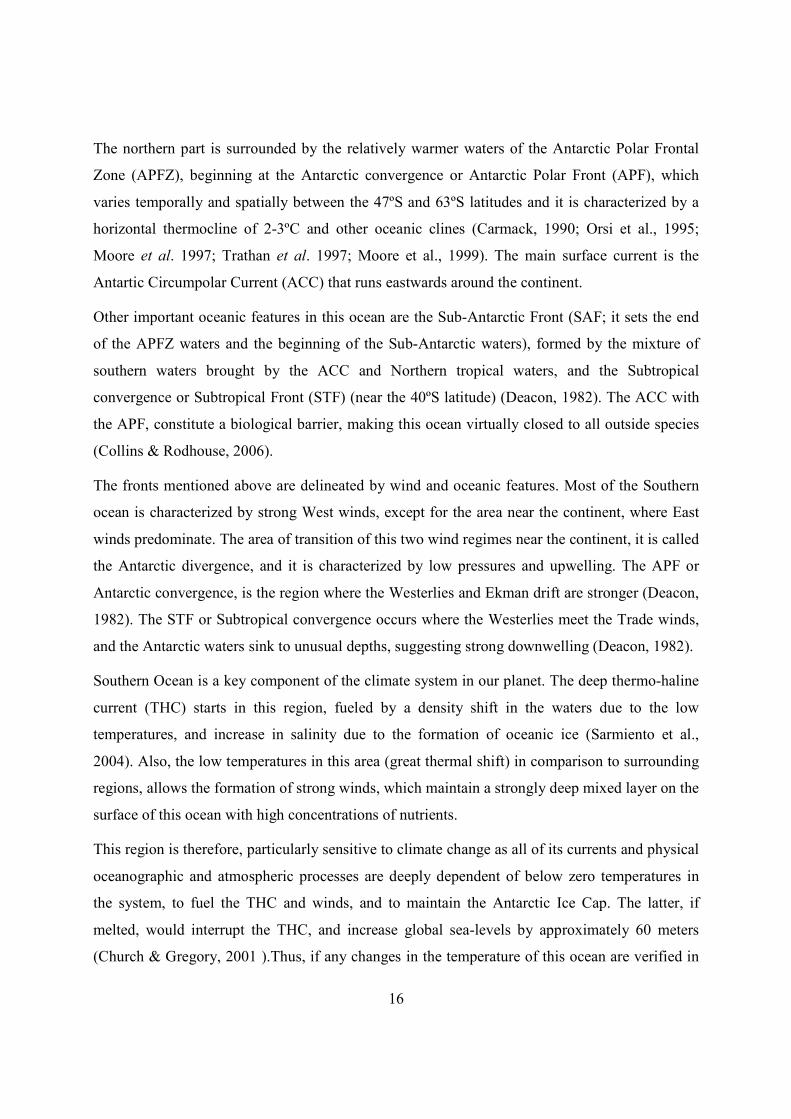
The Southern ocean consists of a system of deep-sea basins separated by the Scotia Ridge (South
of the Falklands), the Kerguelen plateau (in the Indian section) and the Macquarie Ridge (South
of New Zealand) (Carmack, 1990) and is limited in the South by the Antarctic continent (Figure
1.1).
Figure 1.1 - The Southern Ocean. Emerged areas are green coloured. Parallels are spaced 10º and meridians
20º. The geographical position of the breeding islands of D.exulans South Georgia, Prince Edward, Crozet,
Kerguelen, Heard & Macdonald and Macquarie on the Southern Ocean. The main surface water circulation
in the Southern ocean is also represented (Orange arrows – warmer waters; Blue arrows – colder waters of
the Circumpolar Current) with the 1000 m isobath. Main Oceanic fronts are present in the map on the left.
Legend: PF-Antarctic Polar Front; SAF- Sub-Antarctic Front; STF-Sub-Tropical Front. (Source: Orsi et al.,
1995)
16
The northern part is surrounded by the relatively warmer waters of the Antarctic Polar Frontal
Zone (APFZ), beginning at the Antarctic convergence or Antarctic Polar Front (APF), which
varies temporally and spatially between the 47ºS and 63ºS latitudes and it is characterized by a
horizontal thermocline of 2-3ºC and other oceanic clines (Carmack, 1990; Orsi et al., 1995;
Moore et al. 1997; Trathan et al. 1997; Moore et al., 1999). The main surface current is the
Antartic Circumpolar Current (ACC) that runs eastwards around the continent.
Other important oceanic features in this ocean are the Sub-Antarctic Front (SAF; it sets the end
of the APFZ waters and the beginning of the Sub-Antarctic waters), formed by the mixture of
southern waters brought by the ACC and Northern tropical waters, and the Subtropical
convergence or Subtropical Front (STF) (near the 40ºS latitude) (Deacon, 1982). The ACC with
the APF, constitute a biological barrier, making this ocean virtually closed to all outside species
(Collins & Rodhouse, 2006).
The fronts mentioned above are delineated by wind and oceanic features. Most of the Southern
ocean is characterized by strong West winds, except for the area near the continent, where East
winds predominate. The area of transition of this two wind regimes near the continent, it is called
the Antarctic divergence, and it is characterized by low pressures and upwelling. The APF or
Antarctic convergence, is the region where the Westerlies and Ekman drift are stronger (Deacon,
1982). The STF or Subtropical convergence occurs where the Westerlies meet the Trade winds,
and the Antarctic waters sink to unusual depths, suggesting strong downwelling (Deacon, 1982).
Southern Ocean is a key component of the climate system in our planet. The deep thermo-haline
current (THC) starts in this region, fueled by a density shift in the waters due to the low
temperatures, and increase in salinity due to the formation of oceanic ice (Sarmiento et al.,
2004). Also, the low temperatures in this area (great thermal shift) in comparison to surrounding
regions, allows the formation of strong winds, which maintain a strongly deep mixed layer on the
surface of this ocean with high concentrations of nutrients.
This region is therefore, particularly sensitive to climate change as all of its currents and physical
oceanographic and atmospheric processes are deeply dependent of below zero temperatures in
the system, to fuel the THC and winds, and to maintain the Antarctic Ice Cap. The latter, if
melted, would interrupt the THC, and increase global sea-levels by approximately 60 meters
(Church & Gregory, 2001 ).Thus, if any changes in the temperature of this ocean are verified in
17
the future, they will have great repercussions not only in this area and their inhabitants, as for the
global ocean and planet.
Besides playing a key role in the replenishment of dissolved oxygen in the deep sea, this region
also brings nutrients that are deposited in the sea bottom (or in deep waters) back to the surface
(Sarmiento et al., 2004).
Last but not the least, the Southern Ocean is the habitat for numerous seabirds and marine
mammal species, which depend on this ocean productivity and remoteness for foraging and
breeding, respectively.
1.2 Southern Ocean cephalopods
Cephalopods play an important role in the marine food web of the Southern Ocean, since some
of them occupy the niche of epipelagic top predators, normally occupied by sharks and large
fish, and constitute part of an alternate food chain to krill (Rodhouse & White, 1995). These
factors make cephalopods target of predation by many top marine predators (e.g. toothed whales,
seals, penguins and Procellariform birds), and enable them to sustain large populations in the
region (Xavier & Cherel, 2009). In fact, it has been estimated that top marine predators consume
around 34 million tonnes of cephalopods per annum (Clarke, 1983).
Despite their important bio-ecological role in the Southern ocean, the basic knowledge of the
ecology of cephalopods is poorly known (Xavier et al., 1999). One of the main reasons for that is
the fact that the Southern Ocean cephalopods have not awakened the interest of fishery industry,
due to: i) the low number of exploitable species ii) the unpredictability of such stocks, iii) Lack
of knowledge of the abundance and distribution of relevant species and iv) our inability to catch
them ( Cherel et al., 2004; Collins & Rodhouse, 2006; Rodhouse 1998).
Also, the scientific cruises carried out in this area are unable to capture these animals due to the
low speeds they practice, and as well for the orthodox sampling methods used (Rodhouse 1990,
Rodhouse et al. 1996, Clarke 1977, Xavier et al., 2007).
It is worth noting that the cephalopod fauna of the Southern ocean deeply differs from the
cephalopod fauna of the rest of the world. It consists of endemic species of octopods (cirrate and
incirrate) and oegopsid squids, with a total absence of cuttlefish. Also myopsids are absent, and
normally abundant families are rare or nonexistent. Only here we can find the Psychroteuthidae
18
and Batoteuthidae squid families, and the genera Mesonychoteuthis, Psychroteuthis, Kondakovia,
Alluroteuthis, Slosarczykovia and Batoteuthis.
The oegopsid squids in this ocean are exclusively pelagic or benthopelagic and most have
circum-Antarctic patterns of distribution. The cephalopod fauna can be divided into species
entirely Antarctic, and those that span the APF. These last ones either are migratory species or
are deep-sea animals, to which the APF has no biological meaning.
The main squid families found in this ocean are the: i) Onychoteuthids (e.g. including the
Kondakovia and Moroteuthis genera), ii) Ommastrephids (mainly Martialia hyadesi), iii)
Gonatids (e.g. Gonatus antarcticus), iv) Cranchids (including the colossal squid
Mesonychoteuthis hamiltoni), v) Neoteuthids (mainly Alluroteuthis antarcticus), vi) Batoteuthids
(with only Batoteuthis skolops), vii) Mastigoteuthids (e.g. Mastigoteuthis psychrophila and M.
sp. A (Clarke)), and viii) Histioteuthids.
1.3 Wandering albatrosses as a sampling predator of cephalopods
As an alternative to the more conventional methods used to study the biology of cephalopods
from the Southern Ocean, a different approach has been recently applied, namely the use of
seabird predators to sample cephalopods (Xavier et al. 2003a).
In this study, it was used the wandering albatross (D. exulans), the seabird with the largest wing
span (with over 3 meters) that allows them to practice of long distance flights with low energetic
requirements (Weimerskirch et al., 2000), for instance, during its annual circum-antarctic
migration. In general, albatrosses are an excellent tool for this kind of studies, because: i) they
feed on a great amount and diversity of cephalopods (Rodhouse et al., 1987; Tickell 2000), ii)
their populations gather around every year in high density colonies, iii) they do not fear the
human presence, iv) cover large foraging areas to feed their chicks, which in turn v) maintain
undigested parts of their prey in the stomachs for long periods of time (e.g. cephalopod statoliths
and beaks).
D. exulans is thought to explore vast areas of the ocean seeking for large blotches of dying post-
spawning cephalopods that float up to the surface after death or near death (Lipinski & Jackson
1989),or for regurgitated stomach contents of sperm whales (Clarke et al., 1981). These
assumptions are supported by the fact that their diet includes many deep sea cephalopods, i.e.,
19
animals that are usually found in depths out of the albatross reach (note: the maximum depth
reach of the D. exulans is normally the length of its neck).
The main nesting colonies of D. exulans are found in islands and archipelagos of the sub/peri-
antarctic regions of South Georgia, Prince Edward, Crozet, Kerguelen and Macquarie (Figure
1.1). It is a biannual reproducing species, starting its mating season in the beginning of the
austral summer (late November) and ending in the summer of the following year (December)
(Tickell, 2000). By that time, the chicks regurgitate boluses with all the undigested parts of the
meals that the parents gave to them up to that point, and leave the colony, for the first time, into
the ocean.
During this period, breeding D. exulans make foraging trips to the surrounding ocean, which
change in both length and time spent according to the state of development of the chick. Females
go further North than males (Nel et al., 2002 ;Xavier et al., 2004), and it is by far, during
incubation, that the parents perform the longest foraging trips. When chicks are born, parents
limit their trips, becoming shorter and closer to the colonies continental platform (Weimerskirch
et al., 1993; Nel et al., 2002).
According to the International Union for Conservation of Nature (IUCN), D.exulans is presently
in a vulnerable state of conservation, due to several causes, one of them is due to being a by-
catch of the long liners operating in foraging areas (Gales 1993, Gales 1998, Prince et al., 98).
The reason behind the common visits to these fishing vessels is the hope to get an easy meal.
Although the foraging areas of wandering albatrosses are well known, the foraging effort in such
areas has not been quantified yet, as the information of the devices used in foraging behavior
studies can only give us the information about the feeding location and the mass of their food
intake, with no taxonomic or categorical information.
1.4 Using stable isotopic signatures of cephalopods beaks
In the last couple of decades, stable isotopes analysis has been used to study trophic web
ecology, namely by using the isotopes of Carbon (of atomic weights 12 and 13) and Nitrogen (of
atomic weights 14 and 15), to gather information of geographic position and trophic level of
biological samples, respectively (DeNiro & Epstein, 1978; DeNiro & Epstein, 1981).
20
The stable isotope signature of Carbon is influenced by limitations occurring during the
photosynthesis of the autotrophs (the bottom of the food web), mainly by the activity of the
Rubisco or by the concentration of the substrate (CO2) that limits the fixation of Carbon. This
translates into an impoverishment or enrichment in heavy isotopes of Carbon 13, respectively.
As the activity of Rubisco is gradually more limited in the upper latitudes of the ocean due to the
decline of sea surface temperatures (SST) (Sackett et al., 1973), and at the same time, the
increase in CO2 available for the photosynthesis, a latitudinal gradient can be verified from the
equator to the poles (Cherel & Hobson, 2007; Jaeger et al., 2010). This signature is then passed
up throw the food chain with very low variability (DeNiro & Epstein, 1987).
The stable isotope signature of Nitrogen is useful to calculate the trophic level of a sample, as the
heavier isotope of Nitrogen 15 accumulates from trophic level to trophic level in a linear way
(Minagawa & Wada, 1984), and integrates the Nitrogen signatures of the different items of the
diets.
Cherel & Hobson (2005) were the first to adapt and calibrate the stable isotopes methodology for
the cephalopod beaks found on the diet of several of their predators, and by using the respective
signatures, they confirmed the geographic position and trophic levels of reference species, and
extrapolated to the rest of the species in that study. The present study intends to apply this
methodology to the beaks found on the: i) boluses regurgitated by the wanderers’ chicks and ii)
induced regurgitations of the chicks after being feed by their parents.
1.5 Objectives
Under this content, the main objectives of this study are to:
• Characterize the cephalopod diet of wandering albatrosses from the Atlantic sector (South
Georgia), Indian Sector (Crozet and Kerguelen islands) of the Southern Ocean;
• Define the habitat and trophic level of cephalopods in the Southern Ocean and adjacent
waters, using stable isotope analyses;
• Evaluate the implications of such findings on the conservation of wandering albatrosses.
21
2. MATERIAL AND METHODS
2.1 Study Area and sampling
The study area is focused on the Diomedea exulans’ breeding islands (Figure 1.1) off South
Georgia (54ºS, 38ºW; South of the APF) and French archipelagos of Kerguelen (49ºS,69ºE; on
the APF) (Moore et al., 1999; Koubbi et al. 1991) and Crozet (46ºS,51ºE; North of the APF)
(Park et al., 1991; Belkin & Gordon, 1996; Park et al., 1997).
The cephalopod beaks were collected by two methods – boluses and induced regurgitations –
both involving the sampling of stomach contents of albatrosses.
All samples were collected in the same year of 1998 (on the months of September, October and
December).
The boluses were collected in South Georgia, where albatross chicks voluntarily regurgitate prior
to the departure from the colony (fledgling) (Xavier et al., 2003a). Boluses comprise indigestible
items, including beaks of cephalopods given by both parents to the chick, during the winter prior
to its departure, from April/May until October/December (Prince & Morgan, 1987; Xavier et al.,
2003b; Xavier & Croxall, 2007; Xavier et al., 2005).
The second sampling method – induced regurgitations (the animal is held upside down, and its
chest is massaged until the stomach contents are vomited) – was used in the archipelagos of
Crozet and Kerguelen. They were obtained immediately after the chicks being fed by one of its
parents (Cherel & Weimerskirch, 1999; Weimerskirch et al., 2005).
2.2 Characterization of cephalopod component in the albatross’ diet
After sampling in 1998, samples were frozen at -20ºC, until laboratory treatment. Samples from
Crozet and Kerguelen were analyzed in the Centre E´tudes Biologiques de Chizé in France,
while the ones from South Georgia were analyzed at the British Antarctic Survey headquarters,
Cambridge (UK).
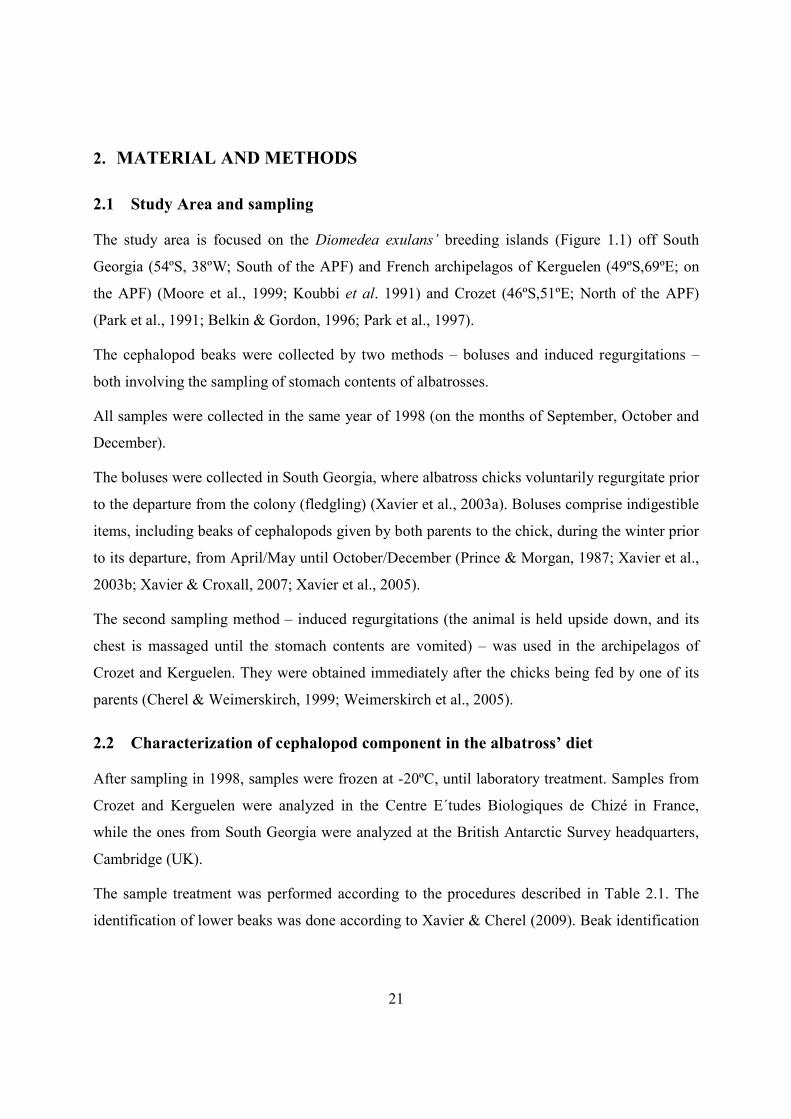
The sample treatment was performed according to the procedures described in Table 2.1. The
identification of lower beaks was done according to Xavier & Cherel (2009). Beak identification
22
was confirmed against the collections present in the British Antarctic Survey and in the Centre
E´tudes Biologiques de Chizé.
Table 2.1 – Laboratory procedures adopted on the treatment of the different structures.
Structure Procedure
Beak
Clean and separation in upper and lower beaks (Xavier et al.
2003a).
Upper beak
Counted
Lower beak
Counted, measurement of lower rostral length (LRL) with
callipers with a precision of a tenth of a millimeter and
identification to the species level when possible (Xavier et al.,
2003a; Xavier & Cherel, 2009).
To characterize the cephalopod component in the wandering albatross diet, the following indices
were determined for each island:
i. Weight index value (%W): indicates the percentage of weight that each prey species has
in the diet. For that, it was used allometric equations that relate the wet mass (M, in
grams) and Mantle Length (ML, in mm) with the Lower Rostral Length (LRL) of the
squids, and the Lower Hood Length (LHL) in the octopuses (Xavier &Cherel, 2009). The
total weight contribution of a certain species is then calculated by multiplying the mean
weight of the individuals sampled and measured (LRL), with the total number of Lower
beaks counted for that same species in the samples. Allometric equations from Xavier &
Cherel 2009 were used (Table 7.1,in annex). No equation was available for the ML of
Haliphron atlanticus;
ii. Numeric index value (%N): it is the number of prey of a certain species divided by the
total number of prey in the samples. The number of prey was estimated by the number of
lower beaks found on the samples;
iii. Frequency index value (%F): percentage of samples with lower beaks of each prey.
Biological diversity of each sample was calculated using the Shannon-Wienner index:
;
23
For comparison of diet diversity, there were plotted individual-based rarefaction curves of each
island and by confidence intervals, it was deliberated if the samples are equal or not. In this case,
it was used a mathematically distinct but computationally much faster way, the “random
placement” curve of Coleman (Coleman, 1981; Coleman et al., 1982), which has been shown to
very closely approximate the hypergeometric rarefaction curve (Brewer & Williamson 1994;
Colwell & Coddington 1994). Confidence Intervals of 95% were calculated by adding and
subtracting to the curve the double of standard deviation registered in each point of the curve.
2.3 Stable isotopes analysis
After the characterization of the cephalopod component in the diet of wandering albatrosses off
South Georgia, Crozet, and Kerguelen, only the cephalopod species that had at least 30
individuals present in one of the islands diets were used in the stable isotope study, ie., the
species choice was done according to their importance by number and mass in the diets.
After that, 10 lower beaks for each species were randomly chosen following Cherel & Hobson
(2005) procedure.
In IMAR-CMA laboratory, the beaks were dried at 60ºC and grinded into a fine powder; 0.30 to
0.55 mg of each beak sample were placed in a tin capsule, and the stable isotope signatures were
measured using a Flash EA 1112 Series elemental analyser coupled on line via Finningan conflo
II interface to a Thermo delta V S mass spectrometer. Replicate measurements of internal
laboratory standards (acetanilide) indicate measurement errors < 0.1 % both for Carbon and for
Nitrogen.
The Carbon and Nitrogen isotope signatures are expressed in delta (δ) notation, defined as the
parts per thousand (‰) deviation from a standard material (PDB limestone for δ 13C and
atmospheric Nitrogen for δ 15N);
δ 13C or δ 15N , where R = 13C/12C or 15N/14N.
After this procedure, it was subtracted 0.75‰ and added 4.8‰ to the Carbon and Nitrogen
signature, respectively, to obtain the mean soft tissues signature of the cephalopods (Cherel &
Hobson, 2006).
24
2.3.1 Isotope Modeling
Samples with δ 13C signatures above -19.5‰ and below -22.3‰ were considered of Subtropical
and Antarctic origin respectively (Cherel & Hobson, 2007). Those that did not enter in these two
groups, were Subantarctic.
Trophic levels (TL) of the samples were calculated according to Minagawa & Wada (1984)
equation:
,
using the δ 15N baseline as Salpa thompsoni with δ15N=3.0‰ (South Georgia average of Su7
and Su8 of (Stowasser et al., 2012)) and 3.4‰ (Crozet island and Kerguelen (Cherel et al,
2008)), both at TL=2 to compare later in this study with other top predators of the ocean.
Subtropical species (with a δ 13C signatures above -19.5‰) were not included in this
calculations, as they have a different d15N baseline of the other 2 oceanic areas (Subantarctic
and Antarctic, I.e. below δ 13C=-19.5‰).
To estimate mean foraging latitude of D. exulans in each island, the means and standard
deviation of the stable isotopes signatures of all cephalopod sampled were calculated.
Afterwards, the Weighted mean Carbon and Nitrogen signature of the cephalopod component of
the Wandering Albatross diet was calculated by weighting the mean signature of each species,
with the number of individuals of each cephalopod found on the diet of D. exulans, for each
island. Representation of the diet (total individuals of the sampled species for SI analysis on the
diet/total individuals on the diet) is presented in %.
2.4 Statistical Analyses
In order to compare the three diet indexes, there were used chi-squared tests. For that, individual
categories were created for each common species to the three islands and all the others species
that only occurred in one or two islands were merged in a category called “others”. This was due
to the high sensibility of the chi-squared test to null entries, skewing the test results to statistical
significance.
25
For the frequency index analysis only the common species to the three islands categories were
considered, because otherwise it would skew the final results.
Histioteuthis B is a group of species (H. atlantica and H. eltaninae) merged into this division, on
the moment of identification and measurement of LRL by the British Antarctic Survey in 1998
(South Georgia sample). However, this 2 species were separated a posteriori, by determining H.
eltaninae highest LRL value (4.2 mm inclusive), and higher values being of H. atlantica LRL,
by the observation of LRL distribution of both these species in the other studied islands . This
means, H. atlantica lower LRL values are included in the H. eltaninae sample.
The mean, standard deviation (presented in mean ± standard deviation) and range (minimum-
maximum) were calculated for LRL, stable isotopes signatures data and the mantle length and
weight values of the species (note: the latter were calculated with LRL allometric equations). It
was only used the LRL and Stable isotopes signatures to test for differences between
cephalopods in different diets, due to the inherent error that the allometric equations used to
calculate weight and length have.
Test for difference on previous parameters between two different islands was made by the use of
T-Test if assumptions are followed; If not, it was used the Mann-Whitney test or Kruskall-
Wallis.
When comparing multiple islands (k>3) analysis was carried using an ANOVA (previously,
normality and homogeneity of variances were verified) or Kruskall-Wallis. If significant
differences were demonstrated somewhere among the groups with the ANOVA or Kruskall-
Wallis tests, the Tukey or Dunn Tests were used, respectively, to find out where those
differences were.
All statistical analyses were performed for a significance level of 0.05, using Statistica 10.0.
EstimateS Win 8.20 software was used to calculate the values for the Coleman curves.
26
3. RESULTS
3.1 Overall
3.1.1 Diet
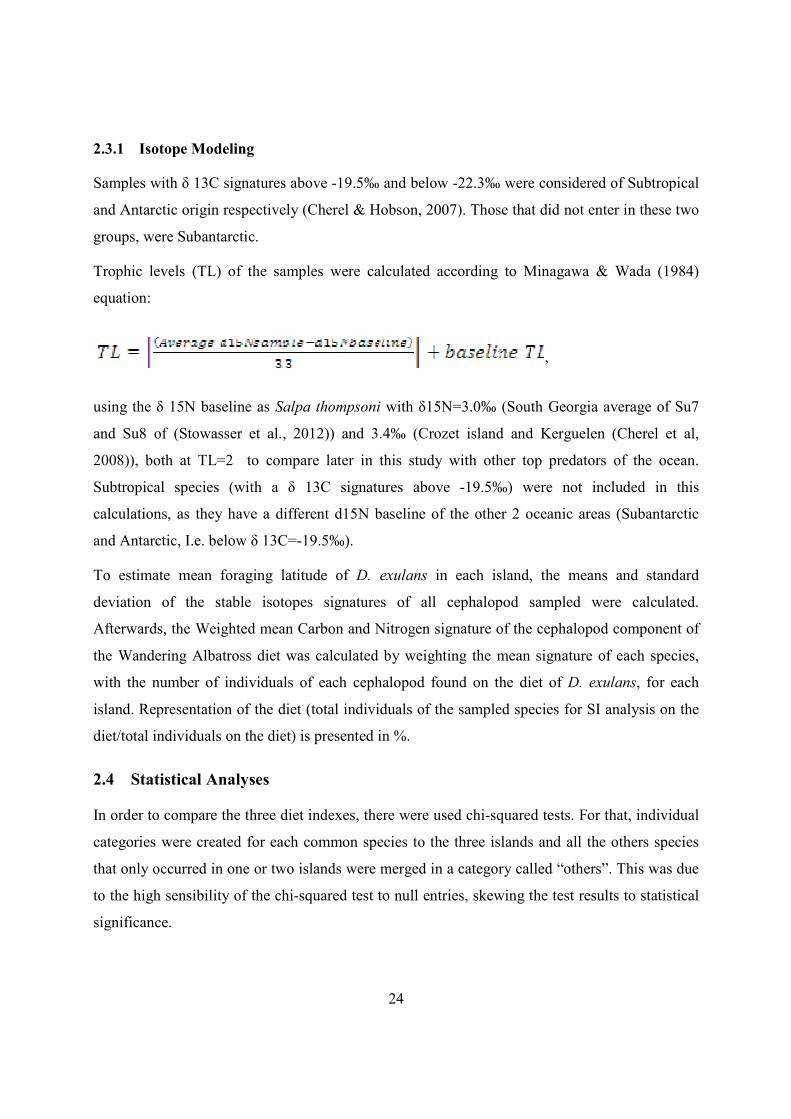
A total of 15,583 beaks were analyzed from the diet of 82 wandering albatrosses. Of those, 7677
were upper and 7906 were lower beaks, all comprising 53 different cephalopod species
belonging to 22 families. The overall distribution of LRL of the beaks revealed three
conspicuous peaks (2 to 3, 5 to 6 and 12 to 13 mm), and a forth minor one around 9-10 mm
(Figure 3.1).
Figure 3.1 - Lower Rostral Length (LRL) distribution of the squids found on the diet of Wandering
Albatross in South Georgia, Crozet and Kerguelen.
3.1.2 Stable isotopes
A total of 384 samples were collected from the 3 islands. The selected species for stable isotopes
analysis (both Histioteuthis miranda and Teuthowenia pellucida were not included as they
contributed poorly to the diets, whereas Haliphron atlanticus that had only 14 beaks entered the
sampled species due to its cosmopolitan distribution, and interest for future studies) were
responsible for a total of 94.1% of the beaks in Crozet (93.1% of the mass), 86.6% in Kerguelen
27
(71.9% in of the mass) and 94.9% in South Georgia (96.6% of the mass) (Table 3.10). The δN
values varied between 7.21‰ (Martialia hyadesi from Crozet) to 18.11‰ (Gonatus antarcticus
from South Georgia), and δ13C from -26.50‰ (Kondakovia longimana of South Georgia) to -
18.62‰ (Histioteuthis atlantica from Kerguelen). Squid with less than -19.5‰ feed along a
continuum of about 1 trophic level (4.77‰) from K. longimana (11.97±0.38‰ to 12.59±0.75‰)
to T. sp. B (Voss) (15.75±0.80‰ to 16.74±0.64‰). This continuum was preceded by a drop of
2.71‰ (almost 1 trophic level) to M. hyadesi (8.4±0.84‰ and 9.26±0.45‰). All this are
followed by a second feed continuum consisting of subtropical species that span less than 1
trophic level (1.93‰), beginning at H. atlantica small (15.07±0.97‰), and ending at C.
akimushkini (17±0.52‰).
3.2 South Georgia
3.2.1 Diet
A total of 1421 upper and 1329 lower beaks were found in the samples (n= 19) from South
Georgia. The distribution of LRL of the beaks is shown in Figure 3.2 and Table 3.1. Four peaks
were observed, namely:
i. 3 to 4 mm, due to the great amount of Histioteuthis eltaninae beaks;
ii. 5 to 6 mm, the largest peak, which was composed by Alluroteuthis antarcticus, G.
antarticus and H. atlantica;
iii. 9 to 10 mm, due to the presence of Taonius sp. B (Voss);
iv. 14 to 15 mm, due to the presence of K. longimana.
A total of 28 cephalopod species were identified, of which 3 were only found in this island. The
Shannon-Wienner value was H=0.998. The most numerous preys found were (by number) K.
longimana (24.2%), T. sp. B (Voss) (23.7%), H.eltaninae (10.6%), A. antarcticus (7.9%), G.
antarcticus (6.8%) and H.atlantica (5.7%) (Table 3.2). In terms of mass, K. longimana (75.5%)
and T. sp. B (Voss) (7.9%) were the most important (Table 3.2). The distribution of the mantle
length and weigth of each species is shown in Table 3.1 & Table 7.2 , in annex. Mantle length
ranged from 47.2 mm (in Histioteuthis macrohista) up to 706.8 mm (in Taningia danae), while
the weight values showed that the lightest prey came from from Brachioteuthis ?picta and
Batoteuthis skolops (7.8 g ) and the heaviest was again, T. danae (6471.2 g ).
28
Figure 3.2 – Lower Rostral Length (LRL) distribution of the squids found on the diet of Wandering Albatross
in South Georgia.
29
Table 3.1 - Lower Rostral Length (LRL), Mantle Length (ML) and Weight (W) of the main species found on
the diet of Wandering Albatrosses of South Georgia, Crozet islands and Kerguelen. (Continued next page)
South Georgia
LRL (mm)
ML (mm)
W (g)
mean ± sd
mean ± sd
mean ± sd
(Range)
(Range)
(Range)
Alloposidae Haliphron
atlanticus
12.51 ± 2.92
-
482.63 ± 165.14
7.90 - 18.60
-
243.95 - 844.36
Architeuthidae
Architeuthis
dux
-
-
-
Batoteuthidae Batoteuthis
skolops
4.17 ± 0.71
113.37 ± 17.36
39.59 ± 20.77
3.00 - 6.30
84.78 - 165.50
15.26 - 113.12
Cranchidae
Galiteuthis
glacialis
5.30 ± 0.48
450.60 ± 40.48
102.98 ± 20.45
4.00 - 6.40
341.82 - 542.90
54.89 - 154.38
Taonius
sp.(Clarke)
-
-
-
Taonius sp.B
(Voss)
9.24 ± 1.08
555.30 ± 66.31
290.90 ± 69.66
5.40 - 11.30
319.42 - 681.86
88.17 - 444.22
Cycloteuthidae
Cycloteuthis
akimushkini
-
-
-
Gonatidae Gonatus
antarcticus
6.05 ± 0.96
215.94 ± 41.25
228.12 ± 112.49
3.40 - 8.20
102.36 - 308.13
30.57 - 573.51
Histioteuthidae
Histioteuthis
atlantica
5.51 ± 0.55
130.95 ± 14.07
295.28 ± 70.41
4.30 - 6.70
99.92 - 161.50
158.16 - 468.79
Histioteuthis
eltaninae
3.46 ± 0.29
81.01 ± 7.06
67.44 ± 17.25
2.30 - 4.20
52.65 - 99.17
18.55 - 120.68
Histioteuthis
miranda
5.63 ± 0.63
134.13 ± 16.09
468.77 ± 157.70
4.70 - 6.50
110.18 - 156.37
261.02 - 699.44
Mastigoteuthidae
Mastigoteuthis
sp.A (Clarke)
6.93 ± 0.82
181.02 ± 20.16
151.27 ± 49.49
5.00 - 9.60
133.70 - 246.22
60.61 - 352.75
Neoteuthidae
Alluroteuthis
antarcticus
5.16 ± 0.48
176.10 ± 16.88
437.86 ± 120.04
3.40 - 6.70
114.67 - 230.13
125.44 - 924.09
Ommastrephidae
Martialia
hyadesi
4.40 ± 0.46
231.67 ± 13.50
219.93 ± 46.52
4.00 - 4.90
219.88 - 246.40
180.23 - 271.11
30
Onychoteuthidae
Kondakovia
longimana
13.45 ± 1.72
479.46 ± 64.04
2709.54 ± 978.52
5.30 - 17.50
175.44 - 630.72
136.78 - 5903.99
Moroteuthis
ingens 9.90 377.07 1729.76
Moroteuthis
knipovitchi
6.87 ± 0.96
322.81 ± 60.09
695.41 ± 424.50
5.40 - 9.40
231.09 - 480.56
250.62 - 2057.44
Moroteuthis
robsoni
7.87 ± 0.31
535.19 ± 46.14
1852.95 ± 595.67
7.60 - 8.20
494.92 - 585.54
1362.61 - 2515.84
Octopoteuthidae Taningia
danae
14.70 ± 3.21
548.83 ± 241.76
4609.20 ± 2693.68
11.00 - 16.80
270.52 - 706.80
1520.51 - 6471.19
Crozet
LRL (mm)
ML (mm)
W (g)
mean ± sd
mean ± sd
mean ± sd
(Range)
(Range)
(Range)
Alloposidae Haliphron
atlanticus
-
-
-
Architeuthidae
Architeuthis
dux 8.53 450.31
3050.94
Batoteuthidae Batoteuthis
skolops
4.02 ± 0.45
109.82 ± 11.02
34.66 ± 10.12
3.01 - 4.96
85.02 - 132.72
15.40 - 59.31
Cranchidae
Galiteuthis
glacialis
5.38 ± 0.35
457.83 ± 29.49
106.17 ± 14.93
4.01 - 6.26
342.65 - 531.17
55.20 - 147.05
Taonius
sp.(Clarke)
5.12 ± 0.29
302.21 ± 17.55
78.76 ± 9.56
4.52 - 5.69
265.36 - 337.24
59.72 - 98.87
Taonius sp.B
(Voss)
8.65 ± 1.20
518.86 ± 73.76
253.30 ± 77.59
5.74 - 11.60
340.31 - 700.29
100.78 - 470.46
Cycloteuthidae
Cycloteuthis
akimushkini
12.76 ± 2.55
395.42 ± 78.90
982.31 ± 350.48
6.39 - 17.56
198.09 - 544.36
246.34 - 1768.64
Gonatidae
Gonatus
antarcticus
6.05 ± 0.64
215.75 ± 27.40
217.17 ± 87.61
5.05 - 7.89
173.09 - 294.84
114.16 - 504.43
Histioteuthidae
Histioteuthis
atlantica
5.64 ± 0.84
134.36 ± 21.44
319.44 ± 107.39
3.20 - 7.20
71.69 - 174.33
76.69 - 559.20
Histioteuthis
eltaninae
3.46 ± 0.32
80.98 ± 7.90
67.73 ± 19.15
2.30 - 5.03
52.65 - 119.48
18.55 - 211.44
Histioteuthis
miranda
6.84 ± 0.40
207.56 ± 13.77
825.91 ± 146.34
5.91 - 7.71
175.67 - 237.25
523.74 - 1175.27
Mastigoteuthidae Mastigoteuthis 6.62 ± 0.62
194.26 ± 18.06
284.07 ± 72.31
31
sp.A (Clarke) 5.26 - 7.79
154.76 - 228.33
143.33 - 444.16
Neoteuthidae
Alluroteuthis
antarcticus
5.46 ± 0.38
186.70 ± 13.23
512.31 ± 100.55
4.22 - 6.23
143.36 - 213.69
236.96 - 745.97
Ommastrephidae
Martialia
hyadesi
6.81 ± 0.83
302.57 ± 23.31
532.83 ± 128.64
5.17 - 9.00
254.36 - 367.23
302.01 - 921.33
Onychoteuthidae
Kondakovia
longimana
12.58 ± 1.37
447.30 ± 51.13
2174.27 ± 796.43
6.20 - 18.66
209.02 - 674.01
224.24 - 7227.75
Moroteuthis
ingens
8.70 ± 1.04
343.04 ± 47.65
1397.23 ± 683.18
5.82 - 11.67
236.25 - 492.99
413.88 - 4149.35
Moroteuthis
knipovitchi
7.30 ± 0.84
349.35 ± 52.26
840.84 ± 354.75
5.75 - 9.07
252.91 - 459.98
318.13 - 1796.30
Moroteuthis
robsoni
8.86 ± 0.39
685.22 ± 59.50
4883.08 ± 1823.92
8.54 - 9.30
636.89 - 751.67
3491.97 - 6948.05
Octopoteuthidae Taningia
danae
15.07 ± 1.72
576.67 ± 129.49
4659.38 ± 1699.85
12.21 - 17.41
361.54 - 752.68
2172.67 - 7310.69
Kerguelen
LRL (mm)
ML (mm)
W (g)
mean ± sd
mean ± sd
mean ± sd
(Range)
(Range)
(Range)
Alloposidae Haliphron
atlanticus
-
-
-
Architeuthidae Architeuthis
dux
11.16 ± 2.85
606.10 ± 168.75
15815.86 ± 16350.63
7.67 - 15.41
399.31 - 858.37
1877.20 - 45525.42
Batoteuthidae
Batoteuthis
skolops
4.71 ± 0.57
126.62 ± 13.82
53.24 ± 16.51
3.67 - 5.57
101.17 - 147.64
26.30 - 81.12
Cranchidae
Galiteuthis
glacialis
5.45 ± 0.33
463.27 ± 27.39
108.90 ± 13.91
3.84 - 6.29
328.41 - 533.68
50.18 - 148.60
Taonius
sp.(Clarke)
4.98 ± 0.22
293.70 ± 13.59
74.07 ± 7.17
4.56 - 5.40
267.82 - 319.42
60.88 - 88.17
Taonius sp.B
(Voss)
9.62 ± 1.09
578.55 ± 66.83
317.28 ± 74.70
6.64 - 11.73
395.60 - 708.27
138.64 - 482.08
Cycloteuthidae
Cycloteuthis
akimushkini
12.78 ± 2.31
396.29 ± 71.57
980.75 ± 322.37
6.90 - 17.98
213.90 - 557.38
286.14 - 1852.07
Gonatidae
Gonatus
antarcticus
6.37 ± 0.73
229.64 ± 31.28
259.97 ± 105.19
5.37 - 7.98
186.81 - 298.70
140.07 - 523.85
Histioteuthidae
Histioteuthis
atlantica
6.05 ± 0.75
144.71 ± 19.10
374.03 ± 101.80
2.54 - 7.79
54.76 - 189.47
43.55 - 678.21
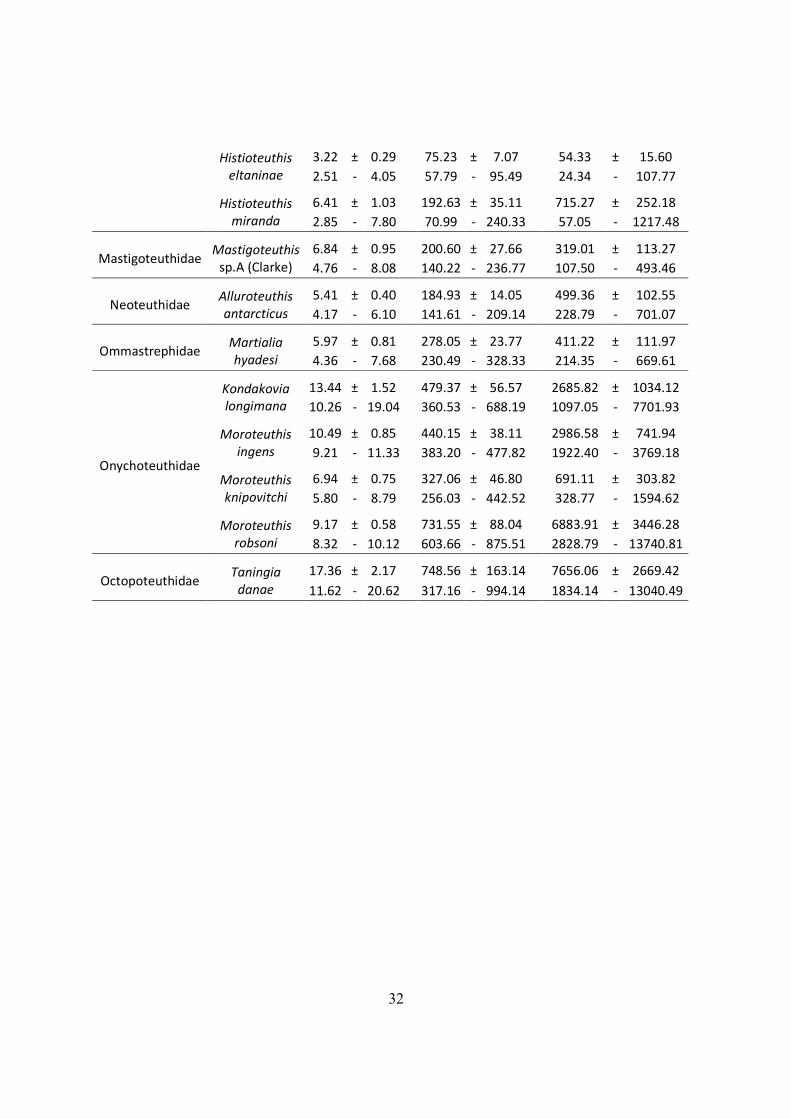
32
Histioteuthis
eltaninae
3.22 ± 0.29
75.23 ± 7.07
54.33 ± 15.60
2.51 - 4.05
57.79 - 95.49
24.34 - 107.77
Histioteuthis
miranda
6.41 ± 1.03
192.63 ± 35.11
715.27 ± 252.18
2.85 - 7.80
70.99 - 240.33
57.05 - 1217.48
Mastigoteuthidae
Mastigoteuthis
sp.A (Clarke)
6.84 ± 0.95
200.60 ± 27.66
319.01 ± 113.27
4.76 - 8.08
140.22 - 236.77
107.50 - 493.46
Neoteuthidae
Alluroteuthis
antarcticus
5.41 ± 0.40
184.93 ± 14.05
499.36 ± 102.55
4.17 - 6.10
141.61 - 209.14
228.79 - 701.07
Ommastrephidae
Martialia
hyadesi
5.97 ± 0.81
278.05 ± 23.77
411.22 ± 111.97
4.36 - 7.68
230.49 - 328.33
214.35 - 669.61
Onychoteuthidae
Kondakovia
longimana
13.44 ± 1.52
479.37 ± 56.57
2685.82 ± 1034.12
10.26 - 19.04
360.53 - 688.19
1097.05 - 7701.93
Moroteuthis
ingens
10.49 ± 0.85
440.15 ± 38.11
2986.58 ± 741.94
9.21 - 11.33
383.20 - 477.82
1922.40 - 3769.18
Moroteuthis
knipovitchi
6.94 ± 0.75
327.06 ± 46.80
691.11 ± 303.82
5.80 - 8.79
256.03 - 442.52
328.77 - 1594.62
Moroteuthis
robsoni
9.17 ± 0.58
731.55 ± 88.04
6883.91 ± 3446.28
8.32 - 10.12
603.66 - 875.51
2828.79 - 13740.81
Octopoteuthidae
Taningia
danae
17.36 ± 2.17
748.56 ± 163.14
7656.06 ± 2669.42
11.62 - 20.62
317.16 - 994.14
1834.14 - 13040.49
33
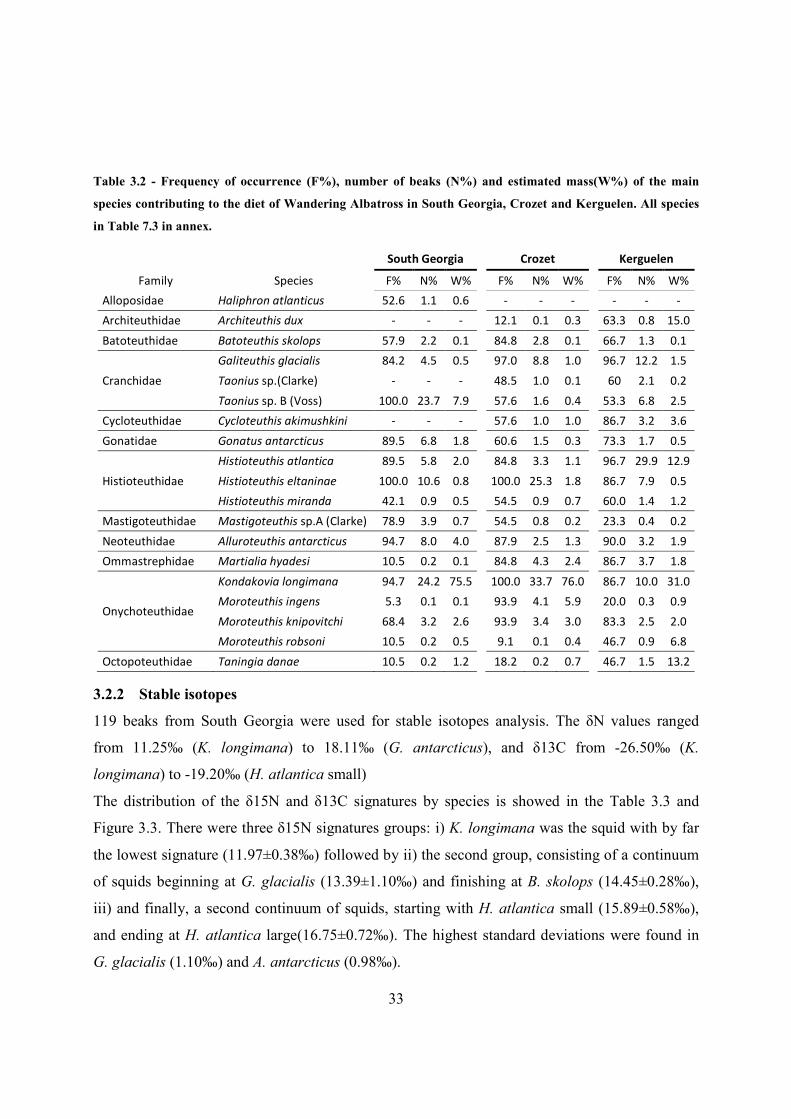
Table 3.2 - Frequency of occurrence (F%), number of beaks (N%) and estimated mass(W%) of the main
species contributing to the diet of Wandering Albatross in South Georgia, Crozet and Kerguelen. All species
in Table 7.3 in annex.
South Georgia
Crozet
Kerguelen
Family Species F% N% W%
F% N% W%
F% N% W%
Alloposidae Haliphron atlanticus 52.6 1.1 0.6
- - -
- - -
Architeuthidae Architeuthis dux - - -
12.1 0.1 0.3
63.3 0.8 15.0
Batoteuthidae Batoteuthis skolops 57.9 2.2 0.1
84.8 2.8 0.1
66.7 1.3 0.1
Cranchidae
Galiteuthis glacialis 84.2 4.5 0.5
97.0 8.8 1.0
96.7 12.2 1.5
Taonius sp.(Clarke) - - -
48.5 1.0 0.1
60 2.1 0.2
Taonius sp. B (Voss) 100.0 23.7 7.9
57.6 1.6 0.4
53.3 6.8 2.5
Cycloteuthidae Cycloteuthis akimushkini - - -
57.6 1.0 1.0
86.7 3.2 3.6
Gonatidae Gonatus antarcticus 89.5 6.8 1.8
60.6 1.5 0.3
73.3 1.7 0.5
Histioteuthidae
Histioteuthis atlantica 89.5 5.8 2.0
84.8 3.3 1.1
96.7 29.9 12.9
Histioteuthis eltaninae 100.0 10.6 0.8
100.0 25.3 1.8
86.7 7.9 0.5
Histioteuthis miranda 42.1 0.9 0.5
54.5 0.9 0.7
60.0 1.4 1.2
Mastigoteuthidae Mastigoteuthis sp.A (Clarke) 78.9 3.9 0.7
54.5 0.8 0.2
23.3 0.4 0.2
Neoteuthidae Alluroteuthis antarcticus 94.7 8.0 4.0
87.9 2.5 1.3
90.0 3.2 1.9
Ommastrephidae Martialia hyadesi 10.5 0.2 0.1
84.8 4.3 2.4
86.7 3.7 1.8
Onychoteuthidae
Kondakovia longimana 94.7 24.2 75.5
100.0 33.7 76.0
86.7 10.0 31.0
Moroteuthis ingens 5.3 0.1 0.1
93.9 4.1 5.9
20.0 0.3 0.9
Moroteuthis knipovitchi 68.4 3.2 2.6
93.9 3.4 3.0
83.3 2.5 2.0
Moroteuthis robsoni 10.5 0.2 0.5
9.1 0.1 0.4
46.7 0.9 6.8
Octopoteuthidae Taningia danae 10.5 0.2 1.2
18.2 0.2 0.7
46.7 1.5 13.2
3.2.2 Stable isotopes
119 beaks from South Georgia were used for stable isotopes analysis. The δN values ranged
from 11.25‰ (K. longimana) to 18.11‰ (G. antarcticus), and δ13C from -26.50‰ (K.
longimana) to -19.20‰ (H. atlantica small)
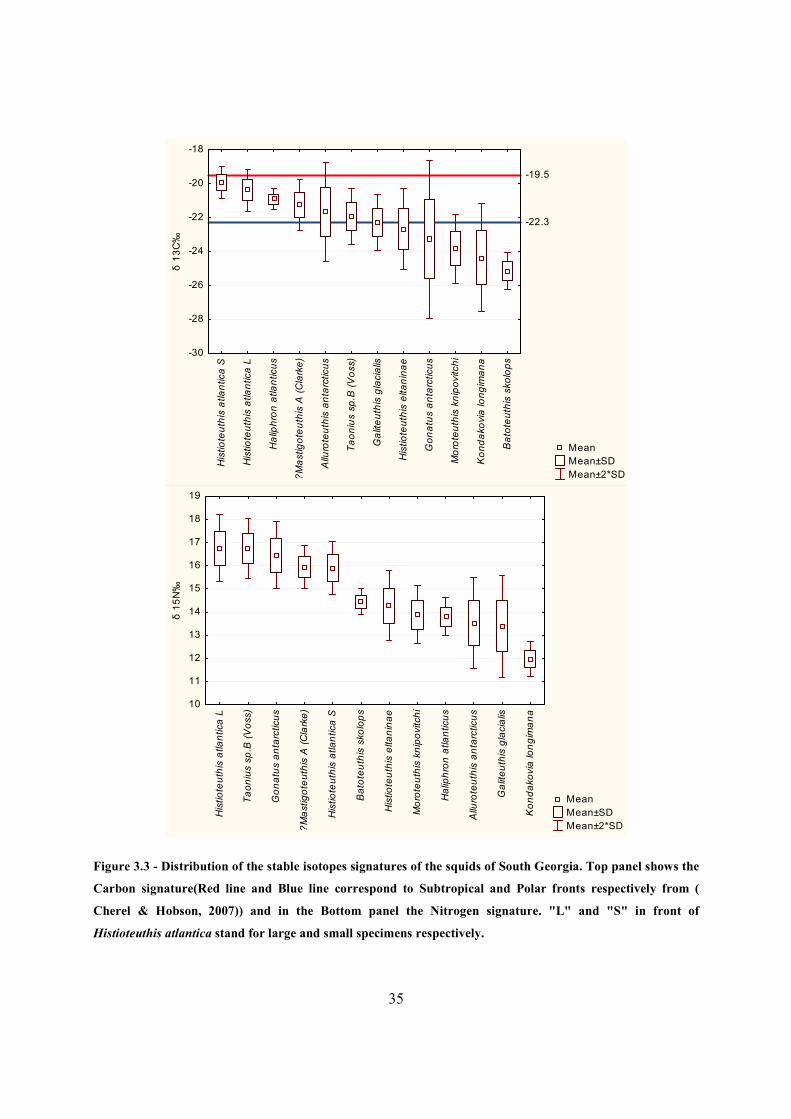
The distribution of the δ15N and δ13C signatures by species is showed in the Table 3.3 and
Figure 3.3. There were three δ15N signatures groups: i) K. longimana was the squid with by far
the lowest signature (11.97±0.38‰) followed by ii) the second group, consisting of a continuum
of squids beginning at G. glacialis (13.39±1.10‰) and finishing at B. skolops (14.45±0.28‰),
iii) and finally, a second continuum of squids, starting with H. atlantica small (15.89±0.58‰),
and ending at H. atlantica large(16.75±0.72‰). The highest standard deviations were found in
G. glacialis (1.10‰) and A. antarcticus (0.98‰).
34
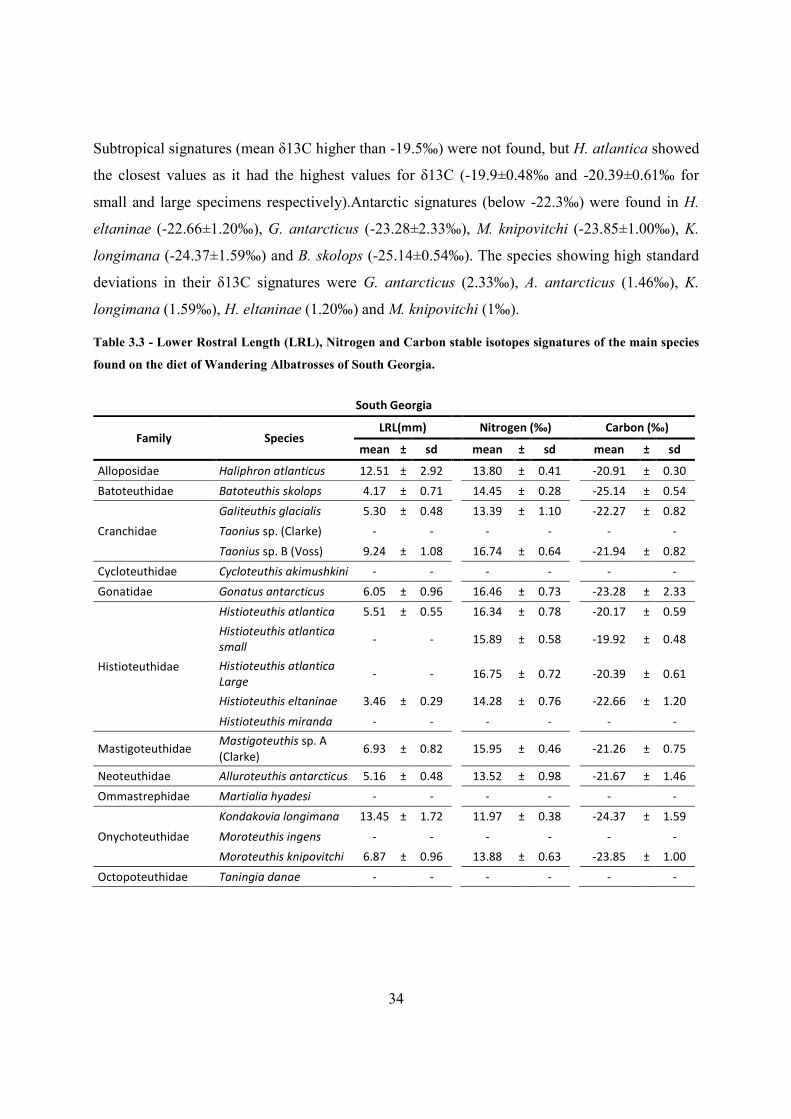
Subtropical signatures (mean δ13C higher than -19.5‰) were not found, but H. atlantica showed
the closest values as it had the highest values for δ13C (-19.9±0.48‰ and -20.39±0.61‰ for
small and large specimens respectively).Antarctic signatures (below -22.3‰) were found in H.
eltaninae (-22.66±1.20‰), G. antarcticus (-23.28±2.33‰), M. knipovitchi (-23.85±1.00‰), K.
longimana (-24.37±1.59‰) and B. skolops (-25.14±0.54‰). The species showing high standard
deviations in their δ13C signatures were G. antarcticus (2.33‰), A. antarcticus (1.46‰), K.
longimana (1.59‰), H. eltaninae (1.20‰) and M. knipovitchi (1‰).
Table 3.3 - Lower Rostral Length (LRL), Nitrogen and Carbon stable isotopes signatures of the main species
found on the diet of Wandering Albatrosses of South Georgia.
South Georgia
Family Species LRL(mm)
Nitrogen (‰)
Carbon (‰)
mean ± sd
mean ± sd
mean ± sd
Alloposidae Haliphron atlanticus 12.51 ± 2.92
13.80 ± 0.41
-20.91 ± 0.30
Batoteuthidae Batoteuthis skolops 4.17 ± 0.71
14.45 ± 0.28
-25.14 ± 0.54
Cranchidae
Galiteuthis glacialis 5.30 ± 0.48
13.39 ± 1.10
-22.27 ± 0.82
Taonius sp. (Clarke) -
-
-
-
-
-
Taonius sp. B (Voss) 9.24 ± 1.08
16.74 ± 0.64
-21.94 ± 0.82
Cycloteuthidae Cycloteuthis akimushkini -
-
-
-
-
-
Gonatidae Gonatus antarcticus 6.05 ± 0.96
16.46 ± 0.73
-23.28 ± 2.33
Histioteuthidae
Histioteuthis atlantica 5.51 ± 0.55
16.34 ± 0.78
-20.17 ± 0.59
Histioteuthis atlantica
small -
-
15.89 ± 0.58
-19.92 ± 0.48
Histioteuthis atlantica
Large -
-
16.75 ± 0.72
-20.39 ± 0.61
Histioteuthis eltaninae 3.46 ± 0.29
14.28 ± 0.76
-22.66 ± 1.20
Histioteuthis miranda -
-
-
-
-
-
Mastigoteuthidae Mastigoteuthis sp. A
(Clarke) 6.93 ± 0.82
15.95 ± 0.46
-21.26 ± 0.75
Neoteuthidae Alluroteuthis antarcticus 5.16 ± 0.48
13.52 ± 0.98
-21.67 ± 1.46
Ommastrephidae Martialia hyadesi -
-
-
-
-
-
Onychoteuthidae
Kondakovia longimana 13.45 ± 1.72
11.97 ± 0.38
-24.37 ± 1.59
Moroteuthis ingens -
-
-
-
-
-
Moroteuthis knipovitchi 6.87 ± 0.96
13.88 ± 0.63
-23.85 ± 1.00
Octopoteuthidae Taningia danae -
-
-
-
-
-
35
Mean
Mean±SD
Mean±2*SD
Histioteuthis atlantica S
Histioteuthis atlantica L
Haliphron atlanticus
?Mastigoteuthis A (Clarke)
Alluroteuthis antarcticus
Taonius sp.B (Voss)
Galiteuthis glacialis
Histioteuthis eltaninae
Gonatus antarcticus
Moroteuthis knipovitchi
Kondakovia longimana
Batoteuthis skolops
-30
-28
-26
-24
-22
-20
-18
δ 1
3C
‰
-22.3
-19.5
Mean
Mean±SD
Mean±2*SD
Histioteuthis atlantica L
Taonius sp.B (Voss)
Gonatus antarcticus
?Mastigoteuthis A (Clarke)
Histioteuthis atlantica S
Batoteuthis skolops
Histioteuthis eltaninae
Moroteuthis knipovitchi
Haliphron atlanticus
Alluroteuthis antarcticus
Galiteuthis glacialis
Kondakovia longimana
10
11
12
13
14
15
16
17
18
19
δ 1
5N
‰
Figure 3.3 - Distribution of the stable isotopes signatures of the squids of South Georgia. Top panel shows the
Carbon signature(Red line and Blue line correspond to Subtropical and Polar fronts respectively from (
Cherel & Hobson, 2007)) and in the Bottom panel the Nitrogen signature. "L" and "S" in front of
Histioteuthis atlantica stand for large and small specimens respectively.
36
3.3 Crozet
3.3.1 Diet
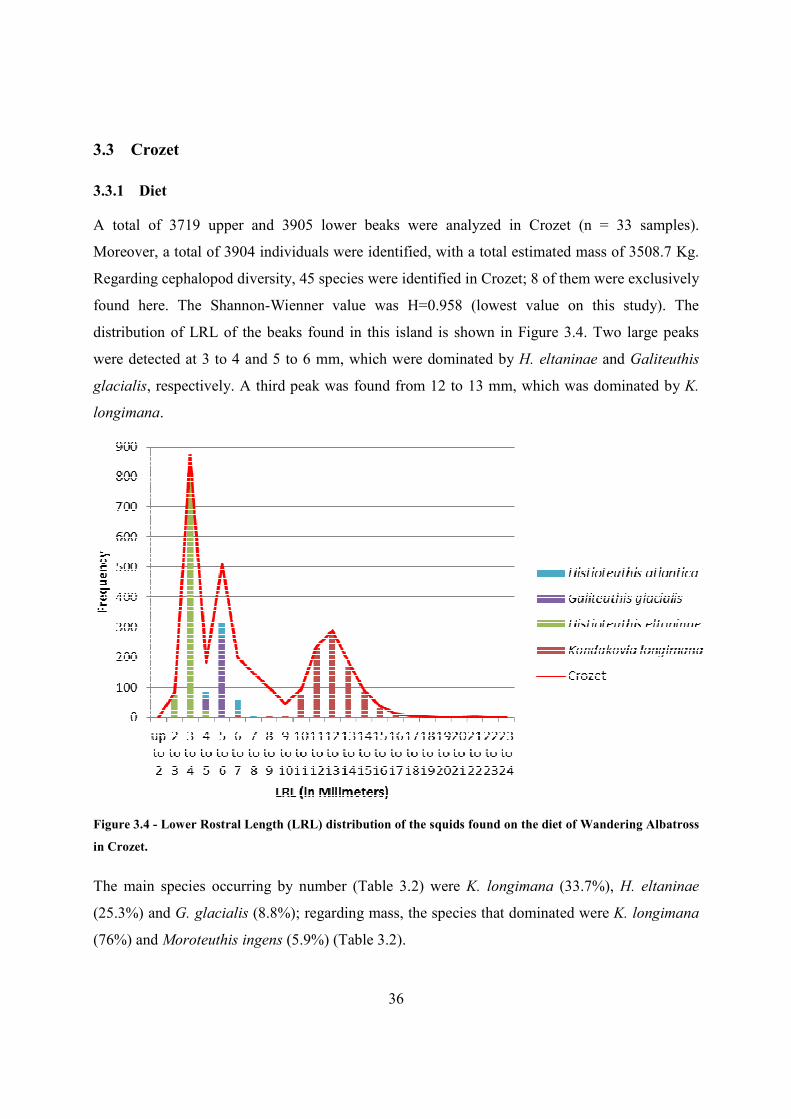
A total of 3719 upper and 3905 lower beaks were analyzed in Crozet (n = 33 samples).
Moreover, a total of 3904 individuals were identified, with a total estimated mass of 3508.7 Kg.
Regarding cephalopod diversity, 45 species were identified in Crozet; 8 of them were exclusively
found here. The Shannon-Wienner value was H=0.958 (lowest value on this study). The
distribution of LRL of the beaks found in this island is shown in Figure 3.4. Two large peaks
were detected at 3 to 4 and 5 to 6 mm, which were dominated by H. eltaninae and Galiteuthis
glacialis, respectively. A third peak was found from 12 to 13 mm, which was dominated by K.
longimana.
Figure 3.4 - Lower Rostral Length (LRL) distribution of the squids found on the diet of Wandering Albatross
in Crozet.
The main species occurring by number (Table 3.2) were K. longimana (33.7%), H. eltaninae
(25.3%) and G. glacialis (8.8%); regarding mass, the species that dominated were K. longimana
(76%) and Moroteuthis ingens (5.9%) (Table 3.2).
37
Distribution of the mantle length and weight by species found in the diet of the samples of this
study is showed in the Table 3.1 & Table 7.2,in annex. Mantle length ranged from 5.4 mm
(Notonikya africanae) to the colossal squid (Mesonychoteuthis hamiltoni) with 927.6 mm..
Lightest prey was a 5.5 g Slosarczykovia circumantarctica, and heaviest was a 9205.7 g
Lepidoteuthis grimaldii.
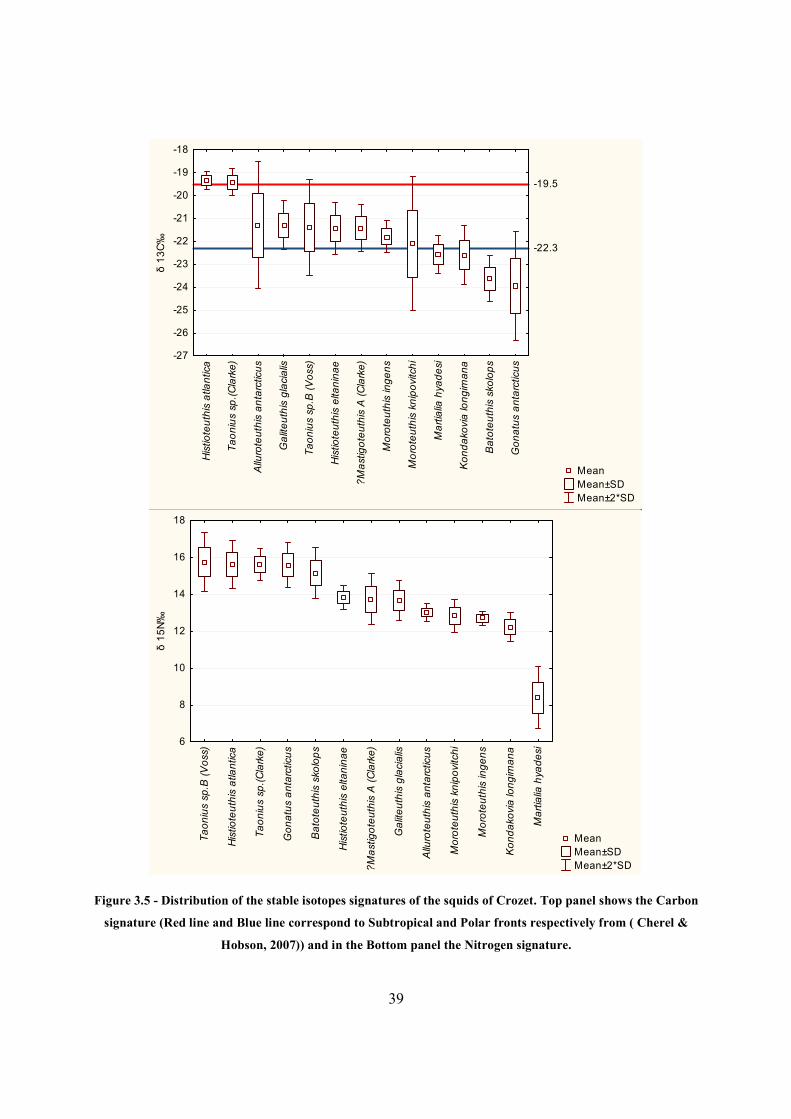
3.3.2 Stable Isotopes
130 beaks from Crozet were used for stable isotopes analysis. The δ15N values ranged from
7.21‰ (M .hyadesi) to 17.31‰ (T. sp. B (Voss)), and δ13C from -25.07‰ (Moroteuthis.
knipovitchi) to -19.04‰ (H. atlantica).
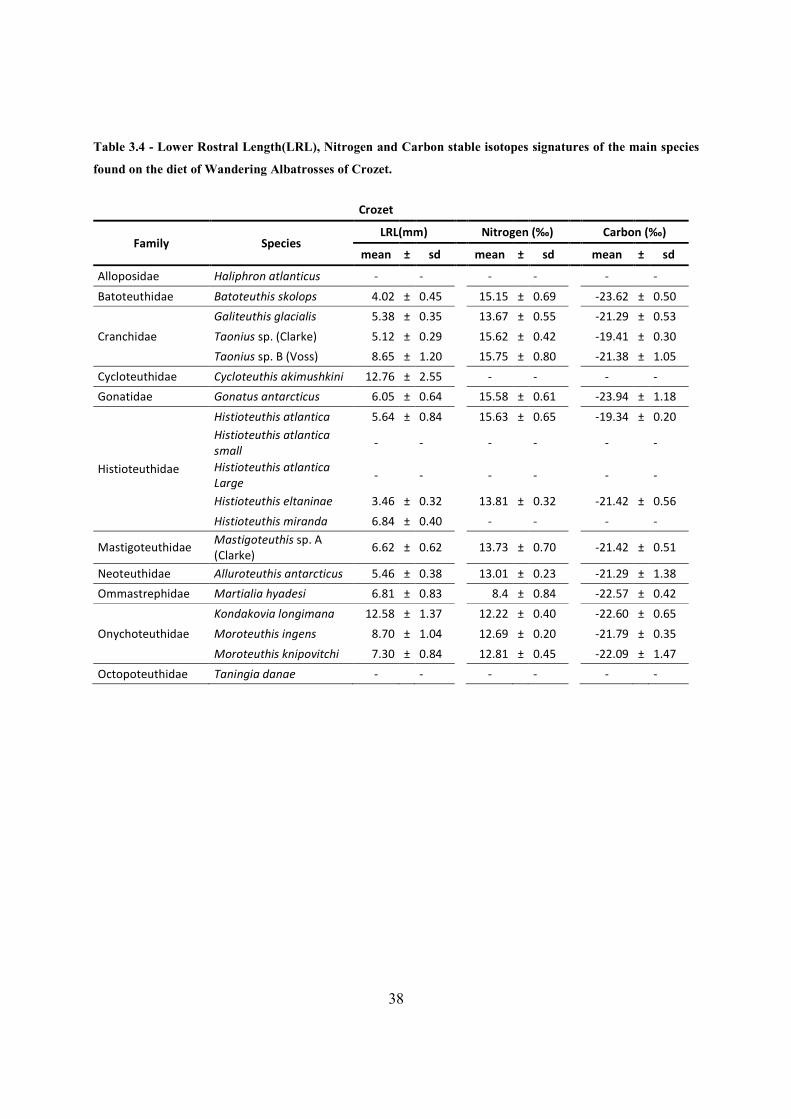
The distribution of the δ15N and δ13C signatures by species is showed in the Table 3.4 and
Figure 3.5. Again, three δ15N signatures groups were found: i) M. hyadesi stands out with the
lowest signature (8.40±0.84‰), followed by ii) the second group, consisting of a continuum of
squids beginning at K. longimana (12.22±0.40‰) and finishing at H. eltaninae (13.81±0.32‰),
iii) and finally, a second continuum of squids, starting with B. skolops (15.15±0.69‰), and
ending at T. sp. B (Voss) (15.75±0.80‰). Highest standard deviations were found in
M.hyadesi(0.84‰) and T. sp. B (Voss) (0.80‰).
Subtropical δ13C signatures were found in H. atlantica (-19.34±0.20‰) and T. sp. (Clarke) (-
19.41±0.30)‰ (Both this species presented some of the highest δ15N in the sample); Antarctic
signatures were found in M. hyadesi (-22.57±0.42‰), K. longimana (-22.60±0.65‰), B. skolops
(-23.62±0.50‰) and G. antarcticus (-23.94±1.18‰). The species showing higher standard
deviations in their δ13C signatures were M. knipovitchi (1.47‰), A. antarcticus (1.38‰), G.
antarcticus (1.18‰) and T. sp. B (Voss) (1.05‰).
38
Table 3.4 - Lower Rostral Length(LRL), Nitrogen and Carbon stable isotopes signatures of the main species
found on the diet of Wandering Albatrosses of Crozet.
Crozet
Family Species LRL(mm)
Nitrogen (‰)
Carbon (‰)
mean ± sd
mean ± sd
mean ± sd
Alloposidae Haliphron atlanticus - -
- -
- -
Batoteuthidae Batoteuthis skolops 4.02 ± 0.45
15.15 ± 0.69
-23.62 ± 0.50
Cranchidae
Galiteuthis glacialis 5.38 ± 0.35
13.67 ± 0.55
-21.29 ± 0.53
Taonius sp. (Clarke) 5.12 ± 0.29
15.62 ± 0.42
-19.41 ± 0.30
Taonius sp. B (Voss) 8.65 ± 1.20
15.75 ± 0.80
-21.38 ± 1.05
Cycloteuthidae Cycloteuthis akimushkini 12.76 ± 2.55
- -
- -
Gonatidae Gonatus antarcticus 6.05 ± 0.64
15.58 ± 0.61
-23.94 ± 1.18
Histioteuthidae
Histioteuthis atlantica 5.64 ± 0.84 15.63 ± 0.65 -19.34 ± 0.20
Histioteuthis atlantica
small -
-
-
-
-
-
Histioteuthis atlantica
Large -
-
-
-
-
-
Histioteuthis eltaninae 3.46 ± 0.32
13.81 ± 0.32
-21.42 ± 0.56
Histioteuthis miranda 6.84 ± 0.40
- -
- -
Mastigoteuthidae Mastigoteuthis sp. A
(Clarke) 6.62 ± 0.62
13.73 ± 0.70
-21.42 ± 0.51
Neoteuthidae Alluroteuthis antarcticus 5.46 ± 0.38
13.01 ± 0.23
-21.29 ± 1.38
Ommastrephidae Martialia hyadesi 6.81 ± 0.83
8.4 ± 0.84
-22.57 ± 0.42
Onychoteuthidae
Kondakovia longimana 12.58 ± 1.37
12.22 ± 0.40
-22.60 ± 0.65
Moroteuthis ingens 8.70 ± 1.04
12.69 ± 0.20
-21.79 ± 0.35
Moroteuthis knipovitchi 7.30 ± 0.84
12.81 ± 0.45
-22.09 ± 1.47
Octopoteuthidae Taningia danae - -
- -
- -
39
Mean
Mean±SD
Mean±2*SD
Histioteuthis atlantica
Taonius sp.(Clarke)
Alluroteuthis antarcticus
Galiteuthis glacialis
Taonius sp.B (Voss)
Histioteuthis eltaninae
?Mastigoteuthis A (Clarke)
Moroteuthis ingens
Moroteuthis knipovitchi
Martialia hyadesi
Kondakovia longimana
Batoteuthis skolops
Gonatus antarcticus
-27
-26
-25
-24
-23
-22
-21
-20
-19
-18δ
13
C‰
-22.3
-19.5
Mean
Mean±SD
Mean±2*SD
Taonius sp.B (Voss)
Histioteuthis atlantica
Taonius sp.(Clarke)
Gonatus antarcticus
Batoteuthis skolops
Histioteuthis eltaninae
?Mastigoteuthis A (Clarke)
Galiteuthis glacialis
Alluroteuthis antarcticus
Moroteuthis knipovitchi
Moroteuthis ingens
Kondakovia longimana
Martialia hyadesi6
8
10
12
14
16
18
δ 1
5N
‰
Figure 3.5 - Distribution of the stable isotopes signatures of the squids of Crozet. Top panel shows the Carbon
signature (Red line and Blue line correspond to Subtropical and Polar fronts respectively from ( Cherel &
Hobson, 2007)) and in the Bottom panel the Nitrogen signature.
40
3.4 Kerguelen
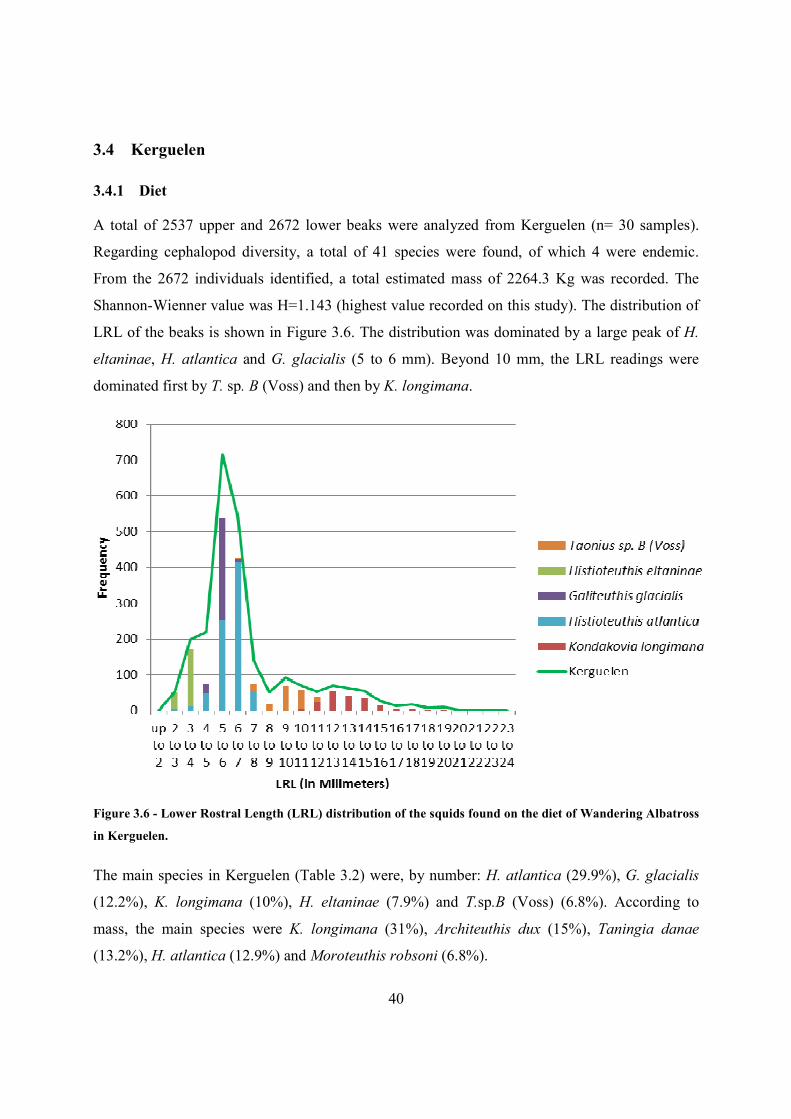
3.4.1 Diet
A total of 2537 upper and 2672 lower beaks were analyzed from Kerguelen (n= 30 samples).
Regarding cephalopod diversity, a total of 41 species were found, of which 4 were endemic.
From the 2672 individuals identified, a total estimated mass of 2264.3 Kg was recorded. The
Shannon-Wienner value was H=1.143 (highest value recorded on this study). The distribution of
LRL of the beaks is shown in Figure 3.6. The distribution was dominated by a large peak of H.
eltaninae, H. atlantica and G. glacialis (5 to 6 mm). Beyond 10 mm, the LRL readings were
dominated first by T. sp. B (Voss) and then by K. longimana.
Figure 3.6 - Lower Rostral Length (LRL) distribution of the squids found on the diet of Wandering Albatross
in Kerguelen.
The main species in Kerguelen (Table 3.2) were, by number: H. atlantica (29.9%), G. glacialis
(12.2%), K. longimana (10%), H. eltaninae (7.9%) and T.sp.B (Voss) (6.8%). According to
mass, the main species were K. longimana (31%), Architeuthis dux (15%), Taningia danae
(13.2%), H. atlantica (12.9%) and Moroteuthis robsoni (6.8%).
41
The distribution of the mantle length and weight is shown in the Table 3.1 and Table 7.2,in
annex. H. atlantica was the smallest prey found (minimum 54.76 mm). On the other hand, the
largest prey was T. danae (maximum 994.14 mm). The lightest species was H. eltaninae
(minimum 24.34 g) while the heaviest was the giant squid A. dux (maximum 45525.42 g). It is
worth noting that T. danae and Moroteuthis robsoni presented some of the heaviest individuals,
over 13 Kg (13040.49 g and 13740.81 g respectively).
3.4.2 Stable Isotopes
135 beaks from Kerguelen were used for stable isotopes analysis. The δ15N values ranged from
8.40‰ (M. hyadesi) to 17.7‰ (H. atlantica large), and δ 13C from -25.46‰ (K. longimana) to -
18.63‰ (H. atlantica small).
Distribution of the δ15N and δ13C signatures by species is shown in the Table 3.5 and Figure
3.7.
In here, there were four δ15N signatures groups found: i) M. hyadesi stands out with the lowest
signature (9.26±0.45‰), followed by ii) the second group, consisting of a continuum of squids
beginning at K. longimana (12.59±0.75‰) and finishing at H. eltaninae (13.51±0.47‰), iii) a
second continuum of squids, starting with G. antarcticus (15.04±0.51‰), and ending at B.
skolops (15.10±0.41‰) and finally iv) the highest continuum, with H. atlantica large
(16.42±0.69‰) to C. akimushkini (17.00±0.52‰). Highest standard deviations were found in H.
atlantica small (0.97‰) and K. longimana (0.75‰).
Subtropical δ13C signatures were found in T. sp. (Clarke) (-19.28±0.22‰), C. akimushkini (-
19.32±0.32‰) and H. atlantica (-19.36±0.40‰ and 19.46±0.66‰ for small and large
respectively); Antarctic signatures were found in B. skolops (-23.69±0.73‰) and M. knipovitchi
(-23.71±0.95‰). Species showing high standard deviations in their δ13C signatures were K.
longimana (1.84‰), G. antarcticus (1.80‰), H. eltaninae (1.11‰), T. danae (1.04‰) and M.
knipovitchi (0.95‰).
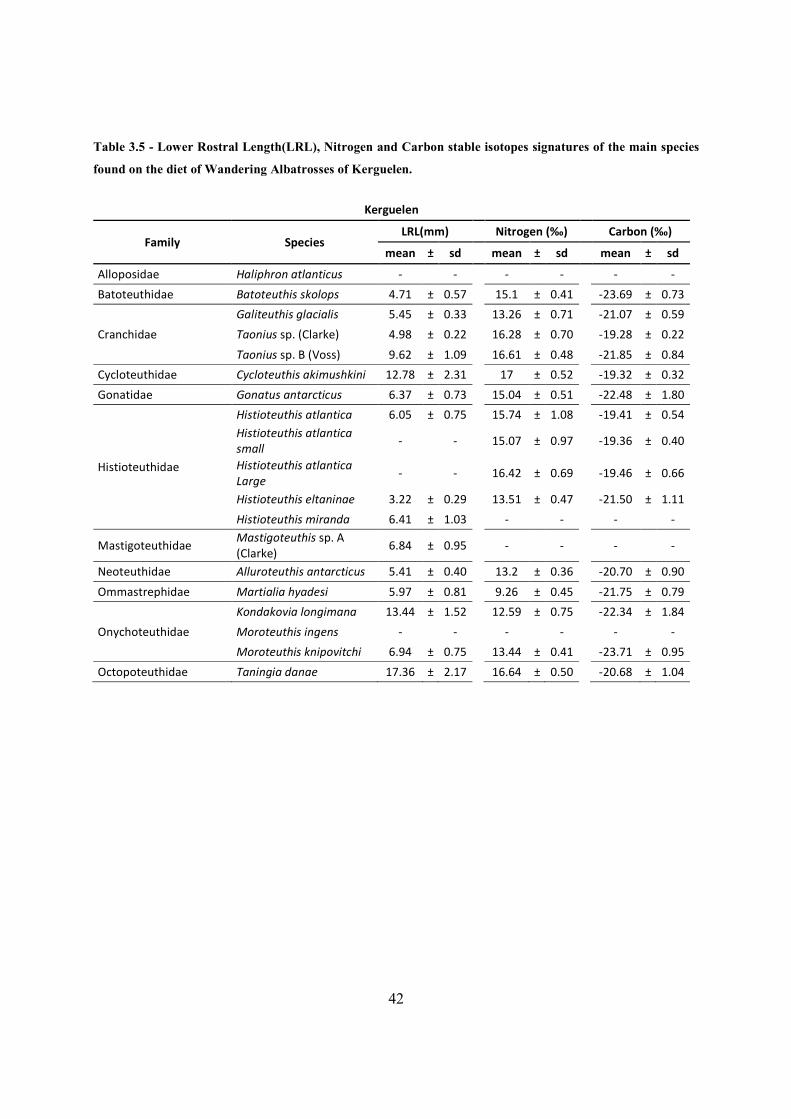
42
Table 3.5 - Lower Rostral Length(LRL), Nitrogen and Carbon stable isotopes signatures of the main species
found on the diet of Wandering Albatrosses of Kerguelen.
Kerguelen
Family Species LRL(mm)
Nitrogen (‰)
Carbon (‰)
mean ± sd
mean ± sd
mean ± sd
Alloposidae Haliphron atlanticus -
-
-
-
-
-
Batoteuthidae Batoteuthis skolops 4.71 ± 0.57
15.1 ± 0.41
-23.69 ± 0.73
Cranchidae
Galiteuthis glacialis 5.45 ± 0.33
13.26 ± 0.71
-21.07 ± 0.59
Taonius sp. (Clarke) 4.98 ± 0.22
16.28 ± 0.70
-19.28 ± 0.22
Taonius sp. B (Voss) 9.62 ± 1.09
16.61 ± 0.48
-21.85 ± 0.84
Cycloteuthidae Cycloteuthis akimushkini 12.78 ± 2.31
17 ± 0.52
-19.32 ± 0.32
Gonatidae Gonatus antarcticus 6.37 ± 0.73
15.04 ± 0.51
-22.48 ± 1.80
Histioteuthidae
Histioteuthis atlantica 6.05 ± 0.75
15.74 ± 1.08
-19.41 ± 0.54
Histioteuthis atlantica
small -
-
15.07 ± 0.97
-19.36 ± 0.40
Histioteuthis atlantica
Large -
-
16.42 ± 0.69
-19.46 ± 0.66
Histioteuthis eltaninae 3.22 ± 0.29
13.51 ± 0.47
-21.50 ± 1.11
Histioteuthis miranda 6.41 ± 1.03
-
-
-
-
Mastigoteuthidae Mastigoteuthis sp. A
(Clarke) 6.84 ± 0.95
-
-
-
-
Neoteuthidae Alluroteuthis antarcticus 5.41 ± 0.40
13.2 ± 0.36
-20.70 ± 0.90
Ommastrephidae Martialia hyadesi 5.97 ± 0.81
9.26 ± 0.45
-21.75 ± 0.79
Onychoteuthidae
Kondakovia longimana 13.44 ± 1.52
12.59 ± 0.75
-22.34 ± 1.84
Moroteuthis ingens -
-
-
-
-
-
Moroteuthis knipovitchi 6.94 ± 0.75
13.44 ± 0.41
-23.71 ± 0.95
Octopoteuthidae Taningia danae 17.36 ± 2.17
16.64 ± 0.50
-20.68 ± 1.04
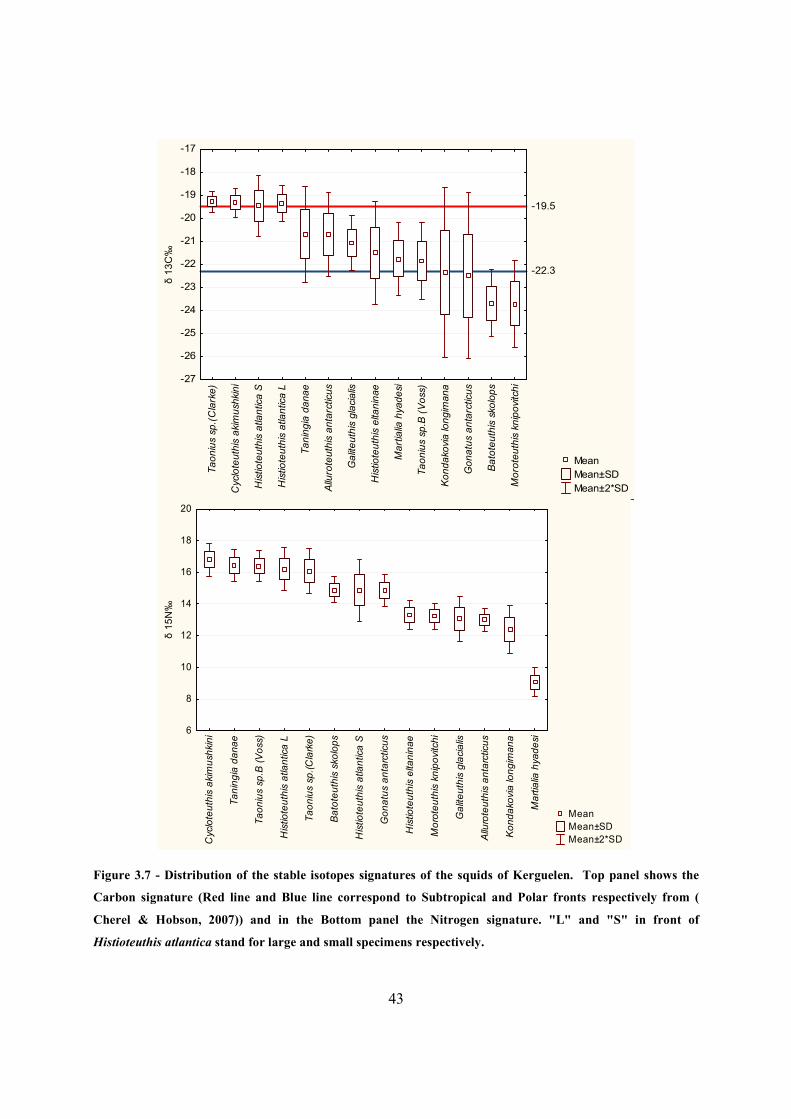
43
Figure 8. Distribution of the stable isotopes signatures of the squids of Kerguelen. Top panel
shows the Carbon signature(Red line and Blue line correspond to Subtropical and Polar fronts
Mean
Mean±SD
Mean±2*SD
Taonius sp.(Clarke)
Cycloteuthis akimushkini
Histioteuthis atlantica S
Histioteuthis atlantica L
Taningia danae
Alluroteuthis antarcticus
Galiteuthis glacialis
Histioteuthis eltaninae
Martialia hyadesi
Taonius sp.B (Voss)
Kondakovia longimana
Gonatus antarcticus
Batoteuthis skolops
Moroteuthis knipovitchi-27
-26
-25
-24
-23
-22
-21
-20
-19
-18
-17
δ 1
3C
‰
-22.3
-19.5
Mean
Mean±SD
Mean±2*SD Cycloteuthis akimushkini
Taningia danae
Taonius sp.B (Voss)
Histioteuthis atlantica L
Taonius sp.(Clarke)
Batoteuthis skolops
Histioteuthis atlantica S
Gonatus antarcticus
Histioteuthis eltaninae
Moroteuthis knipovitchi
Galiteuthis glacialis
Alluroteuthis antarcticus
Kondakovia longimana
Martialia hyadesi6
8
10
12
14
16
18
20
δ 1
5N
‰
Figure 3.7 - Distribution of the stable isotopes signatures of the squids of Kerguelen. Top panel shows the
Carbon signature (Red line and Blue line correspond to Subtropical and Polar fronts respectively from (
Cherel & Hobson, 2007)) and in the Bottom panel the Nitrogen signature. "L" and "S" in front of
Histioteuthis atlantica stand for large and small specimens respectively.
44
3.5 Comparison between islands
3.5.1 Diet indexes
There were no significant spatial differences between the frequency of occurrence of cephalopod
species in the diet of wandering albatrosses from South Georgia, Crozet and Kerguelen islands
(χ2=13.261; p = 0.99). Similar findings were observed for the numeric and weight index values
(χ2=39.68; p =0.66 and χ2=57.57; p =0.055, respectively). Yet, it is worth noting that there were
great deviations from the predicted values, namely in the numeric index for South Georgia, and
also in the weight index for South Georgia and Kerguelen (Table 7.4,in annex). The species that
differed the most by number of individuals were the T. sp. B (Voss), Mastigoteuthis sp.A(Clarke)
and G. antarcticus from South Georgia; By weight, they were the T. sp. B (Voss) and G.
antarcticus from South Georgia, M. robsoni, T. danae and H. atlantica from Kerguelen (Table
7.4,in annex). The most numerous species found were K. longimana, H. eltaninae and H.
atlantica (especially on Kerguelen). Top species contributing to the overall weight found were K.
longimana, H. atlantica and T. danae (both this last 2 species from Kerguelen).
3.5.2 Diversity and cumulative curves
Shannon-Wiener Index was higher in Kerguelen, and lowest in South Georgia, while rarefaction
curves are shown in Figure 3.8 and indicated that: i) South Georgia has less cephalopod diversity
than the French islands, and ii) Crozet appears to have higher diversity, although there is no
statistical significance between the archipelagos of Crozet and Kerguelen (as most part of both
curves are inside each other confidence intervals of 95%).
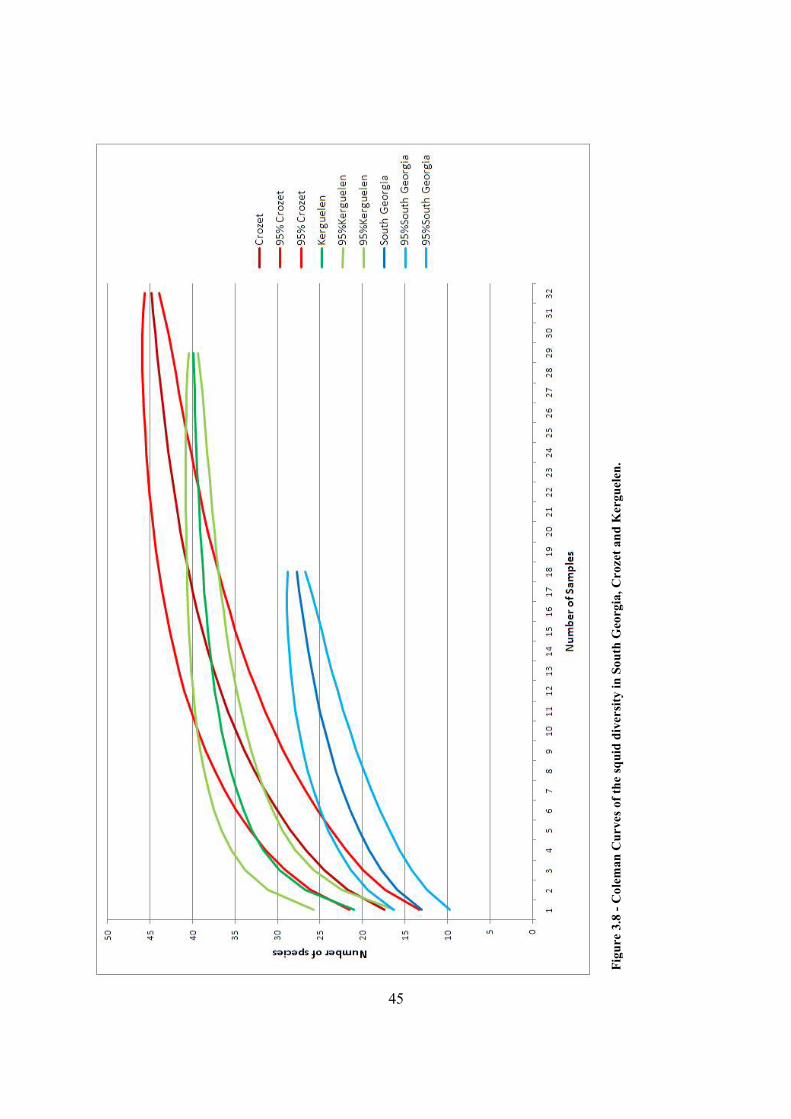
45
Figure 3.8 - Coleman Curves of the squid diversity in South Georgia, Crozet and Kerguelen.
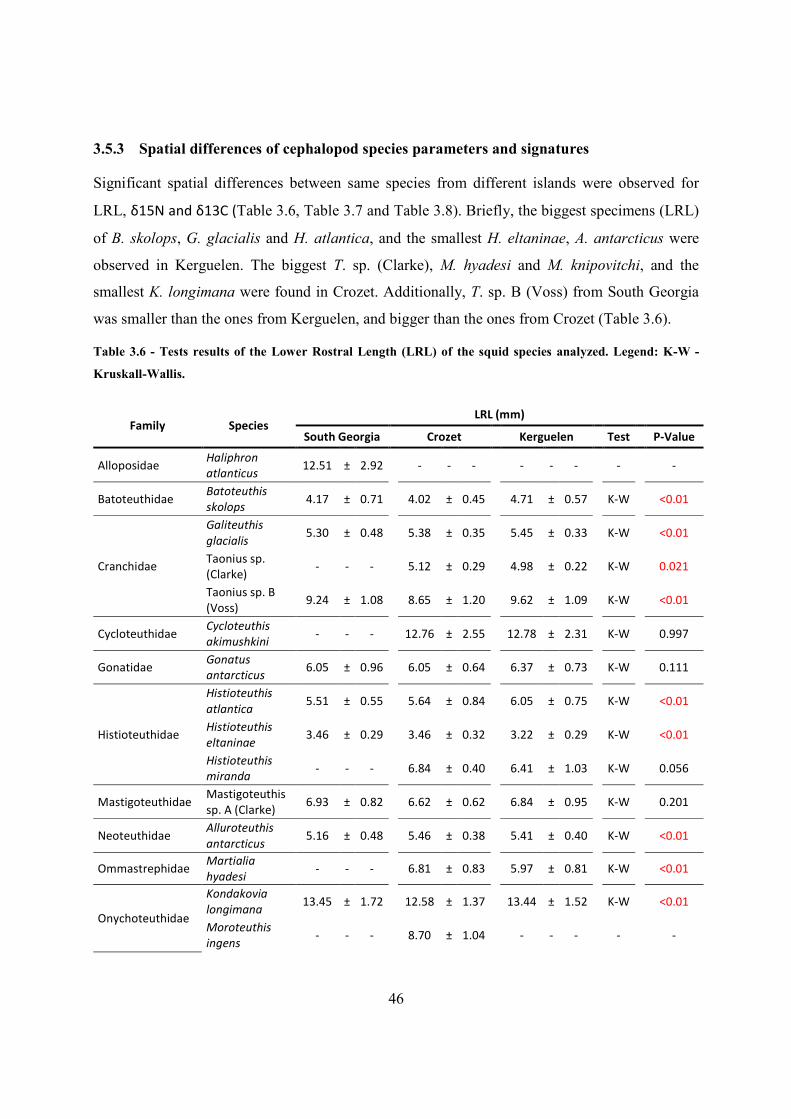
46
3.5.3 Spatial differences of cephalopod species parameters and signatures
Significant spatial differences between same species from different islands were observed for
LRL, δ15N and δ13C (Table 3.6, Table 3.7 and Table 3.8). Briefly, the biggest specimens (LRL)
of B. skolops, G. glacialis and H. atlantica, and the smallest H. eltaninae, A. antarcticus were
observed in Kerguelen. The biggest T. sp. (Clarke), M. hyadesi and M. knipovitchi, and the
smallest K. longimana were found in Crozet. Additionally, T. sp. B (Voss) from South Georgia
was smaller than the ones from Kerguelen, and bigger than the ones from Crozet (Table 3.6).
Table 3.6 - Tests results of the Lower Rostral Length (LRL) of the squid species analyzed. Legend: K-W -
Kruskall-Wallis.
Family Species LRL (mm)
South Georgia
Crozet
Kerguelen
Test
P-Value
Alloposidae Haliphron
atlanticus 12.51 ± 2.92
- - -
- - -
-
-
Batoteuthidae Batoteuthis
skolops 4.17 ± 0.71
4.02 ± 0.45
4.71 ± 0.57
K-W
<0.01
Cranchidae
Galiteuthis
glacialis 5.30 ± 0.48
5.38 ± 0.35
5.45 ± 0.33
K-W
<0.01
Taonius sp.
(Clarke) - - -
5.12 ± 0.29
4.98 ± 0.22
K-W
0.021
Taonius sp. B
(Voss) 9.24 ± 1.08
8.65 ± 1.20
9.62 ± 1.09
K-W
<0.01
Cycloteuthidae Cycloteuthis
akimushkini - - -
12.76 ± 2.55
12.78 ± 2.31
K-W
0.997
Gonatidae Gonatus
antarcticus 6.05 ± 0.96
6.05 ± 0.64
6.37 ± 0.73
K-W
0.111
Histioteuthidae
Histioteuthis
atlantica 5.51 ± 0.55
5.64 ± 0.84
6.05 ± 0.75
K-W
<0.01
Histioteuthis
eltaninae 3.46 ± 0.29
3.46 ± 0.32
3.22 ± 0.29
K-W
<0.01
Histioteuthis
miranda - - -
6.84 ± 0.40
6.41 ± 1.03
K-W
0.056
Mastigoteuthidae Mastigoteuthis
sp. A (Clarke) 6.93 ± 0.82
6.62 ± 0.62
6.84 ± 0.95
K-W
0.201
Neoteuthidae Alluroteuthis
antarcticus 5.16 ± 0.48
5.46 ± 0.38
5.41 ± 0.40
K-W
<0.01
Ommastrephidae Martialia
hyadesi - - -
6.81 ± 0.83
5.97 ± 0.81
K-W
<0.01
Onychoteuthidae
Kondakovia
longimana 13.45 ± 1.72
12.58 ± 1.37
13.44 ± 1.52
K-W
<0.01
Moroteuthis
ingens - - -
8.70 ± 1.04
- - -
-
-
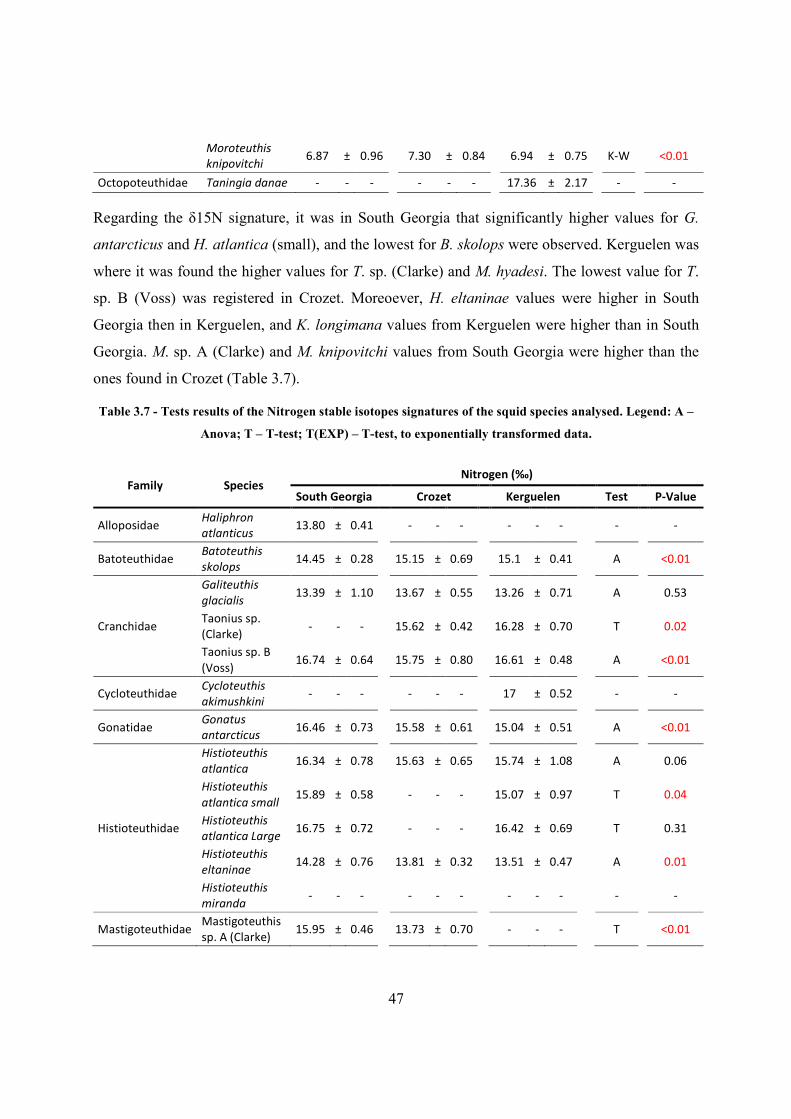
47
Moroteuthis
knipovitchi 6.87 ± 0.96
7.30 ± 0.84
6.94 ± 0.75
K-W
<0.01
Octopoteuthidae Taningia danae - - -
- - -
17.36 ± 2.17
-
-
Regarding the δ15N signature, it was in South Georgia that significantly higher values for G.
antarcticus and H. atlantica (small), and the lowest for B. skolops were observed. Kerguelen was
where it was found the higher values for T. sp. (Clarke) and M. hyadesi. The lowest value for T.
sp. B (Voss) was registered in Crozet. Moreoever, H. eltaninae values were higher in South
Georgia then in Kerguelen, and K. longimana values from Kerguelen were higher than in South
Georgia. M. sp. A (Clarke) and M. knipovitchi values from South Georgia were higher than the
ones found in Crozet (Table 3.7).
Table 3.7 - Tests results of the Nitrogen stable isotopes signatures of the squid species analysed. Legend: A –
Anova; T – T-test; T(EXP) – T-test, to exponentially transformed data.
Family Species Nitrogen (‰)
South Georgia
Crozet
Kerguelen
Test
P-Value
Alloposidae Haliphron
atlanticus 13.80 ± 0.41
- - -
- - -
-
-
Batoteuthidae Batoteuthis
skolops 14.45 ± 0.28
15.15 ± 0.69
15.1 ± 0.41
A
<0.01
Cranchidae
Galiteuthis
glacialis 13.39 ± 1.10
13.67 ± 0.55
13.26 ± 0.71
A
0.53
Taonius sp.
(Clarke) - - -
15.62 ± 0.42
16.28 ± 0.70
T
0.02
Taonius sp. B
(Voss) 16.74 ± 0.64
15.75 ± 0.80
16.61 ± 0.48
A
<0.01
Cycloteuthidae Cycloteuthis
akimushkini - - -
- - -
17 ± 0.52
-
-
Gonatidae Gonatus
antarcticus 16.46 ± 0.73
15.58 ± 0.61
15.04 ± 0.51
A
<0.01
Histioteuthidae
Histioteuthis
atlantica 16.34 ± 0.78 15.63 ± 0.65 15.74 ± 1.08 A
0.06
Histioteuthis
atlantica small 15.89 ± 0.58
- - -
15.07 ± 0.97
T
0.04
Histioteuthis
atlantica Large 16.75 ± 0.72
- - -
16.42 ± 0.69
T
0.31
Histioteuthis
eltaninae 14.28 ± 0.76
13.81 ± 0.32
13.51 ± 0.47
A
0.01
Histioteuthis
miranda - - -
- - -
- - -
-
-
Mastigoteuthidae Mastigoteuthis
sp. A (Clarke) 15.95 ± 0.46
13.73 ± 0.70
- - -
T
<0.01
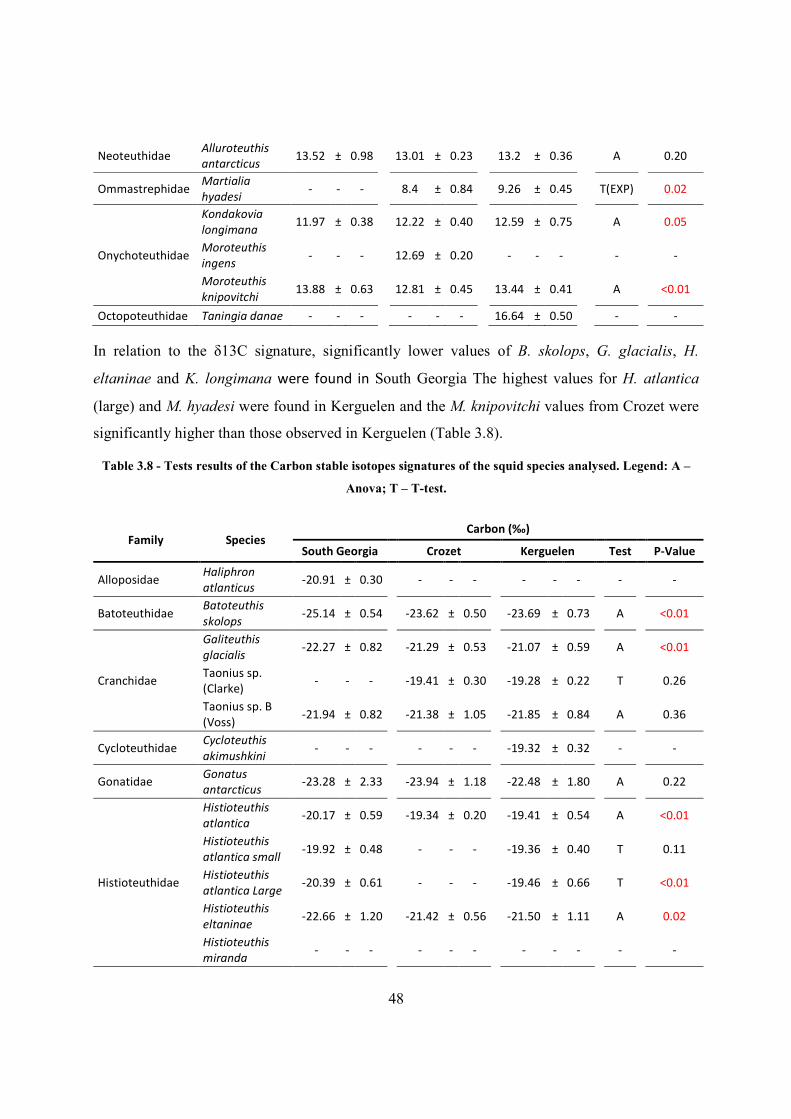
48
Neoteuthidae Alluroteuthis
antarcticus 13.52 ± 0.98
13.01 ± 0.23
13.2 ± 0.36
A
0.20
Ommastrephidae Martialia
hyadesi - - -
8.4 ± 0.84
9.26 ± 0.45
T(EXP)
0.02
Onychoteuthidae
Kondakovia
longimana 11.97 ± 0.38
12.22 ± 0.40
12.59 ± 0.75
A
0.05
Moroteuthis
ingens - - -
12.69 ± 0.20
- - -
-
-
Moroteuthis
knipovitchi 13.88 ± 0.63
12.81 ± 0.45
13.44 ± 0.41
A
<0.01
Octopoteuthidae Taningia danae - - -
- - -
16.64 ± 0.50
-
-
In relation to the δ13C signature, significantly lower values of B. skolops, G. glacialis, H.
eltaninae and K. longimana were found in South Georgia The highest values for H. atlantica
(large) and M. hyadesi were found in Kerguelen and the M. knipovitchi values from Crozet were
significantly higher than those observed in Kerguelen (Table 3.8).
Table 3.8 - Tests results of the Carbon stable isotopes signatures of the squid species analysed. Legend: A –
Anova; T – T-test.
Family Species Carbon (‰)
South Georgia
Crozet
Kerguelen
Test
P-Value
Alloposidae Haliphron
atlanticus -20.91 ± 0.30
- - -
- - -
-
-
Batoteuthidae Batoteuthis
skolops -25.14 ± 0.54
-23.62 ± 0.50
-23.69 ± 0.73
A
<0.01
Cranchidae
Galiteuthis
glacialis -22.27 ± 0.82
-21.29 ± 0.53
-21.07 ± 0.59
A
<0.01
Taonius sp.
(Clarke) - - -
-19.41 ± 0.30
-19.28 ± 0.22
T
0.26
Taonius sp. B
(Voss) -21.94 ± 0.82
-21.38 ± 1.05
-21.85 ± 0.84
A
0.36
Cycloteuthidae Cycloteuthis
akimushkini - - -
- - -
-19.32 ± 0.32
-
-
Gonatidae Gonatus
antarcticus -23.28 ± 2.33
-23.94 ± 1.18
-22.48 ± 1.80
A
0.22
Histioteuthidae
Histioteuthis
atlantica -20.17 ± 0.59
-19.34 ± 0.20
-19.41 ± 0.54
A
<0.01
Histioteuthis
atlantica small -19.92 ± 0.48
- - -
-19.36 ± 0.40
T
0.11
Histioteuthis
atlantica Large -20.39 ± 0.61
- - -
-19.46 ± 0.66
T
<0.01
Histioteuthis
eltaninae -22.66 ± 1.20
-21.42 ± 0.56
-21.50 ± 1.11
A
0.02
Histioteuthis
miranda - - -
- - -
- - -
-
-
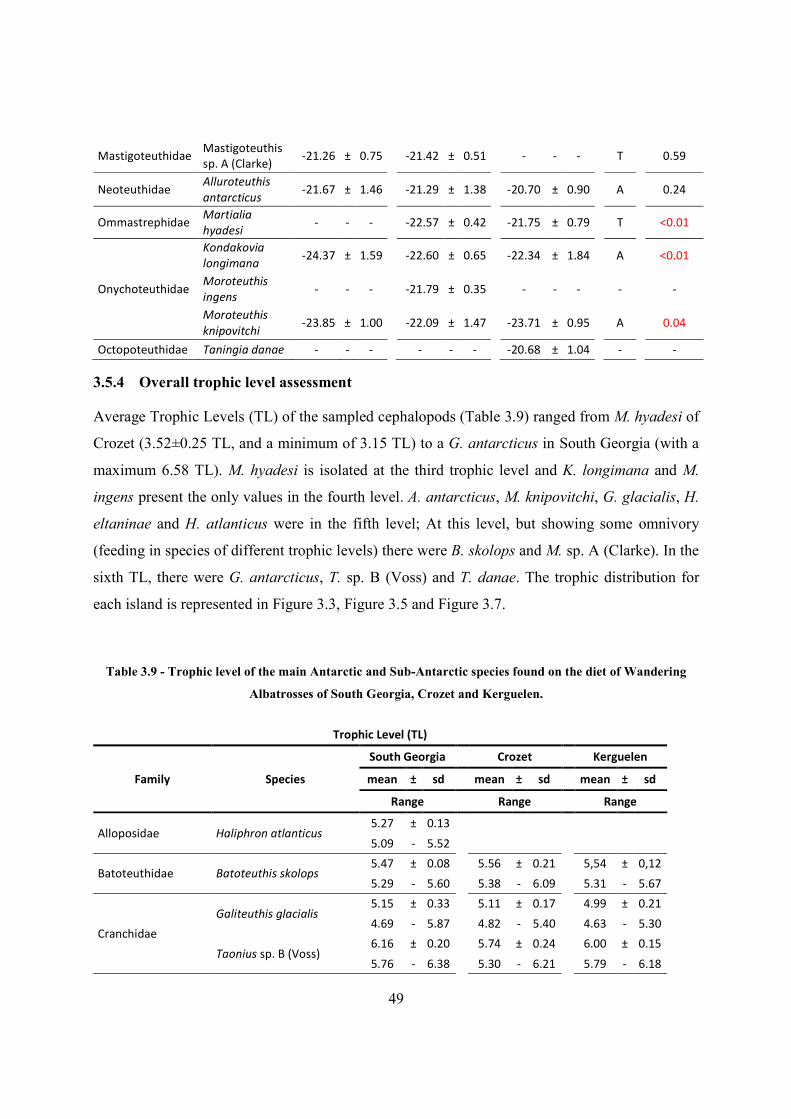
49
Mastigoteuthidae Mastigoteuthis
sp. A (Clarke) -21.26 ± 0.75
-21.42 ± 0.51
- - -
T
0.59
Neoteuthidae Alluroteuthis
antarcticus -21.67 ± 1.46
-21.29 ± 1.38
-20.70 ± 0.90
A
0.24
Ommastrephidae Martialia
hyadesi - - -
-22.57 ± 0.42
-21.75 ± 0.79
T
<0.01
Onychoteuthidae
Kondakovia
longimana -24.37 ± 1.59
-22.60 ± 0.65
-22.34 ± 1.84
A
<0.01
Moroteuthis
ingens - - -
-21.79 ± 0.35
- - -
-
-
Moroteuthis
knipovitchi -23.85 ± 1.00
-22.09 ± 1.47
-23.71 ± 0.95
A
0.04
Octopoteuthidae Taningia danae - - -
- - -
-20.68 ± 1.04
-
-
3.5.4 Overall trophic level assessment
Average Trophic Levels (TL) of the sampled cephalopods (Table 3.9) ranged from M. hyadesi of
Crozet (3.52±0.25 TL, and a minimum of 3.15 TL) to a G. antarcticus in South Georgia (with a
maximum 6.58 TL). M. hyadesi is isolated at the third trophic level and K. longimana and M.
ingens present the only values in the fourth level. A. antarcticus, M. knipovitchi, G. glacialis, H.
eltaninae and H. atlanticus were in the fifth level; At this level, but showing some omnivory
(feeding in species of different trophic levels) there were B. skolops and M. sp. A (Clarke). In the
sixth TL, there were G. antarcticus, T. sp. B (Voss) and T. danae. The trophic distribution for
each island is represented in Figure 3.3, Figure 3.5 and Figure 3.7.
Table 3.9 - Trophic level of the main Antarctic and Sub-Antarctic species found on the diet of Wandering
Albatrosses of South Georgia, Crozet and Kerguelen.
Trophic Level (TL)
Family Species
South Georgia
Crozet
Kerguelen
mean ± sd
mean ± sd
mean ± sd
Range
Range
Range
Alloposidae Haliphron atlanticus 5.27 ± 0.13
5.09 - 5.52
Batoteuthidae Batoteuthis skolops 5.47 ± 0.08
5.56 ± 0.21
5,54 ± 0,12
5.29 - 5.60
5.38 - 6.09
5.31 - 5.67
Cranchidae
Galiteuthis glacialis 5.15 ± 0.33
5.11 ± 0.17
4.99 ± 0.21
4.69 - 5.87
4.82 - 5.40
4.63 - 5.30
Taonius sp. B (Voss) 6.16 ± 0.20
5.74 ± 0.24
6.00 ± 0.15
5.76 - 6.38
5.30 - 6.21
5.79 - 6.18
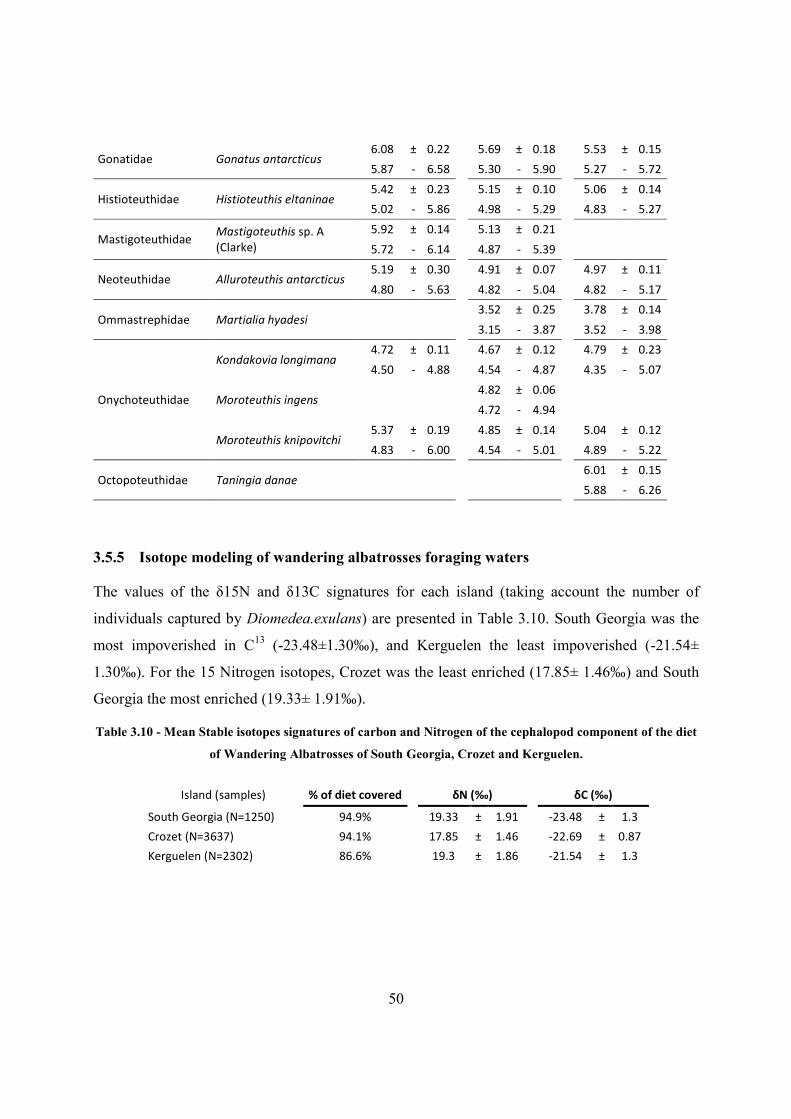
50
Gonatidae Gonatus antarcticus 6.08 ± 0.22
5.69 ± 0.18
5.53 ± 0.15
5.87 - 6.58
5.30 - 5.90
5.27 - 5.72
Histioteuthidae Histioteuthis eltaninae 5.42 ± 0.23
5.15 ± 0.10
5.06 ± 0.14
5.02 - 5.86
4.98 - 5.29
4.83 - 5.27
Mastigoteuthidae Mastigoteuthis sp. A
(Clarke)
5.92 ± 0.14
5.13 ± 0.21
5.72 - 6.14
4.87 - 5.39
Neoteuthidae Alluroteuthis antarcticus 5.19 ± 0.30
4.91 ± 0.07
4.97 ± 0.11
4.80 - 5.63
4.82 - 5.04
4.82 - 5.17
Ommastrephidae Martialia hyadesi 3.52 ± 0.25
3.78 ± 0.14
3.15 - 3.87
3.52 - 3.98
Onychoteuthidae
Kondakovia longimana 4.72 ± 0.11
4.67 ± 0.12
4.79 ± 0.23
4.50 - 4.88
4.54 - 4.87
4.35 - 5.07
Moroteuthis ingens 4.82 ± 0.06
4.72 - 4.94
Moroteuthis knipovitchi 5.37 ± 0.19
4.85 ± 0.14
5.04 ± 0.12
4.83 - 6.00
4.54 - 5.01
4.89 - 5.22
Octopoteuthidae Taningia danae 6.01 ± 0.15
5.88 - 6.26
3.5.5 Isotope modeling of wandering albatrosses foraging waters
The values of the δ15N and δ13C signatures for each island (taking account the number of
individuals captured by Diomedea.exulans) are presented in Table 3.10. South Georgia was the
most impoverished in C13 (-23.48±1.30‰), and Kerguelen the least impoverished (-21.54±
1.30‰). For the 15 Nitrogen isotopes, Crozet was the least enriched (17.85± 1.46‰) and South
Georgia the most enriched (19.33± 1.91‰).
Table 3.10 - Mean Stable isotopes signatures of carbon and Nitrogen of the cephalopod component of the diet
of Wandering Albatrosses of South Georgia, Crozet and Kerguelen.
Island (samples) % of diet covered
δN (‰)
δC (‰)
South Georgia (N=1250) 94.9%
19.33 ± 1.91
-23.48 ± 1.3
Crozet (N=3637) 94.1%
17.85 ± 1.46
-22.69 ± 0.87
Kerguelen (N=2302) 86.6%
19.3 ± 1.86
-21.54 ± 1.3
51
4. DISCUSSION
4.1 Methodological limitations
There are several limitations related to the stable isotopes methodology that was used in this
study, and several other potential biases that could be important to the results here obtained.
In this study, we only characterize the component of cephalopods in the diet of wandering
albatrosses. Yet, the diet of wandering albatrosses is also known to comprise fish in fairly similar
proportions to those of cephalopods (Croxall & Prince 1994; Xavier et al. 2004), and smaller
amounts of carrion and crustaceans (mostly Krill) ( Xavier et al. 2003b). Therefore, this study
focuses only on less than half of the diet, and any conclusions about the overall albatross dietary
ecology, or feeding behaviour is limited, despite not being on the aims of the study. Also,
albatross diet is a biased estimation of the amount and diversity of cephalopods found in the
Southern ocean, due to how cephalopods might be available to albatrosses. Cephalopods that
sink after death (sinking species) might be underestimated in the diet when compared to species
that float after dying. This is because D. exulans only feeds on food available at the sea surface
and probably these sinking squid species come from rare sperm whale vomit scavenging (Clarke
et al., 1981), although the origin of this squids are still under debate (Croxall & Prince 1994;
Rodhouse & Boyle 2010 in press; Xavier et al., 2012 in press). But apart from that, D. exulans
proved to be an efficient sampling tool for cephalopods.
Secondly, incorrect estimation of cephalopod consumption could result from equations used to
estimate squid mass, as this are normally based on: i) low number of individuals covering a
restricted size range (Xavier et al. 2003a), ii) estimations made only with the lower beaks, and it
was observed differences in the number of lower and upper beaks, or iii) conserved individuals,
in which, the conservation process could have altered the original weight of the specimens. The
same limitation is applied to the mantle length estimations. Therefore, further work as to be done
in order to obtain more accurate equations for both upper and lower beaks (Xavier et al.2007;
Xavier et al., 2011).
Thirdly, the Carbon isotopes apart from giving us latitudinal positioning of our sample
(according to water mass), it also can give us information about the position/distance of the
52
biological sample to the coast (Coastal vs. Oceanic) and to the bottom (Benthic vs. Pelagic)
(Cherel& Hobson 2005), meaning that there can be a synergetic effect of this three gradients
(one latitudinal and two longitudinal (coast to open ocean and benthos to pelagic areas)) in the
Carbon signature adding noise and error to the latitude prediction. Therefore, the species of this
study are all considered and picked for being entirely oceanic, and never feeding in coastal or
benthic waters. This problem could have been solved by using stable isotopes of Oxygen – which
give us the information of the temperature (and therefore in the Southern ocean, latitude) where
the animals lived in – but there are currently no studies that calibrate SI signatures of Oxygen of
cephalopods beaks and their muscles, and furthermore, the number of samples that we could run
would be significantly lower due to the costs associated to the measurement of these isotopes.
Further work with Oxygen stable isotopes in this squids should be done, to complement the
Carbon signature in this Ocean.
Forthly, the Nitrogen signature has a major problem: when comparing same trophic level
specimens from different areas or habitats (in this case water masses), Nitrogen signatures do not
match, because, there are different baseline Nitrogen signatures on these environments (i.e.
different background levels of the Nitrogen isotopes (Cherel et al., 2000)). Therefore, it is with
precaution that it is studied the trophic distribution of the samples, when they are in different
water masses that are known to have different baseline Nitrogen signature levels, in this case,
Subtropical waters versus Antarctic and Subantarctic waters. The best solution to this problem
would be by assessing the Nitrogen signature of a cosmopolitan species that has throughout its
distribution, the same trophic level, being the best candidate a phytoplankton or even better, an
herbivor (or a low level omnivor) that lives more than a year, so it can integrate a year round
Nitrogen signal, I.e.Krill (E. superba). Unfortunately, in this study it was used S. thompsoni
sampled in another study (Stowasser et al. 2012), as the representative species for our food web
baseline in South Georgia. S. thompsoni feeds mainly on flagellates and cyanobacteria
(Sutherland et al., 2010; von Harbou et al., 2011), both being isotopically depleted when
compared to other forms of phytoplankton (Fry and Wainwright, 1991; del Giorgio and France,
1996; Fawcett et al., 2010), thus making S. thompsoni also isotopically depleted then expected
for an herbivor (it presented a lower Nitrogen signature then particulate organic matter (POM)
(Stowasser et al.2012)). In consequence, it was used only the average of the 2 highest samples
(Su7 and Su8) as the Nitrogen baseline signature, but even so, trophic levels of the squids in this
53
study may be overestimated in comparison to reality. Furthermore, there are still processes that
change the Nitrogen signature of these (and other) animals that are not yet fully understood, that
can give the wrong idea about their trophic level. Hence, complementary methods should be used
when trying to estimate trophic distribution in animals, as for example, concentration of heavy
metals in their tissues (Anderson et al., 2009).
Fifthly, cephalopods carry out ontogenetic and annual migrations throughout their lives, and by
so, their stable isotopes signatures might be different from the place where they were captured by
albatrosses. So, conclusions about the foraging behavior of albatrosses are limited, but in terms
of prey water mass origin, valuable information can be provided.
4.2 Spatial differences in the cephalopod diet of wandering albatrosses
In other studies done at South Georgia, the onychoteuthid family (and more specifically K.
longimana) also dominated the diets of Wandering Albatross (Clarke et al.1981; Rodhouse et al.
1987; Imber 1992 ; Xavier et al, 2003a), followed by the family Cranchiidae (particularly the
cranchid species Taonius sp. ( Clarke et al. 1981; Rodhouse et al. 1987; Xavier et al. 2003a)) and
by the family Histioteuthidae.
At Crozet, Ridoux (1994), Cherel & Weimerskirch (1999) also found K. longimana to be the
most important item of the diet of Albatross. However, in Cherel & Weimerskirch (1999), M.
ingens is the overall second most numerous species, while in this study, H. eltaninae and G.
glacialis were the second and third most numerous species, as according to Ridoux (1994).
However, M. ingens was the second most important in mass, while in the Cherel &
Weimerskirch (1999), M. ingens in a rare year (1992) was the most important cephalopod in
mass, contributing to 56.8% of the fresh remains on the diet.
At Kerguelen, to our knowledge, there are no dietary studies of the wandering albatross.
According to the results obtained in the present study, H. atlantica is by far the most relatively
abundant species by number, followed by G. glacialis, K. longimana, H. eltaninae and Taonius
sp. B (Voss). By mass, the most important species were K. longimana, A. dux, T. danae, H.
atlantica and M. robsoni, which are all big size species, except for the H. atlantica which is a
small squid (Table 3.1), but due to the high number of individuals found in the diet its
contribution to the total diet mass was significant. The high relative abundance of H. atlantica in
54
Kerguelen waters in 1998 was also registered one year later on the diet of Dissostichus
eleginoides during the 1999 summer fishing season in a 3 years study (1998, 1999 and 2000) (
Cherel et al., 2004).
It is interesting the importance of these giant squids on the diet of the albatrosses from
Kerguelen, mainly A. dux, since on the other islands these species do not have such relevancy.
The radical difference in teuthofauna found in this place can be explained by the great difference
of the nearby Ocean basin. Unlike the other two places studied that consist in Oceanic ridges,
Kerguelen has an enormous continental shelf, which might gather the right conditions to support
this squids.
Diet of D.exulans from Crozet, in this and other studies (Cherel & Weimerskirch, 1999; Ridoux,
1994), shows dominance of the Onychoteuthid family and also the presence of H. eltaninae and
G. glacialis, showing similarities with Kerguelen; in Crozet however, giant species do not appear
to be as important as in Kerguelen.
At Marion island (Cooper et al., 1992) the most abundant species by number were H. eltaninae,
K. longimana, G. glacialis and A. antarcticus (this one is not significant in the Kerguelen diet),
and by weight the Onychoteuthids , while in Prince Edward (Imber, 1992), species dominating
by weight were the Onychoteuthids followed by the Octopoteuthid T. danae, also found in
Kerguelen.
South Georgia presented higher availability of T. sp. B (Voss) and G. antarcticus, with the latter
known to have important juvenile stocks in which seabirds feed in the nearby Falkland islands
(Thompson, 1994). Both these species (and Mastigoteuthis sp. A) are responsible for most
differences observed in the numeric indexes, showing that albatross are more dependent on these
stocks in the Atlantic sector. The biodiversity of cephalopod prey found in the three islands show
that the Albatrosses in the Indian sector relay on a greater number of species (specially the
population nesting in Crozet) than in the Atlantic sector, probably due to the proximity of Crozet
and Kerguelen to the Subtropical Ocean and the Kerguelen plateau.
Moreover, the present findings also revealed clear indications that D. exulans shows a
scavenging strategy, especially at Kerguelen, since there are several captured prey found in their
diet that are several times heavier than the mean D. exulans, as other studies show (Croxall &
Prince, 1994; Xavier & Croxall, 2007).
55
4.3 Cephalopod habitats in the Southern Ocean and adjacent waters
Cephalopods on the Southern ocean are classified by their water masses, namely: Antarctic,
Subantarctic and Subtropical. Furthermore, some of them can display circumpolar or local
distributions. Xavier et al.(1999) has published distribution maps of several of these species in
GIS-maps, where he pinpointed the known locations of captured specimens. In those maps, K.
longimana, M. knipovitchi, B. skolops, A. antarcticus and G. glacialis present a Circumpolar
Antarctic distribution (South of the APF). As for Sub-antarctic species (North of the APF), there
were M. ingens, G. antarcticus, H. atlantica, H. eltaninae, M. hyadesi and occasionally Taonius
sp. (cf. pavo).
This study agrees with the Antarctic distribution for B.skolops (In South Georgia it is further
south than in the other 2 locations), K. longimana and M. knipovitchi found on previous studies (
Xavier et al., 1999). The last two squids presented subantarctic distributions in the Indian sector
(Cherel & Weimerskirch, 1999). It is plausible that the highly productive shelf in Kerguelen
(South of the APF) is pulling the Carbon signature to northern latitudes. Similar findings were
observed by Cherel & Hobson (2005).
In Cherel & Hobson (2005), individuals of M. knipovitchi with a sub-antarctic Carbon signature
were captured in the Kerguelen continental shelf by King Penguins (Aptenodytes patagonicus)
and presented higher values of Carbon than the ones found in the present study (whose signature
values were from Antarctic waters). If this species has true Antarctic distribution, then
potentially, M. knipovitchi comes from oceanic waters populations and the Kerguelen plateau is
adding 2‰ to the Carbon signature of the animals captured in there.
If we take the Kerguelen shelf’s effect, discussed on the previous paragraph, into consideration
than it can be used to explain the higher Carbon signatures within the same squid species on the
Indian sector – higher Carbon signatures come from Kerguelen shelf and lower from Open
Ocean.
It can be inferred then that M. knipovitchi of Crozet were taken almost exclusively from the
Kerguelen plateau (D. exulans males feed in this area ( Weimerskirch et al., 1997)) and the
remaining from oceanic waters (explaining the great standard deviation, and the proximity to the
values obtained in Kerguelen in a previous study (Cherel & Hobson 2005)), while at Kerguelen,
squids were from Antarctic Oceanic waters. Therefore, M. knipovitchi is probably rare or
56
nonexistent in the Crozet waters. Also, if we apply this to K. longimana, squids found in Crozet
diet actually came in part from Kerguelen shelf and from the open southern ocean (south of the
APF), while squid of the diet of Kerguelen were from the nearby shelf.
The standard deviation in the Carbon signatures for K. longimana and M. knipovitchi agree with
Cherel & Weimerskirch (1999) in extending the biogeography of both these squids north of the
APF, but not only at Crozet islands as proposed by them, but also at Kerguelen.
K. longimana presented great standard deviations, both in the South Georgia and Kerguelen
specimens, supporting a great flexibility for this squid to occupy different habitats. In the case of
South Georgia, the species can have a broader latitudinal distribution, as the oceanic fronts
deflect northwards between the South American continent and the Falkland islands, while in
Kerguelen, the species can explore the vast continental shelf and oceanic waters around the
islands (Figure 1.1).
According to the Carbon results, G. antarcticus also has a strong Antarctic distribution, against
the more exclusive northern Subantarctic that was previously thought (Collins & Rodhouse,
2006; Xavier et al., 1999). The high standard deviations verified in this species δ 13C could
mean that this species has no problem in settling in waters south of the STF (as previously
agreed in Xavier et al., 1999), up to the coastal areas of the Antarctic continent.
For Subantarctic species, there were M. ingens in Crozet islands, M. hyadesi of Kerguelen, H.
eltaninae at the Indian sector, and from the 3 studied islands T. sp. B (Voss), agreeing with
previous studies (Voss, 1980; Xavier et al., 1999). We also showed that M. hyadesi in Crozet and
H. eltaninae in South Georgia probably live around the APF, and adults of the H. atlantica in
South Georgia live in the lower latitudes of the Subantarctic waters or in the STF.
Complementarily to what was predicted in previous studies (Collins & Rodhouse, 2006; Xavier
et al., 1999), A. antarcticus and G. glacialis seem to also live in the Subantarctic waters, with the
Carbon signature distribution pointing out for the possibility of A. antarcticus and G. glacialis
living near the STF. M. sp. A(Clarke), T.danae and H.atlanticus also were present in these
waters.
Species that lived in the Subtropical waters north of the Southern Ocean, and in range of the
Wandering Albatrosses were T. sp. (Clarke) (Voss, 1980), C. akimushkini and H. atlantica (Voss
et al., 1998). H. atlantica Large presented the same pattern as K. longimana throughout the
57
islands: It had higher Carbon signatures in Kerguelen then South Georgia, due to the southern
position of South Georgia. This is going to be further developed in the last section of the
discussion.
4.4 Cephalopod trophic position in the Southern Ocean and adjacent waters
Information about diet and trophic position of Southern Ocean cephalopods is very scarce, and
limited to M. hyadesi and M. ingens (Cherel & Duhamel, 2003; Rodhouse et al., 1992). In fact,
for the other species the results are dubious due to: i) the low number of individuals available
(Collins & Rodhouse, 2006), and ii) biased source of information (nets sampling Krill) – i.e.
skewed towards a Krill (E. superba) dominated and specialized diet (Nemoto et al., 1985;
Nemoto et al., 1988).
The present study confirmed previous findings on the diet (and stable isotopes analysis) of M.
hyadesi (Cherel et al., 2008; Cherel & Hobson, 2005; Rodhouse et al., 1992), by showing the
lowest mean Nitrogen signature and TL (Table 3.4 ,Table 3.5 and Table 3.9). M. hyadesi diet is
known to feed mainly of Hyperiid amphipods and myctophid fish, although other cephalopods
(i.e. cannibalism) are registered (Rodhouse et al., 1992). Myctophid however, tend to have an
equal to higher trophic level than this squid ( Cherel et al., 2008), therefore, this squid feeds in
this fish in fairly lower quantities then previously suggested, at least in the Indian sector.
K. longimana, as the other SI studies showed, has a very low Nitrogen signature compared to its
size (Cherel et al., 2008; Cherel & Hobson, 2005). This can be due to this species feed on preys
that have low Nitrogen signatures, such as myctophids ( Cherel et al., 2008) and of E. superba
(Kaehler et al., 2000; Cherel et al., 2008; Stowasser et al., 2012). Probably the only works done
with diet in these animals (Nemoto et al., 1985; Nemoto et al., 1988; Kear 1992) showed an
association with E. superba because of the method used to collect information or krill is a minor
component of the diet (respectively). Clearly the size of these animals is not correlated to their
trophic level, as for the case of Baleen whales (Pauly et al., 1998). However, the results of Wada
et al.(1987) obtained in South Georgia are 4‰ lower than the ones from this study , but Wada et
al. do not provide any further information about the squids captured as for mantle length, or any
other biological data.
58
M. ingens presented higher Nitrogen values (i.e. trophic level; TL=4.82±0.06) then M. hyadesi
and fairly similar to K. longimana, which is within the expected values of a diet dominated by
mesopelagic fish (myctophids and paralepids) (Cherel & Duhamel, 2003).
G. glacialis showed higher values than the ones found in previous study (Stowasser et al., 2012).
This difference was greater than a trophic level, and as for the case of K. longimana (Wada et al.,
1987) no any other biological data was provided to figure out the difference between the 2
samples/studies. This trophic level is dominated by cephalopods of the mesopelagic realm (H.
atlanticus, H. eltaninae and G. glacialis). This comes with no surprise, as they are all dependent
of the sea snow that comes from the epipelagic layer, which is in some extent, slightly enriched
in Nitrogen heavy isotopes due to the microbial decomposition that occurs during the transport
from the surface to this depth, and also, some of the sea snow may be already enriched in
Nitrogen heavy isotopes before decomposition starts (E.g. dead high trophic animals).
M. sp. A (Clarke) from South Georgia and B. skolops Nitrogen signatures are near the ones
obtained for Mastigoteuthis psychrophila in Cherel & Hobson (2005), while M. sp. A (Clarke) of
Crozet agree with the ones obtained also for M. psychrophila in ( Cherel et al., 2008). These
values could be explained by a diet on benthonic-benthopelagic zooplankton, that in turn are
dependent on the bacterial decomposition of surface production that settles in the ocean floor, as
previously proposed (Roper & Vecchione, 1997) for Mastigoteuthids (Batoteuthids seem to share
adaptations with Mastigoteuthids for this kind of feeding strategy). M. sp. A (Clarke) from South
Georgia shows a higher Nitrogen signature(15,95±0,46‰) than the one observed in
Crozet(13,73±0,70‰).Several other species showed the same trend in South Georgia (higher
Nitrogen signatures) giving the impression that squids here are feeding differently than the
Indian Sector (higher trophic levels in South Georgia). This trend could be due to the
local/regional productivity, as cyanobacteria and flagellates that live in open ocean waters poor
in nutrients (probably the case of Crozet oceanic waters) have Nitrogen depleted signatures(Fry
and Wainwright, 1991; del Giorgio and France, 1996; Fawcett et al., 2010), in contrast with rich
upwelling waters with high diatom productivity (the case of South Georgia); Or squids in South
Georgia, are eating differently, due to competitive pressure from other low trophic animals or
normal prey in 1998 were unavailable and squid changed their diet to higher trophic more
available prey.
59
G. antarcticus presents the highest Nitrogen signature in the Antarctic water mass. These high
mean Nitrogen signature values are (2‰) higher than the ones found in previous studies ( Cherel
et al., 2008; Cherel & Hobson, 2005), and just below of M. hamiltoni. This may indicate that G.
antarcticus may feed on prey that has similar high Nitrogen signature values to the Patagonian
toothfish D. eleginoides ( Cherel et al., 2008) ( several squid in this study match that
requirement), or that depends on an alternate, and very inefficient, food chain. G. antarcticus and
T. sp. B (Voss) probably follows the last trend, as they are small squid wich would have
difficulties seizing such large and active prey. G. glacialis however, could easily be a prey of
these 2 squids.
T. danae is one of the top predator squid in the deep sea (Cherel et al., 2009), with Nitrogen
signature as high or higher than those from A. dux, and within the values registered in other
studies (Cherel & Hobson, 2005; Cherel et al. 2009). Trophic level in this study agreed with
these previous studies (Cherel & Hobson, 2005; Cherel et al. 2009), as it is around 6.01±0.15, the
highest in Subantarctic and Antarctic waters.
Subtropical species (H. atlantica, C. akimushkini and T. sp. (Clarke))presented some of the
highest Nitrogen signatures, much due to the Nitrogen baseline shift from Antarctic and
Subantarctic waters to Subtropical. Therefore, Trophic level for this species has to be calculated
with a different base standard then the one used in this study that comes from Antarctic waters.
C.akimushkini has the highest mean Nitrogen signature values in the total sample (17±0.52‰)
while H.atlantica shows a positive correlation between size of the individuals and their Nitrogen
signature, as this squid climb the food chain as they are able to feed on bigger prey.
Overall, squids of this study that live on the Antarctic and subantarctic, are forth level consumers
(TL>5), which is higher than the average level for marine mammals ( TL=4.02 (Pauly et al.,
1998)) and sharks ( TL>4 (Cortés, 1999)). Even so, the trophic span covered by these squids
from the TL=3 to 6, makes them good candidates for occupying the niche of great epipelagic fish
(Cortés, 1999; Rodhouse & White, 1995), to a point where they even compete with great, deep
diving mammals as seals and sperm-whales ( Cherel et al., 2008).
60
4.5 Implications on the conservation of wandering albatrosses
Currently there are several important fisheries within the foraging range of the Wandering
Albatross: i) The Longline fishery that is more intense near the continental shelfs of this region,
and therefore, closer to the breeding grounds of these seabirds; Ii) The Southern Blue-fin tuna
(SBT) Longline fishery, working south of 30ºS and north of 40ºS in the open ocean ( Xavier et
al., 2004; Nel et al., 2002; Weimerskirch et al., 1998).
As previously stated (in the Introduction), during the initial stages of the chick rearing period of
the Albatross, forage trip are shortest, and therefore, nearer their colony (Weimerskirch et al.,
1993; Nel et al., 2002; Xavier et al. 2004). During this time, albatrosses are more prone to follow
longline fishing vessels ( Xavier et al., 2004). Apart from this delicate period of development of
the chicks, trips tend to get further away from the colonies to avoid competition with the animals
that feed near the islands (seals, other smaller albatrosses) (Xavier et al., 2004), with females
going more northwards than males (Xavier et al. 2004; Weimerskirch et al.,1998; Weimerskirch
et al., 1993; Nel et al., 2002). During these trips is when Albatrosses get in contact with the SBT
fishery, especially females (Birdlife Internacional 2010; Nel et al., 2002; Xavier et al., 2004).
Mean Carbon signature of the cephalopods found on the diet of albatrosses can give us
information about the overall origin of the stocks these seabirds depend, and in a lesser degree,
where are these populations taking more foraging efforts. Taking this last thought into account,
according to the results gathered in the current study (Table 3.10), on average South Georgia
Wandering albatrosses are foraging in the APFZ waters (North of South Georgia), whereas in the
Indian sector, Crozet and Kerguelen Wanderers are in the Subantarctic (South and North of their
breeding colonies respectively), in agreement with previous studies (Xavier et al., 2004; Xavier
& Croxall, 2007; Weimerskirch et al., 1993).
In South Georgia, the main preys of D. exulans are the Antarctic K. longimana and Sub Antarctic
T .sp. B (Voss) (this study; Xavier et al., 2004; Rodhouse et al.,1987). Only these species
account for near half of the beaks found on the diet. Therefore, in South Georgia, D. exulans is
dependent on Antarctic and Subantarctic squids, rarely venturing to Subtropical waters (Xavier
et al. 2004), making them particularly exposed to the Patagonian Toothfish longliners around
South Georgia, and potentially in the Subantarctic, with Tuna fisheries. In some years, Illex
argentinus is the predominant species on the diet of D. exulans, which shows that they forage at
61
the Patagonian shelf too, overlapping with the longline fisheries known to operate there (Xavier
et al. 2004)
In Crozet, the main preys of wandering albatrosses, K. longimana and H. eltaninae seem to share
the same pattern as the one shown in South Georgia i.e. high abundance of Antarctic and
Subantarctic squid in the diet of D.exulans. This shows that, in Crozet, D.exulans forage mainly
in the Subantarctic water South of the Crozet archipelago and also near the Kerguelen plateau
(Weimerskirch et al., 1997), susceptible to the Patagonian Toothfish longliners, and more
exposed to the SBT fishery as showed in previous studies (Birdlife international 2010; Nel et al.,
2002; Weimerskirch et al., 1993).
In Kerguelen, the main squid found in the diet are different from the other two islands. In here,
the subtropical species H. atlantica accounts for a third of the beaks found, followed by G.
glacialis (Subantarctic, but near the STF) with 13% of the beaks, and finally K. longimana with a
tenth of the beaks. This shows an inversion of the trend shown by the other two islands, where
there was a dominance of Antarctic and Subantarctic species, while here, it is a subtropical
species that dominates the diet (by numbers). However, as this was a one year sampling, there is
the possibility that the dominance of H. atlantica was characteristic only for that year (1998) as
previously stated (this study; Cherel et al., 2004). Leaving to 2 possible conclusions: i) Or
D.exulans are feeding further north than in the other islands, leaving them deep in SBT fisheries
grounds or ii) the abundance of H.atlantica in this year was abnormal, and therefore, D.exulans
feeds in Subantarctic waters near Kerguelen and mainly close to the STF, exposed to being
bycatched in one of the longliners and by the SBT fishery respectively.
62
5. FINAL CONSIDERATIONS
Cephalopods in this ocean are truly important in the food web, as they occupy almost all trophic
positions from the second consumers (eating copepods and euphausiids), to the top predators at
the sixth trophic level, passing by the fifth trophic level gelatinous predators of the mesopelagic
and benthopelagic realm. By the analysis of the diet of D. exulans performed in this study,
onychoteuthids (specially K. longimana) dominated the diet of D. exulans , with histioteuthids,
cranchiids and giant teuthids playing also a relevant role (specifically in Kerguelen). D. exulans
scavenges squid for food, even if it is not provided by fishing vessels. The Indian sector diet had
more cephalopod diversity then the Atlantic sector, as the former is geographically located nearer
the subtropical region, and the latter is further south in Antarctic waters. Also, D. exulans feeds
in the three main water masses of the Southern Ocean (Antarctic, Subantarctic and subtropical
waters) except for the birds found in South Georgia, as the squids analyzed using stable isotopes
showed (only Antarctic and Subantarctic). The habitat use of the squid species in this ocean, and
their contribution to the diet of D. exulans point out for the threat that longliners operating near
the continental shelves of the breeding colonies pose for their survival, while the Tuna fisheries
further north only are a threat to the Kerguelen population, if H. atlantica is truly the main diet
component of D. exulans in here.
63
6. BIBLIOGRAPHY
Anderson, O., Phillips, R., McDonald, R., Shore, R., McGill, R., & Bearhop, S. (2009). Influence of trophic position and foraging range on mercury levels within a seabird community. Marine Ecology Progress Series, 375, 277–288. doi:10.3354/meps07784
Belkin IM, Gordon AL (1996) Southern ocean front from the Greenwich meridian to Tasmania. J Geophys Res 101: 3675–3696
BirdLife International. (2007). Analysis of albatross and petrel distribution and overlap with
longline fishing effort within the IOTC area: results from the Global Procellariiform Tracking Database. Paper submitted on behalf of the Agreement for the Conservation of Albatrosses and Petrels (ACAP), Third Session of the IOTC Working Party on Ecosystems and Bycatch, Victoria, Seychelles 11-13 July 2007:
Brewer, A. & Williamson, M. (1994). A new relationship for rarefaction. Biodiversity Conservation, 3, 373-379.
Carmack, E. (1990). Large-scale physical oceanography of polar oceans. In ‘‘Polar Oceanography, Part A: Physical Science’’ (W. O. Smith, ed.), pp. 171–222. Academic Press, London.
Cherel, Y, Ducatez, S., Fontaine, C., Richard, P., & Guinet, C. (2008). Stable isotopes reveal the trophic position and mesopelagic fish diet of female southern elephant seals breeding on the Kerguelen Islands. Marine Ecology Progress Series, 370, 239–247. doi:10.3354/meps07673
Cherel, Y, & Duhamel, G. (2003). Diet of the squid Moroteuthis ingens (Teuthoidea: Onychoteuthidae) in the upper slope waters of the Kerguelen Islands. Marine Ecology Progress Series, 250, 197–203. doi:10.3354/meps250197
Cherel, Y, Duhamel, G., & Gasco, N. (2004). Cephalopod fauna of subantarctic islands: new information from predators. Marine Ecology Progress Series, 266, 143–156. doi:10.3354/meps266143
Cherel, Y, & Hobson, K. (2007). Geographical variation in carbon stable isotope signatures of marine predators: a tool to investigate their foraging areas in the Southern Ocean. Marine Ecology Progress Series, 329, 281–287. doi:10.3354/meps329281
Cherel, Y, Hobson, K. a, & Weimerskirch, H. (2005). Using stable isotopes to study resource acquisition and allocation in procellariiform seabirds. Oecologia, 145(4), 533–40. doi:10.1007/s00442-005-0156-7
64
Cherel, Y, Ridoux, V., Spitz, J., & Richard, P. (2009). Stable isotopes document the trophic structure of a deep-sea cephalopod assemblage including giant octopod and giant squid. Biology letters, 5(3), 364–7. doi:10.1098/rsbl.2009.0024
Cherel, Y, & Weimerskirch, H. (1999). Spawning cycle of onychoteuthid squids in the southern Indian Ocean:new information from seabird predators. Marine Ecology Progress Series, 188, 93–104. doi:10.3354/meps188093
Cherel, Y., Hobson, K. a., & Weimerskirch, H. (2000). Using stable-isotope analysis of feathers to distinguish moulting and breeding origins of seabirds. Oecologia, 122(2), 155–162. doi:10.1007/PL00008843
Cherel, Yves, & Hobson, K. a. (2005). Stable isotopes, beaks and predators: a new tool to study the trophic ecology of cephalopods, including giant and colossal squids. Proceedings. Biological sciences / The Royal Society, 272(1572), 1601–7. doi:10.1098/rspb.2005.3115
Church J. A., Gregory J. M., in Climate Change (2001): The Scientific Basis, J. T. Houghton et al., Eds. (Cambridge Univ. Press, Cambridge, 2001), chap. 11, pp. 641–693.
Clarke, M. R. (1977). Beaks, nets and numbers. Symposia of the Zoological Society of London 38, 89–126. Clarke, M. R. (1983). Cephalopod biomass—estimation from predation. Memoirs of the National Museum of Victoria 44, 95–107. Clarke, M.R., Croxall, J.P. & Prince, P.A. (1981). Cephalopod remains in regurgitations of the
wandering albatross Diomedea exulans L. at South Georgia. British Antarctic Survey Bulletin, No. 54, 9-21.
Coleman, B.D. (1981). On Random placement and species-area relations. Mathemat Biosciences, 54, 191-215. Coleman, B.D., Mares, M.A., Willig, M.R. & Hsieh, Y.-H. (1982). Randomness, area, and species richness. Ecology, 63, 1121-1133.
Collins, M. a, & Rodhouse, P. G. K. (2006). Southern Ocean cephalopods. Advances in marine biology, 50(05), 191–265. doi:10.1016/S0065-2881(05)50003-8
Colwell, R.K. & Coddington, J.A. (1994). Estimating terrestrial biodiversity through extrapolation. Phil. Trans. Royal Soc. London B, 345, 101-118.
Cooper, J., Henley, S. R., & Klages, N. T. W. (1992). The diet of the Wandering Albatross Diomedea exulans at Subantarctic Marion Island, Polar Biology 1, 477–484.
Cortés, E. (1999). Standardized diet compositions and trophic levels of sharks, ICES Journal of Marine Science, 56: 707–717.
65
Croxall J.P., Prince P.A. (1994). Dead or alive, night or day: how do albatrosses catch squid? . In Rodhouse, P.G., Piatkowski, U. & Lu, C.C. eds, Southern Ocean cephalopods: life cycles and populations. Antarctic Science, 6, 155-162. Deacon G. E. R. (1982). Physical and biological zonation in the Southern Ocean. Deep-Sea Research 29: 1-15 del Giorgio, P.A., France, R.L., (1996). Ecosystem-specific patterns in the relationship between
zooplankton and POM or microplankton d13C. Limnology and Oceanography 41, 359– 365.
Deniro M. J. and S. Epstein (1978) Influence of diet on the distribution of carbon isotopes in animals. Geochimica et Cosmochimica Acta, 42,495-506. Deniro M. J. and S. Epstein (1981) Influence of diet on the distribution of nitrogen in animals. Geochimica et Cosmochimica Acta, 45,341-351. Fawcett, S.E., Lomas, M.W., Ward, B.B., Casey, J.R., Sigman, D.M., (2010). Eukaryotes
dominate new production in the Sargasso Sea. In: American Geophysical Union Fall Meeting, Abstract #PP31A-1613.
Fry, B., Wainwright, S.C., (1991). Diatom sources of C13 rich carbon in marine food webs.
Marine Ecology Progress Series 76, 149–157. Gales R (1993). Co-operative mechanisms for the conservation of albatrosses. Australian Nature
Conservation Agency and Australain Antarctic Foundation, Hobart, Australia Gales R (1998). Albatross populations: status and threats. In: Robertson G GR (ed) Albatross
biology and conservation. Surrey Beatty & Sons, Chipping Norton, Australia, pp 20-45
Hobson, K. A., & Cherel, Y. (2006). Isotopic reconstruction of marine food webs using cephalopod beaks : new insight from captively raised Sepia officinalis. Can. J. Zool. 770, 766–770. doi:10.1139/Z06-049
Imber, M. J. (1992). Cephalopods Eaten by Wandering Albatrosses (Diomedea-Exulans L) Breeding at 6 Circumpolar Localities. Journal Of The Royal Society Of New Zealand, 22(4), 243–263.
Jaeger, A., Lecomte, V. J., Weimerskirch, H., Richard, P., & Cherel, Y. (2010). Seabird satellite tracking validates the use of latitudinal isoscapes to depict predators ’ foraging areas in the Southern Ocean. Rapid Commun. Mass Spectrom 3456–3460. doi:10.1002/rcm
Kaehler, S., Pakhomov, E. A., & Mcquaid, C. D. (2000). Trophic structure of the marine food web at the Prince Edward Islands ( Southern Ocean ) determined by ␦ ␦ 13 C and 15 N analysis, Mar Ecol Prog Ser 208, 13–20.
66
Kear, A. J. (1992). The diet of Antarctic squid: A comparison of conventional and serological gut contents analyses. Journal of Experimental Marine Biology and Ecology 156, 161– 178.
Koubbi P, Ibaez F, Duhamel G (1991). Environmental influences on spatio-temporal oceanic
distribution of ichthyoplankton around the Kerguelen Islands (Southern Ocean). Mar Ecol Prog Ser 72:225±238
Lipinsky, M.R. & Jackson, S. (1989). Surface-feeding on cephalopods by procellariiform
seabirds in the southern Benguela region, South Africa. Journal of Zoology (London), 218, 549-563.
Minagawa M. and E. Wada (1984). Stepwise enrichment of 15N along food chains: Further
evidence and the relation between 15N and animal age. Geochimica et Cosmochimica Acta, 48, t135-1140
Moore J. K., Abbott M. R., Richman J. G. (1997). Variability in the location of the Antarctic
Polar Front (90º - 20ºW) from satellite sea surface temperature data. Journal of Geophysical Research 102: 27825-27833
Moore, J. K., Abbott, M. R., & Richman, J. G. (1999). Location and dynamics of the Antarctic Polar Front from satellite sea surface temperature data PF returns to a preferred -9 m -1 s -1 despite large latitudinal, Journal of Geophysical Research 104, 3059–3073.
Nel, D. C., Ryan, P. G., Nel, J. L., Klages, N. T. W., Wilson, R. P., Robertson, G., and Tuck, G. N. (2002). Foraging interactions between Wandering Albatrosses Diomedea exulans breeding on Marion Island and long-line fisheries in the southern Indian Ocean. Ibis 144: E141-E154.
Nemoto, T., Okiyama, M., and Takahashi, M. (1985). Aspects of the roles of squid in food chains of marine Antarctic ecosystems. In ‘‘Antartic Nutrient Cycles and Food Webs’’ (W. R. Siegfried, P. R. Condy and R. M. Laws, eds.), pp. 415–420. Springer-Verlag, Berlin Heidelberg.
Nemoto, T., Okiyama, M., Iwasaki, N., and Kikuchi, N. (1988). Squid as predators of krill
(Euphausia superba) and prey for sperm whales in the Southern Ocean. In ‘‘Antarctic Ocean and Resource Variability’’ (D. Sahrhage, ed.), pp. 292–296. Springer-Verlag, Berlin Heidleberg.
Orsi, A., Whitworth, T., & Nowlin, W. (1995). On the meridional extent and fronts of the Antarctic Circumpolar Current. Deep Sea Research Part I: …. Retrieved from http://www.sciencedirect.com/science/article/pii/096706379500021W
Park Y. H, Gambéroni L, Charriaud E (1991). Frontal structure and transport of the antarctic circumpolar current in the South Indian Ocean sector, 40º–80°E. Mar Chem 35:45–62
67
Park Y. H, Gambéroni L (1997). Cross-frontal exchange of antarctic intermediate water and antarctic bottom water in the Crozet Basin. Deep Sea Res II 44:963–986
Pauly, D., Trites, A. W., Capuli, E., & Christensen, V. (1998). Diet composition and trophic levels of marine mammals, ICES Journal of Marine Science, 55: 467–481.
Prince P. A., Morgan R. A. (1987). Diet and feeding ecology of Procellariiformes. In: Croxall JP (ed) Seabirds: Feeding Ecology and Role in Marine Ecosystems. Cambridge University Press, 226 Cambridge, pp 135-171
Prince P. A, Croxall J. P, Trathan P. N, Wood A. G (1998). The pelagic distribution of South Georgia albatrosses and their relationships with fisheries. In: Robertson G, Gales R (eds) Albatross Biology and Conservation. Surrey Beatty & Sons, Chipping Norton, Australia, pp 137-167
Ridoux, V. (1994). The diets and dietary segregation of seabirds at the subantarctic Crozet Islands. Marine Ornithology. Retrieved from http://www.marineornithology.org/PDF/22/MO_1994_01b.pdf
Rodhouse P. G. (1990). Cephalopod fauna of the Scotia Sea at South Georgia: potential for commercial exploitation and possible consequences. In: Kerry KR, Hempel G (eds) Antarctic ecosystems: ecological change and conservation. Springer-Verlag, Berlin, pp 289-298
Rodhouse P. G. (1998) .Large and meso-scale distribution of the ommastrephid squid Martialia hyadesi in the Southern Ocean: a synthesis of information relevant to fishery forecasting and management. Korean Journal of Polar Research 8: 145-154
Rodhouse, P. G., & White, M. G. (1995). Cephalopods Occupy the Ecological Niche of Epipelagic Fish in the Antarctic Polar Frontal Zone. Biological Bulletin, 189(2), 77. doi:10.2307/1542457
Rodhouse, P. G., and Boyle, P. R. (2010). Large aggregations of pelagic squid near the ocean surface at the Antarctic Polar Front, and their capture by grey-headed albatrosses. – ICES Journal of Marine Science, 67: 1432–1435.
Rodhouse, P. G., Clarke, M. R., and Murray, A. W. A. (1987). Cephalopod prey of the wandering albatross Diomedea exulans. Marine Biology 96, 1–10.
Rodhouse, P., White, M., & Jones, M. (1992). Trophic relations of the cephalopod Martialia hyadesi (Teuthoidea: Ommastrephidae) at the Antarctic Polar Front, Scotia Sea. Marine Biology, 421, 415–421. Retrieved from http://www.springerlink.com/index/WX182Q47325670U0.pdf
Rodhouse P. G., Prince P. A., Trathan P. N., Hatfield E. M. C., Watkins J. L., Bone D. G., Murphy E. J., White M. G. (1996) Cephalopods and mesoscale oceanography at the
68
Antarctic Polar Front: satellite tracked predators locate pelagic trophic interactions. Marine Ecology Progress Series 136: 37-50
Roper, C. F. E., & Vecchione, M. (1997). In situ observations test hypotheses of functional morphology in Mastigoteuthis (Cephalopoda, Oegopsida). Vie et milieu. Retrieved from http://cat.inist.fr/?aModele=afficheN&cpsidt=2744023
Sackett W. M., B. J. Eadie and M. E. Exner (1973) Stable isotope composition of organic carbon in recent antarctic sediments. Advances in Organic Geochemistry, 661-671,
Sarmiento, J. L., Gruber, N., Brzezinski, M. A., & Dunne, J. P. (2004). High-latitude controls of thermocline nutrients and low latitude biological productivity, Nature 427, 56-60(January). doi:10.1038/nature02204.1.
Stowasser, G., Atkinson, A., McGill, R. a. R. A. R., Phillips, R. a. A., Collins, M. a. A., & Pond, D. W. W. (2012). Food web dynamics in the Scotia Sea in summer: A stable isotope study. Deep Sea Research Part II: Topical Studies in Oceanography, 59-60, 208–221. doi:10.1016/j.dsr2.2011.08.004
Sutherland, K. R., Madin, L. P., Stocker, R., (2010). Filtration of submicrometer particles by pelagic tunicates. Proceedings of the National Academy of Sciences of the United States of America 107 (34), 15129–15134.
Tickel, W. L. N. (2000) ALBATROSSES. Pica Press, East Essex, UK. pp448.
Thompson K.R. (1994). Predation on Gonatus antarcticus by Falkland Islands seabirds. In Rodhouse, P.G., Piatkowski, U. & Lu, C.C. eds, Southern Ocean cephalopods: life cycles and populations. Antarctic Science, 6, 269-274.
Trathan PN, Brandon MA, Murphy EJ (1997). Characterization of the Antarctic Polar Frontal Zone to the north of South Georgia in summer 1994. Journal of Geophysical Research 102: 10483-10497
von Harbou, L., Dubischar, C. D., Pakhomov, E. A., Hunt, B. P. V., Hagen, W., Bath- mann, U. V., (2011). Salps in the Lazarev Sea, Southern Ocean: I. Feeding dynamics. Marine Biology. /http://dx.doi.org/10.1007/s00227-011-1709-4S.
VOSS, N. A., NESIS, K. N., & RODHOUSE, P. G. (1998). THE CEPHALOPOD FAMILY HISTIOTEUTHIDAE (OEGOPSIDA) : SYSTEMATICS, BIOLOGY, AND BIOGEOGRAPHY. Smithsonian contributions to zoology, (586), 293–372. Retrieved from http://cat.inist.fr/?aModele=afficheN&cpsidt=10607293
Voss, N. (1980). A generic revision of the Cranchiidae (Cephalopoda; Oegopsida). Bulletin of Marine Science, 30(2), 365–412. Retrieved from http://www.ingentaconnect.com/content/umrsmas/bullmar/1980/00000030/00000002/art00003
69
Wada, E., Terazaki, M., Kabaya, Y., & Nemoto, T. (1987). 1997. 15N and 13C abundances in the Antarctic Ocean with emphasis on the biogeochemical structure of the food web. Deep Sea Research, 34, 829–841. Retrieved from http://scholar.google.com/scholar?hl=en&btnG=Search&q=intitle:15N+and+13C+abundances+in+the+Antarctic+Ocean+with+emphasis+on+the+biogeochemical+structure+of+the+food+web#0
Weimerskirch, H, Guionnet, T., Martin, J., Shaffer, S. a, & Costa, D. P. (2000). Fast and fuel efficient? Optimal use of wind by flying albatrosses. Proceedings. Biological sciences / The Royal Society, 267(1455), 1869–74. doi:10.1098/rspb.2000.1223
Weimerskirch, H., Salamolard, M., Sarrazin, F., and Jouventin, P. (1993). Foraging strategies of wandering albatrosses through the breeding season - a study using satellite telemetry. Auk 110: 325-342.
Weimerskirch, H., Brothers, N., and Jouventin, P. 1997. Population dynamics of wandering albatross Diomedea exulans and Amsterdam albatross D-amsterdamensis in the Indian Ocean and their relationships with long-line fisheries: Conservation implications. Biological Conservation 79: 257-270.
Weimerskirch, H., 1998. Foraging strategies of Indian Ocean albatrosses and their relationship with fishereis, in Albatross Biology and Conservation, G. Robertson and R. Gales (Eds). Surrey Beatty and Sons Pty Ltd: Chipping Norton. 196-179.
Weimerskirch, Henri, Cherel, Y., & Gault, A. (2005). PREY DISTRIBUTION AND PATCHINESS : FACTORS IN FORAGING. Ecology, 86(10), 2611–2622.
Xavier, J C, Rodhousel, P. G., Trathani, P. N., & Wood, A. G. (1999). Short note A Geographical Information System ( GIS ) Atlas of cephalopod distribution in the Southern Ocean, Cambridge Univ. Press 11(I), 61–62.
Xavier, J C, & Trathan, P. N. (2004). Foraging ecology and interactions with fisheries of wandering albatrosses ( Diomedea exulans ) breeding at South Georgia, Fisheries oceanography, V 13, issue 5, 324–344.
Xavier, J. C. (2003a). Inter-annual variation in the cephalopod component of the diet of the wandering albatross , Diomedea exulans. Marine Biology: Volume 142, ed 3 , 611-622 doi:10.1007/s00227-002-0962-y
Xavier, J. C., Croxall, J. P., Trathan, P. N., and Wood, A. G. (2003b). Feeding strategies and diets of breeding grey-headed and wandering albatrosses at South Georgia. Marine Biology 143, 221–232.
Xavier, J. C., & Croxall, J. P. (2007). Predatorâ “prey interactions: why do larger albatrosses eat bigger squid? Journal of Zoology, 271(4), 408–417. doi:10.1111/j.1469-7998.2006.00224.x
70
Xavier JC, Cherel Y (2009) Cephalopod Beak Guide For The Southern Ocean. British Antarctic Survey, Cambridge, UK. 129pp.
Xavier, J. C., Phillips, R. a., & Cherel, Y. (2011). Cephalopods in marine predator diet assessments: why identifying upper and lower beaks is important. ICES Journal of Marine Science, 68(9), 1857–1864. doi:10.1093/icesjms/fsr103
Xavier, J. C., Wood, a. G., Rodhouse, P. G., & Croxall, J. P. (2007). Interannual variations in cephalopod consumption by albatrosses at South Georgia: implications for future commercial exploitation of cephalopods. Marine and Freshwater Research, 58(12), 1136. doi:10.1071/MF06237
Xavier, J., M.R. Clarke, M.C. Magalhães, G. Stowasser, C. Blanco & Y. Cherel.(2007b) Current status of using beaks to identify cephalopods: III International Workshop and training course on Cephalopod beaks, Faial island, Azores, April 2007. Arquipélago. Life and Marine Sciences 24: 41-48.
Xavier, J., Croxall, J., Cresswell, K., & Burger, A. (2005). Boluses: An effective method for assessing the proportions of cephalopods in the diet of albatrosses. The Auk, 122(4), 1182–1190. Retrieved from http://www.bioone.org/doi/abs/10.1642/0004-8038(2005)122%5B1182:BAEMFA%5D2.0.CO%3B2
Xavier, J .C., Cherel, Y., Roberts, J. & Piatkowski, U. (2012). How do cephalopods become available to flying seabirds: Can fish gut contents from tuna fishing vessels be a major food source of deep-dwelling cephalopods? ICES Journal of Marine Science (in press)
71
7. ANNEXS
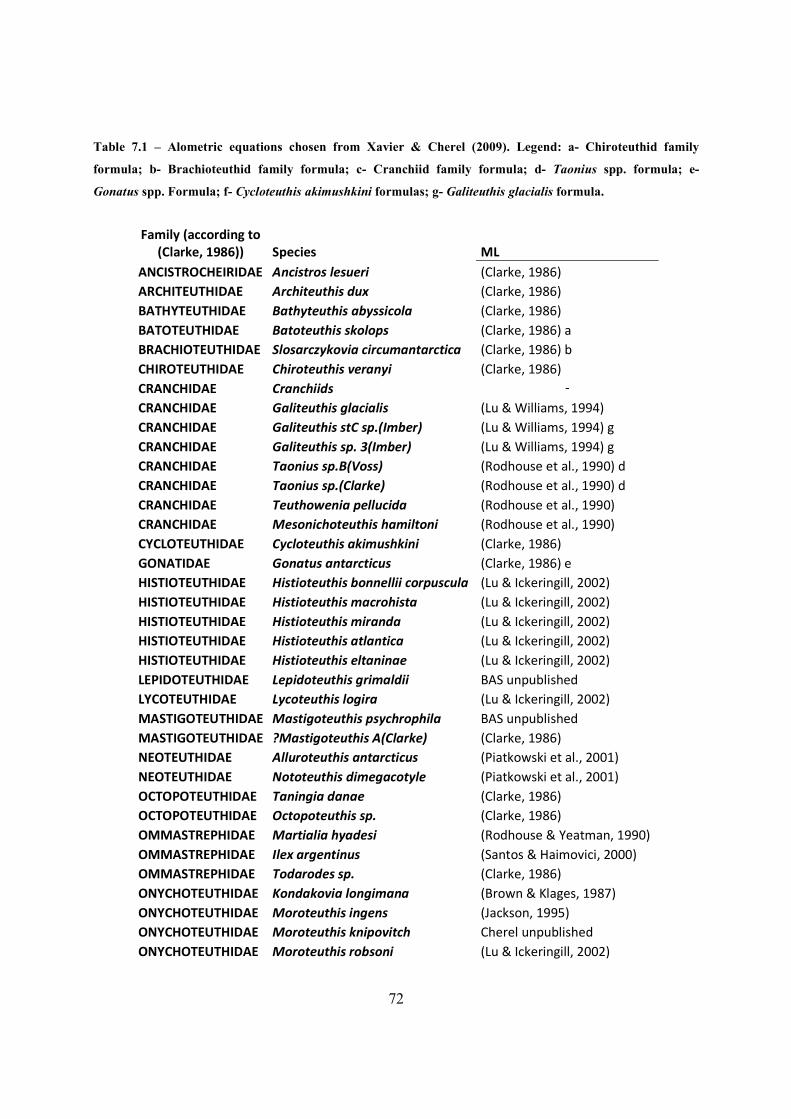
72
Table 7.1 – Alometric equations chosen from Xavier & Cherel (2009). Legend: a- Chiroteuthid family
formula; b- Brachioteuthid family formula; c- Cranchiid family formula; d- Taonius spp. formula; e-
Gonatus spp. Formula; f- Cycloteuthis akimushkini formulas; g- Galiteuthis glacialis formula.
Family (according to
(Clarke, 1986)) Species ML
ANCISTROCHEIRIDAE Ancistros lesueri (Clarke, 1986)
ARCHITEUTHIDAE Architeuthis dux (Clarke, 1986)
BATHYTEUTHIDAE Bathyteuthis abyssicola (Clarke, 1986)
BATOTEUTHIDAE Batoteuthis skolops (Clarke, 1986) a
BRACHIOTEUTHIDAE Slosarczykovia circumantarctica (Clarke, 1986) b
CHIROTEUTHIDAE Chiroteuthis veranyi (Clarke, 1986)
CRANCHIDAE Cranchiids -
CRANCHIDAE Galiteuthis glacialis (Lu & Williams, 1994)
CRANCHIDAE Galiteuthis stC sp.(Imber) (Lu & Williams, 1994) g
CRANCHIDAE Galiteuthis sp. 3(Imber) (Lu & Williams, 1994) g
CRANCHIDAE Taonius sp.B(Voss) (Rodhouse et al., 1990) d
CRANCHIDAE Taonius sp.(Clarke) (Rodhouse et al., 1990) d
CRANCHIDAE Teuthowenia pellucida (Rodhouse et al., 1990)
CRANCHIDAE Mesonichoteuthis hamiltoni (Rodhouse et al., 1990)
CYCLOTEUTHIDAE Cycloteuthis akimushkini (Clarke, 1986)
GONATIDAE Gonatus antarcticus (Clarke, 1986) e
HISTIOTEUTHIDAE Histioteuthis bonnellii corpuscula (Lu & Ickeringill, 2002)
HISTIOTEUTHIDAE Histioteuthis macrohista (Lu & Ickeringill, 2002)
HISTIOTEUTHIDAE Histioteuthis miranda (Lu & Ickeringill, 2002)
HISTIOTEUTHIDAE Histioteuthis atlantica (Lu & Ickeringill, 2002)
HISTIOTEUTHIDAE Histioteuthis eltaninae (Lu & Ickeringill, 2002)
LEPIDOTEUTHIDAE Lepidoteuthis grimaldii BAS unpublished
LYCOTEUTHIDAE Lycoteuthis logira (Lu & Ickeringill, 2002)
MASTIGOTEUTHIDAE Mastigoteuthis psychrophila BAS unpublished
MASTIGOTEUTHIDAE ?Mastigoteuthis A(Clarke) (Clarke, 1986)
NEOTEUTHIDAE Alluroteuthis antarcticus (Piatkowski et al., 2001)
NEOTEUTHIDAE Nototeuthis dimegacotyle (Piatkowski et al., 2001)
OCTOPOTEUTHIDAE Taningia danae (Clarke, 1986)
OCTOPOTEUTHIDAE Octopoteuthis sp. (Clarke, 1986)
OMMASTREPHIDAE Martialia hyadesi (Rodhouse & Yeatman, 1990)
OMMASTREPHIDAE Ilex argentinus (Santos & Haimovici, 2000)
OMMASTREPHIDAE Todarodes sp. (Clarke, 1986)
ONYCHOTEUTHIDAE Kondakovia longimana (Brown & Klages, 1987)
ONYCHOTEUTHIDAE Moroteuthis ingens (Jackson, 1995)
ONYCHOTEUTHIDAE Moroteuthis knipovitch Cherel unpublished
ONYCHOTEUTHIDAE Moroteuthis robsoni (Lu & Ickeringill, 2002)
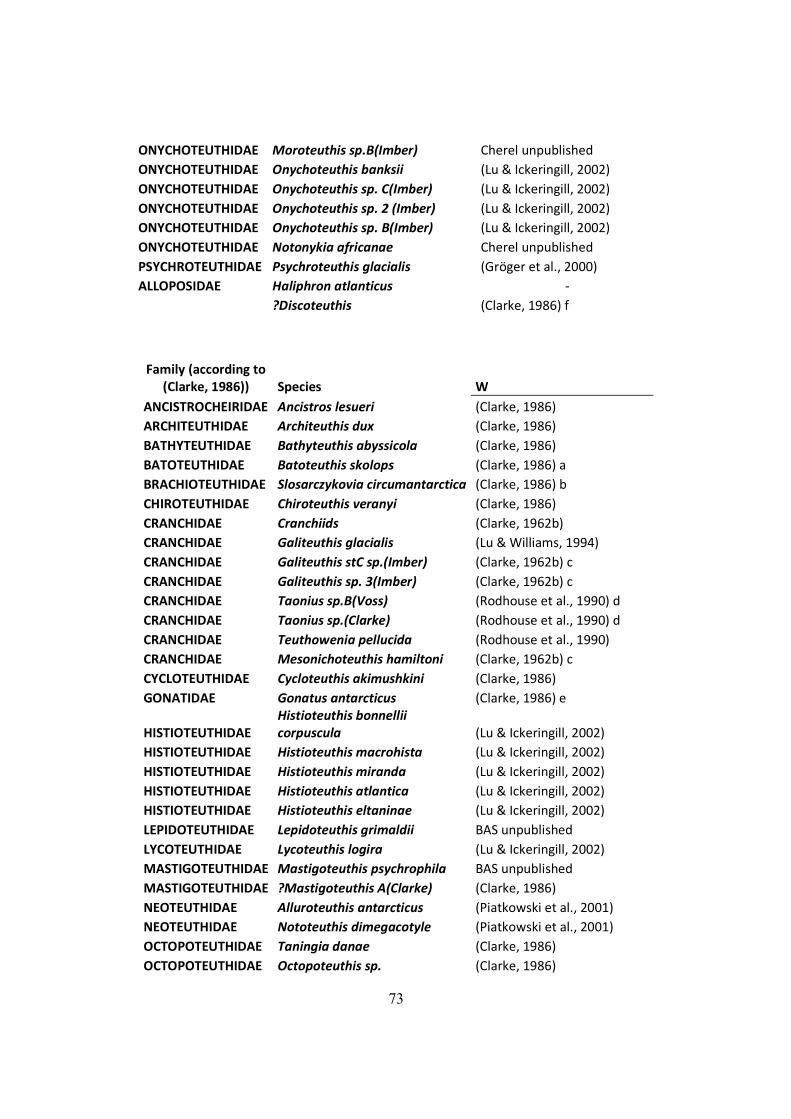
73
ONYCHOTEUTHIDAE Moroteuthis sp.B(Imber) Cherel unpublished
ONYCHOTEUTHIDAE Onychoteuthis banksii (Lu & Ickeringill, 2002)
ONYCHOTEUTHIDAE Onychoteuthis sp. C(Imber) (Lu & Ickeringill, 2002)
ONYCHOTEUTHIDAE Onychoteuthis sp. 2 (Imber) (Lu & Ickeringill, 2002)
ONYCHOTEUTHIDAE Onychoteuthis sp. B(Imber) (Lu & Ickeringill, 2002)
ONYCHOTEUTHIDAE Notonykia africanae Cherel unpublished
PSYCHROTEUTHIDAE Psychroteuthis glacialis (Gröger et al., 2000)
ALLOPOSIDAE Haliphron atlanticus -
?Discoteuthis (Clarke, 1986) f
Family (according to
(Clarke, 1986)) Species W
ANCISTROCHEIRIDAE Ancistros lesueri (Clarke, 1986)
ARCHITEUTHIDAE Architeuthis dux (Clarke, 1986)
BATHYTEUTHIDAE Bathyteuthis abyssicola (Clarke, 1986)
BATOTEUTHIDAE Batoteuthis skolops (Clarke, 1986) a
BRACHIOTEUTHIDAE Slosarczykovia circumantarctica (Clarke, 1986) b
CHIROTEUTHIDAE Chiroteuthis veranyi (Clarke, 1986)
CRANCHIDAE Cranchiids (Clarke, 1962b)
CRANCHIDAE Galiteuthis glacialis (Lu & Williams, 1994)
CRANCHIDAE Galiteuthis stC sp.(Imber) (Clarke, 1962b) c
CRANCHIDAE Galiteuthis sp. 3(Imber) (Clarke, 1962b) c
CRANCHIDAE Taonius sp.B(Voss) (Rodhouse et al., 1990) d
CRANCHIDAE Taonius sp.(Clarke) (Rodhouse et al., 1990) d
CRANCHIDAE Teuthowenia pellucida (Rodhouse et al., 1990)
CRANCHIDAE Mesonichoteuthis hamiltoni (Clarke, 1962b) c
CYCLOTEUTHIDAE Cycloteuthis akimushkini (Clarke, 1986)
GONATIDAE Gonatus antarcticus (Clarke, 1986) e
HISTIOTEUTHIDAE
Histioteuthis bonnellii
corpuscula (Lu & Ickeringill, 2002)
HISTIOTEUTHIDAE Histioteuthis macrohista (Lu & Ickeringill, 2002)
HISTIOTEUTHIDAE Histioteuthis miranda (Lu & Ickeringill, 2002)
HISTIOTEUTHIDAE Histioteuthis atlantica (Lu & Ickeringill, 2002)
HISTIOTEUTHIDAE Histioteuthis eltaninae (Lu & Ickeringill, 2002)
LEPIDOTEUTHIDAE Lepidoteuthis grimaldii BAS unpublished
LYCOTEUTHIDAE Lycoteuthis logira (Lu & Ickeringill, 2002)
MASTIGOTEUTHIDAE Mastigoteuthis psychrophila BAS unpublished
MASTIGOTEUTHIDAE ?Mastigoteuthis A(Clarke) (Clarke, 1986)
NEOTEUTHIDAE Alluroteuthis antarcticus (Piatkowski et al., 2001)
NEOTEUTHIDAE Nototeuthis dimegacotyle (Piatkowski et al., 2001)
OCTOPOTEUTHIDAE Taningia danae (Clarke, 1986)
OCTOPOTEUTHIDAE Octopoteuthis sp. (Clarke, 1986)
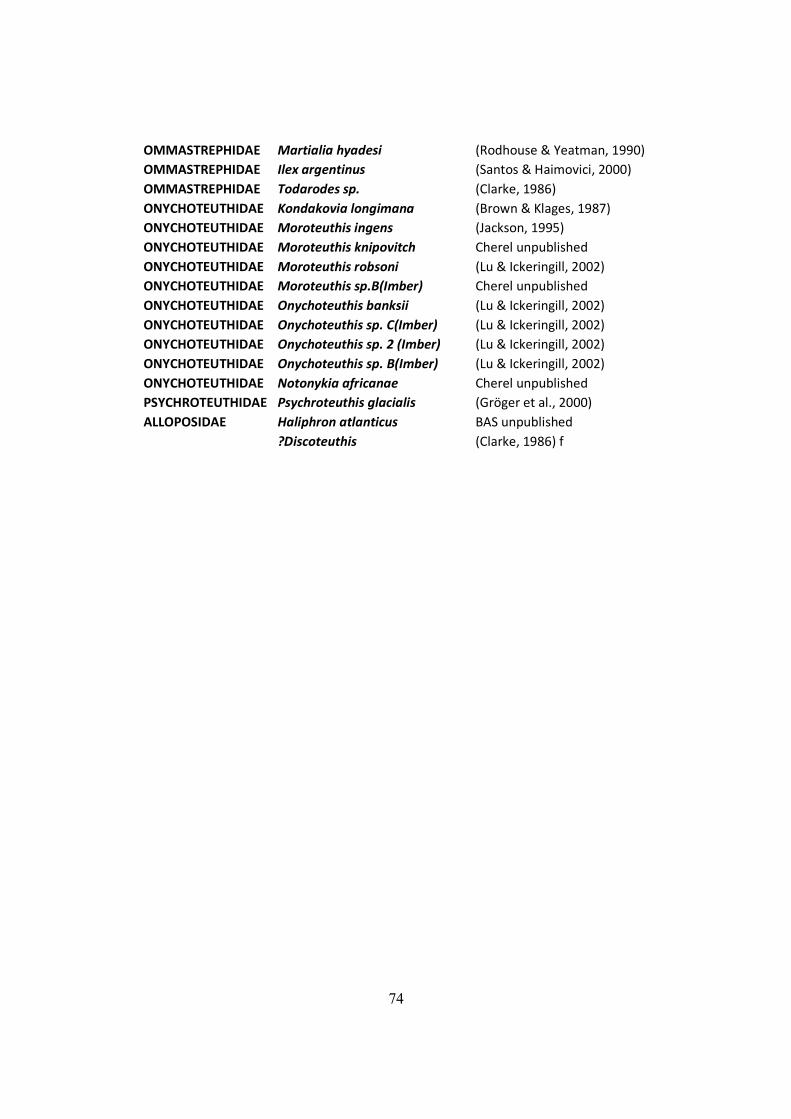
74
OMMASTREPHIDAE Martialia hyadesi (Rodhouse & Yeatman, 1990)
OMMASTREPHIDAE Ilex argentinus (Santos & Haimovici, 2000)
OMMASTREPHIDAE Todarodes sp. (Clarke, 1986)
ONYCHOTEUTHIDAE Kondakovia longimana (Brown & Klages, 1987)
ONYCHOTEUTHIDAE Moroteuthis ingens (Jackson, 1995)
ONYCHOTEUTHIDAE Moroteuthis knipovitch Cherel unpublished
ONYCHOTEUTHIDAE Moroteuthis robsoni (Lu & Ickeringill, 2002)
ONYCHOTEUTHIDAE Moroteuthis sp.B(Imber) Cherel unpublished
ONYCHOTEUTHIDAE Onychoteuthis banksii (Lu & Ickeringill, 2002)
ONYCHOTEUTHIDAE Onychoteuthis sp. C(Imber) (Lu & Ickeringill, 2002)
ONYCHOTEUTHIDAE Onychoteuthis sp. 2 (Imber) (Lu & Ickeringill, 2002)
ONYCHOTEUTHIDAE Onychoteuthis sp. B(Imber) (Lu & Ickeringill, 2002)
ONYCHOTEUTHIDAE Notonykia africanae Cherel unpublished
PSYCHROTEUTHIDAE Psychroteuthis glacialis (Gröger et al., 2000)
ALLOPOSIDAE Haliphron atlanticus BAS unpublished
?Discoteuthis (Clarke, 1986) f
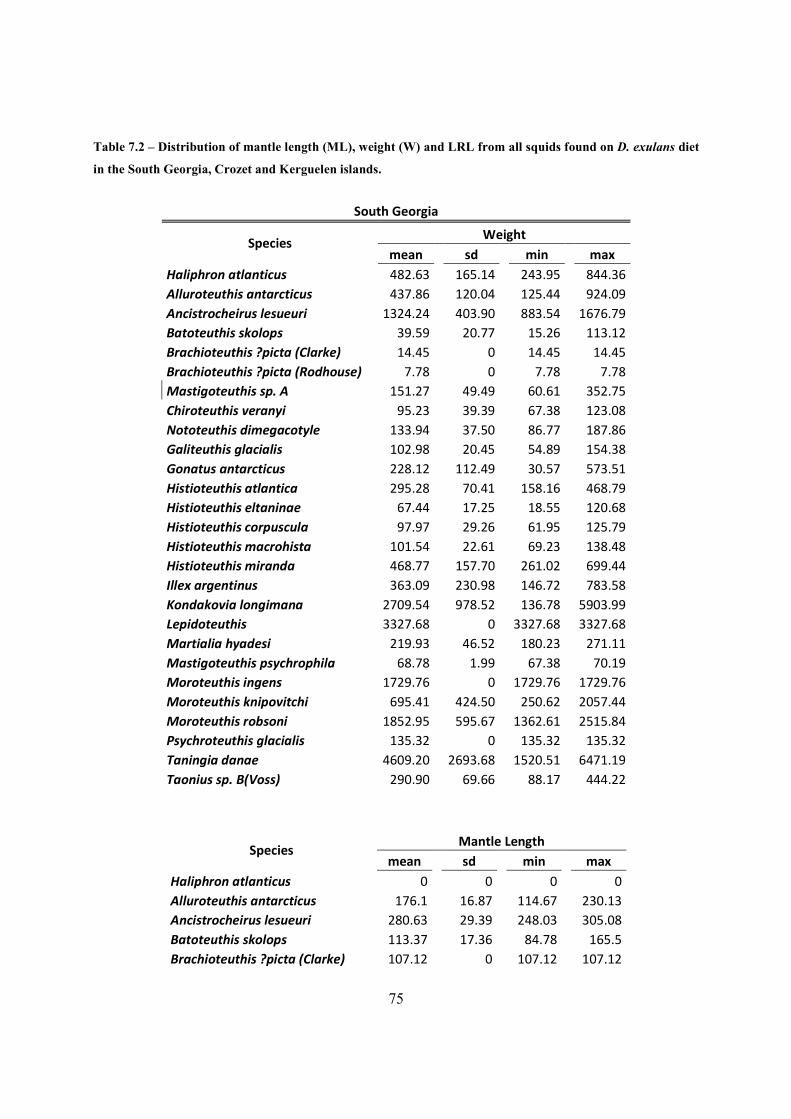
75
Table 7.2 – Distribution of mantle length (ML), weight (W) and LRL from all squids found on D. exulans diet
in the South Georgia, Crozet and Kerguelen islands.
South Georgia
Species Weight
mean
sd
min
max
Haliphron atlanticus 482.63
165.14
243.95
844.36
Alluroteuthis antarcticus 437.86
120.04
125.44
924.09
Ancistrocheirus lesueuri 1324.24
403.90
883.54
1676.79
Batoteuthis skolops 39.59
20.77
15.26
113.12
Brachioteuthis ?picta (Clarke) 14.45
0
14.45
14.45
Brachioteuthis ?picta (Rodhouse) 7.78
0
7.78
7.78
Mastigoteuthis sp. A 151.27
49.49
60.61
352.75
Chiroteuthis veranyi 95.23
39.39
67.38
123.08
Nototeuthis dimegacotyle 133.94
37.50
86.77
187.86
Galiteuthis glacialis 102.98
20.45
54.89
154.38
Gonatus antarcticus 228.12
112.49
30.57
573.51
Histioteuthis atlantica 295.28
70.41
158.16
468.79
Histioteuthis eltaninae 67.44
17.25
18.55
120.68
Histioteuthis corpuscula 97.97
29.26
61.95
125.79
Histioteuthis macrohista 101.54
22.61
69.23
138.48
Histioteuthis miranda 468.77
157.70
261.02
699.44
Illex argentinus 363.09
230.98
146.72
783.58
Kondakovia longimana 2709.54
978.52
136.78
5903.99
Lepidoteuthis 3327.68
0
3327.68
3327.68
Martialia hyadesi 219.93
46.52
180.23
271.11
Mastigoteuthis psychrophila 68.78
1.99
67.38
70.19
Moroteuthis ingens 1729.76
0
1729.76
1729.76
Moroteuthis knipovitchi 695.41
424.50
250.62
2057.44
Moroteuthis robsoni 1852.95
595.67
1362.61
2515.84
Psychroteuthis glacialis 135.32
0
135.32
135.32
Taningia danae 4609.20
2693.68
1520.51
6471.19
Taonius sp. B(Voss) 290.90
69.66
88.17
444.22
Species Mantle Length
mean
sd
min
max
Haliphron atlanticus 0
0
0
0
Alluroteuthis antarcticus 176.1
16.87
114.67
230.13
Ancistrocheirus lesueuri 280.63
29.39
248.03
305.08
Batoteuthis skolops 113.37
17.36
84.78
165.5
Brachioteuthis ?picta (Clarke) 107.12
0
107.12
107.12
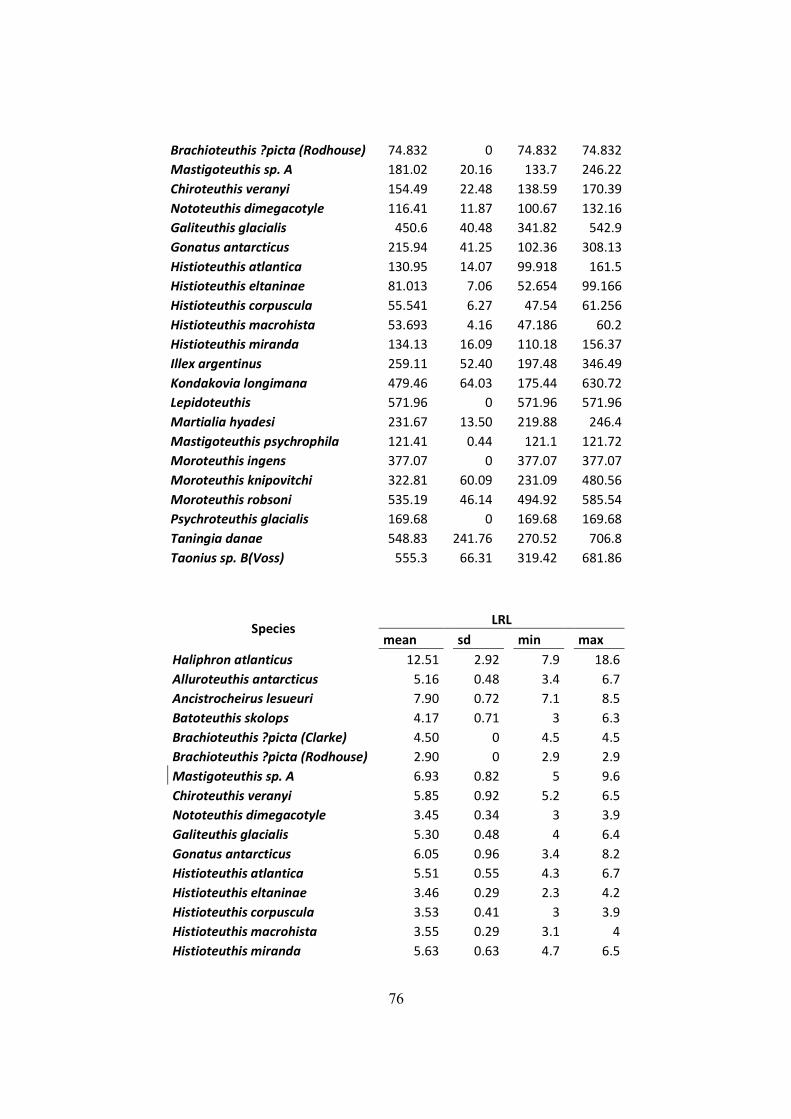
76
Brachioteuthis ?picta (Rodhouse) 74.832
0
74.832
74.832
Mastigoteuthis sp. A 181.02
20.16
133.7
246.22
Chiroteuthis veranyi 154.49
22.48
138.59
170.39
Nototeuthis dimegacotyle 116.41
11.87
100.67
132.16
Galiteuthis glacialis 450.6
40.48
341.82
542.9
Gonatus antarcticus 215.94
41.25
102.36
308.13
Histioteuthis atlantica 130.95
14.07
99.918
161.5
Histioteuthis eltaninae 81.013
7.06
52.654
99.166
Histioteuthis corpuscula 55.541
6.27
47.54
61.256
Histioteuthis macrohista 53.693
4.16
47.186
60.2
Histioteuthis miranda 134.13
16.09
110.18
156.37
Illex argentinus 259.11
52.40
197.48
346.49
Kondakovia longimana 479.46
64.03
175.44
630.72
Lepidoteuthis 571.96
0
571.96
571.96
Martialia hyadesi 231.67
13.50
219.88
246.4
Mastigoteuthis psychrophila 121.41
0.44
121.1
121.72
Moroteuthis ingens 377.07
0
377.07
377.07
Moroteuthis knipovitchi 322.81
60.09
231.09
480.56
Moroteuthis robsoni 535.19
46.14
494.92
585.54
Psychroteuthis glacialis 169.68
0
169.68
169.68
Taningia danae 548.83
241.76
270.52
706.8
Taonius sp. B(Voss) 555.3
66.31
319.42
681.86
Species LRL
mean
sd
min
max
Haliphron atlanticus 12.51
2.92
7.9
18.6
Alluroteuthis antarcticus 5.16
0.48
3.4
6.7
Ancistrocheirus lesueuri 7.90
0.72
7.1
8.5
Batoteuthis skolops 4.17
0.71
3
6.3
Brachioteuthis ?picta (Clarke) 4.50
0
4.5
4.5
Brachioteuthis ?picta (Rodhouse) 2.90
0
2.9
2.9
Mastigoteuthis sp. A 6.93
0.82
5
9.6
Chiroteuthis veranyi 5.85
0.92
5.2
6.5
Nototeuthis dimegacotyle 3.45
0.34
3
3.9
Galiteuthis glacialis 5.30
0.48
4
6.4
Gonatus antarcticus 6.05
0.96
3.4
8.2
Histioteuthis atlantica 5.51
0.55
4.3
6.7
Histioteuthis eltaninae 3.46
0.29
2.3
4.2
Histioteuthis corpuscula 3.53
0.41
3
3.9
Histioteuthis macrohista 3.55
0.29
3.1
4
Histioteuthis miranda 5.63
0.63
4.7
6.5
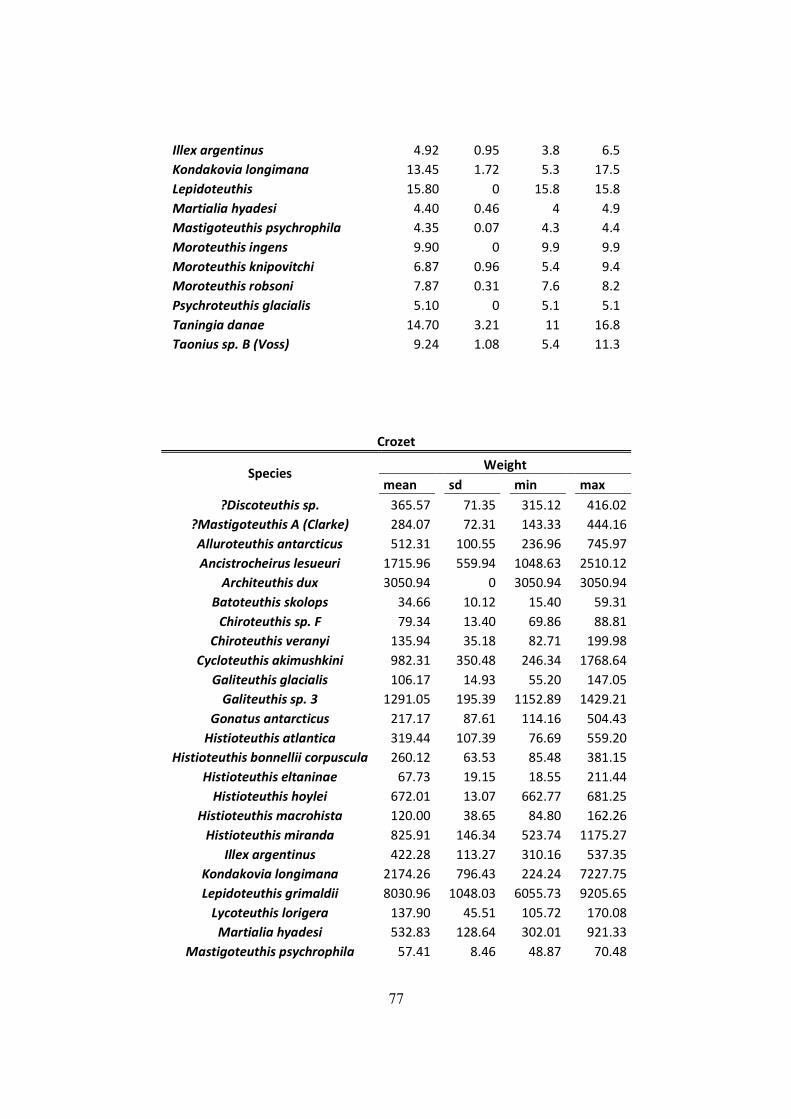
77
Illex argentinus 4.92
0.95
3.8
6.5
Kondakovia longimana 13.45
1.72
5.3
17.5
Lepidoteuthis 15.80
0
15.8
15.8
Martialia hyadesi 4.40
0.46
4
4.9
Mastigoteuthis psychrophila 4.35
0.07
4.3
4.4
Moroteuthis ingens 9.90
0
9.9
9.9
Moroteuthis knipovitchi 6.87
0.96
5.4
9.4
Moroteuthis robsoni 7.87
0.31
7.6
8.2
Psychroteuthis glacialis 5.10
0
5.1
5.1
Taningia danae 14.70
3.21
11
16.8
Taonius sp. B (Voss) 9.24
1.08
5.4
11.3
Crozet
Species Weight
mean
sd
min
max
?Discoteuthis sp. 365.57
71.35
315.12
416.02
?Mastigoteuthis A (Clarke) 284.07
72.31
143.33
444.16
Alluroteuthis antarcticus 512.31
100.55
236.96
745.97
Ancistrocheirus lesueuri 1715.96
559.94
1048.63
2510.12
Architeuthis dux 3050.94
0
3050.94
3050.94
Batoteuthis skolops 34.66
10.12
15.40
59.31
Chiroteuthis sp. F 79.34
13.40
69.86
88.81
Chiroteuthis veranyi 135.94
35.18
82.71
199.98
Cycloteuthis akimushkini 982.31
350.48
246.34
1768.64
Galiteuthis glacialis 106.17
14.93
55.20
147.05
Galiteuthis sp. 3 1291.05
195.39
1152.89
1429.21
Gonatus antarcticus 217.17
87.61
114.16
504.43
Histioteuthis atlantica 319.44
107.39
76.69
559.20
Histioteuthis bonnellii corpuscula 260.12
63.53
85.48
381.15
Histioteuthis eltaninae 67.73
19.15
18.55
211.44
Histioteuthis hoylei 672.01
13.07
662.77
681.25
Histioteuthis macrohista 120.00
38.65
84.80
162.26
Histioteuthis miranda 825.91
146.34
523.74
1175.27
Illex argentinus 422.28
113.27
310.16
537.35
Kondakovia longimana 2174.26
796.43
224.24
7227.75
Lepidoteuthis grimaldii 8030.96
1048.03
6055.73
9205.65
Lycoteuthis lorigera 137.90
45.51
105.72
170.08
Martialia hyadesi 532.83
128.64
302.01
921.33
Mastigoteuthis psychrophila 57.41
8.46
48.87
70.48
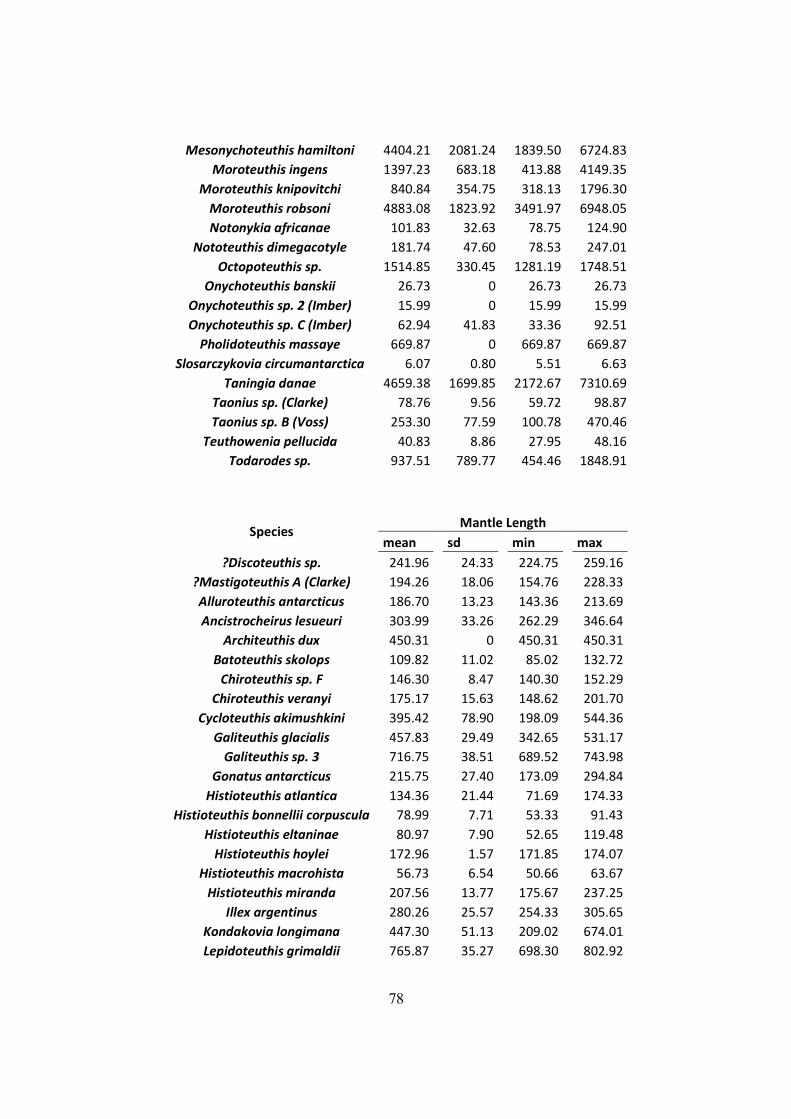
78
Mesonychoteuthis hamiltoni 4404.21
2081.24
1839.50
6724.83
Moroteuthis ingens 1397.23
683.18
413.88
4149.35
Moroteuthis knipovitchi 840.84
354.75
318.13
1796.30
Moroteuthis robsoni 4883.08
1823.92
3491.97
6948.05
Notonykia africanae 101.83
32.63
78.75
124.90
Nototeuthis dimegacotyle 181.74
47.60
78.53
247.01
Octopoteuthis sp. 1514.85
330.45
1281.19
1748.51
Onychoteuthis banskii 26.73
0
26.73
26.73
Onychoteuthis sp. 2 (Imber) 15.99
0
15.99
15.99
Onychoteuthis sp. C (Imber) 62.94
41.83
33.36
92.51
Pholidoteuthis massaye 669.87
0
669.87
669.87
Slosarczykovia circumantarctica 6.07
0.80
5.51
6.63
Taningia danae 4659.38
1699.85
2172.67
7310.69
Taonius sp. (Clarke) 78.76
9.56
59.72
98.87
Taonius sp. B (Voss) 253.30
77.59
100.78
470.46
Teuthowenia pellucida 40.83
8.86
27.95
48.16
Todarodes sp. 937.51
789.77
454.46
1848.91
Species Mantle Length
mean
sd
min
max
?Discoteuthis sp. 241.96
24.33
224.75
259.16
?Mastigoteuthis A (Clarke) 194.26
18.06
154.76
228.33
Alluroteuthis antarcticus 186.70
13.23
143.36
213.69
Ancistrocheirus lesueuri 303.99
33.26
262.29
346.64
Architeuthis dux 450.31
0
450.31
450.31
Batoteuthis skolops 109.82
11.02
85.02
132.72
Chiroteuthis sp. F 146.30
8.47
140.30
152.29
Chiroteuthis veranyi 175.17
15.63
148.62
201.70
Cycloteuthis akimushkini 395.42
78.90
198.09
544.36
Galiteuthis glacialis 457.83
29.49
342.65
531.17
Galiteuthis sp. 3 716.75
38.51
689.52
743.98
Gonatus antarcticus 215.75
27.40
173.09
294.84
Histioteuthis atlantica 134.36
21.44
71.69
174.33
Histioteuthis bonnellii corpuscula 78.99
7.71
53.33
91.43
Histioteuthis eltaninae 80.97
7.90
52.65
119.48
Histioteuthis hoylei 172.96
1.57
171.85
174.07
Histioteuthis macrohista 56.73
6.54
50.66
63.67
Histioteuthis miranda 207.56
13.77
175.67
237.25
Illex argentinus 280.26
25.57
254.33
305.65
Kondakovia longimana 447.30
51.13
209.02
674.01
Lepidoteuthis grimaldii 765.87
35.27
698.30
802.92
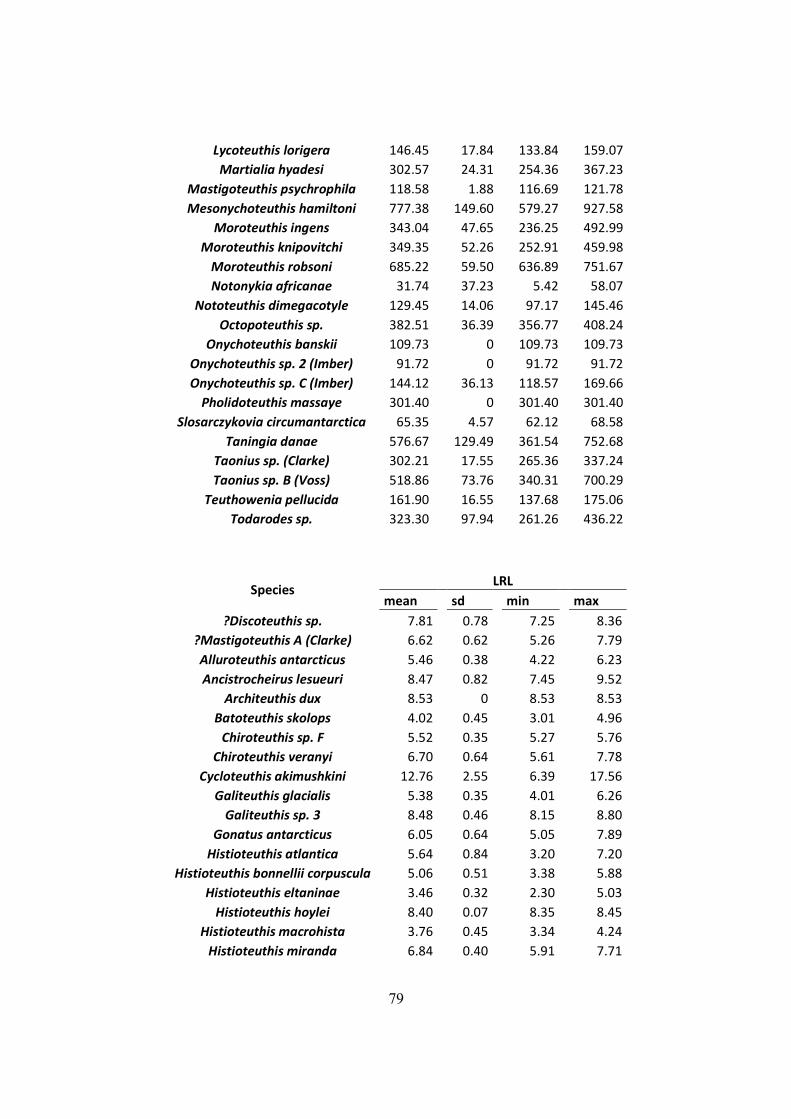
79
Lycoteuthis lorigera 146.45
17.84
133.84
159.07
Martialia hyadesi 302.57
24.31
254.36
367.23
Mastigoteuthis psychrophila 118.58
1.88
116.69
121.78
Mesonychoteuthis hamiltoni 777.38
149.60
579.27
927.58
Moroteuthis ingens 343.04
47.65
236.25
492.99
Moroteuthis knipovitchi 349.35
52.26
252.91
459.98
Moroteuthis robsoni 685.22
59.50
636.89
751.67
Notonykia africanae 31.74
37.23
5.42
58.07
Nototeuthis dimegacotyle 129.45
14.06
97.17
145.46
Octopoteuthis sp. 382.51
36.39
356.77
408.24
Onychoteuthis banskii 109.73
0
109.73
109.73
Onychoteuthis sp. 2 (Imber) 91.72
0
91.72
91.72
Onychoteuthis sp. C (Imber) 144.12
36.13
118.57
169.66
Pholidoteuthis massaye 301.40
0
301.40
301.40
Slosarczykovia circumantarctica 65.35
4.57
62.12
68.58
Taningia danae 576.67
129.49
361.54
752.68
Taonius sp. (Clarke) 302.21
17.55
265.36
337.24
Taonius sp. B (Voss) 518.86
73.76
340.31
700.29
Teuthowenia pellucida 161.90
16.55
137.68
175.06
Todarodes sp. 323.30
97.94
261.26
436.22
Species LRL
mean
sd
min
max
?Discoteuthis sp. 7.81
0.78
7.25
8.36
?Mastigoteuthis A (Clarke) 6.62
0.62
5.26
7.79
Alluroteuthis antarcticus 5.46
0.38
4.22
6.23
Ancistrocheirus lesueuri 8.47
0.82
7.45
9.52
Architeuthis dux 8.53
0
8.53
8.53
Batoteuthis skolops 4.02
0.45
3.01
4.96
Chiroteuthis sp. F 5.52
0.35
5.27
5.76
Chiroteuthis veranyi 6.70
0.64
5.61
7.78
Cycloteuthis akimushkini 12.76
2.55
6.39
17.56
Galiteuthis glacialis 5.38
0.35
4.01
6.26
Galiteuthis sp. 3 8.48
0.46
8.15
8.80
Gonatus antarcticus 6.05
0.64
5.05
7.89
Histioteuthis atlantica 5.64
0.84
3.20
7.20
Histioteuthis bonnellii corpuscula 5.06
0.51
3.38
5.88
Histioteuthis eltaninae 3.46
0.32
2.30
5.03
Histioteuthis hoylei 8.40
0.07
8.35
8.45
Histioteuthis macrohista 3.76
0.45
3.34
4.24
Histioteuthis miranda 6.84
0.40
5.91
7.71
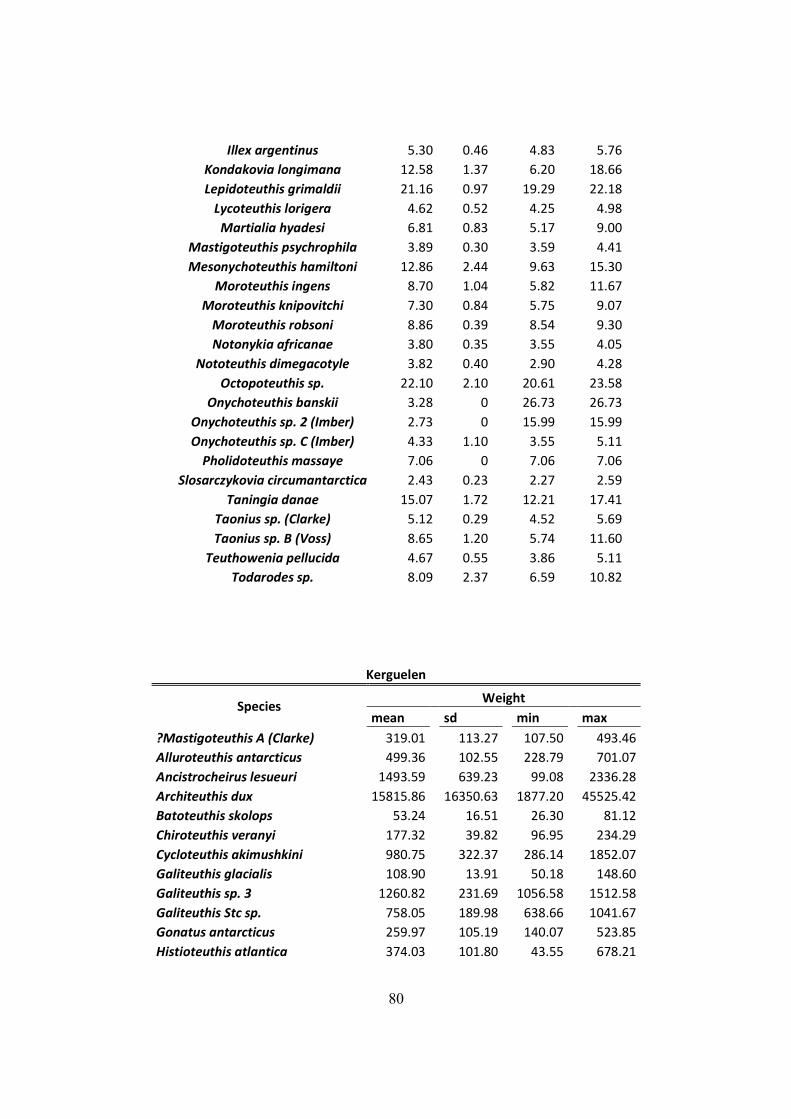
80
Illex argentinus 5.30
0.46
4.83
5.76
Kondakovia longimana 12.58
1.37
6.20
18.66
Lepidoteuthis grimaldii 21.16
0.97
19.29
22.18
Lycoteuthis lorigera 4.62
0.52
4.25
4.98
Martialia hyadesi 6.81
0.83
5.17
9.00
Mastigoteuthis psychrophila 3.89
0.30
3.59
4.41
Mesonychoteuthis hamiltoni 12.86
2.44
9.63
15.30
Moroteuthis ingens 8.70
1.04
5.82
11.67
Moroteuthis knipovitchi 7.30
0.84
5.75
9.07
Moroteuthis robsoni 8.86
0.39
8.54
9.30
Notonykia africanae 3.80
0.35
3.55
4.05
Nototeuthis dimegacotyle 3.82
0.40
2.90
4.28
Octopoteuthis sp. 22.10
2.10
20.61
23.58
Onychoteuthis banskii 3.28
0
26.73
26.73
Onychoteuthis sp. 2 (Imber) 2.73
0
15.99
15.99
Onychoteuthis sp. C (Imber) 4.33
1.10
3.55
5.11
Pholidoteuthis massaye 7.06
0
7.06
7.06
Slosarczykovia circumantarctica 2.43
0.23
2.27
2.59
Taningia danae 15.07
1.72
12.21
17.41
Taonius sp. (Clarke) 5.12
0.29
4.52
5.69
Taonius sp. B (Voss) 8.65
1.20
5.74
11.60
Teuthowenia pellucida 4.67
0.55
3.86
5.11
Todarodes sp. 8.09
2.37
6.59
10.82
Kerguelen
Species Weight
mean
sd
min
max
?Mastigoteuthis A (Clarke) 319.01
113.27
107.50
493.46
Alluroteuthis antarcticus 499.36
102.55
228.79
701.07
Ancistrocheirus lesueuri 1493.59
639.23
99.08
2336.28
Architeuthis dux 15815.86
16350.63
1877.20
45525.42
Batoteuthis skolops 53.24
16.51
26.30
81.12
Chiroteuthis veranyi 177.32
39.82
96.95
234.29
Cycloteuthis akimushkini 980.75
322.37
286.14
1852.07
Galiteuthis glacialis 108.90
13.91
50.18
148.60
Galiteuthis sp. 3 1260.82
231.69
1056.58
1512.58
Galiteuthis Stc sp. 758.05
189.98
638.66
1041.67
Gonatus antarcticus 259.97
105.19
140.07
523.85
Histioteuthis atlantica 374.03
101.80
43.55
678.21
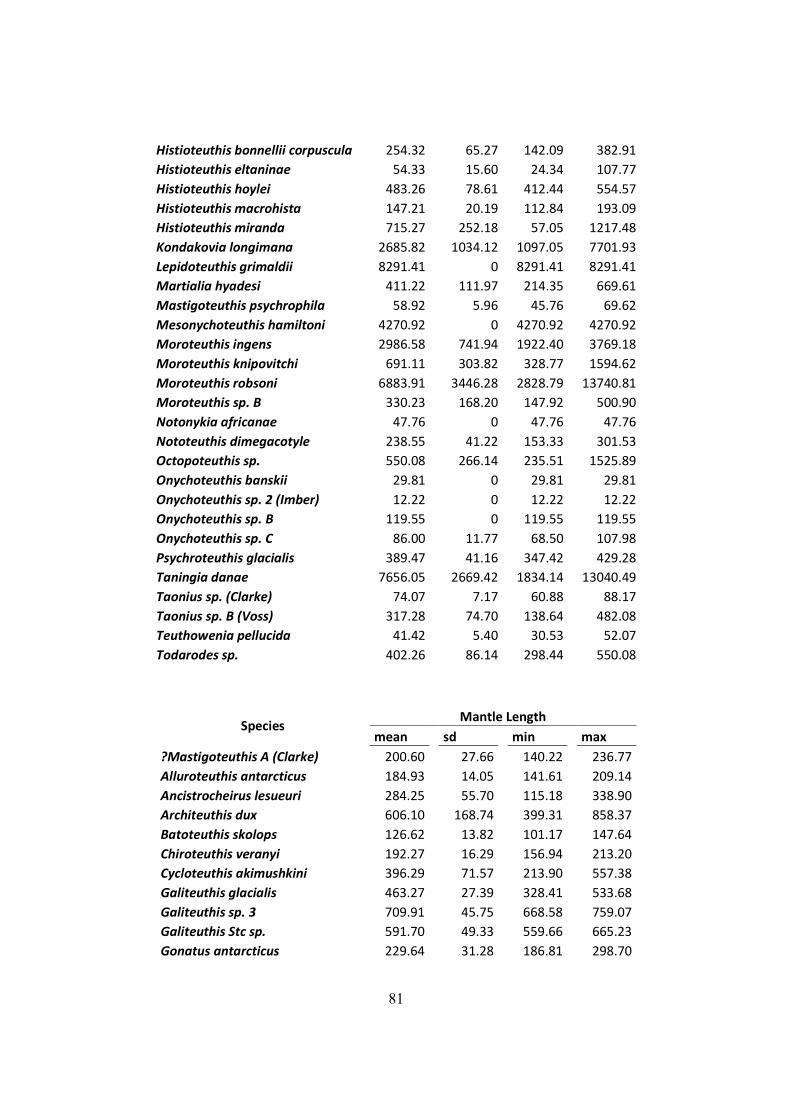
81
Histioteuthis bonnellii corpuscula 254.32
65.27
142.09
382.91
Histioteuthis eltaninae 54.33
15.60
24.34
107.77
Histioteuthis hoylei 483.26
78.61
412.44
554.57
Histioteuthis macrohista 147.21
20.19
112.84
193.09
Histioteuthis miranda 715.27
252.18
57.05
1217.48
Kondakovia longimana 2685.82
1034.12
1097.05
7701.93
Lepidoteuthis grimaldii 8291.41
0
8291.41
8291.41
Martialia hyadesi 411.22
111.97
214.35
669.61
Mastigoteuthis psychrophila 58.92
5.96
45.76
69.62
Mesonychoteuthis hamiltoni 4270.92
0
4270.92
4270.92
Moroteuthis ingens 2986.58
741.94
1922.40
3769.18
Moroteuthis knipovitchi 691.11
303.82
328.77
1594.62
Moroteuthis robsoni 6883.91
3446.28
2828.79
13740.81
Moroteuthis sp. B 330.23
168.20
147.92
500.90
Notonykia africanae 47.76
0
47.76
47.76
Nototeuthis dimegacotyle 238.55
41.22
153.33
301.53
Octopoteuthis sp. 550.08
266.14
235.51
1525.89
Onychoteuthis banskii 29.81
0
29.81
29.81
Onychoteuthis sp. 2 (Imber) 12.22
0
12.22
12.22
Onychoteuthis sp. B 119.55
0
119.55
119.55
Onychoteuthis sp. C 86.00
11.77
68.50
107.98
Psychroteuthis glacialis 389.47
41.16
347.42
429.28
Taningia danae 7656.05
2669.42
1834.14
13040.49
Taonius sp. (Clarke) 74.07
7.17
60.88
88.17
Taonius sp. B (Voss) 317.28
74.70
138.64
482.08
Teuthowenia pellucida 41.42
5.40
30.53
52.07
Todarodes sp. 402.26
86.14
298.44
550.08
Species Mantle Length
mean
sd
min
max
?Mastigoteuthis A (Clarke) 200.60
27.66
140.22
236.77
Alluroteuthis antarcticus 184.93
14.05
141.61
209.14
Ancistrocheirus lesueuri 284.25
55.70
115.18
338.90
Architeuthis dux 606.10
168.74
399.31
858.37
Batoteuthis skolops 126.62
13.82
101.17
147.64
Chiroteuthis veranyi 192.27
16.29
156.94
213.20
Cycloteuthis akimushkini 396.29
71.57
213.90
557.38
Galiteuthis glacialis 463.27
27.39
328.41
533.68
Galiteuthis sp. 3 709.91
45.75
668.58
759.07
Galiteuthis Stc sp. 591.70
49.33
559.66
665.23
Gonatus antarcticus 229.64
31.28
186.81
298.70
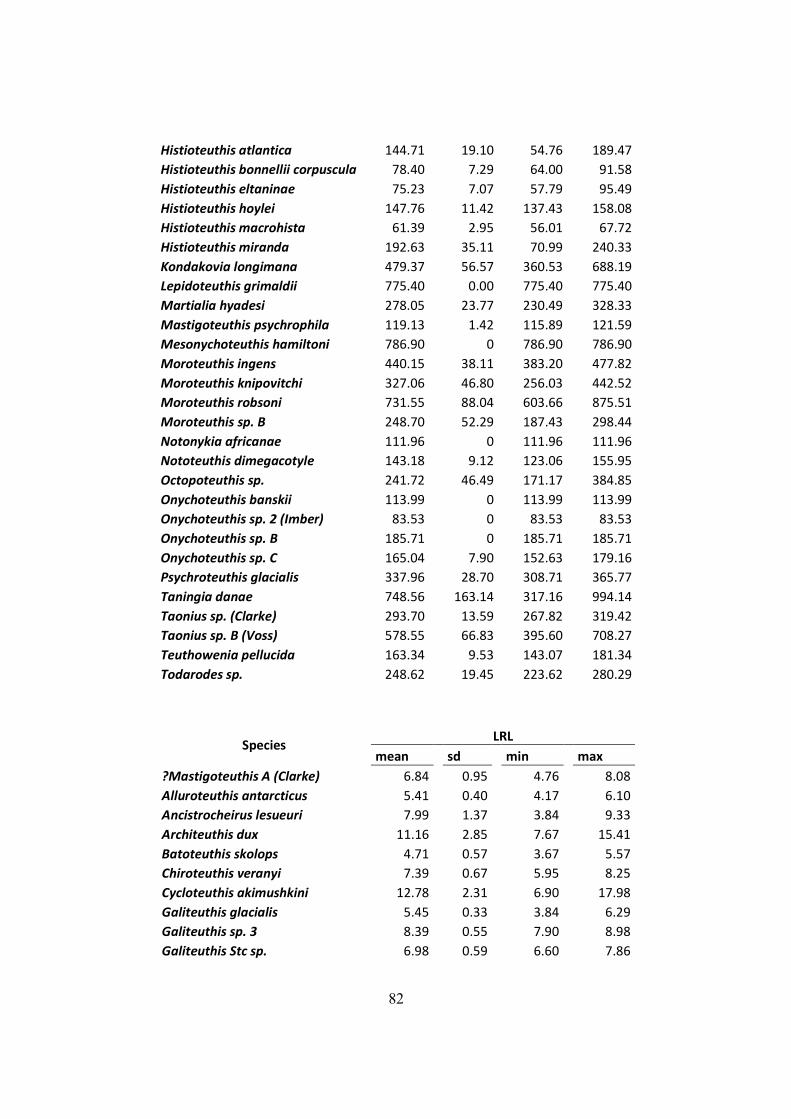
82
Histioteuthis atlantica 144.71
19.10
54.76
189.47
Histioteuthis bonnellii corpuscula 78.40
7.29
64.00
91.58
Histioteuthis eltaninae 75.23
7.07
57.79
95.49
Histioteuthis hoylei 147.76
11.42
137.43
158.08
Histioteuthis macrohista 61.39
2.95
56.01
67.72
Histioteuthis miranda 192.63
35.11
70.99
240.33
Kondakovia longimana 479.37
56.57
360.53
688.19
Lepidoteuthis grimaldii 775.40
0.00
775.40
775.40
Martialia hyadesi 278.05
23.77
230.49
328.33
Mastigoteuthis psychrophila 119.13
1.42
115.89
121.59
Mesonychoteuthis hamiltoni 786.90
0
786.90
786.90
Moroteuthis ingens 440.15
38.11
383.20
477.82
Moroteuthis knipovitchi 327.06
46.80
256.03
442.52
Moroteuthis robsoni 731.55
88.04
603.66
875.51
Moroteuthis sp. B 248.70
52.29
187.43
298.44
Notonykia africanae 111.96
0
111.96
111.96
Nototeuthis dimegacotyle 143.18
9.12
123.06
155.95
Octopoteuthis sp. 241.72
46.49
171.17
384.85
Onychoteuthis banskii 113.99
0
113.99
113.99
Onychoteuthis sp. 2 (Imber) 83.53
0
83.53
83.53
Onychoteuthis sp. B 185.71
0
185.71
185.71
Onychoteuthis sp. C 165.04
7.90
152.63
179.16
Psychroteuthis glacialis 337.96
28.70
308.71
365.77
Taningia danae 748.56
163.14
317.16
994.14
Taonius sp. (Clarke) 293.70
13.59
267.82
319.42
Taonius sp. B (Voss) 578.55
66.83
395.60
708.27
Teuthowenia pellucida 163.34
9.53
143.07
181.34
Todarodes sp. 248.62
19.45
223.62
280.29
Species LRL
mean
sd
min
max
?Mastigoteuthis A (Clarke) 6.84
0.95
4.76
8.08
Alluroteuthis antarcticus 5.41
0.40
4.17
6.10
Ancistrocheirus lesueuri 7.99
1.37
3.84
9.33
Architeuthis dux 11.16
2.85
7.67
15.41
Batoteuthis skolops 4.71
0.57
3.67
5.57
Chiroteuthis veranyi 7.39
0.67
5.95
8.25
Cycloteuthis akimushkini 12.78
2.31
6.90
17.98
Galiteuthis glacialis 5.45
0.33
3.84
6.29
Galiteuthis sp. 3 8.39
0.55
7.90
8.98
Galiteuthis Stc sp. 6.98
0.59
6.60
7.86
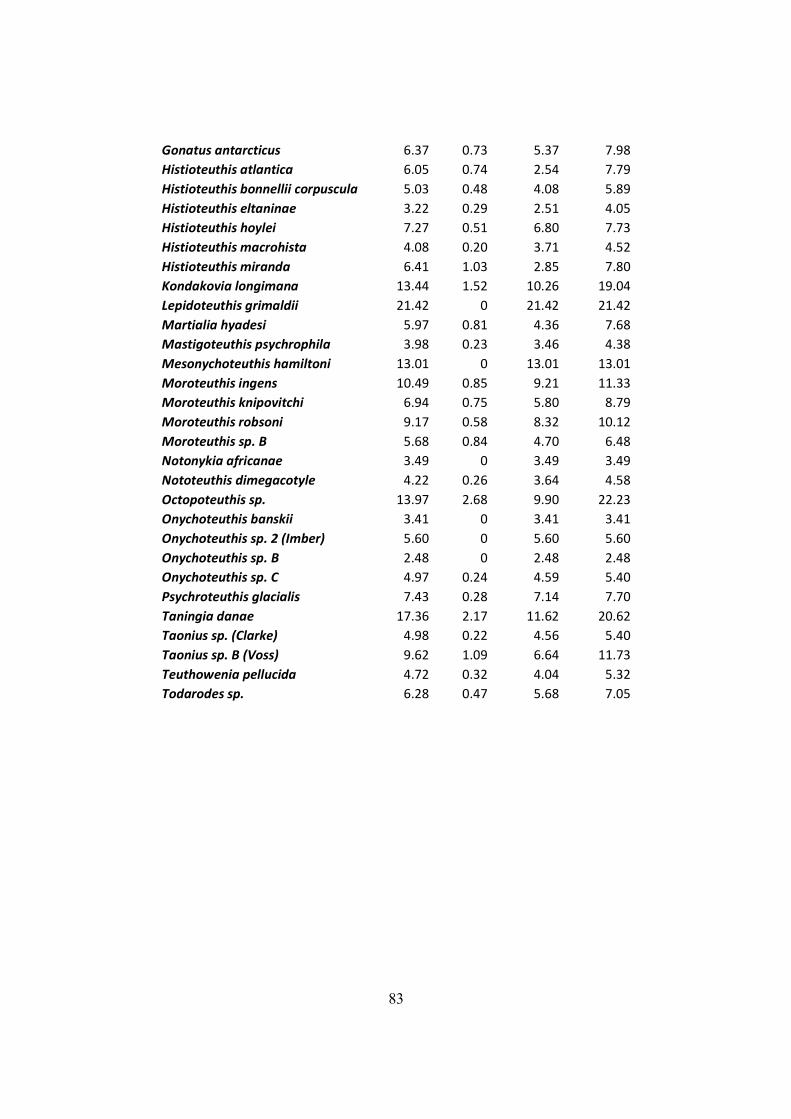
83
Gonatus antarcticus 6.37
0.73
5.37
7.98
Histioteuthis atlantica 6.05
0.74
2.54
7.79
Histioteuthis bonnellii corpuscula 5.03
0.48
4.08
5.89
Histioteuthis eltaninae 3.22
0.29
2.51
4.05
Histioteuthis hoylei 7.27
0.51
6.80
7.73
Histioteuthis macrohista 4.08
0.20
3.71
4.52
Histioteuthis miranda 6.41
1.03
2.85
7.80
Kondakovia longimana 13.44
1.52
10.26
19.04
Lepidoteuthis grimaldii 21.42
0
21.42
21.42
Martialia hyadesi 5.97
0.81
4.36
7.68
Mastigoteuthis psychrophila 3.98
0.23
3.46
4.38
Mesonychoteuthis hamiltoni 13.01
0
13.01
13.01
Moroteuthis ingens 10.49
0.85
9.21
11.33
Moroteuthis knipovitchi 6.94
0.75
5.80
8.79
Moroteuthis robsoni 9.17
0.58
8.32
10.12
Moroteuthis sp. B 5.68
0.84
4.70
6.48
Notonykia africanae 3.49
0
3.49
3.49
Nototeuthis dimegacotyle 4.22
0.26
3.64
4.58
Octopoteuthis sp. 13.97
2.68
9.90
22.23
Onychoteuthis banskii 3.41
0
3.41
3.41
Onychoteuthis sp. 2 (Imber) 5.60
0
5.60
5.60
Onychoteuthis sp. B 2.48
0
2.48
2.48
Onychoteuthis sp. C 4.97
0.24
4.59
5.40
Psychroteuthis glacialis 7.43
0.28
7.14
7.70
Taningia danae 17.36
2.17
11.62
20.62
Taonius sp. (Clarke) 4.98
0.22
4.56
5.40
Taonius sp. B (Voss) 9.62
1.09
6.64
11.73
Teuthowenia pellucida 4.72
0.32
4.04
5.32
Todarodes sp. 6.28
0.47
5.68
7.05
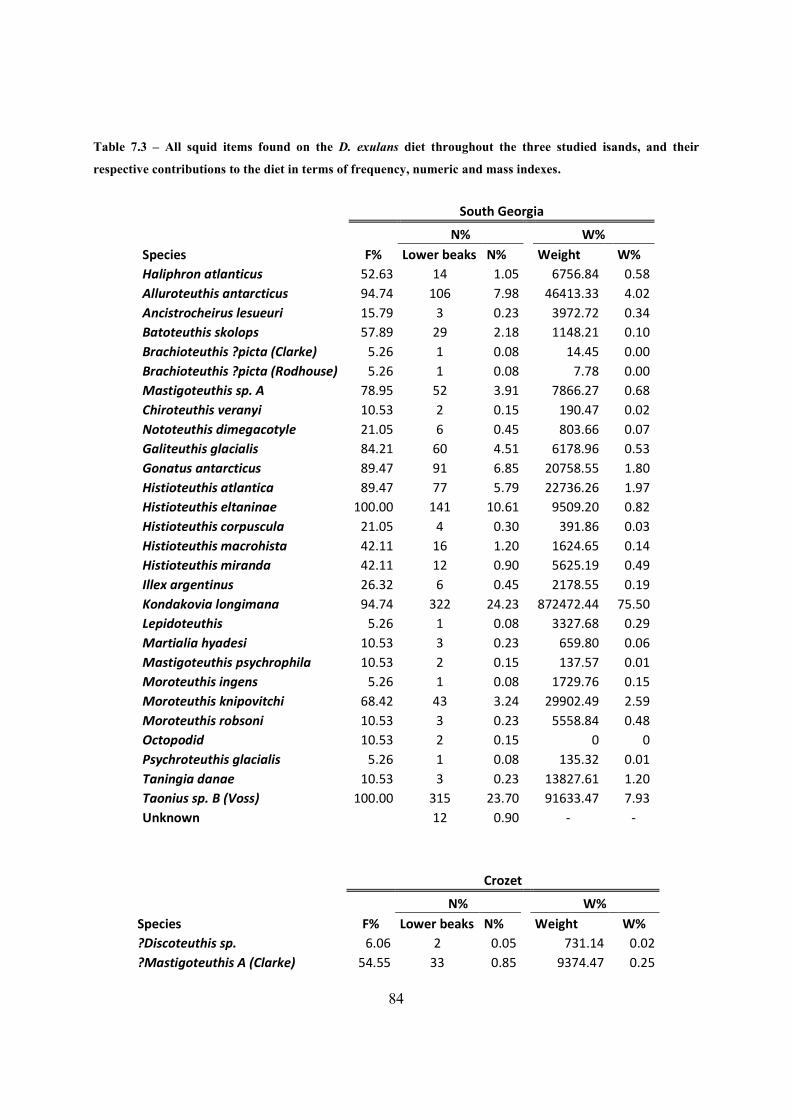
84
Table 7.3 – All squid items found on the D. exulans diet throughout the three studied isands, and their
respective contributions to the diet in terms of frequency, numeric and mass indexes.
South Georgia
F%
N%
W%
Species Lower beaks N%
Weight
W%
Haliphron atlanticus 52.63 14 1.05
6756.84
0.58
Alluroteuthis antarcticus 94.74 106 7.98
46413.33
4.02
Ancistrocheirus lesueuri 15.79 3 0.23
3972.72
0.34
Batoteuthis skolops 57.89 29 2.18
1148.21
0.10
Brachioteuthis ?picta (Clarke) 5.26 1 0.08
14.45
0.00
Brachioteuthis ?picta (Rodhouse) 5.26 1 0.08
7.78
0.00
Mastigoteuthis sp. A 78.95 52 3.91
7866.27
0.68
Chiroteuthis veranyi 10.53 2 0.15
190.47
0.02
Nototeuthis dimegacotyle 21.05 6 0.45
803.66
0.07
Galiteuthis glacialis 84.21 60 4.51
6178.96
0.53
Gonatus antarcticus 89.47 91 6.85
20758.55
1.80
Histioteuthis atlantica 89.47 77 5.79
22736.26
1.97
Histioteuthis eltaninae 100.00 141 10.61
9509.20
0.82
Histioteuthis corpuscula 21.05 4 0.30
391.86
0.03
Histioteuthis macrohista 42.11 16 1.20
1624.65
0.14
Histioteuthis miranda 42.11 12 0.90
5625.19
0.49
Illex argentinus 26.32 6 0.45
2178.55
0.19
Kondakovia longimana 94.74 322 24.23
872472.44
75.50
Lepidoteuthis 5.26 1 0.08
3327.68
0.29
Martialia hyadesi 10.53 3 0.23
659.80
0.06
Mastigoteuthis psychrophila 10.53 2 0.15
137.57
0.01
Moroteuthis ingens 5.26 1 0.08
1729.76
0.15
Moroteuthis knipovitchi 68.42 43 3.24
29902.49
2.59
Moroteuthis robsoni 10.53 3 0.23
5558.84
0.48
Octopodid 10.53 2 0.15
0
0
Psychroteuthis glacialis 5.26 1 0.08
135.32
0.01
Taningia danae 10.53 3 0.23
13827.61
1.20
Taonius sp. B (Voss) 100.00 315 23.70
91633.47
7.93
Unknown
12 0.90
-
-
Crozet
N%
W%
Species F% Lower beaks N%
Weight
W%
?Discoteuthis sp. 6.06 2 0.05
731.14
0.02
?Mastigoteuthis A (Clarke) 54.55 33 0.85
9374.47
0.25
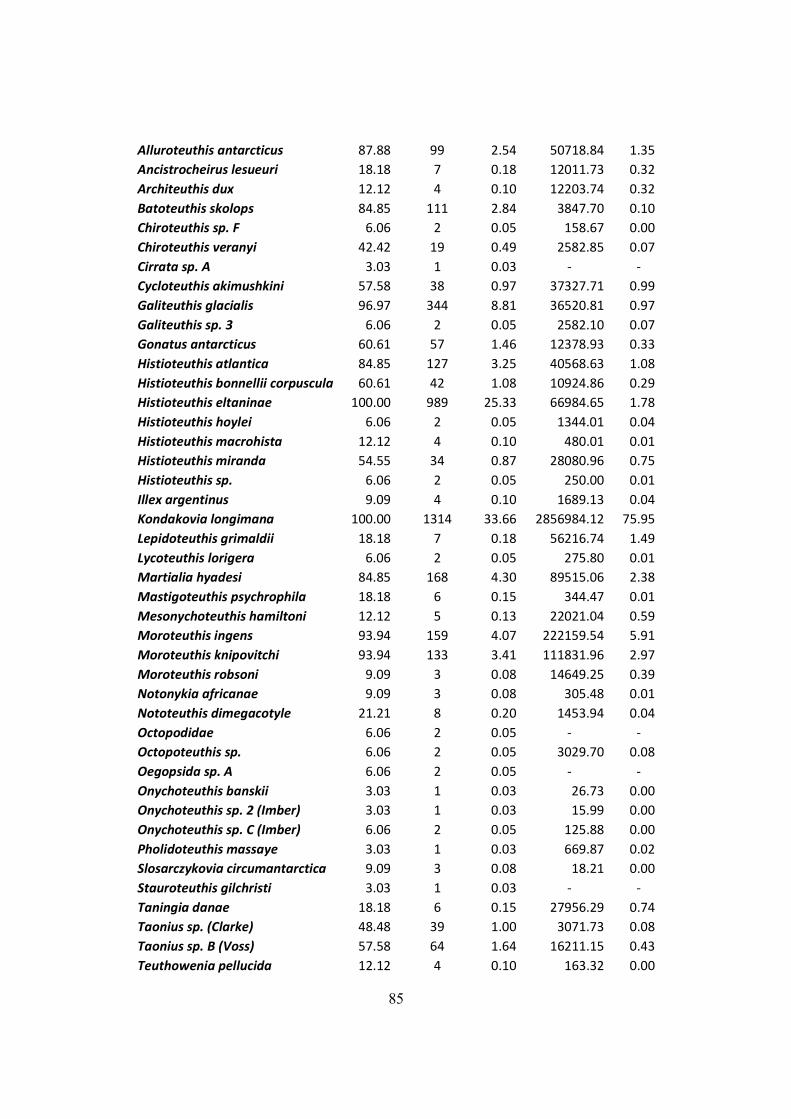
85
Alluroteuthis antarcticus 87.88 99 2.54
50718.84
1.35
Ancistrocheirus lesueuri 18.18 7 0.18
12011.73
0.32
Architeuthis dux 12.12 4 0.10
12203.74
0.32
Batoteuthis skolops 84.85 111 2.84
3847.70
0.10
Chiroteuthis sp. F 6.06 2 0.05
158.67
0.00
Chiroteuthis veranyi 42.42 19 0.49
2582.85
0.07
Cirrata sp. A 3.03 1 0.03
-
-
Cycloteuthis akimushkini 57.58 38 0.97
37327.71
0.99
Galiteuthis glacialis 96.97 344 8.81
36520.81
0.97
Galiteuthis sp. 3 6.06 2 0.05
2582.10
0.07
Gonatus antarcticus 60.61 57 1.46
12378.93
0.33
Histioteuthis atlantica 84.85 127 3.25
40568.63
1.08
Histioteuthis bonnellii corpuscula 60.61 42 1.08
10924.86
0.29
Histioteuthis eltaninae 100.00 989 25.33
66984.65
1.78
Histioteuthis hoylei 6.06 2 0.05
1344.01
0.04
Histioteuthis macrohista 12.12 4 0.10
480.01
0.01
Histioteuthis miranda 54.55 34 0.87
28080.96
0.75
Histioteuthis sp. 6.06 2 0.05
250.00
0.01
Illex argentinus 9.09 4 0.10
1689.13
0.04
Kondakovia longimana 100.00 1314 33.66
2856984.12
75.95
Lepidoteuthis grimaldii 18.18 7 0.18
56216.74
1.49
Lycoteuthis lorigera 6.06 2 0.05
275.80
0.01
Martialia hyadesi 84.85 168 4.30
89515.06
2.38
Mastigoteuthis psychrophila 18.18 6 0.15
344.47
0.01
Mesonychoteuthis hamiltoni 12.12 5 0.13
22021.04
0.59
Moroteuthis ingens 93.94 159 4.07
222159.54
5.91
Moroteuthis knipovitchi 93.94 133 3.41
111831.96
2.97
Moroteuthis robsoni 9.09 3 0.08
14649.25
0.39
Notonykia africanae 9.09 3 0.08
305.48
0.01
Nototeuthis dimegacotyle 21.21 8 0.20
1453.94
0.04
Octopodidae 6.06 2 0.05
-
-
Octopoteuthis sp. 6.06 2 0.05
3029.70
0.08
Oegopsida sp. A 6.06 2 0.05
-
-
Onychoteuthis banskii 3.03 1 0.03
26.73
0.00
Onychoteuthis sp. 2 (Imber) 3.03 1 0.03
15.99
0.00
Onychoteuthis sp. C (Imber) 6.06 2 0.05
125.88
0.00
Pholidoteuthis massaye 3.03 1 0.03
669.87
0.02
Slosarczykovia circumantarctica 9.09 3 0.08
18.21
0.00
Stauroteuthis gilchristi 3.03 1 0.03
-
-
Taningia danae 18.18 6 0.15
27956.29
0.74
Taonius sp. (Clarke) 48.48 39 1.00
3071.73
0.08
Taonius sp. B (Voss) 57.58 64 1.64
16211.15
0.43
Teuthowenia pellucida 12.12 4 0.10
163.32
0.00
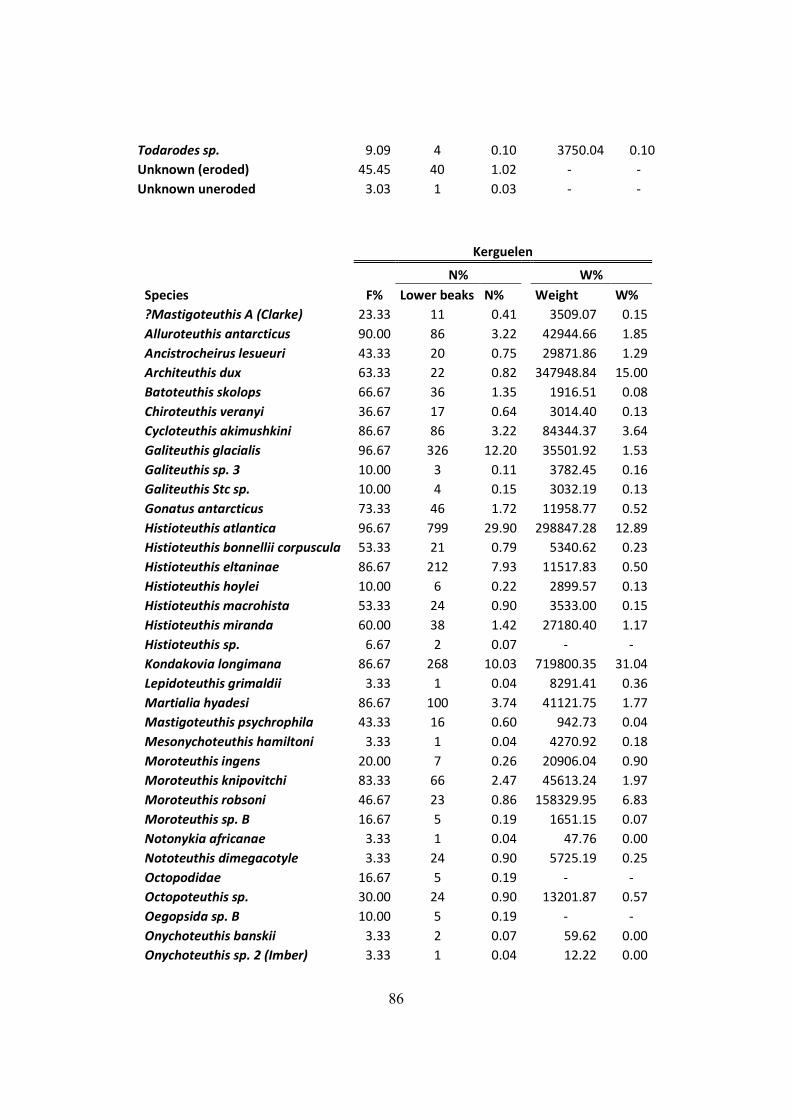
86
Todarodes sp. 9.09 4 0.10
3750.04
0.10
Unknown (eroded) 45.45 40 1.02
-
-
Unknown uneroded 3.03 1 0.03
-
-
Kerguelen
F%
N%
W%
Species Lower beaks N%
Weight
W%
?Mastigoteuthis A (Clarke) 23.33 11 0.41
3509.07
0.15
Alluroteuthis antarcticus 90.00 86 3.22
42944.66
1.85
Ancistrocheirus lesueuri 43.33 20 0.75
29871.86
1.29
Architeuthis dux 63.33 22 0.82
347948.84
15.00
Batoteuthis skolops 66.67 36 1.35
1916.51
0.08
Chiroteuthis veranyi 36.67 17 0.64
3014.40
0.13
Cycloteuthis akimushkini 86.67 86 3.22
84344.37
3.64
Galiteuthis glacialis 96.67 326 12.20
35501.92
1.53
Galiteuthis sp. 3 10.00 3 0.11
3782.45
0.16
Galiteuthis Stc sp. 10.00 4 0.15
3032.19
0.13
Gonatus antarcticus 73.33 46 1.72
11958.77
0.52
Histioteuthis atlantica 96.67 799 29.90
298847.28
12.89
Histioteuthis bonnellii corpuscula 53.33 21 0.79
5340.62
0.23
Histioteuthis eltaninae 86.67 212 7.93
11517.83
0.50
Histioteuthis hoylei 10.00 6 0.22
2899.57
0.13
Histioteuthis macrohista 53.33 24 0.90
3533.00
0.15
Histioteuthis miranda 60.00 38 1.42
27180.40
1.17
Histioteuthis sp. 6.67 2 0.07
-
-
Kondakovia longimana 86.67 268 10.03
719800.35
31.04
Lepidoteuthis grimaldii 3.33 1 0.04
8291.41
0.36
Martialia hyadesi 86.67 100 3.74
41121.75
1.77
Mastigoteuthis psychrophila 43.33 16 0.60
942.73
0.04
Mesonychoteuthis hamiltoni 3.33 1 0.04
4270.92
0.18
Moroteuthis ingens 20.00 7 0.26
20906.04
0.90
Moroteuthis knipovitchi 83.33 66 2.47
45613.24
1.97
Moroteuthis robsoni 46.67 23 0.86
158329.95
6.83
Moroteuthis sp. B 16.67 5 0.19
1651.15
0.07
Notonykia africanae 3.33 1 0.04
47.76
0.00
Nototeuthis dimegacotyle 3.33 24 0.90
5725.19
0.25
Octopodidae 16.67 5 0.19
-
-
Octopoteuthis sp. 30.00 24 0.90
13201.87
0.57
Oegopsida sp. B 10.00 5 0.19
-
-
Onychoteuthis banskii 3.33 2 0.07
59.62
0.00
Onychoteuthis sp. 2 (Imber) 3.33 1 0.04
12.22
0.00
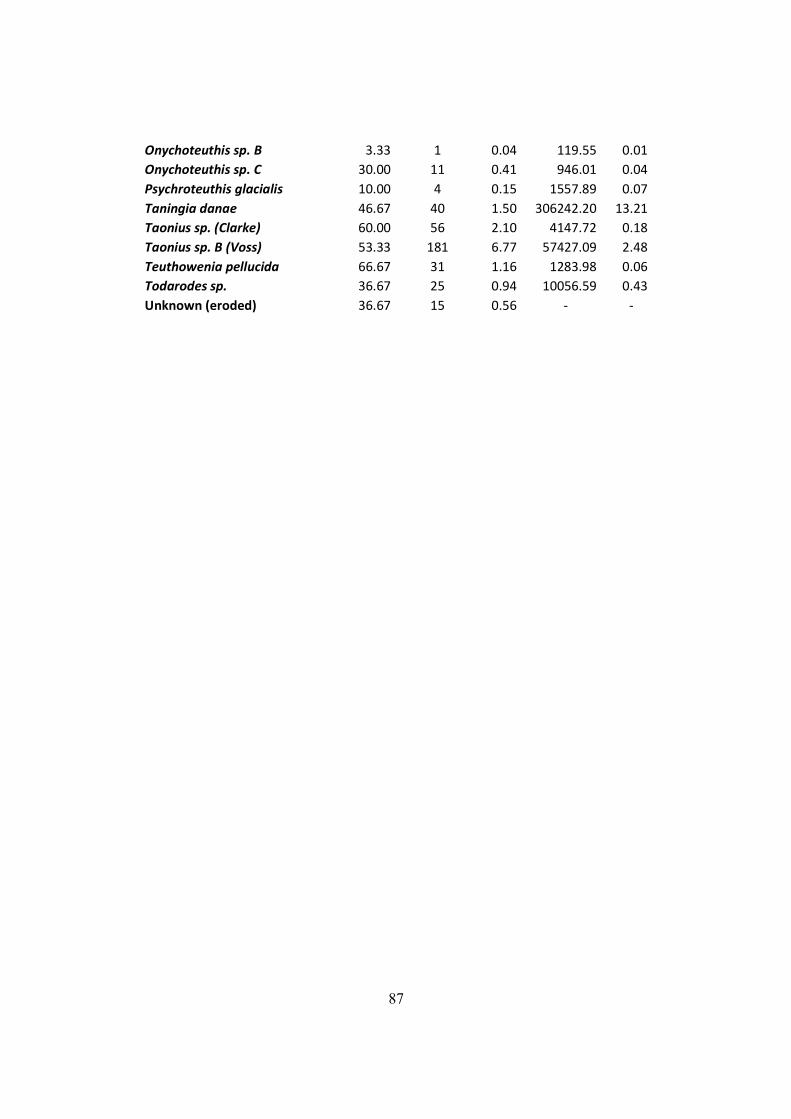
87
Onychoteuthis sp. B 3.33 1 0.04
119.55
0.01
Onychoteuthis sp. C 30.00 11 0.41
946.01
0.04
Psychroteuthis glacialis 10.00 4 0.15
1557.89
0.07
Taningia danae 46.67 40 1.50
306242.20
13.21
Taonius sp. (Clarke) 60.00 56 2.10
4147.72
0.18
Taonius sp. B (Voss) 53.33 181 6.77
57427.09
2.48
Teuthowenia pellucida 66.67 31 1.16
1283.98
0.06
Todarodes sp. 36.67 25 0.94
10056.59
0.43
Unknown (eroded) 36.67 15 0.56
-
-
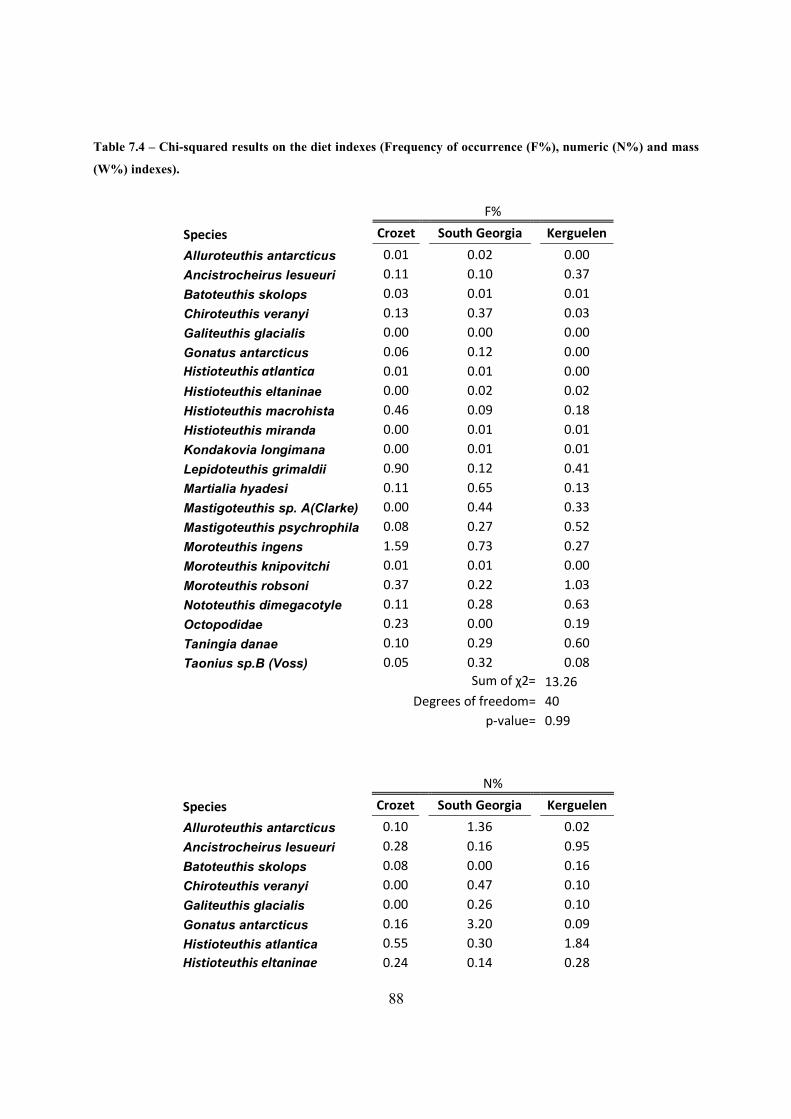
88
Table 7.4 – Chi-squared results on the diet indexes (Frequency of occurrence (F%), numeric (N%) and mass
(W%) indexes).
F%
Species Crozet
South Georgia
Kerguelen
Alluroteuthis antarcticus 0.01
0.02
0.00
Ancistrocheirus lesueuri 0.11
0.10
0.37
Batoteuthis skolops 0.03
0.01
0.01
Chiroteuthis veranyi 0.13
0.37
0.03
Galiteuthis glacialis 0.00
0.00
0.00
Gonatus antarcticus 0.06
0.12
0.00
Histioteuthis atlantica 0.01
0.01
0.00
Histioteuthis eltaninae 0.00
0.02
0.02
Histioteuthis macrohista 0.46
0.09
0.18
Histioteuthis miranda 0.00
0.01
0.01
Kondakovia longimana 0.00
0.01
0.01
Lepidoteuthis grimaldii 0.90
0.12
0.41
Martialia hyadesi 0.11
0.65
0.13
Mastigoteuthis sp. A(Clarke) 0.00
0.44
0.33
Mastigoteuthis psychrophila 0.08
0.27
0.52
Moroteuthis ingens 1.59
0.73
0.27
Moroteuthis knipovitchi 0.01
0.01
0.00
Moroteuthis robsoni 0.37
0.22
1.03
Nototeuthis dimegacotyle 0.11
0.28
0.63
Octopodidae 0.23
0.00
0.19
Taningia danae 0.10
0.29
0.60
Taonius sp.B (Voss) 0.05
0.32
0.08
Sum of χ2= 13.26
Degrees of freedom= 40
p-value= 0.99
N%
Species Crozet
South Georgia
Kerguelen
Alluroteuthis antarcticus 0.10
1.36
0.02
Ancistrocheirus lesueuri 0.28
0.16
0.95
Batoteuthis skolops 0.08
0.00
0.16
Chiroteuthis veranyi 0.00
0.47
0.10
Galiteuthis glacialis 0.00
0.26
0.10
Gonatus antarcticus 0.16
3.20
0.09
Histioteuthis atlantica 0.55
0.30
1.84
Histioteuthis eltaninae 0.24
0.14
0.28
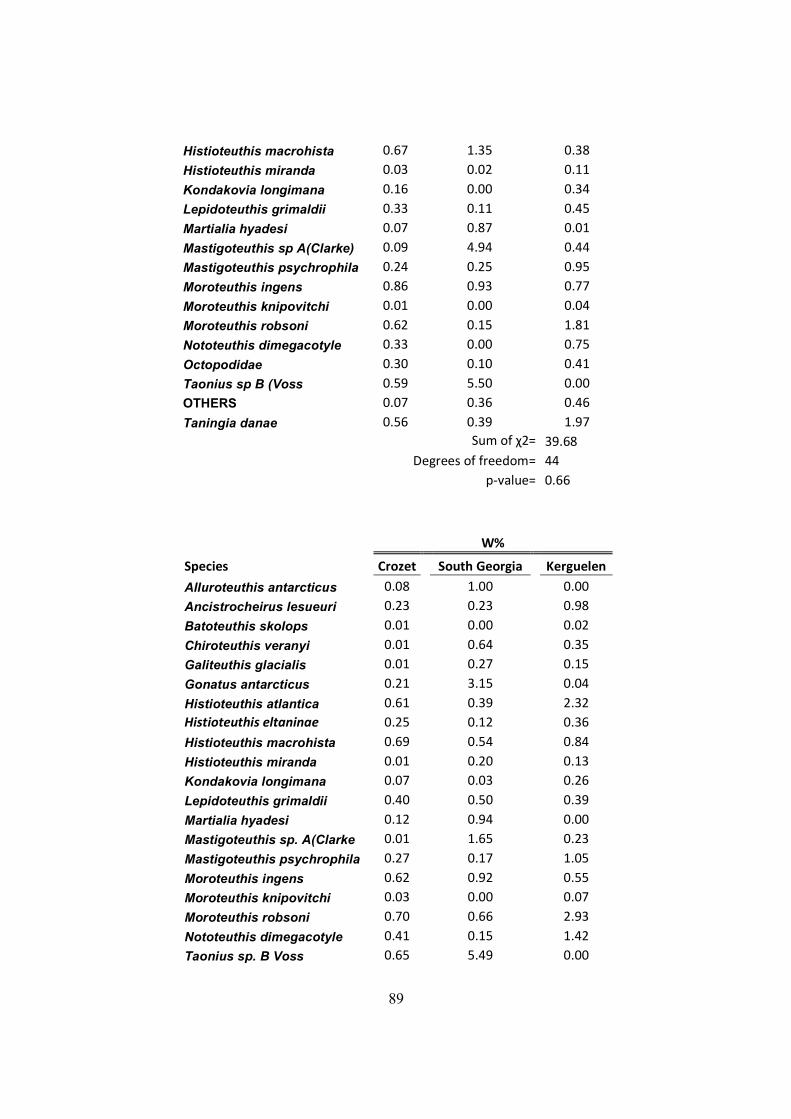
89
Histioteuthis macrohista 0.67
1.35
0.38
Histioteuthis miranda 0.03
0.02
0.11
Kondakovia longimana 0.16
0.00
0.34
Lepidoteuthis grimaldii 0.33
0.11
0.45
Martialia hyadesi 0.07
0.87
0.01
Mastigoteuthis sp A(Clarke) 0.09
4.94
0.44
Mastigoteuthis psychrophila 0.24
0.25
0.95
Moroteuthis ingens 0.86
0.93
0.77
Moroteuthis knipovitchi 0.01
0.00
0.04
Moroteuthis robsoni 0.62
0.15
1.81
Nototeuthis dimegacotyle 0.33
0.00
0.75
Octopodidae 0.30
0.10
0.41
Taonius sp B (Voss 0.59
5.50
0.00
OTHERS 0.07
0.36
0.46
Taningia danae 0.56
0.39
1.97
Sum of χ2= 39.68
Degrees of freedom= 44
p-value= 0.66
W%
Species Crozet
South Georgia
Kerguelen
Alluroteuthis antarcticus 0.08
1.00
0.00
Ancistrocheirus lesueuri 0.23
0.23
0.98
Batoteuthis skolops 0.01
0.00
0.02
Chiroteuthis veranyi 0.01
0.64
0.35
Galiteuthis glacialis 0.01
0.27
0.15
Gonatus antarcticus 0.21
3.15
0.04
Histioteuthis atlantica 0.61
0.39
2.32
Histioteuthis eltaninae 0.25
0.12
0.36
Histioteuthis macrohista 0.69
0.54
0.84
Histioteuthis miranda 0.01
0.20
0.13
Kondakovia longimana 0.07
0.03
0.26
Lepidoteuthis grimaldii 0.40
0.50
0.39
Martialia hyadesi 0.12
0.94
0.00
Mastigoteuthis sp. A(Clarke 0.01
1.65
0.23
Mastigoteuthis psychrophila 0.27
0.17
1.05
Moroteuthis ingens 0.62
0.92
0.55
Moroteuthis knipovitchi 0.03
0.00
0.07
Moroteuthis robsoni 0.70
0.66
2.93
Nototeuthis dimegacotyle 0.41
0.15
1.42
Taonius sp. B Voss 0.65
5.49
0.00
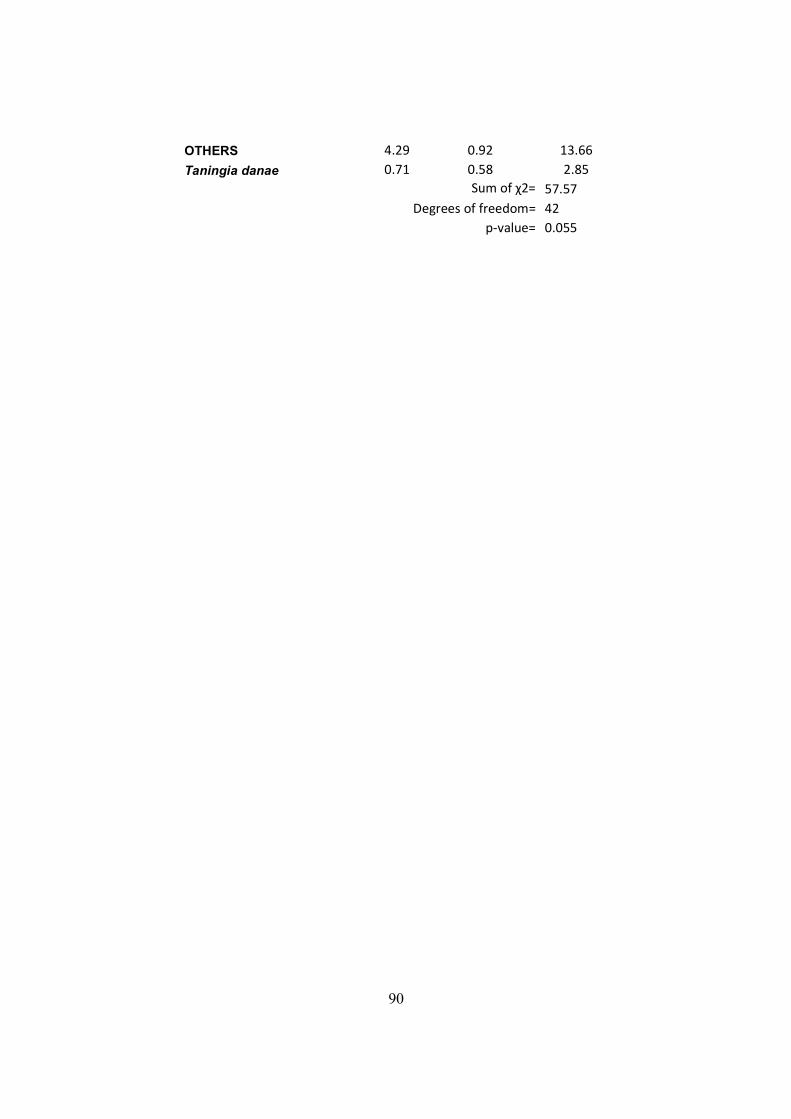
90
OTHERS 4.29
0.92
13.66
Taningia danae 0.71
0.58
2.85
Sum of χ2= 57.57
Degrees of freedom= 42
p-value= 0.055