Embed Size (px)
Citation preview

Working Paper Series
U.S. Environmental Protection Agency National Center for Environmental Economics 1200 Pennsylvania Avenue, NW (MC 1809) Washington, DC 20460 http://www.epa.gov/economics
CERCLA’s Overlooked Cleanup Program:
Emergency Response and Removal
Robin Jenkins, Heather Klemick, Elizabeth Kopits,
and Alex Marten
Working Paper # 11-04
May, 2011

NCEE Working Paper Series
Working Paper # 11-04
May, 2011
DISCLAIMER
The views expressed in this paper are those of the author(s) and do not necessarily represent those
of the U.S. Environmental Protection Agency. In addition, although the research described in this
paper may have been funded entirely or in part by the U.S. Environmental Protection Agency, it
has not been subjected to the Agency's required peer and policy review. No official Agency
endorsement should be inferred.
CERCLA’s Overlooked Cleanup Program:
Emergency Response and Removal
Robin Jenkins, Heather Klemick, Elizabeth Kopits,
and Alex Marten

1
REVISED 7/14/2011
CERCLA’s Overlooked Cleanup Program:
Emergency Response and Removal
Robin R. Jenkins, Heather Klemick, Elizabeth Kopits, Alex Marten1
JEL Codes: H12, Q24, and Q53 Abstract Over the past five decades, the federal government has enacted laws and developed regulations to manage actual and threatened hazardous releases. This paper describes a relatively understudied component of the nation’s response capability – the Superfund Emergency Response and Removal (ERR) Program. Drawing on a new dataset of 113 recent removal actions on 88 sites in the Mid-Atlantic region, we find a great deal of diversity across sites, from the discovery and cause of contamination to the types of risks and the cleanup strategy. The program addresses traditionally studied media such as soil, water, and air contamination, as well as risks from not-yet-released contained contaminants and potential fire or explosion. One of the program’s major strengths is its ability to address this wide range of threats, even though this very heterogeneity complicates research efforts to assess its net benefits. We describe the involvement of
1 The views expressed in this paper are those of the authors and do not necessarily represent those of the U.S. Environmental Protection Agency. No official Agency endorsement should be inferred. The authors wish to thank reviewers from EPA’s Office of Solid Waste and Emergency Response including Lura Matthews, Kevin Haninger, and Brigid Lowery of the Center for Policy Analysis; Dennis Carney of Region 3 Office of Preparedness and Response; Randy Deitz of the Innovation, Partnership, and Communication Office; George Denning and Bill Finan of the Office of Emergency Management; and Elizabeth Southerland and Jennifer Wilbur of the Office of Superfund Remediation and Technology Innovation. We are especially thankful to Patricia Corbett of EPA Region 3 Brownfields and Land Revitalization Branch, who found missing documents for us, tracked down appropriate contacts, and answered countless questions, and Lora Werner, ATSDR Region 3, who provided us with Health Consultations, Public Health Assessments, and Records of Activity for many sites in our sample. Finally, we extend much gratitude to Scott Breen and Laura Wilburn for their valuable research assistance. Any errors are our own.
2
potentially responsible parties and EPA expenditures on removal actions. Finally, we consider future challenges for research into the net benefits of the program.
1 Introduction
Oil, chemicals, and other hazardous substances are ubiquitous throughout the U.S.
economy. Each year, large quantities of these substances are mined, manufactured,
handled, transported, discarded, and in the process, sometimes accidentally released.
Currently between 20,000 and 30,000 incidents are reported in the U.S. annually
involving the release or potential release of oil or hazardous substances (U.S. EPA 2010a,
U.S. National Response Team 2009). Over the past five decades or so, the federal
government has enacted laws and developed regulations to manage actual and threatened
hazardous releases with increasing concern about possible deliberate releases caused by
terrorists. This paper describes a key component of the nation’s response capability – the
Superfund Emergency Response and Removal (ERR) Program.
Congress established the ERR Program in 1980 with the Comprehensive
Environmental Response, Compensation and Liability Act (CERCLA). CERCLA
initially established two land cleanup programs: the well-publicized Superfund Remedial
Program, which created the National Priorities List (NPL), and the lesser known
Superfund ERR Program. The ERR Program was set up to quickly address imminent
threats to public health or the environment, while the Remedial Program’s NPL targets
sites that require long-term remedial action (U.S. EPA 2010c).
Because of the large number of emergency contamination events, the ERR
Program has responded to contaminants at more than three times the number of sites that
appear on the NPL (U.S. EPA 2010e). Yet, in the economics literature there is a virtual
3
absence of research about it compared to the scores of papers focused on the NPL. One
reason for this imbalance might be the lack of readily available data characterizing the
ERR Program. This absence of information limits both opportunities for analysis and
general understanding about the program. The current paper addresses this gap first by
describing the evolution of the ERR Program and second by presenting detailed
information about 113 recent removal actions in the Mid-Atlantic states, known as EPA
Region 3. The goal of the Program is to address imminent threats, but what kinds of
threats, and who was threatened? What environmental media were affected, and how
much did EPA spend removing the risk? This paper addresses these and other questions
in an effort to better understand the impacts of the ERR Program.
The removal sites in our new dataset were usually located in population centers
with a variety of at-risk sub-populations, including residents, employees, recreational
users, and often children. Sites were diverse along many dimensions, from the discovery
of contamination to the cleanup strategy. Contamination most frequently resulted from
improper disposal, handling, or storage of materials. Not only were soil, air, groundwater,
and surface water contamination prevalent, but risks from not-yet-released contained
contaminants and potential fire or explosion were also common. One of the ERR
Program’s major strengths is its ability to address a wide range of threats to public health
and the environment, even though this very heterogeneity complicates research efforts to
assess the program.
The paper begins with a description of the evolution of the ERR Program within
the context of emergency management in the U.S. and presents statistics on the program
nationwide. Section 3 describes our Region 3 dataset and data gathering process. Section

4
4 provides a thorough characterization of the removal actions, including the causes of
contamination and EPA involvement, the types of contamination and risks found, and the
nature of cleanup activities. The paper concludes with ideas for research and a brief
discussion of issues surrounding estimation of social benefits of removal actions.
2 Evolution of the ERR Program
EPA’s ERR Program is part of an evolving set of federal rules addressing
emergency management. Response programs have targeted an increasing set of
environments, starting with the sea and expanding inland, and an increasing variety of
contaminants, starting with oil and expanding to all hazardous substances. The
circumstances requiring emergency response have grown from vehicle or equipment
accidents to radiological incidents, natural disasters, and terrorist attacks. This section
describes the history of the ERR Program in light of the country’s ever-changing needs
and circumstances. It highlights the Program’s intimate connections to the National
Contingency Plan, the Oil Spill Program, and the Superfund Remedial Program (the
NPL). It ends by reporting statistics and geographic information to characterize the
program’s activities to date.
2.1 The National Contingency Plan and EPA’s ERR Program
Although it was the first national program to address contamination of land
posing an imminent threat, the ERR Program built on existing federal authorities to
address hazardous releases at sea. In 1968 President Johnson approved the first National
Oil and Hazardous Substances Pollution Contingency Plan, commonly known as the
National Contingency Plan (NCP). It was a reaction to the first major and highly

5
publicized oil spill at sea. In March, 1967, the supertanker Torrey Canyon snagged on
rocks off the coast of England, releasing more than 35 million gallons of oil and
contaminating approximately 120 miles of Cornish and French coastlines. Allegedly, the
British government handled the incident poorly, with no clear lines of authority or plan of
attack (British Broadcasting Corporation 2010, British Broadcasting Corporation
Cornwall 2010, U.S. EPA 2010b, U.S. National Response Team 2009). The NCP was an
effort to be better prepared for similar future incidents in the U.S.
The original NCP targeted oil spills into navigable U.S. waters and provided an
organized approach for addressing a hazardous substance release incident, including
reporting, containment, and cleanup. It also created a National Response System
identifying a hierarchy of responders and emergency contingency plans and addressing
the roles of federal, state, and local officials. It established the precursors to the present
day National Response Team to develop national level emergency preparedness for oil
and later hazardous substance releases. The NCP required the pre-designation of On
Scene Coordinators (OSCs) who would direct response efforts. In general the U.S. Coast
Guard provides OSCs for the coastal zone and the EPA for the inland zone (U.S. EPA
2010b, U.S. National Response Team 2009).
Over the years, and through various authorities, Congress has expanded the NCP
to more thoroughly address potential public health threats. The 1972 Clean Water Act
mandated that the NCP address all hazardous releases into navigable waters. Later,
CERCLA expanded the scope to address hazardous releases into any environmental
media, in part through establishing the ERR Program. CERCLA also established a trust
fund to pay for cleaning up sites when the responsible parties were unable or unwilling to

6
finance the cleanup. The Oil Pollution Act of 1990 again broadened the NCP authority
and, among other changes, established the Oil Spill Liability Trust Fund, which allows
for compensatory payments for damages from oil spills (U.S. EPA 2010c, 2010d; U.S.
National Response Team 2009, 2010).2
During this continued expansion of the NCP the ERR Program has taken on a
first-responder and oversight role while also addressing an expanding set of threats. The
Robert T. Stafford Disaster Relief and Emergency Assistance Act of 1988 authorized the
federal government to address releases of hazardous substances due to natural disasters in
part through the ERR Program (Probst and Konisky 2001). Three 2003 Homeland
Security Presidential Directives directed EPA to respond to terrorist incidents involving
hazardous materials (U.S. EPA 2010a,c). In 2004, EPA established an Office of
Emergency Management that consolidated the Chemical Emergency Preparedness
Office, Oil Spill Prevention Program, and Superfund Emergency Response and Removal
Program to ensure improved coordination in both preparing for and responding to
emergencies involving oil or hazardous substances (U.S. EPA 2005a). Currently the
National Response Team is chaired by EPA, vice-chaired by the U.S. Coast Guard, and
includes thirteen additional participating agencies (U.S. National Response Team 2009).
2.2 Removal and Remedial Actions: Complementary Responses
The ERR and Remedial Programs share many key features, such as liability rules
for responsible parties, access to the CERCLA trust fund, site management led by an
individual coordinator or manager, and so on. Congress set up the two programs to
2 Sites contaminated by crude oil or refined petroleum are not covered by CERCLA, but sites with waste oil that includes contaminants not normally found in crude oil or refined petroleum, or contaminants in quantities exceeding what would naturally be found in crude oil or petroleum, are (U.S. EPA 1987).
7
address a continuum of response needs – from emergencies to large contaminated sites
dominated by longer term risk. The continuum is refined further within the ERR
Program, where there are three formal categories of removal actions based on the urgency
of site conditions. Emergency actions require response within hours to days; time-critical
actions require response within weeks to months; and non-time-critical removal actions
typically allow for a planning period of six months before action is deemed necessary.
Engineering evaluation and cost analysis are required prior to initiation of non-time
critical actions and more community involvement is sought (U.S. EPA 2000a).
On Scene Coordinators (OSCs) are responsible for evaluating reported releases to
determine the potential for a removal action. They begin by assessing the size and nature
of the release. One job of the OSC is to determine the ability of the potentially
responsible parties (PRPs) or local authorities to address the release. Cleanups can be
PRP-led when PRPs are identifiable, solvent, and capable; however if federal assistance
is necessary the cleanup may be led by EPA (U.S. EPA 2010c). In cases where the
cleanup is EPA-led it may still be funded by PRPs, or the government retains a right to
seek future cost recovery.
Initially, EPA-financed removal actions were limited to less than six months of
time and $1 million in expenditures. The limits were relaxed by the Superfund
Amendments and Reauthorization Act of 1986, which doubled them to one year and $2
million, though the statute allows waivers following appropriate review and
consideration; for example for continuing emergency conditions. (U.S. GAO 1996a,b;
Probst and Konisky 2001). EPA requires Headquarters concurrence before the ERR
8
Program can spend more than $6 million for a removal action (U.S. EPA 2000a). As we
discuss later, our own data reflect the flexibility in these limits.
Naturally, the lengthiest non-time critical actions begin to resemble sites handled
by the Remedial Program. In fact, after ten years of managing NPL cleanups and given
public pressure to do more in a shorter period of time, EPA turned to the ERR Program to
pick up the pace at NPL sites. In 1992 a new Superfund Accelerated Cleanup Model
allowed OSCs to hasten cleanups at Remedial sites by relying more heavily on removal
authority in cases presenting imminent and substantial danger to public health or welfare
(U.S. EPA 2000a). A study by the Government Accountability Office (1996a,b) found
that non-time critical removals can be appropriate for addressing the high-risk portions of
NPL sites and can achieve comparable risk reductions with less time and expense due to
streamlined planning, though remedial actions remain essential for conducting the more
complex cleanup operations at these sites.
In addition to removal actions occurring at NPL sites to address imminent threats,
removal sites can also subsequently be listed on the NPL when remaining contamination
requires further remediation. Approximately 60 percent of all 1,674 NPL sites have had
at least one removal action; at nearly half of those sites the action was started prior to the
site’s final listing on the NPL. Because the ERR Program addresses a much larger
universe than NPL sites, only about 20 percent of all removal actions have occurred at
NPL sites (U.S. EPA 2010e).
Within the past 20 years the nominal budget for the Superfund program to address
both removal and remedial activities has remained fairly constant, resulting in a

9
significant decline in real dollars.3 As shown in Figure 1, expenditures on the ERR
Program averaged about one-third of expenditures on the Remedial Program during the
2000s.4
Figure 1: EPA Superfund Expenditures, Fiscal Years 1999 through 2007
These expenditures do not include additional funding for homeland security in
recent years, such as a supplemental Congressional appropriation in 2002 that helped pay
for emergency response activities at the Capitol Hill anthrax site (U.S. GAO 2003).
Funding for EPA’s Homeland Security Preparedness, Response, and Recovery Program,
which builds on the ERR Program to support EPA’s capacity to respond to catastrophic
incidents through activities such as OSC training and laboratory work, has averaged
about $45 million since 2002, suggesting that some additional resources have helped
support the expanded role of the program in responding to homeland security incidents.
3 The Superfund tax expired at the end of 1995. Since then, Superfund program funding has been financed primarily from General Revenue transfers to the Superfund Trust Fund. Reinstatement of the Superfund tax has been considered and rejected several times and is currently under consideration (U.S. EPA 2010f). 4 Budget data collected from EPA FY2000-FY2011 Annual Performance Plan and Congressional Justification documents, available at http://www.epa.gov/budget/ (accessed Aug. 2010).

10
Source: GAO (2008). Note: These data exclude reimbursable expenditures and other expenditures related to the Brownfields program, transfers to other EPA appropriations, and the 2002 Homeland Security Supplemental appropriation. Other Superfund expenditures related to homeland security are included in various categories. The level of expenditures in each category—but not the total—could vary based on whether certain costs are classified as administration-related.
2.3 The ERR Program Nationwide
At present, EPA has conducted or overseen more than 8,300 removal actions at
about 5,300 sites. Threats at a majority of those sites (78 percent) were addressed with
only one removal action, but complex sites can require multiple removal actions. The
annual number of EPA-led removal actions averaged 141 per year during the 1990s
and169 during the 2000s. Actions led by other federal agencies or PRPs, averaged 82
annually during the 1990s and 172 during the 2000s (U.S. EPA 2010e). During the
1990s, the most common actions were time-critical removals; emergency responses made
up the second-largest category, and non-time critical removals the smallest (Probst and

11
Konisky 2001). Figure 2 shows the locations of removal actions nationally, highlighting
in blue removal actions at NPL sites, and in red removal actions included in our data set.
The majority of removal actions have taken place in the Northeastern and Midwestern
United States.
Figure 2: Locations of EPA Emergency Response and Removal Actions, 1981 – 2010*
* The CERCLIS database does not contain coordinates for approximately 8 percent of the removal actions. Source: U.S. EPA 2010e
Removal actions vary according to location, contaminants, health risks,
population density, and a host of other considerations. Examples of releases range from
contaminants spilled by a train wreck, during a hurricane, or as a result of terrorism, to a
freshly uncovered old cache of lead paint cans. Depending on site-specific
circumstances, sometimes nearby residents are evacuated or provided alternative drinking
water. Other times, air is tested, or barrels of hazardous substances or acres of topsoil are
removed. The next section describes our data set, which contains a rich variety of
removal actions.

12
3 Region 3 and Dataset
To better understand the ERR Program we examined a set of recently addressed
removal sites in EPA Region 3. This section describes the characteristics of Region 3,
explains the data collection effort, and concludes with a summary of the sites within our
sample.
3.1 Description of Region 3
EPA Region 3 includes Pennsylvania, Delaware, Maryland, Virginia, West
Virginia, and the District of Columbia. Due in part to the early presence of iron, steel,
coal, and other manufacturing industries, Region 3 has a history of responding to
hazardous waste contamination and environmental emergencies. Under authority of the
NCP and the Clean Water Act, in the early and mid-1970s, Region 3 helped clean up a
number of tanker accidents on the Delaware River and damages from tropical storm
Agnes involving hundreds of thousands of gallons of oil and chemicals. In the later
1970s, the region also responded to hazardous waste emergencies such as the PCB
contamination of a warehouse in Youngsville, Pennsylvania (U.S. EPA 2010f).
Since the passage of CERCLA, Region 3 has operated an active ERR Program.
To date, the Program has completed nearly 920 removal actions (U.S. EPA 2010e).
Several states in the region oversee and fund their own state remedial and ERR Programs.
For example, Pennsylvania’s 1988 Hazardous Sites Cleanup Act (HSCA) authorized the
state’s Department of Environmental Protection to eliminate threats to public health and
the environment from hazardous substances through removal and remedial actions (PA
Department of Environmental Protection 2010a). As of October 2009, nearly 200
response actions had used the state’s HSCA funding (PA Department of Environmental

13
Protection 2010b). Delaware also conducts response actions under authority granted by
its 1990 Hazardous Substance Cleanup Act to clean up sites not addressed under the
federal ERR Program (Delaware Department of Natural Resources 2010).
3.2 The Data Collection Effort
The starting point for our data collection effort was a recent EPA land use
assessment of sites within Region 3 where removal cleanup activities were completed
between January 1, 2001 and October 1, 2006 (U.S. EPA 2007). The assessment
identified 109 removal sites encompassing a total of 766 acres, with 93 sites and 463
acres occurring on non-NPL sites, and 16 sites and 303 acres occurring on NPL sites.
Some of the sites had more than one removal action; federal facilities were excluded from
consideration.
Because it could prove difficult to separate the potential impacts from removal
and remedial actions occurring at the same site, we limited our study to the non-NPL sites
identified in the EPA Region 3 report. For each site we gathered information about the
causes of contamination, the nature of involvement by EPA and PRPs, the types of
contamination and risks found, and detailed information about the cleanup process,
including the timeline of assessment and removal activities, cleanup costs, and
information sharing with the public by EPA and other sources.
We first reviewed the paper files in the Region 3 office for each site. Most of the
data items we were looking for are intended to be covered in the Pollution Reports filed
by OSCs for each removal action. However, we found the contents and scope of the files
varied substantially among sites so we gathered more information by searching on-line
resources such as the Region 3 website, the EPA Headquarters website for the ERR

14
Program, the EPA Comprehensive Environmental Response, Compensation, and
Liability Information System database (CERCLIS), and relevant state environmental
office websites.
The Agency for Toxic Substances and Disease Registry (ATSDR) Region 3 office
also shared their Records of Activity, Health Consultations, and Public Health
Assessments for sites when available, providing information about site history,
contaminants, and potential health risks prior to the completion of removal activities.
When paper and on-line records were unclear or contradictory, we sought clarification
from contacts in the Region 3 Hazardous Site Cleanup Division. These data were
supplemented by examining press releases and over 20 local newspapers through
LexisNexis Academic, Google, GoogleNews, and the archives of pertinent local
newspapers. We had greater difficulty finding articles about rural sites located in or near
towns with newspapers that do not archive their articles or that require a subscription to
access the archives.
3.3 Summary Statistics
The final dataset represents Region 3 sites with final removal action Pollution
Reports completed during the timeframe of January 1, 2001 - October 1, 2006 and with
removals started in 1996 or later. This covers 113 removal actions on 88 sites across 432
acres.5 Table 1 shows the breakdown of the number of actions, sites, and acreage by
state. The majority of the removal activities in our dataset occurred in Pennsylvania and
Virginia, the largest and most populated states in Region 3, followed by West Virginia.
5 Five of the 93 sites reviewed in U.S. EPA (2007) fell outside the study period, leaving 88 sites.

15
Note that our dataset is not necessarily a nationally representative sample of removal
actions.
Table 1: Removal Actions in Region 3 Dataset by State
State Number of Removal Actions
Number of Sites
Number of Acres*
District of Columbia 6 6 17 Delaware 7 7 37 Maryland 3 3 5 Pennsylvania 52 36 204 Virginia 23 20 98 West Virginia 22 16 72 Total 113 88 432
*Acreage is unknown for 9 sites (5 in PA, 3 in VA, and 1 in WV).
The sites are frequently located in populated areas. Table 2 shows that 80 percent
of the sample sites are in urban or suburban areas or towns. Many were the result of
contamination from old salvage yards, dumps, or former manufacturing facilities in areas
that are now residential, commercial, or in continued industrial use. Others were a result
of accidents or bio-terrorism. We discuss the nature of the contamination and the
removal activities in our sample in more detail in the next section.
Table 2: Nature of Site Location in Region 3 Dataset
State Urban Suburban/
Town Rural Total District of Columbia 6 6 Delaware 4 3 7 Maryland 2 1 3 Pennsylvania 10 20 6 36 Virginia 5 11 4 20 West Virginia 1 12 3 16 Total 28 43 17 88

16
There is an important distinction between removal sites and actions. Removal
sites are defined in the CERCLIS database and typically refer to continuous geographic
areas where cleanup activities occurred. Actions refer to the measures taken to address
the contamination. It is quite common (18 of our 88 sites) for multiple removal actions to
occur at a single site. Figure 3 presents the frequency of a total 121 removal actions for
our sample of 88 Region 3 sites. In most cases these actions are linked not just by
geographic location but also by the source of the contamination. For example, an initial
removal action might stabilize the situation before subsequent actions achieve a more
permanent cleanup.
Figure 3: Frequency of Multiple Removal Actions at Sites, Region 3 Dataset
It is also possible for removal actions at different sites to be linked through a
common history. For example, battery manufacturing in Hamburg, Pennsylvania,
resulted in extensive lead contamination throughout the town caused by smoke from the
0
10
20
30
40
50
60
70
1 2 3 4 5 6 7
Number of ERR Actions at the Site
Num
ber
of S
ites
in D
atas
et

17
plant’s smelter and the use of battery casings as infill. While the battery plant was listed
on the NPL in 2005, removal actions at 9 other sites throughout Hamburg have taken
place since 1993 to address imminent hazards. Since we do not have detailed
information on Region 3 removal actions outside our sample time frame, it is not possible
to fully characterize the extent of such linked actions, but we are aware of at least 18 sites
in our dataset where the incident resulting in the contamination also led to a removal
action at another site.
4 Contamination and Cleanup at Sample Removal Actions
This section examines the characteristics of the removal actions within our sample
of Region 3 sites. We begin by looking at the causes of the contamination and the role of
the EPA and PRPs in the cleanup response. This is followed by a detailed discussion of
the contaminants of concern and the risks they posed to public health. We conclude by
describing the cleanup actions used to address these risks as well as communications with
the public.
4.1 Causes of Contamination and Involvement by EPA and PRPs
A wide variety of events can cause or threaten contamination leading up to a
removal action, just as a wide variety of sources can initiate EPA involvement. The
parties responsible for the contamination are liable for the cleanup costs and they may be
allowed to lead the cleanup, as we explain below.
4.1.1 Events Causing or Threatening Contamination
Each removal action has its own unique story regarding the events triggering or
threatening the release of hazardous substances and leading up to federal intervention.

18
The incidents responsible for contamination can be broadly characterized as accidents,
natural disasters, improper handling and/or storage, improper disposal, and bio-terrorism.
Figure 4 presents the distribution among these categories for our set of 88 sites.
Figure 4: Events Threatening or Leading to Contamination at Region 3 Sites, 2001-2006
The most common reason for the release or threatened release of hazardous
substances was the improper disposal of materials. In a number of cases, improperly
buried waste leached hazardous substances into soil and/or groundwater. In other
instances, firms simply abandoned facilities and failed to properly dispose of hazardous
materials for reasons such as bankruptcy. This was the case at the Evans Chemical
manufacturing facility in Virginia, which was abandoned in 1992 along with hundreds of
drums leaking highly toxic substances.
The second leading cause of contamination was improper handling and/or storing
of hazardous materials. Many of these cases involved hazardous materials that the owner

19
planned to use in the future that were stored in deteriorating or uncovered drums. In a
few instances, students stole mercury from school labs, causing spills that exposed other
students, teachers, and their families.
Accidents were another cause of contamination, often related to the transportation
of hazardous materials by rail or truck. The Kelly Drive removal action in Pennsylvania
was precipitated by a train derailment in which two rail cars upended and began to leak
sulfuric acid.
Only one incident in our sample was the result of a natural disaster. In 2004,
Hurricane Gaston flooded Richmond, Virginia, with over 14 inches of rain in a two hour
period, causing four barrels of oil to leak into the James River. Nearly as rare but
particularly noteworthy were two highly publicized bio-terrorism cases involving ricin
and anthrax mailed to Congressional office buildings in Washington, D.C.
4.1.2 How the EPA Became Involved
There exists a distinction between the time that the contamination, or the threat of,
was discovered by a concerned party and the time at which the EPA became involved
with the cleanup efforts. Within our subset of Region 3 removal actions there are only a
few cases where the EPA was in control from the time of discovery. In most instances
the EPA became involved as the result of concerned parties reaching out to the agency.6
6 In some cases the EPA was contacted directly by the concerned party, while at other times the concerned party initially contacted the National Response Center who then relayed the information to the EPA. In this section we treat the latter to be equivalent to contacting the EPA directly due to a lack of information allowing us to differentiate between the two cases.
Concerned parties contacting the EPA include state and local government, responsible
parties, and concerned citizens. In other cases the EPA became aware of the
contamination as a result of monitoring at a previous removal action or by chance

20
discovery. In one instance the site was referred to the ERR Program by the Remedial
program. Figure 5 presents a chart for the sites in our sample summarizing how the EPA
became aware of the contamination requiring a removal action. As may be seen, there
was not enough information to determine how the EPA became involved for around a
third of the actions.
Figure 5: How EPA was Informed of the Contamination at Region 3 Sites, 2001-2006
For the cases where information was available, the most common way the EPA
became involved was through a request from a state agency. Direct requests from local
government affiliates were also fairly common among our sample of Region 3 removal
action. At three of the sites it was the Philadelphia Department of Licenses and
Inspections that first discovered the contamination. Afterwards the City of Philadelphia
Chance Discovery of Past
Contamination3%
State Government Request
30%
Local Government Request
12%Stakeholder
Request9%
Accident Lead from Beginning
1%
Federal Agency5%
Monitoring of Previous Removal Action
5%Unknown34%
Referred by Remedial Program
1%

21
contacted both the EPA and the Pennsylvania Department of Environmental Protection at
the same time. In the case of the Kelly Drive train derailment, discussed earlier, the
Philadelphia Emergency Operation Center contacted the EPA directly after surveying the
situation. In other instances the EPA was contacted directly by school districts, local fire
departments, and municipal water authorities.
Almost as frequent as requests by local authorities were requests directly from
stakeholders. These requests were typically from citizens concerned about potential
contamination. For example, at the Hamburg Broom Works site a concerned citizen
noticed exposed battery casings in a vacant lot where children frequently played; given
the potential for lead contamination, they subsequently contacted the EPA. At the
Starlight Lane Tire Fire in Virginia, a concerned citizen contacted the EPA when a brush
fire reached a scrap yard containing three to five million used tires. In one instance a
private remediation firm notified the EPA of groundwater contamination at a site which it
did not own.
In other cases the EPA was informed of the contamination by other federal
agencies such as the Nuclear Regulatory Commission or U.S. Fish and Wildlife Services.
Contamination at two of the sites was discovered by chance through unrelated EPA
activity at adjacent sites. For example, while involved with the removal action at the 12th
Street Dump site in Pennsylvania the EPA discovered oil contaminated sediment on the
tidal mudflat of the Brandywine Creek. This discovery led to further testing and
eventually a separate removal action. In four different instances the removal actions were
triggered by EPA monitoring of contamination levels at prior removal sites

22
4.1.3 Involvement of Potentially Responsible Parties
While EPA maintains authority during all removal actions, the intent of CERCLA
is for responsible parties to fund and implement the cleanup, when possible. As shown in
Table 3, PRPs were identified at 52 of the 88 sites in our dataset. Out of these 52, the
PRP led all removal actions at 24 of those sites, and at least one action at another 14 sites.
Table 3: PRP Involvement at Removal Sites, Region 3 Dataset
Number of Sites
PRP(s) Identified 52 Full PRP-led 24 PRP-led at least one action 14 Full EPA-led 14 No Identifiable PRP 36
When a PRP is identified, EPA can issue a special notice letter to solicit a good
faith offer from the party to conduct or finance the removal action. This process triggers
a 60-120 day moratorium on EPA cleanup activities, during which EPA works with the
PRP to develop a legally binding administrative order detailing the cleanup steps and
timeline. This was the case at the Absco Scrap Yard site in Philadelphia, Pennsylvania.
The site was long used as a scrap yard and had once been a rail yard. After half a century
of industrial use the soil at the site had become contaminated with PCBs and lead. The
EPA worked with the former owner of the scrap yard and the new owners of the property
to negotiate a settlement in which the PRPs funded and led the removal actions necessary
to clean up the site to a point where reuse was safe.
As a 60-120 day moratorium on action may pose unnecessary risks to the
community at sites warranting more immediate action, the region may waive the use of
special notice and issue general notice letters which will set more urgent deadlines for the

23
PRPs to state their willingness to undertake the cleanup action. If PRPs exist but do not
reach a settlement with EPA by the end of the established deadlines, EPA can issue a
unilateral administrative order to compel the private parties to complete the cleanup.
Under CERCLA section 106(b)(1) any party that violates a unilateral order without cause
may be subject to fines of up to $25,000 a day during the period of the violation. Such
unilateral orders provide a credible threat to encourage settlement and cooperation. If
however, the unilateral order fails to encourage action by the PRPs the EPA may consider
judicial action to compel cleanup or precede with a fund-financed removal action. If the
Agency chooses to finance the action it is able to recover costs in addition to punitive
damages from one to three times the costs expended as authorized by CERCLA section
107(c)(3). Unilateral administrative orders were issued at 10 of the 52 sites in our dataset
where a viable PRP was identified.
The situation on the ground does not always permit EPA to work with the PRPs to
develop a mutually acceptable agreement while preserving limited fund resources. When
contamination poses an imminent threat, EPA may undertake the removal action itself,
and then seek reimbursement for cleanup costs. The statute of limitations for cost
recovery is three years for removal actions, however under certain exceptions this may be
extended to six years under CERCLA section 104(c)(1)(C). Alternatively, a PRP may
engage in a removal action without an administrative order on consent or other
enforceable instrument in place. This type of action occurred at 11 of the PRP-led sites
in our dataset. In ten of those cases this represented the only removal action to take place
at the site. The other site was the Kelly Drive Sulfuric Acid spill in Philadelphia,
Pennsylvania, where 12 railcars containing sulfuric acid derailed leaving two cars laying
24
on their side and leaking. The PRP mobilized its own response team which began
neutralizing contamination with lime, while retrieving free-standing liquid using vacuum
truck pumps. While this initial removal action stabilized the site, there remained a need
for the PRP to conduct a second removal action in which the contaminated soil was
excavated and properly disposed.
In the absence of an identifiable and viable PRP, the role of leading and financing
the cleanup falls to EPA. At 36 of the 88 sites in our dataset, there is no indication of a
PRP being found that could be held liable. For example, at the Cosmechem site in
Baltimore, Maryland, police responding to a burglary found hazardous materials in drums
and bags at an adjacent abandoned property previously belonging to a wholesale
chemical distributing company that had long been dissolved. Given the need to eliminate
the health threat the EPA itself removed and disposed of over 5,300 pounds of hazardous
materials.
4.2 Contamination and Risks
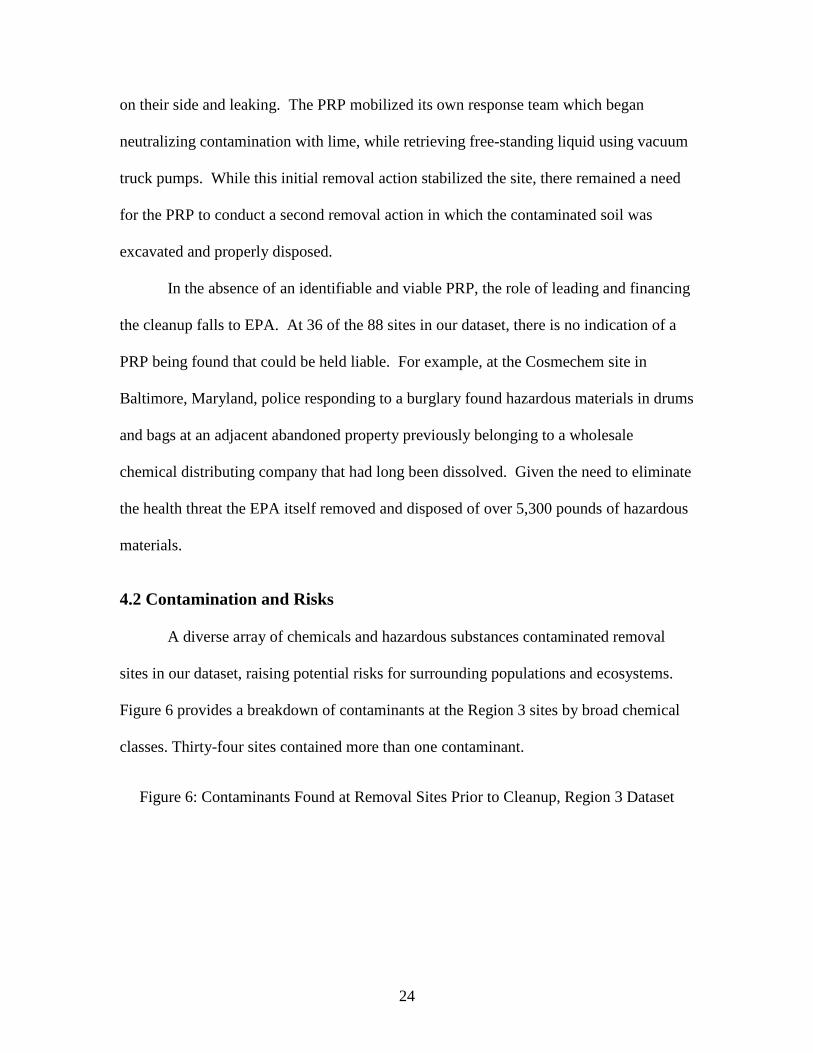
A diverse array of chemicals and hazardous substances contaminated removal
sites in our dataset, raising potential risks for surrounding populations and ecosystems.
Figure 6 provides a breakdown of contaminants at the Region 3 sites by broad chemical
classes. Thirty-four sites contained more than one contaminant.
Figure 6: Contaminants Found at Removal Sites Prior to Cleanup, Region 3 Dataset

25
The most common contaminants out of more than 50 substances identified at the
sites included lead, mercury, and other metals and metalloids; polychlorinated biphenyls
(PCBs), polycyclic aromatic hydrocarbons (PAHs), and other aromatic hydrocarbons;
and corrosive chemicals such as sulfuric acid. These chemicals present a spectrum of
health risks ranging from cancer to major organ damage to developmental disorders.
Over half of the sites in the dataset contained at least one carcinogen, such as arsenic,
chromium, PCB, trichloroethylene (TCE), or sulfuric acid. The data also reveal less
common but still notable hazards such as radioactive materials and the biological agents
anthrax and ricin.
This heterogeneity in contaminants is echoed in the variety of contaminated
environmental media across removal sites. Table 4 shows that out of the 76 sites for
which information is available, soil was the most frequently contaminated medium.
However, air, groundwater, and surface water contamination were also prevalent at
removal sites. Indeed, some of the program’s most urgent cases involved health risks via
26
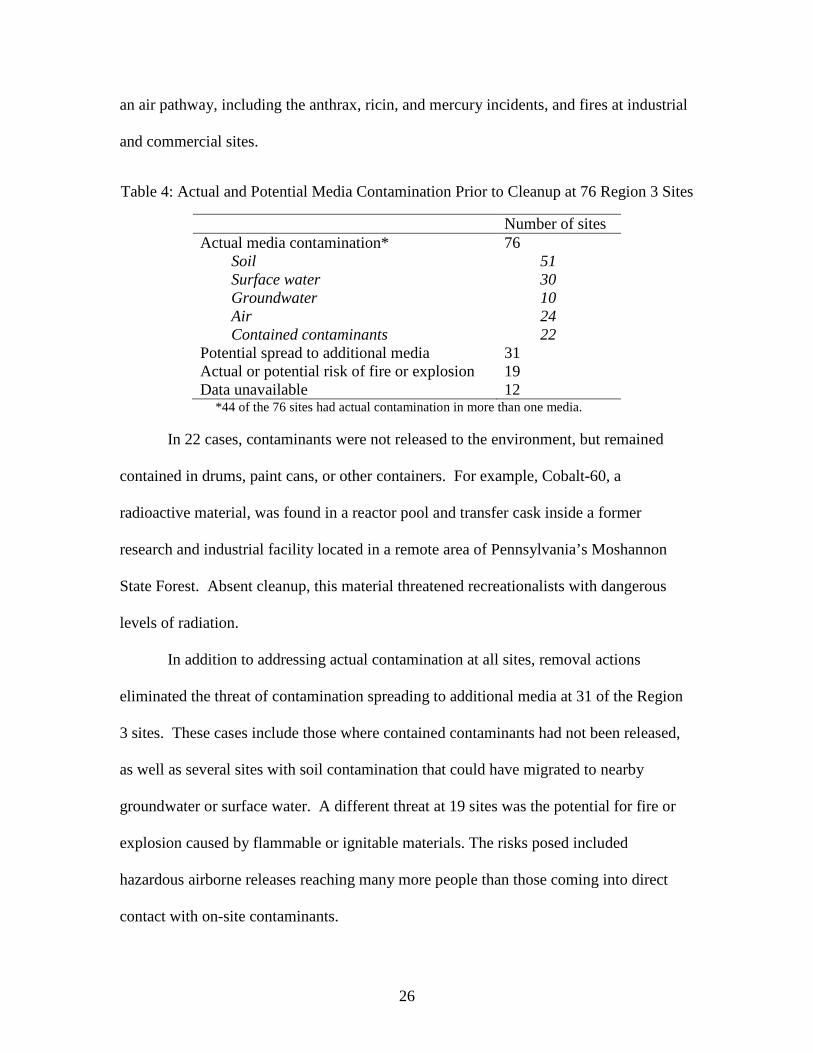
an air pathway, including the anthrax, ricin, and mercury incidents, and fires at industrial
and commercial sites.
Table 4: Actual and Potential Media Contamination Prior to Cleanup at 76 Region 3 Sites
Number of sites Actual media contamination* 76 Soil 51 Surface water 30 Groundwater 10 Air 24 Contained contaminants 22 Potential spread to additional media 31 Actual or potential risk of fire or explosion 19 Data unavailable 12
*44 of the 76 sites had actual contamination in more than one media.
In 22 cases, contaminants were not released to the environment, but remained
contained in drums, paint cans, or other containers. For example, Cobalt-60, a
radioactive material, was found in a reactor pool and transfer cask inside a former
research and industrial facility located in a remote area of Pennsylvania’s Moshannon
State Forest. Absent cleanup, this material threatened recreationalists with dangerous
levels of radiation.
In addition to addressing actual contamination at all sites, removal actions
eliminated the threat of contamination spreading to additional media at 31 of the Region
3 sites. These cases include those where contained contaminants had not been released,
as well as several sites with soil contamination that could have migrated to nearby
groundwater or surface water. A different threat at 19 sites was the potential for fire or
explosion caused by flammable or ignitable materials. The risks posed included
hazardous airborne releases reaching many more people than those coming into direct
contact with on-site contaminants.

27
A completed exposure pathway depends not only on the presence of contaminants
in environmental media, but also on human contact through inhalation, ingestion, or
dermal absorption. For many of the Region 3 sites, information is unavailable about the
actual route of exposure to contamination, how many individuals (if any) were exposed,
and at what levels. Table 5 attempts to provide a qualitative picture of the types of health
risks that removal actions may have helped mitigate. The table presents the four most
common exposure pathways of concern at the 73 sites for which information was
available. It is worth noting, however, that a focus on individual exposure pathways
could obscure potential interactions among multiple pathways, which are present at many
sites.
Table 5: Most Common Exposure Pathways Prior to Cleanup at Region 3 Sites
Contaminant Medium Potential exposure route
Residential/ industrial screening level*
Median concentration at sites [range]**
Number of sites
Lead Soil Ingestion 400/800 ppm
9975 ppm [100 – 522,000]
27
PAHs*** Soil Inhalation, ingestion
0.015/0.21 ppm
37 ppm [5 – 220]
9
Mercury Air Inhalation 0.31/1.3 µg/m3
55 µg/m3
[19 – 100] 7
PCBs Stream sediment
Ingestion of sport fish
0.22/0.74 ppm
11 ppm [0.37 – 1580]
6
* The Region 3 screening levels represent “chemical-specific concentrations for individual contaminants in air, drinking water and soil that may warrant further investigation or site cleanup” (U.S. EPA 2008). Screening levels are not cleanup standards. They are also nonbinding and can vary from site to site. Screening levels are based on human health considerations and do not consider ecological effects. ** For sites where more than one sampled concentration level was available, the highest level was used to determine the median and range across sites. Sampling data were unavailable for 1 lead site, 5 PAH sites, and 2 mercury sites. *** The reported PAH screening level and sampled concentrations are for benzo(a)pyrene, considered to be among the most toxic and well-studied PAH compounds (ATSDR 2010a).
Exposure to lead-contaminated soil through ingestion was the most common
potential pathway. Incidental ingestion is the typical exposure route of concern,

28
especially for young children who play outside. Intentional ingestion is rare but still
another possibility that raises alarm at sites where children play (ATSDR 2007). In at
least one case (Philadelphia’s Logan neighborhood), consumption of vegetables grown
on-site was a potential means of ingestion. Lead can damage major organs, reproductive
function, and especially the central nervous system. Children, in particular, are vulnerable
to cognitive and neurobehavioral impairment (ATSDR 2007). Adults are vulnerable to
hypertension and cardiovascular effects (Navas-Acien, et al. 2007).
Soil sampling data reveal that most lead-contaminated sites substantially
exceeded EPA’s screening level. At removal sites in Hamburg, Pennsylvania, lead in the
soil reached concentrations in the tens of thousands of parts per million. While the
precise exposure and health impacts are unknown at these sites and causal relationships
cannot be established, 17 percent of children in the Hamburg zip code who were screened
for lead between 1998 and 2004 had blood levels of at least 10 µg/dL (ATSDR 2010b),
compared to a 9 percent statewide average over the same period (CDC 2010). The
Centers for Disease Control considers interventions where children’s blood lead levels
exceed 10 µg/dL, although levels less than 10 µg/dL are associated with decreased IQ in
populations evaluated in epidemiological studies (ATSDR 2007). At the Arthur Road
Duplex site in Reedsville, West Virginia, contaminated sand used as fill caused soil lead
concentrations of almost 5000 ppm at a residential property where young children lived.
ATSDR (2006) estimated that exposed children could have experienced blood lead levels
ranging from 3.1 to 24.9 µg/dL, depending on the number of days spent playing on the
soil, the amount of soil tracked inside the home, and the age of the child, with toddlers
significantly more vulnerable than older children.

29
Ingestion or inhalation of PAHs in soil or dust was another relatively frequent
pathway. PAHs are a group of over one hundred compounds, several of which are
carcinogens. Concentrations of benzo(a)pyrene, one of the most toxic and well-studied
PAHs, reached high levels at the four sites where data are available. At the Dalzell
Viking Glass Company site, ATSDR (2010a) estimated that lifetime cumulative exposure
for nearby residents to benzo(a)pyrene (found in the soil at 5 ppm) and other PAHs could
yield a theoretical excess cancer risk of 1 in 10,000.
Exposure to elemental mercury released by spills occurred at seven sites,
including two high schools and a college. At a residence in Hatboro, Pennsylvania, a
mercury spill caused acute poisoning and hospitalization for all members of the
household, including five children. Mercury poisoning typically causes renal and
neurological damage through inhalation of mercury vapors (Risher 2003), though acute
exposure can also lead to skin and eye irritation; cardiovascular, gastrointestinal, and
respiratory impairment; and even death.
Sediment contaminated with PCBs—a group of chemicals that are probable
carcinogens and can cause reproductive and development disorders—was found in
streams or tributaries at several sites. The primary pathway of concern was consumption
of sport fish. For example, runoff from sandblasting pools at the Warwick Township
Real Estate site in Bucks County, Pennsylvania, led to PCB contamination in a nearby
popular recreational fishing creek. Screened sport fish tissue samples revealed PCB
contamination above levels of concern (ATSDR 1999, 2000a). While a removal action
was undertaken to eliminate the source of contamination, the Pennsylvania Department of
Public Health also recommended a temporary fish consumption advisory for carp and
30
other sport fish. Meanwhile, contamination did not reach levels considered a public
health risk at all sites. PCBs migrating from the Diamond State Salvage site to
Brandywine Creek in New Castle County, Delaware, were identified in stream sediment
at a maximum concentration of 0.37 ppm, and ATSDR (1998) found no evidence of
sufficient fish consumption to raise alarm.
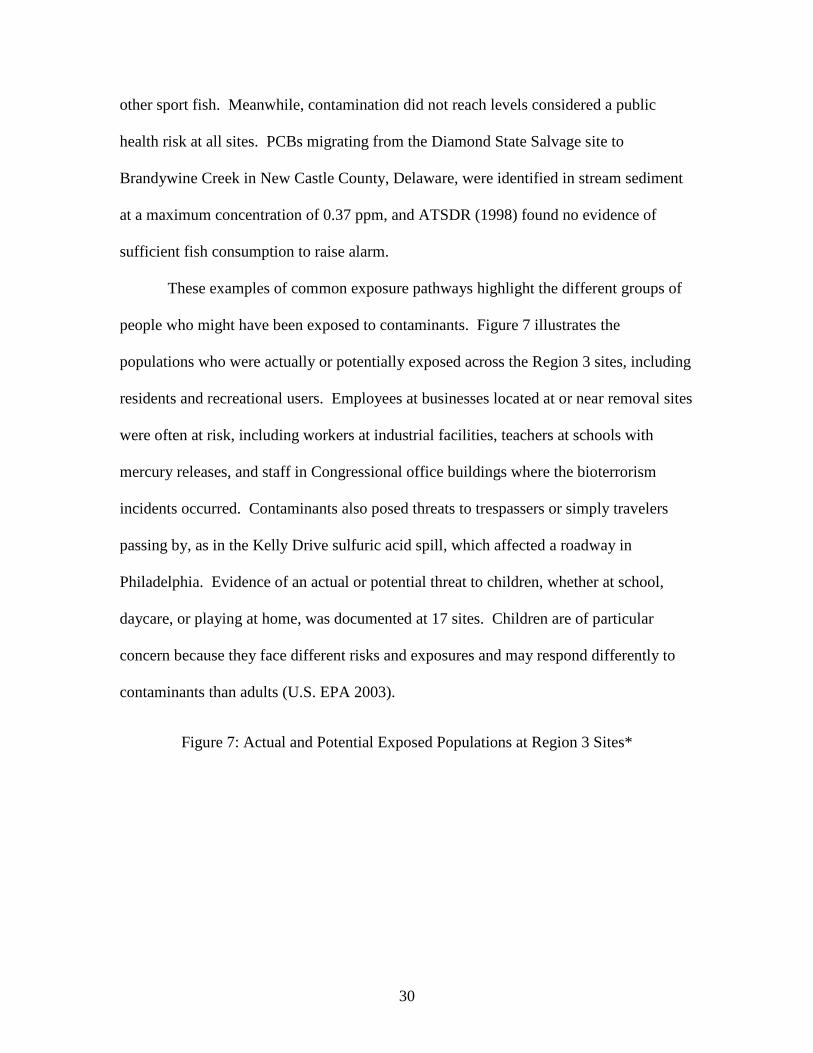
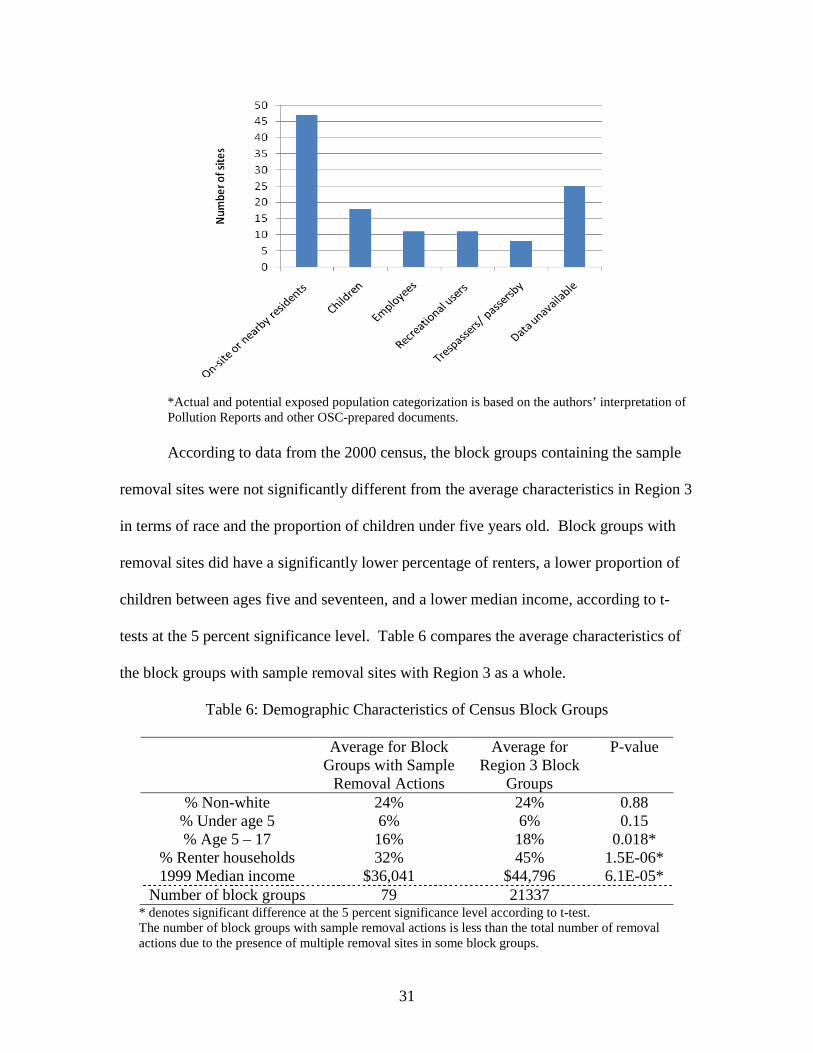
These examples of common exposure pathways highlight the different groups of
people who might have been exposed to contaminants. Figure 7 illustrates the
populations who were actually or potentially exposed across the Region 3 sites, including
residents and recreational users. Employees at businesses located at or near removal sites
were often at risk, including workers at industrial facilities, teachers at schools with
mercury releases, and staff in Congressional office buildings where the bioterrorism
incidents occurred. Contaminants also posed threats to trespassers or simply travelers
passing by, as in the Kelly Drive sulfuric acid spill, which affected a roadway in
Philadelphia. Evidence of an actual or potential threat to children, whether at school,
daycare, or playing at home, was documented at 17 sites. Children are of particular
concern because they face different risks and exposures and may respond differently to
contaminants than adults (U.S. EPA 2003).
Figure 7: Actual and Potential Exposed Populations at Region 3 Sites*
31
*Actual and potential exposed population categorization is based on the authors’ interpretation of Pollution Reports and other OSC-prepared documents. According to data from the 2000 census, the block groups containing the sample
removal sites were not significantly different from the average characteristics in Region 3
in terms of race and the proportion of children under five years old. Block groups with
removal sites did have a significantly lower percentage of renters, a lower proportion of
children between ages five and seventeen, and a lower median income, according to t-
tests at the 5 percent significance level. Table 6 compares the average characteristics of
the block groups with sample removal sites with Region 3 as a whole.
Table 6: Demographic Characteristics of Census Block Groups
Average for Block Groups with Sample
Removal Actions
Average for Region 3 Block
Groups
P-value
% Non-white 24% 24% 0.88 % Under age 5 6% 6% 0.15 % Age 5 – 17 16% 18% 0.018*
% Renter households 32% 45% 1.5E-06* 1999 Median income $36,041 $44,796 6.1E-05*
Number of block groups 79 21337 * denotes significant difference at the 5 percent significance level according to t-test. The number of block groups with sample removal actions is less than the total number of removal actions due to the presence of multiple removal sites in some block groups.

32
Sites addressed by the ERR Program can threaten not only human health, but also
ecosystems. Many sites are located on undeveloped land or near surface water that
provides habitat for wildlife. Contaminants sometimes inflict similar adverse impacts on
wildlife as they do on people. For instance, lead ingestion leads to immunological,
neurological, reproductive, developmental, and carcinogenic effects in animals as well as
humans (ATSDR 2007). In fact, lead contamination, mainly from lead shot, is a leading
cause of mortality for wild birds (USGS 2009). In Harbeson, Delaware, birdwatchers
chanced upon dozens of dead or injured swans suffering from lead poisoning caused by
the use of the site as a former skeet shooting range, prompting a removal action to
address contaminated soil and water.
Actual or potential hazards to animals or ecosystems were documented at 15 sites,
including the sites with PCB-contaminated fish, as well as five sites with fish kills or
other animal deaths. Potential contamination was a concern at additional sites located
near sensitive habitats, domesticated animals, wildlife, or recreational areas.
4.3 Cleanup Actions
Cleanup activities and costs at removal sites are quite variable, reflecting the wide
variety of contaminants found there. The time required to complete cleanup activities is
most frequently less than six months in our Region 3 sample, but can be much longer as
we will see below.
4.3.1 Types of Removal Actions
Given the tremendous heterogeneity in exposed populations, contaminants, and
triggering events in Region 3, it is not surprising that a wide array of cleanup approaches
was used during removal actions. Out of 60 sites for which some data on cleanup actions
33
were available, the most prevalent types of activities were the removal of contained
contaminants and debris (39 sites) and actions addressing contaminated soil (37 sites).
Chemical spills, contaminated groundwater, surface water, or air pollution were
addressed at more than ten sites in the sample. There is also diversity in the activities
used to target each type of media. The cases of groundwater, soil contamination, and air
pollution provide good examples to highlight this heterogeneity. There exists slightly
more homogeneity in the cleanup actions taken to address surface water contamination.
Cleanup activities explicitly addressed groundwater at 12 sites in the dataset.7
A typical ERR Program response to groundwater contamination is to provide
residents with clean drinking water. Residents are typically supplied with bottled drinking
water until access to safe drinking water can be restored via connection to public water
supplies or by having proper filtration equipment installed on their wells (U.S. EPA
2000b, Probst and Konisky 2001).
In
many cases these activities were designed to address potential future groundwater
contamination. For example, at the National Vulcanized Fiber site in Chester County,
Pennsylvania, contaminated soil beneath the firm’s retention pond was disposed of while
a new liner was installed to prevent future groundwater contamination. At the I-81
Tractor Trailer Chemical Spill in Augusta County, Virginia, storm water drainage
systems were pumped in order to prevent future contamination of groundwater.
The actual cleanup of contaminated groundwater during removal actions is rare
due to the time required for the pump and treat process to be successful. Sites where this
type of action is necessary might instead be referred to the Superfund Remedial program.
7 Note that just because removal actions did not address groundwater explicitly at all sites with potential groundwater contamination does not mean it was neglected. Often addressing current soil contamination, for example, can help prevent future groundwater contamination.
34
However, two removal actions in our sample involved groundwater cleanup – at one, the
time required for treatment to be successful was relatively short; at the other, rapid
treatment was not a practical option. At the Village of Reeders site in Monroe County,
Pennsylvania, residents contacted the EPA to report a foul odor associated with their
drinking water. A number of heavy metals and other contaminants were found in the
groundwater. Residents were provided with bottled water until a safe drinking water
supply could be restored when activated carbon filtration systems were installed in the
affected wells. In Glendale, West Virginia, an underground storage tank began leaking
trichloroethylene into the groundwater used by the town’s residents. An air stripper was
installed to decontaminate the water supply. As this treatment approach would require
nearly three years to achieve safe drinking water levels, it was necessary to install a new
well to supply the town with water in the meantime.
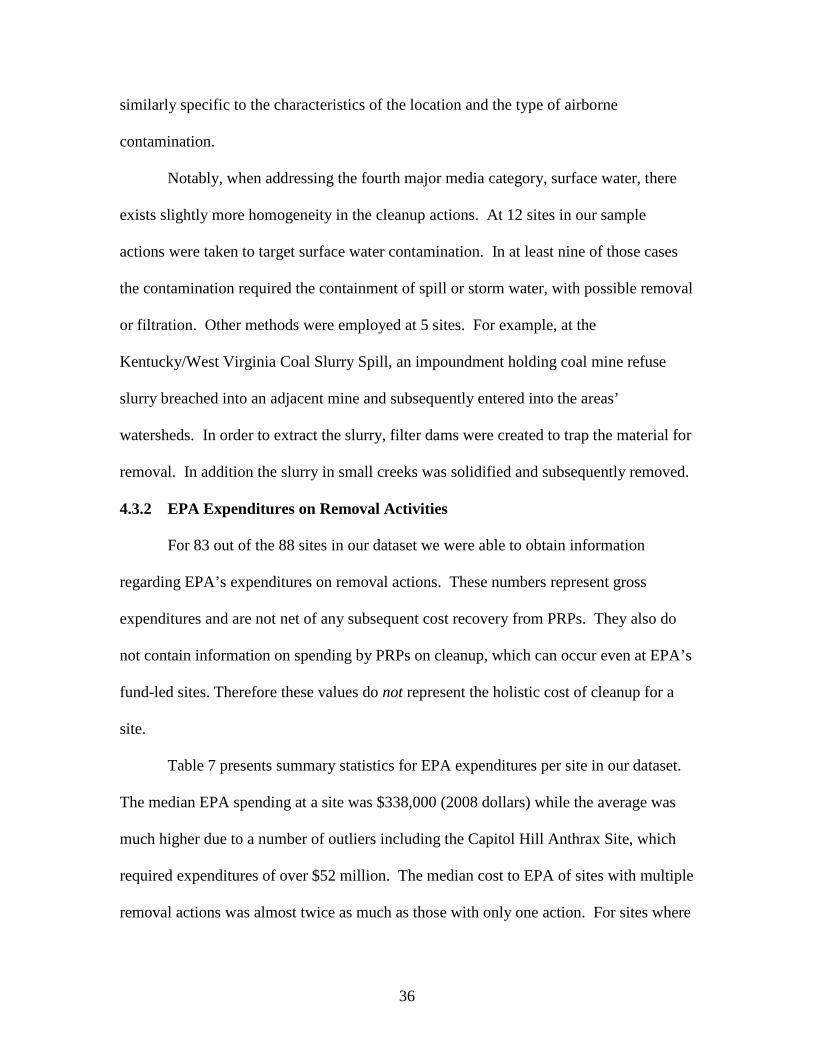
Similar diversity may be found in the cleanup actions addressing soil. At 37 sites
in our sample information on the type of soil cleanup was available, including cap and
containment actions, onsite treatment, or offsite treatment. As shown in Table 6, some
type of cap and containment action occurred at 15 sites.
Table 6: Soil Cleanup Actions at Region 3 Sites, 2001-2006
Type of Cleanup Action # of Sites % of Sites Cap and containment 15 17% Onsite treatment 1 1% Excavation and Disposal or Treatment Offsite 32 36% Other 5 6% Total* 37 42%
*Data on the type of soil cleanup performed were only available for 37 out of 51 sites with soil contamination.
On-site treatment was unusual due to the difficulty of addressing most types of
soil contamination in place and the typical lack of space or facilities for proper disposal.

35
However, it was feasible at the Motiva Enterprises site in New Castle County, Delaware.
An explosion at the industrial facility released approximately one million gallons of
sulfuric acid. Neutralizing agents such as lime and calcium hydroxide were mixed with
the soil to counteract the contamination. These efforts were followed up with a soil cap
and numerous efforts to reduce erosion and run-off.
More common was the use of excavation and offsite disposal or treatment of the
contaminated soil. While the specifics of the process varied, the Irondale Lead Site in
Wise County, Virginia, illustrates the general framework. In response to lead
contamination in the soil that threatened local water systems, EPA excavated the soil and
removed it from the site for proper disposal. Afterwards a soil cap was used to contain
trace elements in the remaining soil. Soil caps are sometimes used without soil
excavations as well. At the Dead Swan Site in Harbeson, Delaware, the land was capped
and covered with pine trees to contain lead-contaminated soil and prevent erosion and
run-off.
While air pollution is less often addressed in removal actions, there remains some
variation among those sites where it is targeted. Eleven sites in our sample were the
subjects of cleanup actions related to existing, or potential, air contamination. In two
instances it was necessary to vent the pollution from an enclosed structure. This included
the Cardozo High School site in the District of Columbia, where three students stole
mercury from a chemistry lab and later released it in the school. At other sites such as
the Capitol Hill Anthrax site in the District of Columbia, gaseous chlorine dioxide was
used to kill the anthrax spores that were airborne. The treatment at the other sites is
36
similarly specific to the characteristics of the location and the type of airborne
contamination.
Notably, when addressing the fourth major media category, surface water, there
exists slightly more homogeneity in the cleanup actions. At 12 sites in our sample
actions were taken to target surface water contamination. In at least nine of those cases
the contamination required the containment of spill or storm water, with possible removal
or filtration. Other methods were employed at 5 sites. For example, at the
Kentucky/West Virginia Coal Slurry Spill, an impoundment holding coal mine refuse
slurry breached into an adjacent mine and subsequently entered into the areas’
watersheds. In order to extract the slurry, filter dams were created to trap the material for
removal. In addition the slurry in small creeks was solidified and subsequently removed.
4.3.2 EPA Expenditures on Removal Activities
For 83 out of the 88 sites in our dataset we were able to obtain information
regarding EPA’s expenditures on removal actions. These numbers represent gross
expenditures and are not net of any subsequent cost recovery from PRPs. They also do
not contain information on spending by PRPs on cleanup, which can occur even at EPA’s
fund-led sites. Therefore these values do not represent the holistic cost of cleanup for a
site.
Table 7 presents summary statistics for EPA expenditures per site in our dataset.
The median EPA spending at a site was $338,000 (2008 dollars) while the average was
much higher due to a number of outliers including the Capitol Hill Anthrax Site, which
required expenditures of over $52 million. The median cost to EPA of sites with multiple
removal actions was almost twice as much as those with only one action. For sites where

37
all removal actions were PRP-led and financed, median EPA expenditures were $111,000
per site for payroll, travel, assessment, and other costs. Median costs to EPA at sites with
soil and groundwater contamination and contained contaminants were higher than those
with surface water or air contamination or the risk of fire or explosion.

38
Table 7: EPA Expenditures per Removal Site, Region 3 Dataset (Thousands of 2008$)
Number of Sites
Average Median Min Max
All Sites 83 $2,127 $338 $0 $52,443 With 1 Action 60 $2,382 $231 $0 $52,443 With >1 Action 23 $1,462 $436 $43 $8,874 Fully PRP-Led 21 $173 $111 $0 $658 Soil Contamination 49 $2,191 $620 $43 $20,397 Surface water Contamination
27 $2,121 $386 $41 $20,397
Groundwater Contamination
9 $548 $524 $25 $1,263
Air Contamination 23 $3,008 $306 $43 $52,443 Risk of fire or explosion 22 $513 $242 $40 $2,152 Contained contaminants 22 $1,567 $766 $40 $8,874
4.3.3 Length of Removal Actions and Information Sharing
We also gathered information on the length of removal actions. These data reflect
the relatively quick remedies typically used during removal actions. Not considering
assessment and design, the cleanup process took on average 19 months per action, with a
median of 8 months indicating the presence of large outliers. The distribution of the
length of actions in our dataset is broken down in more detail in Table 8. Thirty-six
percent required more than a week but less than six months to complete. At the same
time, our dataset contains many longer actions as well, including 27 percent that took
over two years to complete.
Table 8: Length of Removal Actions, Region 3 Dataset*
Length of Removal Action
Number of Actions
% of Total
<1 week 4 4% 1 week - 6 months 40 36% 6-12 months 22 20% 1-2 years 15 14% >2 years 30 27% Total 113
*For 2 of the 113 removal actions end dates were not available. Percentages do not add up to 100 due to rounding.

39
Note these dates correspond to the time spent on the actual removal activities.
They do not include site assessment, which can occur concurrently with removal actions
or begin months or years beforehand. The date of discovery or the event that triggered
the removal may have occurred months to years before the site assessment as well. For
the 67 sites for which we have information on the entire timeline of events, the time from
discovery of contamination to the start of the first cleanup action averaged nearly 9
months, but this is influenced by a few outliers that were over 4 years. The median time
from discovery to the cleanup start was less than 3 months.
During a removal action, the type and frequency of communication with the
public varies according to the length and urgency of cleanup. Longer and more complex
actions typically involve more extensive communication efforts and sometimes even
include a formal Community Involvement Plan based on community interviews. To
inform the public, an OSC might hold meetings with local officials or the media, among
other steps (U.S. EPA 2005b). For 36 of the sample sites, we located evidence of
information sharing through news stories (30 sites), letters/fact sheets (20 sites), public
meetings (10 sites), and press conferences (4 sites). While this provides some evidence
that the public is informed, we hesitate to interpret the degree of public understanding
regarding the precise nature and severity of risks present at removal sites.
5. Conclusions
The focus by the economics literature on measuring the net benefits of the
Remedial Program, while neglecting the value of the ERR Program, may present an
incomplete assessment of the Superfund Program. This paper seeks to motivate research

40
in this area by providing an initial look into the ERR Program as illustrated by half a
decade’s worth of cleanup efforts in EPA’s Region 3. The process of discovery,
financing, and cleaning up removal sites involves a diverse number of stakeholders—
from EPA to PRPs to state and other government agencies—responding to a large variety
of contamination events. There is also tremendous diversity among the public health
risks addressed by the program. The flexibility of the ERR Program to handle these
hazards suggests that its benefits to society will arrive in many forms. Perhaps the ERR
Program as a whole confers two levels of benefits – an aggregation of localized effects
plus the insurance value of a national program that stands ready to address emergency
contamination of almost any nature. The goal of this paper was not to quantify these
benefits, or to provide a thorough assessment of the program’s cost, but to explore the
potential and provide motivation for future research into this important but often
overlooked part of EPA’s cleanup initiative.
In theory, risk assessment, hedonic property value, averting behavior, and even
recreation demand models all offer potential approaches to estimate the benefits of
removal actions, but they raise a variety of challenges. The relatively speedy nature of
the cleanups, compounded by uncertainty about the extent of public awareness of and
actual exposure to contamination, means it could be difficult to observe market
transactions that meaningfully reflect the public’s responses to contamination and
cleanup. The heterogeneity of contaminants, exposure pathways, and cleanup approaches
also pose difficulties for analysis. In addition, many of these sites are fairly small – less
than 5 acres on average for the sample – thus, the geographic scope of effects might be
41
limited and hard to measure. Still, further exploration of one or a set of these approaches
might move us toward quantification of the benefits of removal actions.
Another unique characteristic of the ERR Program that complicates benefits
assessment is that it addresses not only past contamination but also threatened releases of
hazardous substances. We find that a significant portion of the program addresses the
threat of fire or explosion and contained contaminants with potential for release.
Addressing these types of hazards before they cause acute problems may be a more cost-
effective method than waiting for exposure to occur before beginning cleanup. However,
quantifying risk reductions associated with these actions is challenging because they
depend on the probability that a fire, explosion, or release of chemicals would have
occurred if the contamination was left unaddressed. In order to obtain a full picture of
the benefits derived from the ERR Program the value of such risk reductions needs to be
addressed.
Data availability is a challenge to describing both benefits and costs of the ERR
Program. To paint even a partial picture of the benefits from removal actions, we found it
necessary to examine a wide variety of data sources. A consolidation of information into
OSC Pollution Reports or CERCLIS would help address this issue. To assess the ERR
Program’s net benefits, a more complete collection of cost data incorporating PRP
expenditures would also be required. Still, the program’s track record of quickly
addressing immediate threats suggests that the present value of these net benefits is not
likely to be diluted by long time spans between discovery of contamination and cleanup,
as is sometimes the case with the Remedial Program which addresses complex
contamination that often requires lengthy cleanups (Messer et al. 2006).

42
Finally, it is worth noting that, because of the prevalence of removal actions on
NPL sites, previous estimates of the value of NPL cleanups may already include
important benefits from the ERR Program. Future investigations into the value of
Superfund cleanups would present a more balanced picture by identifying and accounting
for removal actions that occur on remedial sites.
43
References
ATSDR (1998). Health Consultation: Diamond State Salvage. Atlanta, Georgia: DHHS, U.S. Public Health Service, ATSDR. http://www.atsdr.cdc.gov/HAC/pha/PHA.asp?docid=986&pg=0. ATSDR (1999). Health Consultation: Warwick Township Real Estate. Atlanta, Georgia: DHHS, U.S. Public Health Service, ATSDR. ATSDR (2000a). Health Consultation No. 2: Warwick Township Real Estate, a.k.a. Andela. Atlanta, Georgia: DHHS, U.S. Public Health Service, ATSDR. ATSDR (2000b). Health Consultation: Logan Lead Site. Atlanta, Georgia: DHHS, U.S. Public Health Service, ATSDR. ATSDR (2006). Public Health Assessment: Reedsville Scattered Foundry. Atlanta, Georgia: DHHS, U.S. Public Health Service, ATSDR. http://www.atsdr.cdc.gov/HAC/pha/ReedsvilleScatteredFoundryWasteCerclisSite/ReedsvilleScatteredFoundryPHA090706.pdf. ATSDR (2007). Toxicological Profile for Lead. Atlanta, Georgia: DHHS, U.S. Public Health Service, ATSDR. http://www.atsdr.cdc.gov/ToxProfiles/tp13.pdf ATSDR (2010a). Public Health Assessment: Dalzell Viking Glass Company Site. Atlanta, Georgia: DHHS, U.S. Public Health Service, ATSDR. http://www.atsdr.cdc.gov/HAC/pha/DalzellVikingGlassCompanySite%5CDalzellVikingGlassCompanySitePHA51710.pdf. ATSDR (2010b). Public Health Assessment: Price Battery Site. Atlanta, Georgia: DHHS, U.S. Public Health Service, ATSDR. British Broadcasting Corporation. 2010. “On This Day: 1950-2005, 29 March 1967, ‘Bombs Rain Down on Torrey Canyon.’” http://news.bbc.co.uk/onthisday/hi/dates/stories/march/29/newsid_2819000/2819369.stm. British Broadcasting Corporation Cornwall. 2010. “Torrey Canyon disaster revisited.” http://news.bbc.co.uk/local/cornwall/hi/people_and_places/nature/newsid_8753000/8753329.stm CDC (2010). National Surveillance Data. National Center for Environmental Health. http://www.cdc.gov/nceh/lead/data/national.htm. Messer, Kent, William Schulze, Katherine Hackett, Trudy Cameron, and Gary McClelland. 2006. “Can Stigma Explain Large Property Value Losses? The Psychology and Economics of Superfund.” Environmental and Resource Economics 33: 299-324.

44
Navas-Acien, Ana, Eliseo Guallar, Ellen K. Silbergeld, and Stephen J. Rothenberg. 2007. “Lead Exposure and Cardiovascular Disease—A Systematic Review.” Environmental Health Perspectives. 115(3): 472–482. Probst, Katherine N. and David M. Konisky (2001) Superfund’s Future: What Will It Cost? Resources for the Future. Washington, D.C. Risher, J.F. (2003). Elemental Mercury and Inorganic Mercury Compounds: Human Health Aspects. Concise International Chemical Assessment Document 50. Geneva: World Health Organization. http://www.inchem.org/documents/cicads/cicads/cicad50.htm. U.S. EPA (1987) Memorandum from General Council to Assistant Administrator of Solid Waste and Emergency Response. Subject: Scope of the CERCLA Petroleum Exclusion Under Sections 101(14) and 104(a)(2). July 31, 1987. http://www.epa.gov/compliance/resources/policies/cleanup/superfund/petro-exclu-mem.pdf. U.S. EPA (2000a). Memorandum from Stephen Luftig, Director, Office of Emergency and Remedial Response, and Barry Breen, Director, Office of Site Remediation Enforcement. To Regions I-X, Program and Legal Division Directors. Subject: Use of Non-Time Critical Removal Authority in Superfund Response Actions. February 14, 2000. http://www.epa.gov/superfund/policy/remedy/pdfs/memofeb2000-s.pdf. U.S. EPA (2000b). The EPA Emergency Response and Removal Program: Over Two Decades of Protecting Human Health and the Environment. EPA 540-K-00-002. U.S. EPA (2003). Children’s Health Valuation Handbook. EPA 100-R-03-003. U.S. EPA (2005a). 2005 Year in Review: Emergency Management – Prevention, Preparedness and Response. OEM Annual Report. http://www.epa.gov/oem/docs/chem/OEM_2005review.pdf. U.S. EPA (2005b). Superfund Community Involvement Handbook. EPA 540-K-05-003. April 2005. http://www.epa.gov/superfund/community/cag/pdfs/ci_handbook.pdf. U.S. EPA (2007). Assessment of the Current Land Use at EPA Region 3’s Emergency Response & Removal Sites. EPA Region 3. May 2007. http://www.epa.gov/reg3hwmd/bf-lr/removal/final_removal_report%20.pdf. U.S. EPA. 2008. Regional Screening Levels for Chemical Contaminants at Superfund Sites. As accessed at http://epa-prgs.ornl.gov/chemicals/index.shtml. Prepared by EPA Office of Superfund and Oak Ridge National Laboratory.

45
U.S. EPA (2010a). Emergency Response and Cleanup Activities. http://www.epa.gov/oem/content/er_cleanup.htm. U.S. EPA (2010b). National Oil and Hazardous Substances Pollution Contingency Plan Overview. http://www.epa.gov/oem/content/lawsregs/ncpover.htm. U.S. EPA (2010c). Emergency Response Authorities. http://www.epa.gov/emergencies/content/nrs/auth.htm. U.S. EPA (2010d). Subpart J: The National Oil and Hazardous Substances Pollution Contingency Plan (NCP) Product Schedule. http://www.epa.gov/oem/content/ncp/factsheet.htm. U.S. EPA (2010e) EPA’s Comprehensive Environmental Response, Compensation, and Liability Information System (CERCLIS) Database. http://www.epa.gov/enviro/html/cerclis/. U.S. EPA (2010f). News Releases by date: "EPA Supports Superfund "Polluter Pays" Provision/Agency submits administration's guidance to Congress". Accessed May 2011. http://www.epa.gov/newsroom/index.htm. USGS National Wildlife Health Center (2009). Lead Poisoning in Wild Birds. http://www.nwhc.usgs.gov/publications/fact_sheets/pdfs/lead_poisoning_wild_birds_2009.pdf U.S. GAO (1996a). A Superfund Tool for More Efficient Cleanups. GAO/RCED-96-134R. U.S. GAO (1996b). Time and Cost Limits on Superfund Removals. GAO/RCED-96.195R. U.S. GAO (2003). Capitol Hill Anthrax Incident. GAO-03-686. U.S. GAO (2008). Superfund: Funding and Reported Costs of Enforcement and Administration Activities. GAO-08-841R. U.S. National Response Team (2009). The National Response System: Federal, state, and local governments working together to protect Americans from threats to our land, air, and water. National Response System Outreach Presentation Version 10.0. http://www.nrt.org/Production/NRT/NRTWeb.nsf/AllPagesByTitle/P-AboutNRT. U.S. National Response Team (2010). Laws, Regulations, and Directives: Laws. http://www.nrt.org/Production/NRT/NRTWeb.nsf/PagesByLevelCat/Level2Laws?Opendocument. *All websites accessed between June and December 2010.