Embed Size (px)
Citation preview
Page 1 of 25 Back to Top
CES National Benchmark Article BLS Establishment Survey National Estimates Revised to Incorporate March 2019 Benchmarks
Authors: Lawrence Doppelt and Shane Haley
About the authors: Lawrence Doppelt and Shane Haley are economists in the Division of Current Employment Statistics–National, Office of Employment and Unemployment Statistics, Bureau of Labor Statistics.
Telephone: (202) 691-6555 Email: Contact CES
Page 2 of 25 Back to Top
Table of Contents BLS Establishment Survey National Estimates Revised to Incorporate March 2019 Benchmarks 1 Table of Contents ............................................................................................................................ 2 Summary of the revisions ............................................................................................................... 3
IMPORTANT Special notice regarding seasonally adjusted historical data .............................. 4 Overview ......................................................................................................................................... 4 Seasonally adjusted revisions ......................................................................................................... 5 Not seasonally adjusted revisions ................................................................................................... 6 Benchmark revision effects for other data types............................................................................. 9 Summary of research into sources of the revision ........................................................................ 13
CES and population differences ............................................................................................... 13 QCEW imputation .................................................................................................................... 13 Revisions to net birth-death ...................................................................................................... 14
Forecasted vs. actual net birth-death ..................................................................................... 14
Net birth-death adjustments to the post-benchmark period .................................................. 15
Research conclusions ................................................................................................................ 16 Reconstructions ............................................................................................................................. 17
Rail transportation processing error .......................................................................................... 17 Basic-level reconstruction methods ...................................................................................... 17
Aggregate-level reconstruction methods .............................................................................. 18
Financial activities recoding ..................................................................................................... 19 Basic-level reconstruction methods ...................................................................................... 19
Aggregate-level reconstruction methods .............................................................................. 20
Seasonal adjustment in reconstructed series ............................................................................. 20 Changes to the CES published series ............................................................................................ 21
Series changes due to annual sample review ............................................................................ 21 Availability of revised data ........................................................................................................... 24 Table of figures ............................................................................................................................. 25
Tables ........................................................................................................................................ 25 Exhibits ..................................................................................................................................... 25
U.S. Bureau of Labor Statistics Page 3 of 25 Back to Top
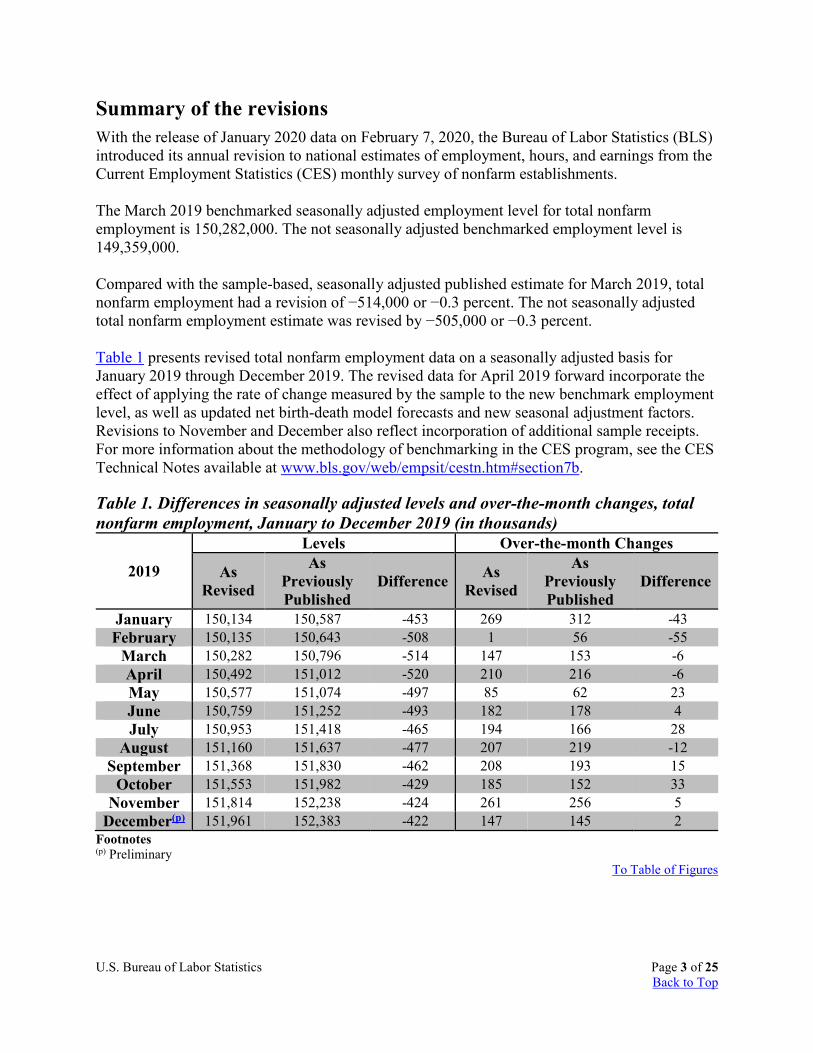
Summary of the revisions With the release of January 2020 data on February 7, 2020, the Bureau of Labor Statistics (BLS) introduced its annual revision to national estimates of employment, hours, and earnings from the Current Employment Statistics (CES) monthly survey of nonfarm establishments. The March 2019 benchmarked seasonally adjusted employment level for total nonfarm employment is 150,282,000. The not seasonally adjusted benchmarked employment level is 149,359,000. Compared with the sample-based, seasonally adjusted published estimate for March 2019, total nonfarm employment had a revision of −514,000 or −0.3 percent. The not seasonally adjusted total nonfarm employment estimate was revised by −505,000 or −0.3 percent. Table 1 presents revised total nonfarm employment data on a seasonally adjusted basis for January 2019 through December 2019. The revised data for April 2019 forward incorporate the effect of applying the rate of change measured by the sample to the new benchmark employment level, as well as updated net birth-death model forecasts and new seasonal adjustment factors. Revisions to November and December also reflect incorporation of additional sample receipts. For more information about the methodology of benchmarking in the CES program, see the CES Technical Notes available at www.bls.gov/web/empsit/cestn.htm#section7b.
Table 1. Differences in seasonally adjusted levels and over-the-month changes, total nonfarm employment, January to December 2019 (in thousands)
2019
Levels Over-the-month Changes
As Revised
As Previously Published
Difference As Revised
As Previously Published
Difference
January 150,134 150,587 -453 269 312 -43 February 150,135 150,643 -508 1 56 -55
March 150,282 150,796 -514 147 153 -6 April 150,492 151,012 -520 210 216 -6 May 150,577 151,074 -497 85 62 23 June 150,759 151,252 -493 182 178 4 July 150,953 151,418 -465 194 166 28
August 151,160 151,637 -477 207 219 -12 September 151,368 151,830 -462 208 193 15
October 151,553 151,982 -429 185 152 33 November 151,814 152,238 -424 261 256 5
December(p) 151,961 152,383 -422 147 145 2 Footnotes (p) Preliminary
To Table of Figures

U.S. Bureau of Labor Statistics Page 4 of 25 Back to Top
IMPORTANT Special notice regarding seasonally adjusted historical data Due to several reconstructions, some seasonally adjusted series were revised further back than the usual five years. Affected series, including total nonfarm data, were revised back to 1990. For more information, see the Reconstructions section of this article. Overview Establishment survey benchmarking is done on an annual basis to population employment counts derived primarily from the administrative file of employees covered by Unemployment Insurance (UI). All employers covered by UI laws are required to report employment and wage information to the appropriate state UI agency four times per year. Approximately 97 percent of total nonfarm employment within the scope of the establishment survey is covered by UI. The UI data are obtained and edited by each state’s Labor Market Information (LMI) agency, and are tabulated and published through the BLS Quarterly Census of Employment and Wages (QCEW) program. Both the QCEW and CES categorize their data using the North American Industry Classification System (NAICS). An employment count for the remaining 3 percent is constructed from alternate sources, primarily records from the Railroad Retirement Board (RRB), as well as County Business Patterns (CBP) and Annual Survey of Public Employment and Payroll (ASPEP) data from the Census Bureau. This 3 percent is referred to as noncovered employment (NCE). The combination of QCEW and NCE employment data make up the benchmark level. The full benchmark employment level developed for March replaces the March sample-based estimate for each basic cell. The total annual revision is the difference between the benchmark level for a given March and the published March sample-based employment estimate. The overall accuracy of the establishment survey is usually gauged by the size of the benchmark revision, which is often regarded as a proxy for total survey error. Typically, the total revision is equal to the benchmark revision, but in years with historical reconstructions, affected CES series are re-estimated prior to benchmarking. The benchmark revision, in these cases, is the difference between the benchmark level and the newly reconstructed sample-based estimate. The benchmark revision can be more precisely interpreted as the difference between two independently derived employment counts, each subject to its own error sources. In order to create a continuous time series between the new March benchmark level and historical sample-based data from the prior March benchmark level, employment estimates for the months between the most recent March benchmark and the previous year's benchmark are adjusted using a linear "wedge-back" procedure, which assumes that the total estimation error accumulated at a steady rate since the last benchmark. For the nine months following the March benchmark (also referred to as the post-benchmark period), BLS applies previously derived over-the-month sample changes to the revised March level to get the revised estimates. New net birth-death model forecasts are also calculated and applied during post-benchmark estimation. More information on benchmarks in the CES program is available in the Benchmarks section of the CES Technical Notes, as well as in the October 2017 Monthly Labor Review, “Benchmarking the Current Employment Statistics National Estimates.”
U.S. Bureau of Labor Statistics Page 5 of 25 Back to Top
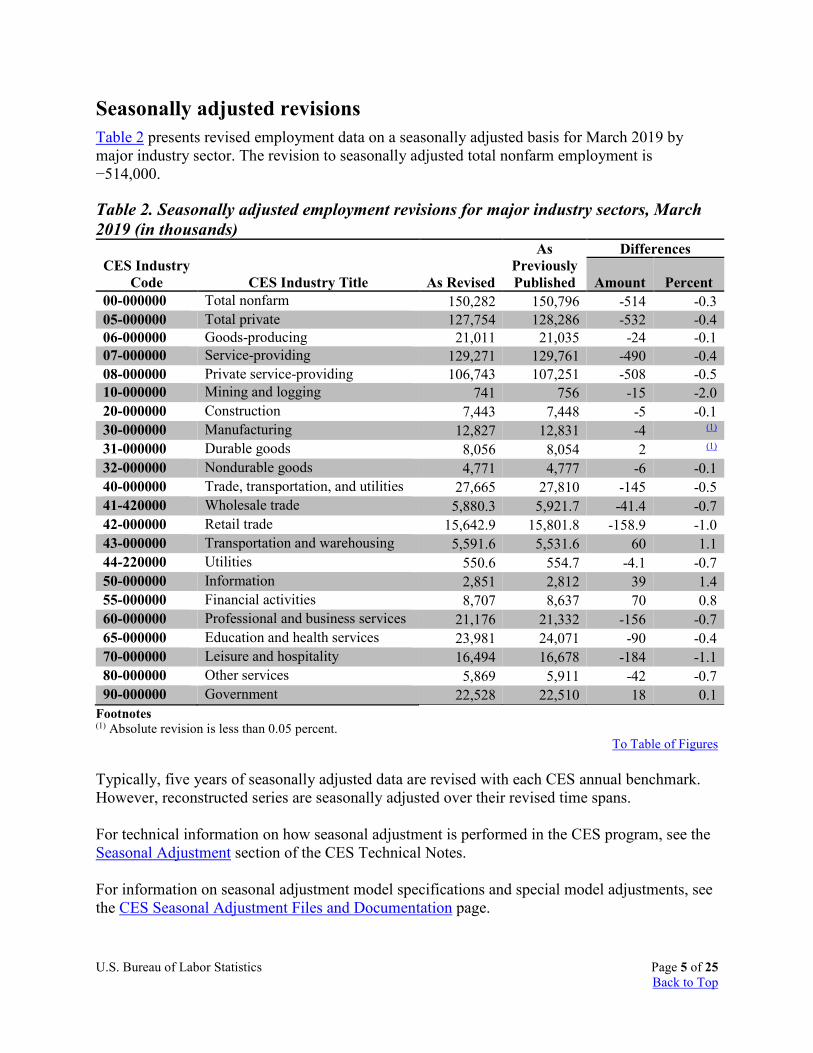
Seasonally adjusted revisions Table 2 presents revised employment data on a seasonally adjusted basis for March 2019 by major industry sector. The revision to seasonally adjusted total nonfarm employment is −514,000.
Table 2. Seasonally adjusted employment revisions for major industry sectors, March 2019 (in thousands)
CES Industry Code CES Industry Title As Revised
As Previously Published
Differences
Amount Percent 00-000000 Total nonfarm 150,282 150,796 -514 -0.3 05-000000 Total private 127,754 128,286 -532 -0.4 06-000000 Goods-producing 21,011 21,035 -24 -0.1 07-000000 Service-providing 129,271 129,761 -490 -0.4 08-000000 Private service-providing 106,743 107,251 -508 -0.5 10-000000 Mining and logging 741 756 -15 -2.0 20-000000 Construction 7,443 7,448 -5 -0.1 30-000000 Manufacturing 12,827 12,831 -4 (1)
31-000000 Durable goods 8,056 8,054 2 (1)
32-000000 Nondurable goods 4,771 4,777 -6 -0.1 40-000000 Trade, transportation, and utilities 27,665 27,810 -145 -0.5 41-420000 Wholesale trade 5,880.3 5,921.7 -41.4 -0.7 42-000000 Retail trade 15,642.9 15,801.8 -158.9 -1.0 43-000000 Transportation and warehousing 5,591.6 5,531.6 60 1.1 44-220000 Utilities 550.6 554.7 -4.1 -0.7 50-000000 Information 2,851 2,812 39 1.4 55-000000 Financial activities 8,707 8,637 70 0.8 60-000000 Professional and business services 21,176 21,332 -156 -0.7 65-000000 Education and health services 23,981 24,071 -90 -0.4 70-000000 Leisure and hospitality 16,494 16,678 -184 -1.1 80-000000 Other services 5,869 5,911 -42 -0.7 90-000000 Government 22,528 22,510 18 0.1
Footnotes (1) Absolute revision is less than 0.05 percent.
To Table of Figures Typically, five years of seasonally adjusted data are revised with each CES annual benchmark. However, reconstructed series are seasonally adjusted over their revised time spans. For technical information on how seasonal adjustment is performed in the CES program, see the Seasonal Adjustment section of the CES Technical Notes. For information on seasonal adjustment model specifications and special model adjustments, see the CES Seasonal Adjustment Files and Documentation page.
U.S. Bureau of Labor Statistics Page 6 of 25 Back to Top
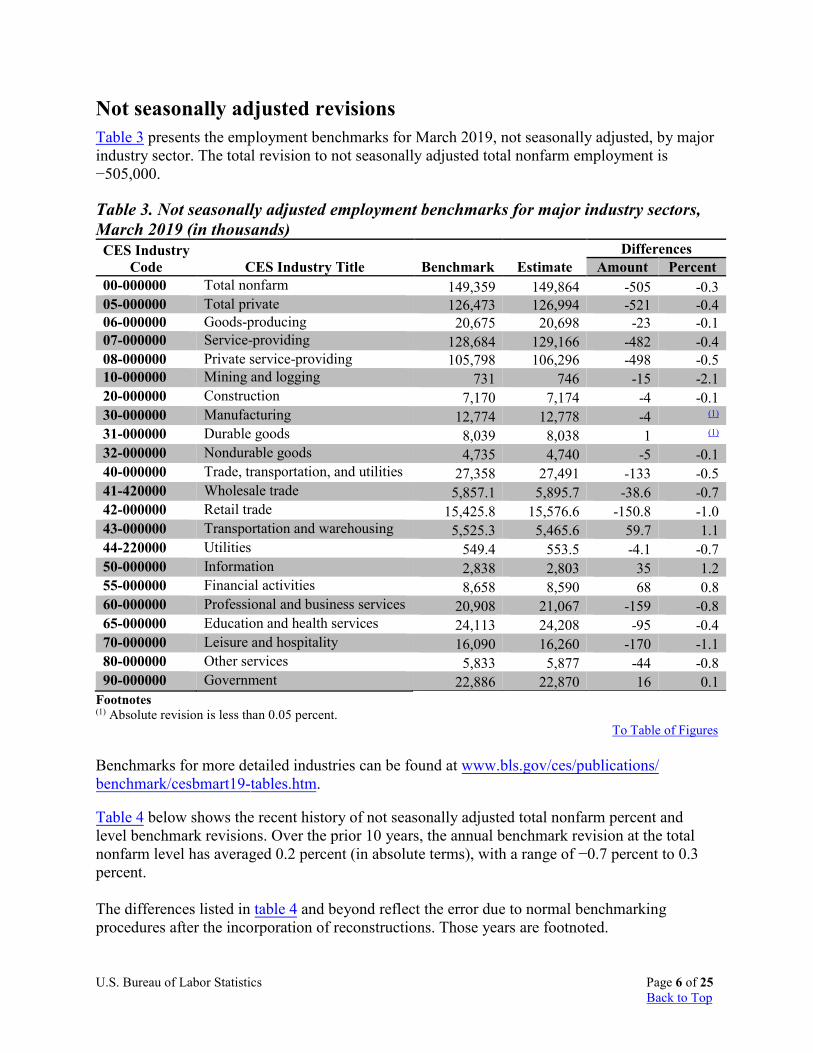
Not seasonally adjusted revisions Table 3 presents the employment benchmarks for March 2019, not seasonally adjusted, by major industry sector. The total revision to not seasonally adjusted total nonfarm employment is −505,000.
Table 3. Not seasonally adjusted employment benchmarks for major industry sectors, March 2019 (in thousands) CES Industry
Code CES Industry Title Benchmark Estimate Differences
Amount Percent 00-000000 Total nonfarm 149,359 149,864 -505 -0.305-000000 Total private 126,473 126,994 -521 -0.406-000000 Goods-producing 20,675 20,698 -23 -0.107-000000 Service-providing 128,684 129,166 -482 -0.408-000000 Private service-providing 105,798 106,296 -498 -0.510-000000 Mining and logging 731 746 -15 -2.120-000000 Construction 7,170 7,174 -4 -0.130-000000 Manufacturing 12,774 12,778 -4 (1)
31-000000 Durable goods 8,039 8,038 1 (1)
32-000000 Nondurable goods 4,735 4,740 -5 -0.140-000000 Trade, transportation, and utilities 27,358 27,491 -133 -0.541-420000 Wholesale trade 5,857.1 5,895.7 -38.6 -0.742-000000 Retail trade 15,425.8 15,576.6 -150.8 -1.043-000000 Transportation and warehousing 5,525.3 5,465.6 59.7 1.144-220000 Utilities 549.4 553.5 -4.1 -0.750-000000 Information 2,838 2,803 35 1.255-000000 Financial activities 8,658 8,590 68 0.860-000000 Professional and business services 20,908 21,067 -159 -0.865-000000 Education and health services 24,113 24,208 -95 -0.470-000000 Leisure and hospitality 16,090 16,260 -170 -1.180-000000 Other services 5,833 5,877 -44 -0.890-000000 Government 22,886 22,870 16 0.1
Footnotes (1) Absolute revision is less than 0.05 percent.
To Table of Figures
Benchmarks for more detailed industries can be found at www.bls.gov/ces/publications/benchmark/cesbmart19-tables.htm.
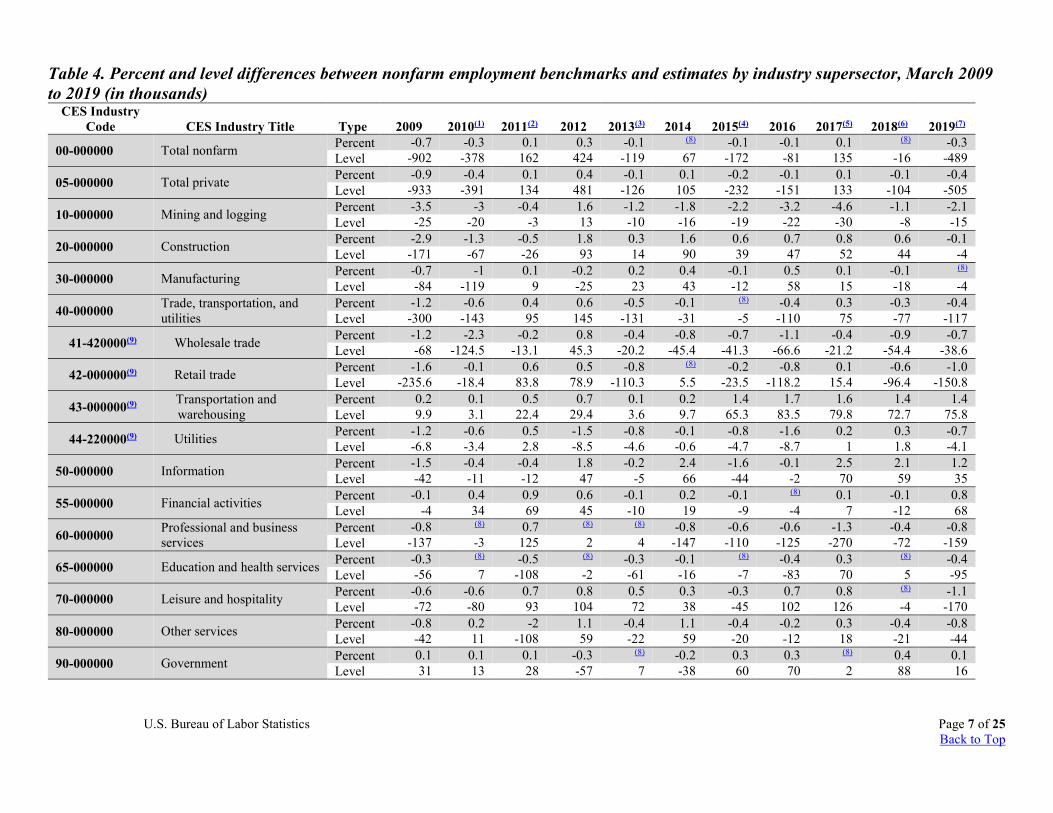
Table 4 below shows the recent history of not seasonally adjusted total nonfarm percent and level benchmark revisions. Over the prior 10 years, the annual benchmark revision at the total nonfarm level has averaged 0.2 percent (in absolute terms), with a range of −0.7 percent to 0.3 percent.
The differences listed in table 4 and beyond reflect the error due to normal benchmarking procedures after the incorporation of reconstructions. Those years are footnoted.
U.S. Bureau of Labor Statistics Page 7 of 25 Back to Top
Table 4. Percent and level differences between nonfarm employment benchmarks and estimates by industry supersector, March 2009 to 2019 (in thousands)
CES Industry Code CES Industry Title Type 2009 2010(1) 2011(2) 2012 2013(3) 2014 2015(4) 2016 2017(5) 2018(6) 2019(7)
00-000000 Total nonfarm Percent -0.7 -0.3 0.1 0.3 -0.1 (8) -0.1 -0.1 0.1 (8) -0.3 Level -902 -378 162 424 -119 67 -172 -81 135 -16 -489
05-000000 Total private Percent -0.9 -0.4 0.1 0.4 -0.1 0.1 -0.2 -0.1 0.1 -0.1 -0.4 Level -933 -391 134 481 -126 105 -232 -151 133 -104 -505
10-000000 Mining and logging Percent -3.5 -3 -0.4 1.6 -1.2 -1.8 -2.2 -3.2 -4.6 -1.1 -2.1 Level -25 -20 -3 13 -10 -16 -19 -22 -30 -8 -15
20-000000 Construction Percent -2.9 -1.3 -0.5 1.8 0.3 1.6 0.6 0.7 0.8 0.6 -0.1 Level -171 -67 -26 93 14 90 39 47 52 44 -4
30-000000 Manufacturing Percent -0.7 -1 0.1 -0.2 0.2 0.4 -0.1 0.5 0.1 -0.1 (8) Level -84 -119 9 -25 23 43 -12 58 15 -18 -4
40-000000 Trade, transportation, and utilities
Percent -1.2 -0.6 0.4 0.6 -0.5 -0.1 (8) -0.4 0.3 -0.3 -0.4 Level -300 -143 95 145 -131 -31 -5 -110 75 -77 -117
41-420000(9) Wholesale trade Percent -1.2 -2.3 -0.2 0.8 -0.4 -0.8 -0.7 -1.1 -0.4 -0.9 -0.7 Level -68 -124.5 -13.1 45.3 -20.2 -45.4 -41.3 -66.6 -21.2 -54.4 -38.6
42-000000(9) Retail trade Percent -1.6 -0.1 0.6 0.5 -0.8 (8) -0.2 -0.8 0.1 -0.6 -1.0 Level -235.6 -18.4 83.8 78.9 -110.3 5.5 -23.5 -118.2 15.4 -96.4 -150.8
43-000000(9) Transportation and warehousing
Percent 0.2 0.1 0.5 0.7 0.1 0.2 1.4 1.7 1.6 1.4 1.4 Level 9.9 3.1 22.4 29.4 3.6 9.7 65.3 83.5 79.8 72.7 75.8
44-220000(9) Utilities Percent -1.2 -0.6 0.5 -1.5 -0.8 -0.1 -0.8 -1.6 0.2 0.3 -0.7 Level -6.8 -3.4 2.8 -8.5 -4.6 -0.6 -4.7 -8.7 1 1.8 -4.1
50-000000 Information Percent -1.5 -0.4 -0.4 1.8 -0.2 2.4 -1.6 -0.1 2.5 2.1 1.2 Level -42 -11 -12 47 -5 66 -44 -2 70 59 35
55-000000 Financial activities Percent -0.1 0.4 0.9 0.6 -0.1 0.2 -0.1 (8) 0.1 -0.1 0.8 Level -4 34 69 45 -10 19 -9 -4 7 -12 68
60-000000 Professional and business services
Percent -0.8 (8) 0.7 (8) (8) -0.8 -0.6 -0.6 -1.3 -0.4 -0.8 Level -137 -3 125 2 4 -147 -110 -125 -270 -72 -159
65-000000 Education and health services Percent -0.3 (8) -0.5 (8) -0.3 -0.1 (8) -0.4 0.3 (8) -0.4 Level -56 7 -108 -2 -61 -16 -7 -83 70 5 -95
70-000000 Leisure and hospitality Percent -0.6 -0.6 0.7 0.8 0.5 0.3 -0.3 0.7 0.8 (8) -1.1 Level -72 -80 93 104 72 38 -45 102 126 -4 -170
80-000000 Other services Percent -0.8 0.2 -2 1.1 -0.4 1.1 -0.4 -0.2 0.3 -0.4 -0.8 Level -42 11 -108 59 -22 59 -20 -12 18 -21 -44
90-000000 Government Percent 0.1 0.1 0.1 -0.3 (8) -0.2 0.3 0.3 (8) 0.4 0.1 Level 31 13 28 -57 7 -38 60 70 2 88 16
U.S. Bureau of Labor Statistics Page 8 of 25 Back to Top
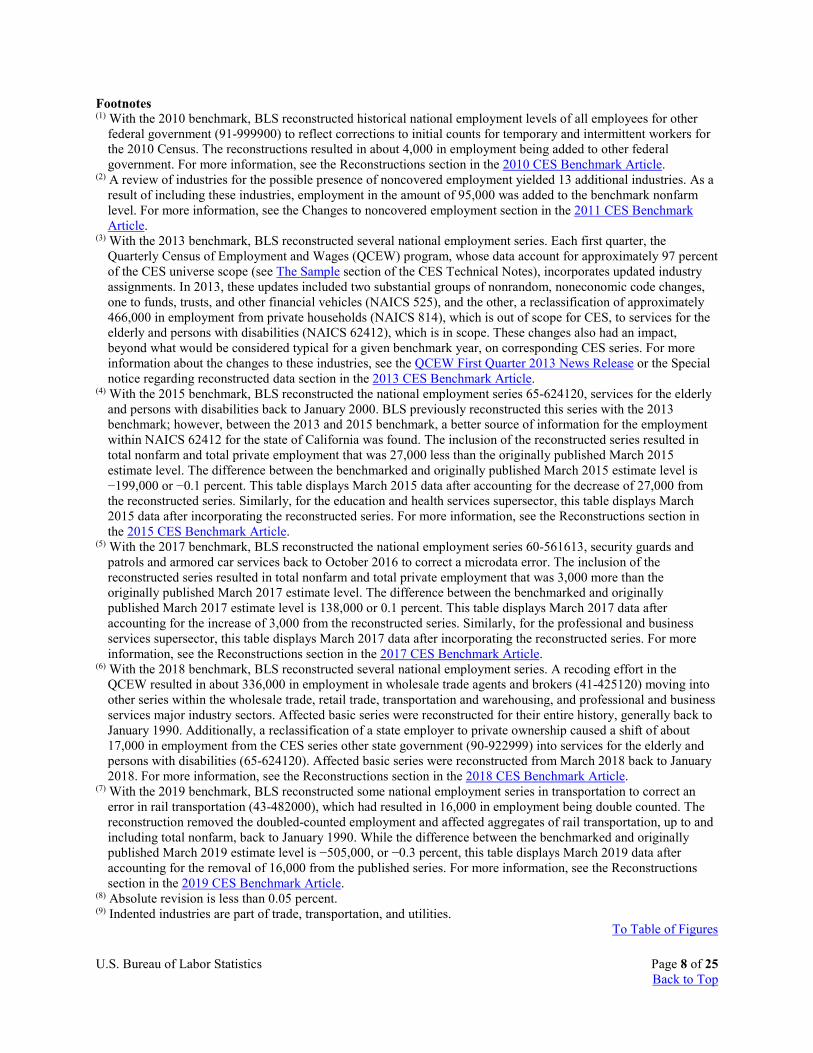
Footnotes (1) With the 2010 benchmark, BLS reconstructed historical national employment levels of all employees for other
federal government (91-999900) to reflect corrections to initial counts for temporary and intermittent workers forthe 2010 Census. The reconstructions resulted in about 4,000 in employment being added to other federalgovernment. For more information, see the Reconstructions section in the 2010 CES Benchmark Article.
(2) A review of industries for the possible presence of noncovered employment yielded 13 additional industries. As aresult of including these industries, employment in the amount of 95,000 was added to the benchmark nonfarmlevel. For more information, see the Changes to noncovered employment section in the 2011 CES BenchmarkArticle.
(3) With the 2013 benchmark, BLS reconstructed several national employment series. Each first quarter, theQuarterly Census of Employment and Wages (QCEW) program, whose data account for approximately 97 percentof the CES universe scope (see The Sample section of the CES Technical Notes), incorporates updated industryassignments. In 2013, these updates included two substantial groups of nonrandom, noneconomic code changes,one to funds, trusts, and other financial vehicles (NAICS 525), and the other, a reclassification of approximately466,000 in employment from private households (NAICS 814), which is out of scope for CES, to services for theelderly and persons with disabilities (NAICS 62412), which is in scope. These changes also had an impact,beyond what would be considered typical for a given benchmark year, on corresponding CES series. For moreinformation about the changes to these industries, see the QCEW First Quarter 2013 News Release or the Specialnotice regarding reconstructed data section in the 2013 CES Benchmark Article.
(4) With the 2015 benchmark, BLS reconstructed the national employment series 65-624120, services for the elderlyand persons with disabilities back to January 2000. BLS previously reconstructed this series with the 2013benchmark; however, between the 2013 and 2015 benchmark, a better source of information for the employmentwithin NAICS 62412 for the state of California was found. The inclusion of the reconstructed series resulted intotal nonfarm and total private employment that was 27,000 less than the originally published March 2015estimate level. The difference between the benchmarked and originally published March 2015 estimate level is−199,000 or −0.1 percent. This table displays March 2015 data after accounting for the decrease of 27,000 fromthe reconstructed series. Similarly, for the education and health services supersector, this table displays March2015 data after incorporating the reconstructed series. For more information, see the Reconstructions section inthe 2015 CES Benchmark Article.
(5) With the 2017 benchmark, BLS reconstructed the national employment series 60-561613, security guards andpatrols and armored car services back to October 2016 to correct a microdata error. The inclusion of thereconstructed series resulted in total nonfarm and total private employment that was 3,000 more than theoriginally published March 2017 estimate level. The difference between the benchmarked and originallypublished March 2017 estimate level is 138,000 or 0.1 percent. This table displays March 2017 data afteraccounting for the increase of 3,000 from the reconstructed series. Similarly, for the professional and businessservices supersector, this table displays March 2017 data after incorporating the reconstructed series. For moreinformation, see the Reconstructions section in the 2017 CES Benchmark Article.
(6) With the 2018 benchmark, BLS reconstructed several national employment series. A recoding effort in theQCEW resulted in about 336,000 in employment in wholesale trade agents and brokers (41-425120) moving intoother series within the wholesale trade, retail trade, transportation and warehousing, and professional and businessservices major industry sectors. Affected basic series were reconstructed for their entire history, generally back toJanuary 1990. Additionally, a reclassification of a state employer to private ownership caused a shift of about17,000 in employment from the CES series other state government (90-922999) into services for the elderly andpersons with disabilities (65-624120). Affected basic series were reconstructed from March 2018 back to January2018. For more information, see the Reconstructions section in the 2018 CES Benchmark Article.
(7) With the 2019 benchmark, BLS reconstructed some national employment series in transportation to correct anerror in rail transportation (43-482000), which had resulted in 16,000 in employment being double counted. Thereconstruction removed the doubled-counted employment and affected aggregates of rail transportation, up to andincluding total nonfarm, back to January 1990. While the difference between the benchmarked and originallypublished March 2019 estimate level is −505,000, or −0.3 percent, this table displays March 2019 data afteraccounting for the removal of 16,000 from the published series. For more information, see the Reconstructionssection in the 2019 CES Benchmark Article.
(8) Absolute revision is less than 0.05 percent.(9) Indented industries are part of trade, transportation, and utilities.
To Table of Figures
U.S. Bureau of Labor Statistics Page 9 of 25 Back to Top
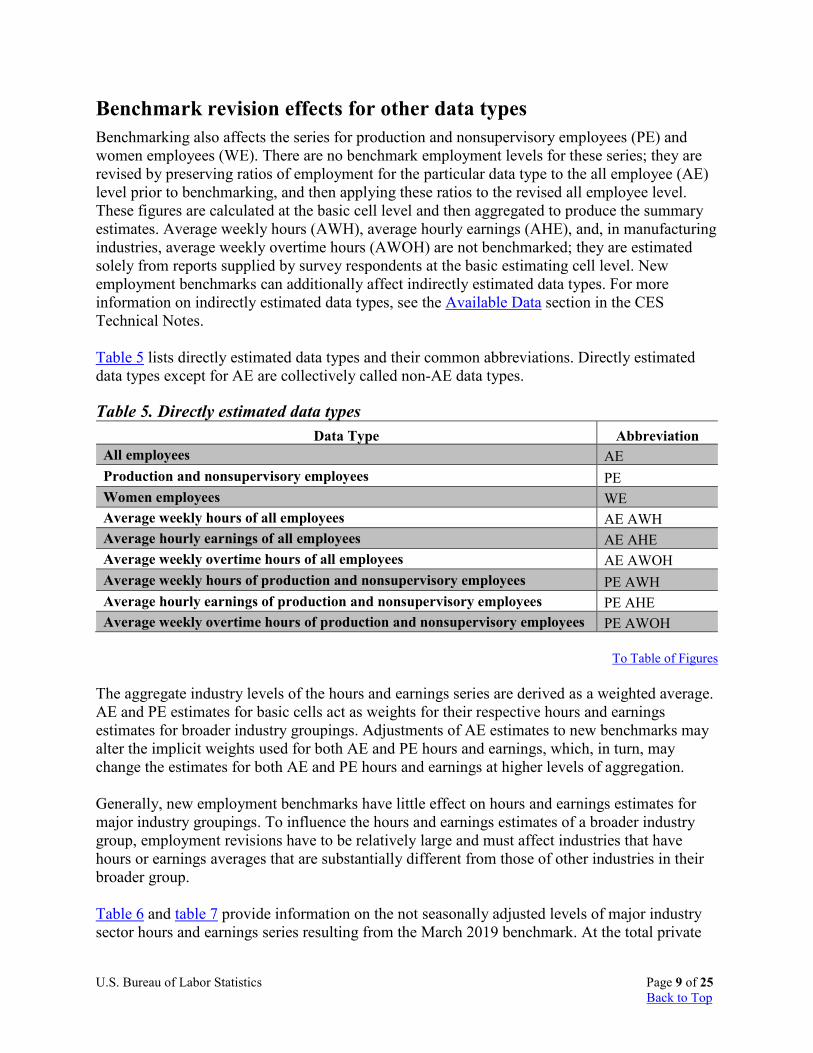
Benchmark revision effects for other data types
Benchmarking also affects the series for production and nonsupervisory employees (PE) and women employees (WE). There are no benchmark employment levels for these series; they are revised by preserving ratios of employment for the particular data type to the all employee (AE) level prior to benchmarking, and then applying these ratios to the revised all employee level. These figures are calculated at the basic cell level and then aggregated to produce the summary estimates. Average weekly hours (AWH), average hourly earnings (AHE), and, in manufacturing industries, average weekly overtime hours (AWOH) are not benchmarked; they are estimated solely from reports supplied by survey respondents at the basic estimating cell level. New employment benchmarks can additionally affect indirectly estimated data types. For more information on indirectly estimated data types, see the Available Data section in the CES Technical Notes. Table 5 lists directly estimated data types and their common abbreviations. Directly estimated data types except for AE are collectively called non-AE data types.
Table 5. Directly estimated data types Data Type Abbreviation
All employees AE Production and nonsupervisory employees PE Women employees WE Average weekly hours of all employees AE AWH Average hourly earnings of all employees AE AHE Average weekly overtime hours of all employees AE AWOH Average weekly hours of production and nonsupervisory employees PE AWH Average hourly earnings of production and nonsupervisory employees PE AHE Average weekly overtime hours of production and nonsupervisory employees PE AWOH
To Table of Figures
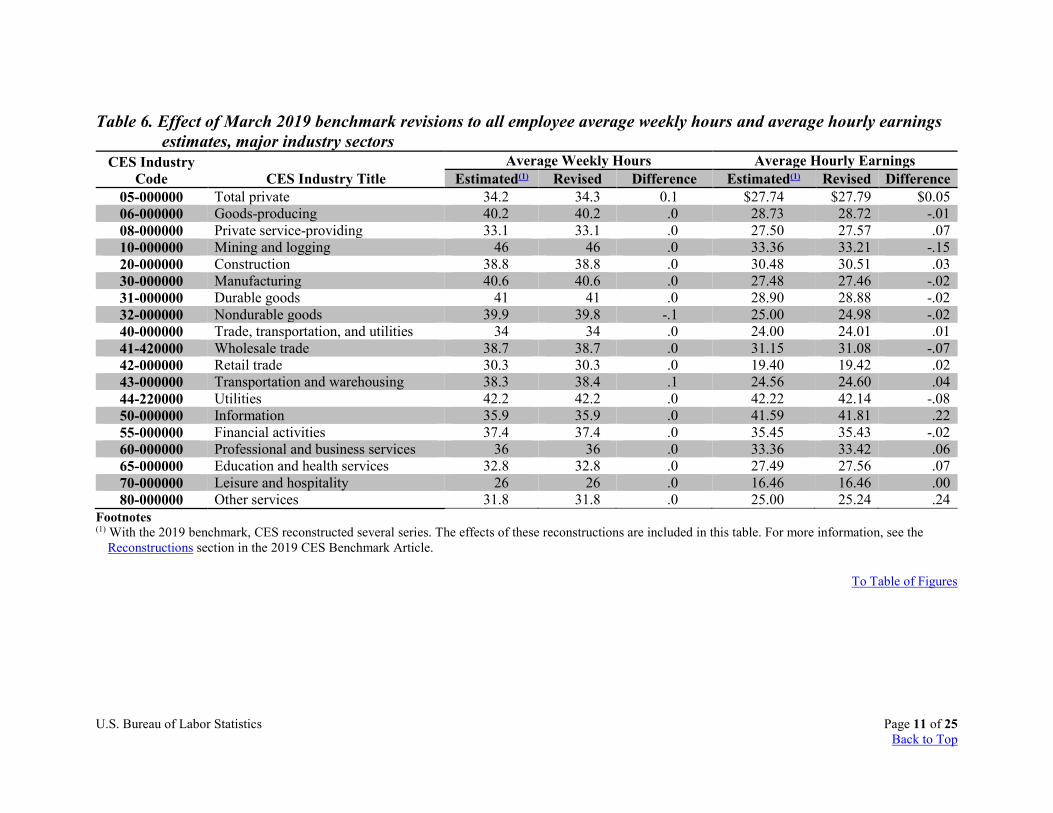
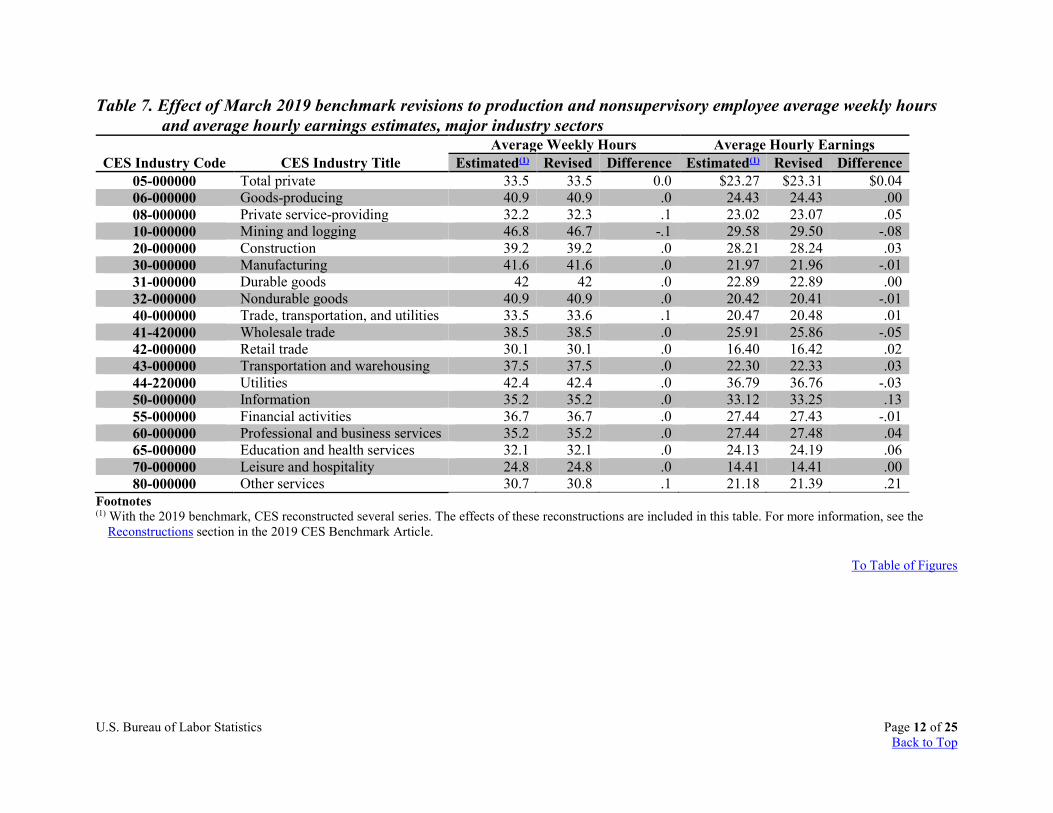
The aggregate industry levels of the hours and earnings series are derived as a weighted average. AE and PE estimates for basic cells act as weights for their respective hours and earnings estimates for broader industry groupings. Adjustments of AE estimates to new benchmarks may alter the implicit weights used for both AE and PE hours and earnings, which, in turn, may change the estimates for both AE and PE hours and earnings at higher levels of aggregation. Generally, new employment benchmarks have little effect on hours and earnings estimates for major industry groupings. To influence the hours and earnings estimates of a broader industry group, employment revisions have to be relatively large and must affect industries that have hours or earnings averages that are substantially different from those of other industries in their broader group. Table 6 and table 7 provide information on the not seasonally adjusted levels of major industry sector hours and earnings series resulting from the March 2019 benchmark. At the total private

U.S. Bureau of Labor Statistics Page 10 of 25 Back to Top
level, average weekly hours estimates for AE increased by 0.1 hours and there was no change in average weekly hours estimates for PE from the previously published level. Total private average hourly earnings increased by 5 cents for AE and increased by 4 cents for PE from the previously published level.
Benchmark effects on hours and earnings for more detailed industries can be found at www.bls.gov/ces/publications/benchmark/cesbmart19-tables.htm.
U.S. Bureau of Labor Statistics Page 11 of 25 Back to Top
Table 6. Effect of March 2019 benchmark revisions to all employee average weekly hours and average hourly earnings estimates, major industry sectors
CES Industry Code CES Industry Title
Average Weekly Hours Average Hourly Earnings Estimated(1) Revised Difference Estimated(1) Revised Difference
05-000000 Total private 34.2 34.3 0.1 $27.74 $27.79 $0.05 06-000000 Goods-producing 40.2 40.2 .0 28.73 28.72 -.01 08-000000 Private service-providing 33.1 33.1 .0 27.50 27.57 .07 10-000000 Mining and logging 46 46 .0 33.36 33.21 -.15 20-000000 Construction 38.8 38.8 .0 30.48 30.51 .03 30-000000 Manufacturing 40.6 40.6 .0 27.48 27.46 -.02 31-000000 Durable goods 41 41 .0 28.90 28.88 -.02 32-000000 Nondurable goods 39.9 39.8 -.1 25.00 24.98 -.02 40-000000 Trade, transportation, and utilities 34 34 .0 24.00 24.01 .01 41-420000 Wholesale trade 38.7 38.7 .0 31.15 31.08 -.07 42-000000 Retail trade 30.3 30.3 .0 19.40 19.42 .02 43-000000 Transportation and warehousing 38.3 38.4 .1 24.56 24.60 .04 44-220000 Utilities 42.2 42.2 .0 42.22 42.14 -.08 50-000000 Information 35.9 35.9 .0 41.59 41.81 .22 55-000000 Financial activities 37.4 37.4 .0 35.45 35.43 -.02 60-000000 Professional and business services 36 36 .0 33.36 33.42 .06 65-000000 Education and health services 32.8 32.8 .0 27.49 27.56 .07 70-000000 Leisure and hospitality 26 26 .0 16.46 16.46 .00 80-000000 Other services 31.8 31.8 .0 25.00 25.24 .24
Footnotes (1) With the 2019 benchmark, CES reconstructed several series. The effects of these reconstructions are included in this table. For more information, see the
Reconstructions section in the 2019 CES Benchmark Article.
To Table of Figures
U.S. Bureau of Labor Statistics Page 12 of 25 Back to Top
Table 7. Effect of March 2019 benchmark revisions to production and nonsupervisory employee average weekly hours and average hourly earnings estimates, major industry sectors
CES Industry Code CES Industry Title Average Weekly Hours Average Hourly Earnings
Estimated(1) Revised Difference Estimated(1) Revised Difference 05-000000 Total private 33.5 33.5 0.0 $23.27 $23.31 $0.04 06-000000 Goods-producing 40.9 40.9 .0 24.43 24.43 .00 08-000000 Private service-providing 32.2 32.3 .1 23.02 23.07 .05 10-000000 Mining and logging 46.8 46.7 -.1 29.58 29.50 -.08 20-000000 Construction 39.2 39.2 .0 28.21 28.24 .03 30-000000 Manufacturing 41.6 41.6 .0 21.97 21.96 -.01 31-000000 Durable goods 42 42 .0 22.89 22.89 .00 32-000000 Nondurable goods 40.9 40.9 .0 20.42 20.41 -.01 40-000000 Trade, transportation, and utilities 33.5 33.6 .1 20.47 20.48 .01 41-420000 Wholesale trade 38.5 38.5 .0 25.91 25.86 -.05 42-000000 Retail trade 30.1 30.1 .0 16.40 16.42 .02 43-000000 Transportation and warehousing 37.5 37.5 .0 22.30 22.33 .03 44-220000 Utilities 42.4 42.4 .0 36.79 36.76 -.03 50-000000 Information 35.2 35.2 .0 33.12 33.25 .13 55-000000 Financial activities 36.7 36.7 .0 27.44 27.43 -.01 60-000000 Professional and business services 35.2 35.2 .0 27.44 27.48 .04 65-000000 Education and health services 32.1 32.1 .0 24.13 24.19 .06 70-000000 Leisure and hospitality 24.8 24.8 .0 14.41 14.41 .00 80-000000 Other services 30.7 30.8 .1 21.18 21.39 .21
Footnotes (1) With the 2019 benchmark, CES reconstructed several series. The effects of these reconstructions are included in this table. For more information, see the
Reconstructions section in the 2019 CES Benchmark Article.
To Table of Figures
U.S. Bureau of Labor Statistics Page 13 of 25 Back to Top
Summary of research into sources of the revision The difference between CES estimates and the population employment results from various sources, and disaggregating it into its components is complex. BLS examined potential sources of error in both the CES estimates and the QCEW-based portion of the employment benchmark. Both are subject to nonresponse and reporting error. Additionally, the CES estimates are subject to sampling error and business birth-death modeling error. A profile of the differences and an analysis of potential sources of error are outlined below.
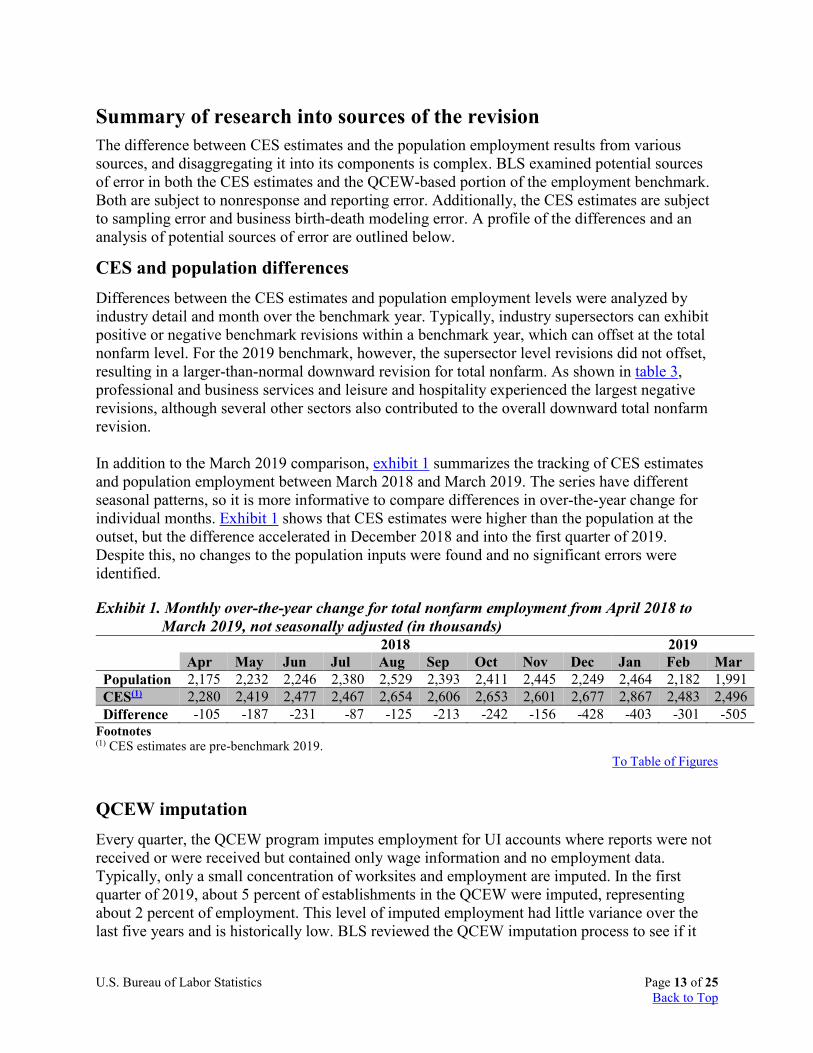
CES and population differences Differences between the CES estimates and population employment levels were analyzed by industry detail and month over the benchmark year. Typically, industry supersectors can exhibit positive or negative benchmark revisions within a benchmark year, which can offset at the total nonfarm level. For the 2019 benchmark, however, the supersector level revisions did not offset, resulting in a larger-than-normal downward revision for total nonfarm. As shown in table 3, professional and business services and leisure and hospitality experienced the largest negative revisions, although several other sectors also contributed to the overall downward total nonfarm revision.
In addition to the March 2019 comparison, exhibit 1 summarizes the tracking of CES estimates and population employment between March 2018 and March 2019. The series have different seasonal patterns, so it is more informative to compare differences in over-the-year change for individual months. Exhibit 1 shows that CES estimates were higher than the population at the outset, but the difference accelerated in December 2018 and into the first quarter of 2019. Despite this, no changes to the population inputs were found and no significant errors were identified.
Exhibit 1. Monthly over‐the‐year change for total nonfarm employment from April 2018 to March 2019, not seasonally adjusted (in thousands)
2018 2019 Apr May Jun Jul Aug Sep Oct Nov Dec Jan Feb Mar
Population 2,175 2,232 2,246 2,380 2,529 2,393 2,411 2,445 2,249 2,464 2,182 1,991 CES(1) 2,280 2,419 2,477 2,467 2,654 2,606 2,653 2,601 2,677 2,867 2,483 2,496 Difference -105 -187 -231 -87 -125 -213 -242 -156 -428 -403 -301 -505
Footnotes (1) CES estimates are pre-benchmark 2019.
To Table of Figures
QCEW imputation Every quarter, the QCEW program imputes employment for UI accounts where reports were not received or were received but contained only wage information and no employment data. Typically, only a small concentration of worksites and employment are imputed. In the first quarter of 2019, about 5 percent of establishments in the QCEW were imputed, representing about 2 percent of employment. This level of imputed employment had little variance over the last five years and is historically low. BLS reviewed the QCEW imputation process to see if it
U.S. Bureau of Labor Statistics Page 14 of 25 Back to Top
could be a factor in the divergence between CES and QCEW over-the-year employment trends. There were no changes in the imputation process, nor any indication that imputation significantly caused the divergence between CES estimates and QCEW employment levels.
Revisions to net birth-death The CES sample alone is not sufficient for estimating the total nonfarm employment level because each month new firms generate employment that cannot be captured through the sample. There is an unavoidable lag between a firm opening for business and its appearance on the CES sample frame. The sample frame is built from UI quarterly tax records. These records cover virtually all U.S. employers and include business births, but they only become available for updating the CES sampling frame seven to nine months after the reference month. After the births appear on the frame, there is also time required for sampling, contacting, and soliciting cooperation from the firm, and verifying the initial data provided. In practice, BLS cannot sample and begin to collect data from new firms until they are at least a year old. BLS has researched both sample-based and model-based approaches to measuring business births and deaths that have not yet appeared on the UI universe frame. The research demonstrated that sampling for births was not feasible in the very short CES production timeframes, so BLS uses a model-based approach to account for this employment. This model incorporates two components; the first component is an indirect imputation for business deaths and the second component is an Autoregressive Integrated Moving Average (ARIMA) time series model designed to estimate the net birth-death employment not accounted for by the imputation from the first component. More information on the CES birth-death model is available in the Birth-Death Model section of the CES Technical Notes.
Forecasted vs. actual net birth-death
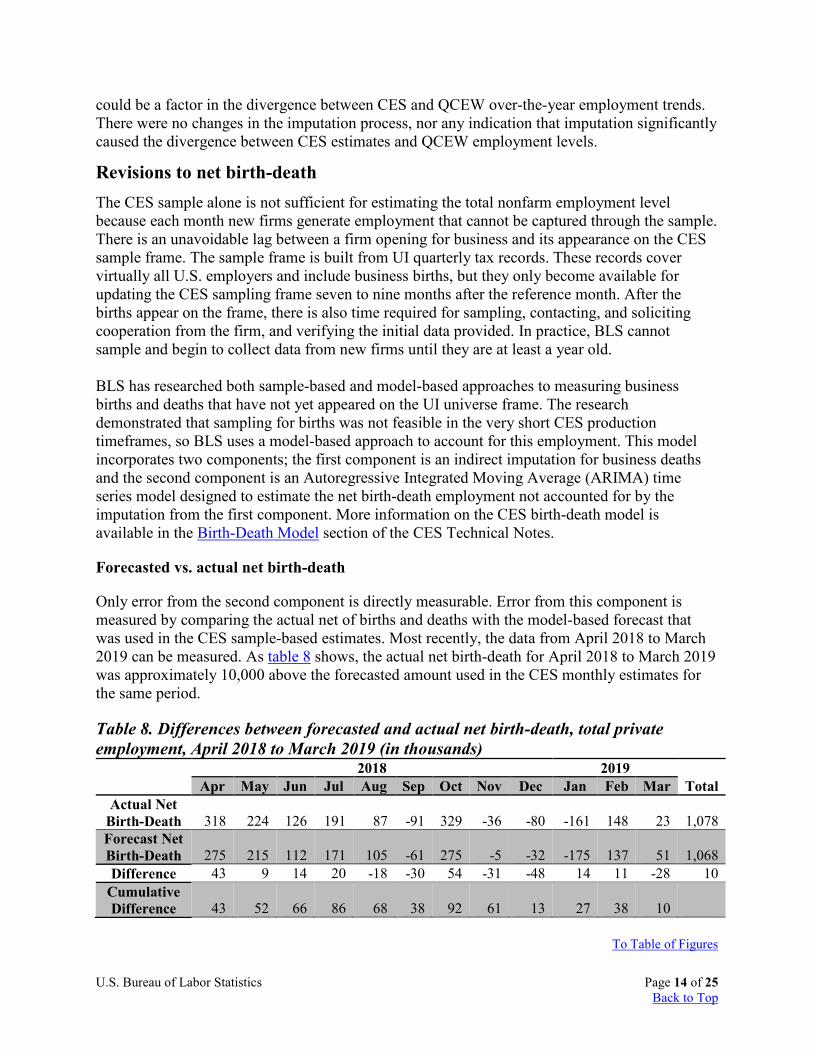
Only error from the second component is directly measurable. Error from this component is measured by comparing the actual net of births and deaths with the model-based forecast that was used in the CES sample-based estimates. Most recently, the data from April 2018 to March 2019 can be measured. As table 8 shows, the actual net birth-death for April 2018 to March 2019 was approximately 10,000 above the forecasted amount used in the CES monthly estimates for the same period.
Table 8. Differences between forecasted and actual net birth-death, total private employment, April 2018 to March 2019 (in thousands)
2018 2019 Total Apr May Jun Jul Aug Sep Oct Nov Dec Jan Feb Mar
Actual Net Birth-Death 318 224 126 191 87 -91 329 -36 -80 -161 148 23 1,078 Forecast Net Birth-Death 275 215 112 171 105 -61 275 -5 -32 -175 137 51 1,068 Difference 43 9 14 20 -18 -30 54 -31 -48 14 11 -28 10
Cumulative Difference 43 52 66 86 68 38 92 61 13 27 38 10
To Table of Figures
U.S. Bureau of Labor Statistics Page 15 of 25 Back to Top
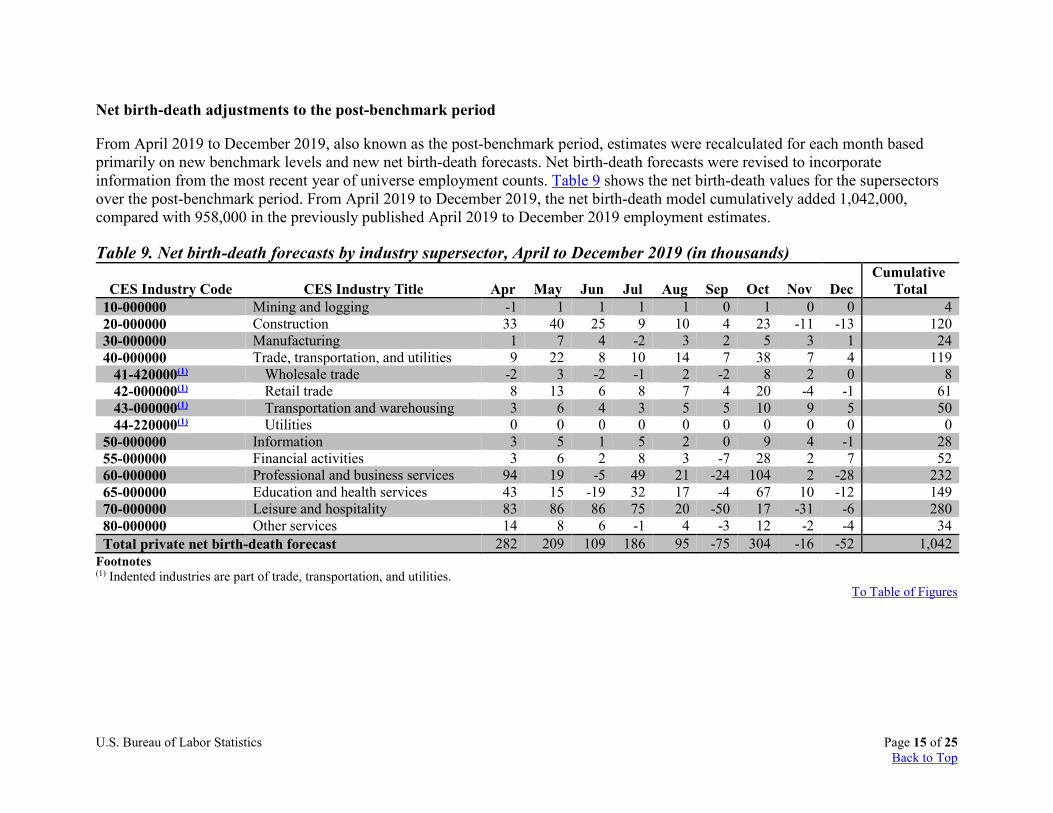
Net birth-death adjustments to the post-benchmark period
From April 2019 to December 2019, also known as the post-benchmark period, estimates were recalculated for each month based primarily on new benchmark levels and new net birth-death forecasts. Net birth-death forecasts were revised to incorporate information from the most recent year of universe employment counts. Table 9 shows the net birth-death values for the supersectors over the post-benchmark period. From April 2019 to December 2019, the net birth-death model cumulatively added 1,042,000, compared with 958,000 in the previously published April 2019 to December 2019 employment estimates.
Table 9. Net birth-death forecasts by industry supersector, April to December 2019 (in thousands)
CES Industry Code CES Industry Title Apr May Jun Jul Aug Sep Oct Nov Dec Cumulative
Total 10-000000 Mining and logging -1 1 1 1 1 0 1 0 0 4 20-000000 Construction 33 40 25 9 10 4 23 -11 -13 120 30-000000 Manufacturing 1 7 4 -2 3 2 5 3 1 24 40-000000 Trade, transportation, and utilities 9 22 8 10 14 7 38 7 4 119
41-420000(1) Wholesale trade -2 3 -2 -1 2 -2 8 2 0 8 42-000000(1) Retail trade 8 13 6 8 7 4 20 -4 -1 61 43-000000(1) Transportation and warehousing 3 6 4 3 5 5 10 9 5 50 44-220000(1) Utilities 0 0 0 0 0 0 0 0 0 0
50-000000 Information 3 5 1 5 2 0 9 4 -1 28 55-000000 Financial activities 3 6 2 8 3 -7 28 2 7 52 60-000000 Professional and business services 94 19 -5 49 21 -24 104 2 -28 232 65-000000 Education and health services 43 15 -19 32 17 -4 67 10 -12 149 70-000000 Leisure and hospitality 83 86 86 75 20 -50 17 -31 -6 280 80-000000 Other services 14 8 6 -1 4 -3 12 -2 -4 34 Total private net birth-death forecast 282 209 109 186 95 -75 304 -16 -52 1,042
Footnotes (1) Indented industries are part of trade, transportation, and utilities.
To Table of Figures

U.S. Bureau of Labor Statistics Page 16 of 25 Back to Top
Research conclusions Early research and analysis into the components of error has concluded the net birth-death model contributed only a small piece to the total survey error. Although some quarters and industries had larger revisions relative to others, it is less clear that the overall revision can be attributed to a single quarter or industry. The difference in employment growth between the CES estimates and the population in December 2018 and into the first quarter of 2019 requires further investigation. BLS and the CES program will continue to research the possible causes of error within the payroll survey and their impacts on benchmark revisions.
U.S. Bureau of Labor Statistics Page 17 of 25 Back to Top
Reconstructions In addition to the regular benchmark revisions, CES employment, hours, and earnings estimates are sometimes reconstructed in order to avoid series breaks and provide users with continuous, comparable employment time series suitable for economic analysis. Reconstructions may be necessary to correct processing errors, reporting errors, changes in scope, or to address other issues that may cause breaks in CES time series that are not economic in nature. The reconstructions that were incorporated with this year’s annual benchmark are described below.
Rail transportation processing error Several CES series in transportation and warehousing (43-000000) were reconstructed to account for the release of more detailed and accurate data from the Railroad Retirement Board (RRB). Two separate, but related, issues resulted in two reconstructions within this industry.
Basic-level reconstruction methods
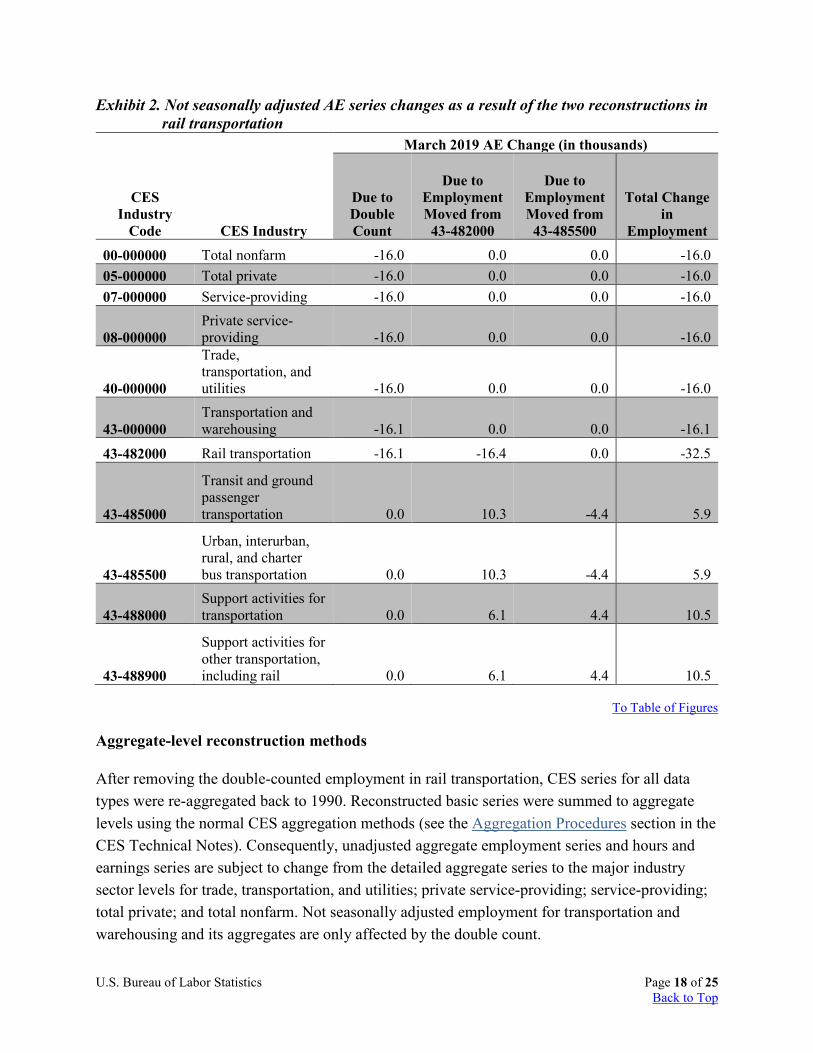
The first reconstruction removed employment that was being double counted in rail transportation’s (43-482000) history from 1990-2019. The updated RRB data revealed that they were reporting overlapping data with states’ LMI agencies for commuter rail transportation, which led to double counting of employment in this industry. Historical data for this error was only available back to 2003; therefore, a ratio of the amount being double counted for March 2019 was generated and applied to the history of rail transportation back to 2003 to calculate the amount of employment to remove from each month. The difference in January 2003 was wedged back to 1990 in order to gradually align the more recent data with historical pre-1990 data. In total, this reconstruction removed 16,000 in employment from rail transportation and all of its aggregates, including total nonfarm, in March 2019. The second reconstruction redistributed transportation employment into correct NAICS codes based on RRB’s updated classification system. After removing the double-counted employment from rail transportation and wedging back the January 2003 difference, additional employment was moved out of rail transportation and into urban, interurban, rural, and charter bus transportation (43-485500) and support activities for other transportation, including rail (43-488900). Furthermore, some employment was removed from urban, interurban, rural, and charter bus transportation and placed into support activities for other transportation, including rail. Ratios were calculated for the amounts of employment moving out of each series for March 2019, then applied to their histories back to 1990. The monthly amounts removed were then added to the correct industry from March 2019 back to January 1990. All other published data types for these industries were adjusted to account for the change, including AE hours and earnings, PE, PE hours and earnings, and WE. More detail on both reconstructions is provided in exhibit 2.
U.S. Bureau of Labor Statistics Page 18 of 25 Back to Top
Exhibit 2. Not seasonally adjusted AE series changes as a result of the two reconstructions in rail transportation
CES Industry
Code CES Industry
March 2019 AE Change (in thousands)
Due to Double Count
Due to Employment Moved from 43-482000
Due to Employment Moved from 43-485500
Total Change in
Employment
00-000000 Total nonfarm -16.0 0.0 0.0 -16.0 05-000000 Total private -16.0 0.0 0.0 -16.0 07-000000 Service-providing -16.0 0.0 0.0 -16.0
08-000000 Private service-providing -16.0 0.0 0.0 -16.0
40-000000
Trade, transportation, and utilities -16.0 0.0 0.0 -16.0
43-000000 Transportation and warehousing -16.1 0.0 0.0 -16.1
43-482000 Rail transportation -16.1 -16.4 0.0 -32.5
43-485000
Transit and ground passenger transportation 0.0 10.3 -4.4 5.9
43-485500
Urban, interurban, rural, and charter bus transportation 0.0 10.3 -4.4 5.9
43-488000 Support activities for transportation 0.0 6.1 4.4 10.5
43-488900
Support activities for other transportation, including rail 0.0 6.1 4.4 10.5
To Table of Figures
Aggregate-level reconstruction methods
After removing the double-counted employment in rail transportation, CES series for all data types were re-aggregated back to 1990. Reconstructed basic series were summed to aggregate levels using the normal CES aggregation methods (see the Aggregation Procedures section in the CES Technical Notes). Consequently, unadjusted aggregate employment series and hours and earnings series are subject to change from the detailed aggregate series to the major industry sector levels for trade, transportation, and utilities; private service-providing; service-providing; total private; and total nonfarm. Not seasonally adjusted employment for transportation and warehousing and its aggregates are only affected by the double count.
U.S. Bureau of Labor Statistics Page 19 of 25 Back to Top
Financial activities recoding A recoding of employers in the first quarter of 2019 in the QCEW resulted in changes to the industries in which those businesses are classified. Several large changes were observed in financial activities, necessitating reconstructions of CES data in commercial banking (55-522110), savings institutions (55-522120), credit card issuing (55-522210), real estate credit (55-522292), and financial transaction processing and clearing (55-522320).
Basic-level reconstruction methods
In March 2019, AE for commercial banking gained 49,700 in employment from savings institutions, credit card issuing, real estate credit, and financial transaction processing and clearing. Ratios of the amount of employment that were moving into commercial banking to the total amount of employment in the source industry for March 2019 were created. Those ratios were then applied to the entire history of the industry, back to 1990, to find the amounts of employment to remove from each series. The total of those amounts for each month was added to commercial banking. All other data types published for these industries were adjusted to account for the change including AE hours and earnings, PE, PE hours and earnings, and WE. Average weekly hours and average hourly earnings were recalculated by applying the same ratios to the amount of old total hours and old total payroll to move the correct amount of hours or earnings into the new CES industry. Total hours and total earnings summed for the new industries were then averaged using the new employment levels. More information about the calculation of CES employment, hours, and earnings estimates is available in the CES Technical Notes under Estimation Methods. All affected industries and the change in AE are listed in exhibit 3.
U.S. Bureau of Labor Statistics Page 20 of 25 Back to Top
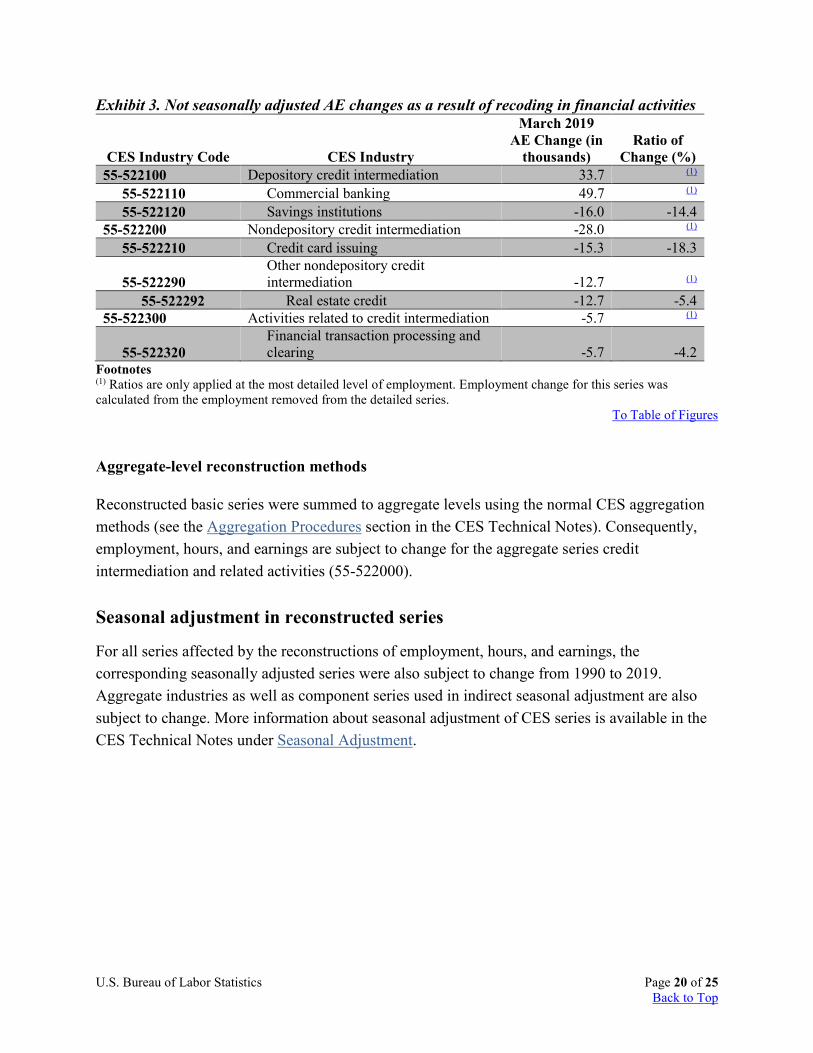
Exhibit 3. Not seasonally adjusted AE changes as a result of recoding in financial activities
CES Industry Code CES Industry
March 2019 AE Change (in
thousands) Ratio of
Change (%) 55-522100 Depository credit intermediation 33.7 (1)
55-522110 Commercial banking 49.7 (1) 55-522120 Savings institutions -16.0 -14.4
55-522200 Nondepository credit intermediation -28.0 (1) 55-522210 Credit card issuing -15.3 -18.3
55-522290 Other nondepository credit intermediation -12.7 (1)
55-522292 Real estate credit -12.7 -5.4 55-522300 Activities related to credit intermediation -5.7 (1)
55-522320 Financial transaction processing and clearing -5.7 -4.2
Footnotes (1) Ratios are only applied at the most detailed level of employment. Employment change for this series was calculated from the employment removed from the detailed series.
To Table of Figures
Aggregate-level reconstruction methods
Reconstructed basic series were summed to aggregate levels using the normal CES aggregation methods (see the Aggregation Procedures section in the CES Technical Notes). Consequently, employment, hours, and earnings are subject to change for the aggregate series credit intermediation and related activities (55-522000).
Seasonal adjustment in reconstructed series
For all series affected by the reconstructions of employment, hours, and earnings, the corresponding seasonally adjusted series were also subject to change from 1990 to 2019. Aggregate industries as well as component series used in indirect seasonal adjustment are also subject to change. More information about seasonal adjustment of CES series is available in the CES Technical Notes under Seasonal Adjustment.

U.S. Bureau of Labor Statistics Page 21 of 25 Back to Top
Changes to the CES published series With the release of the January 2020 first preliminary estimates on February 7, 2020, BLS incorporated series changes related to annual sample adequacy and disclosure review.
Series changes due to annual sample review All CES series are evaluated annually for sample size, coverage, and response rates. The following changes result from a re-evaluation of the sample and universe coverage for CES industries, which are based on the 2017 North American Industry Classification System (NAICS). Some industries no longer have sufficient sample to be estimated and published separately and were discontinued or combined with other similar industries for estimation and publication purposes. This information is also available at www.bls.gov/web/empsit/cesnewseries.htm. A list of currently published CES series is available at www.bls.gov/web/empsit/cesseriespub.htm.
Table 10. Series with CES industry code or title changes There are no series with industry code or title changes.
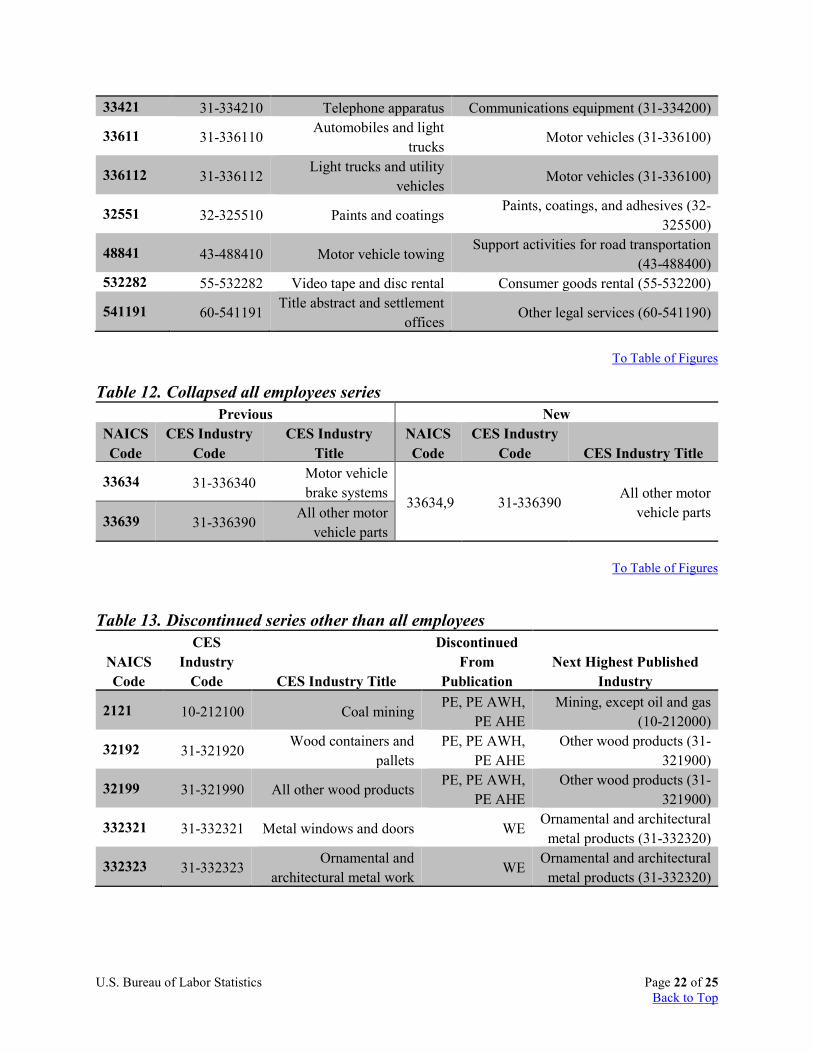
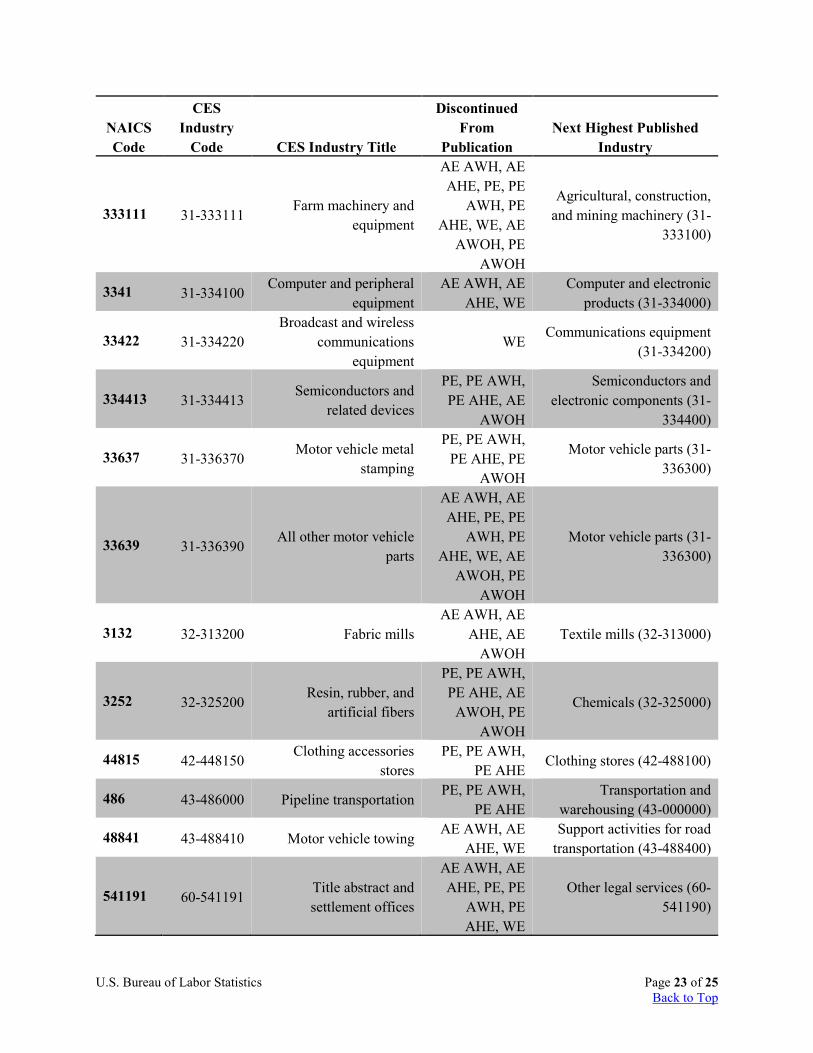
To Table of Figures In order to more easily identify affected series and because AE series are published at a more detailed industry level than non-AE series, series changes are shown for AE and non-AE data types. The first two tables in this section reference the AE data type and the third table references all non-AE data types. The tables display an AE collapse and discontinued series for AE and non-AE data types. Discontinued series tables (table 11 and table 13) display series for which the data types noted are no longer published. The collapsed series table (table 12) displays series for which the data types noted are no longer published because the industry no longer has sufficient sample to be estimated and published separately. Affected industries have been combined with other similar industries for estimation and publication purposes. Historical data for these series were reconstructed to provide consistent time series. Industries that are no longer published for AE will also no longer be published for other directly estimated data types or derivative series.
Table 11. Discontinued all employees series
NAICS Code
CES Industry
Code CES Industry Title Next Highest Published Industry 331511 31-331511 Iron foundries Ferrous metal foundries (31-331510)
333111 31-333111 Farm machinery and
equipment Agricultural implements (31-333110)
334111 31-334111 Electronic computers Computer and peripheral equipment (31-
334100)
334112,8 31-334118 Computer storage devices,
terminals, and other peripheral equipment
Computer and peripheral equipment (31-334100)
U.S. Bureau of Labor Statistics Page 22 of 25 Back to Top
33421 31-334210 Telephone apparatus Communications equipment (31-334200)
33611 31-336110 Automobiles and light
trucks Motor vehicles (31-336100)
336112 31-336112 Light trucks and utility
vehicles Motor vehicles (31-336100)
32551 32-325510 Paints and coatings Paints, coatings, and adhesives (32-
325500)
48841 43-488410 Motor vehicle towing Support activities for road transportation
(43-488400) 532282 55-532282 Video tape and disc rental Consumer goods rental (55-532200)
541191 60-541191 Title abstract and settlement
offices Other legal services (60-541190)
To Table of Figures
Table 12. Collapsed all employees series Previous New
NAICS Code
CES Industry Code
CES Industry Title
NAICS Code
CES Industry Code CES Industry Title
33634 31-336340 Motor vehicle brake systems
33634,9 31-336390 All other motor
vehicle parts 33639 31-336390 All other motor
vehicle parts
To Table of Figures
Table 13. Discontinued series other than all employees
NAICS Code
CES Industry
Code CES Industry Title
Discontinued From
Publication Next Highest Published
Industry
2121 10-212100 Coal mining PE, PE AWH,
PE AHE Mining, except oil and gas
(10-212000)
32192 31-321920 Wood containers and
pallets PE, PE AWH,
PE AHE Other wood products (31-
321900)
32199 31-321990 All other wood products PE, PE AWH,
PE AHE Other wood products (31-
321900)
332321 31-332321 Metal windows and doors WE Ornamental and architectural
metal products (31-332320)
332323 31-332323 Ornamental and
architectural metal work WE
Ornamental and architectural metal products (31-332320)
U.S. Bureau of Labor Statistics Page 23 of 25 Back to Top
NAICS Code
CES Industry
Code CES Industry Title
Discontinued From
Publication Next Highest Published
Industry
333111 31-333111 Farm machinery and
equipment
AE AWH, AE AHE, PE, PE
AWH, PE AHE, WE, AE
AWOH, PE AWOH
Agricultural, construction, and mining machinery (31-
333100)
3341 31-334100 Computer and peripheral
equipment AE AWH, AE
AHE, WE Computer and electronic
products (31-334000)
33422 31-334220 Broadcast and wireless
communications equipment
WE Communications equipment
(31-334200)
334413 31-334413 Semiconductors and
related devices
PE, PE AWH, PE AHE, AE
AWOH
Semiconductors and electronic components (31-
334400)
33637 31-336370 Motor vehicle metal
stamping
PE, PE AWH, PE AHE, PE
AWOH
Motor vehicle parts (31-336300)
33639 31-336390 All other motor vehicle
parts
AE AWH, AE AHE, PE, PE
AWH, PE AHE, WE, AE
AWOH, PE AWOH
Motor vehicle parts (31-336300)
3132 32-313200 Fabric mills AE AWH, AE
AHE, AE AWOH
Textile mills (32-313000)
3252 32-325200 Resin, rubber, and
artificial fibers
PE, PE AWH, PE AHE, AE
AWOH, PE AWOH
Chemicals (32-325000)
44815 42-448150 Clothing accessories
stores PE, PE AWH,
PE AHE Clothing stores (42-488100)
486 43-486000 Pipeline transportation PE, PE AWH,
PE AHE Transportation and
warehousing (43-000000)
48841 43-488410 Motor vehicle towing AE AWH, AE
AHE, WE Support activities for road
transportation (43-488400)
541191 60-541191 Title abstract and settlement offices
AE AWH, AE AHE, PE, PE
AWH, PE AHE, WE
Other legal services (60-541190)
U.S. Bureau of Labor Statistics Page 24 of 25 Back to Top
NAICS Code
CES Industry
Code CES Industry Title
Discontinued From
Publication Next Highest Published
Industry
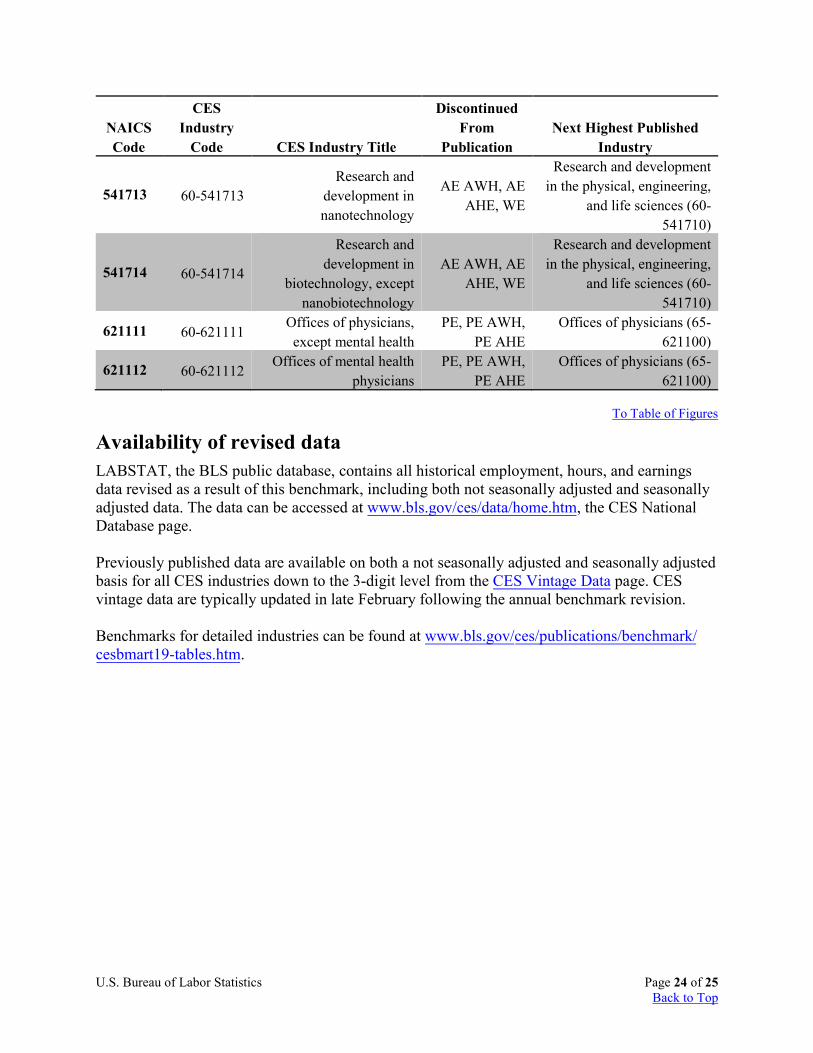
541713 60-541713 Research and
development in nanotechnology
AE AWH, AE AHE, WE
Research and development in the physical, engineering,
and life sciences (60-541710)
541714 60-541714
Research and development in
biotechnology, except nanobiotechnology
AE AWH, AE AHE, WE
Research and development in the physical, engineering,
and life sciences (60-541710)
621111 60-621111 Offices of physicians, except mental health
PE, PE AWH, PE AHE
Offices of physicians (65-621100)
621112 60-621112 Offices of mental health
physicians PE, PE AWH,
PE AHE Offices of physicians (65-
621100)
To Table of Figures
Availability of revised data LABSTAT, the BLS public database, contains all historical employment, hours, and earnings data revised as a result of this benchmark, including both not seasonally adjusted and seasonally adjusted data. The data can be accessed at www.bls.gov/ces/data/home.htm, the CES National Database page.
Previously published data are available on both a not seasonally adjusted and seasonally adjusted basis for all CES industries down to the 3-digit level from the CES Vintage Data page. CES vintage data are typically updated in late February following the annual benchmark revision.
Benchmarks for detailed industries can be found at www.bls.gov/ces/publications/benchmark/cesbmart19-tables.htm.
U.S. Bureau of Labor Statistics Page 25 of 25 Back to Top
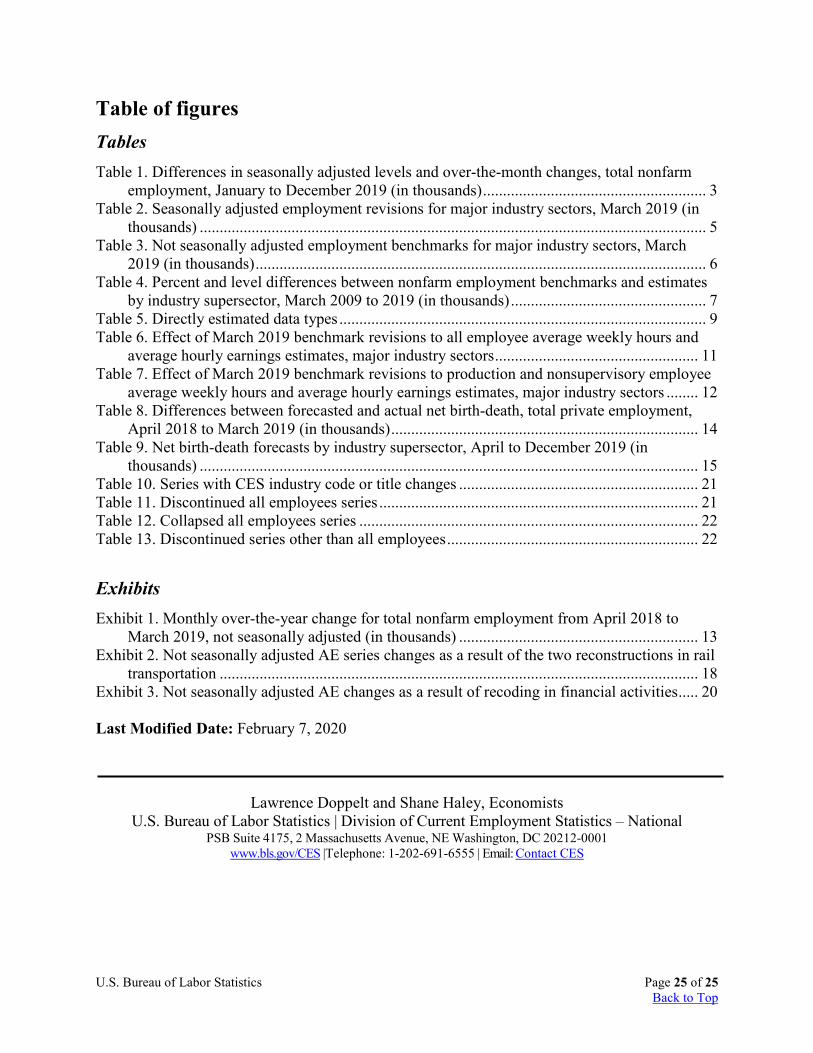
Table of figures Tables Table 1. Differences in seasonally adjusted levels and over-the-month changes, total nonfarm
employment, January to December 2019 (in thousands) ........................................................ 3 Table 2. Seasonally adjusted employment revisions for major industry sectors, March 2019 (in
thousands) ............................................................................................................................... 5 Table 3. Not seasonally adjusted employment benchmarks for major industry sectors, March
2019 (in thousands) ................................................................................................................. 6 Table 4. Percent and level differences between nonfarm employment benchmarks and estimates
by industry supersector, March 2009 to 2019 (in thousands) ................................................. 7 Table 5. Directly estimated data types ............................................................................................ 9 Table 6. Effect of March 2019 benchmark revisions to all employee average weekly hours and
average hourly earnings estimates, major industry sectors ................................................... 11 Table 7. Effect of March 2019 benchmark revisions to production and nonsupervisory employee
average weekly hours and average hourly earnings estimates, major industry sectors ........ 12 Table 8. Differences between forecasted and actual net birth-death, total private employment,
April 2018 to March 2019 (in thousands) ............................................................................. 14 Table 9. Net birth-death forecasts by industry supersector, April to December 2019 (in
thousands) ............................................................................................................................. 15 Table 10. Series with CES industry code or title changes ............................................................ 21 Table 11. Discontinued all employees series ................................................................................ 21 Table 12. Collapsed all employees series ..................................................................................... 22 Table 13. Discontinued series other than all employees ............................................................... 22
Exhibits Exhibit 1. Monthly over‐the‐year change for total nonfarm employment from April 2018 to
March 2019, not seasonally adjusted (in thousands) ............................................................ 13 Exhibit 2. Not seasonally adjusted AE series changes as a result of the two reconstructions in rail
transportation ........................................................................................................................ 18 Exhibit 3. Not seasonally adjusted AE changes as a result of recoding in financial activities ..... 20 Last Modified Date: February 7, 2020
Lawrence Doppelt and Shane Haley, Economists
U.S. Bureau of Labor Statistics | Division of Current Employment Statistics – National PSB Suite 4175, 2 Massachusetts Avenue, NE Washington, DC 20212-0001
www.bls.gov/CES |Telephone: 1-202-691-6555 | Email: Contact CES