Embed Size (px)
Citation preview
v
Contents
List of Figures ................................................................................................................................ viii
List of Tables ................................................................................................................................... ix
Acknowledgements ......................................................................................................................... xi
Abbreviations ................................................................................................................................ xiii
Summary ........................................................................................................................................ xv
1 Introduction ............................................................................................................................ 1
2 Approach/ Method ................................................................................................................. 5
2.1 Scope of Work .................................................................................................................. 5 2.2 P‐S‐I‐R Framework ............................................................................................................ 6 2.2.1 Pressures and Drivers ............................................................................................... 7
2.2.2 States ......................................................................................................................... 7
2.2.3 Impacts ...................................................................................................................... 7
2.2.4 Responses ................................................................................................................. 8
2.3 Data and Sources .............................................................................................................. 8 3 Pressure ................................................................................................................................ 11
3.1 Coastal Settlement and Development ........................................................................... 11 3.1.1 Demographic Changes ............................................................................................ 11
3.1.2 Industrialization ...................................................................................................... 12
3.1.3 Major Industries ...................................................................................................... 13
3.1.4 Micro, Small & Medium Enterprises ....................................................................... 15
3.1.5 Power Generation ................................................................................................... 16
3.1.6 Oil & Gas Exploration .............................................................................................. 16
3.1.7 Mining ..................................................................................................................... 16
3.2 Port‐led Development .................................................................................................... 17 3.3 Likelihood of Oil Spills and Accidents ............................................................................. 20 3.4 Ship Recycling ................................................................................................................. 21 3.5 Commercial Fisheries ..................................................................................................... 23 3.6 Salt Production ............................................................................................................... 25 3.7 Overexploitation of Coastal Aquifers ............................................................................. 27 3.8 Tourism ........................................................................................................................... 27
4 State ...................................................................................................................................... 29
vi
4.1 Natural Hazards and Risks .............................................................................................. 30 4.1.1 Shoreline Vulnerability ............................................................................................ 30
4.1.2 Cyclones .................................................................................................................. 31
4.1.3 Tsunami ................................................................................................................... 32
4.2 Coastal Geo‐morphology ............................................................................................... 33 4.2.1 River System ............................................................................................................ 33
4.2.2 Gulf Systems ............................................................................................................ 34
4.2.3 Islands ..................................................................................................................... 36
4.2.4 Estuaries .................................................................................................................. 36
4.3 Coastal Habitats ............................................................................................................. 37 4.3.1 Coastal Wetlands .................................................................................................... 38
4.3.2 Mangrove Forest ..................................................................................................... 40
4.3.3 Coral Reefs .............................................................................................................. 43
4.3.4 Seagrass .................................................................................................................. 46
4.3.5 Mudflats and Marshy Coast .................................................................................... 47
4.3.6 Sandy Beaches and Dunes ...................................................................................... 48
4.4 Species Diversity ............................................................................................................. 49 4.4.1 Invertebrates ........................................................................................................... 49
4.4.2 Sea and Shore Birds ................................................................................................ 50
4.4.3 Fish Diversity ........................................................................................................... 53
4.4.4 Sea Turtles ............................................................................................................... 54
4.4.5 Sea Mammals .......................................................................................................... 56
4.5 Ecologically Important Sites ........................................................................................... 59 4.6 Commercial Fisheries ..................................................................................................... 63 4.6.1 Marine Fisheries ...................................................................................................... 63
4.6.2 Estuarine Fisheries .................................................................................................. 65
4.7 Environmental Quality ................................................................................................... 66 4.8 Salinity Ingress ................................................................................................................ 70
5 Impacts .................................................................................................................................. 73
5.1 Commercial Fisheries ..................................................................................................... 73 5.2 Salt Based Industries ...................................................................................................... 75 5.3 Salinity Ingress into Coastal Aquifers ............................................................................. 75
6 Responses ............................................................................................................................. 79
vii
6.1 Biodiversity Conservation .............................................................................................. 79 6.1.1 Protected Areas ...................................................................................................... 79
6.1.2 Marine National Park and Sanctuary ...................................................................... 81
6.1.3 Whale Shark Conservation ...................................................................................... 83
6.1.4 Sea Turtle Hatcheries .............................................................................................. 85
6.2 Coastal Zone Management: Laws and Policies .............................................................. 85 6.3 Coastal Regulation and Management ............................................................................ 86 6.4 Implementation of ICZMP .............................................................................................. 87 6.5 Pollution Abatement Measures ..................................................................................... 88 6.5.1 Effluent Treatment Plants ....................................................................................... 88
6.5.2 Coastal Ocean Monitoring and Prediction System (COMAPS) ............................... 90
6.5.3 Action Plan for Critically Polluted Areas in Gujarat ................................................ 90
6.6 Mangrove Plantation ...................................................................................................... 90 6.7 Coral Reef Transplantation............................................................................................. 92 6.8 Initiation of National Centre for Marine Biodiversity (NCMB) ....................................... 92 6.9 Resource inventories and data base creation ................................................................ 92 6.10 Vessel Traffic & Port Management System ................................................................ 93 6.11 Human Development: Sagar Khedu Sarvangi Vikas Yojna ......................................... 93 6.12 Promotion of Coastal Tourism .................................................................................... 94 6.13 Nature Education ........................................................................................................ 95 6.14 Prevention and Control of Salinity Ingress ................................................................. 95 6.15 Civil Society initiatives ................................................................................................ 97 6.16 Institutions Working on Coastal Area of Gujarat ....................................................... 97
Literature Cited or Consulted ..................................................................................................... 101
Annexures ................................................................................................................................... 111
1. Mineral Distribution in Coastal Talukas .............................................................................. 111 2. Species‐wise Marine Fish Production (in kg) between 1999‐2000 and 2007‐08 ............... 112 3. List of Fish Landing Centers along Gujarat Coast ................................................................ 113 4. List of GIDC Estates in Coastal Region of Gujarat ............................................................... 116 5. List of Common Effluent Treatment Plants (CETP) in Gujarat (As on March 2010) ........... 117 6. Important water quality parameters recorded at Coastal Sampling Sites under COMAPS 119 7. DO (Dissolved Oxygen, mg/l) – Reported from GPCB coastal water monitoring sites ...... 127 8. NH3‐ N (mg/l) levels – Reported from GPCB coastal water monitoring sites .................... 130 9. BOD (mg/l) – Reported from GPCB coastal water monitoring sites ................................... 133
viii
List of Figures
Figure 1‐1: Coastline of India showing coastal shelf and other features ....................................... 1
Figure 1‐2: Gujarat's continental shelf ‐ detail ............................................................................... 1
Figure 3‐1: Distribution of major industries along coastal region ................................................ 14
Figure 3‐2: GIDC Estates ‐ distribution along the coast ................................................................ 15
Figure 3‐3: Ship traffic through Gujarat ports 2000‐01 to 2007‐08 ............................................. 19
Figure 3‐4: A view of Alang Ship Breaking Yard ........................................................................... 22
Figure 3‐5: Trends in ship recycling, Alang (1982‐83 to 2008‐09) ................................................ 22
Figure 3‐6: Steady increase in the number of fishing boats ......................................................... 24
Figure 3‐7: Fish Landing Centres ................................................................................................... 25
Figure 3‐8: Distribution of Salt Production Sites .......................................................................... 26
Figure 3‐9: Salt production, 2000 to 2008‐09 .............................................................................. 26
Figure 3‐10: Tourist Growth in Gujarat State ............................................................................... 28
Figure 4‐1: Gujarat Coastline classified into four Sections ........................................................... 29
Figure 4‐2: Gujarat Cyclone Hazard Risk Map – 100 year return period ...................................... 32
Figure 4‐3: Tsunami Hazard Risk Zonation Map of Gujarat .......................................................... 33
Figure 4‐4: Major Estuaries of Gujarat ......................................................................................... 37
Figure 4‐5: Year‐wise Mangrove Cover of Gujarat ....................................................................... 40
Figure 4‐6: Coral Reef Distribution in Gujarat .............................................................................. 44
Figure 4‐7: Important Coastal and Marine Biodiversity Areas (WII 2011) ................................... 60
Figure 4‐8: Ecologically Important Sites of Gujarat Coast ............................................................ 61
Figure 4‐9: Fish landings (1992‐93 to 2009‐10) ............................................................................ 64
Figure 4‐10: Estuarine fisheries ‐ Trends ...................................................................................... 66
Figure 5‐1: Declining fisheries (1999‐00 to 2007‐08) ................................................................... 74
Figure 5‐2: Ascending fisheries (1999‐00 to 2007‐08) .................................................................. 74
Figure 5‐3: Expansion of Salt Work in the central part of Surajbari Creek ................................... 75
Figure 5‐4: Salinity ingress along coastal areas (source CSPC) ..................................................... 76
Figure 6‐1: Protected Areas in Coastal Region of Gujarat ............................................................ 80
Figure 6‐2: Location of Marine National Park and Sanctuary in GoK ........................................... 82
Figure 6‐3: Life‐like rubber model, during one of the ‘save the whale shark’ campaigns ........... 84
ix
List of Tables
Table 1‐1: List of Coastal Districts and Talukas in Gujarat .............................................................. 3
Table 1‐2: Goods and services provided by coastal ecosystems .................................................... 3
Table 2‐1: List of key secondary data and sources ......................................................................... 9
Table 3‐1: Domestic water supply and sewage generation in coastal cities ................................ 12
Table 3‐2: Distribution of Special Economic Zones and Special Investment Regions (proposed
and upcoming) .................................................................................................................. 13
Table 3‐3: Major Industries in Coastal Talukas ‐ Group wise ....................................................... 14
Table 3‐4: Functioning Micro, Small & Medium Enterprises (2006‐07) in Coastal Districts ........ 15
Table 3‐5: Power Generation ‐ Coastal Districts and entire state ................................................ 16
Table 3‐6: Number of Mining and Quarry Leases in Coastal Districts (March 2007) ................... 17
Table 3‐7: Ports and Jetties along Gujarat Coast .......................................................................... 18
Table 3‐8: Cargo (Million Metric Tons ‐ MMT) handled by ports in Gujarat ................................ 18
Table 3‐9: Gujarat’s Share of Cargo Handling (Million Tons) in India ........................................... 19
Table 3‐10: Ship Traffic in Gujarat Coast (Number of Ships) ........................................................ 19
Table 3‐11: Minor spillage incidents near Gujarat coast (1989 to 2007) ..................................... 21
Table 3‐12: Trends in the number of fishing boats in Gujarat ‐ 1996‐97 to 200708 .................... 23
Table 3‐13 : Major fishing harbours and fish landing 2009‐10 ..................................................... 24
Table 3‐14: Important Tourist Destinations in the Coastal Areas ................................................ 28
Table 3-15: Number of Tourists visiting Marine National Park ........................................... 28
Table 4‐1: Coastal stretches susceptible to varying degree of shoreline changes ....................... 31
Table 4‐2: Major and some important minor rivers draining into Gujarat coastal waters .......... 34
Table 4‐3: Gulfs of Kachchh and Khambhat – a comparison ........................................................ 35
Table 4‐4: Types & Extent of Coastal Wetlands in Gujarat ........................................................... 39
Table 4‐5: Mangrove cover of Gujarat state ‐ Changes ................................................................ 42
Table 4‐6: Coral reefs along Gulf of Kachchh ................................................................................ 45
Table 4‐7: Coral Species Found under IUCN Red Data List ........................................................... 46
x
Table 4‐8: Seagrass bed locations in GoK ..................................................................................... 47
Table 4‐9: Number of Reported Species under Invertebrate Group and Taxa from GoK ............ 50
Table 4‐10: Sea and Shore Bird Species Found under IUCN Red Data List ................................... 51
Table 4‐11: Fishes of Gujarat coast listed in IUCN’s Red Data list ................................................ 53
Table 4‐12: No. of Lions in and around Gir Protected Areas ........................................................ 59
Table 4‐13: Sites of very high ecological and conservation significance ...................................... 61
Table 4‐14: Fisheries catch and its species composition – 1999‐00 to 2007‐08 .......................... 64
Table 4‐15: COMAPS – Reported Values DO, BOD and NH3N (Surface/ Winter/Shore& Near
Shore) in different years ................................................................................................... 67
Table 4‐16: Dissolved Oxygen (mg/L) – Reported Minimum Values pertaining to receiving water
bodies: Sea, Jetties and Estuary ........................................................................................ 68
Table 4‐17: BOD (mg/L) – Reported Maximum Values pertaining to receiving water bodies: Sea,
Jetties and Estuary ............................................................................................................ 68
Table 4‐18: Ammonia Nitrogen (NH3N, mg/L) – ReportedMaximum Values pertaining to
receiving water bodies: Sea, Jetties and Estuary .............................................................. 69
Table 4‐19: Water quality for four major estuaries ...................................................................... 69
Table 5‐1: Number of coastal villages affected by salinity ingress into aquifers ......................... 76
Table 5‐2: Talukas affected by salinity ingress into coastal aquifers ........................................... 77
Table 6‐1: Protected Areas Having Conservation Linkages with Coastal Areas of Gujarat .......... 81
Table 6‐2: Hatcheries for Olive ridley, Green turtle and Leather‐back turtles ............................. 85
Table 6‐3: CETP ‐ District‐wise Summary ...................................................................................... 89
Table 6‐4: Mangrove Plantation Area (in ha) by Different Agencies ............................................ 91
Table 6‐5: Annual Allocation (Rs. in Crore) under Sagar Khedu Sarvangi Vikas Yojna ................. 94
Table 6‐6: Participation in Nature Education Efforts .................................................................... 95
Table 6‐7: Summary of works carried out in HLC‐I and II reaches (As on 30‐09‐2011) ................ 96
Table 6‐8: Key institutions and agencies associated with coastal region in Gujarat .................... 98
xi
Acknowledgements
Our thanks are due to Dr. K.U.Mistry, Chairman GPCB and Mr Hardik Shah (Member Secretary, GPCB) for extending the cooperation of the Board.
We acknowledge the support and cooperation provided by various the officials of Gujarat Pollution Control Board, Gandhinagar; Fisheries Department, Gandhinagar; Central Pollution Control Board, Vadodara; Gujarat State Forest Department; Marine National Park, Jamnagar; Gujarat Maritime Board, Gandhinagar; Commissionerate of Industries, Gandhinagar; Commissionerate of Geology and Mining, Gandhinagar; Central Water Commission, Gandhinagar; Narmada and Water Resource Department, Gandhinagar; Sardar Sarovar Narmada Nigam Ltd, Gandhinagar, Coastal Salinity Prevention Cell, Ahmedabad and Commissionerate of Salt, Ahmedabad.
We thank all persons who shared their knowledge and understanding about the various aspects of the subject and thus helped in many ways. Following are specially thanked for the help, cooperation and inputs:Mr C.N. Pandey, Addl. PCCF, Gandhinagar; Mr Bharat J.Pathak (Director, GEER Foundation); Mr Atul Sharma (Gujarat Maritime Board); Dr B.R. Naidu (Zonal Office in-charge, CPCB, Vadodara); Mr S.D. Chaudhary (Dep. Industry Commissioner); Mr R.D.Kamboj (MNPS, Jamnagar); Mr D.K.Sharma (CCF, Kachchh Circle); Mr Devang Thakar (Senior Engineer, GPCB); Mr P.H. Satha (Former DCF, MNPS, Jamnagar); Mr L.N. Jadeja (DCF, Kachchh East); Mr P.A. Vihol (DCF, Kachchh West); Mr C.B. Bhimani (ACF, MNPS); Dr P.C. Mankodi (Zoology Dept., MSU); Dr Kavresh Vachhrajani (Zoology Dept, MSU); Mr Mahesh Pandya (Paryavaran Mitra, Ahmedabad); Dr Bharat Jethva (consultant); Dr Chandresh Dave (MNP, Jamnagar); Mr Dishant Parasharya (GEER Foundation); Mr Sujit Kumar; Mr Uday Gayakwad (CSPC); Mr Dhiren Joshi (WTI, Ahmedabad); Dr Wesley Sunderraj (Green Foundation, Bhuj); Dr G.A. Thivakaran (Scientist, Gujarat Institute of Desert Ecology); Dr Jugal Kishor Tiwari (Director, Centre for Desert and Ocean); Dr Pankaj Joshi (Sahjeevan, Bhuj); Dr Indra Gadhvi (Head of Dept., Marine Biology, Bhavnagar University); Dr V. Vijaykumar (Director-in-charge, Gujarat Institute of Desert Ecology); Dr Deepa Gawli (Dep. Director, Gujarat Ecology Society, Vadodara); Mr V. S. Soni (GPCB, Jamnagar) andMr Jignesh Trivedi (Zoology Dept, MSU).
C. H. Pandya Director
Gujarat Ecology Commission Gandhinagar

xii
xiii
Abbreviations AIS : Automatic Identification System BOD : Biological Oxygen Demand CAGR : Compounded Annual Growth Rate CETP : Common Effluent Treatment Plant CITES : Convention on International Trade in Endangered Species CMS : Convention on Migratory Species COMAPS : Coastal Ocean Monitoring and Prediction System CPCB : Central Pollution Control Board CRZ : Coastal Regulation Zone CSMCRI : Central Marine Fisheries Research Institute CSMCRI : Central Salt and Marine Chemicals Research Institute CSPC : Coastal Salinity Prevention Cell CWC : Central Water Commission CZM : Coastal Zone Management DO : Dissolved Oxygen DWT : Deadweight Tonnage EEZ : Exclusive Economic Zone EIA : Environmental Impact Assessment FSI : Forest Survey of India GANDHI : Green Action for National Dandi Heritage Initiative GDP : Gross Domestic Product GEC : Gujarat Ecology Commission GEER : Gujarat Ecological Education and Research Foundation GEER : Gujarat Ecological Education Research Foundation GIDC : Gujarat Industrial Development Corporation GMB : Gujarat Maritime Board GoK : Gulf of Kachchh GPCB : Gujarat Pollution Control Board GSDMA : Gujarat Disaster Management Authority GTS : Great Trigonometric Survey GWRDC : Gujarat Water Resource Development Corporation ha : Hectare HLC : High Level Committee IBA : Important Bird Area ICED : Indo‐Canada Environment Facility ICG : Indian Coast Guards ICMAM : Integrated Coastal and Marine Area Management ICMBA : Important Coastal and Marine Biodiversity Areas ICZMP : Integrated Coastal Zone Management Program Km (KM) : Kilometre
xiv
LDT : Light Displacement Tonnage m : Meter MCM : Million Cubic Meter MCS : Master Control Station mg/L : Milligrams per litre MINARS : Monitoring of Indian Aquatic Resources MLD or mld : Million Litre Day MMT : Million Metric Tons MMTPA : Million Metric Tons per Annum MNP&S : Marine National Park & Sanctuary MoEF : Ministry of Environment and Forests MPA : Marine Protected Area MPEDA : Marine Products Exports Development Authority MSL : Mean Sea Level MSME : Micro, Small & Medium Enterprises MSP : Marine Shipbuilding Parks MSY : Maximum Sustainable Yield MW : Mega Watts NA : Not Available NCMB : National Centre for Marine Biodiversity NIO : National Institute of Oceanography ONGC : Oil and Natural Gas Commission PA : Protected Area POL : Petroleum, Oil and Lubricants ppm : Parts per million PPP : Public Private Partnership ppt : Parts per trillion RTI : Right to Information SAC : Space Application Centre SEZ : Special Economic Zone SICOM : Society of Integrated Coastal Management SIPC : Salinity Ingress Prevention Cell SIR : Special Investment Region SOER : State of Environment Report Sq km (sq km) : Square kilometre TDS : Total Dissolved Solids TSS : Total Suspended Solids VG‐GIS : Vibrant Gujarat Global Investor Summit VHF : Very High Frequency VTPMS : Vessel Traffic & Port Management System WII : Wildlife Institute of India
xv
Summary
The State of Environment (SOE) Report provides an overview of the present status and trends in
the State’s Environment over a decade. The report is aimed at promoting adequate
environmental safeguards and to sensitize stakeholders about the needs for sound
environmental management. This report covers the coastal and marine component of the SOE.
The coastal areas of Gujarat, in many ways, have become pivotal to the development goals of
the state, at least in the near and mid‐term. The peculiarities of a somewhat heterogeneous
coastal system and the impacts of fast‐paced development poses environmental challenges
that needs to be better understood. These challenges emerge not only from the development
strategies of the state, but also from global linkages. Given the fact that the state has the
longest coastline and the largest continental shelf among all Indian states, global climate
change impacts are particularly worrisome for the state.
The term coastal environment is used here to cover the region where landward and seaward
environmental concerns along the coastal region overlap. The marine environment, for the
purpose this report, covers seaward side beyond the intertidal coastal waters. The approach
used is based on the Pressure‐State‐Impacts‐Responses (P‐S‐I‐R) framework usually employed
in the preparation of SOE Reports. The PSIR is an attempt to capture a web of causal links
starting with 'driving forces' (economic sectors, human activities) through 'pressures'
(emissions, waste) to 'states' (physical, chemical and biological) and 'impacts' on ecosystems,
human health and functions, eventually leading to political 'responses' (prioritisation, target
setting, indicators). Describing the causal chain from driving forces and pressures to impacts
and responses is a complex task. The framework assumes cause‐effect relationships between
interacting components of social, economic, and environmental systems. The line of
demarcation between the domain of “Drivers” and “Pressures” is diffused and in this report the
discussion does not attempt to make a distinction between the two.
xvi
Pressures
Coastal Settlements and Industrialization
The population in coastal talukas increased by nearly 18.3 percent from 2001, on the basis of
district level decadal growth rates reported in National Census 2011. The urban population
increased by about 34 percent in the six major coastal districts, i.e., districts with three or more
coastal talukas: Bharuch, Bhavnagar, Jamnagar, Junagadh, Kachchh, Valsad. As per National
Census 2011, between 2001 and 2011, the urban population in three coastal districts Valsad,
Kachchh and Bharuch increased by 66.4, 53 and 50 percent respectively. The rapid urbanization
requires considerable strengthening of the waste treatment and disposal facilities. Accelerated
economic development is main driver of environmental changes in the coastal region. The
central role of coastal region in the development roadmap is reflected in the large number of
proposed and upcoming Special Economic Zones (SEZ) and Special Investment Regions (SIR). In
terms of area allocated, more than 90 percent SEZ and over 80 percent of SIR are in the coastal
region.
A very large share of the capital outlay in the coastal districts is in chemical, pharmaceutical,
petro‐chemical, cement and engineering sectors. Of the total major industries in the coastal
districts, nearly one‐third falls under chemicals, drugs and pharmaceuticals group of industries.
As per latest Micro, Small & Medium Enterprises (MSME) Census 2006‐07, the coastal districts
account for nearly two‐thirds of the functioning MSME units and workers are in the 12 coastal
districts, which is fairly indicative of the level of industrial development in the coastal districts.
Nearly 60 percent of the GIDC estates in the state are located in the coastal districts and nearly
59 percent of the CETPs in the state are also in the coastal districts. The bulk of power
generation is taking place in the coastal districts with the power plants in coastal districts
accounting for about 71 percent of the power projects and 61 percent of the generating
capacity in the state. The most important mineral resources in the offshore are oil and natural
xvii
gas. Explorations revealed oil and gas reserves in the Khambhat (Cambay) basin. In the Gulfs of
Kachhchh and Khambhat, at present there are nine offshore oil and gas fields in production.
Coastal Taluka has extensive deposits of miliolite rocks of the quaternary period which are raw
materials for soda ash and cement production. Nearly 77% of the number of mining leases and
61% of quarries in the State are located in coastal districts.
Port‐led development is an approach that has been well articulated in official policy and
actions. The 42 ports (one Major, rest Non‐Major) in Gujarat account for nearly 35% of the total
traffic handled by all Ports in India and the Non‐Major Ports of Gujarat handles nearly 70
percent of the total traffic handled by all the Non‐Major Ports in India. Between 2000‐01 and
2007‐08, the number of ships passing through Gujarat ports increased by over 41 percent from
6,575 to 9,279. The total traffic handled by all Ports in Gujarat – major and others – was about
285 MMT in 2009‐10 compared to 117 MMT in 2001‐02. In the case of Non‐Major ports, the
traffic crossed 206 MMT in 2009‐10 and the compounded annual growth rate (CAGR) exceeded
16 percent between 2004‐2010 and 2009‐2010, which is six percent more than the national
growth rate for this period. Petroleum, oil and lubricants and related products (POL) account
for about 69 percent of all cargo handled at Non‐Major Gujarat Ports. Coal (10%) is the other
major cargo handled in these Non‐Major ports.
The western part of the Indian EEZ in the Arabian Sea adjoining peninsular India is a part of the
main international tanker route for oil tankers originating from the Persian Gulf. Fortunately,
there has been no major incident of oil spillage in the region. However, a few minor incidents
have been reported. Considering the quantity of oil handled and transported, the shipping
routes along the Gujarat coast are very vulnerable for oil spills.
Ship recycling emerged as an important coast‐based industry in mid‐1980’s and by mid‐1990’s it
became the world’s largest. The ship‐recycling industry imported over 30 lakh Total Light
Displacement Tonnage (LDT) in 2009‐10 after going through a lull between 2004‐05 and 2007‐
08 when the imports declined to about 6 lakhs LDT. The environmental and industrial safety
xviii
concerns as well as issues of occupational hazards have resulted in several public interest
litigations, initiated mostly by civil society organizations, seeking greater regulation.
Commercial Fisheries
The present annual catch is nearing the potential yield of 5.7 lakh tons estimated for Gujarat.
While the annual marine fish production has been fluctuating between 5.5 and 7.5 lakh metric
tons, the fishing fleet in the state has expanded manifold over the years resulting in over
capacity with larger fishing fleets competing for the limited fisheries resource. Between 1996‐
97 and 2009‐10, the number of fishing boats increased steadily from about 23,000 to 35,000
and continues to rise. At present there are 5 developed fishing harbors with modern
infrastructure, 18 developed landing centers and 117 landing centers without any major
infrastructure. The fishing port facilities are being improved. Besides upgrading facilities at
some of the existing landing centers, several new fishing ports are also expected to be
developed.
Salt Production
Salt production is a sector that provides livelihood to a significant number of families. It is an
industry based mainly on coastal waters with a smaller share contributed by inland salt
production from highly saline water trapped underground. Salt production from Gujarat
accounts for more than 70 percent of the salt produced in India.
Over‐exploitation of Coastal Aquifers
Due to high rainfall variability the agriculture depends heavily on groundwater resources.
Excessive ground water abstraction from coastal aquifers causes intrusion of saline water into
the coastal aquifers. The ‘lateral subsurface intrusion’ of seawater occurs due to the lowering of
xix
groundwater levels (about 3 m below MSL), and percolation of seawater through creeks. From
the mid‐1950s, the advent of pumping technologies helped to increase the agricultural output.
As a result, by the 1960s, there was 10 to 25 fold increase the rate of groundwater withdrawal
in the coastal areas. Resulting sharp decline in the freshwater table paved the way for the
intrusion of seawater into the primarily alluvial aquifers.
State
Ecosystems, Resources and Bio‐Diversity
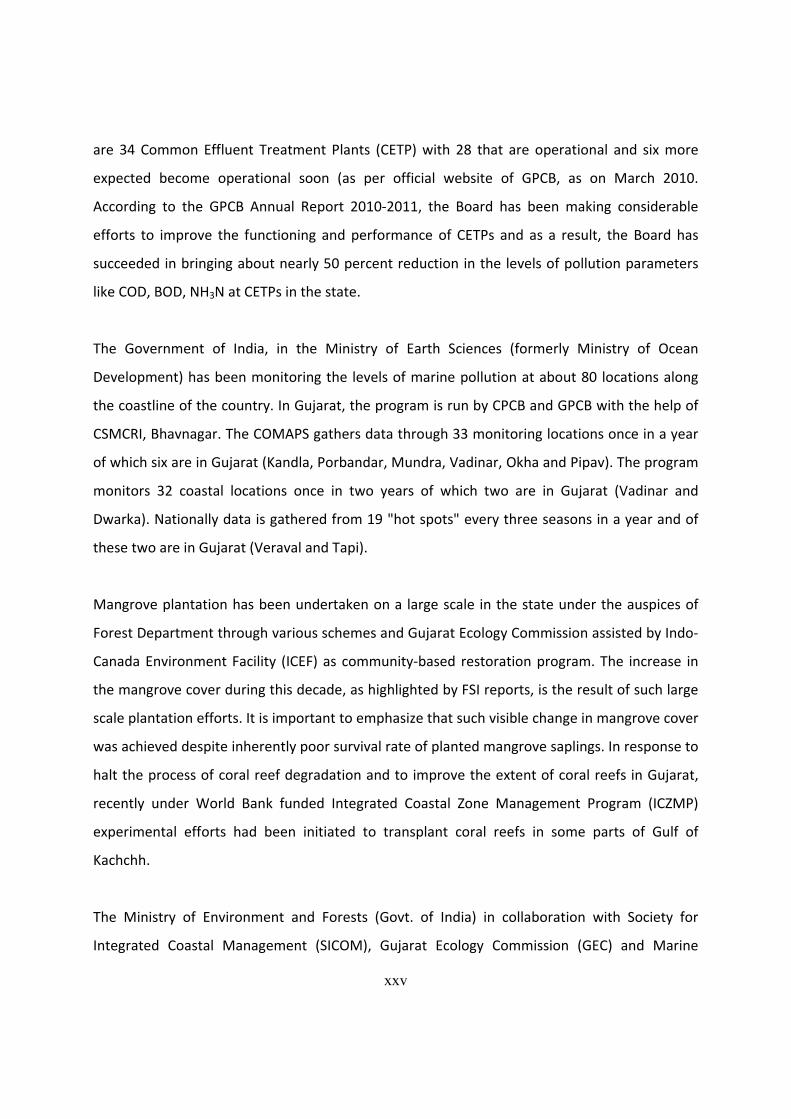
Among Indian states, Gujarat has the longest coastline (more than 1,600 km) and the most
extensive continental shelf of nearly 164,000 sq km1 (Figures 1‐1, 1‐2). These represent nearly
20 and 32 percent of India’s coastline and continental shelf. As per United Nations Conference
on the Law of Sea, the Exclusive Economic Zone (EEZ) for economic exploitation is delimited to
200 nautical miles (370.4 km) from the coast. The Exclusive Economic Zone of Gujarat covers
214,000 sq km. Four major, 25 minor and 5 desert rivers discharge into the coastal waters. The
major rivers are Narmada, Tapti, Sabarmati, and Mahi.
The two Gulfs on Gujarat coast – Gulf of Kachchh and Gulf of Khambhat ‐ differ rather
dramatically. Gulf of Khambhat, earlier known as Gulf of Cambay, is 190 km wide at its mouth
between Diu and Daman, but it rapidly narrows to 24 km. The gulf receives many rivers,
including the Sabarmati, Mahi, Narmada (Narbada), and Tapti. The Gulf is known for its extreme
tides, which vary greatly in height and run into it with amazing speed. At low tide the bottom is
left nearly dry for some distance below the town of Khambhat. The economic importance of the
Gulf has increased considerably after the discovery and exploration of oil and gas, particularly
near Bharuch. The Gulf of Kachchh is rather shallow with a depth of nearly 60 m at the mouth
1 Nearly 65,000 sq km of the shelf is within 50m depth contour from the seaboard and the rest is between 50m and
200m contour.
xx
to less than 20 m near the head. The average depth is about 30 m above chart datum (GTS).
The total gulf area is about 7350 sq km enclosing nearly 220,000 MCM by volume. The
freshwater inflows into the gulf is paltry and come mostly from the ephemeral desert rivers
Banas, Rupen and Saraswati that contribute just about 140 MCM of storm waters in a year of
good monsoon.
The state’s coast is important from both ecological and developmental perspectives. The
ecological importance of the state’s coastal ecosystem, especially that of the Gulf of Kachchh, is
attested to by the fact that India’s first Marine National Park was notified in Gulf of Kachchh. In
the ecological sense, the habitats along Gujarat’s exhibit considerable diversity and they include
mangroves, salt marshes, coral reefs, beaches, dunes, estuaries, intertidal mudflats, gulfs, bays
and wetlands.
State has India’s second largest extent of area under mangroves. According to the Forest Survey
of India, mangrove cover of the Gujarat state was about 1046 sq km in 2009 compared to 911
sq km in 2001. The National Wetland Inventory and Assessment (NWIA) carried out by the
Space Application Centre, shows that wetlands in Gujarat cover 34,750 sq km area of which
about 81 percent is coastal (28,070 sq km).
In India, the distribution of coral reefs is restricted to four major regions: the Lakshadweep, Gulf
of Mannar, Andaman and Nicobar Islands and Gujarat coast. The mapping of coral reefs in
Gujarat State sponsored by GEC in 2011 using a combination of satellite imageries and field
work showed about 217.9 sq km area in Gulf of Kachchh. In the state, sea grasses are localized
and restricted in Gulf of Kachchh. The Coral Reef Mapping exercise by GEC delineated sea grass
beds covering 2,430 ha in 8 different parts of the Gulf of Kachchh.
The Gujarat is an important refuge for large numbers of migratory and resident water birds. A
compilation from various records found that there are about 150 species of water birds
reported from coastal habitats of Gujarat and of these nearly 90 are migratory. As per IUCN Red
xxi
Data List, two of the migratory species are ‘Critically Endangered’, eleven species in the list are
‘Near Threatened’ and six belong to ‘Vulnerable’ category. Gujarat coastal waters are rich in
fish resources and the NIO’s data base lists 306 fish species from sea and coastal waters of
Gujarat. Out these, 23 are in IUCN’s Red Data list with nine belonging to shark families,
including the whale shark, included in Schedule I of Indian Wildlife Protection Act, 1972. Four of
the five species of sea turtles found in India are reported to occur in coastal waters of Gujarat.
Zoological Survey of India (ZSI) has reported 13 species of sea mammals from sea water of
Gujarat.
Recently, as part of nationwide exercise, Wildlife Institute of India, Dehradun, identified 106
Important Coastal and Marine Biodiversity Areas (ICMBA) including 13 from Gujarat. Including
these 13 ICMBAs, 41 locations in Gujarat can be considered to have high ecological and
conservation values. Some of the key conservation values that help identify these sites include:
sea turtle nesting sites, congregation of sea and shorebirds, congregation of whale sharks,
patches of coral reefs outside MNPS, patches of mangroves etc.
Coastal Water Quality
At present, in India, there is very little information and data available in public domain on
systematic and regular monitoring of the coastal waters. The systematic monitoring of levels of
pollutants along the selected and appropriate regions of the country’s coastline is being carried
out by Government of India through the Coastal Ocean Monitoring and Prediction Systems
(COMAPS) since 1991 by the Department of Ocean Development in close co‐operation with the
Ministry of Environment and Forests. For Gujarat coast, the data from COMPAS is available only
till 2009. However, even then, it is not available for all the sites covered by the system.
The available representative data (winter) for shore and near‐shore waters between 1998 and
2009 for DO, BOD and NH3N indicate that water quality is rather well maintained. However,
there are some unusual patterns such as several cases of high DO values along with high BOD

xxii
values. While, BOD shows a rising trend, NH3N levels are declining from 1998 to 2009. The
reported data indicate that minimum DO levels are improving (i.e., dissolved oxygen is more,
despite increases in oxygen demand caused by organic pollutants, BOD). The water quality
monitoring data from GPCB shows that in some locations in the Gulf of Kachchh, the minimum
level of DO is very low and the maximum BOD levels exceed the permissible limit. As per studies
available in public domain, Narmada estuary has low nutrient load. Sabarmati estuary has high
phosphates levels mostly due to the high input of domestic sewage being released from
Ahmedabad city. On the whole, the official monitoring of coastal waters indicates that by and
large the coastal water quality is within the prescribed limits.
The salinity ingress into the coastal aquifers is of particular concern for Gujarat. The emergence
of the problem prompted official investigations as early as 1958 by the then Exploratory Tube
Well Organisation in parts of coastal Saurashtra. According to the report on Water Resources
Planning for the State of Gujarat, Government of Gujarat (1996), the intrusions are in the range
of 1.3 to 4 km for the Una‐Madhavpur, 1 to 2.6 km for the Madhavpur‐Okha and 2.4 to 3.2 km
for the Okha to Malia reaches.
Impacts
Commercial Fisheries
A study by CMFRI points out a conspicuous change in the resource composition over the years
with quality (high value) fishes like pomfrets, larger sciaenids, threadfins and penaeid prawns
being replaced by low value fishes such as ribbonfishes, threadfin breams, carangids, non‐
penaeid prawns and smaller crabs. The largest increase in catch by volume is that of Bombay
duck while valued catch like black pomfret, shrimp and salmon are declining. The published
research papers also indicate that catch by volume of commercially less important species are
increasing while that of high value are decreasing. In the case of estuarine fisheries, the harvest
xxiii
of the major commercial species of freshwater prawn machrobrachium has shown a decreasing
trend in Narmada estuary.
Salinity Ingress into Coastal Aquifers
Salinity is one of the most significant and widespread forms of ground water pollution in coastal
regions of Gujarat that includes districts of Saurashtra and Kachchh. As per estimates, nearly
12.90 Lakh ha along 1,125 km of coastline is affected in seven coastal districts. The available
data indicate that in 379 out of 954 villages (40%), the ground water has TDS above 2000 mg
per litre throughout the year. In nearly 177 villages the ground water becomes saline (> 2000
mg per litre) during the summer months. In 398 villages, the ground water has TDS less than
2000 mg per litre throughout the year.
Responses
Environmental Management
There are eleven protected areas including three National Parks and eight wildlife sanctuaries in
the coastal talukas of Gujarat. The Gulf of Kachchh Marine National Park and Sanctuary (MNPS)
are meant exclusively for conservation and protection of coastal and marine biodiversity.
The whale shark is a species listed in the Appendix II of the International Convention on
Migratory Species. Effective communication and outreach efforts were felt necessary in order
to engage fishermen and local communities in conservation and protection of whale shark. A
‘Save the Whale Shark’ campaign was undertaken jointly by State Forest Department, Wildlife
Trust of India (New Delhi), Tata Chemicals Ltd. An important spiritual leader, Sri Morari Bapu,
also became actively associated with the campaign to convince the fishermen to accept whale
sharks as their own ‘vhali’ (i.e., daughter who has come back to parental home for birth of her
xxiv
first child). All this resulted in a huge public campaign for the protection of whale shark. Gujarat
State Forest Department also announced a monetary compensation of Rs 25,000/‐ for each net
that gets damaged in attempts to save the whale shark. Between 2005 and 2008, after the
campaign began, 87 stranded whale sharks have been rescued and released by fishermen.
Given the conservation importance of sea turtle species and the threats they face, in‐situ
hatching and ex situ conservation programs have been in operation in Gujarat since 1985‐86.
Between 1990‐91 and 2007‐08, more than 17,000 eggs have been collected in Mandvi and
Naliya hatcheries. About 9,590 olive ridley, 110 green turtle and 50 leatherback hatchlings have
been released into the sea.
Several national laws and policies related to marine and coastal zone management are in force.
Both the central and state governments have been making all efforts to abide these
agreements and conventions. The Gujarat Coastal Zone Management Authority has been
established in accordance with the Costal Regulation Zone (CRZ) Act for protecting and
improving the quality of the coastal environment and preventing, abating and controlling
environmental pollution in areas of the state.
The Gujarat is also implementing Integrated Coastal Zone Management Programme (ICZMP). It
consists of capacity building at different levels for effective management of the coastal areas. It
has sponsored pilot studies on the ICZM approach for Gulf of Kachchh. It has carried out
transplantation of corals in the Gulf of Kachchh and is developing sewage treatment facilities
for Jamnagar.
Effluent treatment plants are a primary mitigation measure and as per GPCB, at present there
are 6,340 effluent treatment plants (individual and common) functioning in the state. Since
many of the smaller industries are unable to maintain individual treatment plants, clusters of
small and medium industries, located mainly in the GIDC estates, have set up Common Effluent
Treatment Plants (CETP) that are run as separate enterprise, cooperative or under GIDC. There
xxv
are 34 Common Effluent Treatment Plants (CETP) with 28 that are operational and six more
expected become operational soon (as per official website of GPCB, as on March 2010.
According to the GPCB Annual Report 2010‐2011, the Board has been making considerable
efforts to improve the functioning and performance of CETPs and as a result, the Board has
succeeded in bringing about nearly 50 percent reduction in the levels of pollution parameters
like COD, BOD, NH3N at CETPs in the state.
The Government of India, in the Ministry of Earth Sciences (formerly Ministry of Ocean
Development) has been monitoring the levels of marine pollution at about 80 locations along
the coastline of the country. In Gujarat, the program is run by CPCB and GPCB with the help of
CSMCRI, Bhavnagar. The COMAPS gathers data through 33 monitoring locations once in a year
of which six are in Gujarat (Kandla, Porbandar, Mundra, Vadinar, Okha and Pipav). The program
monitors 32 coastal locations once in two years of which two are in Gujarat (Vadinar and
Dwarka). Nationally data is gathered from 19 "hot spots" every three seasons in a year and of
these two are in Gujarat (Veraval and Tapi).
Mangrove plantation has been undertaken on a large scale in the state under the auspices of
Forest Department through various schemes and Gujarat Ecology Commission assisted by Indo‐
Canada Environment Facility (ICEF) as community‐based restoration program. The increase in
the mangrove cover during this decade, as highlighted by FSI reports, is the result of such large
scale plantation efforts. It is important to emphasize that such visible change in mangrove cover
was achieved despite inherently poor survival rate of planted mangrove saplings. In response to
halt the process of coral reef degradation and to improve the extent of coral reefs in Gujarat,
recently under World Bank funded Integrated Coastal Zone Management Program (ICZMP)
experimental efforts had been initiated to transplant coral reefs in some parts of Gulf of
Kachchh.
The Ministry of Environment and Forests (Govt. of India) in collaboration with Society for
Integrated Coastal Management (SICOM), Gujarat Ecology Commission (GEC) and Marine
xxvi
National Park & Sanctuary (MNP&S), Jamnagar, has initiated development of a central
repository of information and knowledge on best practices developed for marine bio‐diversity
conservation near Jamnagar. Recognizing the ecological importance of mangroves and coral
reefs, GEC has initiated mapping and resource inventories. Detailed atlas of mangroves and
coral reefs along Gujarat coast has developed as part of this effort.
Considering the safety and security of the area in lieu of overall holistic development,
Government of Gujarat & Gujarat Maritime Board has set up one of the most modernized
Vessel Traffic & Port Management System (VTPMS). Accordingly, all maritime vessel traffic is
being monitored by a state‐of‐the‐art Vessel Traffic & Port Management System (VTPMS).
The Salinity Ingression Prevention Schemes (SIPS) Circle was established to oversee the control
measures and to monitor the problem of salinity ingress. Another step has been the activities of
the Coastal Salinity Prevention Cell (CSPC), envisaged as an initiative to bring together and
strengthen various initiatives of government and civil society organizations addressing the issue
of salinity.
State Government had initiated an integrated and holistic Human Development program with
12 point agenda including, skill up‐gradation, employment generation, education, health,
drinking water housing, soil conservation, water management, electrification, capacity building,
development of salt pan workers (agarias) and national security. The program covers about
3000 villages of 13 coastal districts.
With the inevitable increase of conflicts between environmental quality and rapid economic
development there has been raising awareness of the ecological issues by civil society in
general. This is reflected in the increased activism by civil society organizations and the large
number of environment related litigation. There is also greater involvement of civil society in
the public hearings mandated for environmental clearance of new projects. The new avenues

xxvii
like the Right to Information (RTI) Act are used extensively to bring about greater public
accountability of both the government agencies and corporate houses.
Relevant Institutions
A large number of institutions and agencies relevant to coastal environmental management and
research are functioning in the state and some of the important ones are listed below:
• Bhaskaracharya Institute for Space Applications and Geo‐informatics (BISAG),
Gandhinagar
• Central Marine Fisheries Research Institute (CMFRI), Veraval
• Central Pollution Control Board (CPCB) (Regional Office, Vadodara)
• Central Salt and Marine Chemicals Research Institute (CSMCRI), Bhavnagar
• Gujarat Coastal Zone Management Authority (GCZMA)
• Gujarat Disaster Management Authority (GSDMA), Gandhinagar
• Gujarat Ecological Education and Research (GEER) Foundation, Gandhinagar
• Gujarat Ecology Commission (GEC), Gandhinagar
• Gujarat Maritime Board (GMB), Gandhinagar
• Gujarat Pollution Control Board (GPCB), Gandhinagar
• Gujarat State Biodiversity Board (GSBB), Gandhinagar
• Gujarat State Forest Department, Gandhinagar
• Indian Coast Guard (ICG), Gandhinagar
• Marine Products Export Development Authority (MPEDA)
• Space Application Centre (SAC), Ahmedabad

xxviii
1
1 Introduction
Gujarat is among the Indian states experiencing very high economic growth. The rapid
economic growth anywhere poses many challenges for sound environmental management and
the state is no exception. The overall aim of a State of Environment (SOE) Report is to present
an assessment of current and emerging environmental challenges in terms of pressures,
management scenarios and the status of ecosystems. The GEC initiated the preparation of a
comprehensive SOE Report for the State of Gujarat keeping in mind the development of the
state in the last one decade. The SOE Report hopes to promote adequate environmental
safeguards and sensitize stakeholders to the needs of sound environmental management. A
review of last one decade is expected to provide a sound perspective for the Report.
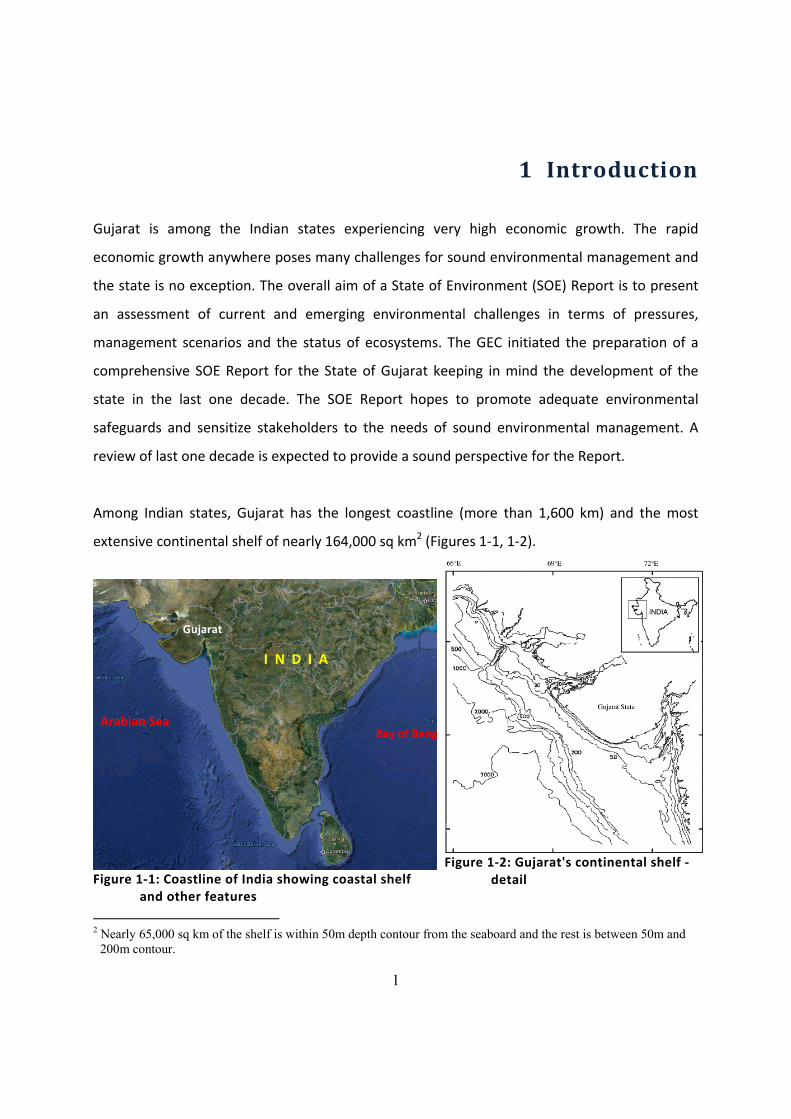
Among Indian states, Gujarat has the longest coastline (more than 1,600 km) and the most
extensive continental shelf of nearly 164,000 sq km2 (Figures 1‐1, 1‐2).
Figure 1‐1: Coastline of India showing coastal shelf and other features
Figure 1‐2: Gujarat's continental shelf ‐ detail
2 Nearly 65,000 sq km of the shelf is within 50m depth contour from the seaboard and the rest is between 50m and
200m contour.
2
These represent nearly 20 and 32 percent of India’s coastline and continental shelf. As per
United Nations Conference on the Law of Sea, the Exclusive Economic Zone (EEZ) for economic
exploitation is delimited to 200 nautical miles (370.4 km) from the coast. The Exclusive
Economic Zone of Gujarat covers 214,000 sq km. The state’s coast is important from both
ecological and developmental perspectives.
This report covers the coastal and marine environment of the state. One way of classifying
coastal component would be to use a fixed distance from the shoreline to the landward side, as
is usually done in primary studies or site‐specific assessments. However, for such demarcations
along the entire state, it is impossible to obtain comparable secondary data of different
periods, since data is compiled and published primarily on the basis of administrative units such
as district and/or taluka (Block). Taluka is the smallest administrative unit below the district
where many official data pertaining to environment and economic activity are gathered and
compiled. Therefore, to the extent possible, subject to data availability, taluka has been used as
the administrative unit of reference. Accordingly, data and analysis is centred on the coastal
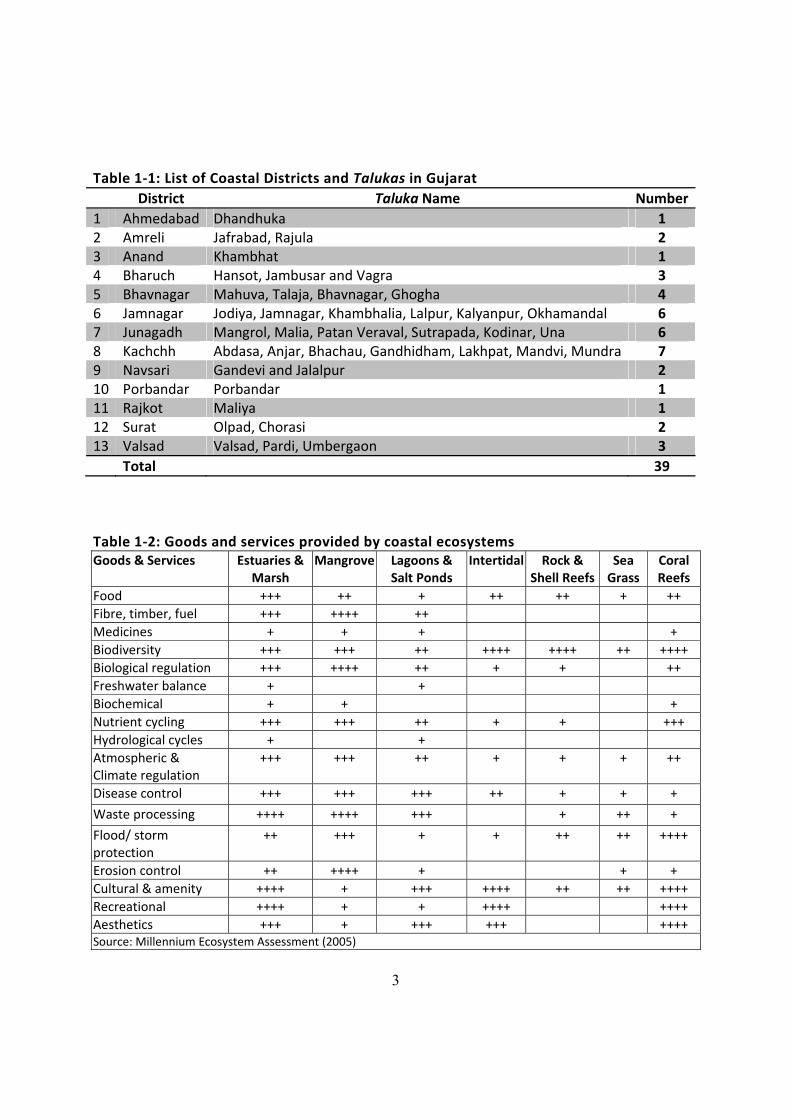
talukas that have at least some coastal stretch. Based on this criterion, the coastal region
referred to in this report consists of 39 talukas belonging to 13 districts (Table 1‐1). In many
cases, due to the administrative jurisdictions and legal frameworks, most data are available only
at district level. Therefore, where taluka‐level data is not available, the data used in the report
is of district‐level.
The term coastal environment is used here to cover the region where landward and seaward
environmental concerns along the coastal region, overlap. The marine environment, for the
purpose of this report, covers seaward side beyond the intertidal coastal waters. The near
shore coastal areas, most affected by economic activities and human interventions, consist of a
mosaic of ecosystems like mangroves, lagoons, rocks, sea‐grass beds, estuaries & marshy lands,
coral reefs etc., which provide invaluable ecological services (Table 1‐2).
3
Table 1‐1: List of Coastal Districts and Talukas in Gujarat District Taluka Name Number1 Ahmedabad Dhandhuka 12 Amreli Jafrabad, Rajula 2 3 Anand Khambhat 1 4 Bharuch Hansot, Jambusar and Vagra 3 5 Bhavnagar Mahuva, Talaja, Bhavnagar, Ghogha 4 6 Jamnagar Jodiya, Jamnagar, Khambhalia, Lalpur, Kalyanpur, Okhamandal 6 7 Junagadh Mangrol, Malia, Patan Veraval, Sutrapada, Kodinar, Una 6 8 Kachchh Abdasa, Anjar, Bhachau, Gandhidham, Lakhpat, Mandvi, Mundra 79 Navsari Gandevi and Jalalpur 2 10 Porbandar Porbandar 1 11 Rajkot Maliya 1 12 Surat Olpad, Chorasi 2 13 Valsad Valsad, Pardi, Umbergaon 3 Total 39
Table 1‐2: Goods and services provided by coastal ecosystems Goods & Services Estuaries &
Marsh Mangrove Lagoons &
Salt Ponds Intertidal Rock &
Shell Reefs Sea Grass
Coral Reefs
Food +++ ++ + ++ ++ + ++ Fibre, timber, fuel +++ ++++ ++ Medicines + + + + Biodiversity +++ +++ ++ ++++ ++++ ++ ++++ Biological regulation +++ ++++ ++ + + ++ Freshwater balance + + Biochemical + + + Nutrient cycling +++ +++ ++ + + +++ Hydrological cycles + + Atmospheric & Climate regulation
+++ +++ ++ + + + ++
Disease control +++ +++ +++ ++ + + +
Waste processing ++++ ++++ +++ + ++ +
Flood/ storm protection
++ +++ + + ++ ++ ++++
Erosion control ++ ++++ + + + Cultural & amenity ++++ + +++ ++++ ++ ++ ++++ Recreational ++++ + + ++++ ++++ Aesthetics +++ + +++ +++ ++++ Source: Millennium Ecosystem Assessment (2005)
4
In multitude of ways, the coastal areas have become pivotal to the development goals of the
state, at least in the near and mid‐term. The peculiarities of a somewhat heterogeneous coastal
system and the impacts of fast‐paced development poses environmental challenges that needs
to be better understood. These challenges emerge not only from the development strategies of
the state, but also from the world‐wide economy as a result of global climate change. Given the
fact that the state has the longest coastline and the largest continental shelf among all Indian
states, global climate change impacts are particularly worrisome for the state. The likely climate
change impacts include changes in rainfall, increase in the frequency of cyclones, sea surges,
evaporation rates, aberrations in the ocean currents, mean sea level changes, changes in mean
sea surface temperatures, and many other changes. Even without rapid industrialization,
intensive agriculture itself has made life very difficult for coastal communities because of
seawater intrusion into the coastal aquifers due to unfettered withdrawal of water from the
coastal aquifers.
5
2 Approach/ Method
2.1 Scope of Work
The focus of the study will be on the emerging environmental challenges for the coastal region
against the background of its growing developmental importance for the state and the
consequent need for sound environmental management. The approach used will be based on
the Pressure‐State‐Impacts‐Responses (P‐S‐I‐R) framework usually employed in the preparation
of SOE Reports. The report is based largely on published secondary data. Asserting or
establishing cause‐effect relationships has not been attempted as it is beyond the scope of this
work. Besides, there is considerable knowledge gap when it comes to establishing cause‐effect
relationships and its quantification in a credible research. Rather well‐known or properly
documented instances have been noted and inferences drawn without trying to generalize
based on specific cases. In other words, data extrapolations have not been attempted based on
site specific information or occasional reports. The pressures are examined in terms of changes
over one decade with year 2005 as the mid‐reference point, depending on availability of widely
accepted data.
The key themes or aspects covered under the sector report on Coastal Environment are:
1. Coastal Ecosystems (Important Habitats) and Species Conservation: Mangroves,
mudflats, coastal wetlands, coral reefs, estuarine habitats, migratory birds; protected
areas including Marine National Park and Sanctuary; rare and endangered species
2. Coastal Ecological Resources: Commercial fisheries, salt‐industry and mineral resources
Land and water issues specific to the coast: Land‐use changes, freshwater flows and
salinity ingress
6
3. Environment Management Challenges: physical infrastructure development; industrial
water pollution; domestic wastes; incidents or episodes in the coastal/marine
environment.
2.2 P‐S‐I‐R Framework
A succinct description of DPSIR framework is provided by Kristensen (2004) summarising the
approach as it has evolved over the years. DPSIR is an attempt to capture a web of causal links
starting with 'driving forces' (economic sectors, human activities) through 'pressures'
(emissions, waste) to 'states' (physical, chemical and biological) and 'impacts' on ecosystems,
human health and functions, eventually leading to political 'responses' (prioritisation, target
setting, indicators). Describing the causal chain from driving forces and pressures to impacts
and responses is a complex task, and tends to be broken down into sub‐tasks, e.g. by
considering the pressure‐state relationship. The framework assumes cause‐effect relationships
between interacting components of social, economic, and environmental systems, which are:
1. Cause of the problem: Pressure (P)– Economic, social, institutional or other pressures on
the environment that may contribute to or cause particular environmental states
2. Status of the issue: State (S) – Condition or quality of the environment and trends in that
condition brought about by human or other pressures
3. Impact of the issue: Impact (I) – Effects of the issue on people, environment and
economy
4. Response to the issue: Response (R) – Mitigation or adaption measures adopted by
different stakeholders
The DPSIR framework is widely adopted internationally and serves as an integrated approach
for Environment Reports. The framework is seen as giving a structure within which to present
the indicators needed to enable feedback to policy makers on environmental quality and the
resulting impact of the political choices made, or to be made in the future. The line of
7
demarcation between the domain of “Drivers” and “Pressures” is diffused and in this report the
discussion does not attempt to make a distinction between the two.
2.2.1 Pressures and Drivers
The driving forces are rooted in needs and they lead to economic activities and/ or human
interventions aimed at realising the needs. For an industrial sector, a driving force could be the
need to be profitable or to reduce costs, while for a nation a driving force could be the need to
keep unemployment levels low or increase overall economic growth (GDP). The resulting
human and economic activities exert 'pressures' on the environment, as a result of production
or consumption processes, which can be divided into three main types: (i) excessive use of
environmental resources, (ii) changes in ecosystems and ecological resources, (iii) emissions (of
chemicals, wastes, radiation, noise) to the environment.
2.2.2 States
As a result of pressures, the ‘state’ of the environment is affected. Pressures alter the quality of
the various environmental compartments (air, water, soil, etc.) in relation to the functions that
these compartments fulfil. The ‘state of the environment’ is thus the combination of the
physical, chemical and biological conditions.
2.2.3 Impacts
The changes in the physical, chemical or biological state of the environment determine the
quality of ecosystems and the welfare of human beings. In other words changes in the state
may have environmental or economic ‘impacts’ on the functioning of ecosystems, their life‐

8
supporting abilities, and ultimately on human health and on the economic and social
performance of society.
2.2.4 Responses
Societal or political response is the result of an undesired impact and can affect any part of the
chain between driving forces and impacts. An example of a response related to driving forces is
a policy to change mode of transportation, e.g., from private (cars) to public (trains), while an
example of a response related to pressures is a regulation concerning permissible SO2 levels in
flue gases.
2.3 Data and Sources
The SOER is mainly based on secondary data and information. The types of secondary data
examined for the SOER is summarised in Table 2‐1. A three pronged effort was employed for
data compilation and review of trends:
i. Use of data and information from available secondary sources like records and reports
of Government Department, academic and research institutions etc.
ii. Review of literature on coastal environmental issues related to Gujarat State
iii. Consultations with key government officials, NGO representatives, researchers and
subject matter experts to understand various issues related with coastal and marine
environment
9
Table 2‐1: List of key secondary data and sources Theme Aspects
1 Development and demography
Population trends; socio‐economic conditions
2 Climate Temperature, rainfall, agro‐ecological and hydrological aspects
3 Forests Extent of forest lands; Diversion of Forest Lands for non‐forestry purpose; Extent of Forest Plantations
4 Biodiversity Record/ checklists of flora and fauna; Wildlife Census records; natural heritage sites; Coastal Habitat types and extent; Extended use of coastal areas by Lion; Protected Areas and highlights
5 Mangroves Current & earlier extent; diversion for non‐forestry purpose; restoration regeneration efforts; growth & survival rate;
6 Coral Reefs Extent and losses; restoration efforts;
7 Fisheries/ Aquaculture/ Salt
Landing centre wise production data of different group of fishes; Govt. schemes and subsidies; area under aquaculture development; production of shrimps; Extent and Production
8 Industries Various aspects of industrialization and its environmental implication on coastal systems
9 Power Plants Trends and development having a bearing on coastal system 10 Ports/ Harbours Port wise cargo handling, Traffic, Capacity
11 Pollution Coastal water pollution, waste generation, air pollution, effluent disposal pipelines; accidental pollution
12 Salinity Ingression Quality of ground water salinity; extent of salinity ingression; type and cost of ameliorative/mitigation measures undertaken;
13 Water Resources Narmada water and ecological benefits to coastal areas; benefits of water transfers to rivers like Sabarmati;Current status, types of dams and amount of water stored, catchment area
14 Tourism Key destinations; Number of tourists
Most of the data collected is for the period between the year 2001 and 2010. Wherever that
was not available, current or best available data has been used. Extensive literature review
based on internet resources, libraries and other sources has been carried out. Importantly, it
has helped in understanding of spatio‐temporal conditions and changes in natural resources
and socio‐economic conditions.

10
11
3 Pressure
3.1 Coastal Settlement and Development
3.1.1 Demographic Changes
The population in coastal Talukas has increased by nearly 18.3 percent, on the basis of district
level decadal growth rates available in Census 2011. Based on Census 2001, about 63 percent of
the rural population is directly dependent on agriculture as farmers or agricultural labour. The
urban population in the coastal 38 Talukas was nearly 33 percent as per Census 2001. This is
expected to rise sharply. Gujarat is one the states experiencing rapid urbanization. As per
Census 2011, the share of urban population of the state is 42.58 compared to 31.16 for India.
As per Census 2001, it was 37.36 compared to 27.81 for India. The increase in urban population
in the 6 major coastal districts with at least three or more Talukas (Bharuch, Bhavnagar,
Jamnagar, Junagadh, Kachchh, Valsad) in the coastal area is about 34 percent. The largest
increase in urban population among coastal districts is of Valsad which saw a 66.4 percent
increase in the urban population. This district comprise of five Talukas of which three are
coastal. Kachchh with seven coastal Talukas out of total 10 and Bharuch with three coastal
talukas out of total eight have registered increase in urban population by about 53 and 50
percent respectively between 2001 and 2011.
The urban growth is not matched by corresponding increase in waste treatment facilities. A
large contribution to the pollution load in the coastal waters is the municipal wastes reaching
through point and non‐point sources and that carried by rivers. While there are efforts in
improving the treatment and disposal facilities, the actual load and treatment estimates are not
available. As part of nationwide survey of sewage treatment in class I and II cities, CPCB
estimated about 742 mld of sewage generation from 14 coastal cities including metro city of
Surat (Table 3‐1).
12
Table 3‐1: Domestic water supply and sewage generation in coastal cities
City Class Population 2008 (#)
Total Water Supply (MLD)
Sewage Generation (MLD)
Surat Metro 2,993,560 540.00 432.00 Bharuch I 182,520 31.49 25.19 Bhavnagar I 628,480 108.41 86.73 Gandhidham I 128,629 8.20 6.55 Jamnagar I 550,710 95.00 76.00 Navsari I 164,830 29.40 23.52 Porbandar I 163,690 28.24 22.59 Valsad I 132000 23.26 18.61 Varaval I 173680 29.96 23.97 Ankleshwar II 77470 8.00 6.40 Bilimora II 58240 5.00 4.00 Khambhat II 91700 9.00 7.20 Mahuva II 80520 12.08 9.66
TOTAL 5,426,029 928.04 742.42
# Population estimates by CPCB based on decadal growth rates reported in National Census 2001 ; Source: CPCB (2009)
3.1.2 Industrialization
The coastal region of the state is highly industrialized. Accelerated economic development is
main driver of environmental changes in the coastal region, more so, due to special position of
the coast in the developmental plans. The central role of coastal region in the development
roadmap is reflected in the distribution of the proposed and upcoming Special Economic Zones
and Special Investment Regions (Table 3‐2). In terms of area allocated, more than 90 percent
SEZ and over 80 percent of SIR are in the coastal region. Besides development of ports, ship
building and ship recycling are specific sectors envisaged in the Vibrant Gujarat Global Investor
Summits (2011 and upcoming 2013) for coastal industrialization.
As per the documents released during Vibrant Gujarat Global Investor Summit (VG‐GIS) 2011
and posted on the VG‐GIS website, the cumulative investments in the ship‐building sector is
expected to be a major component. The development envisages Cluster Development Marine
Shipbuilding Parks (MSP) within a stretch of 5 to 8 km along the coastal waterfronts, which will
13
be notified as SEZ. At present the state accounts for over 60% of Indian shipbuilding order
bookand the estimated gross shipbuilding capacity is expected to be about 150,000 DWT per
annum with the additional investments.
Table 3‐2: Distribution of Special Economic Zones and Special Investment Regions
(proposed and upcoming) Number of Approved SEZ Area (Ha) under Approved SEZ
District Entire State Coastal Area Entire State Coastal AreaAhmedabad 17 2 3177 1200 Amreli 2 2 262 262 Bharuch 8 6 6697 6370 Gandhinagar 6 NA 237 NA Jamnagar 1 1 4494 4494 Kachchh 14 14 15629 15629 Mehsana 1 NA 108 NA Surat 4 4 448 448 Vadodara 5 NA 364 NA Valsad 2 2 1121 1121 Total 63 33 32536 29523 Source: Industries in Gujarat Statistical information (2010) Based on types of industries that are coming up or are expected to come up it is possible to
make a reasonable guess about the polluting potential. The disaggregation by the types of
industries indicates that nearly 40 percent in SIR and 6 percent in SEZ have relatively low
pollution potential. The extent of land allocated (area) is used as a proxy for the size of industry
in the estimate instead of production capacity. These are tentative estimates based on the
types of industries proposed and are likely to differ significantly depending on the actual
industry and the technology deployed. These estimates primarily serve to underscore the
challenge of adequate environmental safeguards and pollution abatement measures in the
coastal region. Sound enforcement and proper compliance would ensure that impacts are
minimal on environment and human health.
3.1.3 Major Industries
A large share of the capital outlay in the coastal districts is in chemical, pharmaceutical, petro‐
chemical, cement and engineering sectors. Of the total major industries in the coastal districts,
nearly one‐third falls under chemicals, drugs & pharmaceuticals group of industries (Table 3‐3).

14
Table 3‐3: Major Industries in Coastal Talukas ‐ Group wise Industry Group (see note below)
District Ch St Cm Pt Fd Og Mn Sl Tx Eg Pr Pl Sb Sbr Total
Amreli 2 2
Anand 1 1
Bharuch 2 1 1 1 1 6
Bhavnagar 2 2 2 1 1 1 9
Jamnagar 1 1 1 2 2 2 1 10
Junagadh 3 2 1 6
Kachchh 2 1 1 4
Navsari 1 1
Porbandar 1 1
Surat 2 2 2 6
Valsad 7 1 3 1 12
Total 19 7 6 5 4 3 3 3 3 1 1 1 1 1 58 Source: compiled from www.vibrantgujarat.com Ch: Chemicals / Drugs‐Pharma; St: Steel and Metals; Cm: Cement; Pt: Petrochemicals; Fd: Food, Agro and Fish Processing; Og: Oil And Gas Refinery; Mn: Mineral; Sl: Salt; Tx: Textile; Eg: Engineering; Pr: Paper; Pl: Plastic; Sb: Ship building; Sbr: Ship Breaking (power sector is given in a separate table)
Figure 3‐1: Distribution of major industries along coastal region
Industry Group Units Industry Group Units Industry Group Units Chem (Chemical) 17 Textile 3 Agro (Agro and Food Processing) 4 Cement 6 Paper 1 Engg (Engineering) 1 O & G (Oil & Gas) 3 S-Bkg (Ship Recycling) 1 S & M (Steel/Metals) 7 Petro (Petro-Chemicals) 5 S-Bld (Ship Building) 1 Salt 3 Pharma (Pharmaceuticals) 2 Plastic 1 Mineral 3
See Table below the figure for explanation
15
3.1.4 Micro, Small & Medium Enterprises As per Micro, Small & Medium Enterprises (MSME) Census 2006‐07 (the latest available), the
coastal districts account for nearly two‐thirds of the functioning MSME units and workers are in
the 12 coastal districts (Table 3‐4), which is fairly indicative of the level of industrial
development in the coastal districts. Nearly 60 percent of the GIDC estates in the state are
located in the coastal districts and nearly 59 percent of the CETPs in the state are also in the
coastal districts. A list of GIDC estates in coastal talukas is presented in Annexure‐1. The
distribution along the coast is depicted in Fig 3‐2.
Table 3‐4: Functioning Micro, Small & Medium Enterprises (2006‐07) in Coastal Districts SN Coastal District Working Factories Number of Workers 1 Ahmedabad City 6,164 283,778 2 Amreli 45 3,603 3 Anand 569 17,181 4 Bharuch 2,695 73,276 5 Bhavnagar 347 30,962 6 Jamnagar 370 29,761 7 Junagadh 487 20,664 8 Kachchh 409 43,319 9 Navsari 374 19,275 10 Porbandar 73 4,773 11 Surat 2,814 218,017 12 Valsad 2,397 95,458 Total 16,744 840,067
Sources: Socio‐Economic Review Gujarat State 2010‐201; Fourth All‐India MSME Census 2006‐07
Figure 3‐2: GIDC Estates ‐ distribution along the coast
16
3.1.5 Power Generation The bulk of power generation is taking place in the coastal districts (Table 3‐5). The power
plants account for nearly 71 percent of the power projects and about 61 percent of the
generating capacity of the state.
Table 3‐5: Power Generation ‐ Coastal Districts and entire state Number of Projects Installed Capacity (MW)
Fuel Type Gujarat Coastal District Gujarat Coastal District Coal & Lignite 9 5 6,870 3,280 Gas 7 6 2,400 2,300 Nuclear 1 1 125 125 Total 17 12 9,395 5,705
Share 70.6% 60.7%
Source: www.gidb.org
3.1.6 Oil & Gas Exploration
The most important mineral resources offshore are oil and natural gas. Explorations revealed
oil and gas reserves in the Khambhat (Cambay) basin. Between 2005 and 2010, nearly 775 wells
have been drilled amounting to over 1.3 lakh meters of drilling for oil and gas exploration. In
these two Gulfs, at present there are nine offshore oil and gas fields in production operated by
ONGC and private companies.
3.1.7 Mining
In Gujarat, 22 important minerals are found distributed in 16 districts. Coastal talukas have
extensive deposits of miliolite rocks of the quaternary period which are raw materials for soda
ash and cement production. It is important to record that 77% of the total number of mining
leases and 61%of total quarries in the State are located in coastal districts (Table 3‐6). Some of
the key mining areas of the State include limestone mining in the coastal region of Junagadh,
Porbandar and Kachchh districts; lignite mining in Surat and Bhavnagar districts and bauxite
17
mining in Jamnagar, Junagadh and Valsad districts. The mineral distribution in the coastal
talukas is presented in Annexure‐2. In the context of coastal environment, there were reports
of sand mining of varying degrees from and near the Ambika, Purna, Kaveri, Aurang, Mindhola
and Tapi estuaries.
Table 3‐6: Number of Mining and Quarry Leases in Coastal Districts (March 2007) District Mining Leases Quarry Leases Ahmedabad 0 50
Amreli 13 167
Anand 0 36
Bharuch 27 192
Bhavnagar 18 66
Jamnagar 180 420
Junagadh 109 374
Kachchh 161 571
Navsari 0 362
Porbandar 264 162
Rajkot 44 338
Surat 6 293
Valsad 0 125
Total 822 3156
Source: Commissionerate of Geology & Mining, Gandhinagar
3.2 Port‐led Development Port‐led development is an approach that has been well articulated in official policy and
actions. The 42 ports (one Major, rest Non‐Major) in Gujarat (Table 3‐7) account for about a
phenomenal 35% of the total traffic handled by all Ports in India and the Non‐Major Ports of
Gujarat handles nearly 70 percent of the total traffic handled by all the Non‐Major Ports in
India.
All the ports in Gujarat including Kandla, the only Major Port in the state, handled a total traffic
of more than 285 MMT in 2009‐10 compared to 117 MMT in 2001‐02 (Table 3‐8). Total traffic
for Non‐Major ports grew at over 16 percent CAGR during 2004‐2010 to cross 206 MMT in
2009‐2010, six percent more than the national growth rate for this period. Petroleum, oil and

18
lubricants (POL) and related products account for about 69 percent of all cargo handled at Non‐
Major Gujarat Ports. Coal (10%) is the other major cargo handled in these Non‐Major ports. The
share of cargo handled by ports in Gujarat was about 28 percent of that of India in 2003‐04 and
the share increased to about 33.5 percent by 2009‐10 (Table 3‐9). Between 2000‐01 and 2007‐
08, the ship traffic through Gujarat ports increased from 6,575 to 9,279 (Table 3‐10; Fig.3‐3) –
an increase by over 41 percent. The traffic through Kandla increased to 2714 by 2011‐12.
Table 3‐7: Ports and Jetties along Gujarat Coast Type of Port/ Jetty Number Ports/ Location of jetties Major Ports 1 Kandla Intermediate Ports 11 Mandvi, Navlakhi, Bedi, Sikka, Jafrabad, Okha, Porbandar,
Veraval, Bhavnagar, Bharuch, Magdalla Minor Ports 12 Mundra (Old), Muldwarka, Pipavav (Victor), Mahuva,
Talaja, Gogha, Dahej, Salaya, Jakhau, GPPL, GAPL, HPPL Jetties‐Captive 18 Magdalla (7), Jafrabad (2),Muldwarka (1), Sikka (4), Dahej
(2), Jakhau (1), Salaya (1) Jetties‐Private NA Bedi, Porbandar, Navlakhi, Jakhau (number unknown) Jetties‐GMB NA Okha, Porbandar, Veraval, Bhavnagar, Navlakhi, Dahej,
Pipavav (Victor), Mundra (Old), Alang, Sachana (number unknown)
Total 42 All excluding Private and GMB jetties Source: Industries Statistics – 2007, 2010, Govt. of Gujarat; GMB Administration Report 2007‐08
Table 3‐8: Cargo (Million Metric Tons ‐ MMT) handled by ports in Gujarat
Year POL & Products
Coal Iron Ore Fertilizer & FRM
Others* Total
2001‐02 71.21 8.21 3.05 2.87 31.93 117.27 2002‐03 69.86 9.02 3.44 4.84 35.04 122.192003‐04 76.17 6.74 4.23 4.64 37.07 128.852004‐05 78.6 10.16 4.05 5.46 39.42 137.69 2005‐06 84.45 10.97 5.19 7.78 41.05 149.44 2006‐07 100.87 12.01 5.94 6.43 58.99 184.25 2007‐08 118.71 14.49 6.50 8.44 67.31 215.44 2008‐09 132.92 18.33 6.03 10.58 57.18 225.04 2009‐10 180.03 24.87 7.50 10.72 61.96 285.08
* All other cargoincluding food grains and containers Source: Indian Port Report (2003), www.ipa.nic.in, Basic Port Statistics of India, 2010
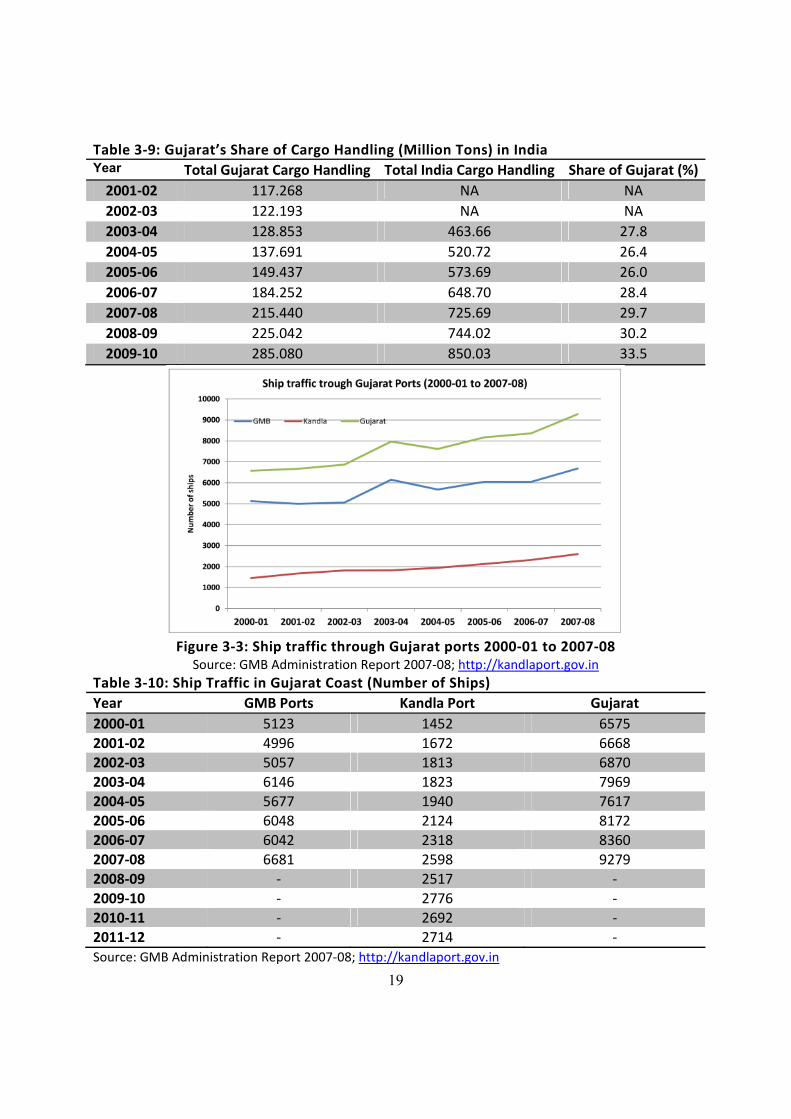
19
Table 3‐9: Gujarat’s Share of Cargo Handling (Million Tons) in India Year Total Gujarat Cargo Handling Total India Cargo Handling Share of Gujarat (%)2001‐02 117.268 NA NA 2002‐03 122.193 NA NA 2003‐04 128.853 463.66 27.8 2004‐05 137.691 520.72 26.4 2005‐06 149.437 573.69 26.0 2006‐07 184.252 648.70 28.4 2007‐08 215.440 725.69 29.7 2008‐09 225.042 744.02 30.2 2009‐10 285.080 850.03 33.5
Figure 3‐3: Ship traffic through Gujarat ports 2000‐01 to 2007‐08
Source: GMB Administration Report 2007‐08; http://kandlaport.gov.in Table 3‐10: Ship Traffic in Gujarat Coast (Number of Ships) Year GMB Ports Kandla Port Gujarat 2000‐01 5123 1452 6575 2001‐02 4996 1672 6668 2002‐03 5057 1813 6870 2003‐04 6146 1823 7969 2004‐05 5677 1940 7617 2005‐06 6048 2124 8172 2006‐07 6042 2318 8360 2007‐08 6681 2598 9279 2008‐09 ‐ 2517 ‐ 2009‐10 ‐ 2776 ‐ 2010‐11 ‐ 2692 ‐ 2011‐12 ‐ 2714 ‐ Source: GMB Administration Report 2007‐08; http://kandlaport.gov.in
20
Between 2001‐02 and 2009‐10, the investments in the sector tripled from about Rs 7,300
crores to over Rs 22,000 crores. In this period, the total port capacity increased by 80 percent
from 135 to 244 MMTPA. The Gujarat Maritime Board has identified 11 Greenfield sites to
develop all weather direct berthing ports with the participation of major private port players. In
addition to these Greenfield ports, GMB has identified five sites to be developed as deep‐
draught ports. All these are expected to add over 100 MMTPA of cargo handling capacity (GMB
2008, 2011). Besides capacity addition at existing ports and investments in new ports, the port‐
led development envisages leveraging the growth potential by promoting investments in
industrial clusters close to ports, strengthening the ship building and ship recycling industries
and encouraging a variety of facilities, industries and services that can take advantage of the
port facilities directly or indirectly.
3.3 Likelihood of Oil Spills and Accidents
The major marine coastal concern is possibility of accidents and mishaps along shipping routes,
especially those involving oil tankers and those carrying petroleum products. More than 8,300
ships passed through the state’s ports in 2010‐11 as compared to nearly 5,000 in 2000‐01. The
western part of the Indian EEZ, that is, the Arabian Sea adjoining peninsular India, forms the
main international tanker route for oil tankers originating from the Persian Gulf. Fortunately,
there has been no major incident of oil spillage in the region but a few minor incidents were
reported by Coast Guards (Table 3‐11).
The documents posted on the official website of the Indian Coast Guard (2011), which has the
primary responsibility for responding to oil spills and emergencies involving ships, state that
considering the quantity of oil handled and transported, the shipping routes along the Gujarat
coast must be considered as very vulnerable for oil spills, although only minor incidences of oil
spill have occurred in the past. The probability of incidents from tanker traffic, loading,
unloading, and associated activities can only increase as the demand for petroleum and its
products continues to rise. A study based on the likely risk and sensitivity of the biological
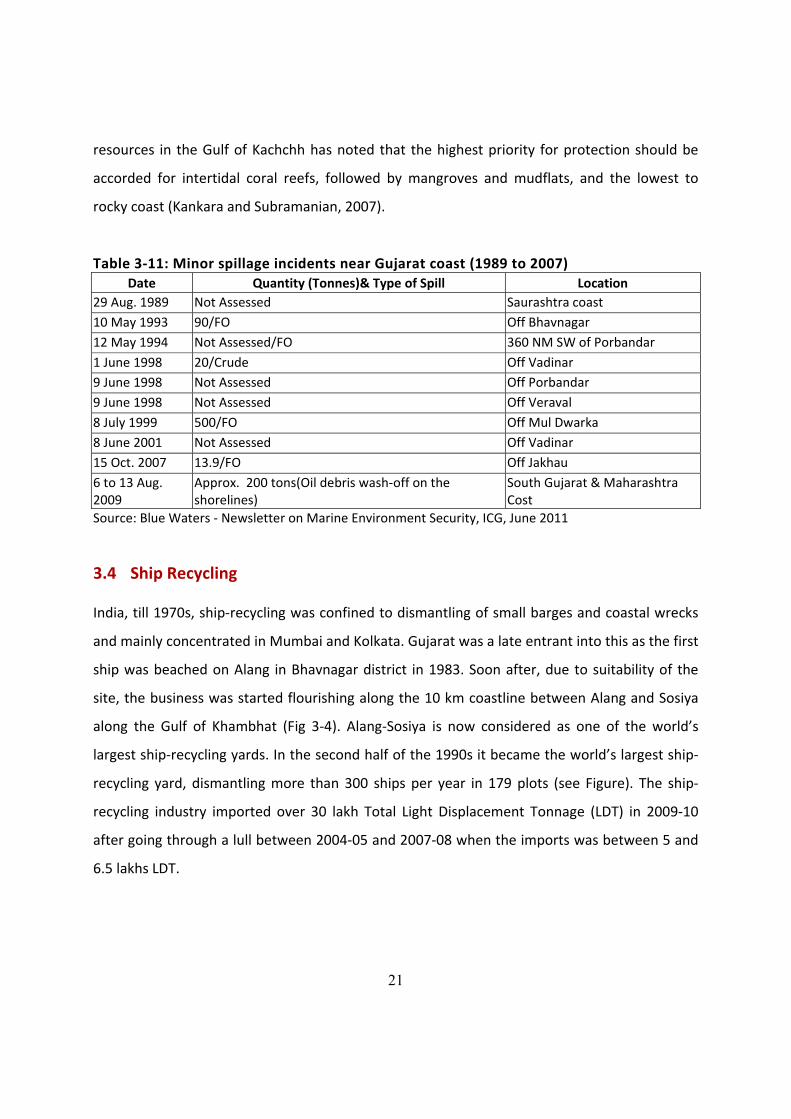
21
resources in the Gulf of Kachchh has noted that the highest priority for protection should be
accorded for intertidal coral reefs, followed by mangroves and mudflats, and the lowest to
rocky coast (Kankara and Subramanian, 2007).
Table 3‐11: Minor spillage incidents near Gujarat coast (1989 to 2007) Date Quantity (Tonnes)& Type of Spill Location
29 Aug. 1989 Not Assessed Saurashtra coast 10 May 1993 90/FO Off Bhavnagar 12 May 1994 Not Assessed/FO 360 NM SW of Porbandar 1 June 1998 20/Crude Off Vadinar 9 June 1998 Not Assessed Off Porbandar 9 June 1998 Not Assessed Off Veraval 8 July 1999 500/FO Off Mul Dwarka 8 June 2001 Not Assessed Off Vadinar 15 Oct. 2007 13.9/FO Off Jakhau 6 to 13 Aug. 2009
Approx. 200 tons(Oil debris wash‐off on the shorelines)
South Gujarat & Maharashtra Cost
Source: Blue Waters ‐ Newsletter on Marine Environment Security, ICG, June 2011
3.4 Ship Recycling India, till 1970s, ship‐recycling was confined to dismantling of small barges and coastal wrecks
and mainly concentrated in Mumbai and Kolkata. Gujarat was a late entrant into this as the first
ship was beached on Alang in Bhavnagar district in 1983. Soon after, due to suitability of the
site, the business was started flourishing along the 10 km coastline between Alang and Sosiya
along the Gulf of Khambhat (Fig 3‐4). Alang‐Sosiya is now considered as one of the world’s
largest ship‐recycling yards. In the second half of the 1990s it became the world’s largest ship‐
recycling yard, dismantling more than 300 ships per year in 179 plots (see Figure). The ship‐
recycling industry imported over 30 lakh Total Light Displacement Tonnage (LDT) in 2009‐10
after going through a lull between 2004‐05 and 2007‐08 when the imports was between 5 and
6.5 lakhs LDT.
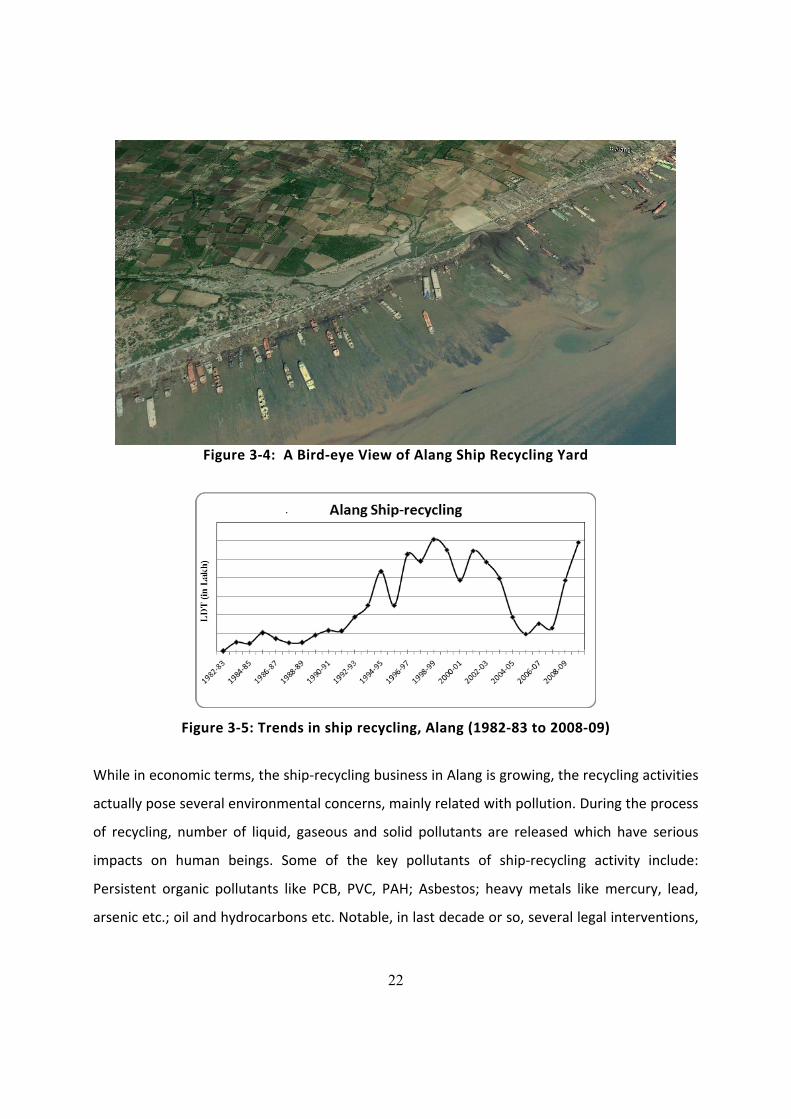
22
Figure 3‐4: A Bird‐eye View of Alang Ship Recycling Yard
Figure 3‐5: Trends in ship recycling, Alang (1982‐83 to 2008‐09)
While in economic terms, the ship‐recycling business in Alang is growing, the recycling activities
actually pose several environmental concerns, mainly related with pollution. During the process
of recycling, number of liquid, gaseous and solid pollutants are released which have serious
impacts on human beings. Some of the key pollutants of ship‐recycling activity include:
Persistent organic pollutants like PCB, PVC, PAH; Asbestos; heavy metals like mercury, lead,
arsenic etc.; oil and hydrocarbons etc. Notable, in last decade or so, several legal interventions,

23
on behest of civil society organizations, were witnessed to push environmental compliances
while recycling the ships carrying hazardous materials.
3.5 Commercial Fisheries The present annual catch is nearing the potential yield of 5.7 lakh tons estimated for Gujarat.
About 75% of the total marine fish landings of Gujarat are of comparatively low economic
value. Bombay duck forms the mainstay of the dol net fishery. The low value catch is sundried
or block frozen and exported to China and Southeast Asian countries. The fishery at present is
dominated by low value fin and shell fishes like smaller croakers, carangids, Bombay duck,
ribbon‐fishes, threadfin breams, lizard fishes, flatfishes and non‐penaeid prawns.
While the annual marine fish production has been fluctuating between 5.5 and 7.5 lakh metric
tons, the fishing fleet in the state has expanded manifold over the years resulting in over
capacity with larger fishing fleets competing for the limited fisheries resource. Between 1996‐
97 and 2009‐10, the number of fishing boats increased steadily from about 23 to 35 thousand
and shows no sign of any decline (Table 3‐12, Fig 3‐5).
Table 3‐12: Trends in the number of fishing boats in Gujarat ‐ 1996‐97 to 200708 Year Trawler Gillneter FRP
boats Wooden Canoes
OBM
Others/ Dollneters
Total mechanized
Total non- mechanized
Total
1 1996-97 6027 3205 3012 1827 600 14671 8851 23522 2 1997-98 6390 3275 3551 1854 628 15698 8918 24616 3 1998-99 6749 3482 3998 1899 635 16763 9222 25985 4 1999-00 6787 3764 4347 1895 663 17456 8819 26275 5 2000-01 6948 3375 5162 1813 1238 18536 10170 28706 6 2001-02 7029 3007 5584 1807 1665 19092 10414 29506 7 2002-03 7163 3031 6004 1805 1665 19668 10430 30098 8 2003-04 7402 3082 6390 263 1498 18635 12365 31000 9 2004-05 7045 2319 6822 56 2127 18369 11784 30153
10 2005-06 7090 2315 7566 56 2138 19165 11905 31070 11 2006-07 7189 2316 8650 56 2148 20359 11011 31370 12 2007-08 7438 2352 9548 56 2175 21569 10917 32486 Source: Fisheries Dept., Govt. of Gujarat
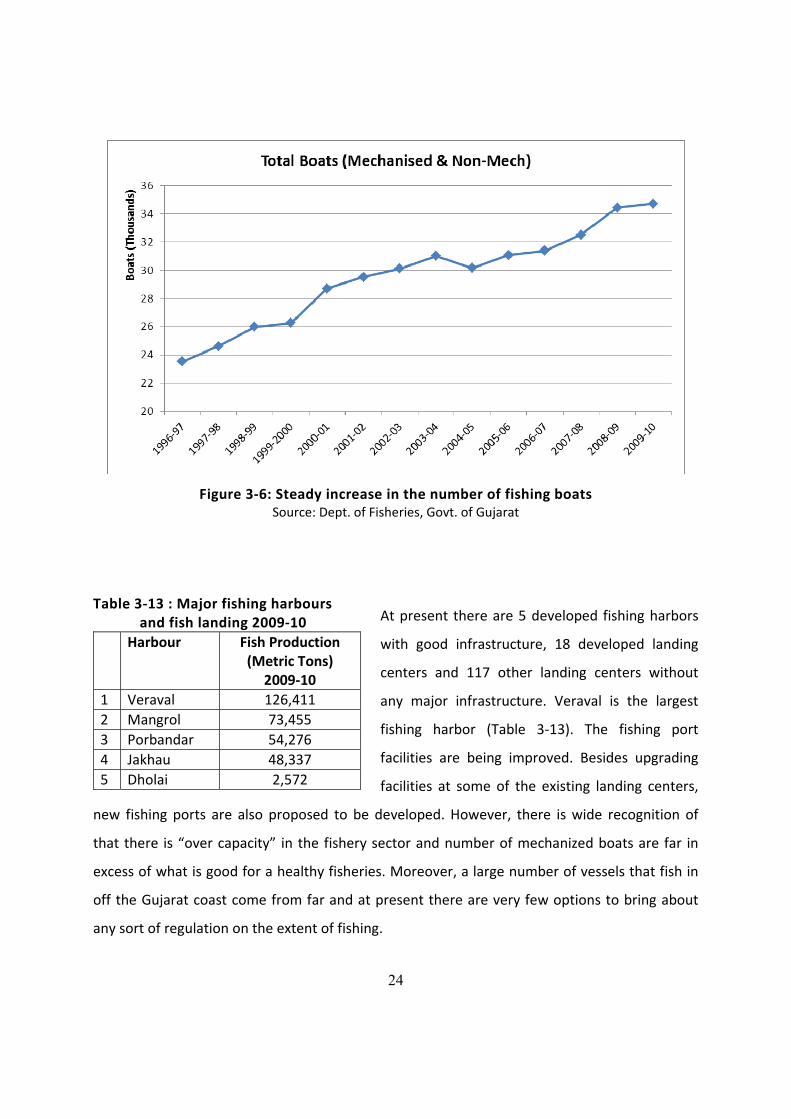
24
Figure 3‐6: Steady increase in the number of fishing boats Source: Dept. of Fisheries, Govt. of Gujarat
At present there are 5 developed fishing harbors
with good infrastructure, 18 developed landing
centers and 117 other landing centers without
any major infrastructure. Veraval is the largest
fishing harbor (Table 3‐13). The fishing port
facilities are being improved. Besides upgrading
facilities at some of the existing landing centers,
new fishing ports are also proposed to be developed. However, there is wide recognition of
that there is “over capacity” in the fishery sector and number of mechanized boats are far in
excess of what is good for a healthy fisheries. Moreover, a large number of vessels that fish in
off the Gujarat coast come from far and at present there are very few options to bring about
any sort of regulation on the extent of fishing.
Table 3‐13 : Major fishing harbours and fish landing 2009‐10
Harbour Fish Production(Metric Tons)
2009‐10 1 Veraval 126,411 2 Mangrol 73,455 3 Porbandar 54,276 4 Jakhau 48,337 5 Dholai 2,572
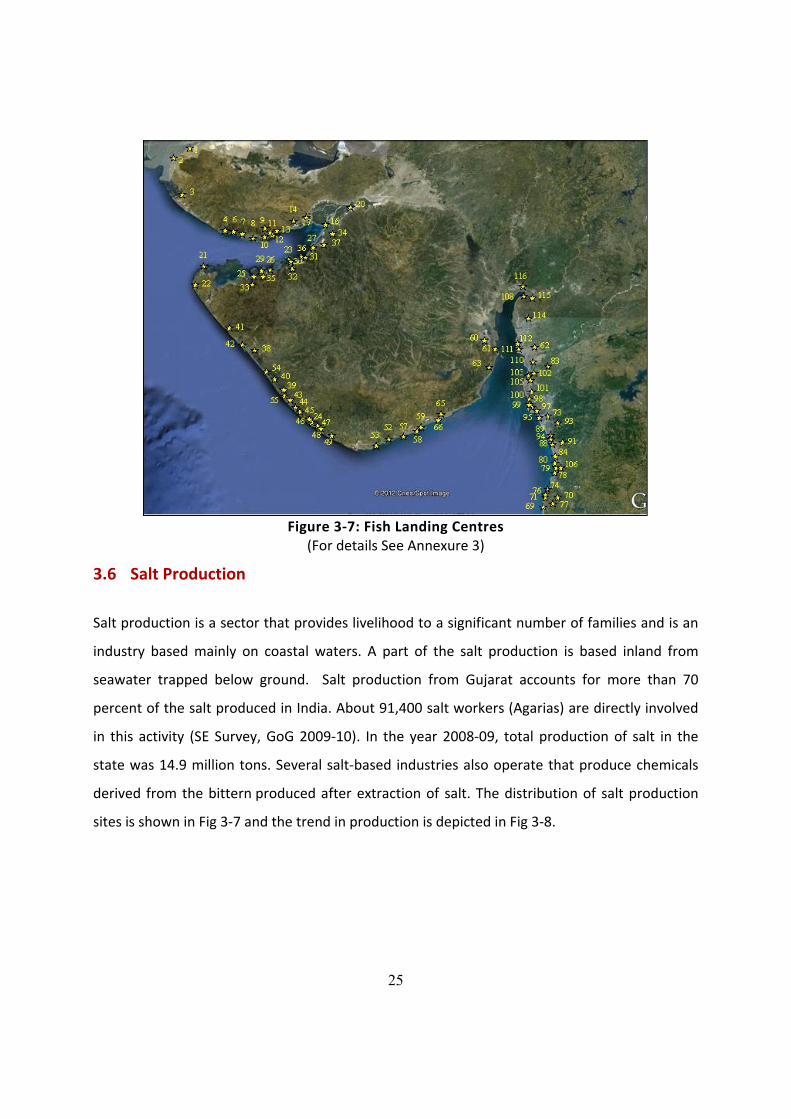
25
Figure 3‐7: Fish Landing Centres
(For details See Annexure 3)
3.6 Salt Production
Salt production is a sector that provides livelihood to a significant number of families and is an
industry based mainly on coastal waters. A part of the salt production is based inland from
seawater trapped below ground. Salt production from Gujarat accounts for more than 70
percent of the salt produced in India. About 91,400 salt workers (Agarias) are directly involved
in this activity (SE Survey, GoG 2009‐10). In the year 2008‐09, total production of salt in the
state was 14.9 million tons. Several salt‐based industries also operate that produce chemicals
derived from the bittern produced after extraction of salt. The distribution of salt production
sites is shown in Fig 3‐7 and the trend in production is depicted in Fig 3‐8.
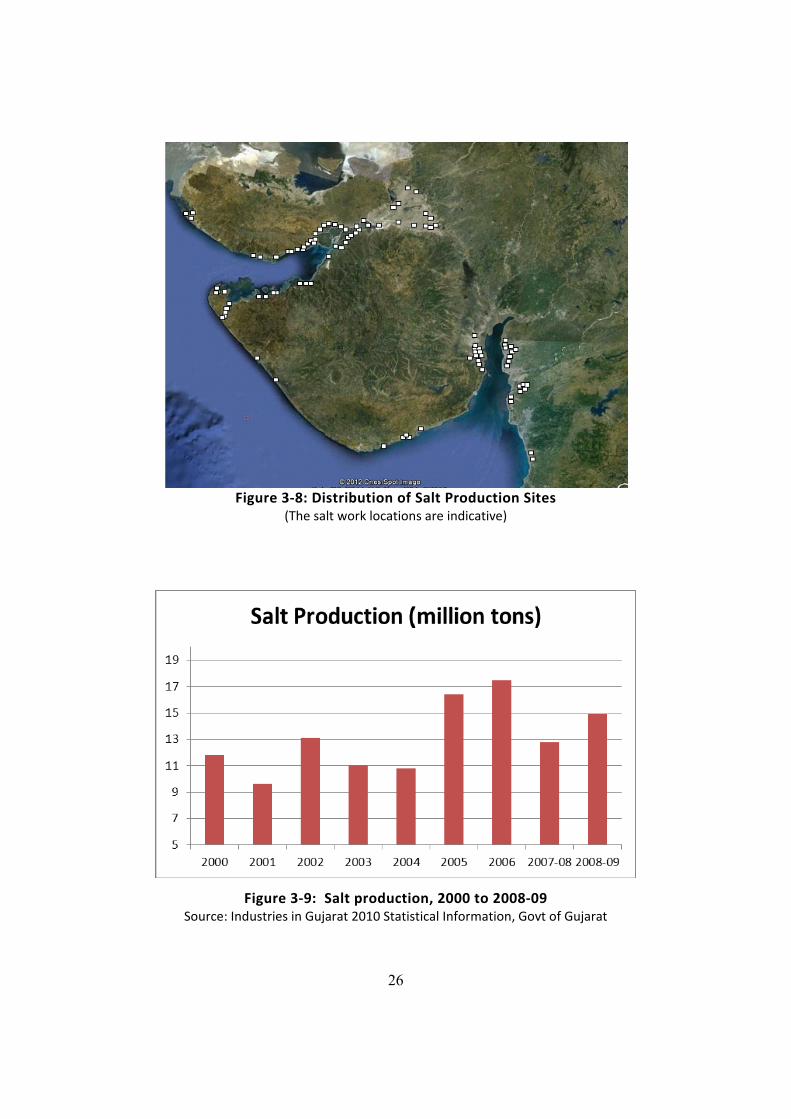
26
Figure 3‐8: Distribution of Salt Production Sites
(The salt work locations are indicative)
Figure 3‐9: Salt production, 2000 to 2008‐09 Source: Industries in Gujarat 2010 Statistical Information, Govt of Gujarat
27
3.7 Overexploitation of Coastal Aquifers
Due to high rainfall variability the agriculture depends heavily on groundwater resources.
Excessive ground water abstraction from coastal aquifers causes intrusion of saline water into
the coastal aquifers. The ‘lateral subsurface intrusion’ of seawater occurs due to the lowering of
groundwater levels (about 3 m below MSL), and percolation of seawater through creeks. From
the mid‐1950s, the advent of pumping technologies helped to increase the agricultural output.
As a result, by the 1960s, there was 10 to 25 fold increase the rate of groundwater withdrawal
in the coastal areas. Resulting sharp decline in the freshwater table paved the way for the
intrusion of seawater into the primarily alluvial aquifers.
3.8 Tourism
Tourism is an important and emerging economic growth sector. According to Gujarat Tourism
Department records, the number of tourists in year 2011‐12 was about 223.5 lakh tourists
compared to 61.7 lakhs in 2002‐03 (Fig 3‐10). In the coastal region, tourism is being promoted
around 11 beaches and 4 religious sites including the famous Dwarka and Somnath
temples(Table 3‐14). The tourism in some of the ecologically important locations needs to be
made sensitive to the specific features of such locations. The increase of tourism to Marine
National Park and sites like Pirotan Islands (Table 3‐15) must be matched by adequate
precautions and sensitization of the tourists themselves.
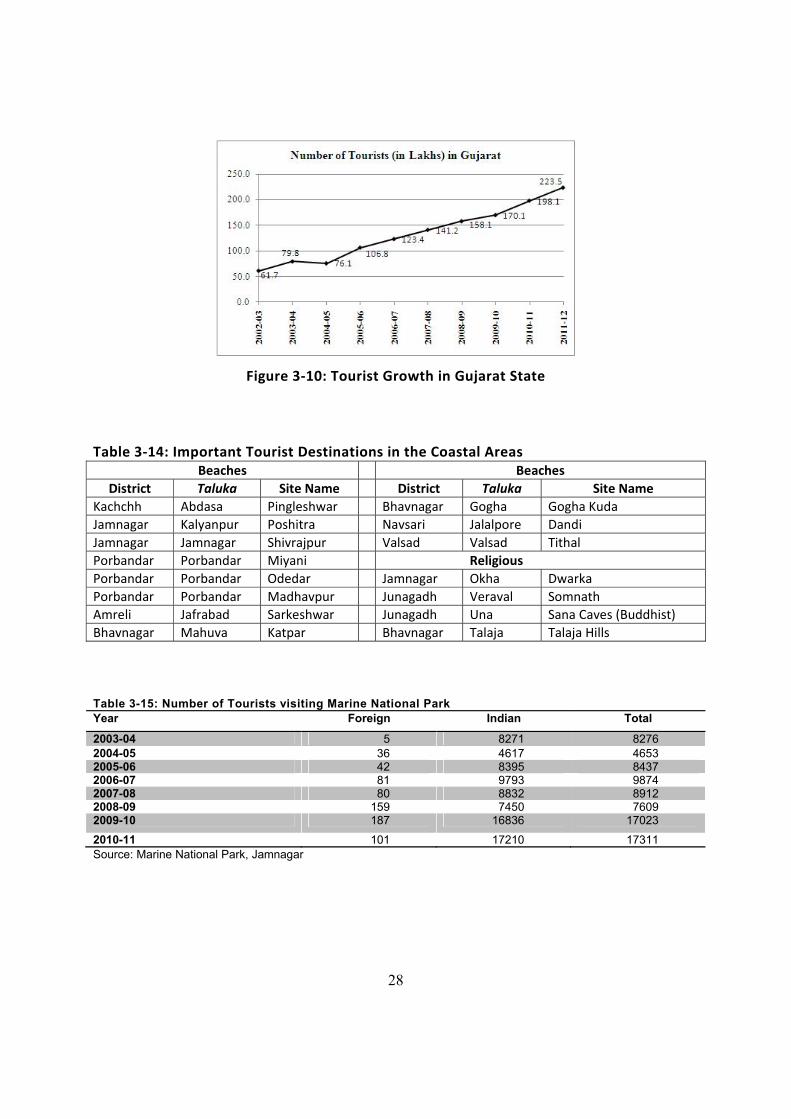
28
Figure 3‐10: Tourist Growth in Gujarat State
Table 3‐14: Important Tourist Destinations in the Coastal Areas Beaches Beaches
District Taluka Site Name District Taluka Site Name Kachchh Abdasa Pingleshwar Bhavnagar Gogha Gogha Kuda Jamnagar Kalyanpur Poshitra Navsari Jalalpore Dandi Jamnagar Jamnagar Shivrajpur Valsad Valsad Tithal Porbandar Porbandar Miyani Religious Porbandar Porbandar Odedar Jamnagar Okha Dwarka Porbandar Porbandar Madhavpur Junagadh Veraval Somnath Amreli Jafrabad Sarkeshwar Junagadh Una Sana Caves (Buddhist) Bhavnagar Mahuva Katpar Bhavnagar Talaja Talaja Hills
Table 3-15: Number of Tourists visiting Marine National Park Year Foreign Indian Total
2003-04 5 8271 8276 2004-05 36 4617 4653 2005-06 42 8395 8437 2006-07 81 9793 9874 2007-08 80 8832 8912 2008-09 159 7450 7609 2009-10 187 16836 17023
2010-11 101 17210 17311 Source: Marine National Park, Jamnagar
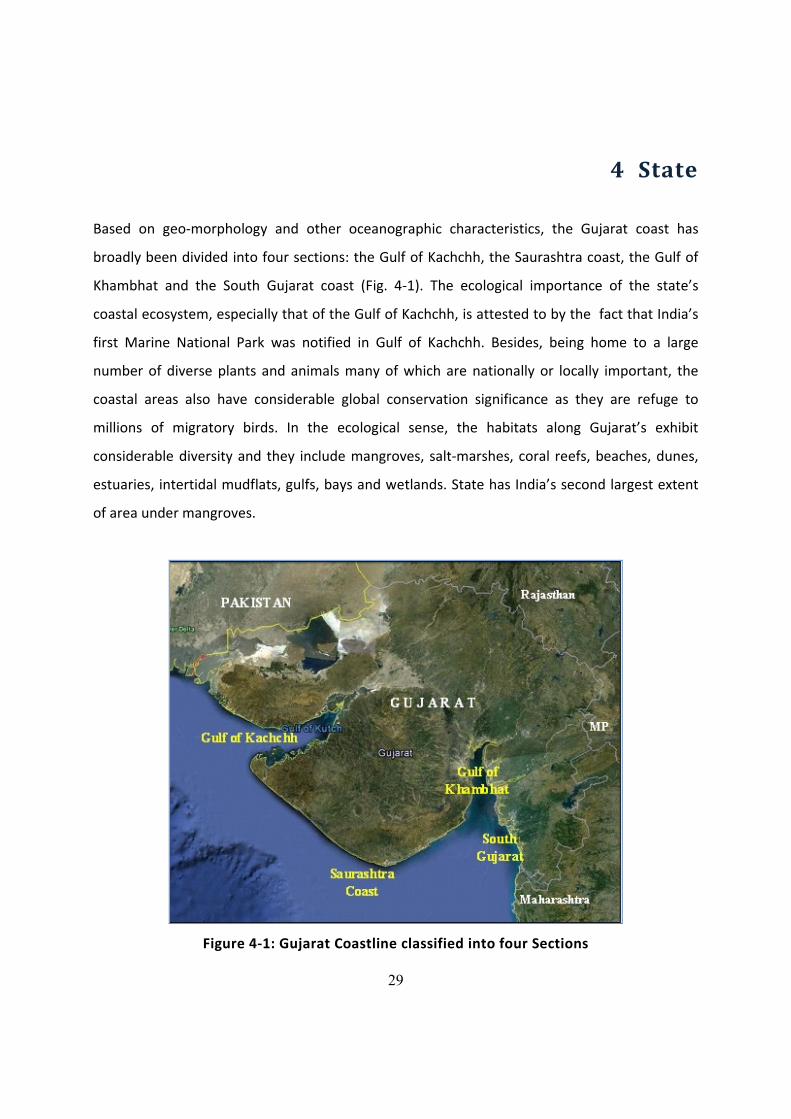
29
4 State
Based on geo‐morphology and other oceanographic characteristics, the Gujarat coast has
broadly been divided into four sections: the Gulf of Kachchh, the Saurashtra coast, the Gulf of
Khambhat and the South Gujarat coast (Fig. 4‐1). The ecological importance of the state’s
coastal ecosystem, especially that of the Gulf of Kachchh, is attested to by the fact that India’s
first Marine National Park was notified in Gulf of Kachchh. Besides, being home to a large
number of diverse plants and animals many of which are nationally or locally important, the
coastal areas also have considerable global conservation significance as they are refuge to
millions of migratory birds. In the ecological sense, the habitats along Gujarat’s exhibit
considerable diversity and they include mangroves, salt‐marshes, coral reefs, beaches, dunes,
estuaries, intertidal mudflats, gulfs, bays and wetlands. State has India’s second largest extent
of area under mangroves.
Figure 4‐1: Gujarat Coastline classified into four Sections

30
4.1 Natural Hazards and Risks
4.1.1 Shoreline Vulnerability
The landward displacement of the shoreline caused by the forces of waves and currents is
termed as coastal erosion. It is a loss of sub‐aerial landmass into sea due to natural processes
(e.g. waves, winds, tides, storms, sea level rise etc.) as well as anthropogenic factors (e.g.
physical alteration in tidal entrance, construction of ports, harbours and jetties; destruction of
mangrove and other bio‐shields, mining in coastal areas etc.)
Along the Gujarat coast, substantial shoreline erosion is reported from Gulf of Khambhat and
Saurashtra region. However, due to vast intertidal area, rocky shores and presence of corals
and mangroves, the southern side of Gulf of Kachchh is quite protected from the problem of
coastal erosion. As part of country level assessment of shoreline changes conducted by
Institute of Ocean Management (Anna University), problem of coastal erosion along the Gujarat
coast was deciphered. For the purpose, coastal tracts were assessed for three levels of erosion‐
the low, the medium and the high. At the state level, extent of coastal erosion suggest that out
of total coast line of 1600 km, about 733 km (i.e. 45.8%) had encountered with different degree
of erosion i.e. 84.5 km as high, 170.2 as medium and 478.1 as low (Table 4‐1 ).
Coastal areas of 13 districts and 38talukas were found affected. For example, in Kachchh a total
of 310.6 km of coastline is affected by this problem‐ 62.3 km of this as high erosion. Other
coastal districts that face problem of erosion include Junagadh (100.3 km), Jamnagar (90.9 km),
Amreli (26.2 km), Bhavnagar (65.0 km), Bharuch (54.7 km), Valsad (44 km) and Surat (18.1 km).
It is important to mention here that the severity of coastal erosion also define the physical and
environmental vulnerability of the coast and thus had serious implications on the
developmental activities. Accordingly, as per MoEF notification, while the area under high
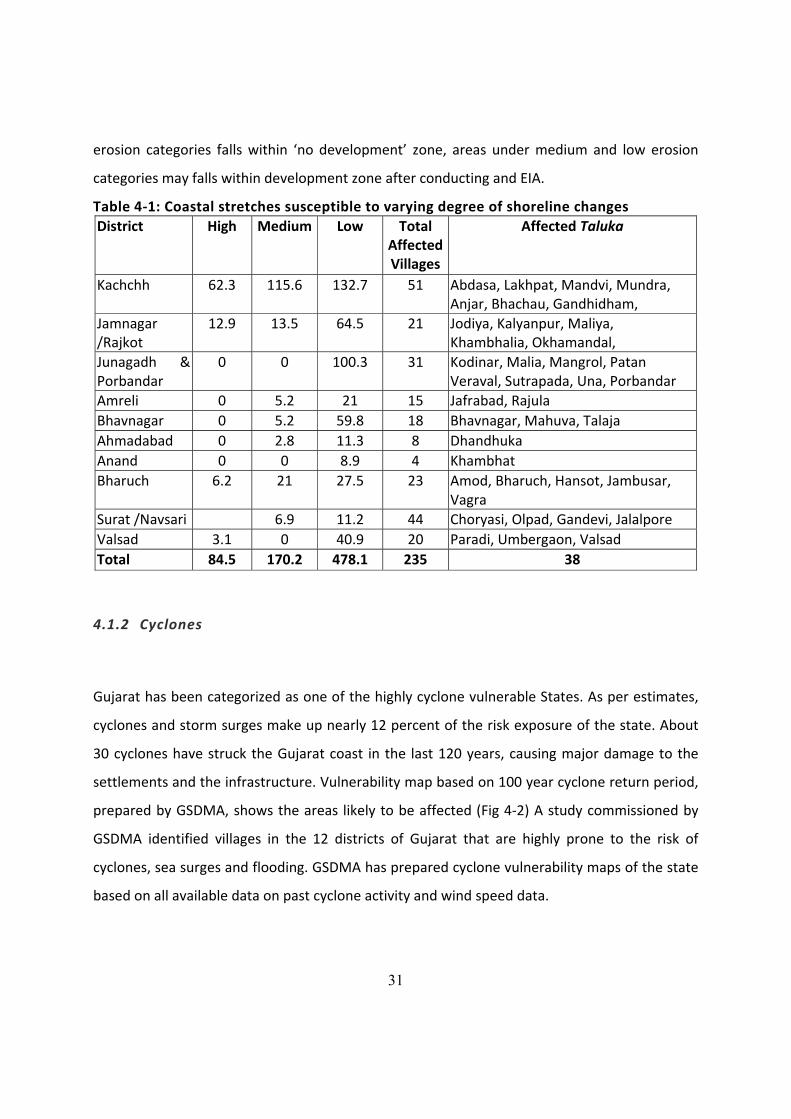
31
erosion categories falls within ‘no development’ zone, areas under medium and low erosion
categories may falls within development zone after conducting and EIA.
Table 4‐1: Coastal stretches susceptible to varying degree of shoreline changes District High Medium Low Total
Affected Villages
Affected Taluka
Kachchh 62.3 115.6 132.7 51 Abdasa, Lakhpat, Mandvi, Mundra, Anjar, Bhachau, Gandhidham,
Jamnagar /Rajkot
12.9 13.5 64.5 21 Jodiya, Kalyanpur, Maliya, Khambhalia, Okhamandal,
Junagadh & Porbandar
0 0 100.3 31 Kodinar, Malia, Mangrol, Patan Veraval, Sutrapada, Una, Porbandar
Amreli 0 5.2 21 15 Jafrabad, Rajula Bhavnagar 0 5.2 59.8 18 Bhavnagar, Mahuva, Talaja Ahmadabad 0 2.8 11.3 8 Dhandhuka Anand 0 0 8.9 4 Khambhat Bharuch 6.2 21 27.5 23 Amod, Bharuch, Hansot, Jambusar,
Vagra Surat /Navsari 6.9 11.2 44 Choryasi, Olpad, Gandevi, Jalalpore Valsad 3.1 0 40.9 20 Paradi, Umbergaon, Valsad Total 84.5 170.2 478.1 235 38
4.1.2 Cyclones
Gujarat has been categorized as one of the highly cyclone vulnerable States. As per estimates,
cyclones and storm surges make up nearly 12 percent of the risk exposure of the state. About
30 cyclones have struck the Gujarat coast in the last 120 years, causing major damage to the
settlements and the infrastructure. Vulnerability map based on 100 year cyclone return period,
prepared by GSDMA, shows the areas likely to be affected (Fig 4‐2) A study commissioned by
GSDMA identified villages in the 12 districts of Gujarat that are highly prone to the risk of
cyclones, sea surges and flooding. GSDMA has prepared cyclone vulnerability maps of the state
based on all available data on past cyclone activity and wind speed data.

32
Figure 4‐2: Gujarat Cyclone Hazard Risk Map – 100 year return period
4.1.3 Tsunami
The GSDMA has prepared tsunami vulnerability maps for the state and identified areas along
the coast that are most likely to be affected (Fig 4‐3). The probability of a tsunami striking
Gujarat coast is very low. The 1945 Mekran earthquake (magnitude 8.1) in the Persian Gulf
generated Tsunami of 12 to 15 meters height. The estimated height of Tsunami at Gulf of
Kachchh was 15m but no reports of damage are available. In the event of a major seismic event
in the region of Arabian Sea and Persian Gulf, there could be a small possibility of tsunami
reaching Gujarat coast, although all earthquake do not generate tsunami.
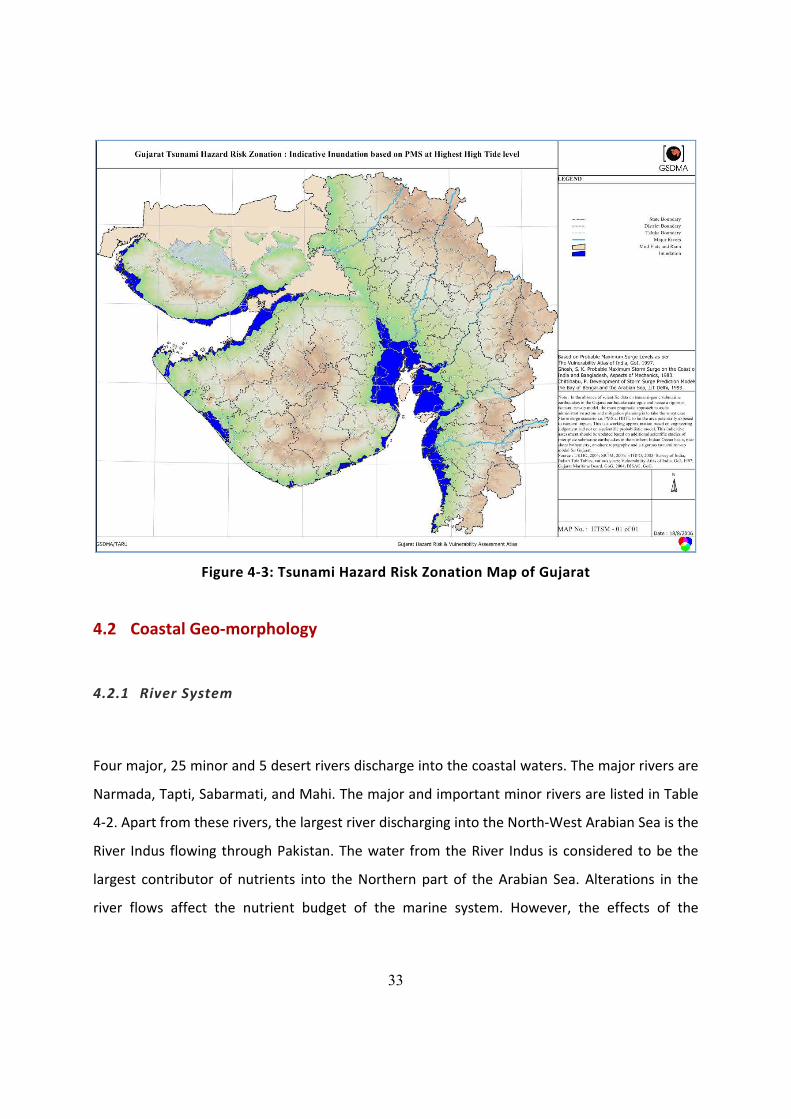
33
Figure 4‐3: Tsunami Hazard Risk Zonation Map of Gujarat
4.2 Coastal Geo‐morphology
4.2.1 River System
Four major, 25 minor and 5 desert rivers discharge into the coastal waters. The major rivers are
Narmada, Tapti, Sabarmati, and Mahi. The major and important minor rivers are listed in Table
4‐2. Apart from these rivers, the largest river discharging into the North‐West Arabian Sea is the
River Indus flowing through Pakistan. The water from the River Indus is considered to be the
largest contributor of nutrients into the Northern part of the Arabian Sea. Alterations in the
river flows affect the nutrient budget of the marine system. However, the effects of the
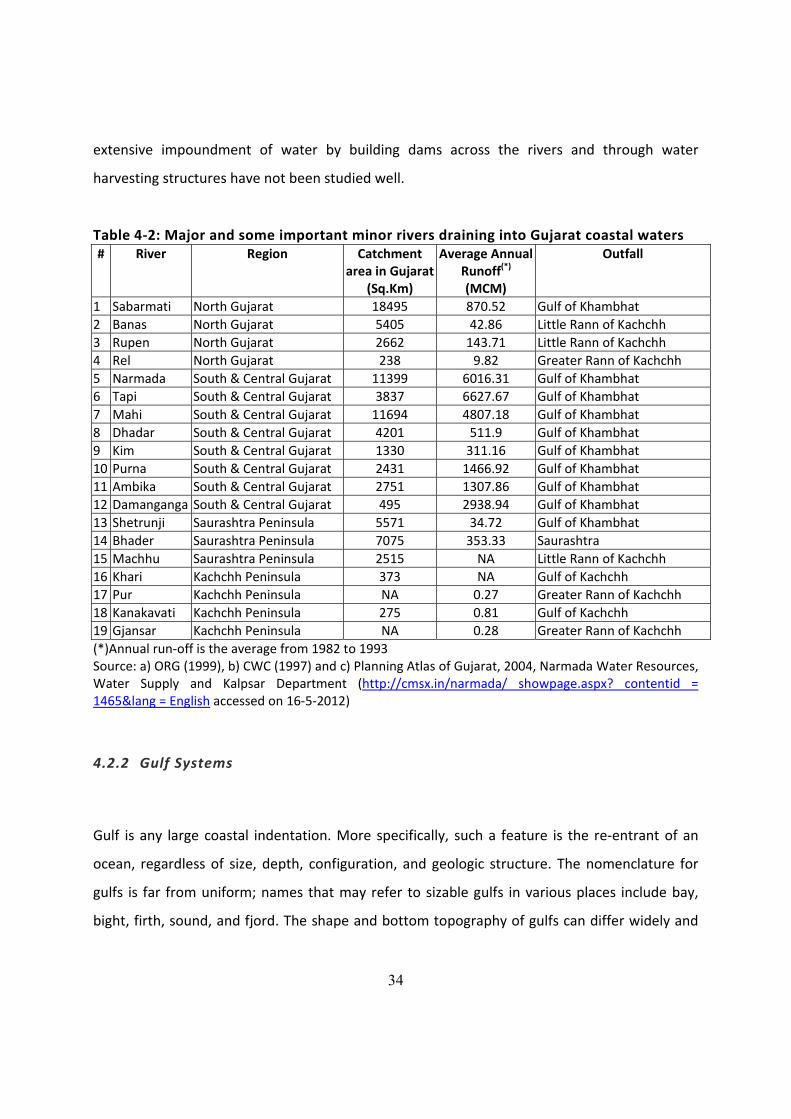
34
extensive impoundment of water by building dams across the rivers and through water
harvesting structures have not been studied well.
Table 4‐2: Major and some important minor rivers draining into Gujarat coastal waters # River Region Catchment
area in Gujarat (Sq.Km)
Average Annual Runoff(*) (MCM)
Outfall
1 Sabarmati North Gujarat 18495 870.52 Gulf of Khambhat 2 Banas North Gujarat 5405 42.86 Little Rann of Kachchh 3 Rupen North Gujarat 2662 143.71 Little Rann of Kachchh 4 Rel North Gujarat 238 9.82 Greater Rann of Kachchh 5 Narmada South & Central Gujarat 11399 6016.31 Gulf of Khambhat 6 Tapi South & Central Gujarat 3837 6627.67 Gulf of Khambhat 7 Mahi South & Central Gujarat 11694 4807.18 Gulf of Khambhat 8 Dhadar South & Central Gujarat 4201 511.9 Gulf of Khambhat 9 Kim South & Central Gujarat 1330 311.16 Gulf of Khambhat 10 Purna South & Central Gujarat 2431 1466.92 Gulf of Khambhat 11 Ambika South & Central Gujarat 2751 1307.86 Gulf of Khambhat 12 Damanganga South & Central Gujarat 495 2938.94 Gulf of Khambhat 13 Shetrunji Saurashtra Peninsula 5571 34.72 Gulf of Khambhat 14 Bhader Saurashtra Peninsula 7075 353.33 Saurashtra 15 Machhu Saurashtra Peninsula 2515 NA Little Rann of Kachchh 16 Khari Kachchh Peninsula 373 NA Gulf of Kachchh 17 Pur Kachchh Peninsula NA 0.27 Greater Rann of Kachchh 18 Kanakavati Kachchh Peninsula 275 0.81 Gulf of Kachchh 19 Gjansar Kachchh Peninsula NA 0.28 Greater Rann of Kachchh (*)Annual run‐off is the average from 1982 to 1993 Source: a) ORG (1999), b) CWC (1997) and c) Planning Atlas of Gujarat, 2004, Narmada Water Resources, Water Supply and Kalpsar Department (http://cmsx.in/narmada/ showpage.aspx? contentid = 1465&lang = English accessed on 16‐5‐2012)
4.2.2 Gulf Systems
Gulf is any large coastal indentation. More specifically, such a feature is the re‐entrant of an
ocean, regardless of size, depth, configuration, and geologic structure. The nomenclature for
gulfs is far from uniform; names that may refer to sizable gulfs in various places include bay,
bight, firth, sound, and fjord. The shape and bottom topography of gulfs can differ widely and

35
are determined by the geologic structure and development of the region. The two Gulfs on
Gujarat coast differ rather dramatically (Table 4‐3).
Table 4‐3: Gulfs of Kachchh and Khambhat – a comparison Aspect Gulf of Kachchh Gulf of Khambhat Area (sq.km.) 7350 3120 Water Balance Negative: evap. > inflow & rain
(evap. 7350 MCM/Yr) Positive, evap. < Inflow & Rain (evap. 1560 MCM/yr)
Residence/ Turnover Time 8 to 51 days 4 to 15 days Pollution Low Very High (300 MCM of effluents) River Flows (MCM/Yr) 140 38000 Tides 3 – 8 3 – 12DO High Low Primary Production Relatively High Low (almost 1/10th) Mangroves 954 sq.km. (836 sq.km.Kachchh Dist.) 37 sq.km. Corals 34 islands with coral reefs Absent Estuaries Nil (only seasonal streams) Several Source: Sengupta & Deshmukh, 2000 Gulf of Khambhat, earlier known as Gulf of Cambay, is 190 km wide at its mouth between Diu
and Daman, but it rapidly narrows to 24 km. The gulf receives many rivers, including the
Sabarmati, Mahi, Narmada (Narbada), and Tapti. Its shape and its orientation in relation to the
southwest monsoon winds account for its high tidal range (12 meters) and the high velocity of
the entering tides. Shoals and sandbanks are treacherous to navigation, and all the gulf ports
have suffered from silting caused by tides and flood torrents from the rivers. The Gulf is known
for its extreme tides, which vary greatly in height and run into it with amazing speed. At low
tide the bottom is left nearly dry for some distance below the town of Khambhat. The economic
importance of the Gulf has increased considerably after the discovery and exploration of oil and
gas, particularly near Bharuch.
The Gulf of Kachchh is rather shallow with a depth of nearly 60 m at the mouth to less than 20
m near the head. The average depth is about 30 m above chart datum (GTS). The total gulf area
is about 7350 sq km enclosing nearly 220,000 MCM by volume. The residence time in the gulf
range between 8 to 51 days. The climate is highly arid with huge evaporation rate estimated at
7350 MCM per year from the gulf (Sengupta & Deshmukh, 2000). The rainfall is about 42 cm
36
per year. The freshwater inflows into the gulf is paltry and come mostly from the ephemeral
desert rivers Banas, Rupen and Saraswati that contribute just about 140 MCM of storm waters
in a year of good monsoon. The high water spring tide varies between 3 m at Okha at the
mouth to 5.9 m at Kandla.
4.2.3 Islands
In addition to the main land coastal areas, there are many islands and islets (an islet is a small
island) in both the Gulf of Kachchh and Gulf of Khambhat. In the Gulf of Kachchh, there are 42
islands & some islets, covering a total area of about 410.6 sq km. These islands and islets varied
in their size e.g. Manmarodi (5 ha), Pirotan (1328 ha), Kalumbhar (6105 ha). Also, due to
variations in the tidal amplitudes at various locations, the inundation patterns of these islands
differed. While many are partially submerged into the water (known as ‘Areal’ islands), quite a
few of these islands are fully submerged even during the normal period. These submerged
islands are, however, exposed only during the ‘minus tide’ (e.g. Dona, Boria, Pashu islands etc).
As a matter of fact, the inundation pattern of islands is one of the factors determining the
presence of coral reefs and mangroves. Of the total area of islands in GoK, 148.9 km2 have
been notified under Marine National Park and Sanctuary. Among all the islands, only two are
having human habitations viz. Beyt Dwarka and Ajad. Other than these islands in GoK, there
are two bets In the Gulf of Khambhat‐ the Piram bet near Bhavnagar and Alia bet near Narmada
estuary close to Bharuch and Ankleshwar towns.
4.2.4 Estuaries
Estuaries are defined as partially enclosed coastal body of water which is either permanently or
periodically open to the sea and within which there is a measurable variation of salinity due to
the mixture of sea water with freshwater derived from land drainage. In a sense, estuaries are
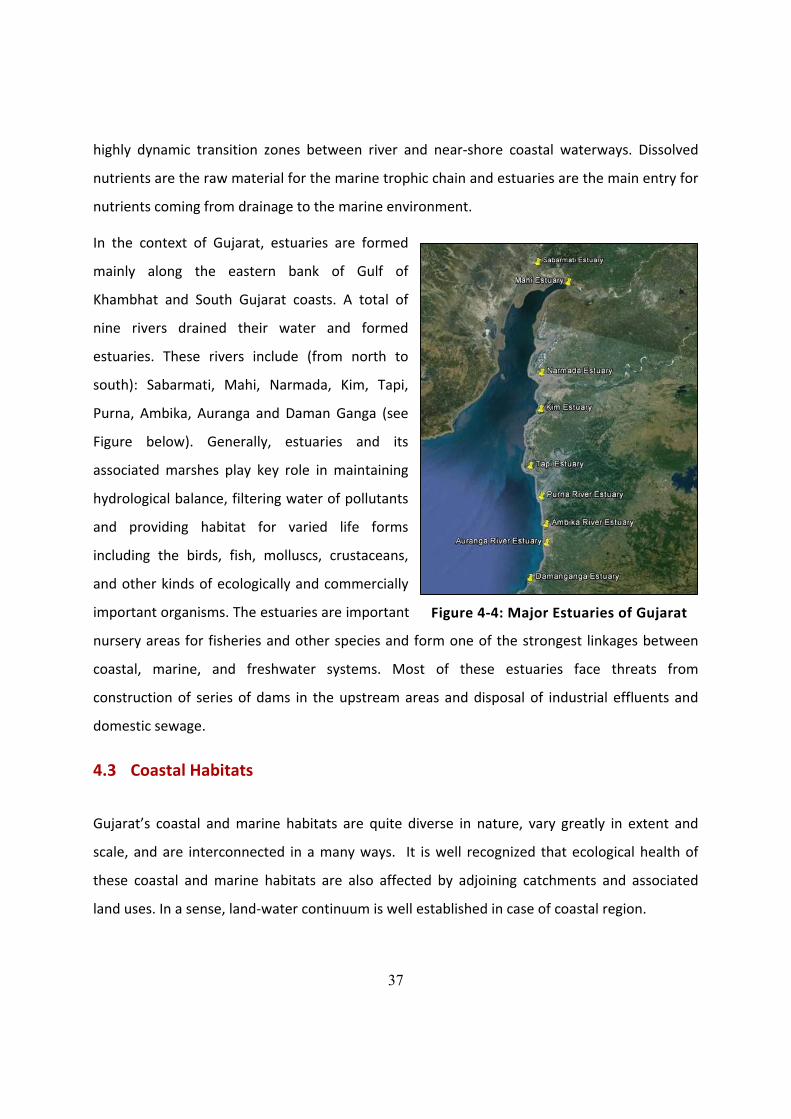
37
highly dynamic transition zones between river and near‐shore coastal waterways. Dissolved
nutrients are the raw material for the marine trophic chain and estuaries are the main entry for
nutrients coming from drainage to the marine environment.
In the context of Gujarat, estuaries are formed
mainly along the eastern bank of Gulf of
Khambhat and South Gujarat coasts. A total of
nine rivers drained their water and formed
estuaries. These rivers include (from north to
south): Sabarmati, Mahi, Narmada, Kim, Tapi,
Purna, Ambika, Auranga and Daman Ganga (see
Figure below). Generally, estuaries and its
associated marshes play key role in maintaining
hydrological balance, filtering water of pollutants
and providing habitat for varied life forms
including the birds, fish, molluscs, crustaceans,
and other kinds of ecologically and commercially
important organisms. The estuaries are important
nursery areas for fisheries and other species and form one of the strongest linkages between
coastal, marine, and freshwater systems. Most of these estuaries face threats from
construction of series of dams in the upstream areas and disposal of industrial effluents and
domestic sewage.
4.3 Coastal Habitats
Gujarat’s coastal and marine habitats are quite diverse in nature, vary greatly in extent and
scale, and are interconnected in a many ways. It is well recognized that ecological health of
these coastal and marine habitats are also affected by adjoining catchments and associated
land uses. In a sense, land‐water continuum is well established in case of coastal region.
Figure 4‐4: Major Estuaries of Gujarat
38
Gujarat, with its varying coastal and marine geo‐morphological and oceanographic
characteristics, is endowed with a great diversity of natural habitats and ecosystems which in
turn support a rich diversity of species. In fact, Gulf of Kachchh is considered as one of the
biologically richest marine habitats along the west coast of India. Some of the important coastal
and marine habitats in Gujarat waters include: mangroves, coral reefs, sea‐grass beds, sandy
and rocky beaches, mud flats, estuaries and creeks. Another ecosystem worth mentioning for
Gujarat is the hyper‐saline salt‐flats (Little and Great Ranns of Kachchh). These are located in
dry and arid regions of Kachchh with their combined area of about 22000 sq km. Their
importance to the biodiversity of the region relates to the presence of many salt‐tolerant plant
species besides their role as home to large number of resident and migratory avifauna. The
detail on this system is, however, presented in separate chapter.
4.3.1 Coastal Wetlands
Wetlands are defined differently. However, the definitions proposed by IUCN for the purpose of
the Ramsar Convention on Wetlands of International Importance and that of US Fish and
Wildlife are the most frequently used. According to Ramsar Convention wetlands are the “areas
of marsh, fen, peat‐land or water whether natural or artificial, permanent or temporary with
water i.e. static or flowing, fresh, brackish or salt including areas of marine water, the depth of
which at low tide does not exceed six meter”. Similarly, US Fish and Wildlife Service defined
wetland as “lands transitional between terrestrial and aquatic systems where the water table is
usually at or near the surface of the land or the land is covered by shallow water”.
Realizing the ecological and economic importance of wetlands, Space Application Centre under
MoEF sponsored National Wetland Inventory and Assessment (NWIA) project, mapped
wetlands‐ freshwater as well as coastal and marine‐ of Gujarat state (SAC, 2010). Accordingly,
wetlands in Gujarat covers a total of 34749.5 sq km area of which, 28070.5 sq km is under the
category of coastal wetlands i.e. about 80.7 % of total wetland area (Table 4‐4).
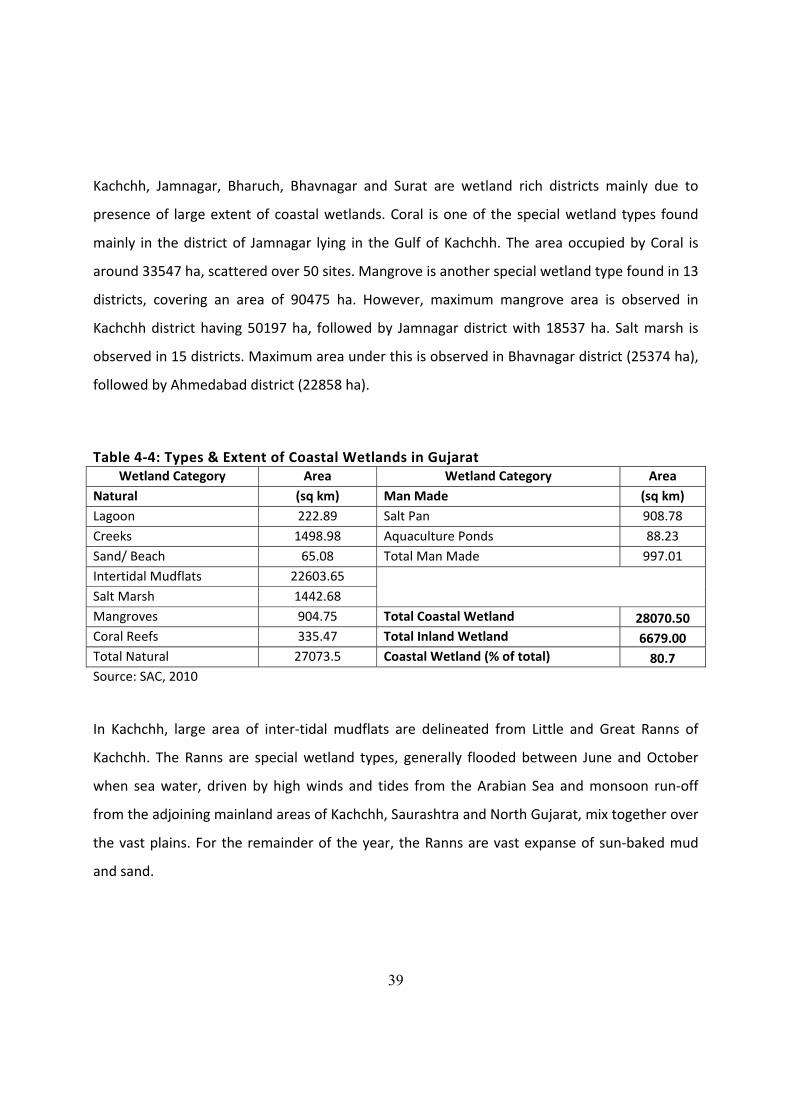
39
Kachchh, Jamnagar, Bharuch, Bhavnagar and Surat are wetland rich districts mainly due to
presence of large extent of coastal wetlands. Coral is one of the special wetland types found
mainly in the district of Jamnagar lying in the Gulf of Kachchh. The area occupied by Coral is
around 33547 ha, scattered over 50 sites. Mangrove is another special wetland type found in 13
districts, covering an area of 90475 ha. However, maximum mangrove area is observed in
Kachchh district having 50197 ha, followed by Jamnagar district with 18537 ha. Salt marsh is
observed in 15 districts. Maximum area under this is observed in Bhavnagar district (25374 ha),
followed by Ahmedabad district (22858 ha).
Table 4‐4: Types & Extent of Coastal Wetlands in Gujarat Wetland Category Area Wetland Category Area
Natural (sq km) Man Made (sq km) Lagoon 222.89 Salt Pan 908.78 Creeks 1498.98 Aquaculture Ponds 88.23 Sand/ Beach 65.08 Total Man Made 997.01 Intertidal Mudflats 22603.65 Salt Marsh 1442.68 Mangroves 904.75 Total Coastal Wetland 28070.50 Coral Reefs 335.47 Total Inland Wetland 6679.00 Total Natural 27073.5 Coastal Wetland (% of total) 80.7 Source: SAC, 2010
In Kachchh, large area of inter‐tidal mudflats are delineated from Little and Great Ranns of
Kachchh. The Ranns are special wetland types, generally flooded between June and October
when sea water, driven by high winds and tides from the Arabian Sea and monsoon run‐off
from the adjoining mainland areas of Kachchh, Saurashtra and North Gujarat, mix together over
the vast plains. For the remainder of the year, the Ranns are vast expanse of sun‐baked mud
and sand.
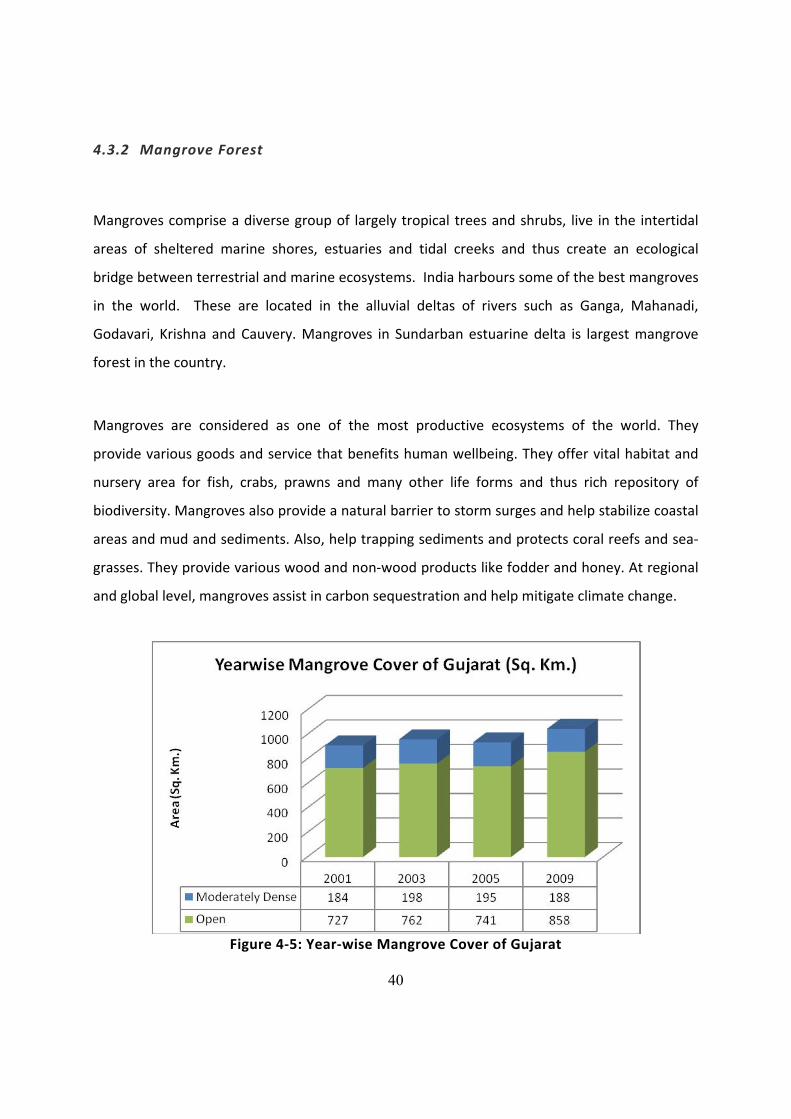
40
4.3.2 Mangrove Forest
Mangroves comprise a diverse group of largely tropical trees and shrubs, live in the intertidal
areas of sheltered marine shores, estuaries and tidal creeks and thus create an ecological
bridge between terrestrial and marine ecosystems. India harbours some of the best mangroves
in the world. These are located in the alluvial deltas of rivers such as Ganga, Mahanadi,
Godavari, Krishna and Cauvery. Mangroves in Sundarban estuarine delta is largest mangrove
forest in the country.
Mangroves are considered as one of the most productive ecosystems of the world. They
provide various goods and service that benefits human wellbeing. They offer vital habitat and
nursery area for fish, crabs, prawns and many other life forms and thus rich repository of
biodiversity. Mangroves also provide a natural barrier to storm surges and help stabilize coastal
areas and mud and sediments. Also, help trapping sediments and protects coral reefs and sea‐
grasses. They provide various wood and non‐wood products like fodder and honey. At regional
and global level, mangroves assist in carbon sequestration and help mitigate climate change.
Figure 4‐5: Year‐wise Mangrove Cover of Gujarat
41
As per 2009 estimates of Forest Survey of India (FSI), among the states, West Bengal, Andaman
and Nicobar, Orissa, Andhra Pradesh and Gujarat support good coverage of mangrove forests.
Gujarat is having second highest mangrove cover in the country, after West Bengal (MOEF,
2010). Actually, in the entire western coast, Gujarat has the major chunk of mangrove forests.
According to the last few reports of Forest Survey of India (FSI, 2001, 2003, 2005, 2009),
mangrove cover of the Gujarat state was about 1046 sq km in 2009, which was about 135 sq km
more compared to a total of 911 sq km in 2001. Thus at state level, there is an increase in
mangrove cover in the last decade or so (see Figure 4‐5). While, category like very dense
mangrove forest is absent in the State, 188 sq km of moderately dense and 858 sq km of open
forests were recorded.
District wise and coastal region wise, estimates of mangrove cover highlight that in 2009
Kachchh and Jamnagar coasts had maximum area under mangroves (775 and 157 sq km,
respectively). Thus, in Gulf of Kachchh areas, a total of 934 sq km of mangrove forests occurred
i.e. about 90% of total mangrove cover of the state. Coastal areas along the Gulf of Khambhat
and South Gujarat respectively support a total of 85 (8%) and 27 sq km (2.5%) of total
mangroves in the state. Saurashtra coast, on the other hand, is devoid of any mangrove forest
(Table 4‐5). It is important to mention here that while in all the three coastal regions of the
state, total mangrove cover was found increased between 2001 and 2009 assessment years,
the open forests were increased proportionally more than the moderately dense types.
Notably, such shift in mangrove cover could be attributed to a concerted plantation efforts by
different stakeholders including the Forest Department, communities and to a certain extent
the industries.
Gujarat Ecology Commission (GEC) has estimated total mangrove cover of Gujarat State and
prepared Mangrove’s Atlas for the year 2009. Accordingly, Gujarat has mangrove cover of
1023.3 sq km distributed in 35 talukas. Talukas having relatively larger extent of mangrove
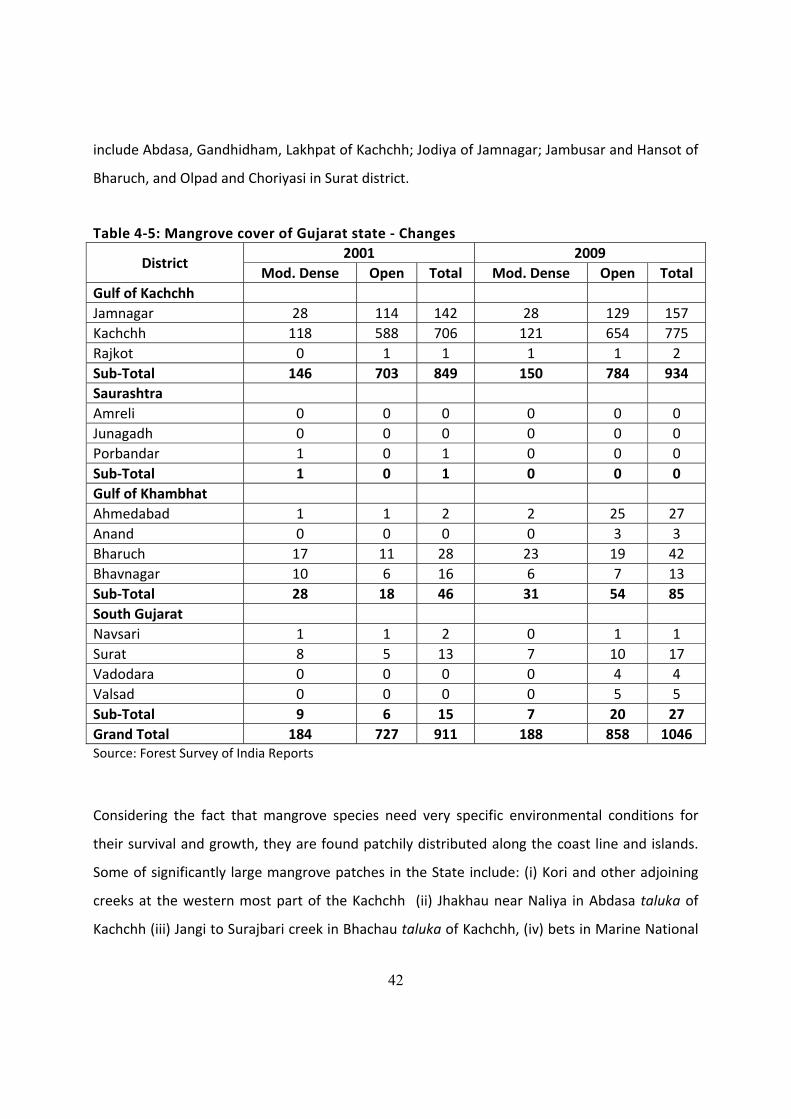
42
include Abdasa, Gandhidham, Lakhpat of Kachchh; Jodiya of Jamnagar; Jambusar and Hansot of
Bharuch, and Olpad and Choriyasi in Surat district.
Table 4‐5: Mangrove cover of Gujarat state ‐ Changes
District 2001 2009
Mod. Dense Open Total Mod. Dense Open Total Gulf of Kachchh Jamnagar 28 114 142 28 129 157 Kachchh 118 588 706 121 654 775 Rajkot 0 1 1 1 1 2 Sub‐Total 146 703 849 150 784 934 Saurashtra Amreli 0 0 0 0 0 0 Junagadh 0 0 0 0 0 0 Porbandar 1 0 1 0 0 0 Sub‐Total 1 0 1 0 0 0 Gulf of Khambhat Ahmedabad 1 1 2 2 25 27 Anand 0 0 0 0 3 3 Bharuch 17 11 28 23 19 42 Bhavnagar 10 6 16 6 7 13 Sub‐Total 28 18 46 31 54 85 South Gujarat Navsari 1 1 2 0 1 1 Surat 8 5 13 7 10 17 Vadodara 0 0 0 0 4 4 Valsad 0 0 0 0 5 5 Sub‐Total 9 6 15 7 20 27 Grand Total 184 727 911 188 858 1046 Source: Forest Survey of India Reports
Considering the fact that mangrove species need very specific environmental conditions for
their survival and growth, they are found patchily distributed along the coast line and islands.
Some of significantly large mangrove patches in the State include: (i) Kori and other adjoining
creeks at the western most part of the Kachchh (ii) Jhakhau near Naliya in Abdasa taluka of
Kachchh (iii) Jangi to Surajbari creek in Bhachau taluka of Kachchh, (iv) bets in Marine National
43
Park in Jamnagar, (v) Purna in Navsari, (vi) patches in Dhandhuka taluka in Gulf of Khambhat
and Sabarmati estuary, and (vii) Mahi, Tapti, Kolak, Ambika, Purna and Damanganga estuaries.
According to Botanical Survey of India, there are 59 mangrove species in the country. Of these,
34 species are present on the East Coast, 45 on Andaman and Nicobar Islands and 25 on West
Coast. From Gujarat, a total of 14 species of mangroves were recorded. These include Avicennia
marina, Avicennia officinalis, Avicennia alba, Ceriops tagal, Ceriops decandra, Aegiceras
corniculata, Excoecaria agallocha, Sonneratia apetala, Rhizophora mucronata, Bruguiera
cylindrical, Acanthus ilicifolius, Bruguiera gymnorhiza, Kandelia candel, Lumnitzera racemosa
(GEER, 2009). Among all these, Avicennia marina is the most wide spread and dominant
species. However, due to the presence of rivers like Narmada, Tapti, Mahi, Sabarmati etc and
thus greater flow of fresh water, more diverse mangrove forest are present in Gulf of
Khambhat and South Gujarat regions compared to Saurashtra and Kachchh regions. In the other
areas fresh water flow is much less and therefore mostly Avicennia marina is dominant as it can
survive harsh environment including high salinity.
4.3.3 Coral Reefs
Coral reefs are underwater structures formed from the calcium carbonate secreted by a group
of marine animals called corals. Coral reef ecosystem consists of colonies of a variety of living
marine organisms. Most coral reefs are built from stony corals. Many of these provide source of
income, food and coastal protection for millions of people; and recent studies have shown that
coral reef goods and services provide an annual net benefit of US$30 billion to economies
worldwide (Cesar et al, 2003). Living corals need specific geo‐physical‐chemical conditions for
survival and development. They need relatively warm, low nutrient and clear and quiet water
for optimal growth. The optimum temperature for the growth of coral reefs is 25‐30°C. At sea‐
water temperatures below 15°C, the growth gets restricted or ceased, while above 36°C results
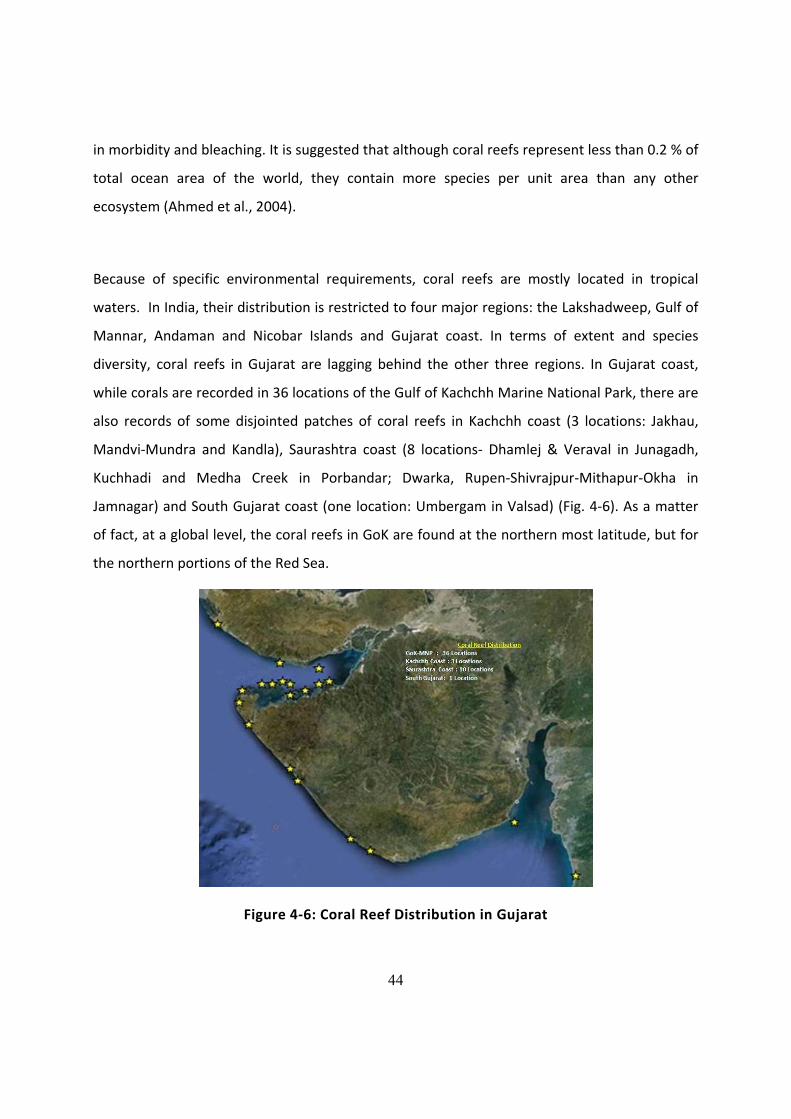
44
in morbidity and bleaching. It is suggested that although coral reefs represent less than 0.2 % of
total ocean area of the world, they contain more species per unit area than any other
ecosystem (Ahmed et al., 2004).
Because of specific environmental requirements, coral reefs are mostly located in tropical
waters. In India, their distribution is restricted to four major regions: the Lakshadweep, Gulf of
Mannar, Andaman and Nicobar Islands and Gujarat coast. In terms of extent and species
diversity, coral reefs in Gujarat are lagging behind the other three regions. In Gujarat coast,
while corals are recorded in 36 locations of the Gulf of Kachchh Marine National Park, there are
also records of some disjointed patches of coral reefs in Kachchh coast (3 locations: Jakhau,
Mandvi‐Mundra and Kandla), Saurashtra coast (8 locations‐ Dhamlej & Veraval in Junagadh,
Kuchhadi and Medha Creek in Porbandar; Dwarka, Rupen‐Shivrajpur‐Mithapur‐Okha in
Jamnagar) and South Gujarat coast (one location: Umbergam in Valsad) (Fig. 4‐6). As a matter
of fact, at a global level, the coral reefs in GoK are found at the northern most latitude, but for
the northern portions of the Red Sea.
Figure 4‐6: Coral Reef Distribution in Gujarat
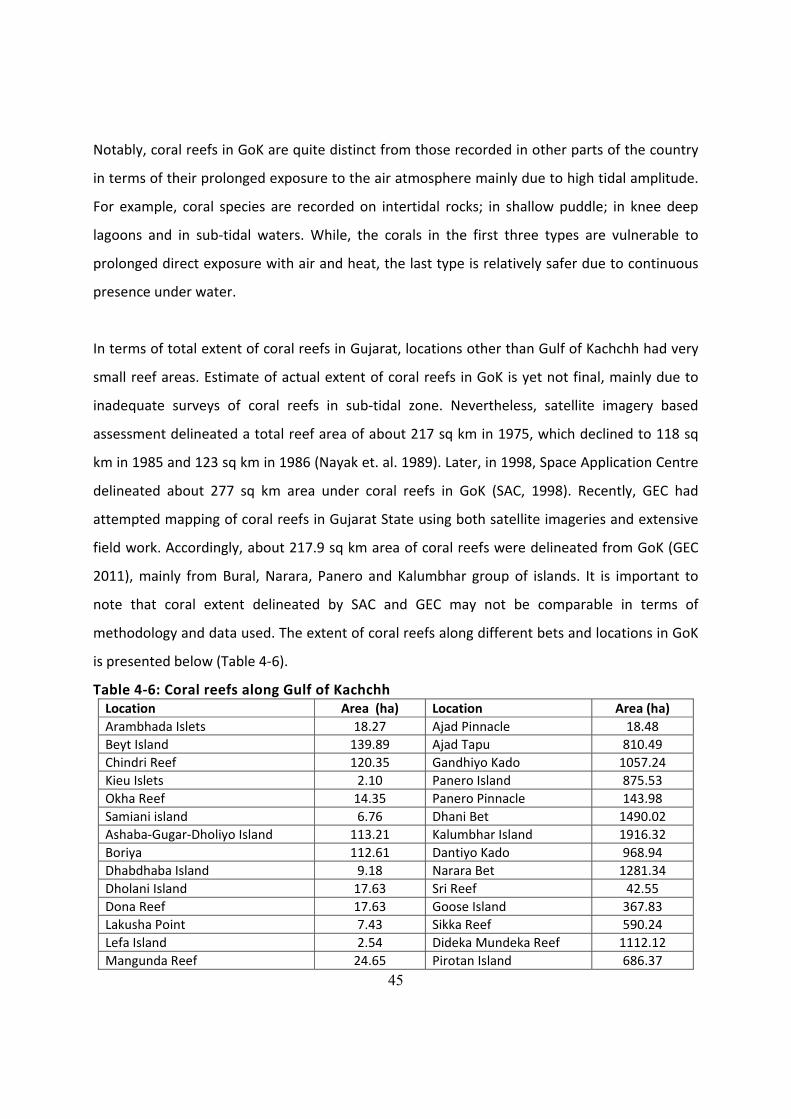
45
Notably, coral reefs in GoK are quite distinct from those recorded in other parts of the country
in terms of their prolonged exposure to the air atmosphere mainly due to high tidal amplitude.
For example, coral species are recorded on intertidal rocks; in shallow puddle; in knee deep
lagoons and in sub‐tidal waters. While, the corals in the first three types are vulnerable to
prolonged direct exposure with air and heat, the last type is relatively safer due to continuous
presence under water.
In terms of total extent of coral reefs in Gujarat, locations other than Gulf of Kachchh had very
small reef areas. Estimate of actual extent of coral reefs in GoK is yet not final, mainly due to
inadequate surveys of coral reefs in sub‐tidal zone. Nevertheless, satellite imagery based
assessment delineated a total reef area of about 217 sq km in 1975, which declined to 118 sq
km in 1985 and 123 sq km in 1986 (Nayak et. al. 1989). Later, in 1998, Space Application Centre
delineated about 277 sq km area under coral reefs in GoK (SAC, 1998). Recently, GEC had
attempted mapping of coral reefs in Gujarat State using both satellite imageries and extensive
field work. Accordingly, about 217.9 sq km area of coral reefs were delineated from GoK (GEC
2011), mainly from Bural, Narara, Panero and Kalumbhar group of islands. It is important to
note that coral extent delineated by SAC and GEC may not be comparable in terms of
methodology and data used. The extent of coral reefs along different bets and locations in GoK
is presented below (Table 4‐6).
Table 4‐6: Coral reefs along Gulf of Kachchh Location Area (ha) Location Area (ha) Arambhada Islets 18.27 Ajad Pinnacle 18.48Beyt Island 139.89 Ajad Tapu 810.49 Chindri Reef 120.35 Gandhiyo Kado 1057.24 Kieu Islets 2.10 Panero Island 875.53 Okha Reef 14.35 Panero Pinnacle 143.98 Samiani island 6.76 Dhani Bet 1490.02 Ashaba‐Gugar‐Dholiyo Island 113.21 Kalumbhar Island 1916.32 Boriya 112.61 Dantiyo Kado 968.94Dhabdhaba Island 9.18 Narara Bet 1281.34 Dholani Island 17.63 Sri Reef 42.55 Dona Reef 17.63 Goose Island 367.83 Lakusha Point 7.43 Sikka Reef 590.24 Lefa Island 2.54 Dideka Mundeka Reef 1112.12 Mangunda Reef 24.65 Pirotan Island 686.37

46
Location Area (ha) Location Area (ha) Pashu 121.41 Chhad Jindra Islands 812.39 Paga Reef 741.65 Balachhadi Raval Pir 886.72 Bural Reef 1814.93 Balachhadi Rocks 438.56 Bural Reef with Pinnacle 4504.23 Sikotari Tadhora 66.39 Vuda Kuda Reef 434.91 Total 21789.22
Source: GEC, 2011 Gulf of Kachchh is one of the most isolated areas in terms of coral distribution. Owe to such
geographical isolation and the extreme environmental conditions (temperature range 15‐35oC,
salinity range 25‐40 ppt), strong tidal currents and heavy sediment load, the diversity of coral
species is quite low in GoK compared to other reef areas in India. Compilation from existing
literatures could confirm a total of 68 coral species from the GoK and Gujarat: 45 hard corals
and 23 soft coral species. Out of total 42 islands in GoK, 33 have presence of coral reefs.
Significantly, out of 68 coral species, 11 species are under Near Threatened category of IUCN’s
Red Data list, 3 species are under Vulnerable while 11 species were not evaluated due to lack of
scientific data (Table 4.7). Twenty species were reported as Least Concerned.
Table 4‐7: Coral Species Found under IUCN Red Data List Near Threatened & Endangered (11) Acropora humilis, Favia stelligera, Favites bestae, F. complanata, F. halicora, Goniopora minor, Montipora foliosa, M. venosa, Platygyra lamellina, Psammocora digitata, Pseudosiderastrea tayami Vulnerable (3) Goniopora planulata, Turbinaria mesentarina, T. peltata Data Deficient (11) Acanthastrea hillae, Acropora squarrosa, Dendrophyllia minuscule, G. stutchburyi, Hydrophora exesa, M. explanata, Paracyathus stokesi, Polycyathus verrilli, Tubastrea aurea, T. faulkneri, Turbinaria crater
4.3.4 Seagrass
Seagrasses are intertidal and sub‐tidal flowering plants found fully submerged in the shallow
seawater and colonize soft substrates and grow to depths where about 11% of surface light
reaches the bottom (Duarte 1991). In tropical region, sea grass beds occur in association with
coral reefs as well as in their absence. Sea grass beds are stabilizing the coastal sediment,
substrate and provide vital oxygen to surrounding water masses. Seagrass herbivory is a highly
important link in the food chain, with many species feeding on it. Thus, they profoundly
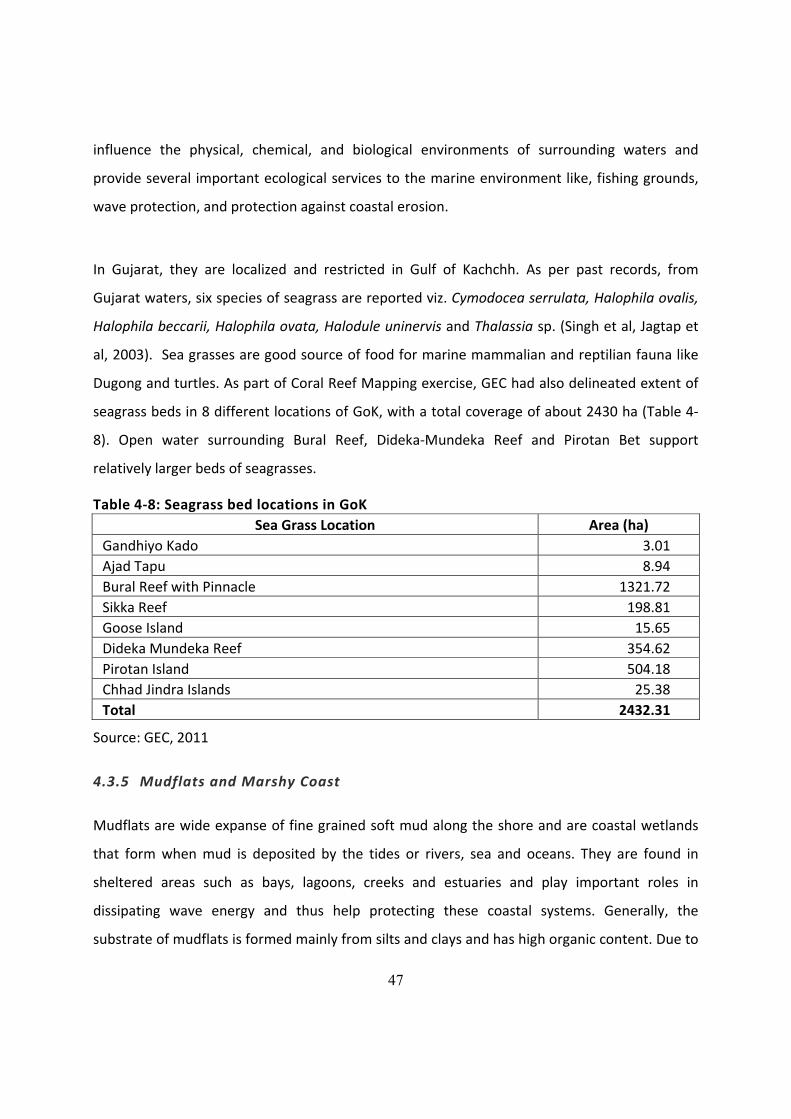
47
influence the physical, chemical, and biological environments of surrounding waters and
provide several important ecological services to the marine environment like, fishing grounds,
wave protection, and protection against coastal erosion.
In Gujarat, they are localized and restricted in Gulf of Kachchh. As per past records, from
Gujarat waters, six species of seagrass are reported viz. Cymodocea serrulata, Halophila ovalis,
Halophila beccarii, Halophila ovata, Halodule uninervis and Thalassia sp. (Singh et al, Jagtap et
al, 2003). Sea grasses are good source of food for marine mammalian and reptilian fauna like
Dugong and turtles. As part of Coral Reef Mapping exercise, GEC had also delineated extent of
seagrass beds in 8 different locations of GoK, with a total coverage of about 2430 ha (Table 4‐
8). Open water surrounding Bural Reef, Dideka‐Mundeka Reef and Pirotan Bet support
relatively larger beds of seagrasses.
Table 4‐8: Seagrass bed locations in GoK Sea Grass Location Area (ha)
Gandhiyo Kado 3.01 Ajad Tapu 8.94 Bural Reef with Pinnacle 1321.72 Sikka Reef 198.81 Goose Island 15.65Dideka Mundeka Reef 354.62 Pirotan Island 504.18 Chhad Jindra Islands 25.38Total 2432.31
Source: GEC, 2011
4.3.5 Mudflats and Marshy Coast
Mudflats are wide expanse of fine grained soft mud along the shore and are coastal wetlands
that form when mud is deposited by the tides or rivers, sea and oceans. They are found in
sheltered areas such as bays, lagoons, creeks and estuaries and play important roles in
dissipating wave energy and thus help protecting these coastal systems. Generally, the
substrate of mudflats is formed mainly from silts and clays and has high organic content. Due to
48
which, they are characterized by high biological productivity and supporting abundance of
invertebrate fauna, such as lugworms, sand mason worms and bivalves. In the context of
Gujarat coast, mudflats constitute about 29% of the total length of the coastline (Kumar et al.
2006). Some of the vast stretches of mud flats occur along the Gulf of Kachchh and Gulf of
Khambhat. The vast stretch of mud flats near Ghogha in Bhavnagar support rich diversity of
shore birds.
Marshy coasts are found near the estuarine systems and thus located mostly along the eastern
side of the Gulf of Khambhat. They are also found in large extent near Kori Creek in western
Kachchh and Surajbari creek in the Gulf of Kachchh. In Gujarat, they constitute about 22% of
the entire coastline.
These habitats are important breeding sites for wading birds and winter feeding areas for many
sea and shore birds. They also provide suitable habitats for many species of fish, crabs and
crustaceans. However, despite playing some of the key ecological roles in coastal and marine
dynamics, no systematic study on mudflats and marshy coasts had been undertaken in Gujarat.
4.3.6 Sandy Beaches and Dunes
Coastal sandy beaches and dunes are important but understudied coastal ecosystem. They
form at low‐lying coastal margins where sand transported by sea waves and wind combine with
vegetation to produce dynamic geomorphic structures. However, except tourism and erosion
control function and values, not much has been understood about the sandy beaches and
dunes.
49
In Gujarat sandy beaches constitute about 28% of total coastal length and mainly occurred
along the Saurashtra coast and to some extent in Mandvi and further western coasts of
Kachchh and in South Gujarat coast near Umbargam in Valsad district. In Saurashtra, long sandy
beaches are found along the Junagadh and Porbandar coast. While quite a few of these sites
are recently being developed and promoted for tourism purpose, many other sites are
considered ecologically important for supporting nesting of Olive Ridley and Green turtles.
4.4 Species Diversity
Gujarat coasts, constituted by varied geomorphologies and oceanographic features, support
rich diversity of ecological systems, especially the mangroves, mudflats, coral reefs etc. All
together, they formed different habitats to support rich diversity in flora and fauna. Out of
different coastal regions of Gujarat, relatively more serious efforts had gone into inventorying
the different groups of species from Gulf of Kachchh. Other regions like Gulf of Khambhat,
South Gujarat coast and Saurashtra coast are yet to be explored for their varied species
composition.
4.4.1 Invertebrates
The invertebrates are comprised of different groups and taxa of animals. Most of the
commercially harvested marine fish depend on invertebrates either directly or indirectly, and
marine ecosystems and services would largely collapse if invertebrate communities became
degraded. As discussed above, while no comprehensive inventories of different group and taxa
of invertebrates are available for different coastal regions of the State, efforts had made
towards preparation of checklist of invertebrate fauna of Gulf of Kachchh (Dixit et al. 2010).
Accordingly, a total of 687 invertebrates’ species were reported from GoK (Table 4‐9).
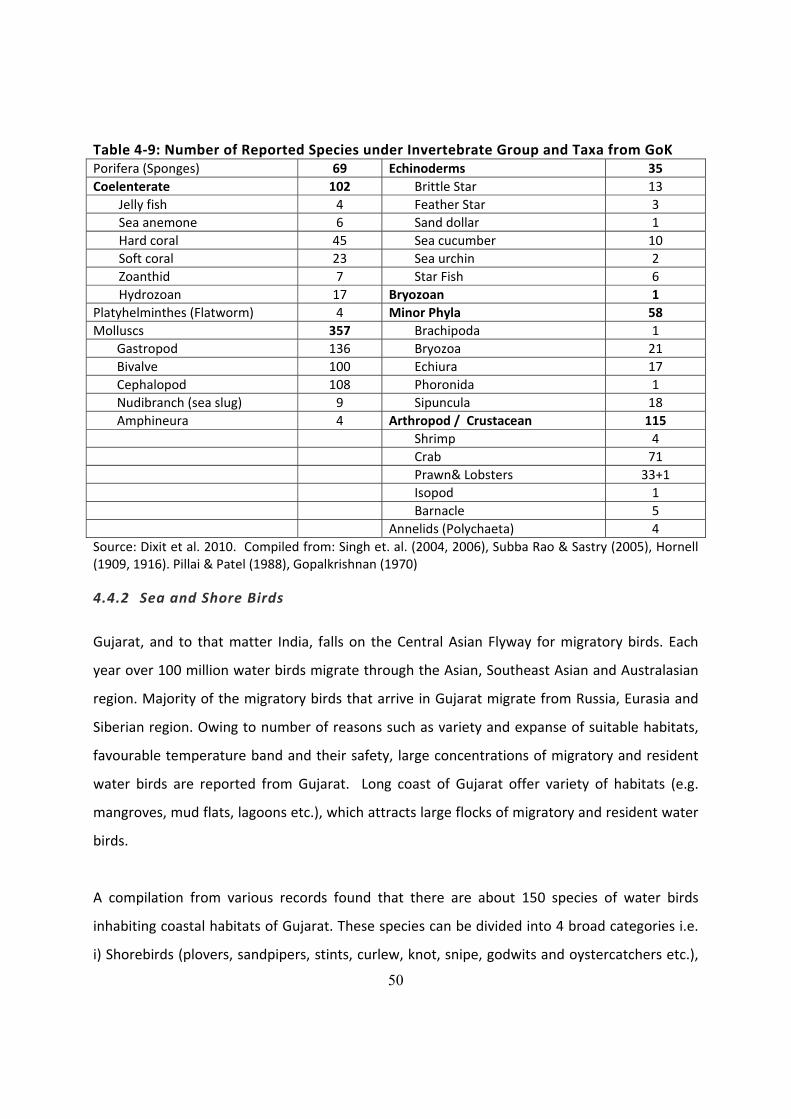
50
Table 4‐9: Number of Reported Species under Invertebrate Group and Taxa from GoK Porifera (Sponges) 69 Echinoderms 35 Coelenterate 102 Brittle Star 13
Jelly fish 4 Feather Star 3 Sea anemone 6 Sand dollar 1 Hard coral 45 Sea cucumber 10 Soft coral 23 Sea urchin 2 Zoanthid 7 Star Fish 6 Hydrozoan 17 Bryozoan 1
Platyhelminthes (Flatworm) 4 Minor Phyla 58 Molluscs 357 Brachipoda 1
Gastropod 136 Bryozoa 21 Bivalve 100 Echiura 17 Cephalopod 108 Phoronida 1 Nudibranch (sea slug) 9 Sipuncula 18 Amphineura 4 Arthropod / Crustacean 115
Shrimp 4 Crab 71 Prawn& Lobsters 33+1 Isopod 1 Barnacle 5 Annelids (Polychaeta) 4
Source: Dixit et al. 2010. Compiled from: Singh et. al. (2004, 2006), Subba Rao & Sastry (2005), Hornell (1909, 1916). Pillai & Patel (1988), Gopalkrishnan (1970)
4.4.2 Sea and Shore Birds
Gujarat, and to that matter India, falls on the Central Asian Flyway for migratory birds. Each
year over 100 million water birds migrate through the Asian, Southeast Asian and Australasian
region. Majority of the migratory birds that arrive in Gujarat migrate from Russia, Eurasia and
Siberian region. Owing to number of reasons such as variety and expanse of suitable habitats,
favourable temperature band and their safety, large concentrations of migratory and resident
water birds are reported from Gujarat. Long coast of Gujarat offer variety of habitats (e.g.
mangroves, mud flats, lagoons etc.), which attracts large flocks of migratory and resident water
birds.
A compilation from various records found that there are about 150 species of water birds
inhabiting coastal habitats of Gujarat. These species can be divided into 4 broad categories i.e.
i) Shorebirds (plovers, sandpipers, stints, curlew, knot, snipe, godwits and oystercatchers etc.),
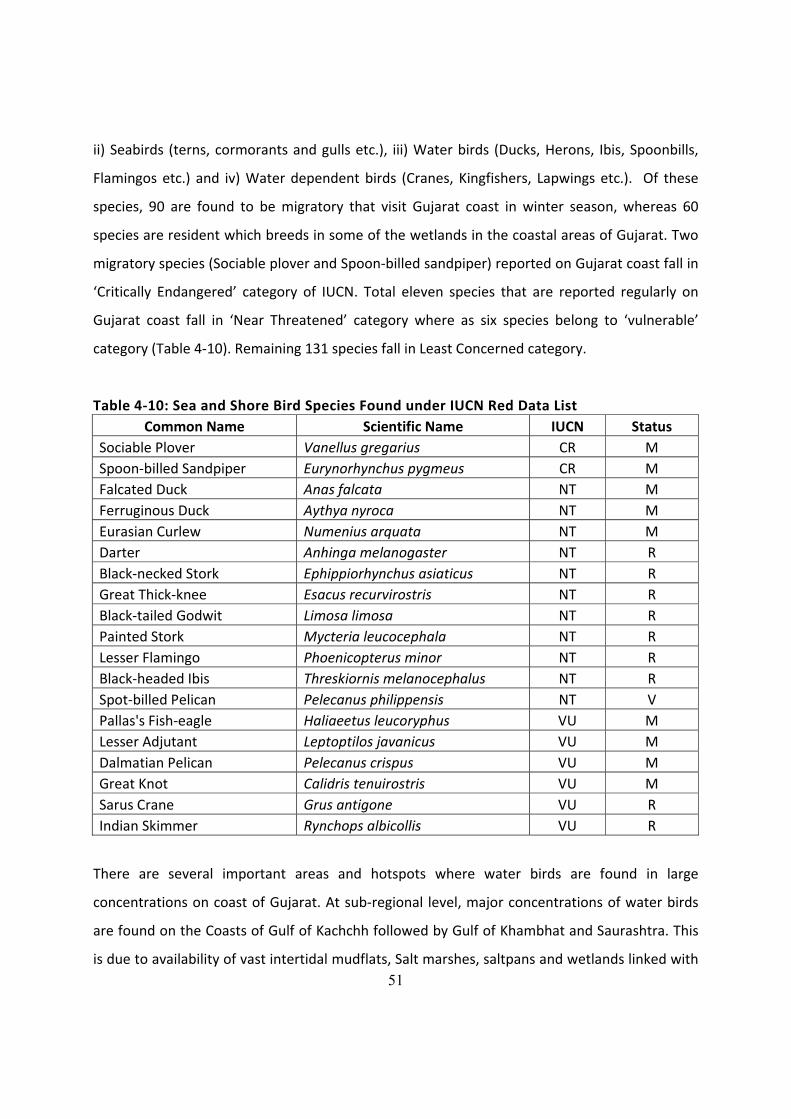
51
ii) Seabirds (terns, cormorants and gulls etc.), iii) Water birds (Ducks, Herons, Ibis, Spoonbills,
Flamingos etc.) and iv) Water dependent birds (Cranes, Kingfishers, Lapwings etc.). Of these
species, 90 are found to be migratory that visit Gujarat coast in winter season, whereas 60
species are resident which breeds in some of the wetlands in the coastal areas of Gujarat. Two
migratory species (Sociable plover and Spoon‐billed sandpiper) reported on Gujarat coast fall in
‘Critically Endangered’ category of IUCN. Total eleven species that are reported regularly on
Gujarat coast fall in ‘Near Threatened’ category where as six species belong to ‘vulnerable’
category (Table 4‐10). Remaining 131 species fall in Least Concerned category.
Table 4‐10: Sea and Shore Bird Species Found under IUCN Red Data List Common Name Scientific Name IUCN Status
Sociable Plover Vanellus gregarius CR M Spoon‐billed Sandpiper Eurynorhynchus pygmeus CR M Falcated Duck Anas falcata NT M Ferruginous Duck Aythya nyroca NT M Eurasian Curlew Numenius arquata NT M Darter Anhinga melanogaster NT R Black‐necked Stork Ephippiorhynchus asiaticus NT R Great Thick‐knee Esacus recurvirostris NT R Black‐tailed Godwit Limosa limosa NT R Painted Stork Mycteria leucocephala NT R Lesser Flamingo Phoenicopterus minor NT R Black‐headed Ibis Threskiornis melanocephalus NT R Spot‐billed Pelican Pelecanus philippensis NT V Pallas's Fish‐eagle Haliaeetus leucoryphus VU M Lesser Adjutant Leptoptilos javanicus VU M Dalmatian Pelican Pelecanus crispus VU M Great Knot Calidris tenuirostris VU M Sarus Crane Grus antigone VU R Indian Skimmer Rynchops albicollis VU R
There are several important areas and hotspots where water birds are found in large
concentrations on coast of Gujarat. At sub‐regional level, major concentrations of water birds
are found on the Coasts of Gulf of Kachchh followed by Gulf of Khambhat and Saurashtra. This
is due to availability of vast intertidal mudflats, Salt marshes, saltpans and wetlands linked with
52
marine systems of two Gulfs and coast of Saurashtra. Some of these areas and water bird
hotspots are protected in the form National Park and Sanctuary where as others are identified
by Birdlife International as Important Bird Areas. There are total 6 Protected Areas which
include two National Parks (Marine National Park & Velavadar National Park) and four Wildlife
Sanctuaries (Marine Sanctuary, Khijadiya bird Sanctuary, Kachchh Desert Sanctuary, Wild Ass
Sanctuary) that are linked with coastal systems support large concentrations of birds.
The Important Bird Areas that are linked with coastal systems include Bhal area, Charakla
saltpans, Flamingo city in Great Rann, Kaj‐Nanawada lake, Khijadiya Bird Sanctuary, Marine
National Park & Sanctuary, Saltpans of Bhavnagar and Wild Ass Sanctuary (IBA book 2000).
However, at local level, there are many sites that provide suitable habitats for congregation of
sea and shore birds. Some of these important sites for sea and shore birds include: Wadgham
mudflat in Khambhat taluka; Aliya bet in Gulf of Khambhat; Gopnath beach in Talaja taluka;
Damanganga, Purna, Mahi and Ambika river estuaries; Jafrabad creek, Piram bet near
Bhavnagar, Kuranga lake in Okha taluka; Surajbari & Hadakiya creek; Amipur tank in Porbandar
district etc.
It is reported by Wetlands International (2010) that at global level the status of water bird
populations remains poor as 44% of known populations is decreasing and only 17% are
increasing. Water bird population status is least favourable in Africa, South America and
particularly Asia, where 62% of known populations are decreasing or exterminated and only
10% are increasing. Assumingly, situation is by and large the same for bird population
inhabiting or visiting Gujarat. Thus, safeguarding of suitable habitats for 150 sea and shore bird
species and their populations on the coast of Gujarat is one of the key conservation goals of the
State.
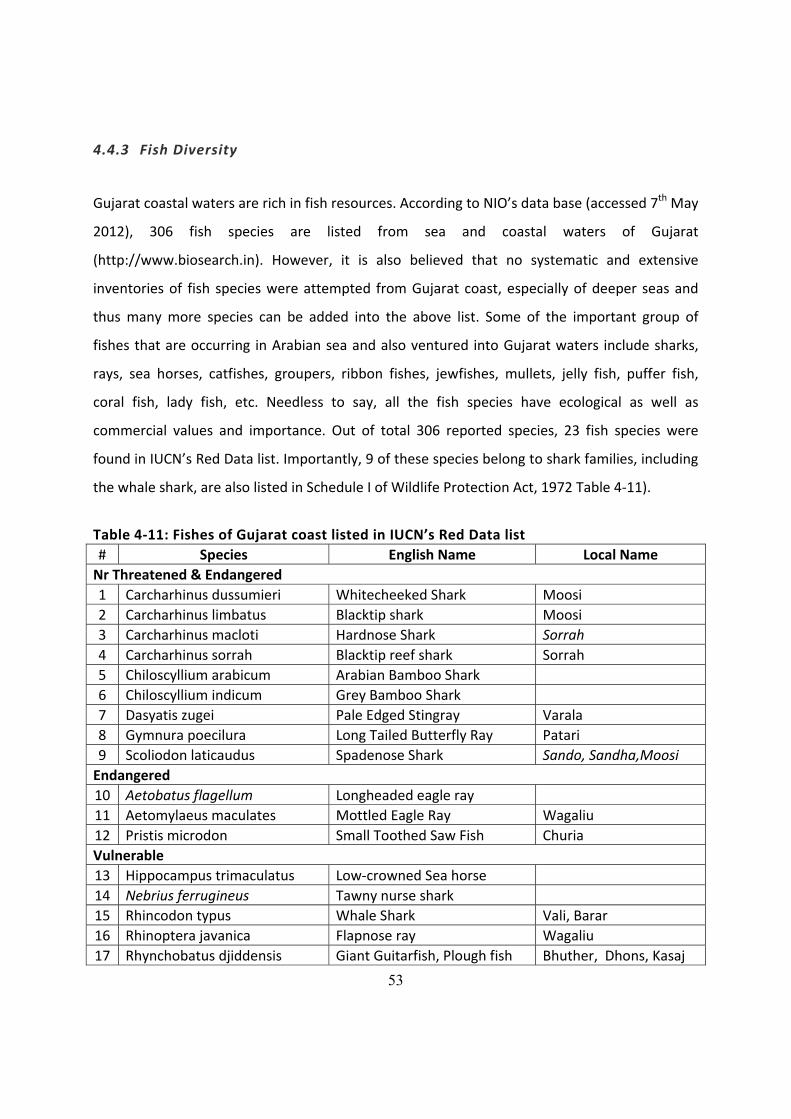
53
4.4.3 Fish Diversity
Gujarat coastal waters are rich in fish resources. According to NIO’s data base (accessed 7th May
2012), 306 fish species are listed from sea and coastal waters of Gujarat
(http://www.biosearch.in). However, it is also believed that no systematic and extensive
inventories of fish species were attempted from Gujarat coast, especially of deeper seas and
thus many more species can be added into the above list. Some of the important group of
fishes that are occurring in Arabian sea and also ventured into Gujarat waters include sharks,
rays, sea horses, catfishes, groupers, ribbon fishes, jewfishes, mullets, jelly fish, puffer fish,
coral fish, lady fish, etc. Needless to say, all the fish species have ecological as well as
commercial values and importance. Out of total 306 reported species, 23 fish species were
found in IUCN’s Red Data list. Importantly, 9 of these species belong to shark families, including
the whale shark, are also listed in Schedule I of Wildlife Protection Act, 1972 Table 4‐11).
Table 4‐11: Fishes of Gujarat coast listed in IUCN’s Red Data list # Species English Name Local Name Nr Threatened & Endangered 1 Carcharhinus dussumieri Whitecheeked Shark Moosi 2 Carcharhinus limbatus Blacktip shark Moosi 3 Carcharhinus macloti Hardnose Shark Sorrah 4 Carcharhinus sorrah Blacktip reef shark Sorrah 5 Chiloscyllium arabicum Arabian Bamboo Shark 6 Chiloscyllium indicum Grey Bamboo Shark 7 Dasyatis zugei Pale Edged Stingray Varala 8 Gymnura poecilura Long Tailed Butterfly Ray Patari 9 Scoliodon laticaudus Spadenose Shark Sando, Sandha,Moosi Endangered 10 Aetobatus flagellum Longheaded eagle ray 11 Aetomylaeus maculates Mottled Eagle Ray Wagaliu 12 Pristis microdon Small Toothed Saw Fish Churia Vulnerable 13 Hippocampus trimaculatus Low‐crowned Sea horse 14 Nebrius ferrugineus Tawny nurse shark 15 Rhincodon typus Whale Shark Vali, Barar 16 Rhinoptera javanica Flapnose ray Wagaliu 17 Rhynchobatus djiddensis Giant Guitarfish, Plough fish Bhuther, Dhons, Kasaj
54
# Species English Name Local Name 18 Stegostoma fasciatum Leopard Shark Shinawala Least Concerned 19 Epinephelus merra Dwarf Spotted Grouper Salai 20 Mugil cephalus Flathead Grey Mullet Boi, Bomat, Gandhia Data Deficient 21 Alopias vulpinus Thresher Shark Magru 22 Epinephelus sexfasciatus Trout Reef Cod Salai 23 Hippocampus kuda Sea Horse Jal ghodo
The occurrence of whale sharks in Gujarat waters is due to its seasonal migration cycle, from
the south towards the north along the west coast and from the north towards the south along
the east coast of India. The whale shark aggregation started from December in the west coast
and reached a peak during March–June with a maximum aggregation off the Saurashtra coast
of Gujarat. Pravin (2000) reported a total of 1974 whale sharks recorded in the Indian waters,
with Gujarat contributing the highest percentage (94.6%), followed by Tamil Nadu (2.0%) and
Andhra Pradesh (1.0%).
4.4.4 Sea Turtles
Four of the five species of sea turtles found in India are reported to occur in coastal waters of
Gujarat. These include oliveridley (Lepidochelys olivacea), green (Chelonia mydas), hawksbill
(Eretmochelys imbricata) and leatherback (Dermochelys coriacea). However, nesting of only
olive ridley and green turtles has been documented from Gujarat coast (Bhaskar, 1984, Kar and
Bhasker 1982, Sunderraj et. al. 2002). Other two species were sighted occasionally by fishermen
and researchers. In Gujarat, the nesting season of the olive ridley and green turtles begins in
June and ends in January (Bhaskar, 1984). However, sporadic nesting of these species was
recorded till March.
During 1981, a total of 2109 of olive ridley and green turtle nests were recorded along the
Saurashtra coast (Bhaskar 1984). Recent survey (during 2000‐2001) reported about 520 km of
Gujarat coast as suitable for sea turtle nesting‐ mainly in Kachchh, Jamnagar, Porbandar,
55
Junagadh, Amreli, Bhavnagar and Valsad districts. During that survey a total of 676 sea turtle
nests were reported (Sunderraj et al. 2002). In 2004‐2005, monitoring of 17 selected beaches of
the Saurashtra coast recorded a total of 1902 sea turtle nests along the Jamnagar (945),
Porbandar (449) and Junagadh (508). Of the total nests, 1234 were of green turtle and 668 of
olive ridley. In addition, partial surveys of Kachchh and Porbandar coast by State Forest
Department recorded a total of 195 nests, including two unconfirmed reports of hawksbill
turtle from Porbandar. In Kachchh, coastal stretch between Mandvi and Bhambhdai was found
as most potential area for sea turtle nesting. In year 2000, Local Forest Department also
collected about 4400 eggs of olive ridley mostly from this stretch.
Based on above reports, following were considered as important beaches in Gujarat for sea
turtle nesting:
(i) Mandvi – Bhambdai beach, Kachchh (7 km)
(ii) Mojap‐Shivrajpur beach, Jamnagar (4 km)
(iii) Kharakhetar‐Kuranga beach, Jamnagar (10km)
(iv) Navadra‐Lamba beach, Jamnagar (5 km)
(v) Lamba – Shitala mata beach, Jamnagar (5 km)
(vi) Shitala mata – Harshad mata beach, Jamnagar (4 km)
(vii) Ratadi – Kantela beach, Porbandar (4 km)
(viii) Kantela – Kuchhadi beach,Porbandar (4.5 km)
(ix) Shil – Lohej beach, Junagadh (3 km)
(x) Mangrol – Bara beach, Junagadh (4.5 km)
It is important to understand that mass sea turtle nesting occurs in eastern coast of India,
mostly along the Orissa coast (e.g. Gahirmatha, Rushikulya and Devi estuaries), where turtle
nests were counted in several lakhs. Conversely, in most of the maritime states of western
coast, including Gujarat, nesting population of both olive ridley and green turtle are sporadic
and thus quite small. Importantly, however, maximum nesting population of sea turtles are
reported from Gujarat coast beating other states of western coasts like Maharashtra, Goa,
56
Karnataka and Kerala. This signifies the need of conservation measures of sea turtle species in
Gujarat coast, especially when there are gap in knowledge about population genetics and
migration patterns of these sporadically nesting turtles.
All the four species of sea turtles that occur in Gujarat coastal waters are protected under
Schedule I of the Wildlife Protection Act (1972), as well as listed in Appendix I of Convention of
International Trade in Endangered Species of Wild Fauna and Flora (CITES) which prohibits
trade of turtle products. However, at present there are no reports of commercial or
international trade of sea turtles or turtle products from Gujarat. Nonetheless, the nesting
population of sea turtles in Gujarat coast also faces threats from various sources (Sunderraj et
al. 2006). These include: (a) Very high incidence (44%) of nest predation by animals and local
people. Olive ridley is more prone for nest predation (52%) than green turtles (39%). The
predation rate varies across the beaches: highest of 61% on the beach between Shitala mata
and Harsad mata in Jamnagar to lowest of 31% on the beach between Shil and Lohej in
Junagadh. (b) Incidental capture in fishing trawls is a familiar cause of mortality for sea turtles.
Both the Jamnagar and Junagadh coasts are well known for the commercial fishing activities.
During the course of 2004‐2005 monitoring of 17 beaches, on an average 0.86 dead‐sea turtles
per km of coast length were recorded, with maximum of 1.33 dead turtles per km in Junagadh.
(c) Habitat destruction in the form of sand mining from coastal beaches is a common threat to
sea turtles. In total, 67 sand mining locations were encountered during 2004‐05 monitoring
survey (Sunderraj et al. 2006).
4.4.5 Sea Mammals
Zoological Survey of India (ZSI) has reported 13 species of sea mammals from sea water of
Gujarat. These include: southern right whale (Balaena australis), blue whale (Balaena
musculus), humpback whale (Magaptera novaeangliae), pilot whale (Globicephala
macrohynchus), melon‐headed whale (Peonocephala electra), killer whale (Ornicus orca), false
57
killer whale (Peudorca crassidens), common dolphin (Delphinus delphis), Indo‐Pacific‐humpback
dolphin (Sousa chinensis), bottlenose dolphin (Tursiops truncates), finless porpoise
(Neophocaena phocaenoides), pygmy sperm whale (Kogia braviceps) and dugong (Dugon
dugon). However, due to lack of extensive systematic surveys, information about diversity and
abundance of sea mammals visiting the coastal areas of Gujarat are quite limited, especially of
large sized whales who often ventures into deeper, open seas. Two species of dolphins, one
species of porpoise and dugong were, however, recorded quite often from coastal water of
Gujarat.
4.4.5.1 Dolphins & Porpoise
While common dolphins are recorded frequently in the Gulf of Kachchh, seldom they were
sighted along the coast of Valsad (southern Gujarat). In 2001, Marine National Park authorities
conducted a survey in and around their territorial water and sighted 230 dolphins. Later, an
extensive two year survey of sea mammals in the Marine National Park during 2000‐2002,
recorded a total of 116 dolphins mainly from Okha, Bural‐chank reef and Poshitra to Bet
Dwarka area (Singh 2003). Porpoise are also recorded frequently in the Gulf of Kachchh.
However, as compared to dolphins, they are less common. During the above survey a total of
14 finless porpoise were observed, mainly near the mouth of the Gulf i.e. from Poshitra to Okha
area.
4.4.5.2 Dugong
Dugong, also known as ‘sea cow’, is the only herbivores marine mammal in the world. In Indian
sea water, the dugongs were mainly reported from the Gulf of Mannar, Palk Bay and Andaman
& Nicobar Islands. Ironically, the ecological information about dugongs is quite scarce not only
in Gujarat but also in other parts of India. Dugong is known to forage mainly in seagrass beds in
shallow water areas. Thus, in Gujarat, all its records are from Gulf of Kachchh and adjoining
water, where along the shore of some of the islands, there exist small beds of sea grasses. In
58
one of the recent surveys in 2009, a ‘feeding trail’ of dugong was confirmed from a sea grass
bed near Pirotan Island in Gulf of Kachchh (Pandey et al 2010). While, the dugongs are rarely
sighted in Gujarat coastal region, it is also argued that the Gulf of Kachchh might have an small
isolated meta‐population of about 10‐15 dugong (Frazier and Mundkur, 1990, Marsh et al 2004,
Singh 2009). Because of its meta‐population like structure the Gujarat’s dugong has very high
conservation significance.
Due to its small global population and also by virtue of various threats of anthropogenic and
natural origins, dugong has been categorized as ‘vulnerable’ according to IUCN Red Data List of
Threatened Species. Accidental stranding in the fishing nets and trawlers, rapid degradation of
sea‐grass beds and, to a certain extent, the increasing industrial pollution are the key threats to
dugong population. More than often, bodies of dead dugong were found stranded on shores
and islands in Gulf of Kachchh. Between 2000 and 2010 there were records of seven dead
dugongs in Gulf of Kachchh mainly from Poshitara, Bet Dwarka and Bhaidar‐Noru islands
(Pandey et al., 2010).
4.4.5.3 Asiatic Lions in Coastal Areas
Gir and Velavadar National Parks are situated outside the boundaries of coastal talukas.
However, major species of these PAs like Asiatic lion, wolf and black buck are known to disperse
away from the PAs and occupied different habitats including the coastal habitats. Not much
scientific information is available about the population dispersion of the wolf and the black
buck from Velavadar into coastal region, except some reports of wolves and black buck in
neighbouring coastal taluka of Dhandhuka in Ahmedabad district. Dispersion of lion in coastal
tracts, on the other hand, is well documented. Accordingly, while the lion population in Gujarat
has shown increasing trend from 1990 onwards (i.e. 284 in 1990 to 411 in 2010), the dispersion
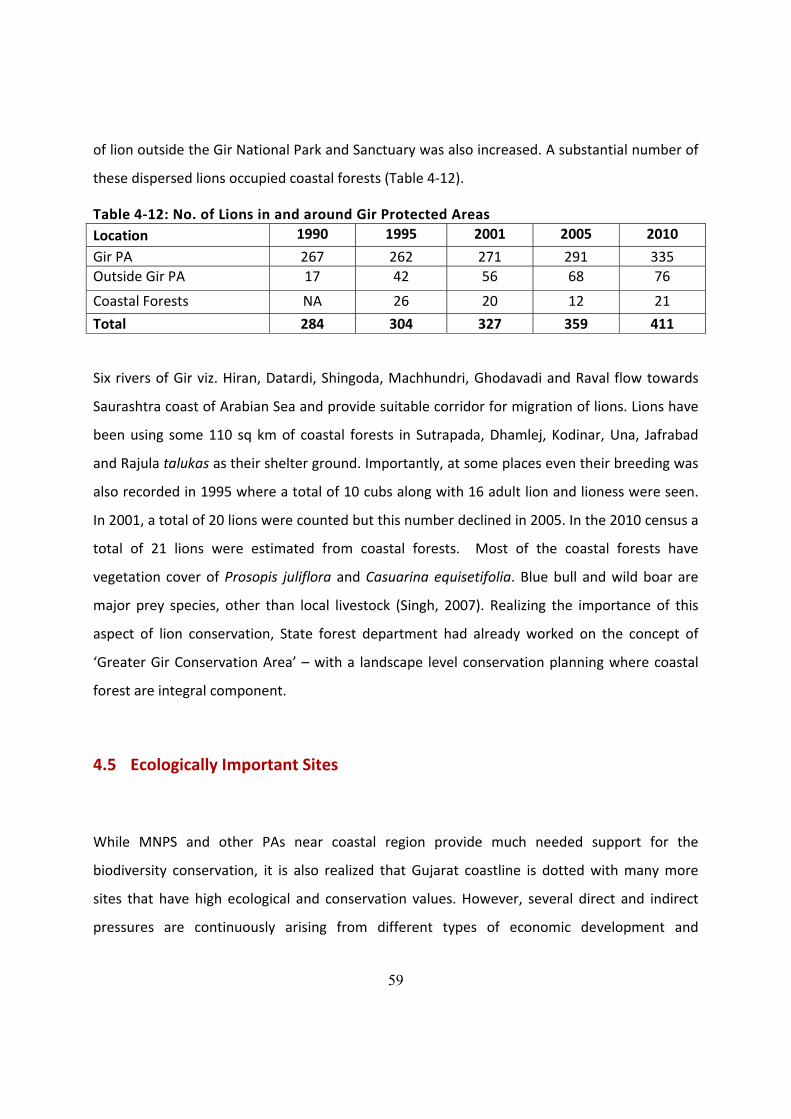
59
of lion outside the Gir National Park and Sanctuary was also increased. A substantial number of
these dispersed lions occupied coastal forests (Table 4‐12).
Table 4‐12: No. of Lions in and around Gir Protected Areas Location 1990 1995 2001 2005 2010
Gir PA 267 262 271 291 335 Outside Gir PA 17 42 56 68 76
Coastal Forests NA 26 20 12 21
Total 284 304 327 359 411
Six rivers of Gir viz. Hiran, Datardi, Shingoda, Machhundri, Ghodavadi and Raval flow towards
Saurashtra coast of Arabian Sea and provide suitable corridor for migration of lions. Lions have
been using some 110 sq km of coastal forests in Sutrapada, Dhamlej, Kodinar, Una, Jafrabad
and Rajula talukas as their shelter ground. Importantly, at some places even their breeding was
also recorded in 1995 where a total of 10 cubs along with 16 adult lion and lioness were seen.
In 2001, a total of 20 lions were counted but this number declined in 2005. In the 2010 census a
total of 21 lions were estimated from coastal forests. Most of the coastal forests have
vegetation cover of Prosopis juliflora and Casuarina equisetifolia. Blue bull and wild boar are
major prey species, other than local livestock (Singh, 2007). Realizing the importance of this
aspect of lion conservation, State forest department had already worked on the concept of
‘Greater Gir Conservation Area’ – with a landscape level conservation planning where coastal
forest are integral component.
4.5 Ecologically Important Sites
While MNPS and other PAs near coastal region provide much needed support for the
biodiversity conservation, it is also realized that Gujarat coastline is dotted with many more
sites that have high ecological and conservation values. However, several direct and indirect
pressures are continuously arising from different types of economic development and
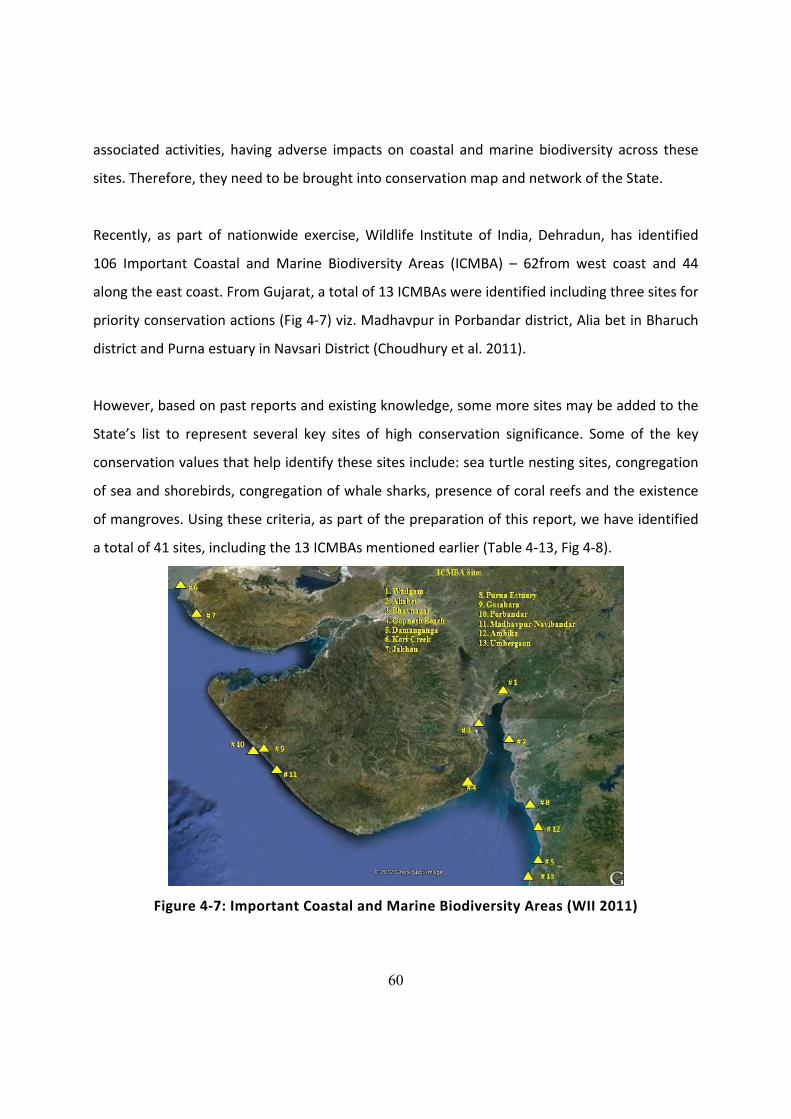
60
associated activities, having adverse impacts on coastal and marine biodiversity across these
sites. Therefore, they need to be brought into conservation map and network of the State.
Recently, as part of nationwide exercise, Wildlife Institute of India, Dehradun, has identified
106 Important Coastal and Marine Biodiversity Areas (ICMBA) – 62from west coast and 44
along the east coast. From Gujarat, a total of 13 ICMBAs were identified including three sites for
priority conservation actions (Fig 4‐7) viz. Madhavpur in Porbandar district, Alia bet in Bharuch
district and Purna estuary in Navsari District (Choudhury et al. 2011).
However, based on past reports and existing knowledge, some more sites may be added to the
State’s list to represent several key sites of high conservation significance. Some of the key
conservation values that help identify these sites include: sea turtle nesting sites, congregation
of sea and shorebirds, congregation of whale sharks, presence of coral reefs and the existence
of mangroves. Using these criteria, as part of the preparation of this report, we have identified
a total of 41 sites, including the 13 ICMBAs mentioned earlier (Table 4‐13, Fig 4‐8).
Figure 4‐7: Important Coastal and Marine Biodiversity Areas (WII 2011)
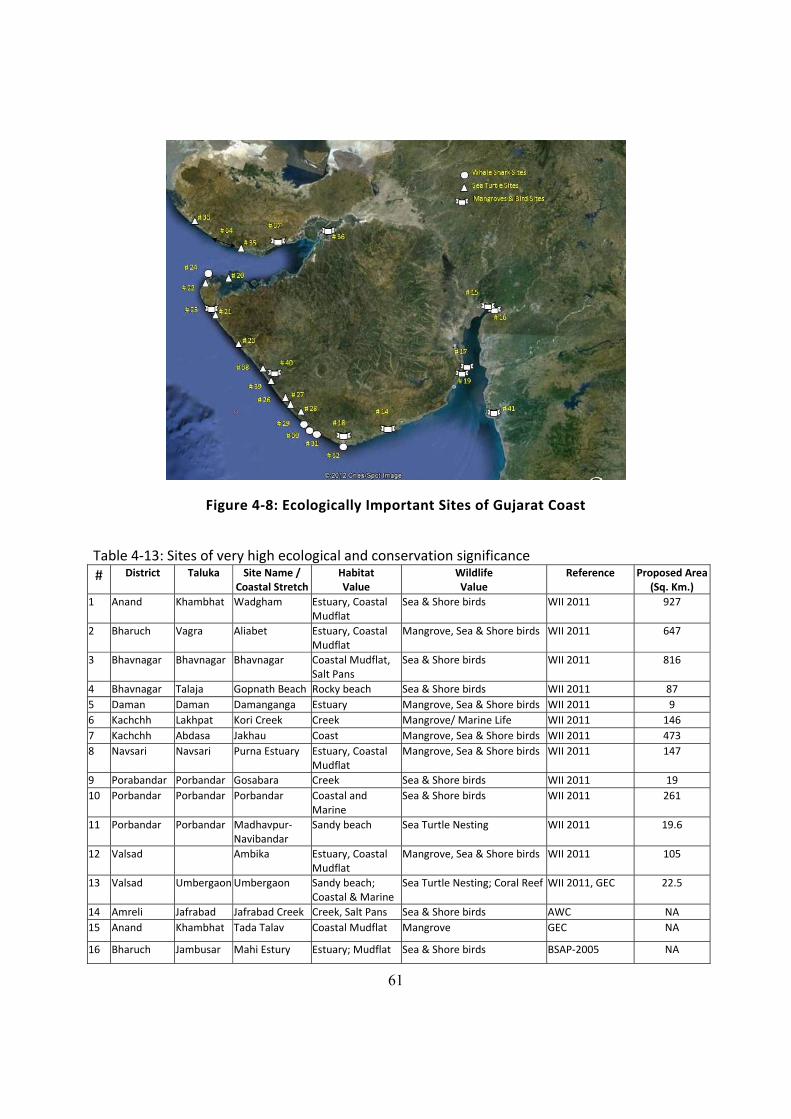
61
Figure 4‐8: Ecologically Important Sites of Gujarat Coast
Table 4‐13: Sites of very high ecological and conservation significance # District Taluka Site Name /
Coastal Stretch Habitat Value
Wildlife Value
Reference Proposed Area (Sq. Km.)
1 Anand Khambhat Wadgham Estuary, Coastal Mudflat
Sea & Shore birds WII 2011 927
2 Bharuch Vagra Aliabet Estuary, Coastal Mudflat
Mangrove, Sea & Shore birds WII 2011 647
3 Bhavnagar Bhavnagar Bhavnagar Coastal Mudflat, Salt Pans
Sea & Shore birds WII 2011 816
4 Bhavnagar Talaja Gopnath Beach Rocky beach Sea & Shore birds WII 2011 87 5 Daman Daman Damanganga Estuary Mangrove, Sea & Shore birds WII 2011 9 6 Kachchh Lakhpat Kori Creek Creek Mangrove/ Marine Life WII 2011 146 7 Kachchh Abdasa Jakhau Coast Mangrove, Sea & Shore birds WII 2011 473 8 Navsari Navsari Purna Estuary Estuary, Coastal
Mudflat Mangrove, Sea & Shore birds WII 2011 147
9 Porabandar Porbandar Gosabara Creek Sea & Shore birds WII 2011 19 10 Porbandar Porbandar Porbandar Coastal and
Marine Sea & Shore birds WII 2011 261
11 Porbandar Porbandar Madhavpur‐Navibandar
Sandy beach Sea Turtle Nesting WII 2011 19.6
12 Valsad Ambika Estuary, Coastal Mudflat
Mangrove, Sea & Shore birds WII 2011 105
13 Valsad Umbergaon Umbergaon Sandy beach; Coastal & Marine
Sea Turtle Nesting; Coral Reef WII 2011, GEC 22.5
14 Amreli Jafrabad Jafrabad Creek Creek, Salt Pans Sea & Shore birds AWC NA 15 Anand Khambhat Tada Talav Coastal Mudflat Mangrove GEC NA
16 Bharuch Jambusar Mahi Estury Estuary; Mudflat Sea & Shore birds BSAP‐2005 NA
62
# District Taluka Site Name / Coastal Stretch
Habitat Value
Wildlife Value
Reference Proposed Area (Sq. Km.)
17 Bhavnagar Ghogha Piram Island Bet Mangrove, Sea & Shore birds AWC NA
18 Junagadh Kodinar Kaj‐Nanwada Coastal Wetland Sea & Shore birds IBA NA
19 Bhavnagar Bhavnagar Hathab Coastal Mudflat Sea & Shore birds AWC NA
20 Jamnagar Okha Bhaidar bet Sandy beach Sea Turtle Nesting Shankar & Andrews, 2006
NA
21 Jamnagar Okha Kharakhetar‐Kuranga
Sandy beach Sea Turtle Nesting Shankar & Andrews, 2006
NA
22 Jamnagar Okha Mojap‐Shivrajpur
Sandy beach Sea Turtle Nesting Shankar & Andrews, 2006
NA
23 Jamnagar Kalyanpur Navadra‐Shitlamata
Sandy beach Sea Turtle Nesting Shankar & Andrews, 2006
NA
24 Jamnagar Okha Mithapur‐Okha‐Rupen
Coastal and Marine
Whale shark, coral reef, marine life
WTI NA
25 Jamnagar Okha Kuranga lake Coastal Wetland Sea & Shore birds AWC NA
26 Junagadh Mangrol Shil‐Lohaj Sandy beach Sea Turtle Nesting Venkatesan et al. (2004); Shankar & Andrews, 2006
NA
27 Junagadh Mangrol Lohaj‐Maktupur Sandy beach Sea Turtle Nesting Shankar & Andrews, 2006
NA
28 Junagadh Mangrol Mangrol‐Bara Sandy beach Sea Turtle Nesting Shankar & Andrews, 2006
NA
29 Junagadh Veraval Veraval Coastal and Marine
Whale shark WTI NA
30 Junagadh Sutrapada Sutrapada Coastal and Marine
Whale shark, coral reef, marine life
WTI NA
31 Junagadh Sutrapada Dhamlej‐Hirakot
Coastal and Marine
Whale shark; Coral Reef WTI, GEC NA
32 Junagadh Kodinar Madhvad Coastal and Marine
Whale shark WTI NA
33 Kachchh Abdasa Kamond‐ Suthri Sandy beach Sea Turtle Nesting Shankar & Andrews, 2006
NA
34 Kachchh Mandvi Mandvi‐Bhambdai
Sandy beach Sea Turtle Nesting Shankar & Andrews, 2006
NA
35 Kachchh Mandvi Gundiali‐ Tragadi
Sandy beach Sea Turtle Nesting Shankar & Andrews, 2006
NA
36 Kachchh Bhachau Surajbari/ / Hadakiya creek
Coastal Mudflat Sea & Shore birds; Fish & Prawns
GEER (1998) NA
37 Kachchh Mundra Bhadreshwar Creek
Creek Sea & Shore birds AWC NA
38 Porbandar Porbandar Ratadi‐Kantela Sandy beach Sea Turtle Nesting Venkatesan et al. (2004), Shankar & Andrews, 2006
NA
39 Porbandar Porbandar Kantela‐Kuchhadi
Sandy beach, Coastal & Marine
Sea Turtle Nesting; Coral reef Venkatesan et al. (2004); Shankar & Andrews, 2006, GEC
NA
40 Porbandar Kutiyana Amipur tank Coastal Wetland Sea & Shore birds AWC NA
41 Surat Chorasi Tapi Estuary Estuary, Coastal Mudflat
Mangrove, Sea & Shore birds GEER NA
63
4.6 Commercial Fisheries
4.6.1 Marine Fisheries
Gujarat ranks first among the maritime states by volume in marine fish production. According
to the pre‐census survey, conducted prior to the National Marine Fisheries Census‐2010,
conducted in coastal districts of the state by Central Marine and Fisheries Research Institute
(CMFRI) the number of fishermen households in Gujarat has increased from 60,000 in 2005 to
83,000 in 2010.The annual marine fish production in the state has been fluctuating between 5.5
and 7.5 lakh metric tons, peaking at 7.4 thousand metric tons in 2002‐03 and falling below 6.5
lakh metric tons by 2009‐10 (Fig 4‐9). There are conflicting estimates of the potential yield of
Gujarat’s marine waters up to the 200m depth contour. The most recent estimate is that of the
Central Marine Fisheries Research Institute (CMFRI), according to which Gujarat has a
maximum sustainable yield (MSY) of 567,000 tonnes3. The Fisheries Survey of India (FSI),
however, has estimated an MSY of 703,000 tonnes. But according to the Government of
Gujarat, the State has an “estimated potentiality” of 773,000 tonnes in its waters less than
200m depth. 65 per cent of the MSY is believed to comprise demersal stocks, and the rest,
pelagic4.
The high value fisheries make up a small percentage of the total catch (Table 4‐14). The bulk of
the catch of low value fishes such as Small Sciaenids and Bombay duck. The published fish
production figures show only the net catch that reaches the market and if one considers the
bycatch, fish discarded at sea, trash fishes that do not reach market and the wastes are either
discarded or converted into fertilizer or fishmeal, the gross catch would be much higher. The
estimates of wastage and trash fishes in the Gujarat range between 30 to even 50 percent of
the catch by trawlers (Zynudheen et al 2004, Ganpathiraju 2010).
3 ‘Standing fishable stock’, ‘marine fishable stock’, ‘maximum sustainable yield’ , ‘total potentiality’ and ‘total potential yield’ are the terms often used to describe the marine fisheries resource potential. 4 Commenting on the level of production of Gujarat in 1994-95, which was nearly 6.5 lakh tonnes (Government of Gujarat figures), Devaraj et al of CMFRI observed that there was “absolutely no further scope for increasing the annual catch any further!”
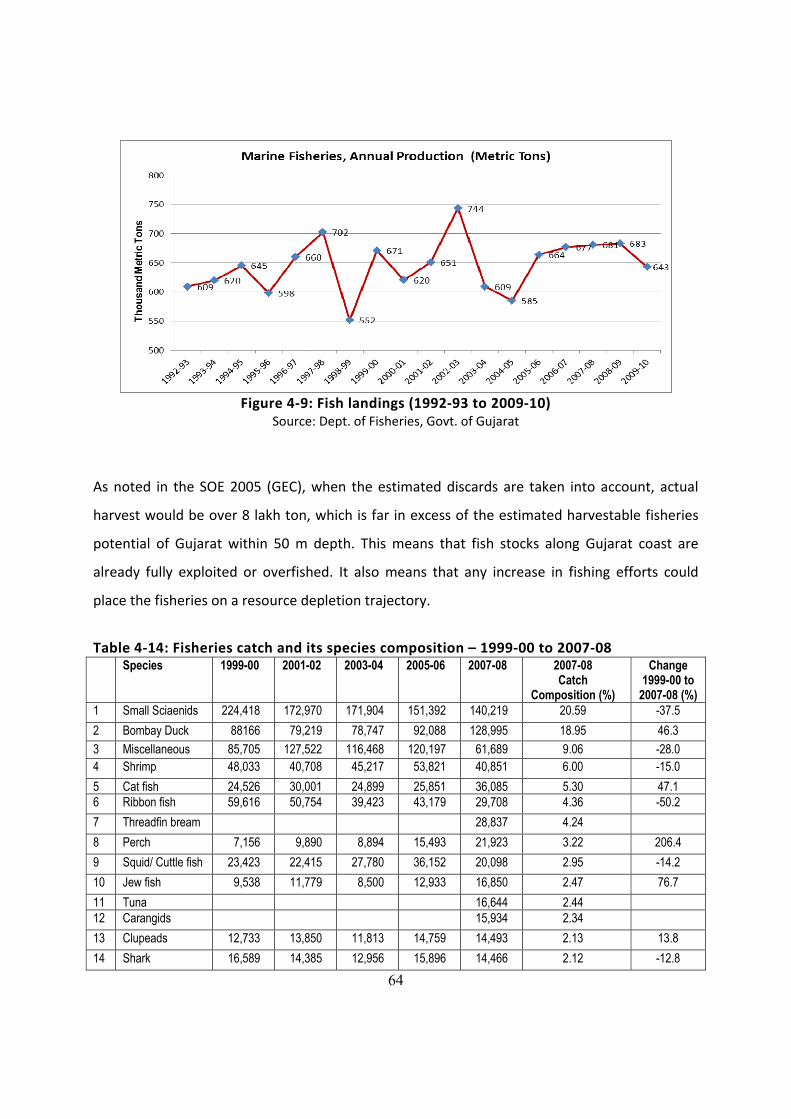
64
Figure 4‐9: Fish landings (1992‐93 to 2009‐10)
Source: Dept. of Fisheries, Govt. of Gujarat
As noted in the SOE 2005 (GEC), when the estimated discards are taken into account, actual
harvest would be over 8 lakh ton, which is far in excess of the estimated harvestable fisheries
potential of Gujarat within 50 m depth. This means that fish stocks along Gujarat coast are
already fully exploited or overfished. It also means that any increase in fishing efforts could
place the fisheries on a resource depletion trajectory.
Table 4‐14: Fisheries catch and its species composition – 1999‐00 to 2007‐08 Species 1999-00 2001-02 2003-04 2005-06 2007-08 2007-08
Catch Composition (%)
Change 1999-00 to
2007-08 (%) 1 Small Sciaenids 224,418 172,970 171,904 151,392 140,219 20.59 -37.5 2 Bombay Duck 88166 79,219 78,747 92,088 128,995 18.95 46.3 3 Miscellaneous 85,705 127,522 116,468 120,197 61,689 9.06 -28.0 4 Shrimp 48,033 40,708 45,217 53,821 40,851 6.00 -15.0 5 Cat fish 24,526 30,001 24,899 25,851 36,085 5.30 47.1 6 Ribbon fish 59,616 50,754 39,423 43,179 29,708 4.36 -50.2 7 Threadfin bream 28,837 4.24 8 Perch 7,156 9,890 8,894 15,493 21,923 3.22 206.4 9 Squid/ Cuttle fish 23,423 22,415 27,780 36,152 20,098 2.95 -14.2 10 Jew fish 9,538 11,779 8,500 12,933 16,850 2.47 76.7 11 Tuna 16,644 2.44 12 Carangids 15,934 2.34 13 Clupeads 12,733 13,850 11,813 14,759 14,493 2.13 13.8 14 Shark 16,589 14,385 12,956 15,896 14,466 2.12 -12.8
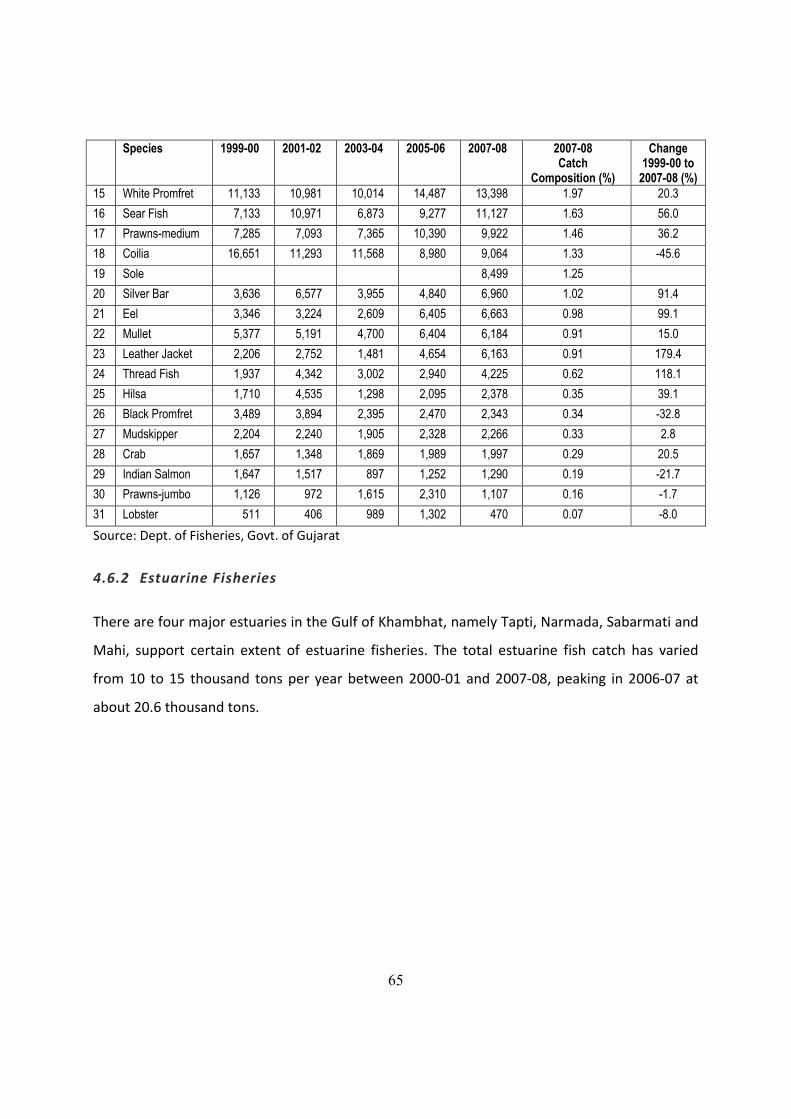
65
Species 1999-00 2001-02 2003-04 2005-06 2007-08 2007-08 Catch
Composition (%)
Change 1999-00 to
2007-08 (%) 15 White Promfret 11,133 10,981 10,014 14,487 13,398 1.97 20.3 16 Sear Fish 7,133 10,971 6,873 9,277 11,127 1.63 56.0 17 Prawns-medium 7,285 7,093 7,365 10,390 9,922 1.46 36.2 18 Coilia 16,651 11,293 11,568 8,980 9,064 1.33 -45.6 19 Sole 8,499 1.25 20 Silver Bar 3,636 6,577 3,955 4,840 6,960 1.02 91.4 21 Eel 3,346 3,224 2,609 6,405 6,663 0.98 99.1 22 Mullet 5,377 5,191 4,700 6,404 6,184 0.91 15.0 23 Leather Jacket 2,206 2,752 1,481 4,654 6,163 0.91 179.4 24 Thread Fish 1,937 4,342 3,002 2,940 4,225 0.62 118.1 25 Hilsa 1,710 4,535 1,298 2,095 2,378 0.35 39.1 26 Black Promfret 3,489 3,894 2,395 2,470 2,343 0.34 -32.8 27 Mudskipper 2,204 2,240 1,905 2,328 2,266 0.33 2.8 28 Crab 1,657 1,348 1,869 1,989 1,997 0.29 20.5 29 Indian Salmon 1,647 1,517 897 1,252 1,290 0.19 -21.7 30 Prawns-jumbo 1,126 972 1,615 2,310 1,107 0.16 -1.7 31 Lobster 511 406 989 1,302 470 0.07 -8.0 Source: Dept. of Fisheries, Govt. of Gujarat
4.6.2 Estuarine Fisheries
There are four major estuaries in the Gulf of Khambhat, namely Tapti, Narmada, Sabarmati and
Mahi, support certain extent of estuarine fisheries. The total estuarine fish catch has varied
from 10 to 15 thousand tons per year between 2000‐01 and 2007‐08, peaking in 2006‐07 at
about 20.6 thousand tons.
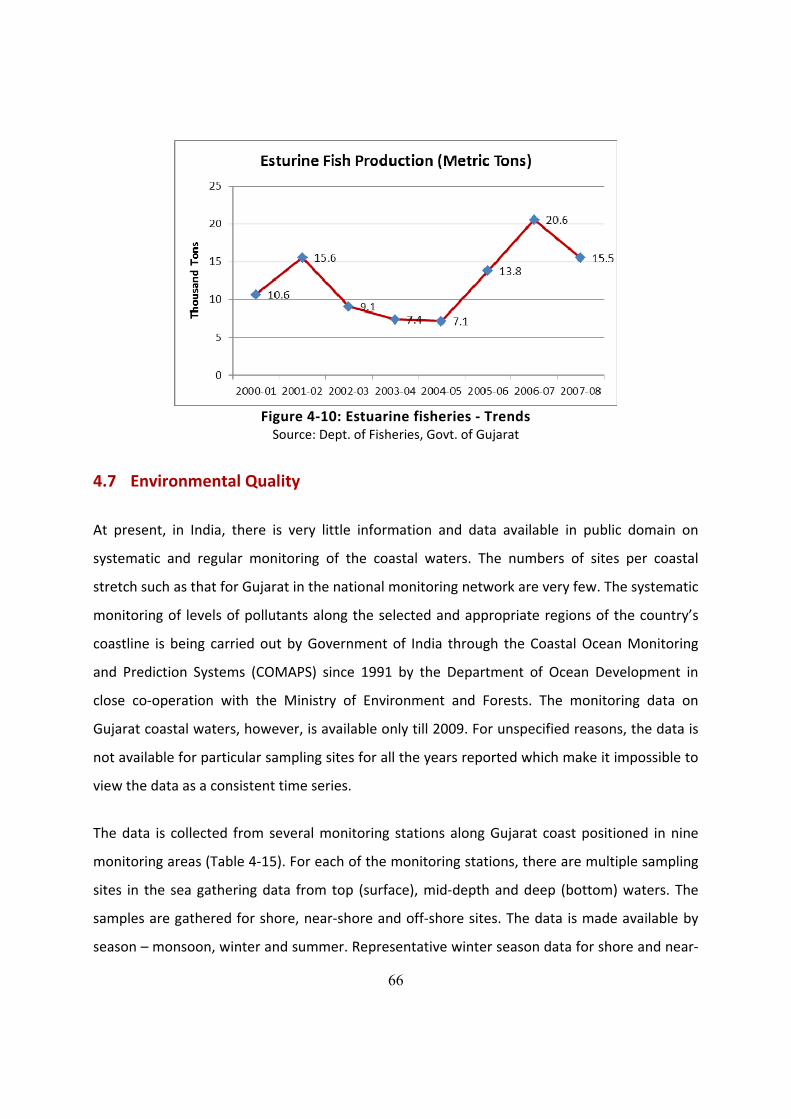
66
Figure 4‐10: Estuarine fisheries ‐ Trends Source: Dept. of Fisheries, Govt. of Gujarat
4.7 Environmental Quality
At present, in India, there is very little information and data available in public domain on
systematic and regular monitoring of the coastal waters. The numbers of sites per coastal
stretch such as that for Gujarat in the national monitoring network are very few. The systematic
monitoring of levels of pollutants along the selected and appropriate regions of the country’s
coastline is being carried out by Government of India through the Coastal Ocean Monitoring
and Prediction Systems (COMAPS) since 1991 by the Department of Ocean Development in
close co‐operation with the Ministry of Environment and Forests. The monitoring data on
Gujarat coastal waters, however, is available only till 2009. For unspecified reasons, the data is
not available for particular sampling sites for all the years reported which make it impossible to
view the data as a consistent time series.
The data is collected from several monitoring stations along Gujarat coast positioned in nine
monitoring areas (Table 4‐15). For each of the monitoring stations, there are multiple sampling
sites in the sea gathering data from top (surface), mid‐depth and deep (bottom) waters. The
samples are gathered for shore, near‐shore and off‐shore sites. The data is made available by
season – monsoon, winter and summer. Representative winter season data for shore and near‐

67
shore waters between 1998 and 2009 (the last available) for DO, BOD and NH3N indicate that
water quality is rather well maintained, although there are variations.
Table 4‐15: COMAPS – Reported Values DO, BOD and NH3N (Surface/ Winter/Shore&
Near Shore) in different years DO (Minimum) BOD (Maximum) NH3N (Maximum) Location 1998 2000 2003 2009 1998 2000 2003 2009 1998 2000 2003 2009 1 Alang 5.31 - - 6.70 1.53 - - 4.50 1.23 - - 0.80 2 Dwarka 5.89 6.63 6.14 6.30 2.16 1.20 0.60 5.90 5.22 3.88 2.80 0.80 3 Hazira 6.71 - 6.85 - 1.50 - 4.50 - - - 1.70 - 4 Kandla 5.88 7.47 - - 2.31 1.21 - - 2.42 1.38 - - 5 Mundra - - 6.29 - - - 0.50 - - - 5.70 - 6 Okha 7.54 7.74 3.00 - 1.91 1.10 5.30 - 0.72 1.20 1.50 - 7 Pipavav 5.86 0.94 6.14 6.60 1.0 - 4.60 5.10 - 3.95 4.50 1.60 8 Porbandar 6.71 6.45 2.86 - 1.30 1.57 2.90 - - 11.50 18.10 - 9 Vadinar 6.17 6.98 6.14 - 1.32 1.02 2.60 - 6.10 5.55 0.20 - Overall 5.31 0.94 2.86 6.30 2.31 1.57 2.60 5.10 6.10 11.5 0.10 1.60 DO (Dissolved Oxygen): Minimum level to be maintained for oxygen availability (i.e., minimum DO) – at least 5.0 mg/l or 60 percent
saturation value, whichever is higher. It should not fall below 3.5 mg/l at any time of the year for protection of aquatic biota.
NH3N – Maximum permissible limit: 50 mg/L BOD – Maximum permissible limit: 30 mg/L The data is not available for all years and for all stations for all seasons. There are some unusual
patterns in the data as in several cases higher DO values are reported along with high BOD
values, instead of the well‐known negative correlation between these two parameters. While,
BOD shows a rising trend, NH3N levels are declining from 1998 to 2009. The reported data
indicate that minimum DO levels are improving (i.e., dissolved oxygen is more, despite
increases in oxygen demand caused by organic pollutants, BOD).
On the whole, the official monitoring of coastal waters indicates that by and large the coastal
water quality is within the prescribed limits. Most of the pollutants reaching the coastal waters
consist of treated industrial wastes and untreated domestic waste waters discharged into the
drains and rivulets that ultimately reach join the sea through the rivers. The water quality
monitoring data from GPCB, shows that at least in some locations in the Gulf of Kachchh, the
minimum level of DO are very low (Table 4‐16) and the maximum BOD levels exceed the
permissible limit of 30 mg/L (Table 4‐17). The ammonia nitrogen (NH3N) is well within the
68
maximum permissible limits in the reported data (Table 4‐18). The independent data sources
are mainly occasional studies, research reports and papers on the water quality of the coastal
waters. While useful in understanding some of the trends and threats, they cannot be relied
upon for regular monitoring.
Table 4‐16: Dissolved Oxygen (mg/L) – Reported Minimum Values pertaining to receiving
water bodies: Sea, Jetties and Estuary Coastal Stretch 2001‐02 2005‐06 2010‐11 Gulf of Kachchh ‐ ‐ 0.2
Sea ‐ ‐ 0.2 Gulf of Khambhat ‐ 4 4.9
Estuaries ‐ 4 4.9 Jetties ‐ 4.6 4.9 Sea ‐ 6.6 6.5
Saurashtra Coast ‐ ‐ 5.3 Jetties ‐ 6.6 5.8 Sea ‐ ‐ 5.3
South Gujarat 4.9 5 6.3 Estuaries 4.9 5 6.3 Jetties 5.3 5.3 6.7
DO (Dissolved Oxygen): Minimum level to be maintained for oxygen availability (i.e., minimum DO) – at least 5.0 mg/l or 60 percent saturation value, whichever is higher. It should not fall below 3.5 mg/l at any time of the year for protection of aquatic biota.
Source – GPCB Annual Reports Table 4‐17: BOD (mg/L) – Reported Maximum Values pertaining to receiving water
bodies: Sea, Jetties and Estuary Coastal Stretch 2002‐2003 2004‐2005 2006‐2007 2008‐2009 2010‐2011Gulf of Kachchh ‐ ‐ 1.8 2.35 45
Sea ‐ ‐ 1.8 2.35 45Gulf of Khambhat 6 7 4.8 3.32 5
Estuaries 6 5 4.3 3.2 4Jetties 5 7 4.8 3.32 5Sea 1.46 2.88 3.1 2.78 1
Saurashtra Coast ‐ 14.27 2.8 10.18 5Jetties ‐ 14.27 2.8 10.18 5Sea ‐ 2.4 2.07 2
South Gujarat 2.5 4.48 10.1 9.49 11Estuaries 2.5 4.48 10.1 9.49 11Jetties 2.31 4.35 10 4.78 4
BOD – Maximum permissible limit: 30 mg/L; Source – GPCB Annual Reports
69
Table 4‐18: Ammonia Nitrogen (NH3N, mg/L) – ReportedMaximum Values pertaining to
receiving water bodies: Sea, Jetties and Estuary Coastal Stretch 2001‐02 2005‐06 2010‐11 Gulf of Kachchh 0.003 0.98 12.05
Sea 0.003 0.98 12.05 Gulf of Khambhat 0.00523 1.01 1.36
Estuaries 0 1.01 1.12 Jetties 0 0.8 0.56 Sea 0.00523 0.85 1.36
Saurashtra Coast 0 1.9 0.81 Jetties 0 1.9 0.81 Sea 0 0.9 0.57
South Gujarat 0.362 80 6.02 Estuaries 0.362 80 6.02 Jetties 0.317 71 4.35
NH3N – Maximumpermissible limit: 50 mg/L; Source – GPCB Annual Reports Most research reports and monitoring data indicate that pollutants are within the prescribed
limits, in the estuaries (Table 4‐19). However, some of the research papers have reported cases
of variation in the pollution level, within the prescribed limits. As per studies available in public
domain, Narmada estuary has low nutrient load. Sabarmati estuary has high phosphates levels
mostly due to the high input of domestic sewage being released from Ahmedabad city. The
CPCB report notes that BOD is high in the Sabarmati estuary, indicating the presence high
organic wastes in the aquatic body.
Table 4‐19: Water quality for four major estuaries Narmada Mahi Sabarmati TapiParameters Min Max Min Max Min Max Min MaxTemperature (oC) 29.0 30.0 28.0 30.0 27.0 30.0 23.5 33.5Salinity (ppt) 0.61 33.27 0.20 33.10 14.18 33.27 0.11 32.00pH 8.50 8.80 7.60 10.70 8.30 8.40 7.20 8.50DO (mg/l) 4.57 5.03 2.28 4.11 1.14 3.20 2.10 8.50NO3‐N (mg/l) 0.07 0.19 0.09 0.31 0.14 0.40 0.23 0.71Source: Nirmalkumar et al., 2009; Deshkar et al, 2011
70
The observations from the Monitoring of Indian Aquatic Resources (MINARS), the national
water quality monitoring program, are reported in the CPCB Report on Status of Water Quality
2009 (CPCB 2010). The monitoring of major rivers is carried out all along the course of the rivers
that runs through more than one state. The report observes that River Mahi is conforming to
the desired water quality at most of the monitoring locations except a few. On the other hand,
the report notes that River Sabarmati is relatively polluted at many monitoring points with
water having low DO, high faecal coliform contamination and very high dissolved solid content.
The report also notes that waters of River Narmada are conforming to water quality for most of
the parameters. The water quality of River Tapti is poor in some monitoring points along its
course including a few locations in Gujarat.
4.8 Salinity Ingress
The salinity ingress into the coastal aquifers is of particular concern for Gujarat. The emergence
of the problem prompted official investigations as early as 1958 by the then Exploratory Tube
Well Organisation in parts of coastal Saurashtra. One of the worst affected regions is the Una‐
Madhavpur reach, extending over 160 km of the coastline. Following complaints of saline
ingression, systematic geo‐hydrological investigations were carried out in this region in 1970 to
locate the boundary of freshwater‐saltwater interface in the coastal aquifers.
According to the report on Water Resources Planning for the State of Gujarat (GOG, 1996), the
intrusions are in the range of 1.3 to 4 km for the Una‐Madhavpur, 1 to 2.6 km for the
Madhavpur‐Okha and 2.4 to 3.2 km for the Okha to Malia reaches. The report estimates that
freshwater flow of 70 MCM from the land to the sea needs to be maintained to check further
intrusion of freshwater‐seawater interface. It also states that out of annual recharge of 115.3
MCM in the coastal areas, the extraction should be restricted to just 76 MCM. Further, it says
that the remaining 39.3 MCM should be allowed to flow into the sea from the aquifer above
the toe of the interface. It estimates that additional 30.7 MCM of rainwater should be allowed
to flow over the interface.
71
Between 1970 and 1977, it was found that the groundwater salinity had increased from 3,500
ppm to 9,000 ppm at a distance of 2 km from the coast, and from 860 ppm to 2,060 ppm at a
distance of 5km from the coast. The chloride content went high from 1,800 ppm to 2,400 ppm
and from 260 ppm to 330 ppm at distances of 2 km and 5 km, respectively, from the coast. An
increase in the ratio of Cl/(CO3+HCO3) was also noted towards the coast, indicating
considerable mixing of seawater with the local groundwater. This ratio also showed increase
after a few hours of pumping operation in the same wells, indicating ‘up‐coning’ of seawater.
Seawater ingress (manifested as TDS > 2000 ppm) that was observed to a distance of 2.5‐4.5 km
from the coast, mostly in the Miliolitic Limestone, in 1971, had encroached a distance of 5.0‐7.5
km inland from the coast by 1977.The data compiled by the HLC‐3 showed that saline areas
from Bhavnagar to Valsad cover about 1.1 M ha of which 2.6 lakh ha were within tidal ingress.
The HLC that studied the problem of salinity along the coastal areas of Kachchh found 3.65 lakh
ha to be affected by salinity ingress.

72
73
5 Impacts
5.1 Commercial Fisheries
A study by CMFRI points out a conspicuous change in the resource composition over the years
with quality fishes like pomfrets, larger sciaenids, threadfins and penaeid prawns being
replaced by low value fishes such as ribbon fishes, threadfin breams, carangids, non‐penaeid
prawns and smaller crabs. In the five years between 2002 and 2006, period, pelagic resources
contributed (40%), followed by the demersal resources (30%), crustacean resources (22%) and
cephalopod resources (8%). The bulk of fish landings are by trawlers (59%), followed by dol‐
netters (26%) and gill‐netters (14%). The demersal trawlers operating up to 90 metre depth are
intensively exploiting the inshore and off shore water.
The shifts in the composition of fish landings are depicted in Figures 5‐1 and 5‐2 which clearly
show that the largest increase by volume is that of Bombay duck while valued catch like that of
black pomfret, shrimp and salmon show declining trend. It must be kept in mind that some of
the fisheries can only take place in smaller volumes while some are commercially viable only in
high volumes. For example, there is no potential for very large increase in the normal capture
fisheries of lobsters. On the other hand, some new fisheries have emerged. For example, the
year 2006saw the emergence of mackerel fishery coupled with increased landings of high
export value cephalopods and tuna. The research paper by Mohanraj et al (2009) noted several
changes in the species composition of the landings. The research reinforces the trends
noticeable in the fish landing data and they conclude that the changes point to commercially
less important species replacing larger fishes of higher value.

74
Figure 5‐1: Declining fisheries (1999‐00 to 2007‐08) Source: compiled from official statistics, Dept. of Fisheries, Govt. of Gujarat
Figure 5‐2: Ascending fisheries (1999‐00 to 2007‐08) Source: compiled from official statistics, Dept. of Fisheries, Govt. of Gujarat
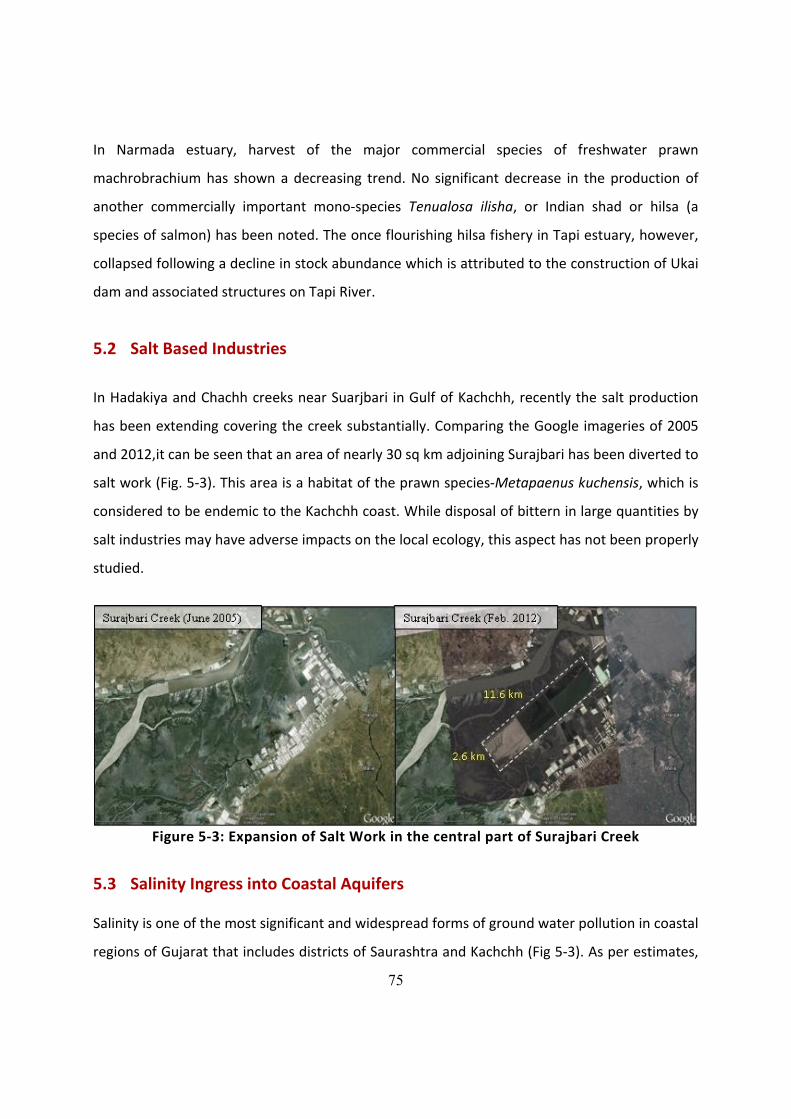
75
In Narmada estuary, harvest of the major commercial species of freshwater prawn
machrobrachium has shown a decreasing trend. No significant decrease in the production of
another commercially important mono‐species Tenualosa ilisha, or Indian shad or hilsa (a
species of salmon) has been noted. The once flourishing hilsa fishery in Tapi estuary, however,
collapsed following a decline in stock abundance which is attributed to the construction of Ukai
dam and associated structures on Tapi River.
5.2 Salt Based Industries
In Hadakiya and Chachh creeks near Suarjbari in Gulf of Kachchh, recently the salt production
has been extending covering the creek substantially. Comparing the Google imageries of 2005
and 2012,it can be seen that an area of nearly 30 sq km adjoining Surajbari has been diverted to
salt work (Fig. 5‐3). This area is a habitat of the prawn species‐Metapaenus kuchensis, which is
considered to be endemic to the Kachchh coast. While disposal of bittern in large quantities by
salt industries may have adverse impacts on the local ecology, this aspect has not been properly
studied.
Figure 5‐3: Expansion of Salt Work in the central part of Surajbari Creek
5.3 Salinity Ingress into Coastal Aquifers Salinity is one of the most significant and widespread forms of ground water pollution in coastal
regions of Gujarat that includes districts of Saurashtra and Kachchh (Fig 5‐3). As per estimates,
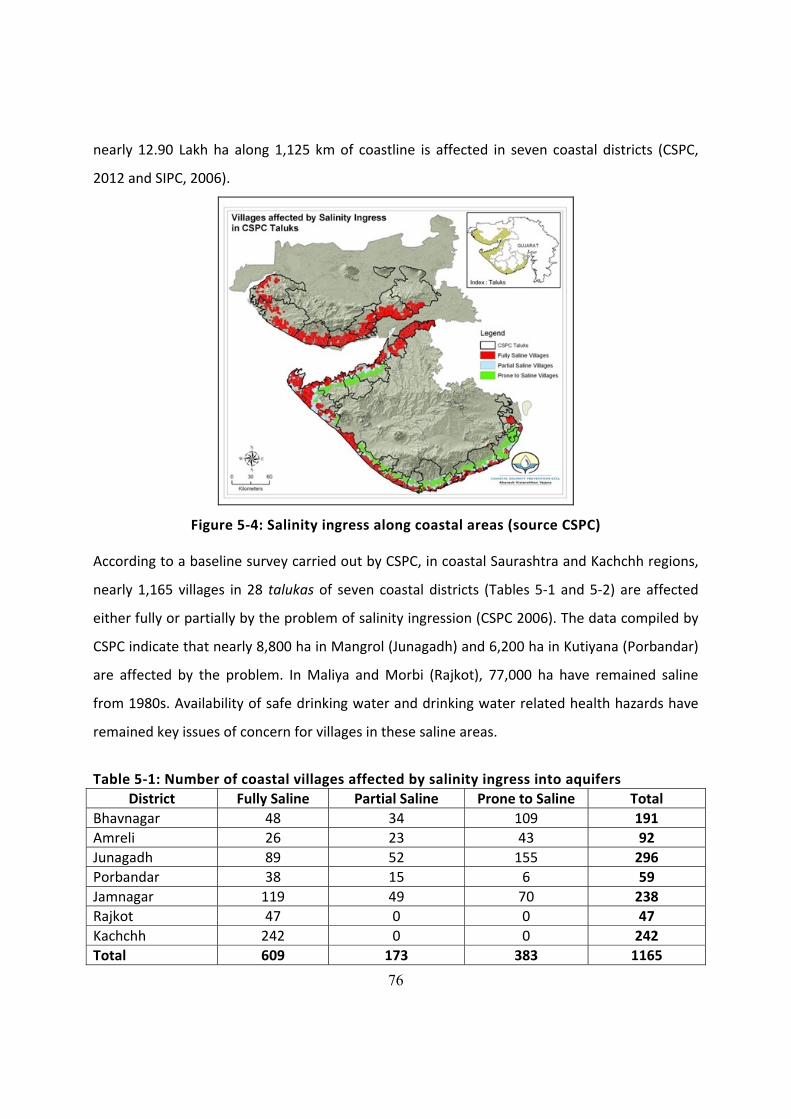
76
nearly 12.90 Lakh ha along 1,125 km of coastline is affected in seven coastal districts (CSPC,
2012 and SIPC, 2006).
Figure 5‐4: Salinity ingress along coastal areas (source CSPC) According to a baseline survey carried out by CSPC, in coastal Saurashtra and Kachchh regions,
nearly 1,165 villages in 28 talukas of seven coastal districts (Tables 5‐1 and 5‐2) are affected
either fully or partially by the problem of salinity ingression (CSPC 2006). The data compiled by
CSPC indicate that nearly 8,800 ha in Mangrol (Junagadh) and 6,200 ha in Kutiyana (Porbandar)
are affected by the problem. In Maliya and Morbi (Rajkot), 77,000 ha have remained saline
from 1980s. Availability of safe drinking water and drinking water related health hazards have
remained key issues of concern for villages in these saline areas.
Table 5‐1: Number of coastal villages affected by salinity ingress into aquifers
District Fully Saline Partial Saline Prone to Saline Total Bhavnagar 48 34 109 191 Amreli 26 23 43 92 Junagadh 89 52 155 296 Porbandar 38 15 6 59 Jamnagar 119 49 70 238 Rajkot 47 0 0 47 Kachchh 242 0 0 242 Total 609 173 383 1165
77
Source: CSPC (2006) ‐ Baseline Study Table 5‐2: Talukas affected by salinity ingress into coastal aquifers District Salinity Ingression Affected Talukas Bhavnagar Bhavnagar, Ghogha, Mahuva, TalajaAmreli Jafrabad, Rajula Junagadh Kodinar, Maliya, Mangrol, Una, VeravalPorbandar Kutiyana, Ranavav, Porbandar Jamnagar Jamnagar, Jodiya, Kalyanpur, Khambhaliya, Lalpur, OkhaMandal Rajkot Maliya Kachchh Bhachau, Mandvi, Abdasa, Anjar, Rapar, Lakhpat, Mundra Source: CSPC (2006) ‐ Baseline Study The available data indicate that the ground water in 379 villages out of 954 villages (40%) has
ground water with TDS above 2000 mg per litre through the year. In nearly 177 villages the
ground water becomes saline (> 2000 mg per litre) during the summer months. In 398 villages,
the ground water has TDS less than 2000 mg per litre throughout the year (CSPC, 2007‐08).

78
79
6 Responses 6.1 Biodiversity Conservation
6.1.1 Protected Areas
In order to protect and conserve the floral and faunal elements of the coastal and marine
region and also to preserve the ecological integrity of some of the representative habitats of
coastal tracts, establishment of network of protected areas (PA) is a well adopted strategy. In
ecological terms, the PAs are considered as ‘source’ system, with better population of rare and
endangered species of flora and fauna. Often the source population disperses in other receiving
areas and in the process cause genetic mixing with other nearby source or residual populations.
For effective conservation, such holistic and landscape view are quite pertinent while designing
PA networks.
In the context of coastal and marine areas of Gujarat, PAs can be divided into two major types,
based on their location. Firstly, the PAs located on or very close to the coast and are, thus,
influenced by coastal and marine processes like diurnal or seasonal tides. Second, those PAs
which are located slightly away from coast towards the mainland and from these PAs many
wildlife species disperse to coastal areas and use different habitats therein. Often such
dispersion facilitates sufficient mixing of population and thus genetic materials between
mainland and coastal populations. In a sense, these inland PAs had some functional ecological
linkages with coastal areas and thus play enough roles in defining conservation values of coastal
tracts of Gujarat.
Keeping above in view, 39 coastal talukas of Gujarat support eleven protected areas including
three National Parks and eight wildlife sanctuaries (Fig. 6‐1; Table 6‐1). Out of these, only Gulf
of Kachchh‐ Marine National Park & Sanctuary (MNPS) is exclusively created for conservation
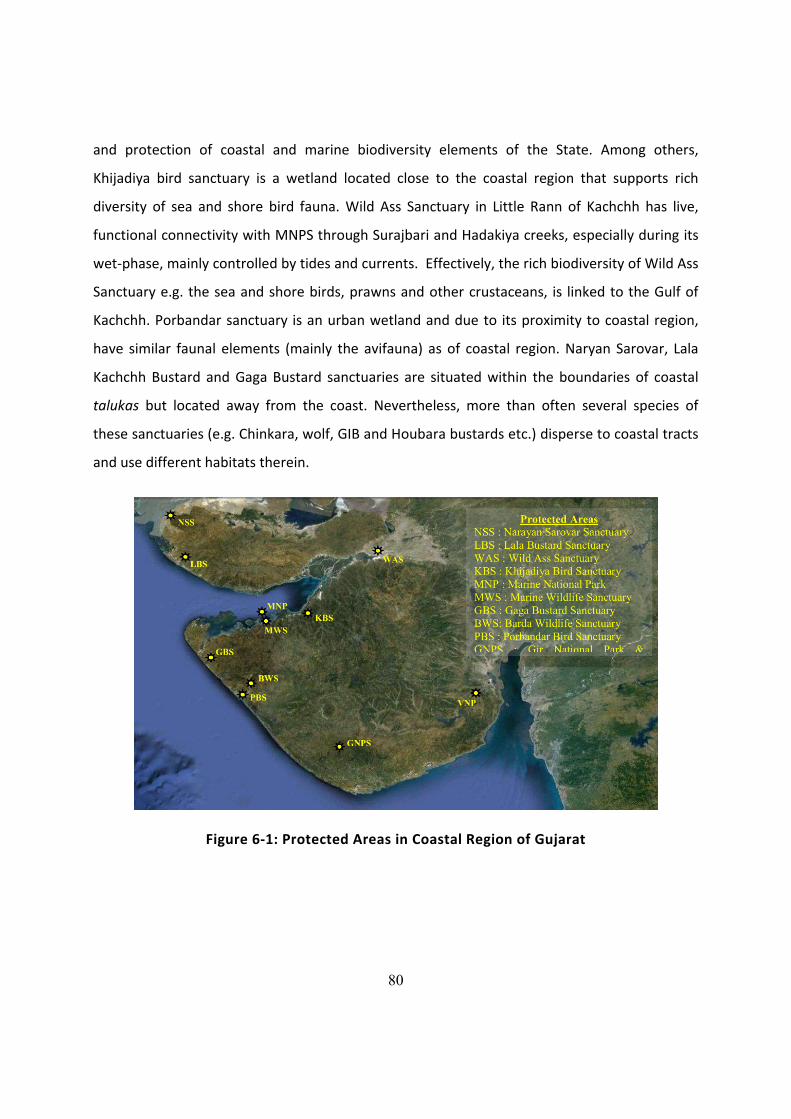
80
and protection of coastal and marine biodiversity elements of the State. Among others,
Khijadiya bird sanctuary is a wetland located close to the coastal region that supports rich
diversity of sea and shore bird fauna. Wild Ass Sanctuary in Little Rann of Kachchh has live,
functional connectivity with MNPS through Surajbari and Hadakiya creeks, especially during its
wet‐phase, mainly controlled by tides and currents. Effectively, the rich biodiversity of Wild Ass
Sanctuary e.g. the sea and shore birds, prawns and other crustaceans, is linked to the Gulf of
Kachchh. Porbandar sanctuary is an urban wetland and due to its proximity to coastal region,
have similar faunal elements (mainly the avifauna) as of coastal region. Naryan Sarovar, Lala
Kachchh Bustard and Gaga Bustard sanctuaries are situated within the boundaries of coastal
talukas but located away from the coast. Nevertheless, more than often several species of
these sanctuaries (e.g. Chinkara, wolf, GIB and Houbara bustards etc.) disperse to coastal tracts
and use different habitats therein.
Figure 6‐1: Protected Areas in Coastal Region of Gujarat
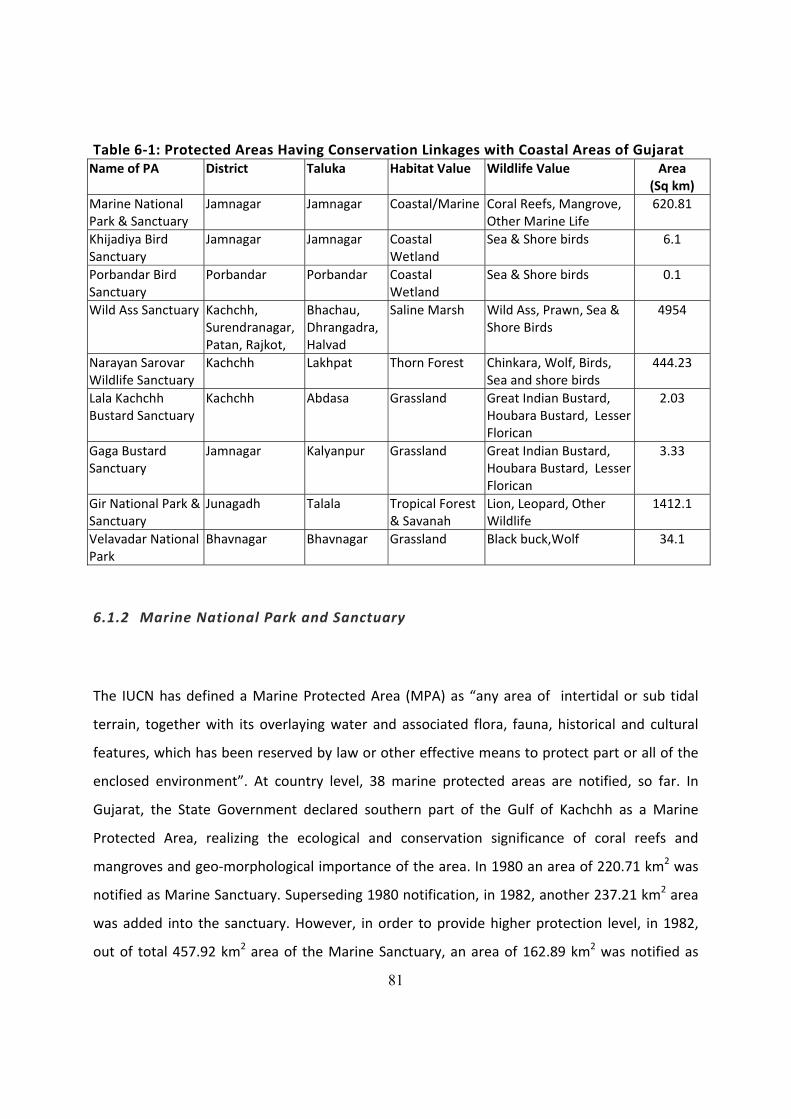
81
Table 6‐1: Protected Areas Having Conservation Linkages with Coastal Areas of Gujarat Name of PA District Taluka Habitat Value Wildlife Value Area
(Sq km) Marine National Park & Sanctuary
Jamnagar Jamnagar Coastal/Marine Coral Reefs, Mangrove, Other Marine Life
620.81
Khijadiya Bird Sanctuary
Jamnagar Jamnagar Coastal Wetland
Sea & Shore birds 6.1
Porbandar Bird Sanctuary
Porbandar Porbandar Coastal Wetland
Sea & Shore birds 0.1
Wild Ass Sanctuary Kachchh, Surendranagar, Patan, Rajkot,
Bhachau, Dhrangadra, Halvad
Saline Marsh Wild Ass, Prawn, Sea & Shore Birds
4954
Narayan Sarovar Wildlife Sanctuary
Kachchh Lakhpat Thorn Forest Chinkara, Wolf, Birds, Sea and shore birds
444.23
Lala Kachchh Bustard Sanctuary
Kachchh Abdasa Grassland Great Indian Bustard, Houbara Bustard, Lesser Florican
2.03
Gaga Bustard Sanctuary
Jamnagar Kalyanpur Grassland Great Indian Bustard, Houbara Bustard, Lesser Florican
3.33
Gir National Park & Sanctuary
Junagadh Talala Tropical Forest & Savanah
Lion, Leopard, Other Wildlife
1412.1
Velavadar National Park
Bhavnagar Bhavnagar Grassland Black buck,Wolf 34.1
6.1.2 Marine National Park and Sanctuary
The IUCN has defined a Marine Protected Area (MPA) as “any area of intertidal or sub tidal
terrain, together with its overlaying water and associated flora, fauna, historical and cultural
features, which has been reserved by law or other effective means to protect part or all of the
enclosed environment”. At country level, 38 marine protected areas are notified, so far. In
Gujarat, the State Government declared southern part of the Gulf of Kachchh as a Marine
Protected Area, realizing the ecological and conservation significance of coral reefs and
mangroves and geo‐morphological importance of the area. In 1980 an area of 220.71 km2 was
notified as Marine Sanctuary. Superseding 1980 notification, in 1982, another 237.21 km2 area
was added into the sanctuary. However, in order to provide higher protection level, in 1982,
out of total 457.92 km2 area of the Marine Sanctuary, an area of 162.89 km2 was notified as
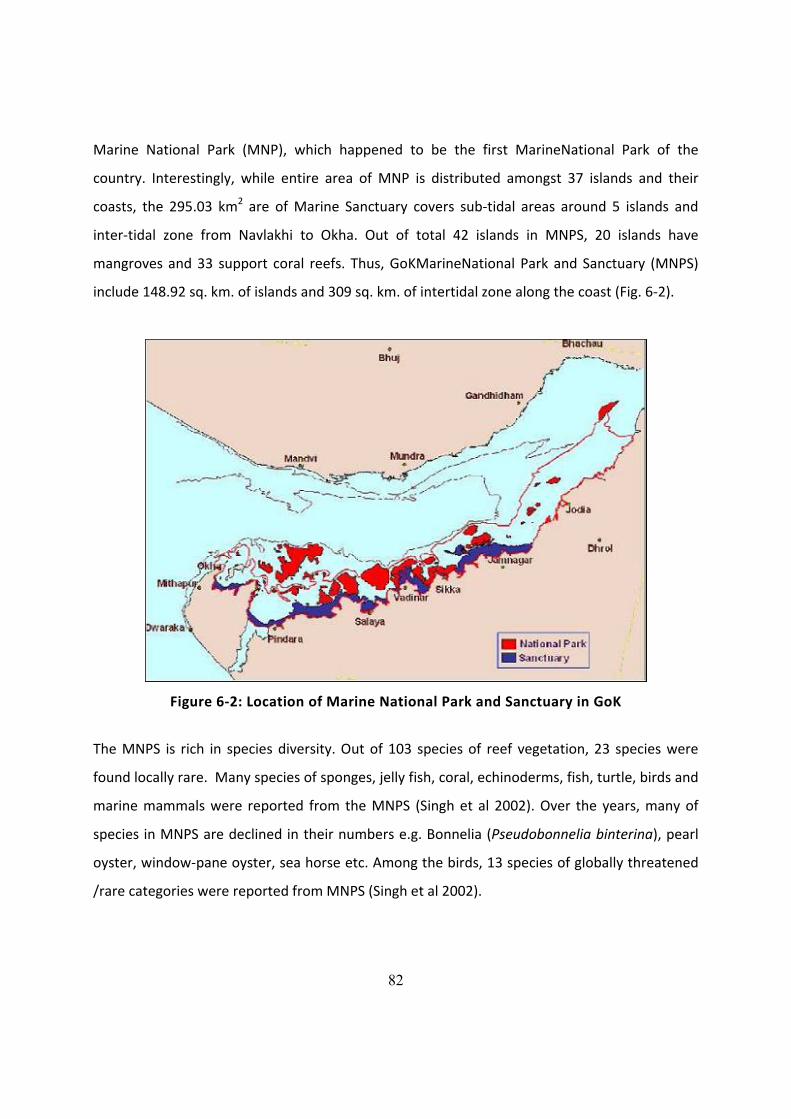
82
Marine National Park (MNP), which happened to be the first MarineNational Park of the
country. Interestingly, while entire area of MNP is distributed amongst 37 islands and their
coasts, the 295.03 km2 are of Marine Sanctuary covers sub‐tidal areas around 5 islands and
inter‐tidal zone from Navlakhi to Okha. Out of total 42 islands in MNPS, 20 islands have
mangroves and 33 support coral reefs. Thus, GoKMarineNational Park and Sanctuary (MNPS)
include 148.92 sq. km. of islands and 309 sq. km. of intertidal zone along the coast (Fig. 6‐2).
Figure 6‐2: Location of Marine National Park and Sanctuary in GoK
The MNPS is rich in species diversity. Out of 103 species of reef vegetation, 23 species were
found locally rare. Many species of sponges, jelly fish, coral, echinoderms, fish, turtle, birds and
marine mammals were reported from the MNPS (Singh et al 2002). Over the years, many of
species in MNPS are declined in their numbers e.g. Bonnelia (Pseudobonnelia binterina), pearl
oyster, window‐pane oyster, sea horse etc. Among the birds, 13 species of globally threatened
/rare categories were reported from MNPS (Singh et al 2002).
83
It is also important to note that while Gujarat coastline constitutes about 21.3% of entire Indian
coastline and about 10% of area of country’s Exclusive Economic Zone, it has just one Marine
Protected Area out of total 38 declared so far at country level. The overall responsibility of
management of MNPS lies with State Forest Department. However, due to presence of
unprotected open water and dotted with many private and public sector coastal infrastructure
projects, there are quite a few agencies that also had jurisdictional authority in the area (for
example Gujarat Maritime Board, Indian Coast Guard, Custom and Fisheries Dept.).The Gulf of
Kachchh MNPS was notified way back in 1982. In year 2000, Wildlife Institute of India
recommend that about 20sq km in the Gulf of Khambhat and about 50 sq km around Kori Creek
in western Kachchh, needs to be notified under marine protected area system.
6.1.3 Whale Shark Conservation
In early eighties, there were no reports of commercial harvesting of the whale shark in the
region (Compagno, 1984). But, Rao (1986) observed existence of a small harpoon fishery for
the whale shark at Veraval and immediately after that whale shark fishing had gained the
momentum. Vivekananadan and Zala (1994) reported that during a period of four years (1988‐
1991), a total of 647 whale sharks were captured and killed. A report by TRAFFIC India in 2001
documented a total of 600 whale shark landings between March 1999 and May 2000. Fishing
harbour of Veraval in Juangadh district was in the centre of affairs.
In 1999, the whale shark was listed on Appendix II of the Convention on Migratory Species
(CMS). This relates to migratory species that need or would significantly benefit from the
implementation of international cooperative agreements for its conservation and management
are listed in Appendix II of the Convention. Recognizing this grave threat to the survival of
whale shark, and to provide legal protection, in 2001Central Govt. has included it under

84
Schedule I of Wildlife Protection Act (1972). In the year 2002, the fish was also included in
Appendix II of the CITES (Convention on International Trade in Endangered Species).
Despite getting such legal protection and ban, hunting was continued though not as openly as
before. Clearly, the fishermen community was not ready to forgo their profits. Strong
communication and outreach efforts were felt necessary in order to engage fishermen and
other local communities for effective the ban on whale shark hunting. A ‘save the whale shark’
campaign was undertaken jointly by State Forest Department, Wildlife Trust of India (New
Delhi), Tata Chemicals Ltd (Fig. 6‐3). More importantly, famous spiritual leader Sri Morari Bapu
was also actively associated with the campaign and play major role in convincing the fishermen
to recognize whale sharks as their own ‘vhalis’ ‐ their own married daughters who come to
their parents for delivering their first baby. As a result of concerted campaign, more than 5000
persons including the fishermen, school children, NGOs, local administration etc pledged the
protection of whale shark. Gujarat State Forest Department also announced a monetary
compensation of Rupees 25,000 for each net that gets damaged in attempts to save the whale
shark. After the initiation of campaign, between 2005 and 2008, a total of 87 stranded whale
sharks were rescued and released by fishermen: 43 from Veraval, 27 from Sutrapada, 12 from
Dhamlej, 4 from Hirakot and 1 from Madhvad.
Figure 6‐3: Life‐like rubber model, during one of the ‘save the whale shark’ campaigns
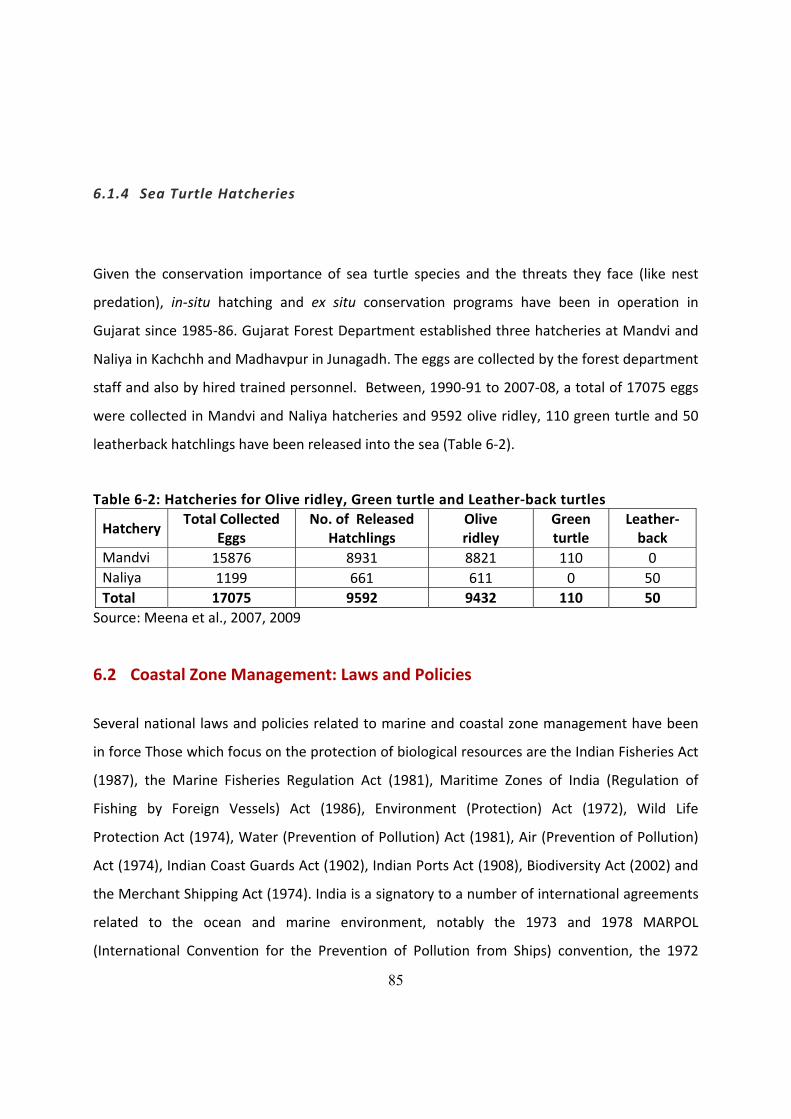
85
6.1.4 Sea Turtle Hatcheries
Given the conservation importance of sea turtle species and the threats they face (like nest
predation), in‐situ hatching and ex situ conservation programs have been in operation in
Gujarat since 1985‐86. Gujarat Forest Department established three hatcheries at Mandvi and
Naliya in Kachchh and Madhavpur in Junagadh. The eggs are collected by the forest department
staff and also by hired trained personnel. Between, 1990‐91 to 2007‐08, a total of 17075 eggs
were collected in Mandvi and Naliya hatcheries and 9592 olive ridley, 110 green turtle and 50
leatherback hatchlings have been released into the sea (Table 6‐2).
Table 6‐2: Hatcheries for Olive ridley, Green turtle and Leather‐back turtles
Hatchery Total Collected
Eggs No. of Released
Hatchlings Olive ridley
Green turtle
Leather‐back
Mandvi 15876 8931 8821 110 0 Naliya 1199 661 611 0 50 Total 17075 9592 9432 110 50
Source: Meena et al., 2007, 2009
6.2 Coastal Zone Management: Laws and Policies
Several national laws and policies related to marine and coastal zone management have been
in force Those which focus on the protection of biological resources are the Indian Fisheries Act
(1987), the Marine Fisheries Regulation Act (1981), Maritime Zones of India (Regulation of
Fishing by Foreign Vessels) Act (1986), Environment (Protection) Act (1972), Wild Life
Protection Act (1974), Water (Prevention of Pollution) Act (1981), Air (Prevention of Pollution)
Act (1974), Indian Coast Guards Act (1902), Indian Ports Act (1908), Biodiversity Act (2002) and
the Merchant Shipping Act (1974). India is a signatory to a number of international agreements
related to the ocean and marine environment, notably the 1973 and 1978 MARPOL
(International Convention for the Prevention of Pollution from Ships) convention, the 1972
86
London Dumping Convention, 1969 Convention on Civil Liability for Oil Pollution Damages and
its Protocol in 1976 and 1979, and the 1972 Convention on Biodiversity. All the states in the
Indian Union have to abide these agreements and conventions.
6.3 Coastal Regulation and Management
Costal Regulation Zone (CRZ)
In accordance with the notification of Ministry of Environment & Forest, Government of India
under the Environment Protection Act (1986), declaring coastal stretches as Costal Regulation
Zone (CRZ) and regulating activity in CRZ. It also states that all State Governments should
identify and classify CRZ areas in their respective territories in accordance with the guidelines
given in the said notification.
Based on the recommendation of an expert committee chaired by Prof M. S. Swaminathan,
Government of India suggested replacing the present CRZ notification with a Coastal Zone
Management Notification to facilitate sustainable development of the coastal regions including
coastal resources. The proposed CZM notification 2007 includes offshore areas extending up to
12 nautical miles extending from an appropriate baseline for management purpose.
Gujarat Coastal Zone Management Authority (GCZMA)
On 9th July, 2009, under the Environment (Protection) Act, the Ministry of Environment and
Forests, Government of India, constituted Gujarat Coastal Zone Management Authority. The
GCZMA includes 15 members from various State Government Department, Experts from
various fields and NGOs under the chairmanship of Additional Chief Secretary/Principal
Secretary/ Secretary, Forests and Environment Department, Government of Gujarat.
Some of the recent activities undertaken by GCZMA are as follows:

87
1. Make it mandatory to undertake mangrove plantation under CSR schemes as part of
CRZ clearance for any project
2. Develop bio‐shield on the southern coast between Dahej in Bharuch district and Hazira
in Surat district including the northern portion of the Narmada estuary. A study to this
effect has been assigned to MS University, Vadodara.
3. Organized workshop on CRZ Notification (2011) to understand and acquaint all the CF
and DCF rank officers about the provisions of CRZ Notification
4. Initiated the preparation of Gujarat Coastal Zone Management Plan with the technical
support from BISAG, Gandhinagar.
5. Requested concerned authorities and departments to prepare action plans for phasing
out disposal of untreated effluent/sewage/solid waste into CRZ area.
6. Declared Dandi as Ecologically Sensitive Area and National Heritage by the Ministry of
Environment and Forests, Government of India
7. Initiated study on Shoreline Changes along Gujarat Coast with the technical support
from MS University, Vadodara.
8. Declared High Erosion prone area as “No‐Go areas” and formal request has been made
to PCCF to take up plantation activities.
6.4 Implementation of ICZMP
The Gujarat ICZMP consists of capacity building of the State Government, including the State
Pollution Control Board, for effective management of the coastal areas. The project has three
components viz. a) Vulnerability assessment or hazard line mapping, b) Capacity building of
state and national constituencies (national component), & c) Pilot investments in the three
states to facilitate cross‐sectoral learning and joint implementation (State Component).
Pilot studies will be undertaken on the ICZM approach for the coastline of the Gulf of Kachchh.
Further, transplantation of corals in the Gulf of Kachchh and sewage treatment facilities for

88
Jamnagar District are being undertaken. This component also support priority investments in
Gujarat, all located in the Gulf of Kachchh, to complement the ICZMP. Under the project a
Green Action for National Dandi Heritage Initiative (GANDHI) has also been initiated in July
2010.
Project has several unique features such as for the first time transplantation of corals in an area
of 2,000 sq m, mangrove plantation on 15,000 hectare, establishment of sewage treatment
plant in Jamnagar with an investment of Rs 100 crores, eco‐tourism development in Gulf of
Kachchh and the establishment of national level institute for marine bio‐diversity.
The project implementation recognizes the importance of community‐based‐organization in the
sustainable management of coastal resources. In view of this, activities involving coastal
communities have been initiated in about 160 villages for improvement of socio‐economic
conditions and to promote environmentally sound practices. Among the activities is
establishing mangrove plantations in Jamanagar & Kutch districts with the participation of
about 20 community organizations.
6.5 Pollution Abatement Measures
6.5.1 Effluent Treatment Plants
Effluent treatment plants are a primary mitigation measure and as per GPCB, at present there
are 6,340 effluent treatment plants (individual and common) functioning in the state. Since
many of the smaller industries are unable to maintain individual treatment plants, clusters of
small and medium industries, located mainly in the GIDC estates, have set up Common Effluent
Treatment Plants (CETP) that are run as separate enterprise, cooperative or under GIDC. Much
of the uncontrolled emissions and effluent discharges are emanating from the small & medium
industries and CETP is considered as the main mitigation mechanism for these industries.
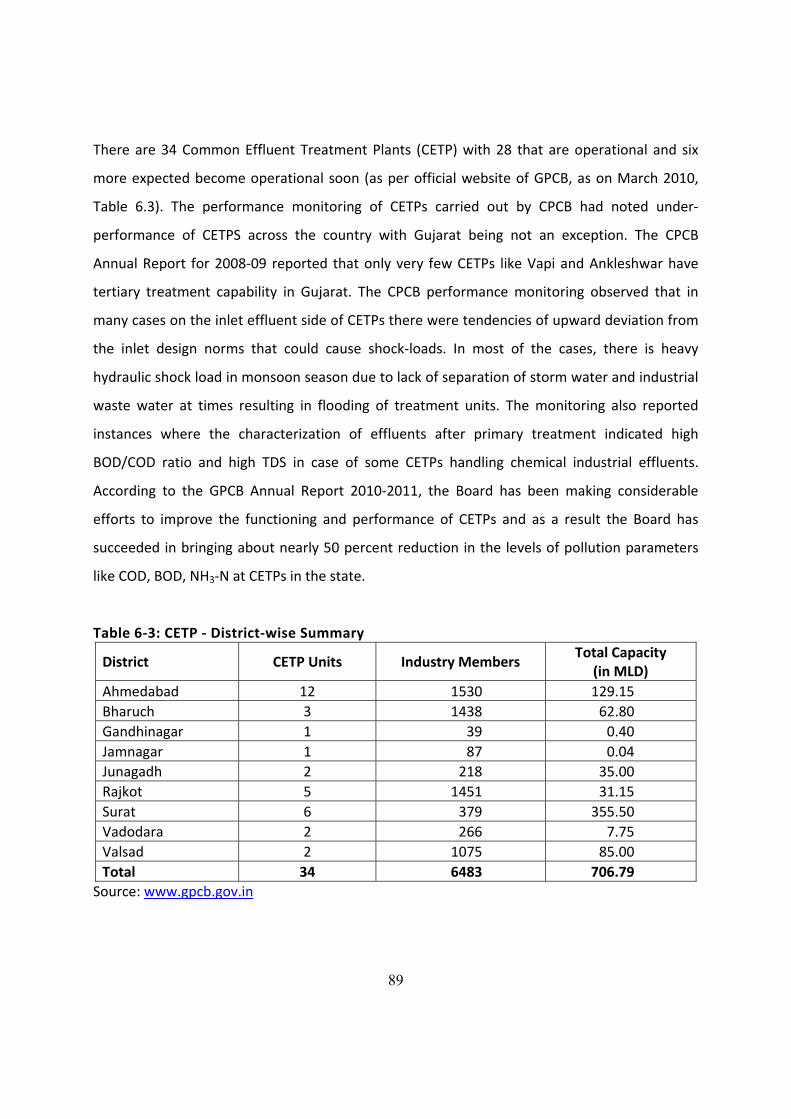
89
There are 34 Common Effluent Treatment Plants (CETP) with 28 that are operational and six
more expected become operational soon (as per official website of GPCB, as on March 2010,
Table 6.3). The performance monitoring of CETPs carried out by CPCB had noted under‐
performance of CETPS across the country with Gujarat being not an exception. The CPCB
Annual Report for 2008‐09 reported that only very few CETPs like Vapi and Ankleshwar have
tertiary treatment capability in Gujarat. The CPCB performance monitoring observed that in
many cases on the inlet effluent side of CETPs there were tendencies of upward deviation from
the inlet design norms that could cause shock‐loads. In most of the cases, there is heavy
hydraulic shock load in monsoon season due to lack of separation of storm water and industrial
waste water at times resulting in flooding of treatment units. The monitoring also reported
instances where the characterization of effluents after primary treatment indicated high
BOD/COD ratio and high TDS in case of some CETPs handling chemical industrial effluents.
According to the GPCB Annual Report 2010‐2011, the Board has been making considerable
efforts to improve the functioning and performance of CETPs and as a result the Board has
succeeded in bringing about nearly 50 percent reduction in the levels of pollution parameters
like COD, BOD, NH3‐N at CETPs in the state.
Table 6‐3: CETP ‐ District‐wise Summary
District CETP Units Industry Members Total Capacity
(in MLD) Ahmedabad 12 1530 129.15 Bharuch 3 1438 62.80 Gandhinagar 1 39 0.40 Jamnagar 1 87 0.04 Junagadh 2 218 35.00 Rajkot 5 1451 31.15 Surat 6 379 355.50 Vadodara 2 266 7.75 Valsad 2 1075 85.00 Total 34 6483 706.79
Source: www.gpcb.gov.in
90
6.5.2 Coastal Ocean Monitoring and Prediction System (COMAPS)
The Government of India, in the Ministry of Earth Sciences (formerly Ministry of Ocean
Development) has been monitoring the levels of marine pollution at about 80 locations along
the coastline of the country. The COMAPS has major objectives to assess status and trend of
coastal marine environmental quality on a long term basis and to alert government and public
institutions, of their implications. The program is running 1991‐92 onwards and covered nearly
25 environmental parameters for monitoring purpose. In Gujarat, the program is run by CPCB
and GPCB with the help of CSMCRI, Bhavnagar. The COMAPS gathers data through 33
monitoring locations once in a year of which six are in Gujarat (Kandla, Porbandar, Mundra,
Vadinar, Okha and Pipav). The program monitors 32 coastal locations once in two years of
which two are in Gujarat (Vadinar and Dwarka). Nationally data is gathered from 19 "hot spots"
every three seasons in a year and of these two are in Gujarat (Veraval and Tapi).
6.5.3 Action Plan for Critically Polluted Areas in Gujarat
GPCB undertake a more rigorous and systematic monitoring approach of water and ambient air
quality in different areas where pollution risk is high. For the purpose six industrial clusters viz.
Ahmedabad, Vatva, Vapi, Junagadh, Bhavnagar were identified by GPCB. Detailed action plan
for pollution control of these clusters has already been prepared.
6.6 Mangrove Plantation
While there were many reports of diversion of mangroves in the State, the satellite imagery
based assessment of FSI revealed an increase in mangrove cover during the last decade (i.e.
2001 to 2009). Actually, after the cyclones of 1998 and 1999 in the state itself and tsunami in
Tamil Nadu and other parts of country, the importance of mangroves has been recognized as
‘bio‐shields’. Thus, State government gave high priority for conservation and restoration of
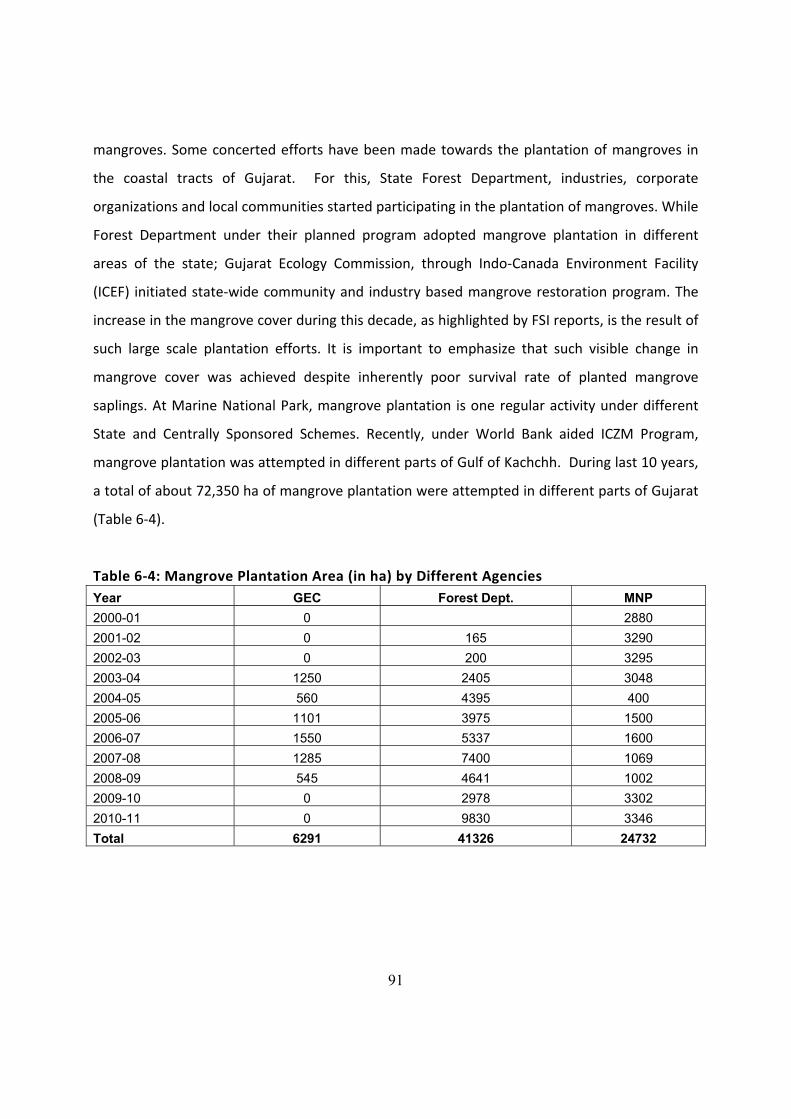
91
mangroves. Some concerted efforts have been made towards the plantation of mangroves in
the coastal tracts of Gujarat. For this, State Forest Department, industries, corporate
organizations and local communities started participating in the plantation of mangroves. While
Forest Department under their planned program adopted mangrove plantation in different
areas of the state; Gujarat Ecology Commission, through Indo‐Canada Environment Facility
(ICEF) initiated state‐wide community and industry based mangrove restoration program. The
increase in the mangrove cover during this decade, as highlighted by FSI reports, is the result of
such large scale plantation efforts. It is important to emphasize that such visible change in
mangrove cover was achieved despite inherently poor survival rate of planted mangrove
saplings. At Marine National Park, mangrove plantation is one regular activity under different
State and Centrally Sponsored Schemes. Recently, under World Bank aided ICZM Program,
mangrove plantation was attempted in different parts of Gulf of Kachchh. During last 10 years,
a total of about 72,350 ha of mangrove plantation were attempted in different parts of Gujarat
(Table 6‐4).
Table 6‐4: Mangrove Plantation Area (in ha) by Different Agencies Year GEC Forest Dept. MNP 2000-01 0 2880 2001-02 0 165 3290 2002-03 0 200 3295 2003-04 1250 2405 3048 2004-05 560 4395 400 2005-06 1101 3975 1500 2006-07 1550 5337 1600 2007-08 1285 7400 1069 2008-09 545 4641 1002 2009-10 0 2978 3302 2010-11 0 9830 3346 Total 6291 41326 24732
92
6.7 Coral Reef Transplantation In response to halt the process of coral reef degradation and to improve the extent of coral
reefs in Gujarat, recently under World Bank funded Integrated Coastal Zone Management
Program (ICZMP) experimental efforts had been initiated to transplant coral reefs in some parts
of Gulf of Kachchh. GEER Foundation did initiate experiment in March 2012 and transplants
four locally abundant species viz. Favia favus, Favia speciosa, Porites lutea and Porites
compressa. Similar experiments had also been initiated by Wildlife Trust of India and planned to
transplant and recover two species of Acropora that are extinct locally.
6.8 Initiation of National Centre for Marine Biodiversity (NCMB)
Realizing the need of a dedicated research centre in the country in the area of marine bio‐
diversity is vital for effective coastal management approaches. Thus, MoEF in collaboration
with Society for Integrated Coastal Management (SICOM), Gujarat Ecology Commission (GEC)
and Marine National Park & Sanctuary (MNP&S), Jamnagar, initiated development of a central
repository of information and knowledge on best practices developed for marine bio‐diversity
conservation & management globally & in India. The centre is being established near in
Jamnagar. The overall goal of the NCMB is to support integrated management of coastal and
marine bio‐diversity and its environment for better livelihood security, sustainable
development, and hazards risk management.
6.9 Resource inventories and data base creation
Recognizing the ecological importance of mangroves and coral reefs, GEC has initiated mapping
and resource inventories. Detailed atlas of mangroves and coral reefs along Gujarat coast has
developed as part of this effort.
93
6.10 Vessel Traffic & Port Management System
Considering the safety and security of the area in lieu of overall holistic development,
Government of Gujarat & Gujarat Maritime Board has set up one of the most modernized
Vessel Traffic & Port Management System (VTPMS). Accordingly, all maritime vessel traffic is
being monitored by a state‐of‐the‐art Vessel Traffic & Port Management System (VTPMS). The
system provides complete surface water surveillance with two Emergency Response Centers,
one at Coast Guard and one at GMB H.O., Gandhinagar. The VTPMS System includes:
• Radar coverage in the entire Gulf, all navigation channels, port approaches and
anchorages
• AIS coverage in the entire Gulf
• VHF coverage in the entire Gulf
• Metrological & Hydrological sensors at selected locations
• Microwave communication for data transfer
• Directional Finder stations
• Port Management data free to GMB & private port & jetty users
• VTPMS Master Control Station (MCS) & Coast Guard Station for surveillance
6.11 Human Development: Sagar Khedu Sarvangi Vikas Yojna State Government had initiated an integrated and holistic Human Development program with
12 point agenda including, skill up‐gradation, employment generation, education, health,
drinking water housing, soil conservation, water management, electrification, capacity building,
development of salt pan workers (Agarias) and national security (Table 6‐5). The program
covers about 3000 villages in 38 talukas of 13 coastal districts. The program target about 6
million populations with allocated budget of Rs. 16000 crores under State’s 11th Five year Plan.
Importantly, out of total allocation about Rs. 9788 crores were planned to invest through
Public‐Private Partnership (PPP). In first three years (i.e. between 2007‐08 to 2009‐10) at total
of Rs. 627 crores was invested so far in several socio‐economic development programs and

94
various schemes specific to coastal tracts e.g. check dam creation, pond making, sea erosion
control works, tidal regulators, anti‐sea ingression schemes etc.
Table 6‐5: Annual Allocation (Rs. in Crore) under Sagar Khedu Sarvangi Vikas Yojna Department/ Board/ PPP 2007‐08 2008‐09 2009‐10 2010‐11 2011‐12 Total
Water Supply 152.00 222.22 229.00 220.00 200.00 1023.22 Water Resources 220.00 184.71 192.39 230.63 185.87 1013.60 Roads and Building 436.00 150.00 150.00 317.07 158.66 1211.73 Panchayat 93.96 10.80 12.05 9.42 126.23 Rural Development 10.80 19.75 23.25 22.13 75.93 Energy and Petroleum 88.84 80.00 88.00 176.88 106.48 540.20 Agriculture 30.00 40.92 40.92 81.84 73.66 267.34 Fisheries 206.16 34.85 42.27 64.65 29.22 377.15Social Justice 85.00 39.20 45.07 47.61 216.88 Industries 43.80 39.30 45.63 128.73 general Administration 35.00 30.00 34.00 45.00 46.75 190.75 Home 58.42 19.00 12.90 14.52 6.17 111.01 Health & Family Welfare 11.04 9.13 17.69 23.30 18.54 79.70 Education 8.02 17.15 24.90 3.22 53.29 Labour and Employment 7.76 2.45 8.80 6.48 3.22 28.71 Women and Child 25.43 25.43 86.05 136.91 Urban Development 5.00 63.84 15.00 28.07 111.91Gujarat Maritime Board 31.81 124.89 148.55 290.00 595.25 PPP 3400.00 1922.75 1593.25 2872.00 9788.00 Total 1504.21 4327.16 3096.03 3127.28 4021.86 16076.54 Source: Sagar Khedu Sarvangi Vikas Yojana for Coastal Areas, GAD Planning Dept., Gandhinagar
6.12 Promotion of Coastal Tourism
Gujarat Tourism Corporation is promoting a wide array of tourism in Gujarat. Coastal and beach
based tourism is one of their major focus. Also, they promote nature based tourism in Gujarat.
In year 2010 and 2011, International Bird Watcher’s Conference was organized to attract large
numbers of amateur and professional bird watchers. Several beaches are adopted to promote
beach tourism. Some of the important beaches in Gujarat for tourism purpose include Gopnath
beach, Madhavpur beach, Porbandar beach, Chorwad beach, Tithal beach etc.
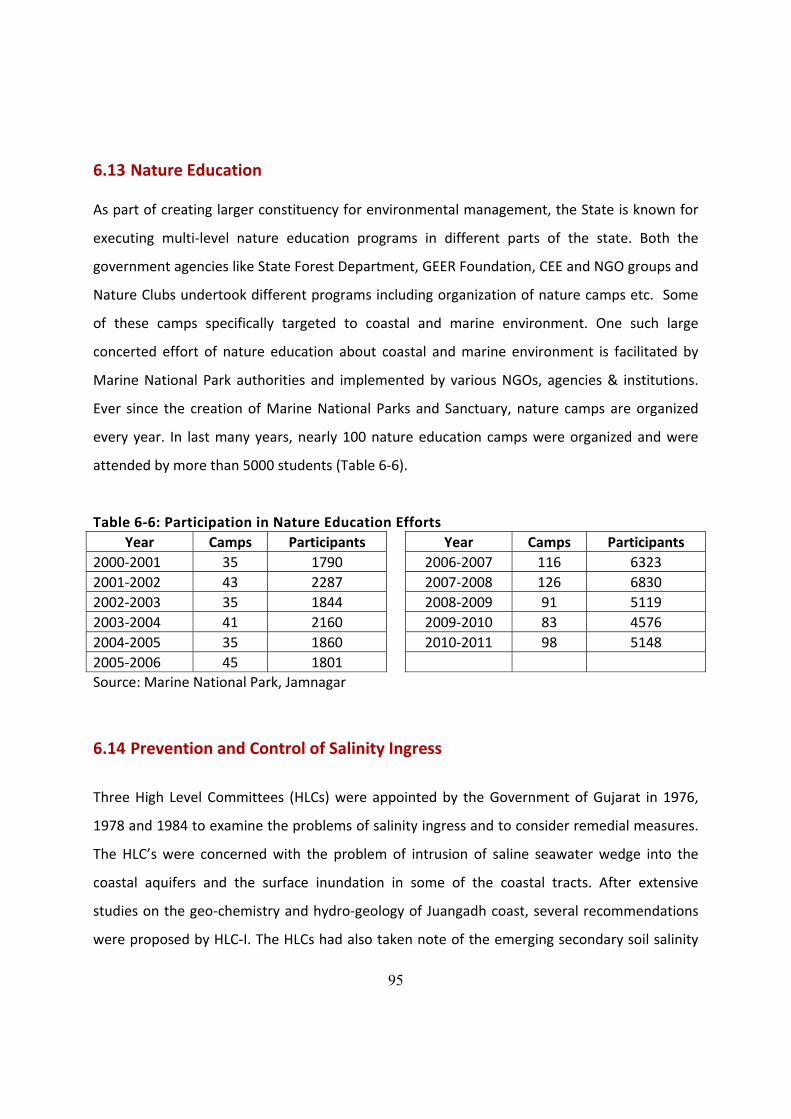
95
6.13 Nature Education As part of creating larger constituency for environmental management, the State is known for
executing multi‐level nature education programs in different parts of the state. Both the
government agencies like State Forest Department, GEER Foundation, CEE and NGO groups and
Nature Clubs undertook different programs including organization of nature camps etc. Some
of these camps specifically targeted to coastal and marine environment. One such large
concerted effort of nature education about coastal and marine environment is facilitated by
Marine National Park authorities and implemented by various NGOs, agencies & institutions.
Ever since the creation of Marine National Parks and Sanctuary, nature camps are organized
every year. In last many years, nearly 100 nature education camps were organized and were
attended by more than 5000 students (Table 6‐6).
Table 6‐6: Participation in Nature Education Efforts Year Camps Participants Year Camps Participants
2000‐2001 35 1790 2006‐2007 116 6323 2001‐2002 43 2287 2007‐2008 126 6830 2002‐2003 35 1844 2008‐2009 91 5119 2003‐2004 41 2160 2009‐2010 83 4576 2004‐2005 35 1860 2010‐2011 98 5148 2005‐2006 45 1801 Source: Marine National Park, Jamnagar
6.14 Prevention and Control of Salinity Ingress
Three High Level Committees (HLCs) were appointed by the Government of Gujarat in 1976,
1978 and 1984 to examine the problems of salinity ingress and to consider remedial measures.
The HLC’s were concerned with the problem of intrusion of saline seawater wedge into the
coastal aquifers and the surface inundation in some of the coastal tracts. After extensive
studies on the geo‐chemistry and hydro‐geology of Juangadh coast, several recommendations
were proposed by HLC‐I. The HLCs had also taken note of the emerging secondary soil salinity
96
problem arising out of the use of saline water for irrigation. The HLC’s pointed out that that the
use of saline waters would have serious consequences. The HLC’s were apprehensive that the
salt‐based industry, in particular the salt pans, are contributing significantly to the salinization
by improper disposal of salt wastes. The Salinity Ingression Prevention Schemes (SIPS) Circle
was established to oversee the control measures and to monitor the problem of salinity ingress.
Another step has been the activities of the Coastal Salinity Prevention Cell (CSPC), envisaged as
an initiative to bring together and strengthen various initiatives of government and civil society
organizations addressing the issue of salinity. The CSPC is a joint initiative of Government of
Gujarat, Aga Khan Rural Support Program (India), Ambuja Cement Foundation and Sir Ratan
Tata Trust.
The HLCs had proposed several control and preventive measures for adoption such as changing
the crop pattern, regulation of groundwater extraction and the implementation of groundwater
recharge techniques. The HLC had also proposed salinity control techniques such as
establishment of tidal regulators and creation of fresh water barriers. Partial measures are
adopted in some of those areas. There has been some limited success from the
implementation of various measures recommended by the HLCs. The efforts carried as per HLC
recommendations are summarised in Table 6‐7.
Table 6‐7: Summary of works carried out in HLC‐I and II reaches (As on 30‐09‐2011)
SN Measures carried out Completed Benefited area (ha)Direct and Indirect
Storage Capacity(MCM)
1 Tidal Regulators 12 17,170 174.815
2 Bandharas 26 13,717 65.23
3 Recharge Reservoirs 13 6,790 45.05
4 Checkdam 649 7,435 22.96
5 Recharge Tanks 18 1,993 1.32
6 Recharge Wells 397 0 0
7 Afforestation (ha) 5,867 0 0
8 Nalla Plugs 4,487 0 0
9 Spreading Channels (kms) 125 17,529 1.21
97
Source: Adapted from CEPT Report, State of Environment Report Gujarat 2012, Urban, Rural and Built Environment
According to a GWRDC study in 2007‐08 using ground water level and quality data of their fixed
observation wells, extents of salinity as well as salinity affected areas are changed in different
reaches. Between 1984 and 2008, the area affected by salinity ingression in the Bhavnagar‐Una
and Una‐Madhavpur reach declined by 13,600 and 15,000 ha, respectively. However, in
Madhavpur‐Maliya and Maliya‐Lakhpat reaches the affected area has increased by 4,000 and
6,600 ha, respectively. Overall, therefore, area affected by salinity ingress has decreased by
about 18,000 hectares.
6.15 Civil Society initiatives
With the inevitable increase of conflicts between environmental quality and rapid economic
development there has been raising awareness of the ecological issues by civil society in
general. This is reflected in the increased activism by civil society organizations and the large
number of environment related litigation. There is also greater involvement of civil society in
the public hearings mandated for environmental clearance of new projects. The new avenues
like the Right to Information (RTI) Act are used extensively to bring about greater public
accountability of both the government agencies and corporate houses.
6.16 Institutions Working on Coastal Area of Gujarat
There are several institutions and agencies associated with the development and management
of the coastal region of the state and the important ones are summarized in this section (Table
6‐8) with a brief description of the role and contribution of each.
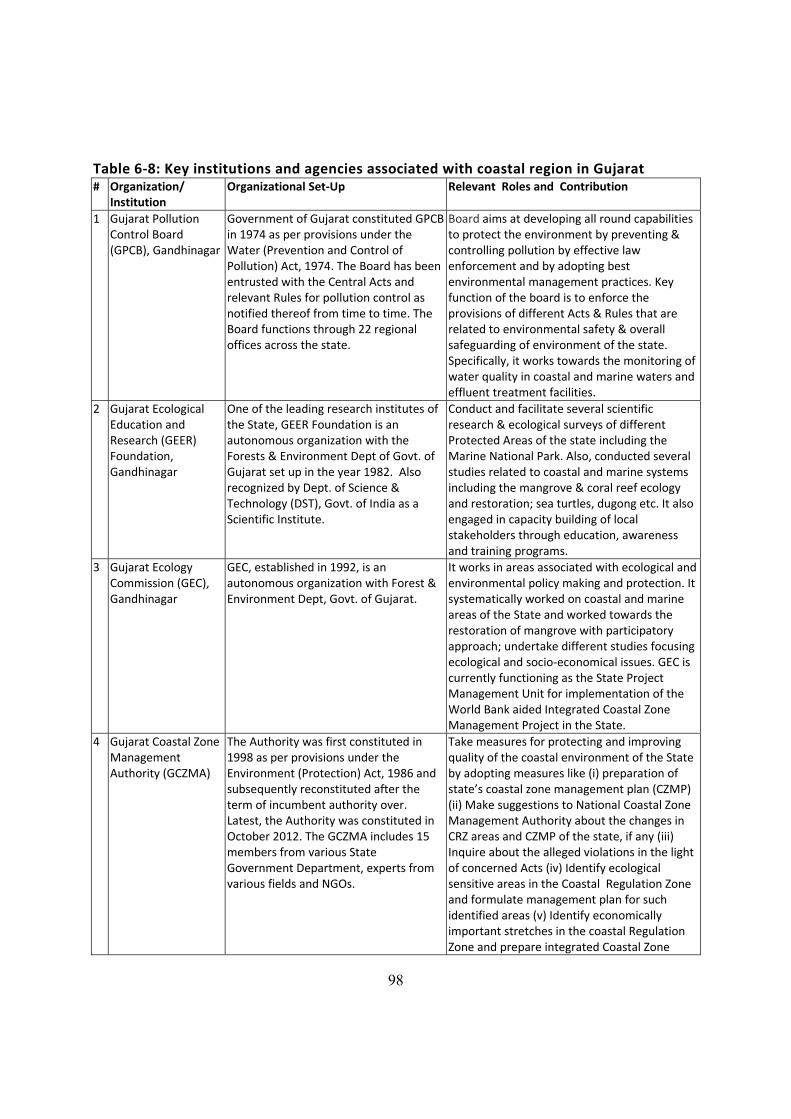
98
Table 6‐8: Key institutions and agencies associated with coastal region in Gujarat # Organization/
Institution Organizational Set‐Up Relevant Roles and Contribution
1 Gujarat Pollution Control Board (GPCB), Gandhinagar
Government of Gujarat constituted GPCB in 1974 as per provisions under the Water (Prevention and Control of Pollution) Act, 1974. The Board has been entrusted with the Central Acts and relevant Rules for pollution control as notified thereof from time to time. The Board functions through 22 regional offices across the state.
Board aims at developing all round capabilities to protect the environment by preventing & controlling pollution by effective law enforcement and by adopting best environmental management practices. Key function of the board is to enforce the provisions of different Acts & Rules that are related to environmental safety & overall safeguarding of environment of the state. Specifically, it works towards the monitoring of water quality in coastal and marine waters and effluent treatment facilities.
2 Gujarat Ecological Education and Research (GEER) Foundation, Gandhinagar
One of the leading research institutes of the State, GEER Foundation is an autonomous organization with the Forests & Environment Dept of Govt. of Gujarat set up in the year 1982. Also recognized by Dept. of Science & Technology (DST), Govt. of India as a Scientific Institute.
Conduct and facilitate several scientific research & ecological surveys of different Protected Areas of the state including the Marine National Park. Also, conducted several studies related to coastal and marine systems including the mangrove & coral reef ecology and restoration; sea turtles, dugong etc. It also engaged in capacity building of local stakeholders through education, awareness and training programs.
3 Gujarat Ecology Commission (GEC), Gandhinagar
GEC, established in 1992, is an autonomous organization with Forest & Environment Dept, Govt. of Gujarat.
It works in areas associated with ecological and environmental policy making and protection. It systematically worked on coastal and marine areas of the State and worked towards the restoration of mangrove with participatory approach; undertake different studies focusing ecological and socio‐economical issues. GEC is currently functioning as the State Project Management Unit for implementation of the World Bank aided Integrated Coastal Zone Management Project in the State.
4 Gujarat Coastal Zone Management Authority (GCZMA)
The Authority was first constituted in 1998 as per provisions under the Environment (Protection) Act, 1986 and subsequently reconstituted after the term of incumbent authority over. Latest, the Authority was constituted in October 2012. The GCZMA includes 15 members from various State Government Department, experts from various fields and NGOs.
Take measures for protecting and improving quality of the coastal environment of the State by adopting measures like (i) preparation of state’s coastal zone management plan (CZMP) (ii) Make suggestions to National Coastal Zone Management Authority about the changes in CRZ areas and CZMP of the state, if any (iii) Inquire about the alleged violations in the light of concerned Acts (iv) Identify ecological sensitive areas in the Coastal Regulation Zone and formulate management plan for such identified areas (v) Identify economically important stretches in the coastal Regulation Zone and prepare integrated Coastal Zone
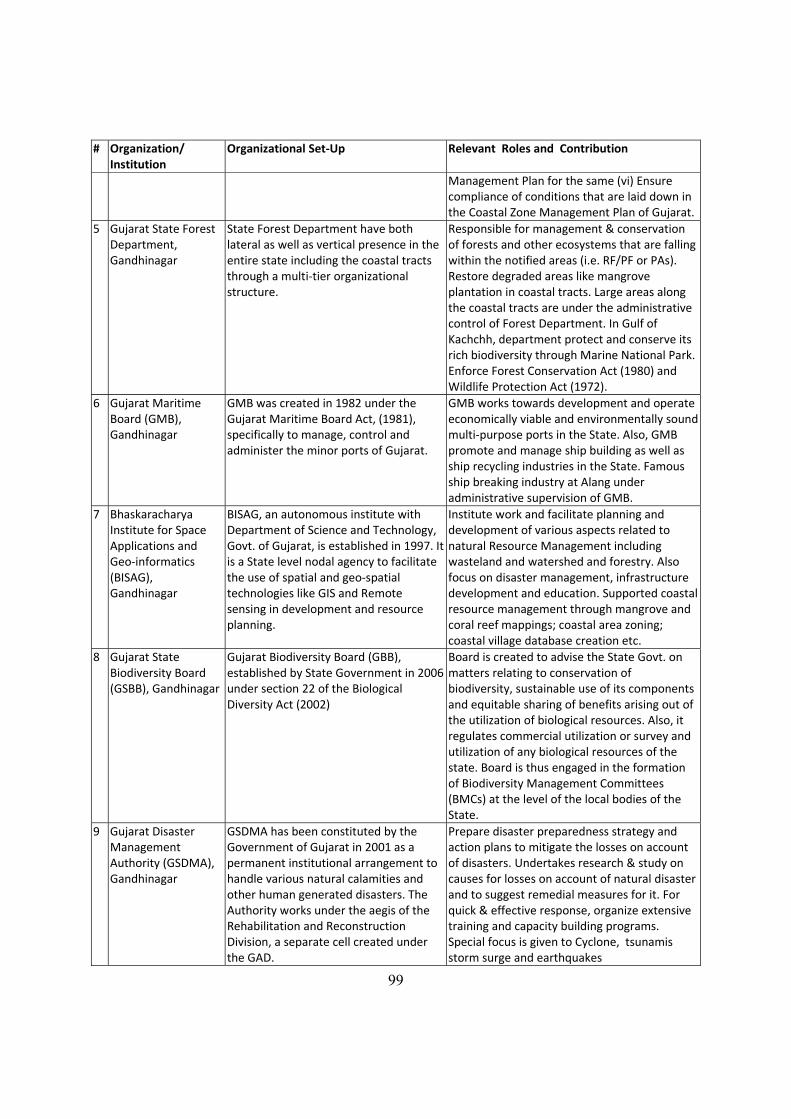
99
# Organization/ Institution
Organizational Set‐Up Relevant Roles and Contribution
Management Plan for the same (vi) Ensure compliance of conditions that are laid down in the Coastal Zone Management Plan of Gujarat.
5 Gujarat State Forest Department, Gandhinagar
State Forest Department have both lateral as well as vertical presence in the entire state including the coastal tracts through a multi‐tier organizational structure.
Responsible for management & conservation of forests and other ecosystems that are falling within the notified areas (i.e. RF/PF or PAs). Restore degraded areas like mangrove plantation in coastal tracts. Large areas along the coastal tracts are under the administrative control of Forest Department. In Gulf of Kachchh, department protect and conserve its rich biodiversity through Marine National Park. Enforce Forest Conservation Act (1980) and Wildlife Protection Act (1972).
6 Gujarat Maritime Board (GMB), Gandhinagar
GMB was created in 1982 under the Gujarat Maritime Board Act, (1981), specifically to manage, control and administer the minor ports of Gujarat.
GMB works towards development and operate economically viable and environmentally sound multi‐purpose ports in the State. Also, GMB promote and manage ship building as well as ship recycling industries in the State. Famous ship breaking industry at Alang under administrative supervision of GMB.
7 Bhaskaracharya Institute for Space Applications and Geo‐informatics (BISAG), Gandhinagar
BISAG, an autonomous institute with Department of Science and Technology, Govt. of Gujarat, is established in 1997. It is a State level nodal agency to facilitate the use of spatial and geo‐spatial technologies like GIS and Remote sensing in development and resource planning.
Institute work and facilitate planning and development of various aspects related to natural Resource Management including wasteland and watershed and forestry. Also focus on disaster management, infrastructure development and education. Supported coastal resource management through mangrove and coral reef mappings; coastal area zoning; coastal village database creation etc.
8 Gujarat State Biodiversity Board (GSBB), Gandhinagar
Gujarat Biodiversity Board (GBB), established by State Government in 2006 under section 22 of the Biological Diversity Act (2002)
Board is created to advise the State Govt. on matters relating to conservation of biodiversity, sustainable use of its components and equitable sharing of benefits arising out of the utilization of biological resources. Also, it regulates commercial utilization or survey and utilization of any biological resources of the state. Board is thus engaged in the formation of Biodiversity Management Committees (BMCs) at the level of the local bodies of the State.
9 Gujarat Disaster Management Authority (GSDMA), Gandhinagar
GSDMA has been constituted by the Government of Gujarat in 2001 as a permanent institutional arrangement to handle various natural calamities and other human generated disasters. The Authority works under the aegis of the Rehabilitation and Reconstruction Division, a separate cell created under the GAD.
Prepare disaster preparedness strategy and action plans to mitigate the losses on account of disasters. Undertakes research & study on causes for losses on account of natural disaster and to suggest remedial measures for it. For quick & effective response, organize extensive training and capacity building programs. Special focus is given to Cyclone, tsunamis storm surge and earthquakes
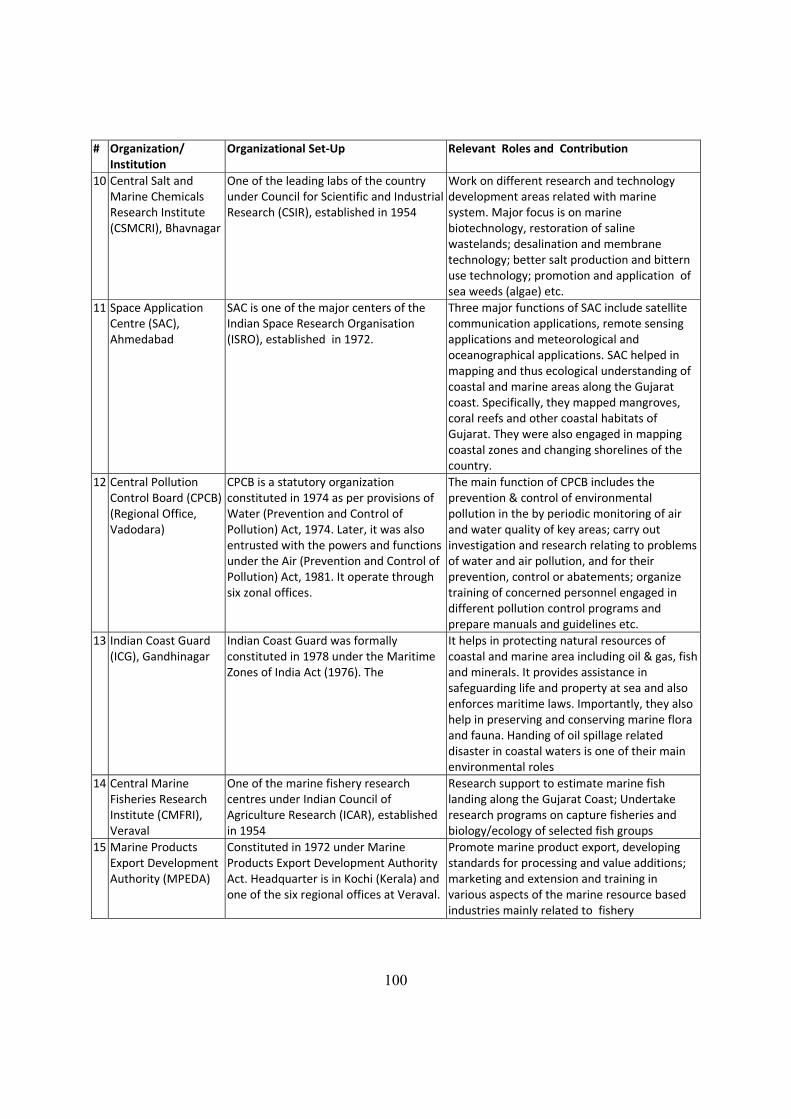
100
# Organization/ Institution
Organizational Set‐Up Relevant Roles and Contribution
10 Central Salt and Marine Chemicals Research Institute (CSMCRI), Bhavnagar
One of the leading labs of the country under Council for Scientific and Industrial Research (CSIR), established in 1954
Work on different research and technology development areas related with marine system. Major focus is on marine biotechnology, restoration of saline wastelands; desalination and membrane technology; better salt production and bittern use technology; promotion and application of sea weeds (algae) etc.
11 Space Application Centre (SAC), Ahmedabad
SAC is one of the major centers of the Indian Space Research Organisation (ISRO), established in 1972.
Three major functions of SAC include satellite communication applications, remote sensing applications and meteorological and oceanographical applications. SAC helped in mapping and thus ecological understanding of coastal and marine areas along the Gujarat coast. Specifically, they mapped mangroves, coral reefs and other coastal habitats of Gujarat. They were also engaged in mapping coastal zones and changing shorelines of the country.
12 Central Pollution Control Board (CPCB) (Regional Office, Vadodara)
CPCB is a statutory organization constituted in 1974 as per provisions of Water (Prevention and Control of Pollution) Act, 1974. Later, it was also entrusted with the powers and functions under the Air (Prevention and Control of Pollution) Act, 1981. It operate through six zonal offices.
The main function of CPCB includes the prevention & control of environmental pollution in the by periodic monitoring of air and water quality of key areas; carry out investigation and research relating to problems of water and air pollution, and for their prevention, control or abatements; organize training of concerned personnel engaged in different pollution control programs and prepare manuals and guidelines etc.
13 Indian Coast Guard (ICG), Gandhinagar
Indian Coast Guard was formally constituted in 1978 under the Maritime Zones of India Act (1976). The
It helps in protecting natural resources of coastal and marine area including oil & gas, fish and minerals. It provides assistance in safeguarding life and property at sea and also enforces maritime laws. Importantly, they also help in preserving and conserving marine flora and fauna. Handing of oil spillage related disaster in coastal waters is one of their main environmental roles
14 Central Marine Fisheries Research Institute (CMFRI), Veraval
One of the marine fishery research centres under Indian Council of Agriculture Research (ICAR), established in 1954
Research support to estimate marine fish landing along the Gujarat Coast; Undertake research programs on capture fisheries and biology/ecology of selected fish groups
15 Marine Products Export Development Authority (MPEDA)
Constituted in 1972 under Marine Products Export Development Authority Act. Headquarter is in Kochi (Kerala) and one of the six regional offices at Veraval.
Promote marine product export, developing standards for processing and value additions; marketing and extension and training in various aspects of the marine resource based industries mainly related to fishery
101
Literature Cited or Consulted
Ahmed, M., Chong, C.K. & Balasubramanian, H. 2004. An Overview of problems and issues of Coral Reefs management., In: Ahmed, M., Chong, C. K. & Cesar, H. (eds.). Economic Valuation and Policy Priorities for Sustainable Management of Coral Reefs. Pp. 2‐11. World Fish Centre Conference Proceedings, 70.
Anon, (1987).Mangroves in India.Status Report.Government of India, Ministry of Environment and Forest, New Delhi. 150pp. Quoted in Hirway & Goswami (2004)
Anon. 1989.Marine Living Resources of the U.T of Lakshadweep. Bulletin No 43. CMFRI, Cochin, India.
Anon. 1991.Coastal marine ecosystems and anthropogenic pressure in the Gulf of Kachchh.Dept.of Bioscinece, Saurashtra University, Rajkot.
Anon. 2007.Gujarat Fisheries Statistics‐ 2007.Commissioner of Fisheries, Govt. of Gujarat, Gandhinagar.
Anon. 2007.Industries in Gujarat Statistical Information. Industries Commissionerate, Government of Gujarat, Gandhinagar.
Anon. 2010.Industries in Gujarat Statistical Information. Industries Commissionerate, Government of Gujarat, Gandhinagar.
Anon. 2011.Sagarkhedu Sarvangi Vikas Yojana for coastal areas. GAD, Government of Gujarat, Gandhinagar
Anon. Undated. Estuaries of India‐ Their environmental status and management strategies
Arthur, R. 2000. Coral bleaching and mortality in three Indian reef regions during an El Nino southern oscillation event. Current Science 79(12): 1723‐1729.
Bahuguna, A. & Nayak, S. 1998. Coral Reefs of the Indian Ocean. Space Application Centre (ISRO), Ahmedabad.
Bakus, G., Arthur, R., Ekaratne, S. & Jinendradasa, S.S. 2000. Chapter 10: India and Sri Lanka. In: McClanahan, T.R., Sheppard, C.R.C. & Obura, D.O. (eds.). Coral Reefs of the Indian Ocean: Their Ecology and Conservation. Oxford Univ. Press. pp. 295‐324.
Balasubramanian (ed), 2002. Estuaries of India: State of the art report, CAS in Marine Biology Quoted in Estuaries of India‐ Their environmental status and management strategies
Bharwada C. and Mahajan V., 2007. Mangroves and maldharis of Gujarat, Gujarat ecology Commission, Gandhinagar
Bhaskar, S. 1984. The distribution and status of sea turtles in India. In: Proceedings of the workshop on sea turtle conservation (Ed. E.G. Silas). CMFRI Special Publication 18: 21‐35.
102
Bhaskar, S., 1978. Note from the Gulf of Kutch. Hamadryad 3(3): 9‐11
Bhaskaran, M. & Goplakrishnan, P. 1971. Observation on the marine plankton in the Gulf of Kutch, off Port Okha. Indian J. Fish., 18: 99‐108.
Bhatt, S., Shah, D.G. & Desai, N. 2009.The mangrove diversity of Purna Estuary, South Gujarat, India.Trop. Ecol. 50(2):287‐293.
Bhattathiri, P. M., 2001. Features of some significant estuaries of India, In: Indian Ocean‐ A perspective Quoted in
Biswas, N. 2009. The Gulf of Kutch Marine National Park and Sanctuary: A Case Study. http://www.icsf.net/icsf2006/uploads/resources/usefulDocs/docs/
Carte, B. K. 1996. Biomedical potential of marine natural products. BioScience, 46: 271‐86.
Chauhan, O.S. 1994. Influence of macrotidal environment on shelf sedimentation, Gulf of Kachchh, India. Continental Shelf Research, 14 (13‐14): 1477‐1493.
Chhaya, N.D. & Patel, M.I. 1982. Coral and coral reefs of the Gulf of Kutch. In: Recent Researches in Geology Series. 9: 379‐389. Hindustan Publishing Corp. Delhi.
Choudhury, B.C. , Sivakumar, K. and Saravanan, K.R. 2011. Status of Marine and Coastal environments and developing a Marine Protected Area Network in India.Wildlife Institute of India, Dehardun.
CMFRI, 2010.National Marine Fisheries Census. Central Marine Fisheries Research Institute, Kochi
Costanza, R, d'Arge, R., de Groot, R., Farberk, S., Grasso, M. Hannon, B., LimburgI, K., Naeem, S., O'Neill, R.V., Paruelo, J., Raskin, R.G., Suttonkk, P. & van den Belt, M. 1997. The value of the world's ecosystem services and natural capital. Nature, 387: 253‐260.
CPCB 2009. Status of water supply, wastewater generation and treatment in Class I cities and Class II towns of India. Central Pollution Control Board, Ministry of Environment & Forests, Government of India, New Delhi
CPCB. 2002. Oil pollution and the marine environment, Central Pollution Control Board Ministry of Environment & Forests, Government of India, New Delhi
CPCB. 2009. Annual Report, 2008‐09. Central Pollution Control Board, Government of India, Gandhinagar
CPCB. 2009. Status of Water Quality in India, Monitoring of Indian Aquatic Resources, Series: MINARS/2009‐10, Central Pollution Control Board
de Groot R., Wilson, M.A., & R.M.J. Boumans. 2002. A typology for classification, description and valuation for ecosystem functions, goods and services, Ecological Economics, 41: 393‐408.
De Groot, a. J., Salmons, W. & Allersma, E. 1976. Processes affecting heavy metals in estuarine sediments, Estuarine Chemistry (Burton, J. D. and Liss, p. S., eds., 131 ‐ 153, Academic Press, London Quoted in Krupadam et al., 2006.

103
Demaria, F. 2010. Shipbreaking at Alang‐Sosiya (India): An ecological distribution conflict, Ecological Economics 70(2010) 250‐260
Desai, B.N., Gajbhiye, S.N., Ram, M J. & Nair, V.R. 1983. Comparative account on zooplankton in polluted and unpolluted estuaries of Gujarat. Mahasagar, 16(3), 281‐291. National Institute of Oceography.
Deshkar, S., Lakhmapurkar, J. & Gavali, D. 2011.State of three estuaries of Gulf of Khambhat, Gujarat Ecology Society, Vadodara.
Deshmukhe, G., Ramamoorthy, K .& Sen Gupta, R. 2000. On the coral reefs of the Gulf of Kachchh.Curr. Sci., 79(2):160‐162.
Dixit, A.M., Kumar, P., Kumar, L. & Pathak, K. 2010. Economic valuation of coral reef systems in Gulf of Kutch, Gujarat Ecology Commission, Gandhinagar
Drysen, D. and Wedborg, M. 1980. Major and minor elements, chemical speciation in estuarine waters, Chemistry and Bio‐geochemistry of Estuaries (Olausson, E. and cato, i., eds.), 71 ‐ 119, Wiley, Chichester Quoted in Krupadam et al., 2006
Frazier, J. G. & Mundkur, T. 1990.Dugong Dugong dugon Muller in the Gulf of Kutch, Gujarat.J. Bombay Nat. Hist. Soc., 87(3): 368‐379.
FSI. 2001. Annual Report. Forest Survey of India, Ministry of Environment & Forest, Government of India
FSI. 2003. Annual Report. Forest Survey of India, Ministry of Environment & Forest, Government of India
FSI. 2005. Annual Report. Forest Survey of India, Ministry of Environment & Forest, Government of India
FSI. 2009. Annual Report. Forest Survey of India, Ministry of Environment & Forest, Government of India
Ganapathiraju, P. 2010. Illegal, Unreported and Unregulated Marine Fish Catches in the Indian Exclusive Economic Zone‐ Policy and Ecosystem Restoration in Fisheries Centre. University of British Columbia, BC, Vancouver, Canada.
Garg, J.K., Singh, T.S., and Murthy, T.V.R. 1998. Coastal wetlands of India. Space Application Centre, Ahmedabad, pp 237.
GEC. 2009. Mangrove Atlas of Gujarat State. Gujarat Ecology Commission, Government of Gujarat, Gandhinagar
GEC. 2011. Coral Atlas of Gujarat State. Gujarat Ecology Commission, Government of Gujarat, Gandhinagar
GEC.2011. Ecological Profile of coastal talukas around Gulf of Khambhat, Government of Gujarat, Gandhinagar

104
GEER. 2009. Study of floristic diversity and natural recruitment of mangrove species in selected mangrove habitats of South Gujarat, Gandhinagar: Gujarat Ecological Education and Research Foundation, Gandhinagar
GIDB, 2006. Saurashtra Coastal Corridor, Government of Gujarat, Gandhinagar
Glynn, P.W. 1993. Coral Reefs, 8: 193‐197
GMB. 2008. Annual Report, 2007‐08. Gujarat Maritime Board, Government of Gujarat, Gandhinagar
GMB. 2011. Annual Report, 2010‐11. Gujarat Maritime Board, Government of Gujarat, Gandhinagar
Gopalkrishnan, P. 1970. Some observations on the shore ecology of Okha coast. J. Mar. Biol. Asso. India, 12(1&2): 15‐34.
Goswami, S., Parthasarathy, R. & Iyer, M. 2012. State of Environment Report Gujarat 2012‐ Urban, Rural and Built Environment. CEPT University, Ahmedabad
Govindan, K., Varshney, P.K. & Desai, B. N. 1983. Benthic studies in South Gujarat Estuaries, Mahasagar, 16(3): 349‐356. National Institute of Oceanography
GPCB. 2001. Annual Report, 2000‐01. Gujarat Pollution Control Board. Government of Gujarat, Gandhinagar
GPCB. 2002. Annual Report, 2001‐02. Gujarat Pollution Control Board. Government of Gujarat, Gandhinagar
GPCB. 2003. Annual Report, 2002‐03. Gujarat Pollution Control Board. Government of Gujarat, Gandhinagar
GPCB. 2004. Annual Report, 2003‐04. Gujarat Pollution Control Board. Government of Gujarat, Gandhinagar
GPCB. 2005. Annual Report, 2004‐05. Gujarat Pollution Control Board. Government of Gujarat, Gandhinagar
GPCB. 2006. Annual Report, 2005‐06. Gujarat Pollution Control Board. Government of Gujarat, Gandhinagar
GPCB. 2007. Annual Report, 2006‐07. Gujarat Pollution Control Board. Government of Gujarat, Gandhinagar
GPCB. 2010. Annual Report, 2009‐10. Gujarat Pollution Control Board. Government of Gujarat, Gandhinagar
GPCB. 2011. Annual Report, 2010‐11. Gujarat Pollution Control Board. Government of Gujarat, Gandhinagar
GUIDE & GEER. 2001. Ecological status of Narayan Sarovar Wildlife Sanctuary‐ A management perspective,
105
Gujarat Fisheries Statistics 2007‐08, Commissionerate of Fisheries, Government of Gujarat, Gandhinagar
Hatcher, B.G. 1988. Coral Reef Primary Productivity: Abeggaros Banquet. TREE 3: 106‐111.
Hirway, I. & Goswami, S. 2004. Valuation of mangroves in Gujarat. Centre for Development Alternatives, Ahmedabad. Pp. 97.
HLC‐1. 1976. Shri. Kapoor, the then Chief Secretary, GOG headed the HLC of 1976 [GOG notification No. GWR‐1076 (II) I(i) dated 17‐12‐1976].
HLC‐2. 1978. Shri. K.Shivraj, the then Chief Secretary, GOG, headed the HLC of 1978 [vide GOG notification GER‐1076‐11‐5‐I(i) dated 17‐7‐1978] to study the area between Madhavpur‐Maliya reach and Maliya to Lakhpat.
HLC‐3. 1984. GOG notification WR‐I(i) MIP‐2284‐4884(19) K(i) dated 21‐11‐1984] headed by J.F.Mistry, Secretary, Department of Irrigation
Hornell, J. 1909. Report on the Marine Zoology of Okhamandal in Kattiawar. Part I. Williams & Norgate, London.Pp. 137.
Hornell, J. 1916. Report on the Marine Zoology of Okhamandal in Kattiawar. Part II. Williams & Norgate, London.Pp. 157.
IBA, 2000. Important Bird Atlas
ICMAM . 2002. Integrated Coastal and Marine Area Management: Gulf of Kachchh.
Indian Port Report, 2003.I‐Maritime Research and Consulting Division, Mumbai.
IPCC.2001 Technical summary. Climate change 2001: Working Group I: the scientific basis: IPCC Third Assessment Report. Geneva, Switzerland: Intergovernmental Panel on Climate Change.
Joshua, J., Wesly, S. F., Vijayakumar, V. & Gokula, V. 2008. Avifauna of Narayan Sarovar Sanctuary: A Management Perspective, Wildlife Biodiversity Conservation
Kankara, R.S. & Subramanian, B.R. 2007.Oil Spill Sensitivity Analysis and Risk assessment for Gulf of Kachchh, India, using Integrated Modeling. J. Coast. Res. 23(5) 1251–1258
Kar, C.S. & Bhaskar,S. 1982. The status of Sea turtles in the eastern Indian Ocean. In: The biology and Conservation of Sea Turtles (ed.K.A. Bjorndal), Pp: 365‐373. Smithsonian Institution Press,Washington D.C.
Kristensen, P. 2004.The DPSIR Framework.European Topic Centre on Water. European Environment Agency, pp. 1‐10.
Krupadam, R. J., Smita, P. & Wate, S. R. 2006. Geochemical fractionation of heavy metals in sediments of the Tapi estuary, National environmental Engineering Research Institute, Nagpur
106
Kumar, N.J.I., George, B., Kumar, R.N., Sajish, P.R. & Viyol, S. 2009. Assessment of spatial and temporal fluctuations in water quality of a tropical permanent Estuarine system ‐ Tapi, West coast India. Applied Ecology and Environmental Research 7(3): 267‐276.
Kumar, N.J.I., Kumar, R. N.& Viyol, S. 2010. Characterization of hydro‐chemical parameters in relation to freshwater fraction ingress in tropical Narmada estuary, Gujarat, India. Ecoscan, 4(1): 49‐52.
Kumar, S. (Undated). SEZ & SIR in Gujarat: Land for Industrialization, Green Eminent
Mathew, J. 2010. Strategic alternatives for coastal protection: Multipurpose submerged reefs, Proceedings of 11'th meeting of the coastal protection and development advisory committee (CPDAC), Chennai
MEA. 2005. Millennium Ecosystem Assessment‐ Ecosystems and Human Well‐being: Biodiversity Synthesis. World Resource Institute, Washington DC.
Meena, R.L. Jadeja, L.N. & Barad, I.K. 2009. Conservation of sea turtles in Kachchh on the western coast of Gujarat. Indian Ocean Turtle Newsletter 9: 21‐22
Meena, R.L., Vyas, J.V. & Jadeja, R.S. 2007.Sea turtle hatcheries in Kachchh, Gujarat. Indian Ocean Turtle Newsletter 5: 19‐20.
Menon, N.G. & Pillai, C.S.G. (eds.). 1996. Marine Biodiversity, Conservation and Management. Central Marine Fisheries Institute, Cochin.
MNPS. 1994. Management Plan of Gulf of Kachchh Marine National Park and Sanctuary. Forest Dept.
Moberg, F. &Folke , C. 1999. Ecological goods and services of Coral reef Ecosystems. Ecological Economics, diversity. Nature, 421: 933‐936.
MoEF (2010‐2011). Annual Report 2010‐2011, Ministry of Environment and Forest.
MoES, Monitoring of Marine Pollution through Coastal Ocean Monitoring and Prediction Syaytem (COMAPS) Programme
Mohandass, C., Nair, S., Achuthankutty, C. T. & Bharathi, P.A.L. 2000. Pollution monitoring of coastal and estuarine areas: I. Bacterial indicators along the south Gujarat coast, Indian Journal of marine Saciences, Vol. 29, pp 43‐47
Monitoring of Marine Pollution through Coastal Ocean Monitoring and Prediction System (COMAPS) Program, Ministry of Earth Sciences, ICMAM, Chennai
Narvekar P. V., (Undated). On Physical and chemical characteristics of estuaries of South Gujarat, National Institute of Oceanography, Goa
National Assessment of shoreline change: Gujarat coast, Institute of Ocean Management‐ Anna University , Chennai, Ministry of Environment and Forest
Nayak, S., Pandeya, A., Gupta, M.C., Trivedi, C.R., Prasad, K.N. & Kadri, S.A. 1989.Application of satellite data for monitoring degradation of tidal wetlands of Gulf of Kachchh, Western India. Acta Astronautica 20: 171‐178.,
107
NIO. 2002. Status of Flora and Fauna of Gulf of Kachchh, India. National Institute of Oceanography, Goa.
Pandey et al., 2010. Status of Dougong (Dougong dgugon) in India, Gandhinagar: Gujarat Ecological Education and Research Foundation
Pandey, C. N. & Teli, J. 2005. Ecology and Biodiversity of Khijadiya bird sanctuary and its environment, Gujarat Ecological Education and Research Foundation, Gandhinagar
Pandya, P. J. & Vachhrajani, K.D., 2010. Birds of Mahi estuary, Gujarat, India, Journal of Threatened Taxa 2(6): 994‐1000.
Parekh, J. Sangeeta, K. Hazarika, R. Ravi, P. Vishwanathan, Thivakaran, G. Patel, A. Paul, M. 2009. Marine National Park, Gujarat: A Multi‐disciplinary and Multi ‐stakeholder Study. Integrated Research and Action for Development, New Delhi
Patel, M.I. 1976. Corals around Poshetra Point, Gulf of Kutch. Assoc. CIFE Souvenier, Bombay 1(6): 11‐16.
Patel, M.I. 1978. Generic diversity of Scleractinians around Poshitra point, Gulf of Kutch. Indian Jour. Mar. Sci., 7: 30‐32.
Patel, M.I. 1985a. Patchy corals of the Gulf of Kutch. In: Proc. Symp. Endangered Marine Animals and Marine Parks, 1: 411‐ 413.
Patel, M.I. 1985b. Calcareous sand mining from beaches ad littoral areas in the Gulf of Kutch, Gujarat and their possible deleterious effects on marine life. In: Proc. Symposium on endangered marine animals and marine parks. 1: 480‐486.
Pillai, C.G.S 1987. Structure and generic diversity of recent Scleractinian of India. J. Mar. Biol. Assoc. India, 25: 78‐80.
Pillai, C.G.S., Rajgopal, M.S. & Varghese, M.A., 1979.Preliminary report on the reconnaissance survey of the major coastal and marine ecosystems in the Gulf of Kutch.Marine Fishery Information Service. CMFRI, Cochin. T & E Serv. No. 14: 16‐20.
Pillai, C.S.G. & Patel M. I. 1988.Scleractinian corals from the Gulf of Kutch. Journal of Marine Biological Association, India, 30: 54‐74.
Pillai, C.S.G. 1983. Coral Reef and their Environs. Bulletin NO. 34, CMFRI, Cochin, India.
Pillai, C.S.G. 1996. Coral reefs of India: Their Conservation and Management. In: Pillai, C.S.G. & Menon, N.G. (eds.) Marine Biodiversity, Conservation and Management, Pp. 16‐31. CMFRI, Cochin, India.
Pillai.C.S.G. 1969.Corals and coral reefs.Symposium on Corals and Coral Reefs.Marine Biological Association of India.Souvenir Issue pp. 9‐17.
Pravin, P. 2000. Whale Shark in the Indian Coast ‐ Need for Conservation. CurrentScience 79, (3): 310‐315.
Qasim, S. Z.2003. Indian estuaries Quoted in Estuaries of India‐ Their environmental status and management strategies
108
Raghunathan, C. Sen Gupta, R. Wangikar, U. & Lakhmapurkar, J. 2004.A record of live corals along the Saurashtra coast of Gujarat, Arabian Sea.Curr. Sci., 87(8): 1131‐1138.
Raghunathan, C., Sen Gupta, r., Wangikar, U. & Lakhsmapurkar, j. 2004.A record of live corals along the Saurashtra coast of Gujarat, Arabian Sea.Curr. Sci., 87(8): 1131‐1138.
Ravindran, J. Raghukumar, C. & Raghukumar, S. 1998.Disease and stress‐indused mortality of corals in Indian reefs and observations on bleaching of corals in the andamans.Curr. Sci., 87(8): 1131‐1138.
Reddy, S.M., Basha, S., Kumar, S.V.G., Joshi, H.V. & Ghosh, P.K. 2003. Quantification and classification of ship scraping waste at Alang‐Sosiya, India, Marine Pollution Bulletin 46 (2003) 1609‐1614
SAC. 2010. National Wetland Atlas: Gujarat. Space Applications Centre (ISRO), Ahmedabad, India, 198p.
SAC. 2010. National Wetland Inventory & Assessment, Indian Space Research Organization, Ahmedabad
Sen Gupta, R. & Deshmukhe, G. 2000. Coastal and maritime environments of Gujarat: Ecology and Economics. Gujarat Ecological Society, Vadodara. pp. 150.
SER. 2009. Socio‐Economic Review ‐ Gujarat State, 2008‐09, Government of Gujarat, Gandhinagar
SER. 2010. Socio‐Economic Review ‐ Gujarat State, 2009‐10, Government of Gujarat, Gandhinagar
SER. 2011. Socio‐Economic Review ‐ Gujarat State, 2010‐11, Government of Gujarat, Gandhinagar
Shanker, K. and Andrews, H.V. 2006.Towards an integrated and collaborative sea turtle conservation programme in India: a UNEP/CMS‐IOSEA Project Report. Centre for Herpetology/Madras Crocodile Bank Trust, Post Bag 4, Mamallapuram, Tamil Nadu
Singh, H. S. 2006. Mangroves and their environment with emphasis on mangroves in Gujarat, Forest Department, Gujarat State, Gandhinagar
Singh, H. S. 2007. The Gir lion Panthera leo‐persica ‐ A natural history, conservation status, and future prospect, IFS, Gujarat
Singh, H.S. 2003.Sea mammals in marine protected areas in the Gulf of Kachchh, Gujarat State, India. Indian J. Mar. Sci. 32(3): 258‐262.
Singh, H.S., Pandey, C.N., Yennawar, P., Asari, R.J., Patel, B.H., Tatu, K. & Raval, B.R. 2004. The Marine National Park and Sanctuary in the Gulf of Kachchh‐ A comprehensive study on biodiversity and management issues.GEER Foundation; Gandhinagar.
Singh, H.S., Yennawar, P., Asari, R.J., Tatu, K. & Raval, B.R. 2006. : An Ecological and Socio‐Economic Study in Marine National Park and Sanctuary in the Gulf of Kutch (A
109
Comprehensive Study on Biodiversity and Management Issues); GEER Foundation; Gandhinagar.
Spalding , M.D., Ravilious, C. & Green, E.P. 2001. World Atlas of Coral Reefs.Prepared by the UNEP‐World Conservation Monitoring Centre.University of California Press, Berkeley, USA.
Stanley, O. D. 2004. Wetland ecosystems and coastal habitat diversity in Gujarat, India. J. Coastal Dev. 7(2): 49‐64.
Stone, L., Huppert, A., Rajagopalan, B., Bhasin, H. & Loya, Y. 1999. Mass coral reef bleaching: A recent outcome of increased El Nino activity? Ecol Lett., 2: 325‐330.
Subba Rao, N.V. & Sastry, D.R.K. 2005.Fauna of Marine National Park, Gulf of Kachchh, Gujarat.An Overview. Conservation Area Series 23: 1‐79. Plates I‐ VIII. Zoological Survey of India, Kolkata.
Sunderraj S.F.W., Joshua, J., Brahmbhatt, L., Saravanakumar, A., Muthuraman, B. and Das, S.K. 2006. The status of sea turtle populations on the Gujarat coast. In: Towards an integrated and collaborative sea turtle conservation programme in India: a UNEP/CMS‐IOSEA Project Report (eds. K. Shanker and H.V. Andrews). Centre for Herpetology/Madras Crocodile Bank Trust, Post Bag 4, Mamallapuram, Tamil Nadu.
Sunderraj, S.F.W., Joshua, J., Vijayakumar, V., Serebiah, J.S., Patal, I.L., Saravanakumar, A. & Joshi, N.M. 2002. Status of the Breeding Population of Sea Turtle along the Gujarat Coast.Gujarat Institute of Desert Ecology, Bhuj‐Kachchh, Gujarat.44p.
Varshney, P. K., Govingan, K. & Desai, B. N. 1981.Benthos of the Narmada Estuary. Mahasagar Bulletin, 14(2)
Venkataraman, K., Satyanarayan, C., Alfred, J.R.B. & Wolstenhobre, J. 2003. Handook on hard corals of India.Zoological Survey of India, Kolkata.Pp. 266.
Venkatesan, S., Kannan, P., Rajagopalan, M. & Vivekanandan, E. 2004.Nesting ecology of the green sea turtle Chelonia mydas along the Saurashtra coast.J. mar.biol. Ass. India, 46 (2) : 169 ‐ 177.
Venkatraman, K. & Wafar, M. 2005.Coastal and marine biodiversity of India. Indian J. Marine Sci., 34(1): 57‐75.
Vivekanandan, E. & Zala, M.S. 1994.Whale shark fishery off Veraval. Indian J. Fisheries 41(1): 37‐40.
Wafar, M.V.M. 1986. Corals and coral reefs of India.Proceeding of the Indian Academy of Science (Animal Sci / Plant Sci) Suppl., Pp. 19‐43.
Wilkinson, C.R. (ed.) 2000. Status of Coral reefs of the World.Auatralian Institute of Marine Science, Toensville.
Wilkinson, C.R. (ed.) 2004. Status of Coral Reefs of the World.Australian Institute of Marine Science, Townsville.
110
WTI. 2008. Turning the Tide. The campaign to save Vhali, the whale shark (Rhincodon typus) in Gujarat. Wildlife Trust of India (WTI), The International Fund for Animal Welfare (IFAW), Tata Chemicals Ltd. and Gujarat Forest Department
Zingde M. D., Status of pollution in Indian estuaries
Zingde M.D., Sharma P. & Sabnis M.M. 1985. Physico‐chemical investigation in Auranga river estuary (Gujarat), Mahasagar, 18(2), 307‐321
Zynudheen, A.A., Ninan, G., Sen, A. & Badonia, R. 2004.Utilization of trawl bycatch in Gujarat (India).NAGA, World Fish Center Quarterly 27(3 & 4).
Internet Resources
http://www.biosearch.in http://www.envforguj.in http://www.gujenvfor.gswan.gov.ingmb http://www.gidb.org http://www.gmbports.org http://www.gsdma.org http://censusgujarat.gov.in/Census2001Data.htm http://eprints.cmfri.org.in/25/1/12.pdf http://shodhganga.inflibnet.ac.in/bitstream/10603/903/9/09_chapter%202.pdf http://ic.gujarat.gov.in/pdf/Industries%20commissioner.pdf http://www.ipa.nic.in http://kandlaport.gov.in http://www.gpcb.gov.in http://www.cpcb.nic.in http://www.vibrantgujarat.com http://www.wwf.org.au http://www.ioseaturtles.org/Education/dugongbooklet.pdf http://www.iucn.org http://www.icmam.gov.in http://www.incois.gov.in http://www.dod.nic.in http://www.dolphins‐world.com/
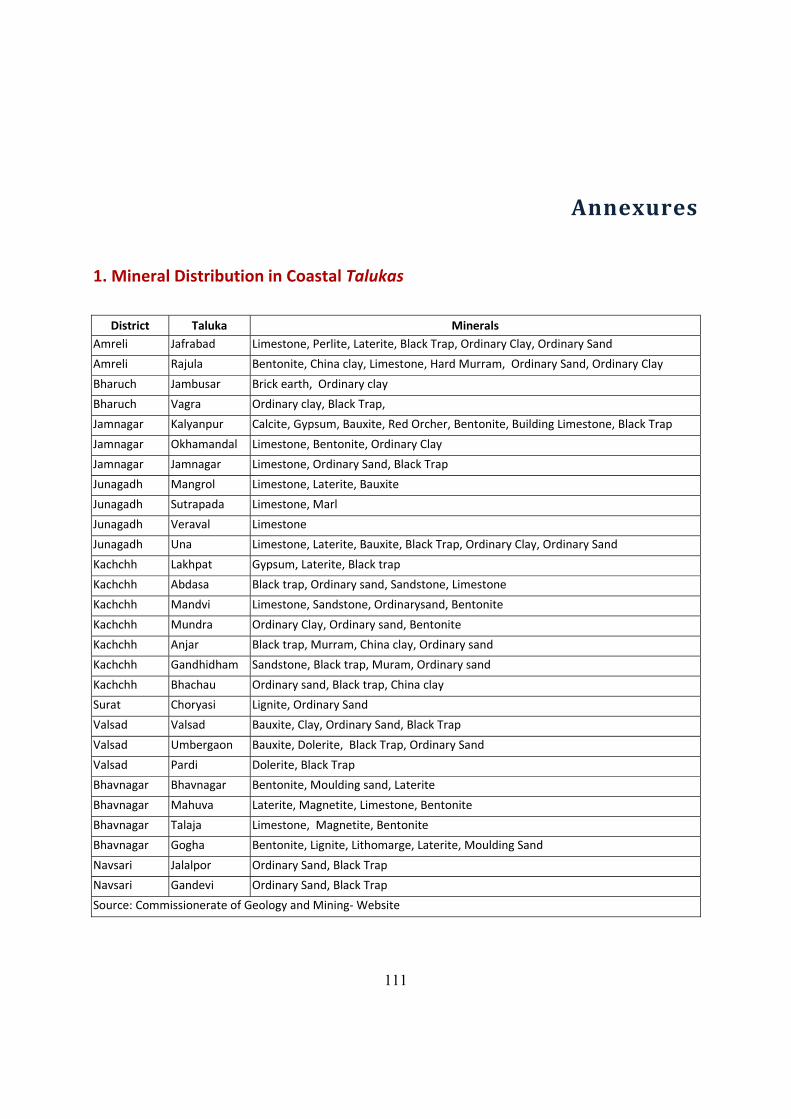
111
Annexures
1. Mineral Distribution in Coastal Talukas
District Taluka Minerals Amreli Jafrabad Limestone, Perlite, Laterite, Black Trap, Ordinary Clay, Ordinary Sand
Amreli Rajula Bentonite, China clay, Limestone, Hard Murram, Ordinary Sand, Ordinary Clay
Bharuch Jambusar Brick earth, Ordinary clay
Bharuch Vagra Ordinary clay, Black Trap,
Jamnagar Kalyanpur Calcite, Gypsum, Bauxite, Red Orcher, Bentonite, Building Limestone, Black Trap
Jamnagar Okhamandal Limestone, Bentonite, Ordinary Clay
Jamnagar Jamnagar Limestone, Ordinary Sand, Black Trap
Junagadh Mangrol Limestone, Laterite, Bauxite
Junagadh Sutrapada Limestone, Marl
Junagadh Veraval Limestone
Junagadh Una Limestone, Laterite, Bauxite, Black Trap, Ordinary Clay, Ordinary Sand
Kachchh Lakhpat Gypsum, Laterite, Black trap
Kachchh Abdasa Black trap, Ordinary sand, Sandstone, Limestone
Kachchh Mandvi Limestone, Sandstone, Ordinarysand, Bentonite
Kachchh Mundra Ordinary Clay, Ordinary sand, Bentonite
Kachchh Anjar Black trap, Murram, China clay, Ordinary sand
Kachchh Gandhidham Sandstone, Black trap, Muram, Ordinary sand
Kachchh Bhachau Ordinary sand, Black trap, China clay
Surat Choryasi Lignite, Ordinary Sand
Valsad Valsad Bauxite, Clay, Ordinary Sand, Black Trap
Valsad Umbergaon Bauxite, Dolerite, Black Trap, Ordinary Sand
Valsad Pardi Dolerite, Black Trap
Bhavnagar Bhavnagar Bentonite, Moulding sand, Laterite
Bhavnagar Mahuva Laterite, Magnetite, Limestone, Bentonite
Bhavnagar Talaja Limestone, Magnetite, Bentonite
Bhavnagar Gogha Bentonite, Lignite, Lithomarge, Laterite, Moulding Sand
Navsari Jalalpor Ordinary Sand, Black Trap
Navsari Gandevi Ordinary Sand, Black Trap
Source: Commissionerate of Geology and Mining‐Website

112
2. Species‐wise Marine Fish Production (in kg) between 1999‐2000 and 2007‐08
# Species 1999‐00 2000‐01 2001‐02 2002‐03 2003‐04 2004‐05 2005‐06 2006‐07 2007‐08
1 White Pomfret 11133 9169 10981 10655 10014 6515 14487 27562 13398
2 Black Pomfret 3489 2567 3894 4595 2395 1766 2470 5539 2343
3 Bomby Duck 88166 86085 79219 76940 78747 84956 92088 91443 128995
4 Thread Fish 1937 2079 4342 5197 3002 2285 2940 3057 4225
5 Jew Fish 9538 8814 11779 9540 8500 8236 12933 9878 16850
6 Hilsa 1710 1988 4535 1983 1298 1906 2095 3539 2378
7 Clupeads 12733 11186 13850 19677 11813 10793 14759 15892 14493
8 Coilia 16651 9145 11293 12543 11568 11654 8980 9480 9064
9 Shark 16589 14079 14385 17937 12956 10163 15896 27465 14466
10 Mullet 5377 5694 5191 5391 4700 4435 6404 6585 6184
11 Cat Fish 24526 19568 30001 25990 24899 25979 25851 29594 36085
12 Eel 3346 2694 3224 3638 2609 3418 6405 6279 6663
13 Leather‐Jacket 2206 2291 2752 3166 1481 2336 4654 6751 6163
14 Seer Fish 7133 7706 10971 11881 6873 7388 9277 15866 11127
15 Indian Salmon 1647 885 1517 1074 897 1002 1252 1950 1290
16 Ribbon Fish 59616 38429 50754 62852 39423 48135 43179 41118 29708
17 Silver Bar 3636 3043 6577 8457 3955 3963 4840 10189 6960
18 Perch 7156 6942 9890 11908 8894 11731 15493 17719 21923
19 Small Sciendies 224418 197006 172970 189665 171904 154562 151392 129210 140219
20 Shrimp 48033 44970 40708 43189 45217 48281 53821 50952 40851
21 Prawns [Medi] 7285 7905 7093 5760 7365 5949 10390 10305 9922
22 Prawns [Jumbo] 1126 1108 972 947 1615 839 2310 3166 1107
23 Lobster 511 500 406 421 989 273 1302 2275 470
24 Crab 1657 1787 1348 2633 1869 1657 1989 3499 1997
25 Levta/ Mudskipper 2204 2712 2240 2173 1905 1763 2328 3312 2266
26 Squid/ Cuttle 23423 22857 22415 35476 27780 17504 36152 26297 20098
27 Tuna 10028 16644
28 Carangies/Macarel 17445 15934
29 Rani Fish 16460 28837
30 Sole 5300 8499
31 Misc. 85705 109265 127522 169950 116468 107462 120197 68607 61689
Grand Total 670951 620474 650829 743638 609136 584951 663884 676762 680848
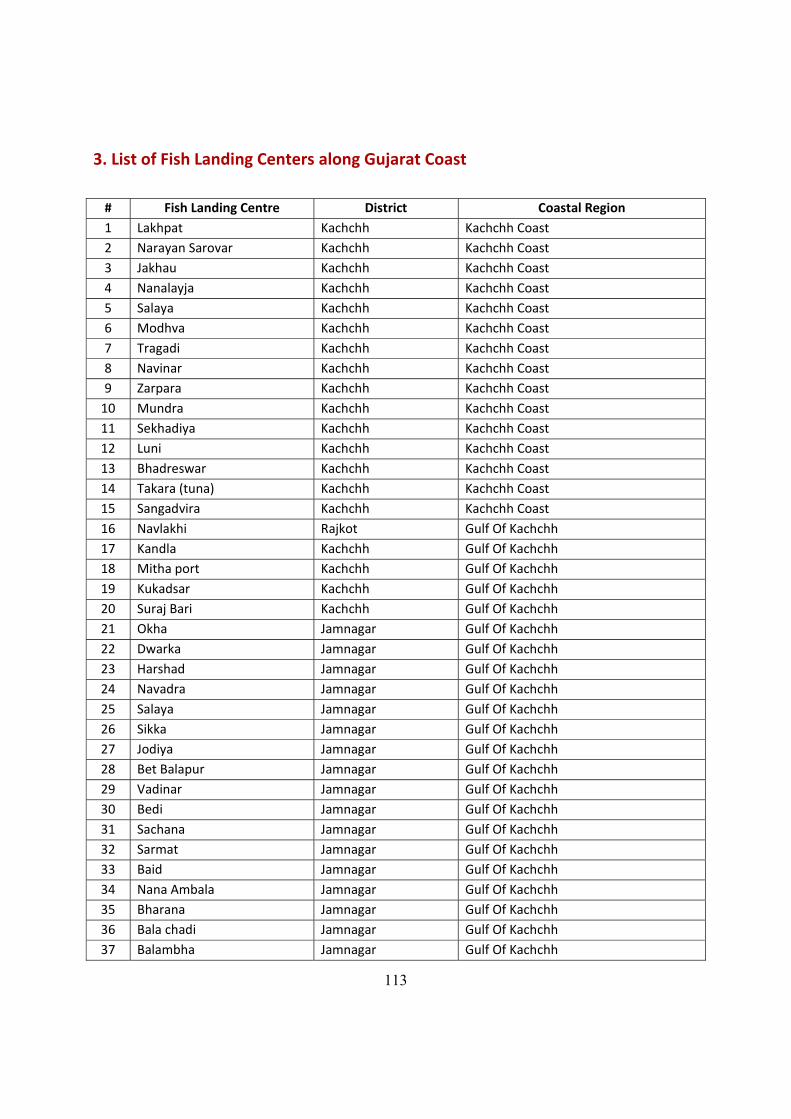
113
3. List of Fish Landing Centers along Gujarat Coast
# Fish Landing Centre District Coastal Region 1 Lakhpat Kachchh Kachchh Coast 2 Narayan Sarovar Kachchh Kachchh Coast 3 Jakhau Kachchh Kachchh Coast 4 Nanalayja Kachchh Kachchh Coast 5 Salaya Kachchh Kachchh Coast 6 Modhva Kachchh Kachchh Coast 7 Tragadi Kachchh Kachchh Coast 8 Navinar Kachchh Kachchh Coast 9 Zarpara Kachchh Kachchh Coast 10 Mundra Kachchh Kachchh Coast 11 Sekhadiya Kachchh Kachchh Coast 12 Luni Kachchh Kachchh Coast 13 Bhadreswar Kachchh Kachchh Coast 14 Takara (tuna) Kachchh Kachchh Coast 15 Sangadvira Kachchh Kachchh Coast 16 Navlakhi Rajkot Gulf Of Kachchh 17 Kandla Kachchh Gulf Of Kachchh 18 Mitha port Kachchh Gulf Of Kachchh 19 Kukadsar Kachchh Gulf Of Kachchh 20 Suraj Bari Kachchh Gulf Of Kachchh 21 Okha Jamnagar Gulf Of Kachchh 22 Dwarka Jamnagar Gulf Of Kachchh 23 Harshad Jamnagar Gulf Of Kachchh 24 Navadra Jamnagar Gulf Of Kachchh 25 Salaya Jamnagar Gulf Of Kachchh 26 Sikka Jamnagar Gulf Of Kachchh 27 Jodiya Jamnagar Gulf Of Kachchh 28 Bet Balapur Jamnagar Gulf Of Kachchh 29 Vadinar Jamnagar Gulf Of Kachchh 30 Bedi Jamnagar Gulf Of Kachchh 31 Sachana Jamnagar Gulf Of Kachchh 32 Sarmat Jamnagar Gulf Of Kachchh 33 Baid Jamnagar Gulf Of Kachchh 34 Nana Ambala Jamnagar Gulf Of Kachchh 35 Bharana Jamnagar Gulf Of Kachchh 36 Bala chadi Jamnagar Gulf Of Kachchh 37 Balambha Jamnagar Gulf Of Kachchh
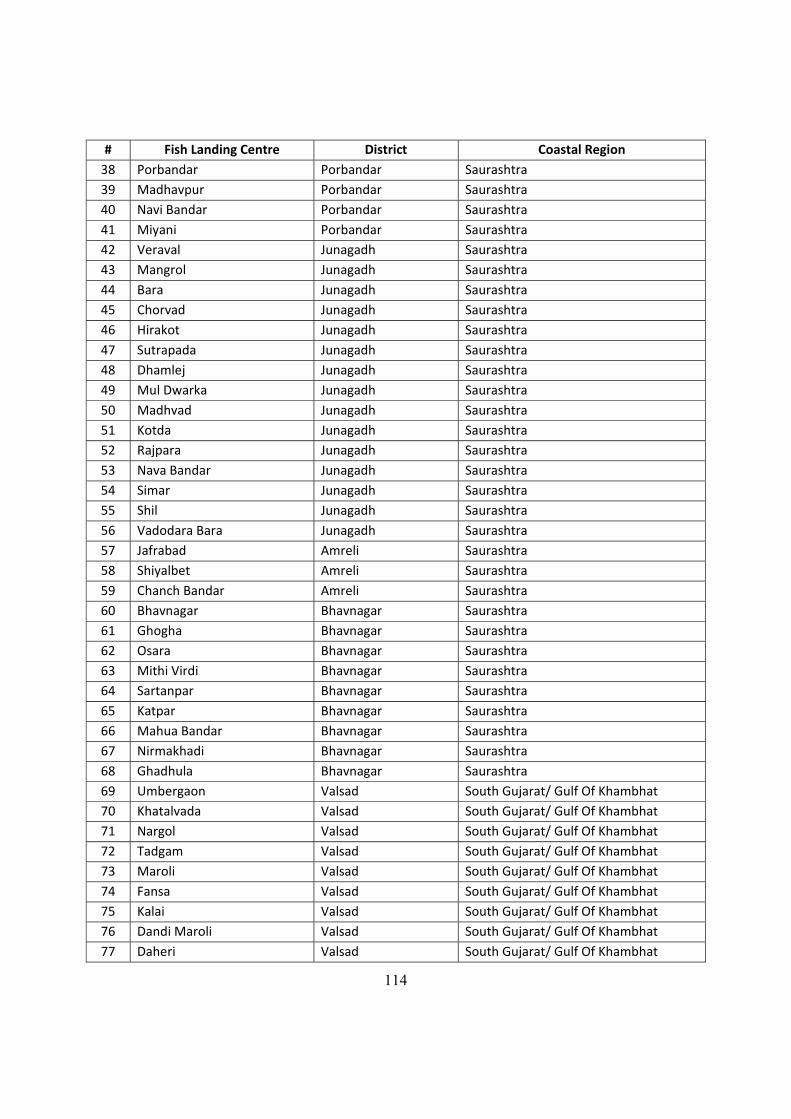
114
# Fish Landing Centre District Coastal Region 38 Porbandar Porbandar Saurashtra 39 Madhavpur Porbandar Saurashtra 40 Navi Bandar Porbandar Saurashtra 41 Miyani Porbandar Saurashtra 42 Veraval Junagadh Saurashtra 43 Mangrol Junagadh Saurashtra 44 Bara Junagadh Saurashtra 45 Chorvad Junagadh Saurashtra 46 Hirakot Junagadh Saurashtra 47 Sutrapada Junagadh Saurashtra 48 Dhamlej Junagadh Saurashtra 49 Mul Dwarka Junagadh Saurashtra 50 Madhvad Junagadh Saurashtra 51 Kotda Junagadh Saurashtra 52 Rajpara Junagadh Saurashtra 53 Nava Bandar Junagadh Saurashtra 54 Simar Junagadh Saurashtra 55 Shil Junagadh Saurashtra 56 Vadodara Bara Junagadh Saurashtra 57 Jafrabad Amreli Saurashtra 58 Shiyalbet Amreli Saurashtra 59 Chanch Bandar Amreli Saurashtra 60 Bhavnagar Bhavnagar Saurashtra 61 Ghogha Bhavnagar Saurashtra 62 Osara Bhavnagar Saurashtra 63 Mithi Virdi Bhavnagar Saurashtra 64 Sartanpar Bhavnagar Saurashtra 65 Katpar Bhavnagar Saurashtra 66 Mahua Bandar Bhavnagar Saurashtra 67 Nirmakhadi Bhavnagar Saurashtra 68 Ghadhula Bhavnagar Saurashtra 69 Umbergaon Valsad South Gujarat/ Gulf Of Khambhat 70 Khatalvada Valsad South Gujarat/ Gulf Of Khambhat 71 Nargol Valsad South Gujarat/ Gulf Of Khambhat 72 Tadgam Valsad South Gujarat/ Gulf Of Khambhat 73 Maroli Valsad South Gujarat/ Gulf Of Khambhat 74 Fansa Valsad South Gujarat/ Gulf Of Khambhat 75 Kalai Valsad South Gujarat/ Gulf Of Khambhat 76 Dandi Maroli Valsad South Gujarat/ Gulf Of Khambhat 77 Daheri Valsad South Gujarat/ Gulf Of Khambhat
115
# Fish Landing Centre District Coastal Region 78 Kolak Valsad South Gujarat/ Gulf Of Khambhat 79 Udvada Valsad South Gujarat/ Gulf Of Khambhat 80 Umarsadi Valsad South Gujarat/ Gulf Of Khambhat 81 Magod Dungri Valsad South Gujarat/ Gulf Of Khambhat 82 Survada Valsad South Gujarat/ Gulf Of Khambhat 83 Kosamba Valsad South Gujarat/ Gulf Of Khambhat 84 Bhadeli Jagalala Valsad South Gujarat/ Gulf Of Khambhat 85 Dandi Bhagal Valsad South Gujarat/ Gulf Of Khambhat 86 Nani Danti Valsad South Gujarat/ Gulf Of Khambhat 87 Moti Danti Valsad South Gujarat/ Gulf Of Khambhat 88 Dholai Navsari South Gujarat/ Gulf Of Khambhat 89 Krisnapur Navsari South Gujarat/ Gulf Of Khambhat 90 Bhat Navsari South Gujarat/ Gulf Of Khambhat 91 Bilimora Navsari South Gujarat/ Gulf Of Khambhat 92 Vagrech Navsari South Gujarat/ Gulf Of Khambhat 93 Navsari Navsari South Gujarat/ Gulf Of Khambhat 94 Onjal Navsari South Gujarat/ Gulf Of Khambhat 95 Vansi borshi Navsari South Gujarat/ Gulf Of Khambhat 96 Choramlabhatha Navsari South Gujarat/ Gulf Of Khambhat 97 Bhimpor Surat South Gujarat/ Gulf Of Khambhat 98 Dumas Surat South Gujarat/ Gulf Of Khambhat 99 Hazira Surat South Gujarat/ Gulf Of Khambhat 100 Suwali Surat South Gujarat/ Gulf Of Khambhat 101 Vanswa Surat South Gujarat/ Gulf Of Khambhat 102 Dandi Surat South Gujarat/ Gulf Of Khambhat 103 Delasa Surat South Gujarat/ Gulf Of Khambhat 104 Mor Surat South Gujarat/ Gulf Of Khambhat 105 Bhagva Surat South Gujarat/ Gulf Of Khambhat 106 Pardi Zankhri Surat/Valsad South Gujarat/ Gulf Of Khambhat 107 Malpur Bharuch South Gujarat/ Gulf Of Khambhat 108 Kavi Bharuch South Gujarat/ Gulf Of Khambhat 109 Nada Bharuch South Gujarat/ Gulf Of Khambhat 110 Kantiyajal Bharuch South Gujarat/ Gulf Of Khambhat 111 Luvara Bharuch South Gujarat/ Gulf Of Khambhat 112 Lakhigam Bharuch South Gujarat/ Gulf Of Khambhat 113 Zamdi Bharuch South Gujarat/ Gulf Of Khambhat 114 Tankaria Bharuch South Gujarat/ Gulf Of Khambhat 115 Sarod Bharuch South Gujarat/ Gulf Of Khambhat 116 Khambhat Anand South Gujarat/ Gulf Of Khambhat Source: Dept. of Fisheries, Govt. of Gujarat
116
4. List of GIDC Estates in Coastal Region of Gujarat # District GIDC Estate
1 Kachchh Mandvi 2 Kachchh Mundra 3 Kachchh Anjar 4 Kachchh Gandhidham 5 Kachchh Bhachau 6 Rajkot Maliya 7 Jamnagar Dhrol 8 Jamnagar Jamnagar 9 Jamnagar Khambhalia 10 Jamnagar Mithapur 11 Jamnagar Bhatia 12 Porbandar Miyani 13 Porbandar Porbandar 14 Junagadh Shil 15 Junagadh Sutrapada 16 Junagadh Una 17 Amreli Jafrabad 18 Amreli Pipavav 19 Amreli Rajula 20 Bhavnagar Mahuva 21 Bhavnagar Vitthalvadi 22 Bhavnagar Sihor 2 23 Bhavnagar Bhavnagar 24 Bhavnagar Chitra 25 Bhavnagar Vartej 26 Ahmedabad Dhandhuka 27 Bharuch Dahej 28 Bharuch Panoli 29 Bharuch Vagra 30 Bharuch Jambusar 31 Surat Olpad 32 Surat Hajira 33… Surat Khatodara 34 Surat Pandesara 35 Surat Sachin 36 Navsari Billimora 37 Valsad Pardi 38 Valsad Valsad 39 Valsad Sarigam 40 Valsad Bhilad 41 Valsad Umbergaon Source: GPCB
117
5. List of Common Effluent Treatment Plants (CETP) in Gujarat (As on March 2010)
# CETP Management’s Name and Location No. of
Members Capacity in
MLD Status
1 The Green Environment Services Co‐op. Society Ltd. 244‐251, Phase II, GIDC Vatva Ahmedabad
671 16 Operational
2 Odhav Enviro Project Ltd., 25, GIDC Odhav, Ahmedabad 54 1.6 Operational3 Gujarat Vepari Maha Mandal Sahkari Udhyogik Vasahat Ltd., 181, GVMMS Industrial Estate, Odhav, Ahmedabad
372 1 Operational
4 Odhav Green Enviro Project Association, 394, GIDC Odhav, Ahmedabad
2 1.5 Operational
5 Naroda Enviro Projects Ltd., 512‐515, Phase I, GIDC Naroda, Ahmedabad
180 3.5 Operational
6 Narol Dyestuff Enviro Society, 1083 Near Vishal Textile Mill, B/h Narol‐Court, Narol, Ahmedabad
27 0.1 Operational
7 Sanand Eco Projects Ltd. (Incineration system), Ajanta Industrial Estate, Iyara – Sanand Dist. Ahmedabad
49 0.2 Operational
8 Bavla Eco Project. Sr No: 1440/P, Opp : Ganpati Boil Centre Ta. Bavla Dist : Ahmedabad.
12 1 Operational
9 Vinayak Jal Sudhikaran Co.op. Soc. Ltd. C/o . Tirupati Agro Ind. At Bavla. Dist : Ahmedabad.
20 1.5 Operational
10 Pollution Advisory Committee, NIA [Nandesari Industries Association] 153/A, GIDC Nandesari District Vadodara
177 5.5 Operational
11 Enviro Infrastructure Co. Ltd. ECP Canal road, Umraya, Ta. Padra District Vadodara
89 2.25 Operational
12 Enviro Technology Ltd., 2413/2414, GIDC Estate, Ankleshwar, District Bharuch
268 1.8 Operational
13 Bharuch Eco‐Aqua Infrastructure Ltd.,(BEAIL), Ankleshwar 1051 60 Operational14 Panoli Enviro Technology Ltd. 619, GIDC Estate, Panoli, District
Bharuch 119 1 Operational
15 Globe Enviro Care Ltd. [chemical units], PP 1, Off road no. 2, B/h Kay Tex Mills, GIDC Estate, Sachin – Surat
50 0.5 Operational
16 Sachin Enviro Infra Ltd., [process houses] P/2, GIDC Sachin Dist. Surat
71 50 Operational
17 Palsana Enviro Protection Ltd., Kadodara‐Surat 102 100 Operational18 Vapi Waste & Effluent Management Co. Ltd., 4807, Phase IV,
GIDC Vapi, District Valsad 786 70 Operational
19 Tata motors Ltd, Vendor Park Sanand, Dist‐Ahmedabad. 42 2 Operational20 Veraval Industries Association 5/6, GIDC Veraval, District
Junagadh 68 5 Operational
21 Jetpur Dyeing & Printing Association Kankiya Plot, Jetpur, District Rajkot
1174 11 Operational

118
22 Shri Dhareshwar GIDC Vistar Association, Nr. Dhareshwar Temple, National Highway, Navagadh, Rajkot
26 0.1 Operational
23 Jay Kay Enviro‐Technologies Pvt. Ltd., Kalipat, Bhavnagar road, Rajkot
130 0.035 Operational
24 Rajkot Electroplating Association, Rajkot Shapar (Veraval), Ta: Kotadasangani Dist. Rajkot
21 0.01 Operational
25 Kalol GIDC Industries Association 65/66, GIDC Estate Kalol, District Gandhinagar
39 0.4 Operational
26 Zydus Infrastructure Pvt.Ltd, Changodar, District Ahmedabad 12 0.75 Operational27 Pandesara Green Co‐op. Society Ltd., GIDC ‐ Surat 122 100 Operational28 Gujarat Eco Textile Park Pvt.Ltd, Village Baleswar Dist. Surat. 17 60 Operational29 New Palsana Industries Association, Plot 2, Block 194 B,
Baleshwar, Ta. Palsana Dist. Surat 17 45 Proposed
30 Jamnagar Electroplaters Association, Jamnagar 87 0.04 Proposed 31 CETP forWashing Ghat, Derdi Road, Jetpur Dist. Rajkot 100 20 Proposed 32 ATPA Swarnim Gujarat Enviro Pvt Limited Pirana Sewage Farm
Area, Village Gyaspur, Ahmedabad 89 100 Proposed
33 Sarigam Industrial Waste Effluent Co. Ltd, GIDC, Sarigam, Dist.Valsad.
289 15 Proposed
34 CETP for Washing Ghat, Village Bhat Gam Ta: Bhesan, Dist. Junagadh
150 30 Proposed
Source: www.gpcb.gov.in
119
6. Important water quality parameters recorded at Coastal Sampling Sites under COMAPS
Location Stcode Year Season Zone Source Tide W temp SSC pH Salinity DO BOD NO2 NO3 NH4 TN IP PHC Hazira H3 1998 Summer Nr.Shore Surface LT 25.8 208 8.1 32.6 6.71 1.5 0.5 22.6 NA NA 4.3 0.5 Hazira H1 1998 Premonsoon Shore Surface LT 32.1 633 7.9 14.3 4.35 1.6 3.9 25.2 1.1 NA 2.3 9.4 Hazira H2 1998 Premonsoon Shore Surface LT 31.4 691 8 22.1 5.42 3.4 3.7 22 0.6 NA 2.2 8.5 Hazira H3 1998 Premonsoon Nr.Shore Surface LT 31.7 940.5 8 30 5.28 2.7 0.9 24 0.5 NA 2.4 4.2 Hazira H3 1998 Postmonsoon Nr.Shore Surface HT 29 868 8.2 34.2 6.14 0.5 0.5 20 0.6 NA 2.6 1.2 Hazira H2 1999 Premonsoon Shore Surface HT 29.9 175 7.9 15.8 5.86 1.3 3.1 20.9 37.2 64.6 3.8 3.2 Hazira H1 1999 Premonsoon Shore Surface HT 29.7 249 8.2 6.8 6.28 2.7 14 28.4 9.3 NA 2.9 5.9 Hazira H3 1999 Premonsoon Nr.Shore Surface HT 29 283 7.7 33 6 0.3 1 5.6 0.8 15.7 1.4 NA Hazira H3 2001 Summer Nr.Shore Surface HT 23.5 NA 7.9 33.6 6.28 1.1 0.3 15.5 4.6 NA 4.4 0.2 Hazira H3 2002 Summer Nr.Shore Surface LT 23.5 1050 8 33.7 4.86 0.3 1.9 16.2 1.8 NA 5.8 1.7 Hazira H3 2003 Summer Nr.Shore Surface LT 23.1 193 8.2 33.2 6.85 4.5 0.2 15.4 1.7 NA 3.1 NA Dwarka D2 1998 Summer Nr.Shore Surface LT 22.5 55.6 8.31 36.18 6.893 2.16 2.15 5.71 3.68 87.32 4.37 8.12 Dwarka D3 1998 Summer Nr.Shore Surface LT 22.5 54.37 8.29 36.48 5.89 1.92 1.26 4.31 3.16 84.6 4.47 2.16 Dwarka D1 1998 Summer Shore Surface LT 24.5 65.2 8.21 36.19 6.12 1.06 3.8 2.84 4.26 90.32 3.26 12.28 Dwarka D1 1998 Summer Shore Surface LT 24.5 64.8 8.28 36.37 6.249 1.23 3.72 3.22 2.86 88.41 3.82 NA Dwarka D1 1998 Summer Shore Surface LT 25 64.3 8.22 36.33 6.02 0.98 4.27 3.15 3.25 NA 2.91 NA Dwarka D1 1998 Summer Shore Surface LT 25 NA 8.31 36.42 6.249 1.12 4.32 2.92 3.68 NA 2.56 NA Dwarka D1 1998 Summer Shore Surface LT 25 NA 8.3 36.38 6.178 0.58 3.82 2.86 5.22 NA 4.12 NA Dwarka D1 1998 Summer Shore Surface LT 25 NA 8.27 36.31 6.607 0.68 3.62 2.32 3.78 NA 3.65 NA Dwarka D1 1998 Summer Shore Surface LT 24.5 NA 8.32 36.28 6.306 1.29 4.1 2.46 4.28 NA 4.2 NA Dwarka D1 1998 Postmonsoon Shore Surface LT 25.5 68.24 8.23 36.51 6.07 1.52 0.97 2.85 3.87 NA 4.88 NA Dwarka D1 1998 Postmonsoon Shore Surface LT 26 63.32 8.24 36.55 6 1.32 0.85 3.12 3.43 89.37 4.78 NA Dwarka D1 1998 Postmonsoon Shore Surface LT 26 70.48 8.25 36.62 6.11 1.26 0.92 3.18 3.92 NA 5.32 NA Dwarka D1 1998 Postmonsoon Shore Surface LT 26.1 62.14 8.21 36.66 6.04 1.37 0.95 3.11 3.78 NA 5.17 NA Dwarka D1 1998 Postmonsoon Shore Surface LT 26.5 63.64 8.19 36.53 5.89 1.24 1.2 2.8 3.82 90.32 5.29 11.25 Dwarka D1 1998 Postmonsoon Shore Surface HT 26 62.48 8.23 36.68 5.96 1.27 1.16 2.88 3.52 NA 5.12 NA Dwarka D1 1998 Postmonsoon Shore Surface HT 25.5 64.21 8.25 36.64 6.11 1.65 1.12 3.02 3.4 NA 4.78 NA Dwarka D2 1998 Postmonsoon Nr.Shore Surface LT 26 51.32 8.16 36.42 6.21 1.95 0.65 4.82 2.54 NA 5.32 NA Dwarka D2 1998 Postmonsoon Nr.Shore Surface LT 26.5 48.42 8.18 36.37 6.16 2.16 0.92 4.22 1.87 NA 5.49 NA Dwarka D2 1998 Postmonsoon Nr.Shore Surface HT 26.7 52.37 8.22 36.47 6.54 2.16 0.78 4.84 2.06 89.21 4.85 23.1 Dwarka D3 1998 Postmonsoon Nr.Shore Surface LT 25.5 48.37 8.18 36.56 6.01 2.48 0.32 4.37 2.98 NA 5.32 11 Dwarka D3 1998 Postmonsoon Nr.Shore Surface LT 26 47.22 8.12 36.62 5.69 2.38 0.88 3.87 2.51 91.22 5.12 NA Dwarka D1 1999 Summer Shore Surface LT 21.5 62.38 8.18 36.69 6.69 1.21 1.38 3.15 4.37 NA 3.72 NA Dwarka D1 1999 Summer Shore Surface LT 21.5 62.42 8.21 36.54 6.47 1.17 1.39 3.18 4.28 92.45 3.88 NA Dwarka D1 1999 Summer Shore Surface LT 21.5 64.61 8.23 36.59 6.74 0.97 1.32 2.71 3.81 NA 4.17 NA
120
Location Stcode Year Season Zone Source Tide W temp SSC pH Salinity DO BOD NO2 NO3 NH4 TN IP PHC Dwarka D1 1999 Summer Shore Surface HT 22 65.32 8.19 36.62 6.64 0.92 1.41 2.92 4.28 NA 3.85 10.2 Dwarka D1 1999 Summer Shore Surface HT 22.2 63.91 8.21 36.68 6.4 0.88 1.25 2.85 3.75 NA 4.27 NA Dwarka D1 1999 Summer Shore Surface HT 22.2 68.2 8.23 36.63 6.6 1.32 1.34 3.16 3.8 88.37 4.35 NA Dwarka D1 1999 Summer Shore Surface HT 21.7 65.52 8.24 36.69 6.7 1.12 1.23 3.13 3.85 NA 4.23 NA Dwarka D2 1999 Summer Nr.Shore Surface LT 22 48.39 8.19 36.59 6.74 2.32 1.85 5.23 3.38 85.92 3.85 NA Dwarka D2 1999 Summer Nr.Shore Surface LT 22.6 50.37 8.18 36.35 6.9 1.95 2.12 4.81 3.08 88.45 4.08 NA Dwarka D2 1999 Summer Nr.Shore Surface HT 23 51.47 8.22 36.35 6.74 2.18 1.94 4.61 3.15 90.32 3.78 2.58 Dwarka D3 1999 Summer Nr.Shore Surface LT 22.3 51.49 8.18 36.62 6.21 1.86 1.62 4.87 3.23 NA 3.86 ND Dwarka D3 1999 Summer Nr.Shore Surface LT 22.3 52.37 8.22 36.68 6.01 1.89 2.19 4.66 2.73 NA 3.85 NA Dwarka D1 2000 Summer Shore Surface HT 19.1 63.5 8.23 35.66 7.13 1.14 1.25 2.11 3.88 88.95 3.12 NA Dwarka D1 2000 Summer Shore Surface HT 19.4 NA 8.23 35.66 7.11 1.11 1.26 2.15 3.84 NA 3.12 NA Dwarka D1 2000 Summer Shore Surface HT 20.4 NA 8.24 35.67 7.13 1.2 1.22 2.14 3.84 NA 3.44 26.5 Dwarka D1 2000 Summer Shore Surface HT 21.1 63.5 8.24 35.66 6.93 0.94 1.27 2.33 2.98 NA 3.21 NA Dwarka D1 2000 Summer Shore Surface HT 21.7 NA 8.24 35.66 6.74 0.97 1.27 2.34 2.99 NA 3.22 NA Dwarka D1 2000 Summer Shore Surface HT 21.7 NA 8.23 35.67 6.63 0.98 1.25 2.32 2.95 NA 3.24 NA Dwarka D1 2000 Summer Shore Surface LT 21.8 NA 8.23 35.66 6.69 0.98 1.27 2.35 0.98 NA 3.21 NA Dwarka D2 2000 Summer Nr.Shore Surface HT 21.4 55.6 8.32 35.66 7.73 1.11 2.22 5.14 2.54 85.5 3.25 13.2 Dwarka D3 2000 Summer Nr.Shore Surface HT 21.3 37.5 8.32 35.66 7.87 1.2 1.98 4.56 3.01 79.6 2.14 ND Dwarka DW5 2003 Summer Nr.Shore Surface LT 26 23 8.3 36.2 6.14 0.6 1.8 0.5 2.6 8.5 0.8 0.2 Dwarka DW5 2003 Summer Nr.Shore Surface LT 26 NA 8.3 36.3 6.43 NA 2.6 0.5 2.8 NA 0.7 NA Dwarka DW5 2004 Summer Nr.Shore Surface HT 24 20 8.2 36 6.43 2.3 0.5 7.9 2.2 386.1 0.6 NA Dwarka DW5 2004 Summer Nr.Shore Surface HT 24 NA 8.2 35.9 6.14 NA 0.5 5.9 2.1 320.7 1 NA Dwarka DW5 2004 Postmonsoon Nr.Shore Surface HT 29 16 8.1 36.1 6.43 4.2 0.7 2.9 0.2 NA 0.5 4.2 Dwarka DW5 2004 Postmonsoon Nr.Shore Surface HT 29 NA 8.1 36.1 6.43NA 0.7 2.5 2.1 NA 0.3 NA Dwarka DW5 2006 Summer Nr.Shore Surface NA 25.5 24 8 35.6 6.57 0.2 0.3 2.9 0 NA 0.8 28.1 Dwarka DW5 2006 Summer Nr.Shore Surface NA 25.5 NA 8 35.7 6.57 NA 0.3 4 0 NA 0.8 NA Dwarka DW5 2007 Summer Nr.Shore Surface LT 24.5 12 7.9 35.87 6.46 2.26 1.26 2.4 0.11 NA 1.05 18.3 Dwarka DW5 2007 Summer Nr.Shore Surface LT 24.5 NA 7.9 35.85 6.46 NA 1.26 2.1 0.06 NA 1.03 NA Dwarka DW5 2008 Summer Nr.Shore Surface HT 25 20 8.4 36 6.86 0 0 1 0 NA 1 39.6 Dwarka DW5 2008 Summer Nr.Shore Surface HT 25 NA 8.4 36 7 NA 0 1 0 NA 1 NA Dwarka DW5 2009 Summer Nr.Shore Surface HT 26 16.8 8.1 36.3 6.3 NA 0.4 0.6 0.5 222.8 0.7 35.7 Dwarka DW5 2009 Summer Nr.Shore Surface HT 26 NA 8.1 36.1 6.6 5.9 0.4 0.8 0.8 NA 0.7 NA Vadinar V2 1998 Summer Nr.Shore Surface MT 21.7 41.82 8.19 38.54 6.178 0.92 0.31 4.82 1.91 76.54 4.32 16.28 Vadinar V2 1998 Postmonsoon Nr.Shore Surface HT 25.5 44.18 8.17 37.92 6.735 1.19 0.28 6.89 1.42 NA 5.34 10.4 Vadinar V2 1998 Postmonsoon Nr.Shore Surface MT 25 41.65 8.18 38.36 6.935 1.31 0.23 5.15 1.47 NA 4.78 NA Vadinar V2 1998 Postmonsoon Nr.Shore Surface MT 24.5 42.89 8.12 38.32 6.835 1.27 0.42 5.32 2.13 79.23 4.31 NA Vadinar V1 1998 Postmonsoon Shore Surface HT 27.7 44.89 8.23 38.15 6.692 1.18 2.21 6.31 4.72 NA 6.21 NA Vadinar V1 1998 Postmonsoon Shore Surface HT 28 45.12 8.17 38.91 6.607 1.11 1.63 5.97 6.48 NA 6.32 NA Vadinar V1 1998 Postmonsoon Shore Surface HT 27.8 47.26 8.21 38.18 6.592 0.86 1.85 6.22 5.32 90.42 5.67 NA

121
Location Stcode Year Season Zone Source Tide W temp SSC pH Salinity DO BOD NO2 NO3 NH4 TN IP PHC Vadinar V1 1998 Postmonsoon Shore Surface HT 27.6 46.38 8.18 38.12 6.478 1.06 2.18 6.78 5.18 NA 5.37 NA Vadinar V1 1998 Postmonsoon Shore Surface HT 27.2 45.47 8.2 38.85 6.235 1.23 2.06 6.52 5.82 92.62 4.42 8.7 Vadinar V1 1998 Postmonsoon Shore Surface HT 27.2 43.23 8.19 38.88 6.163 0.92 1.93 6.35 6.32 NA 4.57 NA Vadinar V1 1998 Summer Shore Surface MT 24 45.32 8.28 38.69 6.75 0.89 0.83 6.88 6.1 92.48 5.16 19.22 Vadinar V1 1998 Summer Shore Surface MT 24.5 NA 8.36 38.81 6.607 1.21 1.39 5.92 4.95 90.37 5.31 NA Vadinar V1 1998 Summer Shore Surface MT 24.5 45.81 8.27 38.75 6.263 1.15 2.21 7.1 5.83 NA 4.82 NA Vadinar V1 1998 Summer Shore Surface MT 24.5 NA 8.17 38.48 6.893 0.92 1.56 6.83 6.08 NA 5.12 NA Vadinar V1 1998 Summer Shore Surface HT 24 NA 8.28 38.62 6.507 1.32 2.13 5.82 5.45 NA 5.32 NA Vadinar V1 1998 Summer Shore Surface HT 24 NA 8.32 38.52 6.75 0.86 1.86 7.13 5.37 91.38 4.86 NA Vadinar V1 1998 Postmonsoon Shore Surface MT 27 44.58 8.22 38.97 6.392 0.83 2.15 7.22 4.78 NA 5.88 NA Vadinar V2 1999 Summer Nr.Shore Surface MT 20.5 42.29 8.21 38.38 6.95 1.37 0.32 5.87 1.32 NA 4.73 NA Vadinar V1 1999 Summer Shore Surface LT 22.5 44.86 8.2 38.91 6.549 1.18 2.04 8.32 4.19 NA 4.32 NA Vadinar V1 1999 Summer Shore Surface LT 23 45.32 8.19 38.15 6.75 0.89 2.18 6.89 6.17 NA 4.18 5.7 Vadinar V1 1999 Summer Shore Surface MT 22.5 44.47 8.21 38.85 6.621 1.24 2.23 6.81 5.63 93.61 5.81 NA Vadinar V1 1999 Summer Shore Surface MT 22.5 45.16 8.18 38.08 6.893 0.94 2.37 6.95 4.83 NA 4.65 NA Vadinar V1 1999 Summer Shore Surface MT 22.1 44.18 8.16 38.12 6.578 1.17 2.15 5.85 5.37 91.32 5.42 NA Vadinar V1 1999 Summer Shore Surface MT 22 45.32 8.17 38.23 6.478 1.28 1.95 6.32 6.28 NA 6.37 NA Vadinar V2 1999 Summer Nr.Shore Surface LT 21 44.16 8.15 38.79 6.764 1.32 0.36 6.17 2.18 NA 5.13 5.8 Vadinar V2 1999 Summer Nr.Shore Surface MT 21 41.87 8.22 38.74 6.85 1.29 0.27 4.75 1.23 NA 3.81 NA Vadinar V1 1999 Summer Shore Surface LT 22.5 44.81 8.16 38.21 6.621 1.22 2.18 7.13 5.88 NA 5.36 NA Vadinar V1 2000 Summer Shore Surface LT 22.1 NA 8.28 38.66 7.45 0.98 1.35 5.56 5.25 NA 5.22 NA Vadinar V1 2000 Summer Shore Surface LT 22.1 NA 8.27 38.64 7.465 0.99 1.35 5.57 5.22 NA 5.23 NA Vadinar V1 2000 Summer Shore Surface LT 21.5 55.4 8.27 38.7 7.45 0.98 1.35 5.56 5.26 NA 5.22 NA Vadinar V1 2000 Summer Shore Surface MT 21.3 NA 8.28 38.71 7.45 1.01 1.38 5.56 5.25 NA 5.22 NA Vadinar V1 2000 Summer Shore Surface MT 21.1 NA 8.27 38.7 7.465 1.01 1.34 5.58 5.54 NA 5.01 NA Vadinar V1 2000 Summer Shore Surface MT 20.2 NA 8.28 38.66 7.493 1.02 1.33 5.59 5.55 NA 4.58 NA Vadinar V1 2000 Summer Shore Surface MT 20.1 56.2 8.28 38.66 7.465 1.01 1.34 5.58 5.45 90.25 4.88 39.8 Vadinar V2 2000 Summer Nr.Shore Surface LT 21.1 45.2 8.22 38.65 6.978 0.95 0.33 4.88 1.23 81.2 3.98 14.5 Vadinar VD6 2003 Summer Nr.Shore Surface HT 23.1 NA 8.3 36.7 7.57 NA 0.4 6.2 0.1 NA 1.3 NA Vadinar VD6 2003 Summer Nr.Shore Surface HT 23.1 25 8.3 38.2 8.29 2.6 0.4 5.1 ND 22 1.4 0.2 Vadinar VD5 2003 Summer Nr.Shore Surface HT 23.1 NA 8.3 36.2 6.14 NA 0.4 5.8 0.2 NA 1.3 NA Vadinar VD5 2003 Summer Nr.Shore Surface HT 23.1 20 8.3 35.9 6.29 0.4 0.4 3.7 ND 7.9 1.3 0.1 Okha O1 1998 Premonsoon Shore Surface LT 26.8 37.5 7.8 36.5 3.86 1.7 0.2 2.2 0.6 NA 0.2 4.7 Okha O3 1998 Premonsoon Nr.Shore Surface LT 26.9 65 7.7 36.5 4.29 1.8 0.4 4.4 0.5 NA 1.4 4.1 Okha O1 1998 Postmonsoon Shore Surface LT 25.9 58.83 8.19 37.71 8.15 0.98 0.15 1.31 1.27 NA 0.73 18.1 Okha O4 1998 Postmonsoon Nr.Shore Surface LT 25.1 55.31 8.18 37.81 6.91 1.95 0.28 1.92 1.98 NA 0.78 5.8 Okha O3 1998 Summer Nr.Shore Surface HT 23 58.32 8.11 36.38 8.37 1.91 1.16 1.89 0.18 90.32 2.36 NA Okha O4 1998 Summer Nr.Shore Surface HT 23 60.21 8.17 36.31 7.54 1.85 1.15 1.63 0.72 NA 2.85 NA Okha O1 1998 Summer Shore Surface LT 24.5 68.23 8.12 36.19 7.67 0.82 0.45 1.82 0 101.37 5.89 ND
122
Location Stcode Year Season Zone Source Tide W temp SSC pH Salinity DO BOD NO2 NO3 NH4 TN IP PHC Okha O1 1999 Summer Shore Surface HT 21 58.38 8.22 37.71 7.87 0.93 0.8 0.92 0.39 NA 5.56 20.33 Okha O4 1999 Summer Nr.Shore Surface HT 20.5 53.89 8.22 37.27 8.48 2.15 0.95 1.78 0.17 NA 2.89 15.4 Okha O1 1999 Summer Shore Surface LT 26.2 27 8.2 35.5 4.7 2.9 0.2 2.6 0.3 32 0.8 1.7 Okha O2 1999 Summer Shore Surface LT 26.1 35 8.1 35.4 4.1 1.2 0.4 2.9 0.2 54 0.8 2.6 Okha O3 1999 Summer Nr.Shore Surface LT 25.7 42 8.2 35.3 4.7 0.7 0.5 3.8 0.5 72 0.8 2.5 Okha O4 2000 Summer Nr.Shore Surface HT 21.2 67.8 8.32 38.2 7.82 1.1 1.44 1.54 1.2 89.5 3.55 ND Okha O3 2000 Summer Nr.Shore Surface HT 21.1 67.8 8.32 38.1 7.94 1.1 1.24 1.32 1.02 98.5 4.51 11.8 Okha O1 2000 Summer Shore Surface HT 20.5 65.8 8.32 37.61 7.74 0.64 0.75 0.87 0.57 94.8 4.78 NA Okha O3 2003 Summer Nr.Shore Surface HT 23.1 42 8.3 36 6.85 1.6 0.6 1.8 0.3 8 0.6 0.1 Okha O4 2003 Summer Nr.Shore Surface HT 23.1 36 8.3 36 6.85 5.3 0.6 0.9 0.6 4.6 0.5 2.6 Okha O2 2003 Summer Shore Surface LT 24.8 22 8.2 36.4 7.14 2.1 0.4 1 0.3 6.9 0.3 0.8 Okha O1 2003 Summer Shore Surface LT 23.7 22 8.2 37.4 3 2.9 0.2 1.9 1.5 10.5 0.7 0.1 Okha O4A 2003 Summer Nr.Shore Surface LT 24 33 8.3 36.3 5.85 0.4 0.8 3.2 0.4 9.7 1.7 0.2 Mundra MU2 2003 Summer Nr.Shore Surface LT 22.2 NA 8.3 38.6 6.29 NA 0.4 4.6 5.7 NA 1.9 NA Mundra MU2 2003 Summer Nr.Shore Surface LT 22.2 42 8.3 37.7 6.57 0.4 0.4 5.1 2.3 NA 1.9 0.2 Mundra MU1 2003 Summer Shore Surface LT 22 NA 8.3 37.7 6.71 NA 0.4 4.5 4.3 NA 1.9 NA Mundra MU1 2003 Summer Shore Surface LT 22 49 8.3 37.7 6.57 0.5 0.4 3.8 3.5 10.7 1.9 0.1 Mundra MU1 2004 Summer Shore Surface LT 22 30 8.2 37.5 6.86 3.2 0.1 3.9 1.6 402 1 NA Mundra MU1 2004 Postmonsoon Shore Surface HT 28 32 8.2 37.8 5.43 2.9 0.8 3.8 5.8 NA 1.6 NA Mundra MU1 2004 Postmonsoon Shore Surface HT 28 NA 8.2 37.7 5.43NA 0.9 5.3 1.6 NA 1.6 NA Mundra MU2 2004 Postmonsoon Nr.Shore Surface HT 28 30 8.3 37.7 5.43 2.6 0.4 5.3 0.6 NA 2 13.8 Mundra MU2 2004 Postmonsoon Nr.Shore Surface HT 28 NA 8.3 37.9 5.43NA 0.5 5.8 0.8 NA 1.8 NA Mundra MU2 2004 Summer Nr.Shore Surface LT 21.4 NA 8.2 37.5 6.43 NA ND 7.9 3.5 420.9 1.1 NA Mundra MU2 2004 Summer Nr.Shore Surface LT 21.4 82 8.2 37.5 6.43 1 ND 9.9 1.6 351.1 0.8 NA Mundra MU1 2004 Summer Shore Surface LT 22 NA 8.2 37.3 6.43 NA 0.1 4.7 4.8 403 0.9 NA Pipavav PJ‐05 1998 Summer Nr.Shore Surface LT 25.8 39 8.1 33.6 5.86 1 0.1 20.5 NA NA 3.1 0.3 Pipavav PJ‐05 1998 Postmonsoon Nr.Shore Surface LT 28 NA 8.1 34.8 6.14 0.8 0.5 13.4 1.7 16.3 2.1 0.9 Pipavav PJ‐05 2000 Summer Nr.Shore Surface NA NA NA 8.4 32.9 0.94 NA 0.48 10.54 3.95 137.75 2.49 NA Pipavav PJ‐05 2000 Summer Nr.Shore Surface NA 23.5 198 8.4 32.9 1.5 NA 0.63 7.32 2.86 143.52 2.72 NA Pipavav PJ‐05 2001 Summer Nr.Shore Surface LT 21.5 144 8.2 35.2 4.29 0.2 1.5 5.2 2.5 76.8 12.1 0.6 Pipavav PJ‐05 2002 Summer Nr.Shore Surface LT 23.5 139 8.1 34.1 6 2.1 2.8 8.5 2.1 442.5 9.8 1.8 Pipavav PJ‐05 2003 Summer Nr.Shore Surface LT 23.2 NA 8.2 36.5 6.14 NA 1.1 7.1 4.5 NA 3 NA Pipavav PJ‐05 2003 Summer Nr.Shore Surface LT 23.2 666 8.2 36.6 6.29 4.6 0.9 8 3.8 14.7 2.1 0.3 Pipavav PJ‐05 2004 Postmonsoon Nr.Shore Surface HT 29 116 8 33.3 6.08 3.8 0.1 19.8 1.8 NA 2.2 9.5 Pipavav PJ‐05 2004 Postmonsoon Nr.Shore Surface HT 29 NA 8 33.02 6.4NA 0.1 20.8 1.4 NA 1.8 NA Pipavav PJ‐05 2004 Summer Nr.Shore Surface HT 22.4 76 8.1 34.1 6.71 2.8 1.5 12.1 0.7 106.6 2.5 NA Pipavav PJ‐05 2004 Summer Nr.Shore Surface HT 22.4 NA 8.1 34.2 6.71 NA 1.4 14.2 3.4 218.4 2.5 NA Pipavav PJ‐05 2006 Summer Nr.Shore Surface NA 25.2 36 8 32.9 6.43 0.2 0.5 19.5 0.5 NA 2.4 14.4 Pipavav PJ‐05 2006 Summer Nr.Shore Surface NA 25.2 NA 8 33.1 6.86 NA 0.6 25.1 0.4 NA 2.3 NA
123
Location Stcode Year Season Zone Source Tide W temp SSC pH Salinity DO BOD NO2 NO3 NH4 TN IP PHC Pipavav PJ‐05 2007 Summer Nr.Shore Surface LT 24 NA 7.7 32.9 6.4 NA 0.22 26.8 3.16 NA 2.93 NA Pipavav PJ‐05 2007 Summer Nr.Shore Surface LT 24 139 7.7 33.1 6.72 2.02 0.19 24 3 NA 2.97 19.25 Pipavav PJ‐05 2008 Summer Nr.Shore Surface LT 24 NA 8.2 35 6.57 NA 0 17 1 NA 2 NA Pipavav PJ‐05 2008 Summer Nr.Shore Surface LT 24 146 8.2 35 7.14 2 0 13 1 NA 2 50 Pipavav PJ‐05 2009 Summer Nr.Shore Surface LT 25 NA 8.2 35 6.6 NA 0.1 8 1.2 NA 2 NA Pipavav PJ‐05 2009 Summer Nr.Shore Surface LT 25 163.5 8.3 34.8 6.6 5.1 0.1 7.8 1.6 195.3 2 32.7 Porbandar P3 1998 Summer Nr.Shore Surface LT 26.4 23 8.1 36.3 6.71 1.3 0.1 0.6 NA NA 0.8 11.9 Porbandar P2 1998 Premonsoon Shore Surface LT 26 24.5 7.8 36.8 3.57 0.8 1.2 5.1 0.4 NA 0.9 5 Porbandar P1 1998 Premonsoon Shore Surface LT 28.4 30.5 7.7 36.1 2.57 1.5 0.4 7.4 16.4 NA 2.9 13.6 Porbandar P3 1998 Premonsoon Nr.Shore Surface LT 27.5 19 7.8 35.7 2.57 0.8 1 12.1 1.7 NA 0.8 12 Porbandar P3 1998 Postmonsoon Nr.Shore Surface LT 30.5 21 8.1 35.7 7.14 3.1 0.6 6.5 0.6 8.7 1.7 0.7 Porbandar P3 1999 Summer Nr.Shore Surface HT 25.4 25 8.1 34.3 7.14 3.4 0.7 2.5 1 NA 1.7 1 Porbandar P2 1999 Summer Shore Surface HT 26 26 8 34.3 6.57 1.8 0.9 5 1.1 10.2 1.5 3 Porbandar P1 1999 Summer Shore Surface HT 25.5 32 7.9 34.8 3.57 1.7 1.3 2.8 3 11.5 11.5 8.4 Porbandar P3 2000 Summer Nr.Shore Surface HT 20.5 51.4 8.23 36.54 7.822 1.24 2.35 5.21 5.55 78.5 2.56 NA Porbandar P1 2000 Summer Shore Surface LT 19.2 85.6 8.34 36.57 6.935 1.57 3.25 16.54 11.54 114.2 4.56 30.2 Porbandar P2 2000 Summer Shore Surface HT 20.1 71.2 8.34 36.57 6.449 1.25 2.22 11.21 5.66 88.1 2.58 NA Porbandar P3 2001 Summer Nr.Shore Surface LT 23.2 24 8.1 35.9 6.42 0.2 1.6 3.2 1 45.5 1.3 0.6 Porbandar P3 2002 Summer Nr.Shore Surface HT 23.8 15 8.1 35.9 5.63 0.3 0.4 3.1 0.8 84.9 0.7 1.3 Porbandar P4 2003 Summer Nr.Shore Surface LT 24.5 19 8.1 35.9 8.14 2.7 0.2 1.2 1 10.2 1.1 0.1 Porbandar P1 2003 Summer Shore Surface LT 22.9 14 7.8 36.1 2.86 2.9 1.4 5.7 18.1 61.9 2.8 2.6 Porbandar P2 2003 Summer Shore Surface LT 24.8 28 7.9 35.9 6.29 0.6 0.5 4.1 2.2 18.9 0.8 1 Porbandar P3 2003 Summer Nr.Shore Surface LT 24.8 22 7.9 36.3 6.57 2.2 0.4 1.7 1.3 10.1 0.6 1.3 Porbandar P4 2003 Summer Nr.Shore Surface LT 25 16 7.9 36.3 6.29 1.6 0.5 1.1 1.1 8.1 0.7 0.2 Kandla K1 1998 Summer Shore Surface LT 25.5 685 8.19 39.61 6.11 0.87 0.84 9.23 0.83 90.32 2.13 13.28 Kandla K1 1998 Summer Shore Surface LT 26.5 588 8.27 39.24 6.6 1.25 0.96 8.45 0.79 NA 2.93 NA Kandla K1 1998 Summer Shore Surface LT 26.5 595 8.17 39.63 5.88 0.96 1.21 7.22 1.27 NA 2.87 NA Kandla K1 1998 Summer Shore Surface LT 26.5 632 8.23 39.58 6.32 0.84 1.17 7.19 1.12 NA 3.68 NA Kandla K1 1998 Summer Shore Surface HT 26 712 8.18 39.81 6.51 0.63 0.74 9.06 0.95 NA 2.51 NA Kandla K1 1998 Summer Shore Surface HT 26 648 8.15 39.38 6.9 1.28 0.83 8.37 0.82 NA 2.82 NA Kandla K2 1998 Summer Nr.Shore Surface LT 23 517 8.18 38.27 6.92 1.22 2.37 5.27 1.22 83.26 3.73 5.57 Kandla K2 1998 Summer Nr.Shore Surface LT 24 522 8.17 38.15 7.11 1.37 3.15 5.48 1.25 NA 2.82 NA Kandla K2 1998 Summer Nr.Shore Surface MT 24.5 536 8.23 38.35 6.74 0.94 3.18 4.89 1.87 NA 3.15 NA Kandla K3 1998 Summer Nr.Shore Surface MT 22.5 537 8.24 38.32 6.32 2.31 2.06 7.35 2.42 65.82 2.35 2.16 Kandla K1 1998 Postmonsoon Shore Surface MT 25.1 573.24 8.18 39.42 6.15 0.87 0.98 7.68NA NA 2.52 12.8 Kandla K1 1998 Postmonsoon Shore Surface MT 25 688.43 8.2 39.38 6.11 1.08 0.93 8.42 0.83 NA 2.79 NA Kandla K1 1998 Postmonsoon Shore Surface MT 24.5 645.73 8.21 39.33 5.92 1.17 1.15 8.35 0.96 NA 2.85 NA Kandla K1 1998 Postmonsoon Shore Surface LT 24.5 695.71 8.17 39.58 6.01 0.82 0.8 7.75 1.05 80.37 2.8 NA Kandla K1 1998 Postmonsoon Shore Surface LT 24.3 658.23 8.22 39.27 5.5 0.96 1.32 6.95 1.21 NA 2.95 NA

124
Location Stcode Year Season Zone Source Tide W temp SSC pH Salinity DO BOD NO2 NO3 NH4 TN IP PHC Kandla K1 1998 Postmonsoon Shore Surface LT 24 NA 8.19 39.36 5.67 1.12 1.18 7.82 0.93 NA 2.75 NA Kandla K1 1998 Postmonsoon Shore Surface MT 23.8 636.42 8.18 39.45 5.87NA 1.07 6.88 1.12 79.45 3.18 NA Kandla K2 1998 Postmonsoon Nr.Shore Surface HT 25.1 558.27 8.23 39.78 7.28 1.68 2.87 5.13 1.43 NA 3.32 NA Kandla K2 1998 Postmonsoon Nr.Shore Surface HT 24.8 540.68 8.22 39.85 6.94 1.45 3.05 5.51 1.53 82.37 3.22 NA Kandla K2 1998 Postmonsoon Nr.Shore Surface LT 25.2 538.39 8.21 39.89 7.34 1.36 2.98 4.87 1.58 NA 3.17 ND Kandla K3 1998 Postmonsoon Nr.Shore Surface MT 21.5 218.37 8.23 39.96 6.95 2.13 2.03 6.48 2.37 NA 2.55 NA Kandla K3 1998 Postmonsoon Nr.Shore Surface MT 21.7 223.35 8.2 40.08 7.17 2.15 1.93 8.19 2.13 NA 2.64 10.5 Kandla K1 1998 Summer Shore Surface LT 25.5 637 8.25 39.78 6.75 1.17 1.06 7.62 1.15 76.82 3.27 NA Kandla K1 1999 Postmonsoon Shore Surface LT 20.5 532.73 8.18 39.45 6.01 1.02 1.23 6.32 0.92 74.83 2.78 NA Kandla K1 1999 Postmonsoon Shore Surface LT 21.1 518.81 8.18 39.28 6.22 0.93 0.98 5.81 0.85 NA 2.53 16.3 Kandla K1 1999 Postmonsoon Shore Surface LT 21.1 548.32 8.19 39.54 5.82 0.85 1.35 6.83 0.78 NA 1.89 NA Kandla K1 1999 Postmonsoon Shore Surface LT 22 555.3 8.19 39.23 5.5 1.27 1.23 7.12 0.65 78.81 2.65 NA Kandla K1 1999 Postmonsoon Shore Surface HT 22 556.3 8.19 39.33 6.14 1.12 0.85 6.44 1.03 NA 2.78 NA Kandla K1 1999 Postmonsoon Shore Surface HT 22.2 558.2 8.19 39.33 6.22 1.1 1.12 6.44 0.99 NA 2.56 NA Kandla K1 1999 Postmonsoon Shore Surface HT 22.1 542.3 8.19 39.32 6.21 1.11 1.02 6.48 0.92 NA 2.65 NA Kandla K2 1999 Postmonsoon Nr.Shore Surface LT 20.1 532.81 8.18 39.67 7.45 1.23 3.18 6.27 1.37 NA 4.21 NA Kandla K2 1999 Postmonsoon Nr.Shore Surface LT 21.2 463.42 8.18 39.78 6.92 1.33 2.95 6.13 1.42 80.21 3.05 NA Kandla K2 1999 Postmonsoon Nr.Shore Surface LT 21.5 589.51 8.19 39.62 6.92 1.35 3.35 5.88 1.59 78.63 2.72 9.1 Kandla K3 1999 Postmonsoon Nr.Shore Surface HT 20.4 312.41 8.19 39.83 7.07 2.29 1.87 5.92 2.87 NA 2.37 NA Kandla K3 1999 Postmonsoon Nr.Shore Surface MT 20.8 325.48 8.19 39.93 7.07 2.18 1.95 5.81 1.88 73.51 2.4 NA Kandla K1 1999 Summer Shore Surface HT 21 561.32 8.19 39.54 5.64 1.15 1.27 7.87 0.83 NA 2.73 36.54 Kandla K1 1999 Summer Shore Surface HT 21.2 588.45 8.22 39.78 5.9 0.87 0.89 7.95 1.25 NA 3.15 NA Kandla K1 1999 Summer Shore Surface HT 21 576.32 8.2 39.52 6.17 0.93 1.07 8.32 1.08 81.32 3.08 NA Kandla K1 1999 Summer Shore Surface HT 21 572.28 8.18 39.73 6.01 1.06 1.18 6.99 0.95 NA 2.85 NA Kandla K1 1999 Summer Shore Surface HT 20.7 542.52 8.2 39.75 6.24 1.15 0.95 6.85 1.15 79.68 3.28 NA Kandla K1 1999 Summer Shore Surface HT 20.5 627.38 8.2 39.54 6.08 0.95 0.87 8.21 1.13 NA 2.95 NA Kandla K1 1999 Summer Shore Surface LT 20.5 593.48 8.21 39.69 6.01 1.21 1.25 7.32 NA NA 3.18 NA Kandla K2 1999 Summer Nr.Shore Surface LT 20 508.42 8.16 39.78 6.88 1.43 2.87 4.87 1.48 NA 2.67 NA Kandla K2 1999 Summer Nr.Shore Surface HT 20.5 534.64 8.18 40.12 6.67 1.4 3.05 5.57 1.62 NA 2.85 ND Kandla K2 1999 Summer Nr.Shore Surface HT 20.5 495.52 8.15 39.87 7.04 1.26 3.13 6.13 1.58 NA 2.72 NA Kandla K3 1999 Summer Nr.Shore Surface MT 20 147.53 8.17 39.87 7.31 2.61 1.88 7.21 1.9 NA NA 10.5 Kandla K3 1999 Summer Nr.Shore Surface MT 20.5 458.92 8.16 40.29 6.97 2.08 2.27 8.12 2.31 66.38 2.53 NA Kandla K1 1999 Postmonsoon Shore Surface LT 20.3 478.45 8.19 39.38 6.18 1.19 1.12 6.32 0.78 NA 3.12 NA Kandla K1 2000 Summer Shore Surface MT 25.4 659 8.2 39.8 7.47 1.19 3.2 6.32 1.38 89.96 3.12 NA Kandla K1 2000 Summer Shore Surface MT 25.5 655 8.2 39.87 7.47 1.197 3.23 6.32 1.35 NA 3.13 NA Kandla K3 2000 Summer Nr.Shore Surface LT 26.1 688 8.23 39.99 7.94 1.211 2.25 6.23 1.25 86.9 2.99 8.9 Kandla K2 2000 Summer Nr.Shore Surface MT 26.1 698 8.23 39.8 7.49 1.113 2.22 6.21 1.26 89.4 3.12 NA Kandla K2 2000 Summer Nr.Shore Surface MT 24.9 668 8.24 39.7 7.54 1.12 2.26 6.22 NA NA 3.15 NA Kandla K2 2000 Summer Nr.Shore Surface LT 24.6 685 8.22 39.8 7.5 1.099 2.23 6.23 1.25 89.6 3.12 NA
125
Location Stcode Year Season Zone Source Tide W temp SSC pH Salinity DO BOD NO2 NO3 NH4 TN IP PHC Kandla K1 2000 Summer Shore Surface LT 26.8 744 8.21 39.89 7.5 1.197 3.23 6.32 1.33 NA 3.12 NA Kandla K1 2000 Summer Shore Surface LT 26.8 698 8.2 39.85 7.5 1.211 3.22 6.34 1.36 NA 3.09 NA Kandla K1 2000 Summer Shore Surface MT 26.5 742 8.2 39.57 7.47 1.197 3.26 6.25 1.32 96.5 3.1 NA Kandla K1 2000 Summer Shore Surface MT 26.5 756 8.21 39.98 7.5 1.211 2.99 6.26 1.32 NA 3.12 NA Kandla K1 2000 Summer Shore Surface MT 26.1 712 8.21 39.99 7.5 1.211 3.22 6.44 1.36 NA 3.11 13.5 Alang AG1 1998 Summer Shore Surface LT 30.5 565 8.18 36.22 5.4 1.21 0.28 2.16 0.78 NA 2.23 NA Alang AG1 1998 Summer Shore Surface LT 30.5 528 8.21 35.86 5.66 1.52 0.13 1.92 0.82 NA 2.46 NA Alang AG2 1998 Summer Nr.Shore Surface MT 30 623 8.18 35.27 5.51 1.23 0.14 1.71 0.83 24.37 2.68 8.18 Alang AG2 1998 Summer Nr.Shore Surface MT 30 615 8.23 36.21 6.31 1.09 0.18 1.34 0.63 NA 2.39 NA Alang AG2 1998 Summer Nr.Shore Surface MT 30.5 635 8.24 35.89 5.67 1.23 0.15 1.55 0.59 NA 2.62 NA Alang AG1 1998 Postmonsoon Shore Surface NA 28.5 545.37 8.12 33.12 5.51 1.25 0.18 1.8 0.73 NA 2.16 NA Alang AG1 1998 Postmonsoon Shore Surface MT 28.7 537.42 8.11 33.18 5.89 1.39 0.15 1.65 0.59 87.34 2.23 1400 Alang AG1 1998 Postmonsoon Shore Surface NA 28.7 552.61 8.12 33.2 6.04 1.16 0.14 1.73 0.65 NA 2.19 NA Alang AG1 1998 Postmonsoon Shore Surface NA 28.4 528.27 8.13 33.21 5.94 0.92 0.18 1.91 0.8 NA 2.43 NA Alang AG1 1998 Postmonsoon Shore Surface NA 28.2 539.46 8.1 33.18 6.11 1.1 0.13 1.64 0.77 85.28 2.31 NA Alang AG2 1998 Postmonsoon Nr.Shore Surface NA 26.2 532.53 8.1 33.21 5.97 1.25 0.15 1.62 0.98 NA 2.42 NA Alang AG2 1998 Postmonsoon Nr.Shore Surface MT 26.5 539.61 8.11 33.4 6.09 1.32 0.17 1.73 0.85 NA 2.32 62 Alang AG2 1998 Postmonsoon Nr.Shore Surface NA 26.2 552.33 8.12 33.25 6.14 1.28 0.18 1.56 0.88 NA 2.45 NA Alang AG1 1998 Summer Shore Surface LT 30 522 8.13 35.74 5.96 1.06 0.19 1.33 1.23 NA 2.32 NA Alang AG1 1998 Summer Shore Surface MT 30 542 8.17 36.21 5.49 1.53 0.11 1.82 0.96 NA 2.45 NA Alang AG1 1998 Summer Shore Surface MT 30 537 8.11 35.86 6.01 1.48 0.15 2.38 0.85 17.35 2.38 12.26 Alang AG1 1998 Summer Shore Surface MT 29.5 545 8.19 35.27 5.46 0.89 0.14 1.62 0.78 15.43 2.48 NA Alang AG1 1998 Summer Shore Surface LT 30.8 537 8.19 35.45 5.31 1.36 0.15 1.74 0.94 NA 2.16 NA Alang AG1 1999 Summer Shore Surface LT 26.8 532.59 8.12 33.17 6.46 1.26 0.19 1.52 0.92 NA 2.12 NA Alang AG1 1999 Summer Shore Surface LT 27 547.72 8.1 33.23 6.4 1.18 0.15 1.65 1.04 NA 2.36 NA Alang AG1 1999 Summer Shore Surface LT 27 560.36 8.12 33.18 6.21 1.3 0.18 1.59 1.11 NA 2.41 NA Alang AG1 1999 Summer Shore Surface HT 26.5 537.29 8.12 33.12 6.54 1.35 0.21 1.73 0.96 83.47 2.32 1200 Alang AG1 1999 Summer Shore Surface HT 26.5 568.2 8.1 33.24 6.73 1.23 0.19 1.86 0.85 NA 2.48 NA Alang AG2 1999 Summer Nr.Shore Surface HT 21.8 590.21 8.12 33.4 6.11 1.32 0.19 1.84 1.12 NA 2.55 NA Alang AG2 1999 Summer Nr.Shore Surface LT 22 587.68 8.1 33.37 6 1.3 0.18 1.92 1.08 NA 2.7 56 Alang AG2 1999 Summer Nr.Shore Surface LT 22 612.72 8.12 33.45 6.17 1.29 0.19 1.73 0.93 NA 2.62 NA Alang AG1 1999 Postmonsoon Shore Surface LT 27.8 532.19 8.12 33.27 6.19 0.89 3.45 1.8 0.21 NA 1.41 1600 Alang AG1 1999 Postmonsoon Shore Surface LT 27.9 NA 8.13 33.42 6.24 0.96 3.54 1.95 0.23 85.37 2.11 NA Alang AG1 1999 Postmonsoon Shore Surface LT 28.5 NA 8.13 33.18 6.17 1.23 4.63 2.1 0.28 NA 2.11 NA Alang AG1 1999 Postmonsoon Shore Surface LT 30.1 NA 8.13 33.26 5.69 1.18 5.84 2.2 0.26 NA 1.98 NA Alang AG1 1999 Postmonsoon Shore Surface LT 31.2 NA 8.13 33.38 5.64 1.31 4.21 2.16 0.21 NA 1.94 NA Alang AG1 1999 Postmonsoon Shore Surface LT 32 NA 8.12 33.42 5.37 1.23 4.55 2.16 0.23 NA 1.99 NA Alang AG2 1999 Postmonsoon Nr.Shore Surface LT 26.1 585.6 8.12 33.16 5.89 1.27 2.11 2.11 0.65 NA 2.23 22 Alang AG2 1999 Postmonsoon Nr.Shore Surface LT 27.4 NA 8.13 33.19 5.51 1.18 2.13 2.23 1.23 NA 2.23 NA
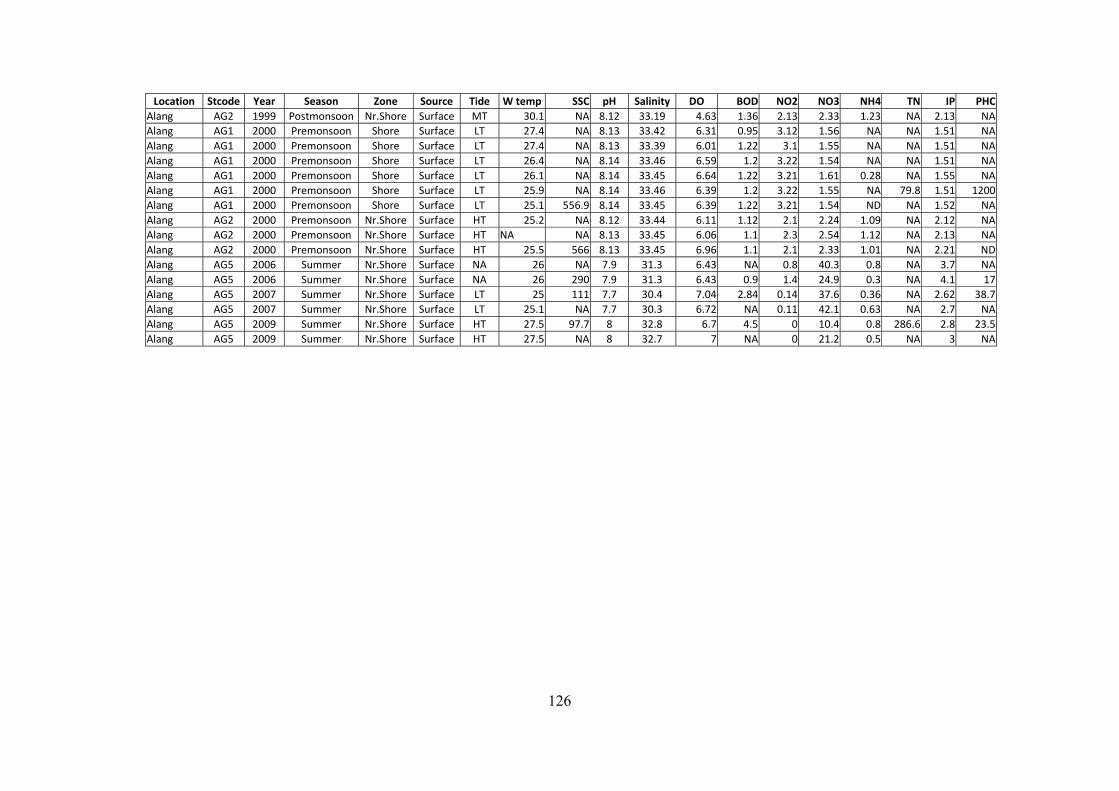
126
Location Stcode Year Season Zone Source Tide W temp SSC pH Salinity DO BOD NO2 NO3 NH4 TN IP PHC Alang AG2 1999 Postmonsoon Nr.Shore Surface MT 30.1 NA 8.12 33.19 4.63 1.36 2.13 2.33 1.23 NA 2.13 NA Alang AG1 2000 Premonsoon Shore Surface LT 27.4 NA 8.13 33.42 6.31 0.95 3.12 1.56 NA NA 1.51 NA Alang AG1 2000 Premonsoon Shore Surface LT 27.4 NA 8.13 33.39 6.01 1.22 3.1 1.55 NA NA 1.51 NA Alang AG1 2000 Premonsoon Shore Surface LT 26.4 NA 8.14 33.46 6.59 1.2 3.22 1.54 NA NA 1.51 NA Alang AG1 2000 Premonsoon Shore Surface LT 26.1 NA 8.14 33.45 6.64 1.22 3.21 1.61 0.28 NA 1.55 NA Alang AG1 2000 Premonsoon Shore Surface LT 25.9 NA 8.14 33.46 6.39 1.2 3.22 1.55 NA 79.8 1.51 1200 Alang AG1 2000 Premonsoon Shore Surface LT 25.1 556.9 8.14 33.45 6.39 1.22 3.21 1.54 ND NA 1.52 NA Alang AG2 2000 Premonsoon Nr.Shore Surface HT 25.2 NA 8.12 33.44 6.11 1.12 2.1 2.24 1.09 NA 2.12 NA Alang AG2 2000 Premonsoon Nr.Shore Surface HT NA NA 8.13 33.45 6.06 1.1 2.3 2.54 1.12 NA 2.13 NA Alang AG2 2000 Premonsoon Nr.Shore Surface HT 25.5 566 8.13 33.45 6.96 1.1 2.1 2.33 1.01 NA 2.21 ND Alang AG5 2006 Summer Nr.Shore Surface NA 26 NA 7.9 31.3 6.43 NA 0.8 40.3 0.8 NA 3.7 NA Alang AG5 2006 Summer Nr.Shore Surface NA 26 290 7.9 31.3 6.43 0.9 1.4 24.9 0.3 NA 4.1 17 Alang AG5 2007 Summer Nr.Shore Surface LT 25 111 7.7 30.4 7.04 2.84 0.14 37.6 0.36 NA 2.62 38.7 Alang AG5 2007 Summer Nr.Shore Surface LT 25.1 NA 7.7 30.3 6.72 NA 0.11 42.1 0.63 NA 2.7 NA Alang AG5 2009 Summer Nr.Shore Surface HT 27.5 97.7 8 32.8 6.7 4.5 0 10.4 0.8 286.6 2.8 23.5 Alang AG5 2009 Summer Nr.Shore Surface HT 27.5 NA 8 32.7 7 NA 0 21.2 0.5 NA 3 NA
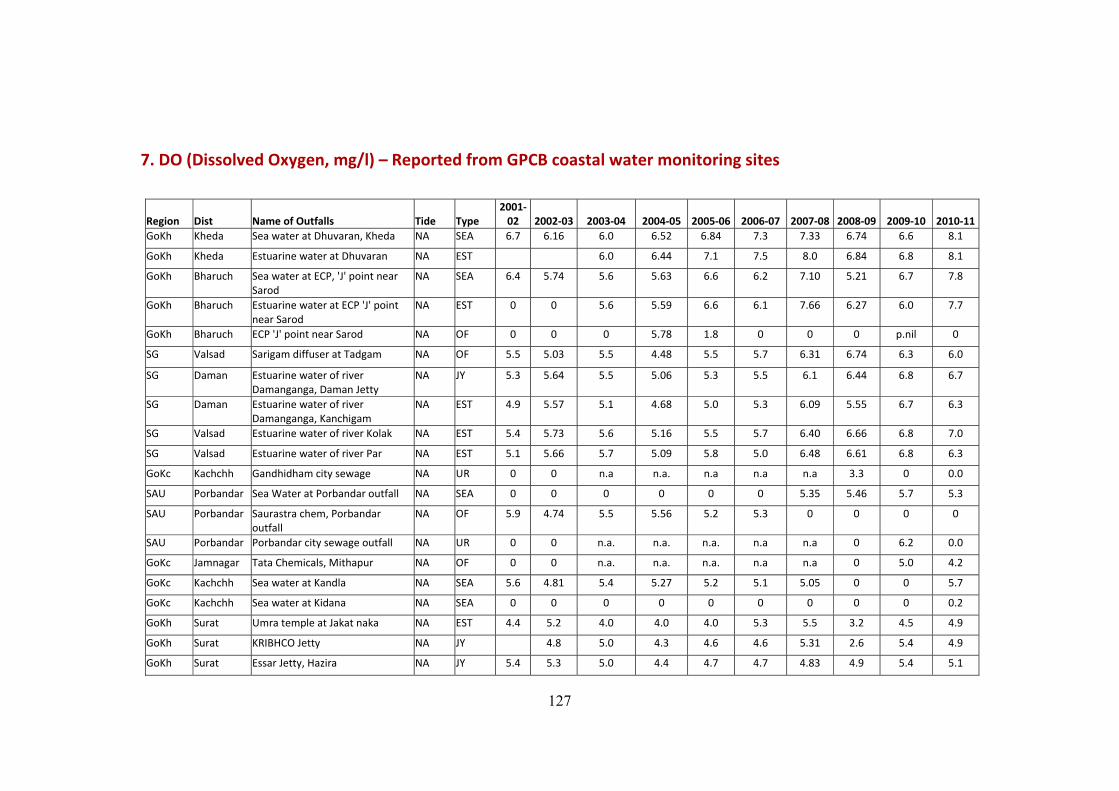
127
7. DO (Dissolved Oxygen, mg/l) – Reported from GPCB coastal water monitoring sites
Region Dist Name of Outfalls Tide Type 2001‐02 2002‐03 2003‐04 2004‐05 2005‐06 2006‐07 2007‐08 2008‐09 2009‐10 2010‐11
GoKh Kheda Sea water at Dhuvaran, Kheda NA SEA 6.7 6.16 6.0 6.52 6.84 7.3 7.33 6.74 6.6 8.1
GoKh Kheda Estuarine water at Dhuvaran NA EST 6.0 6.44 7.1 7.5 8.0 6.84 6.8 8.1
GoKh Bharuch Sea water at ECP, 'J' point near Sarod
NA SEA 6.4 5.74 5.6 5.63 6.6 6.2 7.10 5.21 6.7 7.8
GoKh Bharuch Estuarine water at ECP 'J' point near Sarod
NA EST 0 0 5.6 5.59 6.6 6.1 7.66 6.27 6.0 7.7
GoKh Bharuch ECP 'J' point near Sarod NA OF 0 0 0 5.78 1.8 0 0 0 p.nil 0
SG Valsad Sarigam diffuser at Tadgam NA OF 5.5 5.03 5.5 4.48 5.5 5.7 6.31 6.74 6.3 6.0
SG Daman Estuarine water of river Damanganga, Daman Jetty
NA JY 5.3 5.64 5.5 5.06 5.3 5.5 6.1 6.44 6.8 6.7
SG Daman Estuarine water of river Damanganga, Kanchigam
NA EST 4.9 5.57 5.1 4.68 5.0 5.3 6.09 5.55 6.7 6.3
SG Valsad Estuarine water of river Kolak NA EST 5.4 5.73 5.6 5.16 5.5 5.7 6.40 6.66 6.8 7.0
SG Valsad Estuarine water of river Par NA EST 5.1 5.66 5.7 5.09 5.8 5.0 6.48 6.61 6.8 6.3
GoKc Kachchh Gandhidham city sewage NA UR 0 0 n.a n.a. n.a n.a n.a 3.3 0 0.0
SAU Porbandar Sea Water at Porbandar outfall NA SEA 0 0 0 0 0 0 5.35 5.46 5.7 5.3
SAU Porbandar Saurastra chem, Porbandar outfall
NA OF 5.9 4.74 5.5 5.56 5.2 5.3 0 0 0 0
SAU Porbandar Porbandar city sewage outfall NA UR 0 0 n.a. n.a. n.a. n.a n.a 0 6.2 0.0
GoKc Jamnagar Tata Chemicals, Mithapur NA OF 0 0 n.a. n.a. n.a. n.a n.a 0 5.0 4.2
GoKc Kachchh Sea water at Kandla NA SEA 5.6 4.81 5.4 5.27 5.2 5.1 5.05 0 0 5.7
GoKc Kachchh Sea water at Kidana NA SEA 0 0 0 0 0 0 0 0 0 0.2
GoKh Surat Umra temple at Jakat naka NA EST 4.4 5.2 4.0 4.0 4.0 5.3 5.5 3.2 4.5 4.9
GoKh Surat KRIBHCO Jetty NA JY 4.8 5.0 4.3 4.6 4.6 5.31 2.6 5.4 4.9
GoKh Surat Essar Jetty, Hazira NA JY 5.4 5.3 5.0 4.4 4.7 4.7 4.83 4.9 5.4 5.1
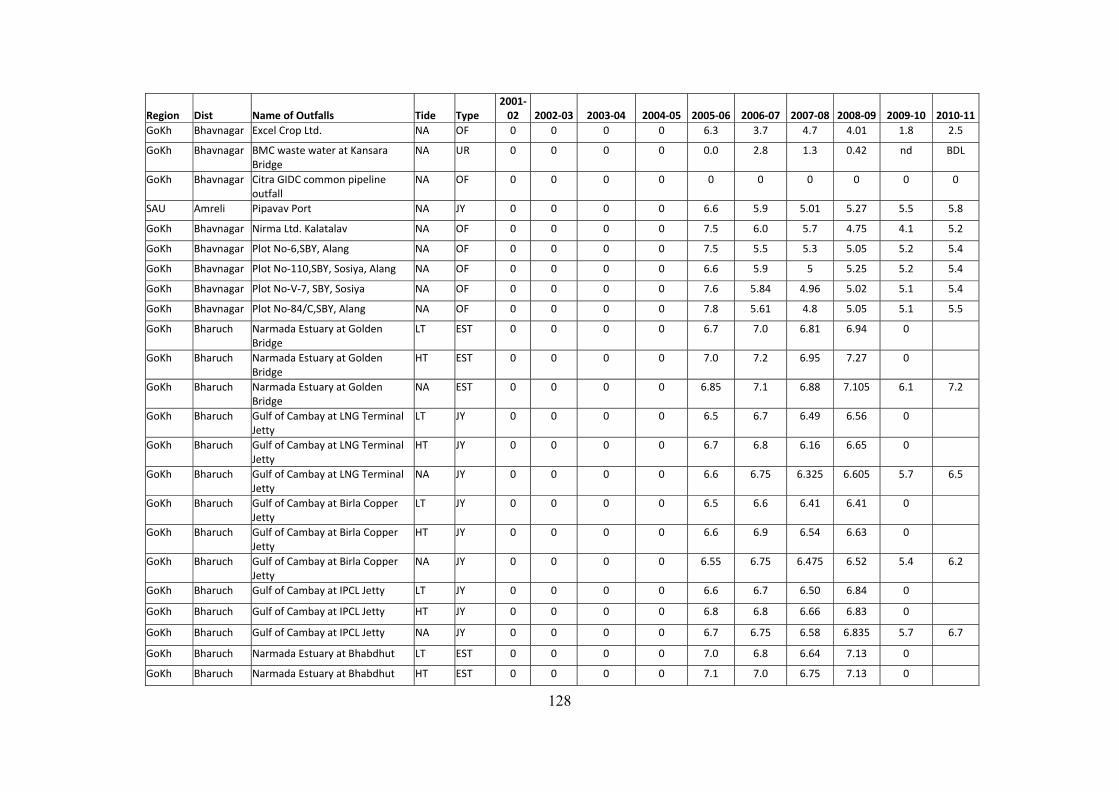
128
Region Dist Name of Outfalls Tide Type 2001‐02 2002‐03 2003‐04 2004‐05 2005‐06 2006‐07 2007‐08 2008‐09 2009‐10 2010‐11
GoKh Bhavnagar Excel Crop Ltd. NA OF 0 0 0 0 6.3 3.7 4.7 4.01 1.8 2.5
GoKh Bhavnagar BMC waste water at Kansara Bridge
NA UR 0 0 0 0 0.0 2.8 1.3 0.42 nd BDL
GoKh Bhavnagar Citra GIDC common pipeline outfall
NA OF 0 0 0 0 0 0 0 0 0 0
SAU Amreli Pipavav Port NA JY 0 0 0 0 6.6 5.9 5.01 5.27 5.5 5.8
GoKh Bhavnagar Nirma Ltd. Kalatalav NA OF 0 0 0 0 7.5 6.0 5.7 4.75 4.1 5.2
GoKh Bhavnagar Plot No‐6,SBY, Alang NA OF 0 0 0 0 7.5 5.5 5.3 5.05 5.2 5.4
GoKh Bhavnagar Plot No‐110,SBY, Sosiya, Alang NA OF 0 0 0 0 6.6 5.9 5 5.25 5.2 5.4
GoKh Bhavnagar Plot No‐V‐7, SBY, Sosiya NA OF 0 0 0 0 7.6 5.84 4.96 5.02 5.1 5.4
GoKh Bhavnagar Plot No‐84/C,SBY, Alang NA OF 0 0 0 0 7.8 5.61 4.8 5.05 5.1 5.5
GoKh Bharuch Narmada Estuary at Golden Bridge
LT EST 0 0 0 0 6.7 7.0 6.81 6.94 0
GoKh Bharuch Narmada Estuary at Golden Bridge
HT EST 0 0 0 0 7.0 7.2 6.95 7.27 0
GoKh Bharuch Narmada Estuary at Golden Bridge
NA EST 0 0 0 0 6.85 7.1 6.88 7.105 6.1 7.2
GoKh Bharuch Gulf of Cambay at LNG Terminal Jetty
LT JY 0 0 0 0 6.5 6.7 6.49 6.56 0
GoKh Bharuch Gulf of Cambay at LNG Terminal Jetty
HT JY 0 0 0 0 6.7 6.8 6.16 6.65 0
GoKh Bharuch Gulf of Cambay at LNG Terminal Jetty
NA JY 0 0 0 0 6.6 6.75 6.325 6.605 5.7 6.5
GoKh Bharuch Gulf of Cambay at Birla Copper Jetty
LT JY 0 0 0 0 6.5 6.6 6.41 6.41 0
GoKh Bharuch Gulf of Cambay at Birla Copper Jetty
HT JY 0 0 0 0 6.6 6.9 6.54 6.63 0
GoKh Bharuch Gulf of Cambay at Birla Copper Jetty
NA JY 0 0 0 0 6.55 6.75 6.475 6.52 5.4 6.2
GoKh Bharuch Gulf of Cambay at IPCL Jetty LT JY 0 0 0 0 6.6 6.7 6.50 6.84 0
GoKh Bharuch Gulf of Cambay at IPCL Jetty HT JY 0 0 0 0 6.8 6.8 6.66 6.83 0
GoKh Bharuch Gulf of Cambay at IPCL Jetty NA JY 0 0 0 0 6.7 6.75 6.58 6.835 5.7 6.7
GoKh Bharuch Narmada Estuary at Bhabdhut LT EST 0 0 0 0 7.0 6.8 6.64 7.13 0
GoKh Bharuch Narmada Estuary at Bhabdhut HT EST 0 0 0 0 7.1 7.0 6.75 7.13 0
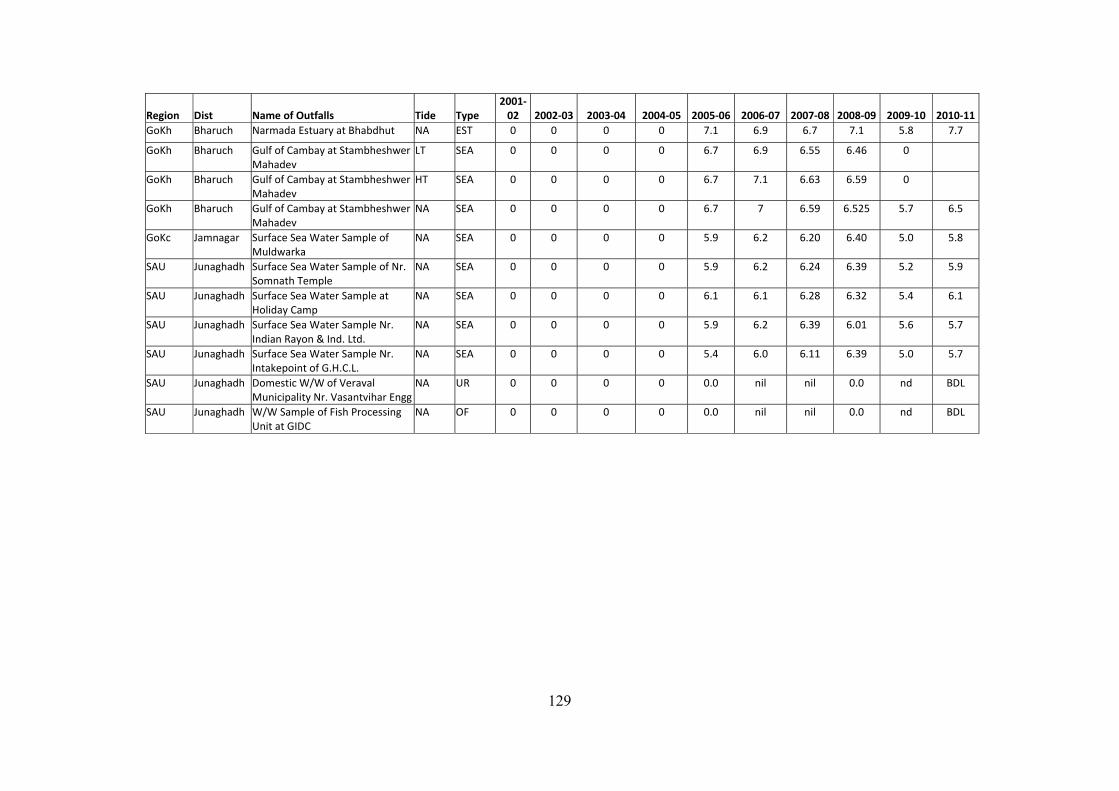
129
Region Dist Name of Outfalls Tide Type 2001‐02 2002‐03 2003‐04 2004‐05 2005‐06 2006‐07 2007‐08 2008‐09 2009‐10 2010‐11
GoKh Bharuch Narmada Estuary at Bhabdhut NA EST 0 0 0 0 7.1 6.9 6.7 7.1 5.8 7.7
GoKh Bharuch Gulf of Cambay at Stambheshwer Mahadev
LT SEA 0 0 0 0 6.7 6.9 6.55 6.46 0
GoKh Bharuch Gulf of Cambay at Stambheshwer Mahadev
HT SEA 0 0 0 0 6.7 7.1 6.63 6.59 0
GoKh Bharuch Gulf of Cambay at Stambheshwer Mahadev
NA SEA 0 0 0 0 6.7 7 6.59 6.525 5.7 6.5
GoKc Jamnagar Surface Sea Water Sample of Muldwarka
NA SEA 0 0 0 0 5.9 6.2 6.20 6.40 5.0 5.8
SAU Junaghadh Surface Sea Water Sample of Nr. Somnath Temple
NA SEA 0 0 0 0 5.9 6.2 6.24 6.39 5.2 5.9
SAU Junaghadh Surface Sea Water Sample at Holiday Camp
NA SEA 0 0 0 0 6.1 6.1 6.28 6.32 5.4 6.1
SAU Junaghadh Surface Sea Water Sample Nr. Indian Rayon & Ind. Ltd.
NA SEA 0 0 0 0 5.9 6.2 6.39 6.01 5.6 5.7
SAU Junaghadh Surface Sea Water Sample Nr. Intakepoint of G.H.C.L.
NA SEA 0 0 0 0 5.4 6.0 6.11 6.39 5.0 5.7
SAU Junaghadh Domestic W/W of Veraval Municipality Nr. Vasantvihar Engg
NA UR 0 0 0 0 0.0 nil nil 0.0 nd BDL
SAU Junaghadh W/W Sample of Fish Processing Unit at GIDC
NA OF 0 0 0 0 0.0 nil nil 0.0 nd BDL
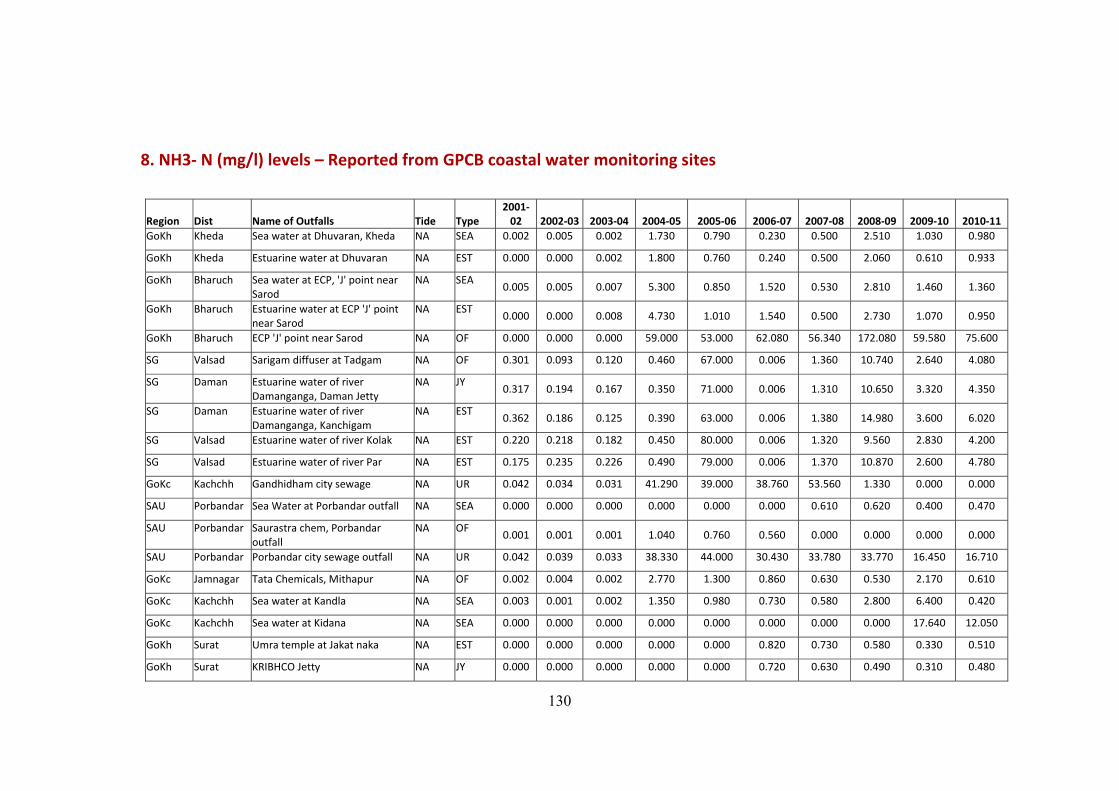
130
8. NH3‐ N (mg/l) levels – Reported from GPCB coastal water monitoring sites
Region Dist Name of Outfalls Tide Type 2001‐02 2002‐03 2003‐04 2004‐05 2005‐06 2006‐07 2007‐08 2008‐09 2009‐10 2010‐11
GoKh Kheda Sea water at Dhuvaran, Kheda NA SEA 0.002 0.005 0.002 1.730 0.790 0.230 0.500 2.510 1.030 0.980
GoKh Kheda Estuarine water at Dhuvaran NA EST 0.000 0.000 0.002 1.800 0.760 0.240 0.500 2.060 0.610 0.933
GoKh Bharuch Sea water at ECP, 'J' point near Sarod
NA SEA 0.005 0.005 0.007 5.300 0.850 1.520 0.530 2.810 1.460 1.360
GoKh Bharuch Estuarine water at ECP 'J' point near Sarod
NA EST 0.000 0.000 0.008 4.730 1.010 1.540 0.500 2.730 1.070 0.950
GoKh Bharuch ECP 'J' point near Sarod NA OF 0.000 0.000 0.000 59.000 53.000 62.080 56.340 172.080 59.580 75.600
SG Valsad Sarigam diffuser at Tadgam NA OF 0.301 0.093 0.120 0.460 67.000 0.006 1.360 10.740 2.640 4.080
SG Daman Estuarine water of river Damanganga, Daman Jetty
NA JY 0.317 0.194 0.167 0.350 71.000 0.006 1.310 10.650 3.320 4.350
SG Daman Estuarine water of river Damanganga, Kanchigam
NA EST 0.362 0.186 0.125 0.390 63.000 0.006 1.380 14.980 3.600 6.020
SG Valsad Estuarine water of river Kolak NA EST 0.220 0.218 0.182 0.450 80.000 0.006 1.320 9.560 2.830 4.200
SG Valsad Estuarine water of river Par NA EST 0.175 0.235 0.226 0.490 79.000 0.006 1.370 10.870 2.600 4.780
GoKc Kachchh Gandhidham city sewage NA UR 0.042 0.034 0.031 41.290 39.000 38.760 53.560 1.330 0.000 0.000
SAU Porbandar Sea Water at Porbandar outfall NA SEA 0.000 0.000 0.000 0.000 0.000 0.000 0.610 0.620 0.400 0.470
SAU Porbandar Saurastra chem, Porbandar outfall
NA OF 0.001 0.001 0.001 1.040 0.760 0.560 0.000 0.000 0.000 0.000
SAU Porbandar Porbandar city sewage outfall NA UR 0.042 0.039 0.033 38.330 44.000 30.430 33.780 33.770 16.450 16.710
GoKc Jamnagar Tata Chemicals, Mithapur NA OF 0.002 0.004 0.002 2.770 1.300 0.860 0.630 0.530 2.170 0.610
GoKc Kachchh Sea water at Kandla NA SEA 0.003 0.001 0.002 1.350 0.980 0.730 0.580 2.800 6.400 0.420
GoKc Kachchh Sea water at Kidana NA SEA 0.000 0.000 0.000 0.000 0.000 0.000 0.000 0.000 17.640 12.050
GoKh Surat Umra temple at Jakat naka NA EST 0.000 0.000 0.000 0.000 0.000 0.820 0.730 0.580 0.330 0.510
GoKh Surat KRIBHCO Jetty NA JY 0.000 0.000 0.000 0.000 0.000 0.720 0.630 0.490 0.310 0.480
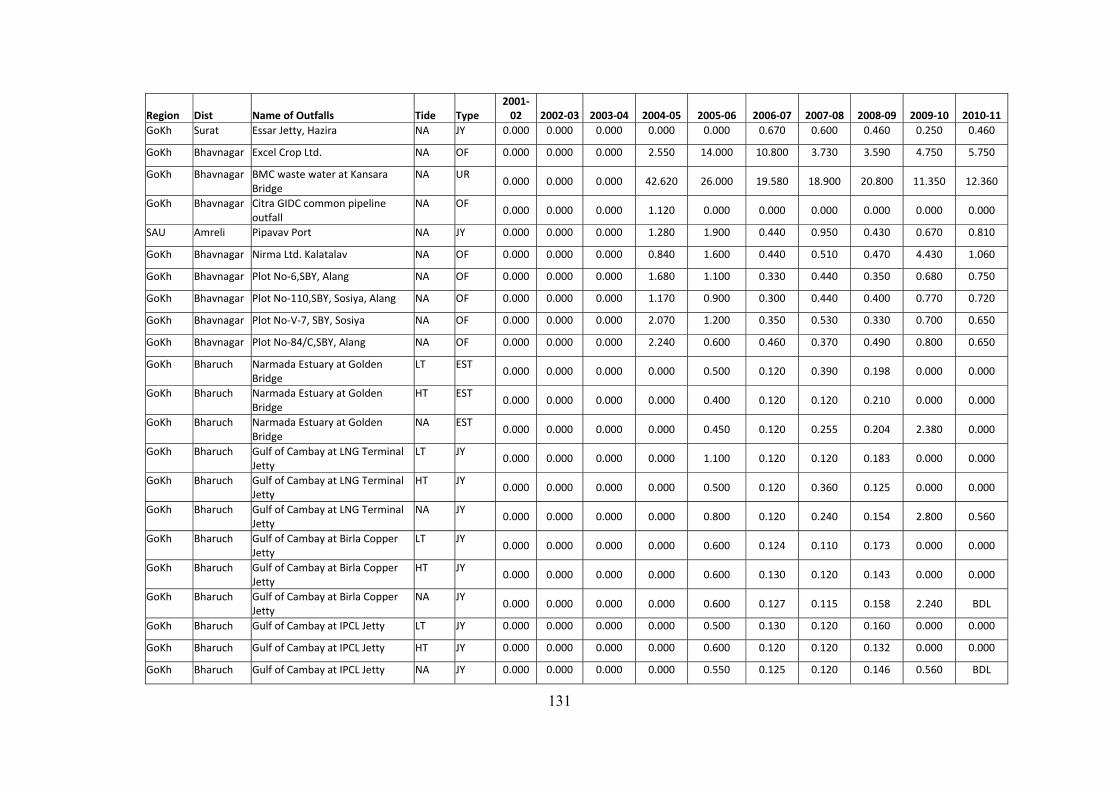
131
Region Dist Name of Outfalls Tide Type 2001‐02 2002‐03 2003‐04 2004‐05 2005‐06 2006‐07 2007‐08 2008‐09 2009‐10 2010‐11
GoKh Surat Essar Jetty, Hazira NA JY 0.000 0.000 0.000 0.000 0.000 0.670 0.600 0.460 0.250 0.460
GoKh Bhavnagar Excel Crop Ltd. NA OF 0.000 0.000 0.000 2.550 14.000 10.800 3.730 3.590 4.750 5.750
GoKh Bhavnagar BMC waste water at Kansara Bridge
NA UR 0.000 0.000 0.000 42.620 26.000 19.580 18.900 20.800 11.350 12.360
GoKh Bhavnagar Citra GIDC common pipeline outfall
NA OF 0.000 0.000 0.000 1.120 0.000 0.000 0.000 0.000 0.000 0.000
SAU Amreli Pipavav Port NA JY 0.000 0.000 0.000 1.280 1.900 0.440 0.950 0.430 0.670 0.810
GoKh Bhavnagar Nirma Ltd. Kalatalav NA OF 0.000 0.000 0.000 0.840 1.600 0.440 0.510 0.470 4.430 1.060
GoKh Bhavnagar Plot No‐6,SBY, Alang NA OF 0.000 0.000 0.000 1.680 1.100 0.330 0.440 0.350 0.680 0.750
GoKh Bhavnagar Plot No‐110,SBY, Sosiya, Alang NA OF 0.000 0.000 0.000 1.170 0.900 0.300 0.440 0.400 0.770 0.720
GoKh Bhavnagar Plot No‐V‐7, SBY, Sosiya NA OF 0.000 0.000 0.000 2.070 1.200 0.350 0.530 0.330 0.700 0.650
GoKh Bhavnagar Plot No‐84/C,SBY, Alang NA OF 0.000 0.000 0.000 2.240 0.600 0.460 0.370 0.490 0.800 0.650
GoKh Bharuch Narmada Estuary at Golden Bridge
LT EST 0.000 0.000 0.000 0.000 0.500 0.120 0.390 0.198 0.000 0.000
GoKh Bharuch Narmada Estuary at Golden Bridge
HT EST 0.000 0.000 0.000 0.000 0.400 0.120 0.120 0.210 0.000 0.000
GoKh Bharuch Narmada Estuary at Golden Bridge
NA EST 0.000 0.000 0.000 0.000 0.450 0.120 0.255 0.204 2.380 0.000
GoKh Bharuch Gulf of Cambay at LNG Terminal Jetty
LT JY 0.000 0.000 0.000 0.000 1.100 0.120 0.120 0.183 0.000 0.000
GoKh Bharuch Gulf of Cambay at LNG Terminal Jetty
HT JY 0.000 0.000 0.000 0.000 0.500 0.120 0.360 0.125 0.000 0.000
GoKh Bharuch Gulf of Cambay at LNG Terminal Jetty
NA JY 0.000 0.000 0.000 0.000 0.800 0.120 0.240 0.154 2.800 0.560
GoKh Bharuch Gulf of Cambay at Birla Copper Jetty
LT JY 0.000 0.000 0.000 0.000 0.600 0.124 0.110 0.173 0.000 0.000
GoKh Bharuch Gulf of Cambay at Birla Copper Jetty
HT JY 0.000 0.000 0.000 0.000 0.600 0.130 0.120 0.143 0.000 0.000
GoKh Bharuch Gulf of Cambay at Birla Copper Jetty
NA JY 0.000 0.000 0.000 0.000 0.600 0.127 0.115 0.158 2.240 BDL
GoKh Bharuch Gulf of Cambay at IPCL Jetty LT JY 0.000 0.000 0.000 0.000 0.500 0.130 0.120 0.160 0.000 0.000
GoKh Bharuch Gulf of Cambay at IPCL Jetty HT JY 0.000 0.000 0.000 0.000 0.600 0.120 0.120 0.132 0.000 0.000
GoKh Bharuch Gulf of Cambay at IPCL Jetty NA JY 0.000 0.000 0.000 0.000 0.550 0.125 0.120 0.146 0.560 BDL

132
Region Dist Name of Outfalls Tide Type 2001‐02 2002‐03 2003‐04 2004‐05 2005‐06 2006‐07 2007‐08 2008‐09 2009‐10 2010‐11
GoKh Bharuch Narmada Estuary at Bhabdhut LT EST 0.000 0.000 0.000 0.000 0.100 0.130 0.120 0.162 0.000 0.000
GoKh Bharuch Narmada Estuary at Bhabdhut HT EST 0.000 0.000 0.000 0.000 0.700 0.130 0.130 0.131 0.000 0.000
GoKh Bharuch Narmada Estuary at Bhabdhut NA EST 0.000 0.000 0.000 0.000 0.400 0.130 0.125 0.147 5.040 1.120
GoKh Bharuch Gulf of Cambay at Stambheshwer Mahadev
LT SEA 0.000 0.000 0.000 0.000 0.500 0.130 0.120 0.162 0.000 0.000
GoKh Bharuch Gulf of Cambay at Stambheshwer Mahadev
HT SEA 0.000 0.000 0.000 0.000 0.600 0.130 0.120 0.166 0.000 0.000
GoKh Bharuch Gulf of Cambay at Stambheshwer Mahadev
NA SEA 0.000 0.000 0.000 0.000 0.550 0.130 0.120 0.164 3.830 0.560
GoKc Jamnagar Surface Sea Water Sample of Muldwarka
NA SEA 0.000 0.000 0.000 0.000 0.600 0.330 1.140 1.430 1.120 0.420
SAU Junaghadh Surface Sea Water Sample of Nr. Somnath Temple
NA SEA 0.000 0.000 0.000 0.000 0.800 0.440 1.820 2.670 0.990 0.520
SAU Junaghadh Surface Sea Water Sample at Holiday Camp
NA SEA 0.000 0.000 0.000 0.000 0.900 0.510 0.960 1.720 1.240 0.520
SAU Junaghadh Surface Sea Water Sample Nr. Indian Rayon & Ind. Ltd.
NA SEA 0.000 0.000 0.000 0.000 0.600 1.160 1.450 2.660 1.230 0.570
SAU Junaghadh Surface Sea Water Sample Nr. Intakepoint of G.H.C.L.
NA SEA 0.000 0.000 0.000 0.000 0.700 0.540 1.790 2.490 1.040 0.560
SAU Junaghadh Domestic W/W of Veraval Municipality Nr. Vasantvihar Engg
NA UR 0.000 0.000 0.000 0.000 33.000 35.440 37.460 44.730 39.340 50.000
SAU Junaghadh W/W Sample of Fish Processing Unit at GIDC
NA OF 0.000 0.000 0.000 0.000 176.000 125.720 126.230 165.140 310.000 171.000
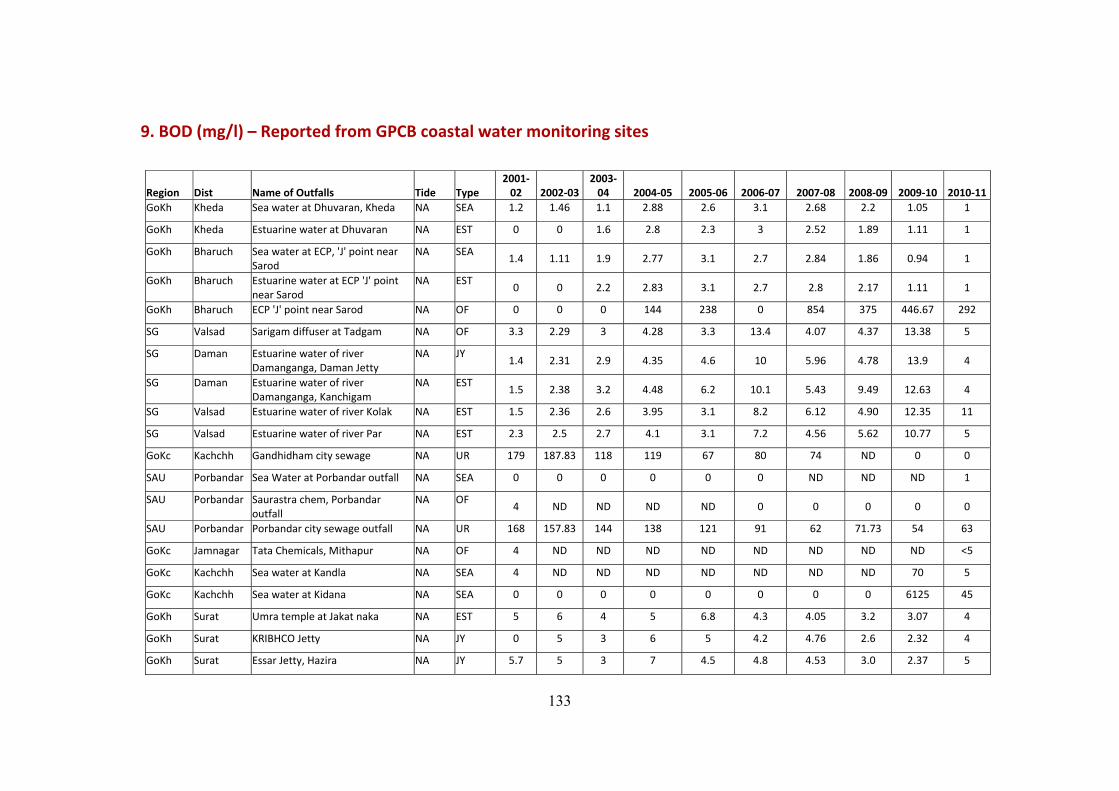
133
9. BOD (mg/l) – Reported from GPCB coastal water monitoring sites
Region Dist Name of Outfalls Tide Type 2001‐02 2002‐03
2003‐04 2004‐05 2005‐06 2006‐07 2007‐08 2008‐09 2009‐10 2010‐11
GoKh Kheda Sea water at Dhuvaran, Kheda NA SEA 1.2 1.46 1.1 2.88 2.6 3.1 2.68 2.2 1.05 1
GoKh Kheda Estuarine water at Dhuvaran NA EST 0 0 1.6 2.8 2.3 3 2.52 1.89 1.11 1
GoKh Bharuch Sea water at ECP, 'J' point near Sarod
NA SEA 1.4 1.11 1.9 2.77 3.1 2.7 2.84 1.86 0.94 1
GoKh Bharuch Estuarine water at ECP 'J' point near Sarod
NA EST 0 0 2.2 2.83 3.1 2.7 2.8 2.17 1.11 1
GoKh Bharuch ECP 'J' point near Sarod NA OF 0 0 0 144 238 0 854 375 446.67 292
SG Valsad Sarigam diffuser at Tadgam NA OF 3.3 2.29 3 4.28 3.3 13.4 4.07 4.37 13.38 5
SG Daman Estuarine water of river Damanganga, Daman Jetty
NA JY 1.4 2.31 2.9 4.35 4.6 10 5.96 4.78 13.9 4
SG Daman Estuarine water of river Damanganga, Kanchigam
NA EST 1.5 2.38 3.2 4.48 6.2 10.1 5.43 9.49 12.63 4
SG Valsad Estuarine water of river Kolak NA EST 1.5 2.36 2.6 3.95 3.1 8.2 6.12 4.90 12.35 11
SG Valsad Estuarine water of river Par NA EST 2.3 2.5 2.7 4.1 3.1 7.2 4.56 5.62 10.77 5
GoKc Kachchh Gandhidham city sewage NA UR 179 187.83 118 119 67 80 74 ND 0 0
SAU Porbandar Sea Water at Porbandar outfall NA SEA 0 0 0 0 0 0 ND ND ND 1
SAU Porbandar Saurastra chem, Porbandar outfall
NA OF 4 ND ND ND ND 0 0 0 0 0
SAU Porbandar Porbandar city sewage outfall NA UR 168 157.83 144 138 121 91 62 71.73 54 63
GoKc Jamnagar Tata Chemicals, Mithapur NA OF 4 ND ND ND ND ND ND ND ND <5
GoKc Kachchh Sea water at Kandla NA SEA 4 ND ND ND ND ND ND ND 70 5
GoKc Kachchh Sea water at Kidana NA SEA 0 0 0 0 0 0 0 0 6125 45
GoKh Surat Umra temple at Jakat naka NA EST 5 6 4 5 6.8 4.3 4.05 3.2 3.07 4
GoKh Surat KRIBHCO Jetty NA JY 0 5 3 6 5 4.2 4.76 2.6 2.32 4
GoKh Surat Essar Jetty, Hazira NA JY 5.7 5 3 7 4.5 4.8 4.53 3.0 2.37 5
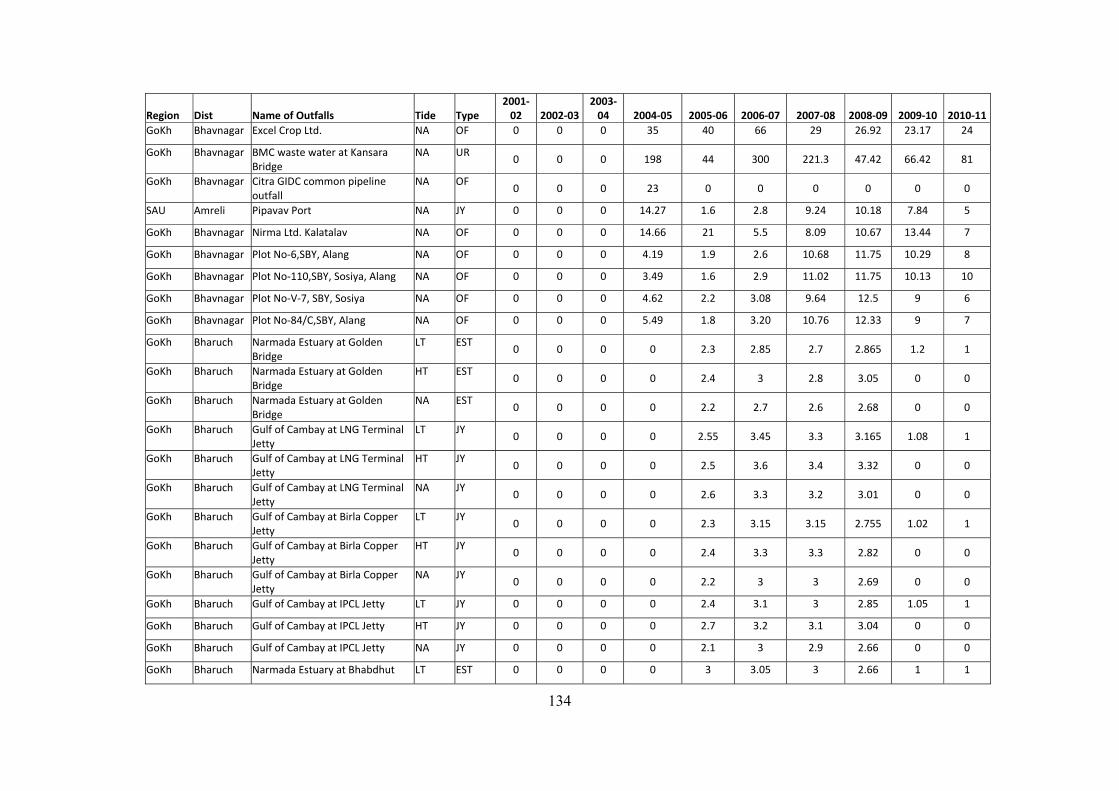
134
Region Dist Name of Outfalls Tide Type 2001‐02 2002‐03
2003‐04 2004‐05 2005‐06 2006‐07 2007‐08 2008‐09 2009‐10 2010‐11
GoKh Bhavnagar Excel Crop Ltd. NA OF 0 0 0 35 40 66 29 26.92 23.17 24
GoKh Bhavnagar BMC waste water at Kansara Bridge
NA UR 0 0 0 198 44 300 221.3 47.42 66.42 81
GoKh Bhavnagar Citra GIDC common pipeline outfall
NA OF 0 0 0 23 0 0 0 0 0 0
SAU Amreli Pipavav Port NA JY 0 0 0 14.27 1.6 2.8 9.24 10.18 7.84 5
GoKh Bhavnagar Nirma Ltd. Kalatalav NA OF 0 0 0 14.66 21 5.5 8.09 10.67 13.44 7
GoKh Bhavnagar Plot No‐6,SBY, Alang NA OF 0 0 0 4.19 1.9 2.6 10.68 11.75 10.29 8
GoKh Bhavnagar Plot No‐110,SBY, Sosiya, Alang NA OF 0 0 0 3.49 1.6 2.9 11.02 11.75 10.13 10
GoKh Bhavnagar Plot No‐V‐7, SBY, Sosiya NA OF 0 0 0 4.62 2.2 3.08 9.64 12.5 9 6
GoKh Bhavnagar Plot No‐84/C,SBY, Alang NA OF 0 0 0 5.49 1.8 3.20 10.76 12.33 9 7
GoKh Bharuch Narmada Estuary at Golden Bridge
LT EST 0 0 0 0 2.3 2.85 2.7 2.865 1.2 1
GoKh Bharuch Narmada Estuary at Golden Bridge
HT EST 0 0 0 0 2.4 3 2.8 3.05 0 0
GoKh Bharuch Narmada Estuary at Golden Bridge
NA EST 0 0 0 0 2.2 2.7 2.6 2.68 0 0
GoKh Bharuch Gulf of Cambay at LNG Terminal Jetty
LT JY 0 0 0 0 2.55 3.45 3.3 3.165 1.08 1
GoKh Bharuch Gulf of Cambay at LNG Terminal Jetty
HT JY 0 0 0 0 2.5 3.6 3.4 3.32 0 0
GoKh Bharuch Gulf of Cambay at LNG Terminal Jetty
NA JY 0 0 0 0 2.6 3.3 3.2 3.01 0 0
GoKh Bharuch Gulf of Cambay at Birla Copper Jetty
LT JY 0 0 0 0 2.3 3.15 3.15 2.755 1.02 1
GoKh Bharuch Gulf of Cambay at Birla Copper Jetty
HT JY 0 0 0 0 2.4 3.3 3.3 2.82 0 0
GoKh Bharuch Gulf of Cambay at Birla Copper Jetty
NA JY 0 0 0 0 2.2 3 3 2.69 0 0
GoKh Bharuch Gulf of Cambay at IPCL Jetty LT JY 0 0 0 0 2.4 3.1 3 2.85 1.05 1
GoKh Bharuch Gulf of Cambay at IPCL Jetty HT JY 0 0 0 0 2.7 3.2 3.1 3.04 0 0
GoKh Bharuch Gulf of Cambay at IPCL Jetty NA JY 0 0 0 0 2.1 3 2.9 2.66 0 0
GoKh Bharuch Narmada Estuary at Bhabdhut LT EST 0 0 0 0 3 3.05 3 2.66 1 1
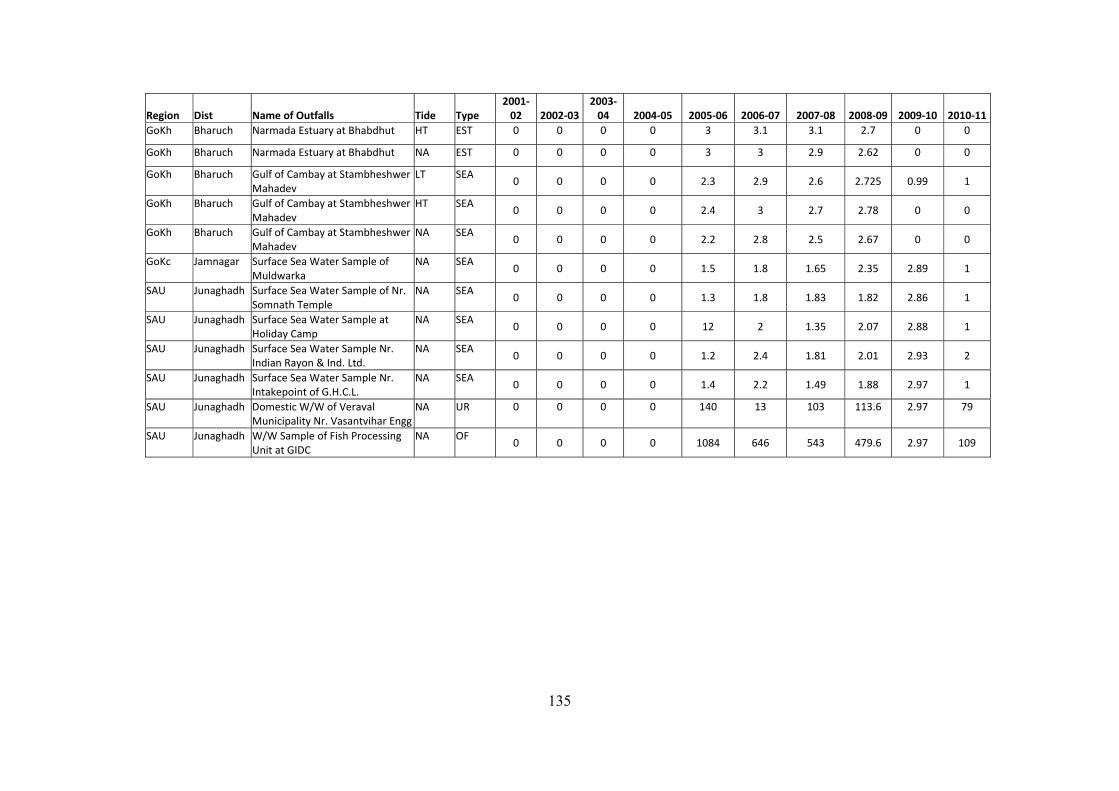
135
Region Dist Name of Outfalls Tide Type 2001‐02 2002‐03
2003‐04 2004‐05 2005‐06 2006‐07 2007‐08 2008‐09 2009‐10 2010‐11
GoKh Bharuch Narmada Estuary at Bhabdhut HT EST 0 0 0 0 3 3.1 3.1 2.7 0 0
GoKh Bharuch Narmada Estuary at Bhabdhut NA EST 0 0 0 0 3 3 2.9 2.62 0 0
GoKh Bharuch Gulf of Cambay at Stambheshwer Mahadev
LT SEA 0 0 0 0 2.3 2.9 2.6 2.725 0.99 1
GoKh Bharuch Gulf of Cambay at Stambheshwer Mahadev
HT SEA 0 0 0 0 2.4 3 2.7 2.78 0 0
GoKh Bharuch Gulf of Cambay at Stambheshwer Mahadev
NA SEA 0 0 0 0 2.2 2.8 2.5 2.67 0 0
GoKc Jamnagar Surface Sea Water Sample of Muldwarka
NA SEA 0 0 0 0 1.5 1.8 1.65 2.35 2.89 1
SAU Junaghadh Surface Sea Water Sample of Nr. Somnath Temple
NA SEA 0 0 0 0 1.3 1.8 1.83 1.82 2.86 1
SAU Junaghadh Surface Sea Water Sample at Holiday Camp
NA SEA 0 0 0 0 12 2 1.35 2.07 2.88 1
SAU Junaghadh Surface Sea Water Sample Nr. Indian Rayon & Ind. Ltd.
NA SEA 0 0 0 0 1.2 2.4 1.81 2.01 2.93 2
SAU Junaghadh Surface Sea Water Sample Nr. Intakepoint of G.H.C.L.
NA SEA 0 0 0 0 1.4 2.2 1.49 1.88 2.97 1
SAU Junaghadh Domestic W/W of Veraval Municipality Nr. Vasantvihar Engg
NA UR 0 0 0 0 140 13 103 113.6 2.97 79
SAU Junaghadh W/W Sample of Fish Processing Unit at GIDC
NA OF 0 0 0 0 1084 646 543 479.6 2.97 109