Embed Size (px)
Citation preview

50 HEAT TREATING PROGRESS • SEPTEMBER 2008
Mathematical tools such ascomputational fluid dynamics (CFD) and finiteelement analysis (FEA) canbe used in combination toimprove the response ofmetal components to heattreatment processes that include quenching. Thecombination of CFD andFEA modeling techniquesprovides an efficient and effective method for the design of quenchingprocesses and related fixtures.
Andrew Banka* Jeff Franklin Airflow Sciences Corp.Livonia, Mich.
Zhichao Li* B. Lynn Ferguson*, FASMDeformation Control Technology Inc.Cleveland, Ohio
Michael Aronov*IQ Technologies Inc.Akron, Ohio
*Member of ASM International and member,ASM Heat Treating Society
uenching of steel componentsis a fast transient thermalprocess where the part isheated above the austenitiza-tion temperature, and rapidly
cooled by the quenching media. Themost common quenching processes in-clude immersion in a liquid, sprayingthe heated part with a liquid, andblowing a gas onto and around heatedparts. Liquid quenching includes im-mersion into an oil, plain water, brine,water/polymer, or molten saltmedium. For all quenching methods,the quenchant flow condition has a pri-mary effect on the quenching results,including final microstructural phasedistribution, hardness, residual stress,and part distortion. Knowledge andcontrol of the quenchant flow is impor-tant for controlling the quenchingprocess and for achieving the desiredresults. With computational fluid dy-namics (CFD) technologies, the quen-chant flow pattern during quenchingcan be calculated. In one publishedstudy, the oil velocity in a quench tankwas predicted by static CFD analysisusing FLUENT (Ansys Inc, Lebanon,N.H.; www.fluent.com) and the infor-mation was used to predict the coolinguniformity among parts in aquenching rack, as well as the localcooling differences within a single part [1]. The quenchant velocities fromthe CFD model were converted to heattransfer coefficients along the part urfaces and used as thermal boundaryconditions in the DCT’s DANTE heat treatment model to predict partdistortion[2].
Intensive quenching methods weredeveloped more than 30 years ago byNikolai Kobasko and others[3]. Inten-sive quenching uses plain water orwater-salt solutions as the quenchmedia, and it achieves extremely highcooling rates in the steel parts. Due tothe high thermal gradient and rapidsurface and near-surface formation ofmartensite early during the quenchingprocess, intensive quenching can gen-erate high compressive residualstresses in the part surface. High sur-face compressive residual stresses aredesirable in many applications to im-prove the fatigue life of the heat treated
part. Studies have shown that inten-sive quenching can be applied to bothcarburized and non-carburized steelparts, which makes it an attractivequench hardening process for steelgears[4-6].
During intensive quenching, highspeed water flows along the surface ofthe part to extract heat quickly and uni-formly. Film boiling must be avoided,and even nucleate boiling duringquenching, where the heat transfer istypically high, is not desired. However,water flow at concave locations of thepart may be stagnant, which will causea much lower cooling rate than the av-erage. Conversely, the cooling rate atouter corners and edges can be muchhigher than the average, which maycause cracking at these locations dueto excessive thermal stresses. Fixturesfor intensively quenching individualparts can be designed to direct thewater flow more uniformly along thesurface of the part to improve unifor-mity of cooling. In this study, CFD pre-dictions of the water flow field andsurface heat transfer rates along a gearare used to characterize and improvethe performance of an intensivequench fixture. The quenchant tem-perature and heat transfer coefficientsalong the gear surfaces are then usedas input to drive DANTE models topredict the metallurgical, stress, anddistortion responses of the gear for thefixture design.
CFD ModelingThe intensive quench fixture in this
study was designed to emphasizecooling of the gear teeth, especially theroot area between teeth. Water is di-rected radially inward into the rootarea (Fig. 1). The incoming water flowsdown the pipe, is diverted outward byan upper cone, and enters the gearchamber radially. Aportion of the flowtravels over the top surface of the gearand down through the bore, while thebalance flows under the gear and outthrough the bottom tube.
The heat flux rate on the surface ofthe gear is expected to vary from loca-tion to location due to several factors,including: 1) variations in the velocityin the vicinity of the gear tooth; 2) the
CFD AND FEA USED TO IMPROVE THE QUENCHING PROCESS
Q
CFD.qxp 8/29/2008 3:41 PM Page 2

thickness of the velocity boundarylayer; and 3) the thickness of thethermal boundary layer. Accurate pre-diction of these effects requires a CFDmodel with a high mesh densityaround the part, with sufficientnumber of near-surface grid points.While it is expected that the heat fluxrates will vary greatly with time, it isnot clear that these rates will vary inthe same way at different surface loca-tions. Due to the high heat flux ratesand rapid temperature changes in-
herent in the intensive quenchingprocess, the transients are expected tobe brief.
It seems that a full 3-D transientanalysis is necessary to fully charac-terize the heat flux rates throughoutthe process, but such a simulation iscurrently impractical due to the com-puting resources needed. Instead, amethod was developed wherein a 2-D transient model was used to charac-terize the variations in heat transferdue to location and time in the quenchprocess, which is used to predict the 3-D transient heat flux rates.
CFD simulations discussed in thisarticle assume that boiling phenomenaare short-lived and have no major im-pact on the resulting material proper-ties, which is reasonable for high-ve-locity intensive quenching processes.
2-D Axisymmetric CFD ModelingFigure 2 shows the domain and the
computational grid used for the 2-DCFD model. The geometry of the 2-Dsolid used in this model is equivalentto a 3-D gear blank before the teeth arehobbed. More than 50,000 computa-tional cells were used for this model,with about 22,000 cells within the gearblank solid. Figure 2 shows the cellsadjacent to the gear were tightlyspaced to capture flow gradients. Thestandard wall function model withinFLUENT was used for all simulations.Atotal quench time of 10 seconds wassimulated.
Figure 3 shows the magnitude of ve-locity at the beginning of the intensive
HEAT TREATING PROGRESS • SEPTEMBER 2008 51
Fig. 1 — Cutaway view of the quench fixtureshowing the gear (red), upstream deflector (blue),and representative water path lines passing overand under the gear (green, yellow).
Fig. 2 — Domain and mesh for the 2-D CFD simulation.
Fig. 3 — Total velocity plot of water flowingthrough quench fixture and around gear blank.
CFD.qxp 8/27/2008 8:30 PM Page 3

quench. High velocities are predictedat the outside corners of the gear blank.The large faces of the gear blank webare predicted to experience lower ve-locities that will result in lower heatflux rates. The tooth face of the gearblank is exposed to impinging flow,and is expected to have high heattransfer due to the water temperatureand flow direction even though thelocal velocities are relatively low. Thisvelocity pattern is predicted to remainlargely unchanged throughout the du-ration of the quench cycle.
Figure 4 shows the time history ofthe heat flux at 3 points on the surfaceof the gear blank. These points high-light the behavior for regions with sig-nificantly different water flow condi-tions. While the initial heat flux ratesdiffer by a factor of more than 4, allcurves asymptotically approach zeroat long times. Figure 5 shows the timehistory of the heat transfer coefficientat these three points. Again, the valuesvary widely both by location and bytime. Thus, the assumption of a uni-form heat transfer coefficient for thequenching process does not properlyrepresent the quenching environment.
Development of Correlation FunctionAs noted above, it is possible but not
currently practical to perform a full 3-D transient simulation of complexgeometries to define the heat transferrates during quenching. Nevertheless,the 2-D model presented above showsthat the heat flux rates and heattransfer coefficients vary considerablywith time and location. The challengeis to extract sufficient information fromone or two steady-state CFD simula-tions to characterize the heat transferrates over the entire quench cycle. Sucha characterization is expected to pro-vide significantly improved accuracyover current methods, which typicallyassume a constant heat transfer coef-ficient.
Equation 1 was found to provide anaccurate representation of the overalltrends for the heat transfer rates on the2D gear blank. It attempts to blendsteady-state simulation results ob-tained from hot and cold conditions ina way that largely duplicates the ac-tual transient behavior.
where h0 is the initial local heat transfercoefficient, hf is the final local heattransfer coefficient (when the part is
fully cooled), is the initial temperatureof the part Tr is the reference fluid tem-perature (inlet fluid temperature), T0
is the initial near surface characteriza-tion temperature, and Tw is the currentwall temperature. Note that the localheat transfer coefficients used in Eq 1differ from those presented in Fig. 5,where the temperature differential isbetween the surface and the fluid inlettemperature, while the temperaturedifferential for the local heat transfercoefficient is between the surface andthe near surface fluid temperature.
The first term in Eq 1 provides ablending from the initial local heattransfer coefficient to the final value,while the second term provides thetemperature differential, including ablending of the near surface liquidtemperature from the initial to finalvalues. Three variables in this equationare obtained from the CFD simula-tions; h0 and T0 are obtained from asteady-state simulation with the partsurface held at its initial temperature,while hf is obtained from a steady-statesimulation with the part surface at thewater inlet temperature. These valuesare independently found for each sur-face location on the gear, and later ap-plied to the DANTE model.
Figure 6 shows the correlation be-tween the simulated heat flux valuesfrom the transient simulation com-pared to the values predicted by theequation. Very good correlation is seenfor Points 1 and 2. The correlation forPoint 3 is not as good, most likely dueto poor water flow in this area.
Steady-State 3-D CFD ModelingThe grid used for the steady-state 3-
D CFD modeling is shown in Fig. 7.The inherent symmetry of the geom-etry was used to reduce the domain toa half gear tooth. A total of 1,721,070computational cells were used in themodel. The gear solid was not in-cluded in the model. Instead, the gearsurface temperature was specified onthe boundary of the fluid domain. Themodel was run for both the hot partsurface and the ambient part surfacein order to determine the h0, hf, and T0
values in equation 1.The heat transfer coefficients are
displayed in Figs. 8 and 9. The bottomside of the gear is displayed in thesefigures, as those surfaces show agreater variation than the top side. Assuggested in Fig. 3, more of the fluidpasses under the gear than over it,leading to the highest heat transferrates on the lower corner of the gear
52 HEAT TREATING PROGRESS • SEPTEMBER 2008
Fig. 4 — Time history of surface heat flux forthree points on gear blank from 2-D transient simulation.
Fig. 5 — Time history of surface heat transfer coefficient for three points on gear blank from 2-Dtransient simulation.
Fig. 6 — Comparison of simulated heat flux valuesand estimated values for 3 points on the 2-D gear
blank model.
q = ho Tw - Tr +h f Tow - Tw Tw- To
Tw - Tr +Tr To
w - Tw eq.[1]To
w - Tr Tow - Tr To
w - Tr Tow - Tr{ { ( )}}
0 1 2 3 4 5 6 7 8 9 10Time, s
0 1 2 3 4 5 6 7 8 9 10Time, s
0 1 2 3 4 5 6 7 8 9 10Time, s
2e+07
1.5e+07
1e+07
5e+06
0
2e+07
1.5e+07
1e+07
5e+06
0
Loca
l hea
t flu
x, W
/m2
160,000
120,000
80,000
40,000
0
Hea
t tra
nsfe
r coe
ffic
ient
, W/m
2 -K
Loca
l hea
t flu
x, W
/m2
SimulationEquation
CFD.qxp 8/27/2008 8:30 PM Page 4

tooth. This is seen for both the initialand final local heat transfer coeffi-cients.
Heat Treatment ModelIn this study, the CFD model and
the heat treatment model used dif-ferent meshes. However, the elementsizes in the heat treatment modelwere designed so that the heattransfer boundary conditions re-ported from CFD results could be ef-fectively applied. A single tooth finiteelement model with 5,979 nodes and4,820 hexahedral elements was cre-ated to predict the gear responseduring the intensive quenchingprocess (Fig. 10).
The bore diameter of the gear is 30mm, and the tip diameter of the 28-tooth gear is 95.25 mm. The heat treat-ment process included furnace heating,carburization, and intensive quench-ing. Results for subsequent cryogenictreatment and tempering are not in-cluded in this article, but they havebeen reported elsewhere[5]. During car-burization, only the gear tooth surfacewas carburized, as all the other sur-faces including the tooth tip werecopper plated. Fine elements wereused in the tooth surface to catch thecarbon gradient.
Cyclic symmetric boundary condi-tions were used for both the thermaland stress heat treatment models. Thisassumption is based on the responseof all the 28 gear teeth being same. Thistype of model cannot predict ovalityand “potato-chip” distortion. Radialand axial distortion of the gear toothare reported.
Modeling the Carburization ProcessThe gear is made of Pyrowear 53
steel (Carpenter Technology, Reading,Pa.; www.cartech.com), which has abase carbon content of 0.1%. The gearis gas carburized at a temperature of927ºC for 8 h; carburizing potential is0.8%.The predicted carbon contourplot after the carburiza-tion process is shown inFig. 11(a). Line EF is lo-cated in the gear rootaround the fillet, asshown in Fig. 11(a). Thepredicted carbon distri-bution in terms of depthfrom the gear surfacealong line EF is shownin Fig. 11(b). The effec-tive case depth is about0.6 mm and the surfacecarbon is 0.8%.
Analysis of Heat Treatment Modeling Results
The correlated heatflux based on Eq 1 wasused as the thermalboundary condition todrive the DANTE heattreatment model. Theheat transfer coefficientsand the local ambienttemperatures are de-pendent on both the sur-face of the part andquenching time.
Two lines of nodes,shown as line AB andline CD in Fig. 12, wereselected to investigate
HEAT TREATING PROGRESS • SEPTEMBER 2008 53
Fig. 7 — Computational domain and grid used for 3-D gear model.
Fig. 8 — Initial local heat transfer coefficient valueson the surface of the gear.
Fig. 9 — Final local heat transfer coefficients on thesurface of the gear.
Fig. 11 —Carbon distribu-tion in terms ofweight fraction;(a) contour plot;(b) along line EF.
Fig. 10 — Finite element mesh used for the DANTE heat treatment model.
(a)
(b)0 0.5 1.0 1.5 2.0 2.5 3.0
Depth, mm
0.010
0.008
0.006
0.004
0.002
0
Car
bon
CFD.qxp 8/27/2008 8:30 PM Page 5
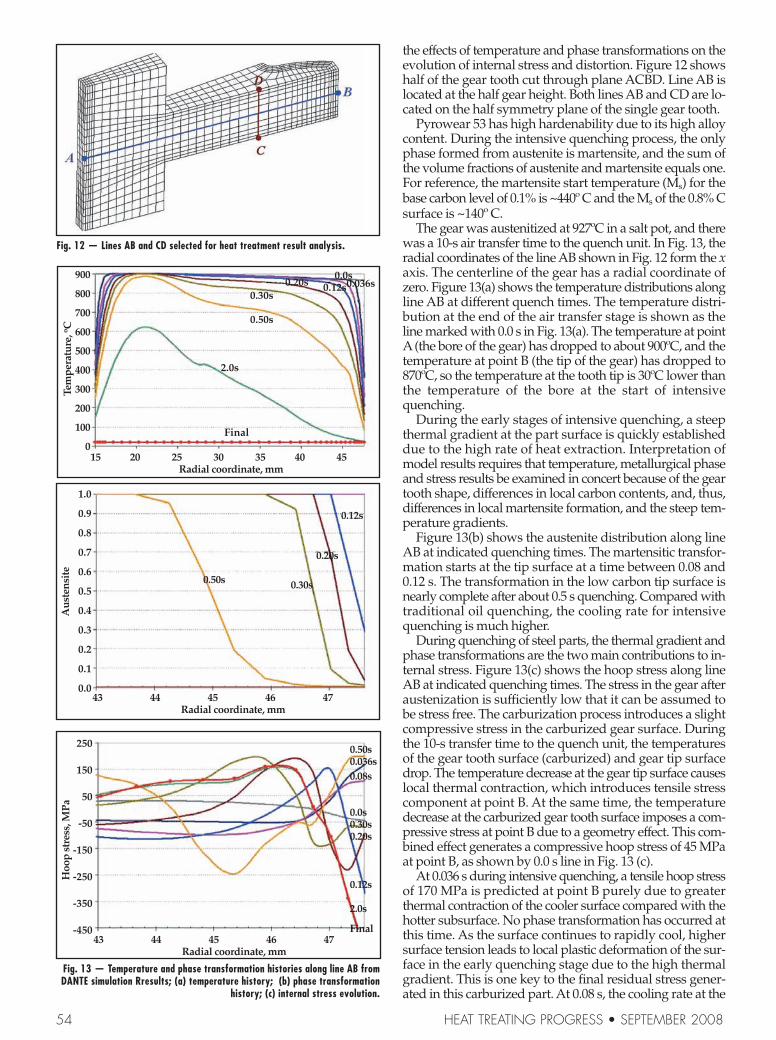
the effects of temperature and phase transformations on theevolution of internal stress and distortion. Figure 12 showshalf of the gear tooth cut through plane ACBD. Line AB islocated at the half gear height. Both lines AB and CD are lo-cated on the half symmetry plane of the single gear tooth.
Pyrowear 53 has high hardenability due to its high alloycontent. During the intensive quenching process, the onlyphase formed from austenite is martensite, and the sum ofthe volume fractions of austenite and martensite equals one.For reference, the martensite start temperature (Ms) for thebase carbon level of 0.1% is ~440º C and the Ms of the 0.8% Csurface is ~140º C.
The gear was austenitized at 927ºC in a salt pot, and therewas a 10-s air transfer time to the quench unit. In Fig. 13, theradial coordinates of the line AB shown in Fig. 12 form the xaxis. The centerline of the gear has a radial coordinate ofzero. Figure 13(a) shows the temperature distributions alongline AB at different quench times. The temperature distri-bution at the end of the air transfer stage is shown as theline marked with 0.0 s in Fig. 13(a). The temperature at pointA(the bore of the gear) has dropped to about 900ºC, and thetemperature at point B (the tip of the gear) has dropped to870ºC, so the temperature at the tooth tip is 30ºC lower thanthe temperature of the bore at the start of intensivequenching.
During the early stages of intensive quenching, a steepthermal gradient at the part surface is quickly establisheddue to the high rate of heat extraction. Interpretation ofmodel results requires that temperature, metallurgical phaseand stress results be examined in concert because of the geartooth shape, differences in local carbon contents, and, thus,differences in local martensite formation, and the steep tem-perature gradients.
Figure 13(b) shows the austenite distribution along lineAB at indicated quenching times. The martensitic transfor-mation starts at the tip surface at a time between 0.08 and0.12 s. The transformation in the low carbon tip surface isnearly complete after about 0.5 s quenching. Compared withtraditional oil quenching, the cooling rate for intensivequenching is much higher.
During quenching of steel parts, the thermal gradient andphase transformations are the two main contributions to in-ternal stress. Figure 13(c) shows the hoop stress along lineAB at indicated quenching times. The stress in the gear afteraustenization is sufficiently low that it can be assumed tobe stress free. The carburization process introduces a slightcompressive stress in the carburized gear surface. Duringthe 10-s transfer time to the quench unit, the temperaturesof the gear tooth surface (carburized) and gear tip surfacedrop. The temperature decrease at the gear tip surface causeslocal thermal contraction, which introduces tensile stresscomponent at point B. At the same time, the temperaturedecrease at the carburized gear tooth surface imposes a com-pressive stress at point B due to a geometry effect. This com-bined effect generates a compressive hoop stress of 45 MPaat point B, as shown by 0.0 s line in Fig. 13 (c).
At 0.036 s during intensive quenching, a tensile hoop stressof 170 MPa is predicted at point B purely due to greaterthermal contraction of the cooler surface compared with thehotter subsurface. No phase transformation has occurred atthis time. As the surface continues to rapidly cool, highersurface tension leads to local plastic deformation of the sur-face in the early quenching stage due to the high thermalgradient. This is one key to the final residual stress gener-ated in this carburized part. At 0.08 s, the cooling rate at the
54 HEAT TREATING PROGRESS • SEPTEMBER 2008
Fig. 12 — Lines AB and CD selected for heat treatment result analysis.
Fig. 13 — Temperature and phase transformation histories along line AB fromDANTE simulation Rresults; (a) temperature history; (b) phase transformation
history; (c) internal stress evolution.
15 20 25 30 35 40 45Radial coordinate, mm
43 44 45 46 47Radial coordinate, mm
43 44 45 46 47Radial coordinate, mm
900
800
700
600
500
400
300
200
100
0
1.0
0.9
0.8
0.7
0.6
0.5
0.4
0.3
0.2
0.1
0.0
250
150
50
-50
-150
-250
-350
-450
Tem
pera
ture
, o CA
uste
nsit
eH
oop
stre
ss, M
Pa
Final
0.0s0.20s 0.12s0.036s
0.30s
0.50s
2.0s
0.12s
0.20s
0.50s 0.30s
0.50s0.036s0.08s
0.0s0.30s0.20s
0.12s
2.0s
Final
CFD.qxp 8/27/2008 8:30 PM Page 6

subsurface exceeds the cooling rate at the surface since thesurface is nearly at the water temperature. The surface ten-sile hoop stress drops from 170 to 105 MPa after 0.08 s ofquenching. Figure 13(b) shows the martensitic transforma-tion starts between 0.08 and 0.12 s at point B, during whichtime the phase transformation rate on the tooth tip surface ishigher than that of the subsurface. Due to the material ex-pansion caused by martensitic transformation, point B onthe tip surface has a 320 MPa hoop stress in compression atthe end of 0.12 s quenching. To balance the surface compres-sive stress, a tensile stress peak of 150 MPa is observed atthe depth of about 0.5 mm from the tip surface, which is alsothe location of the transformation interface, as shown by the0.12 s line in Fig. 13(b) and (c). Note that line AB does nottraverse through the carburized case, so carbon content isconstant at the baseline level along this line. At this time, nomartensite has begun to form in the carburized case.
With continued quenching, the phase transformation in-terface moves inward from the tip surface. Between 0.12 and0.2 s, the phase transformation rate in the subsurface ex-ceeds the transformation rate on the surface. As shown bythe 0.2 s line in Fig. 13(c), the tensile stress peak also movesinward. Acompressive stress peak is observed at the shallowdepth from the tip surface; this is the location which has thehighest martensite formation rate. From 0.2 to 0.3 s during in-tensive quenching, both the tensile and compressive stresspeaks move inward from the tip, and the level of tip surfacecompression is reduced. At 0.5 s, the highest transformationrate occurs at the depth of 2.2 mm from the tip surface, asshown by the 0.5 s line in Fig. 13(b). The compressive stresspeak is about 150 MPa, as shown in Fig. 13(c). The depth ofthe tensile stress peak at 0.5 s is about 6.0 mm from the tipsurface, and the hoop stress value is 200 MPa in tension.Due to the combined effect of the thermal gradient andmartensite phase formation, the hoop stress at point B (thegear tip surface) is about 200 MPa in tension after 0.5 s ofquenching.
The intensive quench is essentially complete in about 2.0s for this specific gear and gear steel. At the end ofquenching, a compressive hoop stress of 550 MPa is pre-dicted at point B (gear tip surface). Finite element analysisshows that both the thermal gradient and steel phase trans-formations are very important to the stress evolution duringquenching. Plastic deformation of austenite under tensionduring quenching is also key to the final residual stress dis-tribution.
The main purpose of applying CFD analysis results to thefinite element model of the intensive quenching process isto accurately characterize the nonuniform thermal boundaryconditions. Knowledge of the water flow pattern, the localvelocity, and the quenchant ambient temperature along thegear surface is required for assigning meaningful heattransfer coefficients along the surface of the gear during theheat treatment analysis. Without CFD results, the assumedheat transfer boundary conditions have been constant anduniform conditions. Because the gear is symmetric to theplane ABCD and normal to the gear axis, for these assumedconditions, line AB always remains straight and parallel tothe x-axis during the FEAanalysis. With these assumed uni-form thermal boundary condition on the gear, FEAanalysiscannot predict warping distortion, which is shown in Fig.14(c) by the line with hollow round marks. The ability topredict nonuniform heat transfer conditions due to nonuni-form quenchant flow is an important aspect of CFD analysis.Nodes on line CD in Fig. 12 were selected to investigate how
HEAT TREATING PROGRESS • SEPTEMBER 2008 55
Fig. 14 — Generation of warping distortion; (a) temperature history along lineCD; (b) phase transformation history along line CD; (c) displacement historyalong line AB.
-3.5 -2.5 -1.5 -0.5 0.5 1.5 2.5 3.5Radial coordinate, mm
-3.5 -2.5 -1.5 -0.5 0.5 1.5 2.5 3.5Radial coordinate, mm
15 20 25 30 35 40 45Radial coordinate, mm
900
800
700
600
500
400
300
200
100
0
1.0
0.8
0.6
0.4
0.2
0.00
0.30
0.25
0.20
0.15
0.10
0.05
0.00
Tem
pera
ture
, o CA
uste
nsit
eA
xial
dis
plac
emen
t, m
m
0.0s
0.036s0.08s0.12s0.20s0.30s0.50s
2.0s
Final
Final
2.0s
0.50s
0.30s
0.0s
0.036s
0.08s
0.08s
0.12s
0.12s
0.20s
0.50s
0.30s
CFD.qxp 8/27/2008 8:30 PM Page 7
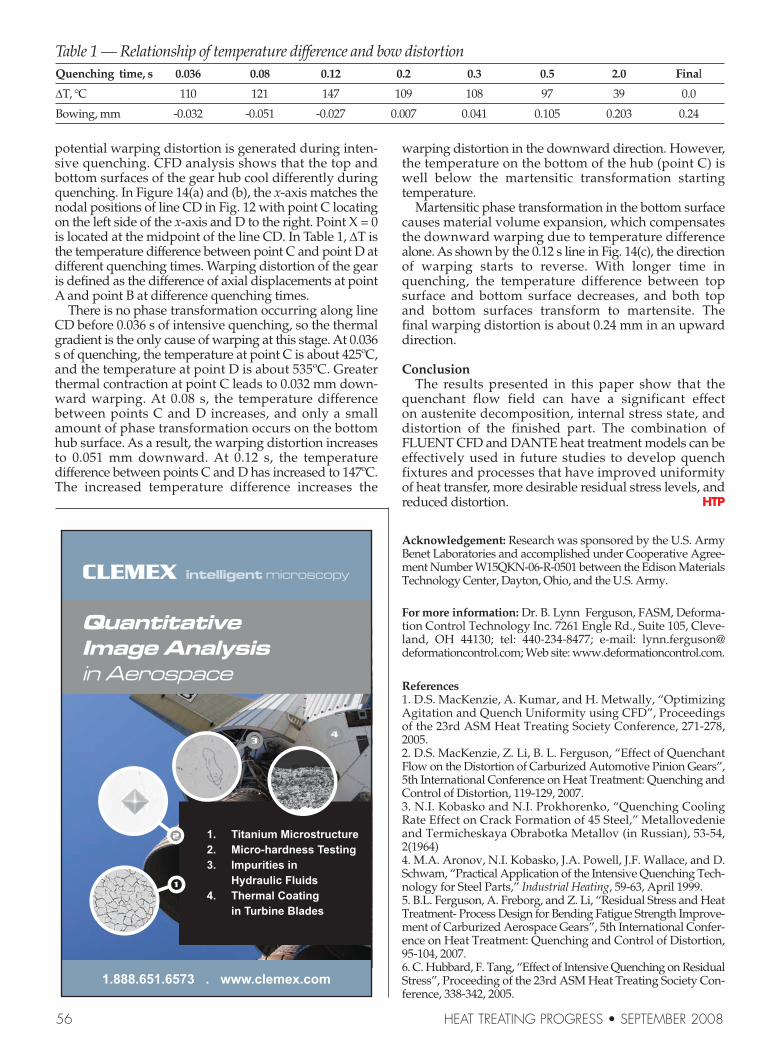
potential warping distortion is generated during inten-sive quenching. CFD analysis shows that the top andbottom surfaces of the gear hub cool differently duringquenching. In Figure 14(a) and (b), the x-axis matches thenodal positions of line CD in Fig. 12 with point C locatingon the left side of the x-axis and D to the right. Point X = 0is located at the midpoint of the line CD. In Table 1, ∆T isthe temperature difference between point C and point D atdifferent quenching times. Warping distortion of the gearis defined as the difference of axial displacements at pointA and point B at difference quenching times.
There is no phase transformation occurring along lineCD before 0.036 s of intensive quenching, so the thermalgradient is the only cause of warping at this stage. At 0.036s of quenching, the temperature at point C is about 425ºC,and the temperature at point D is about 535ºC. Greaterthermal contraction at point C leads to 0.032 mm down-ward warping. At 0.08 s, the temperature difference between points C and D increases, and only a smallamount of phase transformation occurs on the bottom hub surface. As a result, the warping distortion increasesto 0.051 mm downward. At 0.12 s, the temperature difference between points C and D has increased to 147ºC.The increased temperature difference increases the
warping distortion in the downward direction. However,the temperature on the bottom of the hub (point C) is well below the martensitic transformation starting temperature.
Martensitic phase transformation in the bottom surfacecauses material volume expansion, which compensatesthe downward warping due to temperature differencealone. As shown by the 0.12 s line in Fig. 14(c), the directionof warping starts to reverse. With longer time inquenching, the temperature difference between top surface and bottom surface decreases, and both top and bottom surfaces transform to martensite. The final warping distortion is about 0.24 mm in an upwarddirection.
ConclusionThe results presented in this paper show that the
quenchant flow field can have a significant effect on austenite decomposition, internal stress state, and distortion of the finished part. The combination ofFLUENT CFD and DANTE heat treatment models can beeffectively used in future studies to develop quench fixtures and processes that have improved uniformity of heat transfer, more desirable residual stress levels, andreduced distortion. HTP
Acknowledgement: Research was sponsored by the U.S. ArmyBenet Laboratories and accomplished under Cooperative Agree-ment Number W15QKN-06-R-0501 between the Edison MaterialsTechnology Center, Dayton, Ohio, and the U.S. Army.
For more information: Dr. B. Lynn Ferguson, FASM, Deforma-tion Control Technology Inc. 7261 Engle Rd., Suite 105, Cleve-land, OH 44130; tel: 440-234-8477; e-mail: [email protected]; Web site: www.deformationcontrol.com.
References1. D.S. MacKenzie, A. Kumar, and H. Metwally, “Optimizing Agitation and Quench Uniformity using CFD”, Proceedings of the 23rd ASM Heat Treating Society Conference, 271-278, 2005.2. D.S. MacKenzie, Z. Li, B. L. Ferguson, “Effect of QuenchantFlow on the Distortion of Carburized Automotive Pinion Gears”,5th International Conference on Heat Treatment: Quenching andControl of Distortion, 119-129, 2007.3. N.I. Kobasko and N.I. Prokhorenko, “Quenching Cooling Rate Effect on Crack Formation of 45 Steel,” Metallovedenie and Termicheskaya Obrabotka Metallov (in Russian), 53-54,2(1964)4. M.A. Aronov, N.I. Kobasko, J.A. Powell, J.F. Wallace, and D.Schwam, “Practical Application of the Intensive Quenching Tech-nology for Steel Parts,” Industrial Heating, 59-63, April 1999.5. B.L. Ferguson, A. Freborg, and Z. Li, “Residual Stress and HeatTreatment- Process Design for Bending Fatigue Strength Improve-ment of Carburized Aerospace Gears”, 5th International Confer-ence on Heat Treatment: Quenching and Control of Distortion,95-104, 2007.6. C. Hubbard, F. Tang, “Effect of Intensive Quenching on ResidualStress”, Proceeding of the 23rd ASM Heat Treating Society Con-ference, 338-342, 2005.
Table 1 — Relationship of temperature difference and bow distortionQuenching time, s 0.036 0.08 0.12 0.2 0.3 0.5 2.0 Final
∆T, °C 110 121 147 109 108 97 39 0.0
Bowing, mm -0.032 -0.051 -0.027 0.007 0.041 0.105 0.203 0.24
1. Titanium Microstructure2. Micro-hardness Testing3. Impurities in Hydraulic Fluids 4. Thermal Coating in Turbine Blades
2
1
34
CLEMEX intelligent microscopy
1.888.651.6573 . www.clemex.com
Quantitative Image Analysis in Aerospace
56 HEAT TREATING PROGRESS • SEPTEMBER 2008
CFD.qxp 8/27/2008 8:30 PM Page 8