Embed Size (px)
Citation preview

2nd World Congress onPetrochemistry and Chemical EngineeringOctober 27-29, 2014 Las Vegas, USA
CFD and Process Simulations of air
gasification of plastic wastes in a conical
spouted bed gasifier
w w w . c p f d - s o f t w a r e . c o m
Dr. Abdallah S. Berrouk
Dr. Chaohe Yang
Mr. Yupeng Du

2nd World Congress onPetrochemistry and Chemical EngineeringOctober 27-29, 2014 Las Vegas, USA
Outline
� Background
� Process description
w w w . c p f d - s o f t w a r e . c o m
2
� Process description
� CFD model and analysis
� ERN model and Process simulations
� Results and discussion
� Conclusions

2nd World Congress onPetrochemistry and Chemical EngineeringOctober 27-29, 2014 Las Vegas, USA
Background
� Total consumption of plastics in both developing and developed countries has
dramatically increased in the recent years (200 billions pounds as of 2013)
� Plastics have an LHV of 40 MJ/kg much higher in comparison with biomass
(10MJ/kg) or Coal (30 MJ/kg) which are extensively utilized as energy sources
w w w . c p f d - s o f t w a r e . c o m
3
(10MJ/kg) or Coal (30 MJ/kg) which are extensively utilized as energy sources
� Current plastic waste treatment technologies are: landfill, mechanical
recycling, chemical recycling, and incineration.
� The chemical recycling approach does not only recovers valuable
petrochemicals as feedstock, it also produces energy in the form of heat,
steam, etc.
� Advantages of conical spouted bed gasifier over fluidized-bed gasifier:
vigorous solid circulation pattern; high heat transfer rates; simple design; low
segregation, etc.
2nd World Congress onPetrochemistry and Chemical EngineeringOctober 27-29, 2014 Las Vegas, USA
Background
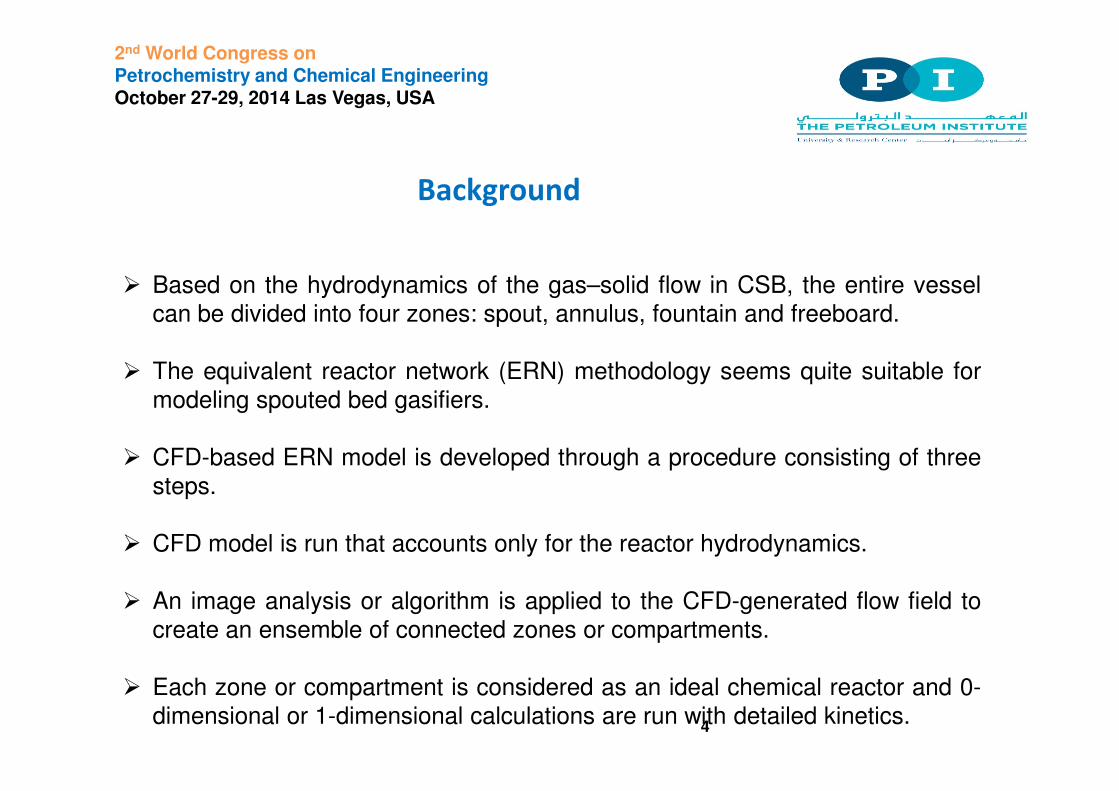
� Based on the hydrodynamics of the gas–solid flow in CSB, the entire vessel
can be divided into four zones: spout, annulus, fountain and freeboard.
� The equivalent reactor network (ERN) methodology seems quite suitable for
modeling spouted bed gasifiers.
w w w . c p f d - s o f t w a r e . c o m
4
modeling spouted bed gasifiers.
� CFD-based ERN model is developed through a procedure consisting of three
steps.
� CFD model is run that accounts only for the reactor hydrodynamics.
� An image analysis or algorithm is applied to the CFD-generated flow field to
create an ensemble of connected zones or compartments.
� Each zone or compartment is considered as an ideal chemical reactor and 0-
dimensional or 1-dimensional calculations are run with detailed kinetics.
2nd World Congress onPetrochemistry and Chemical EngineeringOctober 27-29, 2014 Las Vegas, USA
Background
�CFD-based ERN models reasonably simplify transport process and avoid
calculation divergences of CFD models
�This especially true for situations where many kinds of reactants and complicated
and non-linear reaction paths are involved in the process.
w w w . c p f d - s o f t w a r e . c o m
5
and non-linear reaction paths are involved in the process.
� ERN models perform simulations in very short time generally in the magnitude of
several minutes or even fewer on a desktop personal computer compared to multiple
days or months on multiple processors for more detailed CFD simulations.
� The main objective of the present study is to investigate using CFD-based ERN
model air gasification of a plastics waste feedstock that consists of 100% polyethylene
in a conical spouted bed reactor.

2nd World Congress onPetrochemistry and Chemical EngineeringOctober 27-29, 2014 Las Vegas, USA
Process description
� The gasifying agent (air or steam) is blown
upwards from the bottom inlet of the vessel
� PE particles introduced from the top inlet
w w w . c p f d - s o f t w a r e . c o m
6
� PE particles melt and coat on silic sands,
release a large amount of volatiles and little
amount of char
� Released volatiles are commonly the
mixture consisting of many species such as
H2, CH4, C2H4, C3H6, and heavier
hydrocarbons which are usually termed as
primary tars. Schematic diagram of a spouted bed gasifier (SBG)
2nd World Congress onPetrochemistry and Chemical EngineeringOctober 27-29, 2014 Las Vegas, USA
Process description
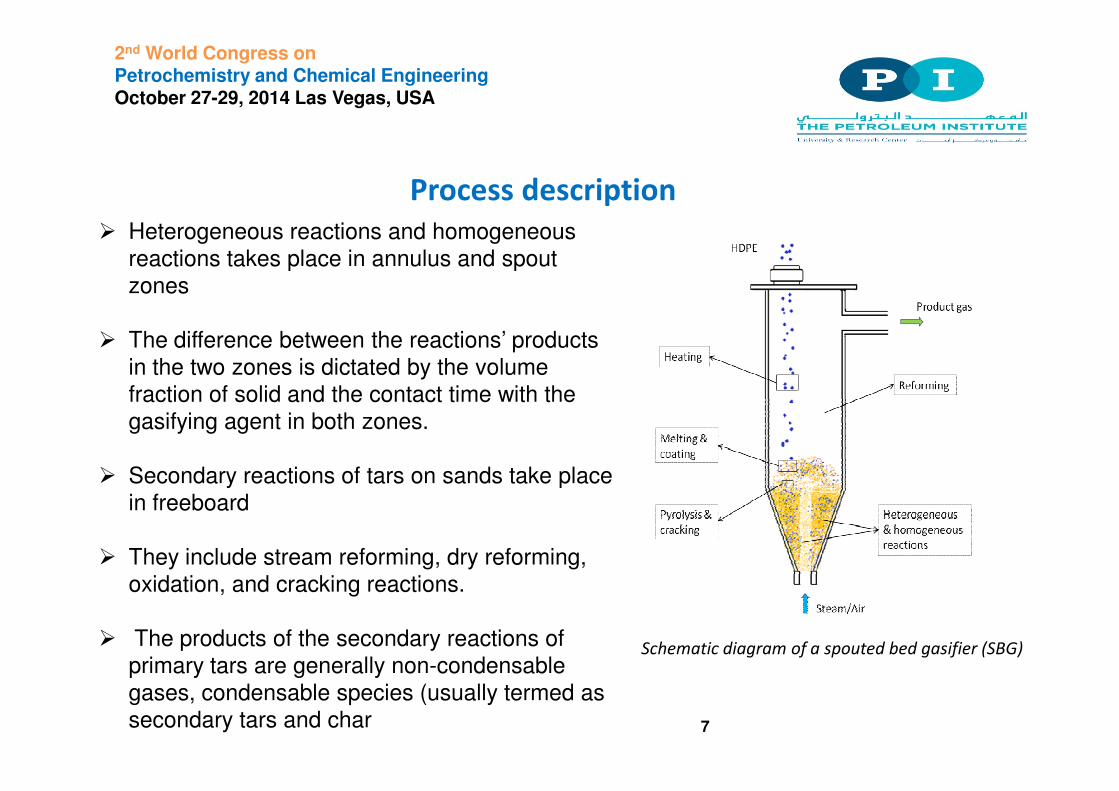
� Heterogeneous reactions and homogeneous reactions takes place in annulus and spout zones
� The difference between the reactions’ products in the two zones is dictated by the volume fraction of solid and the contact time with the
w w w . c p f d - s o f t w a r e . c o m
7
fraction of solid and the contact time with the gasifying agent in both zones.
� Secondary reactions of tars on sands take place in freeboard
� They include stream reforming, dry reforming, oxidation, and cracking reactions.
� The products of the secondary reactions of primary tars are generally non-condensable gases, condensable species (usually termed as secondary tars and char
Schematic diagram of a spouted bed gasifier (SBG)

2nd World Congress onPetrochemistry and Chemical EngineeringOctober 27-29, 2014 Las Vegas, USA
CFD model and analysis
� The computational domain is a
newly-designed conical spouted
bed gasifier (SBG) at a laboratory scale
w w w . c p f d - s o f t w a r e . c o m
8
� Mesh consists of regularly-structured
quadrilateral elements (7,780 cells) that
provide quick convergence and minimal
numerical errors
� Two-Fluid Model is used
� Kinetic theory of granular flows (KTGF)
is used to close the solid phase equations Geometry of the spouted bed and the numerical
grid used

2nd World Congress onPetrochemistry and Chemical EngineeringOctober 27-29, 2014 Las Vegas, USA
CFD model and analysis
• Continuity Equations (k=g, s):
• Momentum Equations (k=g, s; l=s, g):
( ) ( ) 0k k k k kt
α ρ α ρ∂
+ ∇⋅ =∂
v
( ) ( )
( )
k k k k k k k
k g k k k lk l k
t
p K
α ρ α ρ
α α ρ
∂+ ∇ ⋅
∂
= − ∇ + ∇⋅ + + −
v v v
τ g v v
w w w . c p f d - s o f t w a r e . c o m
9
• Turbulence Model (k-ϵ):
• Stress Equations:
( ) ( ) t
i k b M
i j k j
kk u k G G Y
t x x x
µρ ρ µ
σρε
∂ ∂ ∂ ∂+ = + + −
∂ ∂ ∂ ∂
+ −
( ) ( )2
1 2t
i k
i j j
u C G Ct x x x k kε
ε ε
µ ερε ρ ε µ
σ
ε ερ
∂ ∂ ∂ ∂+ = + +
∂ ∂ ∂ ∂
+
[ ] 2s s s s s s sp α λ µ= − + ∇⋅ +τ v S

2nd World Congress onPetrochemistry and Chemical EngineeringOctober 27-29, 2014 Las Vegas, USA
CFD model and analysis
• Deformation Rate:
• Solid Phase Pressure:
( )1 1
2 3
T
k k k k k kv vα α = ∇ + ∇ − ∇ ⋅
S v I
w w w . c p f d - s o f t w a r e . c o m
10
• Solid Phase Viscosity:
• Granular Temperature Equation:
• Collisional Energy Dissipation:

2nd World Congress onPetrochemistry and Chemical EngineeringOctober 27-29, 2014 Las Vegas, USA
CFD model and analysis
• Drag Coefficient:
w w w . c p f d - s o f t w a r e . c o m
11
• Where:

2nd World Congress onPetrochemistry and Chemical EngineeringOctober 27-29, 2014 Las Vegas, USA
CFD model and analysis
CFD results analysis:� Figures illustrate flow pathlines, flow pathlines with solid velocity vectors, and
flow pathlines with solid volume fraction in the SB.
� The CFD results depict well the four different zones characterizing solid-gas
flow in the SB
w w w . c p f d - s o f t w a r e . c o m
12
Flow pathlines from inlet of the spouted bed gasifierTime-averaged solid volume fraction at different times
2nd World Congress onPetrochemistry and Chemical EngineeringOctober 27-29, 2014 Las Vegas, USA
CFD model and analysis
CFD results analysis:
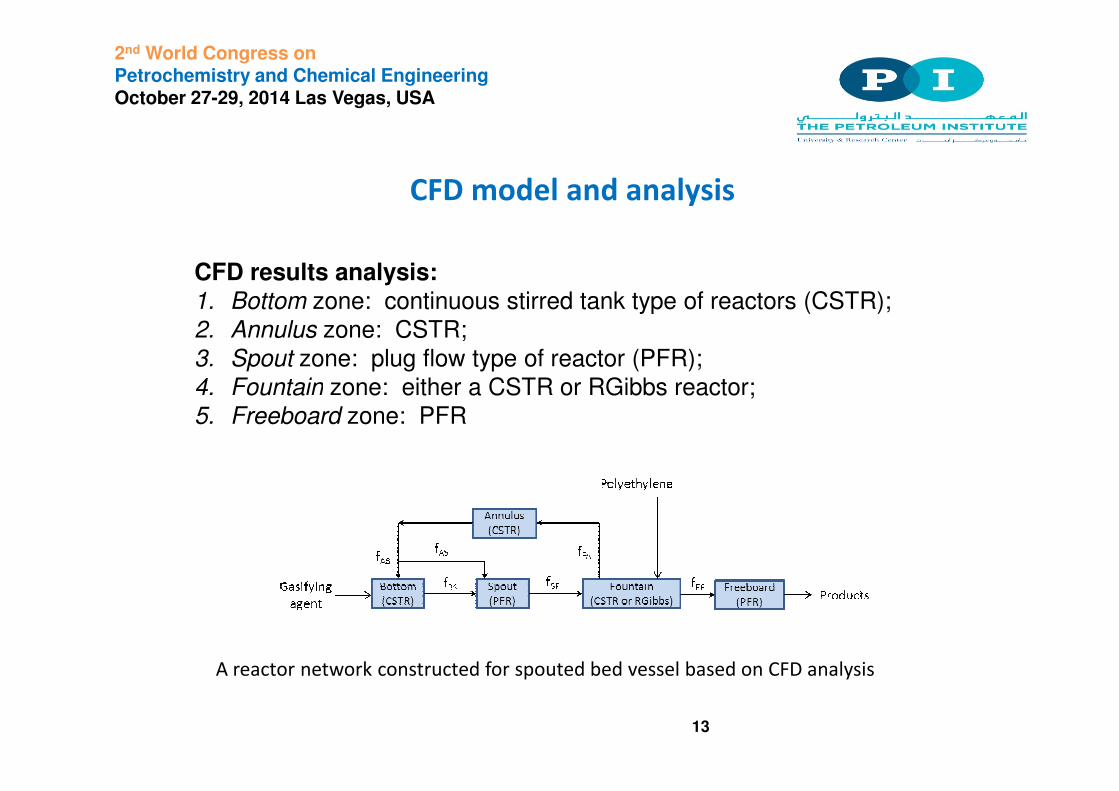
1. Bottom zone: continuous stirred tank type of reactors (CSTR);
2. Annulus zone: CSTR;
3. Spout zone: plug flow type of reactor (PFR);
4. Fountain zone: either a CSTR or RGibbs reactor;
w w w . c p f d - s o f t w a r e . c o m
13
A reactor network constructed for spouted bed vessel based on CFD analysis
4. Fountain zone: either a CSTR or RGibbs reactor;
5. Freeboard zone: PFR
2nd World Congress onPetrochemistry and Chemical EngineeringOctober 27-29, 2014 Las Vegas, USA
CFD model and analysis
CFD results analysis:
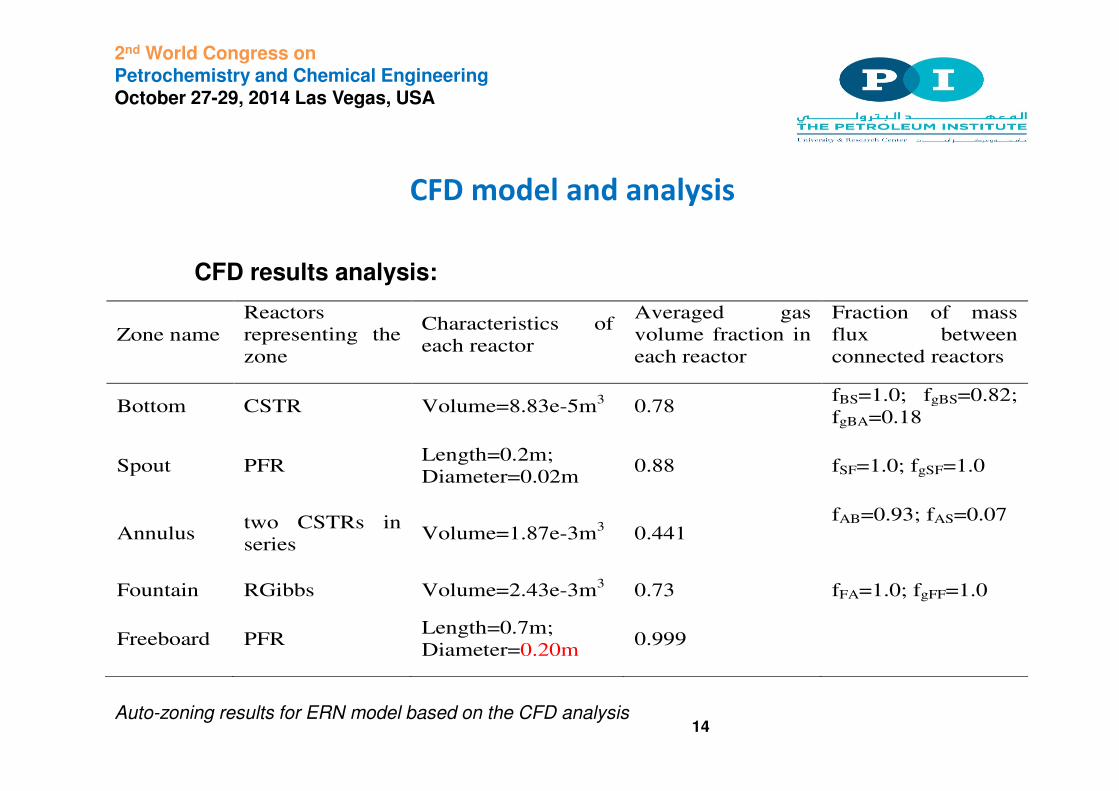
Zone name
Reactors
representing the
zone
Characteristics of
each reactor
Averaged gas
volume fraction in
each reactor
Fraction of mass
flux between
connected reactors
Bottom CSTR Volume=8.83e-5m3 0.78
fBS=1.0; fgBS=0.82;
w w w . c p f d - s o f t w a r e . c o m
14
Bottom CSTR Volume=8.83e-5m3 0.78
fBS=1.0; fgBS=0.82;
fgBA=0.18
Spout PFR Length=0.2m;
Diameter=0.02m 0.88 fSF=1.0; fgSF=1.0
Annulus two CSTRs in
series Volume=1.87e-3m
3 0.441
fAB=0.93; fAS=0.07
Fountain RGibbs Volume=2.43e-3m3 0.73 fFA=1.0; fgFF=1.0
Freeboard PFR Length=0.7m;
Diameter=0.20m 0.999
Auto-zoning results for ERN model based on the CFD analysis

2nd World Congress onPetrochemistry and Chemical EngineeringOctober 27-29, 2014 Las Vegas, USA
ERN model and process simulations
� Construction of an equivalent reactor network model (ERN) for the newly-
designed conical spouted bed gasifier based on the CFD results.
� The structure of the reactor network is based on the schematic depicted in
the Figure below with an added PE pyrolysis reactor and Rgibbs reactor to
represent the fountain zone.
w w w . c p f d - s o f t w a r e . c o m
15Simulation flowchart

2nd World Congress onPetrochemistry and Chemical EngineeringOctober 27-29, 2014 Las Vegas, USA
ERN model and process simulations
Reactions:� Pyrolysis: the yields of the gas and tar are 64.11%wt and 35%wt, respectively,
and the rest are char. The gas consists of 0.056%wt H2, 0.149%wt CH4, and
0.795%wt C2+(Cozzani’s data at 700⁰C). Benzene, toluene and naphthalene
are used to represent PE tar.
� Gasification process is described using a simplified reaction scheme
w w w . c p f d - s o f t w a r e . c o m
16
⁰
� Gasification process is described using a simplified reaction scheme
Simplified reaction scheme of polyethylene gasification process

2nd World Congress onPetrochemistry and Chemical EngineeringOctober 27-29, 2014 Las Vegas, USA
ERN model and process simulationsReaction
number
Stoichiometry Reaction name Reference
1 6 6 2 2 2
7 .5 6 3C H O C O H O+ → + oxidation Gerun et al.40
2 7 8 2 2
3 .5 7 4C H O C O H+ → + oxidation Su et al.41
3 1 0 8 2 2 2
1 2 1 0 4C H O C O H O+ → + oxidation Su et al.41
4 2m n x y
p C H q C H r H→ + thermal cracking Li et al.42
5 7 8 2 2
7 1 4 4C H C O C O H+ → + dry reforming Wu et al.43
w w w . c p f d - s o f t w a r e . c o m
17Possible reactions of tar with benzene, toluene, and naphthalene
5 7 8 2 2
7 1 4 4C H C O C O H+ → + dry reforming Wu et al.
6 6 6 2 4
2 1 .5 2 .5 2C H H O C C H C O+ → + + steam reforming Su et al.41
7 6 6 2 2
6 9 6C H H O H C O+ → + steam reforming Coll et al.44
8 7 8 2 2
7 1 1 7C H H O H C O+ → + steam reforming Kantarelis et al.38
9 1 0 8 2 2
1 0 1 4 1 0C H H O H C O+ → + steam reforming Wang et al.45
10 7 8 2 6 6 2
2C H H O C H C O H+ → + + steam dealkylation Wu et al.43
11 7 8 2
4 7C H H C→ + carbon formation Srinivas et al.34
12 1 0 8 2
4 1 0C H H C→ + carbon formation Li et al.42
13 7 8 2 4 6 6
C H H C H C H+ → + hydrodealkylation Jess46
m nC H represents tar, and
x yC H represents hydrocarbon with smaller carbon number than
m nC H .

2nd World Congress onPetrochemistry and Chemical EngineeringOctober 27-29, 2014 Las Vegas, USA
Results and discussion
Model validation:� The Model predictions are compared to
the experimental observations of Erkiaga
et al. (Fuel 2013, 109, 461-469.)
� ERN model predictions of gasification
products, including H , CO, and CH , are 30
40
50
60
ERN model, H2
ERN model,CO ERN model,CH4
ERN model,others
Ex.data, H2
Ex.data, CO
Ex.data, CH4
Ex.data, others
Ga
s c
om
po
sitio
n (
v/v
%)
w w w . c p f d - s o f t w a r e . c o m
18
products, including H2, CO, and CH4, are
in very good agreement with experimental
data.
800 850 900
0
10
20
Ga
s c
om
po
sitio
n (
v/v
%)
Temperature (°C)
Gas compositions as predicted by ERN model and
Erkiaga et al. (2013) experiment for S/P=1.0
Products yields as predicted by ERN model and
Erkiaga et al. experiment for S/P=1.0.

2nd World Congress onPetrochemistry and Chemical EngineeringOctober 27-29, 2014 Las Vegas, USA
Results and discussion
A range of 600 ⁰C to 900 ⁰C is selected for the purpose of finding out the optimum
T for PE gasification process at ER=0.4⁰C.
Effect of Temperature:
100
w w w . c p f d - s o f t w a r e . c o m
19
Effect of gasification temperature on products
yield at ER=0.4
Effect of gasification temperature on syngas
composition at ER=0.4
600 700 800 900
0
10
20
80
90
gas
water
tar
char
Pro
duct yie
lds (
%w
t)
Temperature(°C)
600 700 800 900
2
4
6
8
10
12
14 CO
H2
CO2
CH4
C2H4
Gas c
om
positio
n (
v/v
%)
Temperature (°C)

2nd World Congress onPetrochemistry and Chemical EngineeringOctober 27-29, 2014 Las Vegas, USA
Results and discussion
Effect of Temperature:
6.50
w w w . c p f d - s o f t w a r e . c o m
20
Effect of gasification temperature on syngas LHV,
CGE, and CCE at ER=0.4
600 700 800 900
60
70
80
90
100
5.00
5.25
5.50
5.75
6.00
6.25
CCE
CGE
Carb
on
co
nvers
ion e
ffic
ien
cy (
%)
and c
old
gas e
ffic
iency (
%)
Temperature (°C)
LH
V o
f syng
as (
MJ/N
m3)
LHV

2nd World Congress onPetrochemistry and Chemical EngineeringOctober 27-29, 2014 Las Vegas, USA
Results and discussion
Effect of Equivalence Ratio:A range of 0.2 to 0.5 is selected for the purpose of finding out the optimum ER for
PE gasification process at T=700⁰C.
w w w . c p f d - s o f t w a r e . c o m
21
Effect of ER on syngas composition at T=700⁰C Effect of ER on syngas LHV, CCE, CGE at T=700⁰C

2nd World Congress onPetrochemistry and Chemical EngineeringOctober 27-29, 2014 Las Vegas, USA
Conclusions
� Plastic waste gasification is one of the most promising techniques to use
non-decomposable solid waste and to produce syngas.
� CFD-based Equivalent Reactor Network (ERN) model is developed for
simulation of polyethylene gasification in a designed pilot-scale conical
spouted bed gasifier.
w w w . c p f d - s o f t w a r e . c o m
22
spouted bed gasifier.
� CFD-based ERN model is established through two steps:
(i) hydrodynamics simulations using CFD; (ii) the equivalent reactor
network is built with gasification reactions taken into account through
external FORTRAN modules.
� Model predictions are in very good agreement with experimental data of a
lab-scale conical spouted bed gasifier used for steam gasification of
polyethylene.

2nd World Congress onPetrochemistry and Chemical EngineeringOctober 27-29, 2014 Las Vegas, USA
Conclusions
� Developed CFD-based ERN model is used to investigate the effects of
gasification temperature and equivalence ratio on the gasification
performance of polyethylene in a pilot-scale CSB reactor.
� It is found that the proper values of temperature and ER for air gasification are
700°C and 0.4, respectively.
w w w . c p f d - s o f t w a r e . c o m
23
700°C and 0.4, respectively.
� With this operation condition, a value of LHV of 6.2MJ/Nm3, a value of CGE of
72.14% and a value of CCE of 97.3% are recorded
� Present work has demonstrated the capabilities of the developed CFD-based
ERN model in simulating polyethylene waste gasification process
� It has also demonstrated the appropriateness of the designed pilot-scale
conical spouted bed gasifier to carry out such a process.


![International Journal of Pure and Applied Mathematics ...batch/semi batch [6], fixed bed, fluidized bed, spouted bed, microwave [7] and screw kiln. Batch or semi -batch reactors have](https://img.pdfslide.net/doc/110x75/6042d371c8d4a7373d406703/international-journal-of-pure-and-applied-mathematics-batchsemi-batch-6.jpg)