Embed Size (px)
Citation preview
CFD Validation by Wind Tunnel Measurements: Uncertainty Assessment by Numerical Simulation of Complete Wind Tunnel Flows
Stefan Melber-Wilkending, Alexander Heidebrecht, Georg WichmannGerman Aerospace Center – DLR / Institute of Aerodynamics and Flow Technology
Lilienthalplatz 7 / 38108 Braunschweig - Germany
[email protected], [email protected], [email protected]
ABSTRACT
This paper contributes to investigations in the context of uncertainties of modern CFD methods by considering the numerical simulation and analyses of wind tunnel experiments including all geometrical and aerodynamic conditions – a so-called numerical wind tunnel. The computational method described is based on investigations within the DLR project ForMEx outlined for the wind tunnels DNW-NWB and ETW. Certainly aiming at the improvement of today’s wind tunnel testing techniques, e.g. CFD based wind tunnel corrections, and improved understanding of the flow physics the project results also represent an excellent data base to study uncertainty effects of the used CFD approaches.
1.0 INTRODUCTION
For the design of new aircraft configurations the wind tunnel experiment still represents an indispensable tool in order to predict the aerodynamic performance of single aircraft components as well as the overall configuration and respectively to validate numerical procedures. In this context extrapolation of the wind tunnel tests to free flight conditions within this process contains certain inaccuracies. The wind tunnel flow does not correspond to the free flight because of wall and model mounting effects. In order to minimize these influences to a large extent, data corrections of the wind tunnel tests are performed, which up to now are based on simple procedures and hand book methods. The wind tunnel measurements usually are performed with smaller models compared to the original, and the extrapolation to real conditions is done by each aircraft company using their own extrapolation procedures. Aerodynamic performance data resulting from the wind tunnel experiment therefore are still affected by certain systematic errors.
During the last years advanced modern procedures for CFD flow simulation have been further developed. In particular by the use of unstructured codes for the flow simulation around complex configurations and geometries also complete wind tunnel flows can now be handled with the required accuracy and justified effort. Thus the critical examination of existing wind tunnel correction procedures and their improvement is made possible, leading to more reliable procedures for the prediction and extrapolation of the wind tunnel experiment to free flight. Within the DLR project ForMEx the numerical simulation and respectively the analysis of the wind tunnel experiment in the so-called numerical wind tunnel considering all geometrical and aerodynamic conditions is performed in order to improve the wind tunnel testing technique described above. In the process also model and model mounting deformations are considered using flow/structure coupling methods. From the deviations detected by careful comparisons of the experimental data with the results of the numerical simulation of the experiment correction rules will be derived. Further on, based on the numerical wind tunnel a so-called numerical wind tunnel correction considering all tunnel and model details is available.
At the beginning the paper outlines the applied numerical procedure, in the present case the unstructured DLR TAU code. The study then describes the CFD potentials to support wind tunnel testing in the low speed wind tunnel DNW-NWB with a transport aircraft half model mounted in the test section and the transonic wind tunnel ETW with a transport aircraft full span model at cruise condition.
RTO-MP-AVT-147 22 - 1
UNCLASSIFIED/UNLIMITED
UNCLASSIFIED/UNLIMITED
Melber-Wilkending, S.; Heidebrecht, A.; Wichmann, G. (2007) CFD Validation by Wind Tunnel Measurements: Uncertainty Assessment by Numerical Simulation of Complete Wind Tunnel Flows. In Computational Uncertainty in Military Vehicle Design (pp. 22-1 – 22-14). Meeting Proceedings RTO-MP-AVT-147, Paper 22. Neuilly-sur-Seine, France: RTO. Available from: http://www.rto.nato.int.
This new approach of CFD supported wind tunnel testing based on investigations of the DLR project ForMEx [1, 2] not only shows ways to improve today’s wind tunnel testing techniques and allows an improved understanding of the flow physics mentioned above but also represents an essential contribution within the context of uncertainties of modern CFD methods.
2.0 NUMERICAL METHOD
The solution of the Reynolds-averaged Navier-Stokes equations (RANS) is carried out using the hybrid unstructured DLR TAU code [3]. For the closure of the Reynolds-averaged equations the k-ω-SST turbulence model of Menter is used, which combines robustness with the applicability for partly detached flows. Due to the low Mach numbers and the resulting stiffness of the RANS equations, low Mach number preconditioning is used. Finally, the central JST-scheme in combination with 80% matrix dissipation assures numerical flow solutions with low numerical dissipation. To increase the convergence, an implicit time-integration (LU-SGS) is implemented in TAU code. All shown results are computed with fully turbulent flow.
3.0 RESULTS
3.1 Half Model Technique on Example of a Low Speed Wind Tunnel DNW-NWB
Strongly coupled with the experimental simulation of high lift configurations in the wind tunnel is the so called half model technique. It results from the demand of the same Reynolds number in free flight and wind tunnel experiment to get the flight physics as real as possible in the wind tunnel experiment. On this point the half model technique is introduced using the assumption of a symmetrical flow around the aircraft by cutting it on the symmetry axis along the fuselage and measure this configuration in the wind tunnel. Using this technique the model size can be doubled without changing the test section and getting a doubled Reynolds number holding all other parameters constant compared to the full span model.
A reduction in the quality of the measurements results from the increased wind tunnel interference resulting from the model volume and the mounting of the model on the tunnel floor or ceiling, in which the model is partially covered by the tunnel wall boundary layer. To reduce this influence and to reduce the disturbance of the symmetrical flow the fuselage is often mounted on a cylindrical extension of its symmetry cut called peniche or stand-off. But even using a peniche a completely symmetrical flow in the symmetry plane cannot be achieved, due to the horse-shoe vortex between peniche a tunnel wall. Because of this, the asymmetries in the flow cannot be eliminated by changing the peniche height and this behaviour always leads to a difference between a half model compared to the full span model measurement.
3.1.1 Geometry / Configuration
In this paper the ALVAST transport aircraft geometry in landing configuration is considered in the wind tunnel DNW-NWB. The ALVAST model is a generic configuration of a modern, twin-engine transport aircraft comparable with an AIRBUS A320 in scale 1:10. Beside the wing this landing configuration consists of a single slat and a single slotted flap which is split into an inner and outer part by a thrust gate [4]. The low speed wind tunnel in Braunschweig (DNW-NWB) is an atmospheric wind tunnel of Göttingen design with a closed loop. The construction of the tunnel was finalized 1960 and the tunnel is integrated since 1996 in the German-Netherland wind tunnels (DNW). The test section has the size of 3.25 m x 2.8 m and reaches a flow speed of 90 m/s at a maximum drive-power of 1.4 MW.
3.1.2 Numerical Simulation of a Wind Tunnel
The peniche plays an important role for the half model technique and therefore it is also considered and simulated in the investigation described in this paper. On the peniche as well as on the fuselage the
CFD Validation by Wind Tunnel Measurements: Uncertainty Assessment by Numerical Simulation of Complete Wind Tunnel Flows
22 - 2 RTO-MP-AVT-147
UNCLASSIFIED/UNLIMITED
UNCLASSIFIED/UNLIMITED
boundary layer of the model and the tunnel wall interacts. Therefore the tunnel wall on which the model was mounted has to be simulated viscid. The remaining walls can be treated inviscid to reduce the numerical effort. However with an increasing angle of attack and thus blockage a wind tunnel model has a remarkable influence on the boundary layer of the tunnel walls. Because of this all tunnel walls are treated viscous in this simulation.
In principle the numerical simulation of a wind tunnel can include the complete tunnel with test section, diffuser, direction change, drive, settling chamber and nozzle. Indeed this would be an additional effort to simulate the intrinsic flow in the test section. Therefore it would be sufficient to simulate only the test section with an in- and outflow. But the shape of the boundary layer on the tunnel walls at the inflow is not known. By adding the nozzle and the settling-chamber to the simulated domain this problem can be solved because the flow straighteners in front of the settling chamber remove the boundary layer and for this reason the flow topology can be handled numerically at this station. Further on the boundary conditions for the simulation of the in- and outflow serve at the same time for the control of the flow speed in the numerical wind tunnel. A detailed description can be found in [5] and shall not be repeated here.
To change the angle of attack of the model in the wind tunnel in the experiment a turntable on the tunnel floor is used. To simulate this numerically in the current investigation the Chimera technique is used [5]. Therefore the tunnel is meshed without the model, afterwards the volume is cut out in which the configuration is rotated at different angles of attack. In this volume a second grid is inserted including the model. The final grid consists of about 21x106 points.
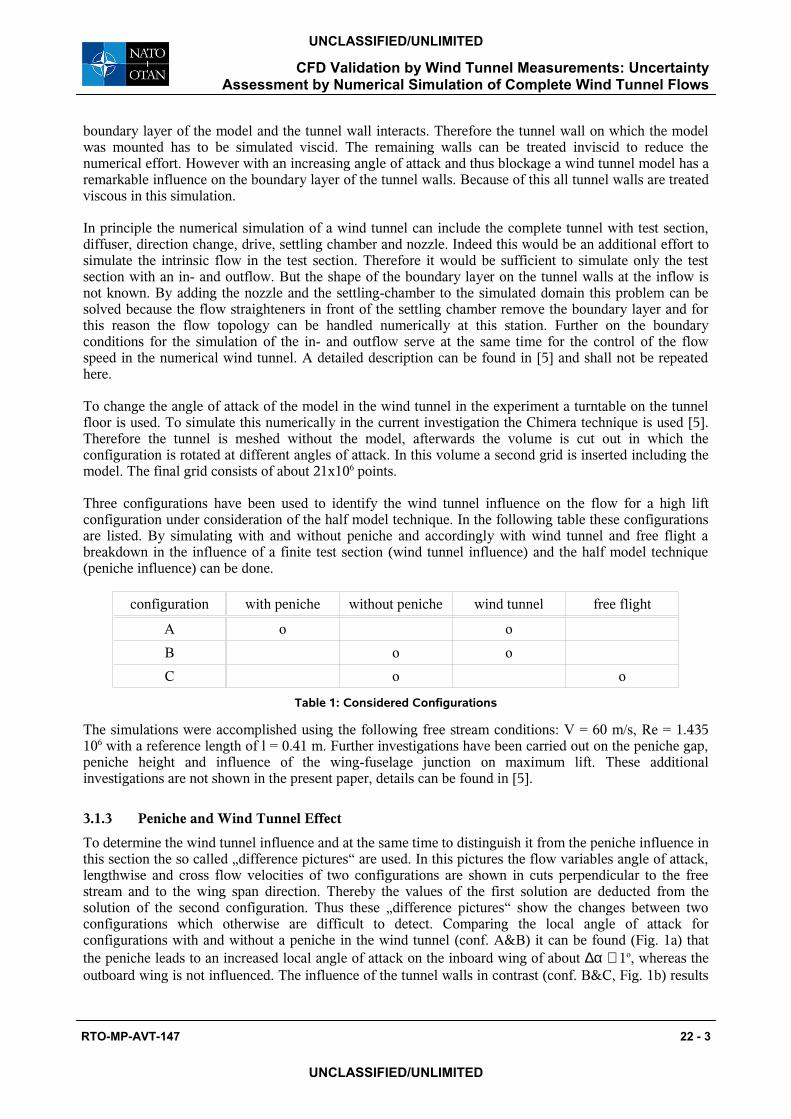
Three configurations have been used to identify the wind tunnel influence on the flow for a high lift configuration under consideration of the half model technique. In the following table these configurations are listed. By simulating with and without peniche and accordingly with wind tunnel and free flight a breakdown in the influence of a finite test section (wind tunnel influence) and the half model technique (peniche influence) can be done.
configuration with peniche without peniche wind tunnel free flight
A o o
B o o
C o o
Table 1: Considered Configurations
The simulations were accomplished using the following free stream conditions: V = 60 m/s, Re = 1.435 106 with a reference length of l = 0.41 m. Further investigations have been carried out on the peniche gap, peniche height and influence of the wing-fuselage junction on maximum lift. These additional investigations are not shown in the present paper, details can be found in [5].
3.1.3 Peniche and Wind Tunnel Effect
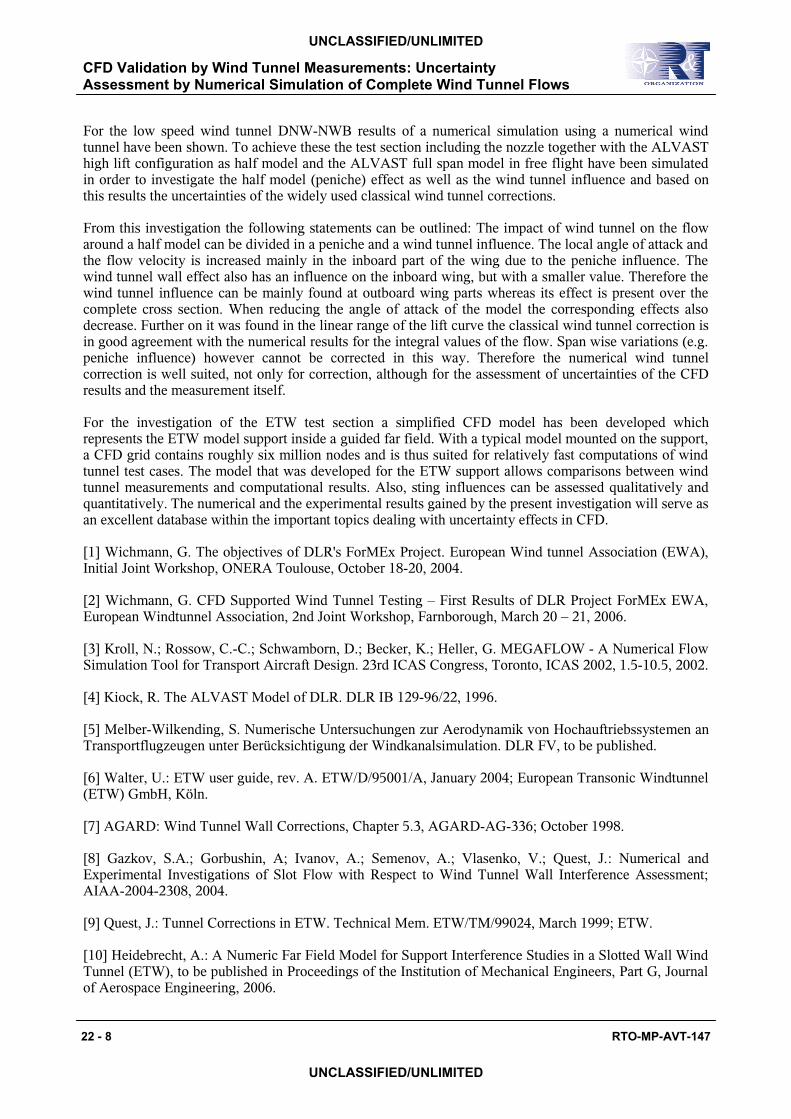
To determine the wind tunnel influence and at the same time to distinguish it from the peniche influence in this section the so called „difference pictures“ are used. In this pictures the flow variables angle of attack, lengthwise and cross flow velocities of two configurations are shown in cuts perpendicular to the free stream and to the wing span direction. Thereby the values of the first solution are deducted from the solution of the second configuration. Thus these „difference pictures“ show the changes between two configurations which otherwise are difficult to detect. Comparing the local angle of attack for configurations with and without a peniche in the wind tunnel (conf. A&B) it can be found (Fig. 1a) that the peniche leads to an increased local angle of attack on the inboard wing of about ∆α ∼ 1o, whereas the outboard wing is not influenced. The influence of the tunnel walls in contrast (conf. B&C, Fig. 1b) results
CFD Validation by Wind Tunnel Measurements: Uncertainty Assessment by Numerical Simulation of Complete Wind Tunnel Flows
RTO-MP-AVT-147 22 - 3
UNCLASSIFIED/UNLIMITED
UNCLASSIFIED/UNLIMITED
in an additional angle of attack on the complete wing span of about ∆α ∼ 0.5o. The superposition of both effects can be found accordingly between the configuration A&C, Fig. 1c.
The reason for this peniche effect is the additional blocking of the peniche in the flow field. This leads to an additional displacement of the flow leading to an increased flow speed and local angle of attack on the model. With increasing angle of attack this effect increases. Further on with increasing distance (e.g. along the wing span) this peniche effect decays. Around the fuselage an interplay between the peniche and wind tunnel effect can be found. Considering Fig. 2 the main influence of the angle of attack can be found in proximity of the fuselage especially in regions where the horse-shoe vortex is located. The wind tunnel effect in contrast leads to an increased angle of attack in front of the model of about ∆α ∼ 1.0o and behind the configuration to an additional value of about ∆α ∼ 4.0o compared to the free flight, Fig. 3. The reason is the downwash of the wing, which cannot spread out downwards because of the wind tunnel wall. Again these effects are superimposed on configuration A&C.
Concerning the cross flow velocity the peniche influence decelerates the flow above and accelerates the flow below the fuselage, in both cases of about ∆v = ± 1 m/s, whereas the wind tunnel influence has no effect, Fig. 1. Because of the spatial reduction of the peniche influence the cross flow velocity is mainly changed on the inboard wing. The lengthwise velocity is decelerated because of the peniche influence in front of the model and accelerated above the model because of the wind tunnel effect. These wind tunnel effects lead to a nearly constant acceleration of about ∆u = ± 0.5 m/s on the complete wing span superimposed by the peniche influence on the inboard wing. In the same manner as before the effects are superimposed in configuration A&C.
Concluding the peniche effect, the flow around the fuselage and the flow deflection are increased leading to an increased flow velocity and local angle of attack on the inboard wing. The strength of the peniche effect is therefore a function of the angle of attack and changes the lift rise, compare Fig. 4. Further on the configuration without peniche has a reduced lift coefficient of 2.6% also. The peniche effect can be found at all angles of attack because the displacement of the peniche always takes place. Further on from the lift curves a change in the maximum angle of attack can be found with and without peniche. With peniche the maximum angle of attack is at α = 15o whereas without peniche at α = 15.5o. In this case the additional load on the inboard wing due to the peniche reduces the maximum possible angle of attack. If this behaviour is triggered by the peniche it is mainly decided were the flow separates, first on the inboard or outboard wing. In the first case the peniche increases the load on the inboard wing and intensifies the lift breakdown there. Using half model measurements this effect must be always kept in mind.
Comparing the lift curves of configuration A&C (Fig. 4) it is clearly visible the one got from the wind tunnel simulation is shifted above the one of the free flight. The reason is the wind tunnel effect which leads to an increasing angle of attack and flow velocity. The peniche effect leads simultaneously to an increased gradient of the lift curve compared with the free flight.
3.1.4 Wind Tunnel Correction – Numerical Wind Tunnel
In Fig. 4 the corrected and uncorrected lift curves from the measurement in the wind tunnel DNW-NWB are shown with the corresponding numerical simulations in the tunnel and the free flight. Configuration A corresponds to the uncorrected measurement, configuration C the corrected one. The corresponding curves of the measurement and the simulation show a good agreement in the linear range of the lift curve.
To get a more detailed assessment of the wind tunnel correction without regarding a measurement and with removing possible measurement and simulation errors the lift curves of the simulation in the wind tunnel are corrected with wind tunnel correction and compared to the lift curves of the free flight. The wind tunnel correction is well defined, if this corrected results from the wind tunnel simulation correlate with free flight simulations.
CFD Validation by Wind Tunnel Measurements: Uncertainty Assessment by Numerical Simulation of Complete Wind Tunnel Flows
22 - 4 RTO-MP-AVT-147
UNCLASSIFIED/UNLIMITED
UNCLASSIFIED/UNLIMITED
The results are shown in Fig. 5 for configuration A (in wind tunnel), uncorrected and corrected, and for comparison configuration C (in free flight). The corrected lift curve of the configuration matches the lift curve of configuration C with a slightly higher gradient and a little bit increased level of lift. The corrected lift curve of configuration B has a slightly reduced gradient and a lower level of lift compared with the free flight. Without peniche there is no additional displacement which can compensate the boundary layer of the tunnel wall. On the other hand with peniche the displacement increases with increasing angle of attack and leads to an only point-wise matching of the corrected wind tunnel measurement and the free flight values as a function of the peniche height.
Overall the used classical wind tunnel correction shows a good agreement in the linear range of the lift curve with the results of the numerical wind tunnel. However the peniche effect is not corrected, especially in its spanwise variation. This leads to spanwise differences in the pressure distributions (not shown here, compare [5]). This differences between corrected configuration A and C can be removed by using a CFD based numerical wind tunnel correction simply by creating the difference of the numerical results of configuration A (uncorrected) and C for each considered angle of attack.
Further on this numerical wind tunnel correction can be considered as a measure of uncertainties of all currently used wind tunnel corrections, where as the comparison of (uncorrected) measurements with the results of the numerical wind tunnel gives the sum of the uncertainties of the CFD results and the measurement itself (e.g. force- and pressure measurements).
3.2 Sting Effects in the European Transonic Wind Tunnel (ETW)
The ETW (European Transonic Wind tunnel) is a transonic cryogenic facility with a Mach number range up to 1.3, which can be pressurized up to 450 kPa and can be cooled down to 110 K, in order to reach Reynolds numbers of up to 50 million for full span models [6]. In order to avoid blockage at transonic wind speeds, the top and bottom walls are slotted and allow the flow to deviate into a large plenum chamber. Fig.6 shows an overview of the test section.
The aim of the project work for the ETW is to create a simplified numerical model of the ETW test section (Fig. 6), in order to evaluate the influence of different support types on measurement results. The focus is on having a model as simple as possible, while capturing all effects of the model support precisely enough to compare and improve different support types and to gain knowledge on the mechanisms of support interference. Another aim is to investigate whether such a simple model can deliver improvements to correction methods and to contribute to the determination of CFD uncertainties. The numerical investigation has been performed using the DLR CFD code TAU [3]. There are simplified methods for using CFD to derive corrections in transonic slotted-wall wind tunnels given in [7]. However, these require measured wall pressures as a boundary condition. This way only configurations can be object of a computation that have already been tested in the wind tunnel and for which wall pressures have been measured. The flow in and around the slots has been shown to be very complex [8] and potentially sensitive to small changes of the main flow. Thus, even for small deviations from measured flow states, there is no certainty as to the accuracy of computational results, since the boundary condition at the wall can't “react” appropriately to changes in the main flow. Since it is planned to investigate also nonexistent configurations, the existing simplified simulation models cannot be used for the work described in this paper.
3.2.1 Wall-free model
The resulting grids should be medium to small size, enabling the computation of several polars of Mach number variation with justifiable effort, i.e. CFD grids with well below 10 million nodes. Also, the boundary conditions should be well-defined, i.e. it should be easy to identify the influence of the support and distinguish it from other effects, originating e.g. in a simplified wall model.
Slotted walls in transonic wind tunnels as realized in the ETW are calibrated in order to minimise blockage. Thus the effect they have on test results is much closer to free flight than to a solid wall. This is
CFD Validation by Wind Tunnel Measurements: Uncertainty Assessment by Numerical Simulation of Complete Wind Tunnel Flows
RTO-MP-AVT-147 22 - 5
UNCLASSIFIED/UNLIMITED
UNCLASSIFIED/UNLIMITED
also reflected in small corrections applied at the ETW for slotted walls [9]. This means that actually, a transonic computation with a far field and no walls comes very close to the real situation in ETW. From several considerations regarding the simulation of solid side walls without top and bottom walls or developing a special “slotted wall” boundary condition, for the present investigation the final conclusion was that for sake of simplicity there should be no walls at all. This way it is also possible to have a defined environment for assessment of support influence, without the need to differentiate between several interference sources.
For determining the level of simplification the straight sting model support with an axial probe mounted on it (SAP – Short Axial Probe) was regarded. Simply isolating the part inside the tunnel test section would result in the geometry shown in Fig. 7. The problem with this configuration is that the flow could pass the upper and lower end of the sector. This would result in vertical flow components that are not present in the actual wind tunnel and would also lower the stagnation effect caused by the sector. To counter this, the sector was extended vertically. This was done by a straight extrusion of the sector profile at the point where the sector meets the tunnel walls and can also be understood as “mirroring” the sector geometry. This way the effect of the sector meeting the walls behind the test section is included in the computations. A parameter study was conducted in order to determine how far the sector has to be extended. Details of the proceedings can be found in [10].
3.2.2 Calibration and Validation
In the ETW, the flow characteristics are adjusted so that inside the test section at a reference position at the wall a dynamic pressure and temperature is reached that corresponds to the wanted Mach and Reynolds number at the model position. In order to obtain flow conditions at the model comparable to an experiment within the computation, a corresponding flow condition at the far field has been applied, similar to the real wind tunnel experiment [9]. To determine the necessary far field conditions a correlation which links far field values to corresponding values at the model location has been established in the computation using an iterative approach by replicating some of the calibration measurements done in the ETW using an axial probe (SAP). This was done on the assumption that the necessary change in far field Mach number was similar to the Mach number difference at the point of model rotation between computation and experiment, using equal total conditions. After roughly five such iterations, the flow properties at the model location match.
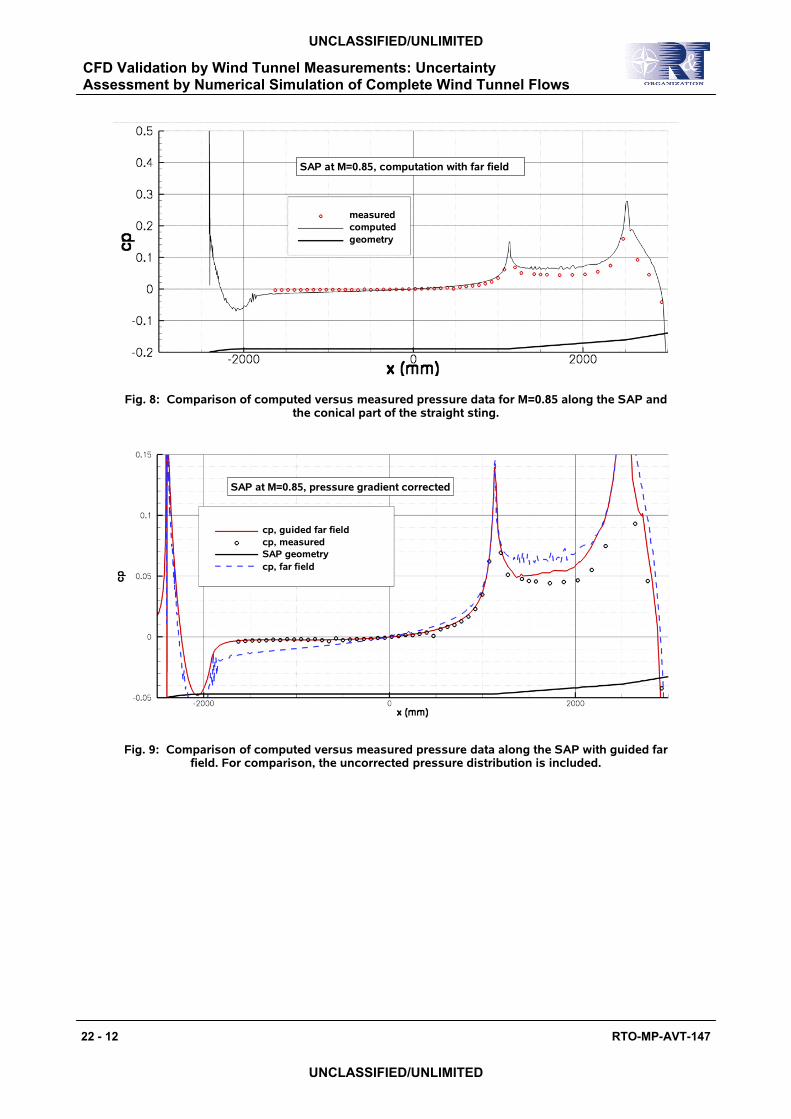
For the case of a Mach number M=0.85 and Reynolds number Re=4.2 millions a comparison between experiment and CFD calculation was done, using the same SAP geometry that was used for calibration. Fig. 8 shows the pressure distribution along the SAP and the conical part of the straight sting. At the point of model rotation (x=0), the measured and computed pressures match exactly, as this was part of the calibration. Apart from that, while in general both curves fit well together, a small gradient can be observed in the computed pressures that is not present in the measured data. The reason for this is that during the ETW calibration phases the re-entry flaps and the wall angle have been set up to deliver the lowest possible axial pressure gradient. This means that in the ETW the walls and re-entry flaps compensate a support effect that is visible here, namely the slowing down of the oncoming flow ahead of the sting boss and the sector.
Without taking into account that the actual wind tunnel walls neutralise this gradient, a precise correction procedure cannot be derived using a far field model. Still, comparison of different support systems is possible using the far field model, since the error is constant between different computations, as long as maximum lift is not reached. But still, comparisons with experiments or free flight computations are difficult because the effects of the pressure gradient on shock and separation positions cannot be isolated from the actual influence of the support.
3.2.2 Guided Far Field
In order to establish a simulation model that delivers results comparable with experimental data, the model described above was modified. This was done by replacing the far field by a rotationally symmetric,
CFD Validation by Wind Tunnel Measurements: Uncertainty Assessment by Numerical Simulation of Complete Wind Tunnel Flows
22 - 6 RTO-MP-AVT-147
UNCLASSIFIED/UNLIMITED
UNCLASSIFIED/UNLIMITED
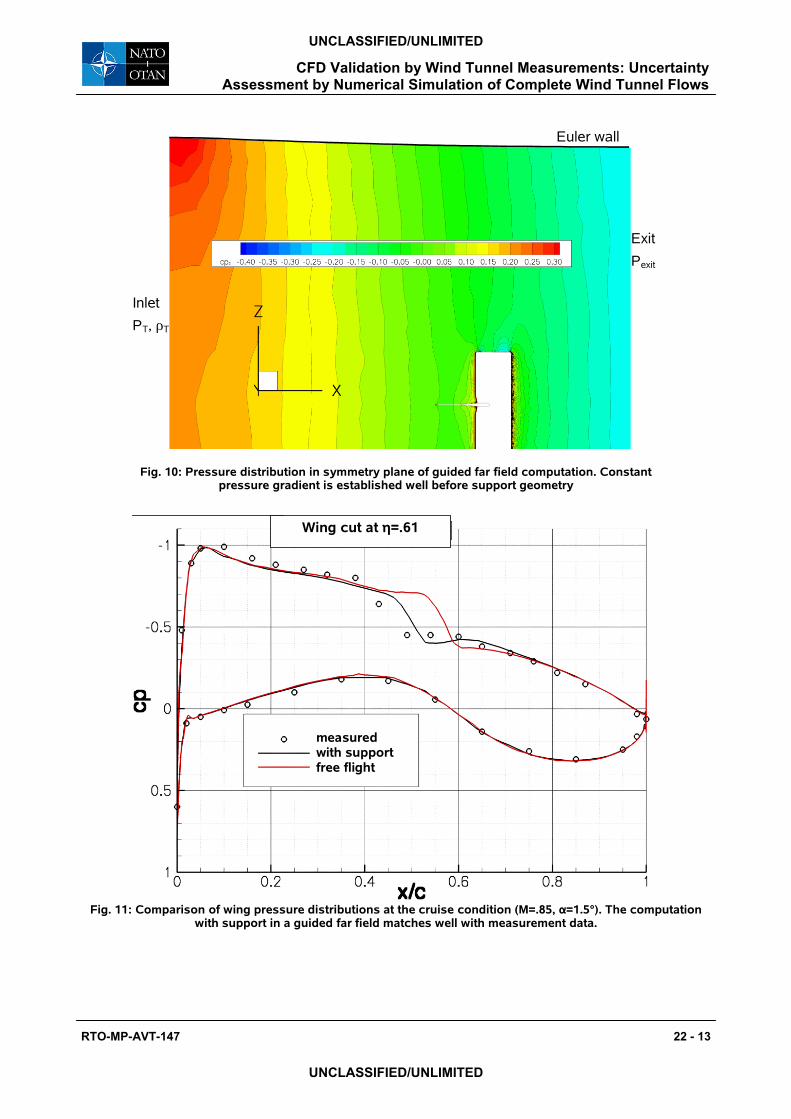
convergent tube. The diameter of the tube was defined by the 1D law for isentropic expansion in a way such that it would impose a constant axial gradient on the flow within, opposite to the pressure gradient caused by the extended sector in the farfield model. A series of computations on the empty tube was conducted to make sure that the volume with constant pressure gradient was at least as large as the far field used before, this led to dimensions of the tube of a radius of 35 meter around the PMR and an additional length of 10 m to settle the flow after the inlet. The tube walls were regarded as inviscid.
With the tube dimensions known, a calibration was done using the SAP geometry. First, the tube geometry is set to deliver a gradient of equal size and adverse direction than the difference between the far field computation and the experiment. Then a computation is done, with total values constant and the exit pressure equal to the theoretic pressure at the exit points from 1D theory. Due to compressibility effects and because the pressure distribution at the tube centreline lags behind the outer contour, this does not correct the erroneous pressure gradient precisely. Static pressure and gradient at the point of model rotation are then compared with the experiment again and the difference is used to further modify the tube geometry. This way, after 3 re-iterations, the tube contour is converged, and the pressure distributions of experiment and computations match very precisely. Figure 9 shows the resulting pressure distributions, Fig. 10 shows a Mach number contour of the tube with support and SAP.
With the exact tube geometry and boundary conditions from the calibration with the SAP, a computation with the HiReTT model (N44) under cruise conditions (M=0.85, α=1.5) was conducted. It can be seen that the pressure distributions from experiment and computation match very well (Fig. 11). It is reasonably safe to assume that a comparison with a farfield computation of the same model under cruise conditions now yields the support influence, with no significant influence from simplifications in the physical modelling.
The difference between computation with support and experiment lies in the order of magnitude of the support influence itself. Taking into account that the computation was done with fully turbulent boundary layers and using a rather simple turbulence model (Spalart-Allmaras with Edwards modifications), this is a satisfactory result. Since it has been found experimentally ([10]) that wind tunnel corrections are almost completely Reynolds number independent, these remaining numerical errors can be accepted.
3.2.3 Wing deformation
The computations with model were conducted using a newly reconstructed wing shape that was obtained by fluid-structure coupling and later compared and found to agree with deformation measurements of the actual N44 model in the wind tunnel under cruise conditions. It was found that the N44 wing geometry that had been available at the start of the project (“1g”) differed from the correct geometry by about 20 mm bend and 0.2° twist at the wing tips. This would have led to small but significant differences in lift distributions between computation and experiment. Also, since the wing geometry is depending on the load, it can be concluded that it is not useful to conduct simulations of wind tunnel experiments with significant wing deformation without taking deformation into account in the computation. It is planned to conduct most future computations of off-design points (for which no deformed geometry is available) using fluid-structure coupling.
4.0 CONCLUSION
A contribution to investigations in the context of uncertainties of modern CFD methods is presented in this paper by considering the numerical simulation and analyses of wind tunnel experiments which include all geometrical and aerodynamic conditions, a so-called numerical wind tunnel. The computational method developed is based on investigations within the DLR project ForMEx outlined for the wind tunnels DNW-NWB and ETW. The presented results do not only show the improvement potential of today’s wind tunnel testing techniques and the improved understanding of the flow physics but also represent an excellent data base to study uncertainty effects of the used CFD approaches.
CFD Validation by Wind Tunnel Measurements: Uncertainty Assessment by Numerical Simulation of Complete Wind Tunnel Flows
RTO-MP-AVT-147 22 - 7
UNCLASSIFIED/UNLIMITED
UNCLASSIFIED/UNLIMITED
For the low speed wind tunnel DNW-NWB results of a numerical simulation using a numerical wind tunnel have been shown. To achieve these the test section including the nozzle together with the ALVAST high lift configuration as half model and the ALVAST full span model in free flight have been simulated in order to investigate the half model (peniche) effect as well as the wind tunnel influence and based on this results the uncertainties of the widely used classical wind tunnel corrections.
From this investigation the following statements can be outlined: The impact of wind tunnel on the flow around a half model can be divided in a peniche and a wind tunnel influence. The local angle of attack and the flow velocity is increased mainly in the inboard part of the wing due to the peniche influence. The wind tunnel wall effect also has an influence on the inboard wing, but with a smaller value. Therefore the wind tunnel influence can be mainly found at outboard wing parts whereas its effect is present over the complete cross section. When reducing the angle of attack of the model the corresponding effects also decrease. Further on it was found in the linear range of the lift curve the classical wind tunnel correction is in good agreement with the numerical results for the integral values of the flow. Span wise variations (e.g. peniche influence) however cannot be corrected in this way. Therefore the numerical wind tunnel correction is well suited, not only for correction, although for the assessment of uncertainties of the CFD results and the measurement itself.
For the investigation of the ETW test section a simplified CFD model has been developed which represents the ETW model support inside a guided far field. With a typical model mounted on the support, a CFD grid contains roughly six million nodes and is thus suited for relatively fast computations of wind tunnel test cases. The model that was developed for the ETW support allows comparisons between wind tunnel measurements and computational results. Also, sting influences can be assessed qualitatively and quantitatively. The numerical and the experimental results gained by the present investigation will serve as an excellent database within the important topics dealing with uncertainty effects in CFD.
[1] Wichmann, G. The objectives of DLR's ForMEx Project. European Wind tunnel Association (EWA), Initial Joint Workshop, ONERA Toulouse, October 18-20, 2004.
[2] Wichmann, G. CFD Supported Wind Tunnel Testing – First Results of DLR Project ForMEx EWA, European Windtunnel Association, 2nd Joint Workshop, Farnborough, March 20 – 21, 2006.
[3] Kroll, N.; Rossow, C.-C.; Schwamborn, D.; Becker, K.; Heller, G. MEGAFLOW - A Numerical Flow Simulation Tool for Transport Aircraft Design. 23rd ICAS Congress, Toronto, ICAS 2002, 1.5-10.5, 2002.
[4] Kiock, R. The ALVAST Model of DLR. DLR IB 129-96/22, 1996.
[5] Melber-Wilkending, S. Numerische Untersuchungen zur Aerodynamik von Hochauftriebssystemen an Transportflugzeugen unter Berücksichtigung der Windkanalsimulation. DLR FV, to be published.
[6] Walter, U.: ETW user guide, rev. A. ETW/D/95001/A, January 2004; European Transonic Windtunnel (ETW) GmbH, Köln.
[7] AGARD: Wind Tunnel Wall Corrections, Chapter 5.3, AGARD-AG-336; October 1998.
[8] Gazkov, S.A.; Gorbushin, A; Ivanov, A.; Semenov, A.; Vlasenko, V.; Quest, J.: Numerical and Experimental Investigations of Slot Flow with Respect to Wind Tunnel Wall Interference Assessment; AIAA-2004-2308, 2004.
[9] Quest, J.: Tunnel Corrections in ETW. Technical Mem. ETW/TM/99024, March 1999; ETW.
[10] Heidebrecht, A.: A Numeric Far Field Model for Support Interference Studies in a Slotted Wall Wind Tunnel (ETW), to be published in Proceedings of the Institution of Mechanical Engineers, Part G, Journal of Aerospace Engineering, 2006.
CFD Validation by Wind Tunnel Measurements: Uncertainty Assessment by Numerical Simulation of Complete Wind Tunnel Flows
22 - 8 RTO-MP-AVT-147
UNCLASSIFIED/UNLIMITED
UNCLASSIFIED/UNLIMITED
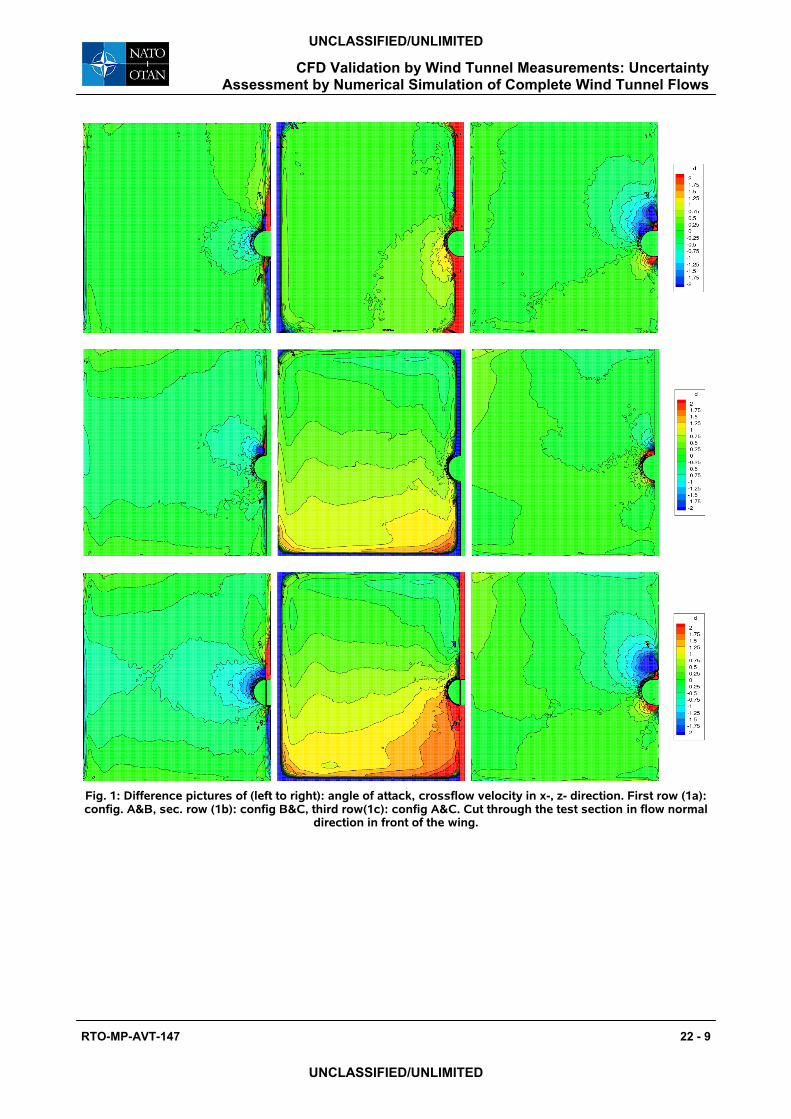
Fig. 1: Difference pictures of (left to right): angle of attack, crossflow velocity in x-, z- direction. First row (1a): config. A&B, sec. row (1b): config B&C, third row(1c): config A&C. Cut through the test section in flow normal
direction in front of the wing.
CFD Validation by Wind Tunnel Measurements: Uncertainty Assessment by Numerical Simulation of Complete Wind Tunnel Flows
RTO-MP-AVT-147 22 - 9
UNCLASSIFIED/UNLIMITED
UNCLASSIFIED/UNLIMITED
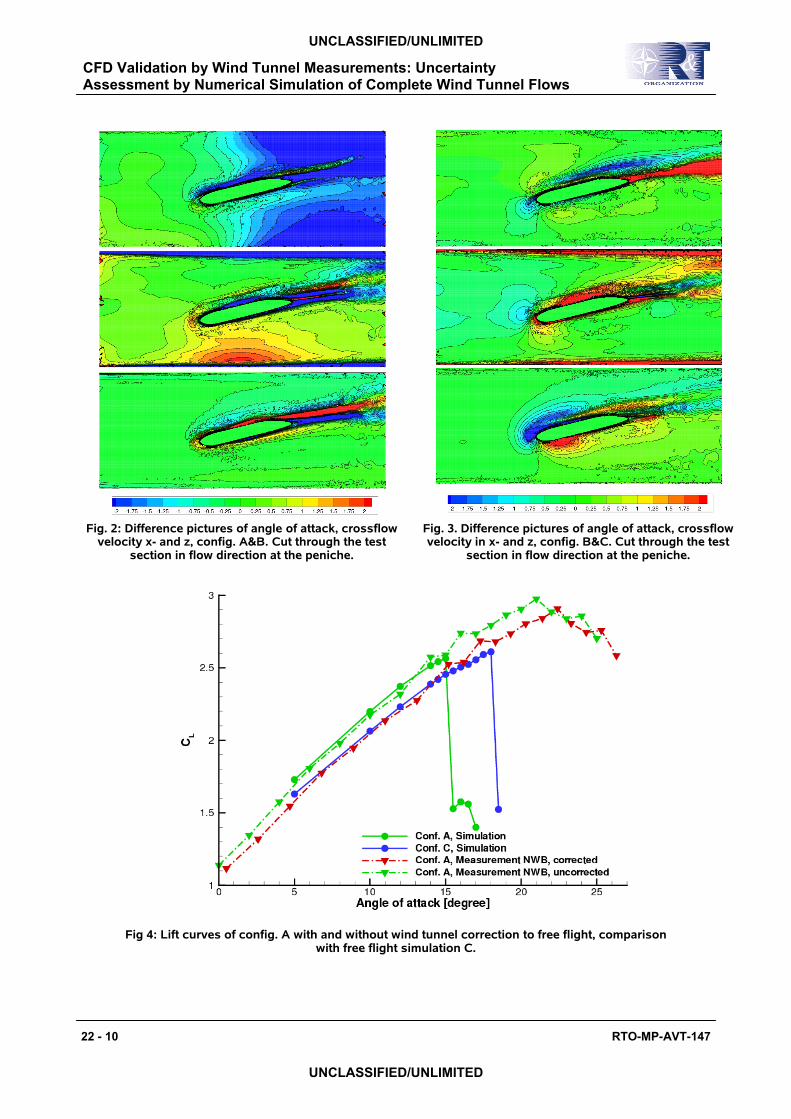
Fig. 2: Difference pictures of angle of attack, crossflow
velocity x- and z, config. A&B. Cut through the test section in flow direction at the peniche.
Fig. 3. Difference pictures of angle of attack, crossflow velocity in x- and z, config. B&C. Cut through the test
section in flow direction at the peniche.
Fig 4: Lift curves of config. A with and without wind tunnel correction to free flight, comparison with free flight simulation C.
CFD Validation by Wind Tunnel Measurements: Uncertainty Assessment by Numerical Simulation of Complete Wind Tunnel Flows
22 - 10 RTO-MP-AVT-147
UNCLASSIFIED/UNLIMITED
UNCLASSIFIED/UNLIMITED
Fig 5: Lift curves of config. A&B with and without wind tunnel correction to free flight, comparison with free flight simulation C.
Fig. 6: Schematic side view of the ETW. The upper and lower walls of the test section are slotted, the whole volume inside the outer wall acts as a plenum chamber. The second throat behind the
sector in the symmetry plane of the test section. (Source: ETW)
Fig. 7: The wetted parts of model support with Short Axial Probe (SAP), mounted on the straight sting, plus second throat
CFD Validation by Wind Tunnel Measurements: Uncertainty Assessment by Numerical Simulation of Complete Wind Tunnel Flows
RTO-MP-AVT-147 22 - 11
UNCLASSIFIED/UNLIMITED
UNCLASSIFIED/UNLIMITED
measured computed geometry
SAP at M=0.85, computation with far field
Fig. 8: Comparison of computed versus measured pressure data for M=0.85 along the SAP and the conical part of the straight sting.
cp, guided far field cp, measured SAP geometry cp, far field
SAP at M=0.85, pressure gradient corrected
Fig. 9: Comparison of computed versus measured pressure data along the SAP with guided far field. For comparison, the uncorrected pressure distribution is included.
CFD Validation by Wind Tunnel Measurements: Uncertainty Assessment by Numerical Simulation of Complete Wind Tunnel Flows
22 - 12 RTO-MP-AVT-147
UNCLASSIFIED/UNLIMITED
UNCLASSIFIED/UNLIMITED
Euler wall
Exit
Pexit
Inlet
PT, ρT
Fig. 10: Pressure distribution in symmetry plane of guided far field computation. Constant pressure gradient is established well before support geometry
Wing cut at η=.61
Wing cut at η=.61
measured with support free flight
Fig. 11: Comparison of wing pressure distributions at the cruise condition (M=.85, α=1.5°). The computation
with support in a guided far field matches well with measurement data.
CFD Validation by Wind Tunnel Measurements: Uncertainty Assessment by Numerical Simulation of Complete Wind Tunnel Flows
RTO-MP-AVT-147 22 - 13
UNCLASSIFIED/UNLIMITED
UNCLASSIFIED/UNLIMITED

CFD Validation by Wind Tunnel Measurements: Uncertainty Assessment by Numerical Simulation of Complete Wind Tunnel Flows
22 - 14 RTO-MP-AVT-147
UNCLASSIFIED/UNLIMITED
UNCLASSIFIED/UNLIMITED
Paper No. 22 Discusser’s Name: A. Cenko Question: How do you know that the Mach number in the test section was M = 0.85, not 0.855 or 0.845? Author’s Reply: Computation and experiment are correlated via the calibration measurements. For each test reference Mach number, there is a corresponding static pressure on the calibration probe and a set of boundary conditions that deliver the same flow state in the computation. The flow state on the calibration probe at x = 0 is taken as reference Mach number. This is also the Mach number correction procedure at the ETW and yields consistent results when comparing with freestream computations. Discusser’s Name: M. Hemsch Question: In your presentation you made no reference to previous work (e.g. two AGARD reports) for slotted transonic wind tunnels. Are you aware of that work and, if so, why don’t you refer to it, if only to say why it is inadequate? Author’s Reply: The paper will be amended with a reference to the latest AGARD report on the topic. The author is aware of the methods described therein, but thinks they are not suited for this particular case for two reasons: (1) The wall pressure method requires one experiment for each computation and (2) The method cannot correctly predict preserved momentum of the slots in the ETW. The author thanks for the advice to include a reference to previous work. [The wall-pressure method uses measured wall pressures in a slotted wind tunnel. Then uses them as a boundary condition for the computation.]