Embed Size (px)
Citation preview

Drag Prediction Workshop����������������� �������
$PHULFDQ�,QVWLWXWH�RI�$HURQDXWLFV�DQG�$VWURQDXWLFV
AIAA Workshop PaperAn Industry Application of CFL3D as a Transonic Drag Prediction Tool
Robert NarducciThe Boeing CompanyLong Beach, CA 90807

2American Institute of Aeronautics and Astronautics
Drag Prediction Workshop
$,$$�'UDJ�3UHGLFWLRQ�:RUNVKRS
$Q�,QGXVWU\�$SSOLFDWLRQ�RI &)/�' DV�D�7UDQVRQLF�'UDJ�3UHGLFWLRQ�7RRO
5REHUW�3��1DUGXFFL
3KDQWRP�:RUNV��7KH�%RHLQJ�&RPSDQ\�����(� :DUGORZ 5RDG��/RQJ�%HDFK�&DOLIRUQLD�������
&RS\ULJKW��������E\�7KH�%RHLQJ�&RPSDQ\��3XEOLVKHG�E\�WKH�$PHULFDQ�,QVWLWXWH�RI�$HURQDXWLFV�DQG�$VWURQDXWLFV� ,QF���ZLWK�SHUPLVVLRQ�

3American Institute of Aeronautics and Astronautics
Drag Prediction Workshop
2XWOLQH
� ,QWURGXFWLRQ
� &)' SURFHVV�IRU�GUDJ�SUHGLFWLRQ
� &)/�'�VROXWLRQ�DW�0DFK�������&/ ���
� 0DFK������GUDJ�SRODU
� 7UDQVRQLF�GUDJ�ULVH�DW�&/ ���
� &RQFOXVLRQV

4American Institute of Aeronautics and Astronautics
Drag Prediction Workshop
,QWURGXFWLRQ
� $Q�LQGXVWU\�SHUVSHFWLYH�IRU�FRPSXWLQJ�GUDJ�RI�D�ZLQG�WXQQHO�PRGHO�XVLQJ�&)'± &)'�DFFXUDF\�YV��FRPSXWHU�UHVRXUFHV�YV��SURJUDP�VFKHGXOHV
� 6WDWH�RI�HVWLPDWLQJ�GUDJ SRODUV DQG�WKH�GUDJ�ULVH�WKURXJK�WKH�WUDQVRQLF�UHJLRQ
The science of Computational Fluid Dynamics (CFD) is maturing and the development of computer processors and architectures has allowed for Navier-Stokes analyses to be routinely used, at least in some capacity, for aerodynamic assessments of aircraft. Typical CFD results complement wind-tunnel data and lower-order analytical method estimates in the full-scale aerodynamic performance and drag build-up process. The goal of this work, in conjunction with the Drag Prediction Workshop, is to assess the aspect of aircraft drag prediction related to the ability of CFD to predict wind-tunnel measurements.
This work offers a perspective from an industry point of view. In an industrial setting, aircraft programs desire the highest fidelity aerodynamic predictions subject to given cost and schedule constraints. The assessment ofCFD drag prediction must not only consider the ability to predict drag, but also the ability to predict it in a timely fashion and within budget. Accurate predictions completed beyond the scope of an aircraft program are useless.
The subject of the assessment is the DLR-F4 wing/body geometry. TheDLR-F4 was developed as a research configuration for a modern day transport-type aircraft. Wind-tunnel data, recorded for the purposes of CFD code validation, were obtained at three European facilities including the High-Speed Wind Tunnel of the National Aerospace Laboratory, the ONERA S2MA wind tunnel, and the 8ft x 8ft Pressurized Subsonic/Supersonic Wind Tunnel of the Defense Research Agency. Details of the geometry and the wind-tunnel tests can be found in AGARD Report No. 303.1

5American Institute of Aeronautics and Astronautics
Drag Prediction Workshop
The ability to compute Navier-Stokes solutions goes beyond exercising aCFD code. It entails executing a process that includes grid generation, input file preparation, solution calculation, and solution post processing. This paper begins by defining the process used by the High-Speed Aerodynamics Group at the Phantom Works Division of The Boeing Company in Long Beach, CA. This is followed by details of the execution of CFL3Dv6. A presentation of the results follows, including the Mach 0.75 drag polar and transonic drag rise at CL
= 0.5. A summary of findings concludes the report.
6American Institute of Aeronautics and Astronautics
Drag Prediction Workshop
)HHGEDFN�ORRS�WR�LPSURYH�VROXWLRQ�TXDOLW\
)HHGEDFN�ORRS�WR�FRUUHFW�LVVXHV�ZLWK�FRPPXQLFDWLRQ�WKURXJK�
SDWFKHG�LQWHUIDFHV
&RPSXWHU�SODWIRUPV�LQFOXGH�6HYHUDO 6*, �+3�ZRUNVWDWLRQV
��1RGH�2ULJLQ�����3&�&OXVWHU
7\SLFDO�JULGV�FRQWDLQ�WKUHH�OHYHOPXOWLJULG FDSDELOLW\��JULG�OLQHV�RUWKRJRQDO�WR�WKH�VXUIDFH��DQG�VXUIDFH�FOXVWHULQJ�WR�DFKLHYH�
\����
&)'�3URFHVV�RI�WKH�+LJK�6SHHG�$HURG\QDPLFV�*URXS��3KDQWRP�:RUNV��/RQJ�%HDFK
&)/�'Y�
3RVW�3URFHVVLQJ
*ULG�*HQHUDWLRQ
&)'�,QSXW�)LOHV
7HFSORW)LHOGYLHZ&)3RVW
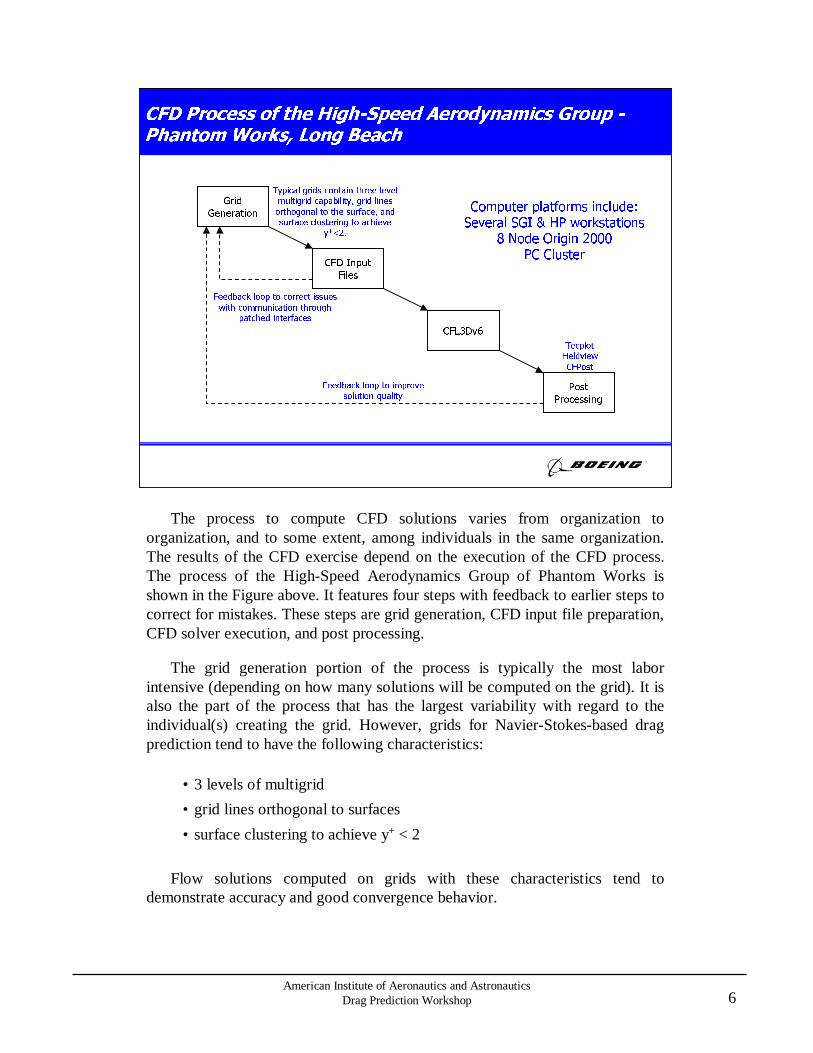
The process to compute CFD solutions varies from organization to organization, and to some extent, among individuals in the same organization. The results of the CFD exercise depend on the execution of the CFD process. The process of the High-Speed Aerodynamics Group of Phantom Works is shown in the Figure above. It features four steps with feedback to earlier steps to correct for mistakes. These steps are grid generation, CFD input file preparation,CFD solver execution, and post processing.
The grid generation portion of the process is typically the most labor intensive (depending on how many solutions will be computed on the grid). It is also the part of the process that has the largest variability with regard to the individual(s) creating the grid. However, grids for Navier-Stokes-based drag prediction tend to have the following characteristics:
• 3 levels of multigrid
• grid lines orthogonal to surfaces
• surface clustering to achieve y+ < 2
Flow solutions computed on grids with these characteristics tend to demonstrate accuracy and good convergence behavior.

7American Institute of Aeronautics and Astronautics
Drag Prediction Workshop
CFD input file generation can be another time consuming aspect of the CFDprocess depending on the complexity of the problem. It is also the portion of the process where the most errors are introduced. Today, depending on the grid generation tool, time and errors are minimized as software can automatically generate these files. Often a feedback loop is exercised during the input file creation as deficiencies in the grid are sometimes discovered. A common example occurs when the calculation for interpolation coefficients across patched block boundaries fails because of highly curved surfaces. In this exercise, the workshop committee provided the grid and input files. The grid was left unmodified, however the input files were adjusted to reflect desired options for the flow solver.
The next step in the process is the execution of the flow solver, CFL3Dv6. The High-Speed Aerodynamics Group has access to several computer platforms that are shared with other groups. These systems include several SGI and HP workstations, an 8 node SGI Origin 2000, and a newly acquired PC cluster. Results presented here were computed on 3 nodes of the SGI Origin 2000.
The flow solver iterates on the solution until certain convergence criteria are met. The convergence criteria may depend on the conditions of the flow solution, but typically for steady-state calculations it is desired to reduce the L2
norm of the residual by 3 or 4 orders and observe force and moment coefficient convergence to at least the third significant digit.
The final step of the CFD process is the post processing. Boeing has access to a variety of tools that ease this process including Tecplot, Fieldview, and in-house developed codes like CFPost. During this step, unanticipated flow features or grid defects may necessitate feedback to the grid generation step.

8American Institute of Aeronautics and Astronautics
Drag Prediction Workshop
&RPSXWDWLRQDO�*ULG
� ���SRLQW�PDWFKHG�EORFNV
� ����0�SRLQWV
� �����.�VXUIDFH�SRLQWV
� ��OHYHO�PXOWLJULG
The computational grid used in the exercise was provided by the workshop committee and left unmodified. The point-matched multiblock grid contained 49 blocks and nearly 3.4 million points. The surface of the configuration was discretized by 23,500 points. The dimensions of each block allowed for two coarser grids (by removing every-other point in each direction) for mesh sequencing and multigrid. The grid featured surface clustering to resolve the boundary layer profile.

9American Institute of Aeronautics and Astronautics
Drag Prediction Workshop
7KLV�&)/�'�6ROXWLRQ
� 6ROXWLRQV�DUH�FRPSXWHG�RQ�WKH�'UDJ�3UHGLFWLRQ�:RUNVKRS�VWDQGDUG�PXOWLEORFN JULG
� 5RH¶V�IOX[�GLIIHUHQFH�VSOLWWLQJ���UG�RUGHU��XSZLQG�ELDVHG�ZLWK�VPRRWK�OLPLWLQJ�
� 0HQWHU¶V�N�ω 667�WXUEXOHQFH�PRGHO��IXOO\�WXUEXOHQW��VROYH�WR�WKH�ZDOO�
� ��OHYHOV�RI�PHVK�VHTXHQFLQJ�IRU�LQLWLDO�VROXWLRQ��VXEVHTXHQW�VROXWLRQV�EHJDQ�IURP�D�UHVWDUW�RI�FORVHVW�FRQYHUJHG�VROXWLRQ
� ��OHYHOV�RI�PXOWLJULG��:�F\FOH�
Solutions presented here were computed using NASA Langley’s CFL3Dv62. CFL3Dv6 is a structured, multigrid, upwind solver that can solve either the Euler or Navier-Stokes equations. The code has been parallelized by NASA with MPI protocol for efficient computation on parallel computer systems.
Given a grid and a flow solver like CFL3Dv6, solutions can vary among the code operators depending on flow solver options. Code performance can also vary. In this application of CFL3Dv6, solutions were computed exclusively on the drag prediction workshop standard, multiblock, point-matched grid. The Roe scheme with 3rd order upwinding was used to difference the fluxes. A smoothlimiter was used to reduce the numerical oscillations in regions of steep gradients. The Menter’s k-ω SST turbulence model was used to close theNavier-Stokes equations of state. Convergence of the initial solution was accelerated with mesh sequencing and w-cycle multigrid. Subsequent solutions were restarted from a related solution and also used multigrid.

10American Institute of Aeronautics and Astronautics
Drag Prediction Workshop
6ROXWLRQ�&RQYHUJHQFH�DW�0DFK�������α ������°��5H �[���
Iterations0 1000 2000 3000 4000 5000 6000
-4.0
-3.0
-2.0
-1.0
0.0
1.0
0.30
0.35
0.40
0.45
0.50
0.55
0.015
0.020
0.025
0.030
0.035
0.040
-0.25
-0.20
-0.15
-0.10
-0.05
0.00
Log(Residual)
LiftCoefficient
DragCoefficient
Pitching Mom.Coefficient
The figure shown above documents the convergence characteristics of CFL3Dv6 for this problem with the log of the residual, lift, drag, and pitching moment. The conditions for the convergence is Mach 0.75 and an angle-of-attack of –0.241, though this convergence was characteristic of all the solutions run. The 3 levels of mesh sequencing are shown: 3000 coarse-grid iterations, 1500 medium level iterations, and 1000 fine grid iterations. A CFL number of 0.5 started the solution, with a ramp over the first 1000 coarse grid iterations to aCFL = 3.0. A CFL number of 3.0 was used for the remainder of the solution iterations.

11American Institute of Aeronautics and Astronautics
Drag Prediction Workshop
0.020
0.024
0.028
0.032
0.036
0.040
0.044
0.048
0.052
0.0 0.2 0.4 0.6 0.8 1.0 1.2
Dra
g C
oeff
icie
nt
PN )1(
0.020
0.024
0.028
0.032
0.036
0.040
0.044
0.048
0.052
0.0 0.2 0.4 0.6 0.8 1.0 1.2
Dra
g C
oeff
icie
nt
PN )1(
&)/�' VROXWLRQ�DW�0DFK�������&/ �����5H �[���
���
���
���
����
����
����
����
����
�����°
������°
$QJOH�RI�$WWDFN�GHJUHHV�
���
���
���
���
���
��
�
���
'UDJ�&RHIILFLHQW�FRXQWV�
���
'UDJ�3UHGLFWLRQ([SHULPHQW
&)/�'Y�
,QFUHDVLQJ�*ULG�'HQVLW\
CFL3Dv6 results and experimental data are compared for Mach 0.75 flow over the DLR-F4 in the graphics above. The CFD simulation was run to match CL = 0.5 and the wind-tunnel data was averaged across 3 tests and interpolated to determine the drag at CL = 0.5. The corresponding angles-of-attack and the total drag values are plotted in the bar charts. CFL3Dv6 predicts the lift condition at approximately 0.4° lower angle-of-attack than the test condition. At this lift condition, CFL3Dv6 predicts the wing/body drag to be 12 counts lower than the experimentally determined value.
The CFD simulation assumed a fully turbulent flow unlike the experimental test where a certain amount of the flow was known to be laminar. The fully turbulent flow conditions of the CFD run would tend to inflate the drag value and correcting for the fully turbulent boundary layer would further separate CFDand experiment.
The line plot shows the convergence of drag with respect to grid density. In the plot, N represents the number of grid points in one computational direction normalized to the coarsest grid; P is the anticipated order of the solution. Here, the solution is third order except near the boundaries and in regions of steep gradients where limiters are used. The figure implies that the grid has sufficient density to resolve the drag prediction and that further grid refinement would not change the predicted value significantly.

12American Institute of Aeronautics and Astronautics
Drag Prediction Workshop
&)/�' VROXWLRQ�DW�0DFK�������&/ �����5H �[���
*ULG�&RQYHUJHQFH�IRU�'UDJ
0.012
0.016
0.020
0.024
0.028
0.032
0.036
0.040
0.044
0.0 0.2 0.4 0.6 0.8 1.0 1.2
Pre
ssur
e D
rag
Co
effi
cien
t
PN )1(
0.012
0.016
0.020
0.024
0.028
0.032
0.036
0.040
0.044
0.0 0.2 0.4 0.6 0.8 1.0 1.2
Pre
ssur
e D
rag
Co
effi
cien
t
PN )1(
0.000
0.004
0.008
0.012
0.016
0.020
0.024
0.028
0.032
0.0 0.2 0.4 0.6 0.8 1.0 1.2
Vis
cou
s D
rag
Co
effic
ient
PN )1(
0.000
0.004
0.008
0.012
0.016
0.020
0.024
0.028
0.032
0.0 0.2 0.4 0.6 0.8 1.0 1.2
Vis
cou
s D
rag
Co
effic
ient
PN )1(
The grid convergence shown previously using drag showed that the grid had sufficient resolution. However, similar plots drawn with pressure and viscous drag components show opposing trends that tend to cancel each other when the total drag is used to document grid convergence. As a figure of merit, the pressure drag shows a tendency for the drag to decrease with mesh refinement. The difference between the medium and fine grid is about 40 counts. The viscous drag, shows the opposite trend with an increase of about 15 counts from the medium to the fine grid. Previous experience (undocumented) has been that the integrated viscous drag computed from computations using the k-ωturbulence model has been sensitive to the spacing at the wall. The medium and fine grid solutions have a significant difference in clustering near the wall and so this trend is expected. However, it is the pressure drag, in this case, that is more sensitive to the grid density.

13American Institute of Aeronautics and Astronautics
Drag Prediction Workshop
&)/�' VROXWLRQ�DW�0DFK�������&/ �����5H �[���
*ULG�&RQYHUJHQFH�IRU�/LIW�DQG�3LWFKLQJ�0RPHQW
0.44
0.46
0.48
0.50
0.52
0.54
0.0 0.2 0.4 0.6 0.8 1.0 1.2
Lift
Co
effi
cien
t
PN )1(
0.44
0.46
0.48
0.50
0.52
0.54
0.0 0.2 0.4 0.6 0.8 1.0 1.2
Lift
Co
effi
cien
t
PN )1(
-0.164
-0.162
-0.160
-0.158
-0.156
-0.154
0.0 0.2 0.4 0.6 0.8 1.0 1.2
Pit
chin
g M
om
ent
Coe
ffic
ien
t
PN )1(
-0.164
-0.162
-0.160
-0.158
-0.156
-0.154
0.0 0.2 0.4 0.6 0.8 1.0 1.2
Pit
chin
g M
om
ent
Coe
ffic
ien
t
PN )1(
Also shown is the solution convergence with grid density using lift and pitching moment as the figures of merit. The trends suggest that further refinement could alter the predicted force and moment.

14American Institute of Aeronautics and Astronautics
Drag Prediction Workshop
&RPSXWDWLRQDO�5HVRXUFHV
� ��SURFHVVRUV�RQ�D�2ULJLQ�����
� ������0E\WHV�� GRXEOH�SUHFLVLRQ
� 6ROXWLRQ�ZLWK������ILQH�JULG�LWHUDWLRQV�FRPSOHWHG�LQ����KRXUV
0
40
80
120
160
200
240
0.01 0.10 1.00 10.00
1/(Normalized Number of Points)
Tim
e p
er It
erat
ion
(S
econ
ds)
0
40
80
120
160
200
240
0.01 0.10 1.00 10.00
1/(Normalized Number of Points)
Tim
e p
er It
erat
ion
(S
econ
ds)
,QFUHDVLQJ�*ULG�'HQVLW\
The grid refinement analysis suggests that denser grids could alter the predicted forces and moments of CFL3Dv6. The data plotted here suggests that the limit of practical computations have been reached. While computers become increasingly more powerful in terms of the speed and amount of data that they can handle, it can take several years before they are used routinely for production analysis in an industry setting. High-end, massively parallel machines may be unstable and are often reserved for research. Production analysis, such as the case here, is usually done with smaller, older machines. In this case, 3 processors of an 8 node Origin 2000 were available. Average wall clock time for a coarse, medium, and fine grid solution are shown above. A fine grid converged solution, requiring 1000 iterations completed in about 58 hours. A total of 13 solutions are presented in this report, with additional 10 solutions computed to iterate to an intended lift condition. In all nearly 2 months of solid computing was required to generated the results for this report using the available machines at Boeing, Long Beach.
An alternative to achieve a grid converged solution would be to redistribute points. Short of grid adaptive schemes which can be somewhat limited, engineering judgment is needed to modify the grid to remove points from some areas and add them to regions where resolution is needed.

15American Institute of Aeronautics and Astronautics
Drag Prediction Workshop
/LIW�3UHGLFWLRQ�DW�0DFK�������5H �[���
-0.2
0.0
0.2
0.4
0.6
0.8
1.0
-6.00 -4.00 -2.00 0.00 2.00 4.00 6.00
Angle-of-Attack
Lif
t C
oeff
icie
nt
Experiment CFL3D
-0.2
0.0
0.2
0.4
0.6
0.8
1.0
-6.00 -4.00 -2.00 0.00 2.00 4.00 6.00
Angle-of-Attack
Lif
t C
oeff
icie
nt
Experiment CFL3D
At a given angle-of-attack, CFL3Dv6 predicts a greater amount of lift than the experimental data presented in the AGARD report, though the slope of the curve is well predicted. The experimental data shows that the lift curve levels off around CL = 0.75. The CFD simulations also capture this feature though at a slightly lower lift condition. Additionally, The lift curve characteristics of the wind-tunnel data shows a small break in the linearity of the curve near 0.5°angle-of-attack. The Navier-Stokes predictions do not capture this feature.

16American Institute of Aeronautics and Astronautics
Drag Prediction Workshop
'UDJ�3UHGLFWLRQ�DW�0DFK�������5H �[���
-0.2
0.0
0.2
0.4
0.6
0.8
1.0
0.01 0.02 0.03 0.04 0.05 0.06 0.07
Drag Coefficient
Lif
t C
oef
fici
ent
Experiment CFL3D
-0.2
0.0
0.2
0.4
0.6
0.8
1.0
0.01 0.02 0.03 0.04 0.05 0.06 0.07
Drag Coefficient
Lif
t C
oef
fici
ent
Experiment CFL3D
The predicted drag polar from CFL3Dv6 is compared against test data in the figure shown above. Near minimum drag, CFL3Dv6 compares favorably with the test data with a slight under-prediction, though falling within the scatter of the data. At a CL = 0.5, the flow solutions under-predict the lift by nearly 5%. At the higher lift conditions, CFD predictions are greater than the experimental data; near CL = 0.65, the experimental data and the predicted data cross.
There are unavoidable discrepancies and uncertainties associated with the numerical and the wind-tunnel experiments. These are not quantified here, however among these is the boundary layer transition location. The wind-tunnel experiment had some region of laminar flow whereas the CFD simulations were fully turbulent. This effect would tend to inflate the viscous drag of the prediction relative to the experimental data. Additionally, the difference in the boundary layer profile changes the effective shape and thus affects the lift and pressure drag as well.

17American Institute of Aeronautics and Astronautics
Drag Prediction Workshop
3LWFKLQJ�0RPHQW�DW�0DFK�������5H �[���
-0.2
0.0
0.2
0.4
0.6
0.8
1.0
-0.20-0.18-0.16-0.14-0.12-0.10-0.08-0.06-0.04
Pitching Moment Coefficient
Lif
t C
oef
fici
ent
Experiment CFL3D
-0.2
0.0
0.2
0.4
0.6
0.8
1.0
-0.20-0.18-0.16-0.14-0.12-0.10-0.08-0.06-0.04
Pitching Moment Coefficient
Lif
t C
oef
fici
ent
Experiment CFL3D
Good correlation between CFD and wind-tunnel data has historically been difficult to achieve in the pitching moment curve particularly because the moment arm can magnify differences in the pressure distribution or geometry. Here is no exception as the predicted and measured curves differ. The differences even appear among the wind-tunnel data from each facility as a large scatter band is observed in the figure above. Despite the large scatter among the curves, the nose-up pitching moment break near CL = 0.7 is loosely captured.
Pitching moment curves are influenced by, among other things, the level of turbulence in the tunnel, the amount of laminar run on the wing, and aeroelasticeffects. Accounting for aeroelastic deflections in the CFD calculations can close the gap between the numerical and experimentally measured data.3

18American Institute of Aeronautics and Astronautics
Drag Prediction Workshop
3UHVVXUH�'LVWULEXWLRQ�DW�0DFK�������&/ �����5H �[���
X/C
Pre
ssur
eC
oeff
icie
nt,C
P
0.0 0.2 0.4 0.6 0.8 1.0
-1.2
-0.8
-0.4
0.0
0.4
0.8
ExperimentCFD
η ������
Pressure distribution cuts along the wing are shown in the next seven figures at several span stations. Inboard of the wing, the correlation between CFD and wind-tunnel measurements is quite good. The underside of the wing is predicted well, as is the upper surface aft end. The suction peak near the leading edge is missed and the correlation becomes increasingly worse as we go outboard. This can have a large effect on integrated quantities like lift, drag, and pitching moment. The fact that CFD predicted more nose-down pitching moment suggests that at a given lift condition, CFD is more aft loaded. These pressure distribution plots support this theory. To better capture the suction peak may require tighter grid spacing on the surface of the leading edge.
At η = 0.331, CFL3Dv6 and experiment agree reasonably well with regard to the shock placement, however, the numerical simulation shows much more smearing of the shock. As the correlation plots move outboard, the simulation tends to predict the shock placement in front of the measurement and, in general, predicts a weaker shock.

19American Institute of Aeronautics and Astronautics
Drag Prediction Workshop
3UHVVXUH�'LVWULEXWLRQ�DW�0DFK�������&/ �����5H �[���
X/C
Pre
ssur
eC
oef
ficie
nt,
CP
0.0 0.2 0.4 0.6 0.8 1.0
-1.2
-0.8
-0.4
0.0
0.4
0.8
ExperimentCFD
η ������

20American Institute of Aeronautics and Astronautics
Drag Prediction Workshop
3UHVVXUH�'LVWULEXWLRQ�DW�0DFK�������&/ �����5H �[���
X/C
Pre
ssur
eC
oef
ficie
nt,
CP
0.0 0.2 0.4 0.6 0.8 1.0
-1.2
-0.8
-0.4
0.0
0.4
0.8
ExperimentCFD
η ������

21American Institute of Aeronautics and Astronautics
Drag Prediction Workshop
3UHVVXUH�'LVWULEXWLRQ�DW�0DFK�������&/ �����5H �[���
X/C
Pre
ssur
eC
oeff
icie
nt,C
P
0.0 0.2 0.4 0.6 0.8 1.0
-1.2
-0.8
-0.4
0.0
0.4
0.8
ExperimentCFD
η ������

22American Institute of Aeronautics and Astronautics
Drag Prediction Workshop
3UHVVXUH�'LVWULEXWLRQ�DW�0DFK�������&/ �����5H �[���
X/C
Pre
ssur
eC
oeff
icie
nt,C
P
0.0 0.2 0.4 0.6 0.8 1.0
-1.2
-0.8
-0.4
0.0
0.4
0.8
ExperimentCFD
η ������

23American Institute of Aeronautics and Astronautics
Drag Prediction Workshop
3UHVVXUH�'LVWULEXWLRQ�DW�0DFK�������&/ �����5H �[���
X/C
Pre
ssur
eC
oeff
icie
nt,C
P
0.0 0.2 0.4 0.6 0.8 1.0
-1.2
-0.8
-0.4
0.0
0.4
0.8
ExperimentCFD
η ������

24American Institute of Aeronautics and Astronautics
Drag Prediction Workshop
3UHVVXUH�'LVWULEXWLRQ�DW�0DFK�������&/ �����5H �[���
X/C
Pre
ssur
eC
oeff
icie
nt,C
P
0.0 0.2 0.4 0.6 0.8 1.0
-1.2
-0.8
-0.4
0.0
0.4
0.8
ExperimentCFD
η ������

25American Institute of Aeronautics and Astronautics
Drag Prediction Workshop
3UHVVXUH�&RQWRXUV�DQG�6XUIDFH�6WUHDPOLQHV DW�0DFK�������&
/ �����5H �[���
X Y
Z
cp0.880.630.380.13
-0.12-0.37-0.62-0.87-1.12
The next two figures show pressure contours and streamlines on the wing. The color bands show the shock on the upper surface of the wing as the colors change from blue to green (Cp* ≈ -0.6). There is a slight outboard turning of the flow near the trailing edge of the outboard panel of the wing though, the relatively straight and parallel streamlines indicate a clean flow field. The streamlines that seem to be going perpendicular to the main stream direction are along the backward facing step of the thick trailing edge of the wing and are not an indication of separation on the wing upper surface. The surface streamlines from the figure above show attached flow, ideal for predicting drag and minimizing turbulence model effects.
Upon closer inspection, very near the wing-fuselage junction, near the trailing edge is a small region of separation. Since the region is small it is not likely to strongly impact the integrated forces and moments.

26American Institute of Aeronautics and Astronautics
Drag Prediction Workshop
3UHVVXUH�&RQWRXUV�DQG�6XUIDFH�6WUHDPOLQHV DW�0DFK�������&
/ �����5H �[���
X Y
Z
cp
0.880.630.380.13
-0.12-0.37-0.62-0.87-1.12

27American Institute of Aeronautics and Astronautics
Drag Prediction Workshop
'UDJ�5LVH�DW�&/ �����5H �[���
-0.80
0.00
0.80
1.60
2.40
3.20
0.50 0.60 0.70 0.80 0.90 1.00 1.10 1.20
Mach Number
An
gle
-of-
Att
ack
Experiment CFL3D
-0.80
0.00
0.80
1.60
2.40
3.20
0.50 0.60 0.70 0.80 0.90 1.00 1.10 1.20
Mach Number
An
gle
-of-
Att
ack
Experiment CFL3D
0.00
0.02
0.04
0.06
0.08
0.10
0.12
0.14
0.50 0.60 0.70 0.80 0.90 1.00 1.10 1.20
Mach Number
Dra
g C
oeff
icie
nt
Experiment CFL3D
0.00
0.02
0.04
0.06
0.08
0.10
0.12
0.14
0.50 0.60 0.70 0.80 0.90 1.00 1.10 1.20
Mach Number
Dra
g C
oeff
icie
nt
Experiment CFL3D
The final calculations shown in this report predict the transonic drag rise at CL = 0.5. The comparison of the results against wind-tunnel data is shown in the figure above. The curve in the foreground shows an encouraging agreement between the two sets of data, though the overlap across the Mach number range is small. Nevertheless, the drag rise curves appear similar in shape between theCFD and the experiment.
The difficulty in computing drag divergence is matching the desired lift condition. Typically with CFL3Dv6, lift is an output, computed as an integration of pressures over the body. In this calculation, several solutions of varying angles-of-attack were computed at each Mach number in the drag divergence curve. Interpolation across the lift curves was used to find the flow incidence angles to produce the desired lift.
An alternate approach would be to interpolate across the Mach Number versus angle-of-attack curve, computed at fixed lift, to find the incidence angle for the desired lift at alternate Mach numbers. This curve, (shown in the background) is nonlinear and linear interpolation is not sufficient to home in on the proper flow incidence angle.
CFL3Dv6 has an option to reverse the angle-of-attack/lift coefficient role as independent/dependent variables. In this way, the desired lift can be input, and CFL3Dv6 will automatically adjust the angle-of-attack during solution computation. This mechanism was not well understood by the author and after a brief trial this mode of operation was abandoned.

28American Institute of Aeronautics and Astronautics
Drag Prediction Workshop
6XPPDU\��&RQFOXVLRQ
� &)/�'Y� SUHGLFWLRQ�VXPPDU\�DW�0DFK������± 'UDJ�LV����FRXQWV������OHVV�WKDQ�H[SHULPHQWDO�PHDVXUHPHQWV�DW�&/ �����EXW�KLJKHU�GUDJ�YDOXHV�DUH�SUHGLFWHG�IRU�&/!�����
± 'UDJ�LV�ZLWKLQ�WKH�VFDWWHU�RI�H[SHULPHQWDO�PHDVXUHPHQWV�IRU�&/����
± /LIW�LV�KLJKHU�DQG�QRVH�GRZQ�SLWFKLQJ�PRPHQW�LV�JUHDWHU�WKDQ�H[SHULPHQWDO�PHDVXUHPHQWV�DW�D�JLYHQ�DQJOH�RI�DWWDFN
� &RPSDULVRQ�RI�WKH�GUDJ�ULVH�EHWZHHQ�&)'�DQG�PHDVXUHPHQWV�LV�HQFRXUDJLQJ��KRZHYHU�GDWD�LV�OLPLWHG
� 6ROXWLRQV�WRRN�DSSUR[LPDWHO\����KRXUV�WR�FRPSXWH�RQ���QRGHV�RI�DQ 6*,2ULJLQ�����
� 3UDFWLFDO�OLPLWV�RI�FRPSXWHU�UHVRXUFHV�DQG�WLPH�ZHUH�UHDFKHG�IRUUHDVRQDEOH�WXUQ�DURXQG
This paper presented results of CFL3Dv6 using the process of the High-Speed Aerodynamics Group of Phantom Works, Long Beach. The subject was transonic force and moment predictions over the DLR-F4 wing-body transport configuration. The drag prediction was shown to be within 5% of the experimentally measured data at Mach 0.75 and CL = 0.5. At lower lift conditions, the CFD predictions were within the scatter of the wind-tunnel data, while the drag was slightly over-predicted at the higher lift conditions.
The slope of the lift curve and the pitch stability were generally predicted well at low angles-of-attack, though curve inflections were missed as was the absolute values. Lift was over-predicted as was the absolute value of the pitching moment. Generally, the leading-edge suction peaks were under-predicted and for a given lift condition, CFD predicted more aft loading. Refinement of the grid around the leading edge could help capture the suction peaks and decrease the gap between experimental and CFD forces and moments.
The structured multiblock grid of 3.4 million points represented the practical limit of computing multiple production-type analyses at Boeing, Long Beach. Each solution took just under 60 hours (wall time) on 3 nodes of an Origin 2000. However, with the addition of a new PC cluster, this limit is expected to increase.

29American Institute of Aeronautics and Astronautics
Drag Prediction Workshop
References:
1.) “A Selection of Experimental Test Cases for the Validation of CFD Codes” AGARD Advisory Report No. 303 Vol II.
2.) Thomas, J.L., Krist, S.L., and Anderson, W.K., "Navier-Stokes Computation of Vortical Flows Over Low Aspect Ratio Wings," AIAA Journal, Vol. 28, February 1990, pp. 205-212.
3.) Kuruvila, G., Hartwich, P.M., and Baker, M.L., "Effect of Aeroelasticity on the Aerodynamic Performance of the TCA," HSR Airframe Technical Review, Los Angles, California, February 9-13, 1998.