Embed Size (px)
Citation preview
Composites Australia and the CRC for Advanced Composite Structures 2014 Australasian Composites Conference Materials for a lighter and smarter world
7 –9 April, 2014 Crowne Plaza Hotel, Newcastle
CFRP manufacturing process chain observation by means of automated thermography
Thomas SCHMIDT1
, Somen DUTTA2
German Aerospace Center, Institute of Structures and Design, Center for Lightweight-Production-Technology (ZLP), Am Technologiezentrum 4, 86159 Augsburg, Germany
Mobile: +49-172-83435701; +49-173-56177422; Fax: +49 8153 -281028 E-mail: [email protected], [email protected]
Abstract
Since the last decade the demand of CFRP parts is rapidly increasing in the aerospace industry. A trend towards large scale and highly integrated parts manufactured by using dry textiles and vacuum assisted infusion processes is visible. One of the drawbacks of such composites so far is the mechanical performance compared to prepreg material. The complexity of the manufacturing process chain requires decent knowledge about the dependencies within each single step. Contactless Lock-In Thermography offers the observation of large scale parts at various stages along the process chain. The approach at DLR Augsburg of a robot based measuring system for industrial applications has been presented in previous papers. With this paper DLR-Center for Lightweight-Production-Technology in Augsburg will give insight into current work and results derived from first experiments. Keywords: carbon fiber reinforced plastics (CFRP), composite process chain, automated Lock-In Thermography

1. Introduction Earlier studies have demonstrated the effectivity of Lock-In Thermography as an ideal measure to perform contactless and thus non-destructive testing along the manufacturing process chain of composite material. At DLR a system had been developed that enables automated Lock-In Thermography even for large scale structures. The system consists of modular components which are the following:
1. Standard Lock-In Thermography device with adaptable automation interface 2. Industrial robot as a manipulator 3. Programmable controller with interchangeable memory as a link in between the
both mentioned above The actual concept had been presented in previous papers [1]. Here, insight will be given by means of a demonstrator object. Figure 1 describes a schematic CFRP (carbon fiber reinforced plastics) manufacturing process and indicates at which step NDT (non-destructive testing) can be conducted by means on Lock-In Thermography.
Figure 1 Schematic CFRP manufacturing process with inline NDT highlighted
2. Testing Scenario In order to investigate the process described above a testing scenario had been worked out which covers the complete process chain including design and manufacturing as well as the inline quality assurance aspects. As a use case an aerospace structure had been selected and modified to accommodate the necessary on the one hand and achievable requirements on the other hand. The choice had therefore been made on the rear pressure bulk head of a typical single aisle aircraft A320. It is a double curved structure which is built in metal so far, trials had been performed to investigate a composite design. From this one were able to use a mold. Consequently a material and manufacturing process choice had to be made. For such a large structure of double curvature and integrated foam core stringer it was quite obvious to investigate a dry textile layup process in a combination of NCFs (Non crimped fabrics) and fabrics with a consecutive infiltration process according to aerospace VAP® (Vacuum assisted process) [1] standards.

Figure 2 Location of rear pressure bulk head in aircraft
Figure 3 Description of use case part and specimen – rear pressure bulk head A320
1.1 Description of specimen For handling reasons the decision had been made to use just a section of the entire part. The section itself had been chosen from a size that was large enough to reflect all necessary features needed for this investigation. As the part is almost spherical and therefore rotational symmetric the sector size had been chosen with an angle of 60° taking symmetry reasons into account. The specimen therefore incorporates monolithic areas with large shear angles in terms of draping as well as sandwich areas in the foam core stringer region with complex draping behavior, see Figure 3.
D~2
.4m
α=60°
monolithic area
sandwich area

1.1.1 Material specification To be as close as possible to aerospace applications, standard aerospace materials had been used. The monolithic areas were built of 2 layers of NCF with a mass per unit area of 563g/m² made out of 6/12k rovings. For suitable draping over the foam core stringer a 2x2 twill of 200g/m² had been applied. The resin (Larit 135®) is a standard epoxy resin with low viscosity at room temperature to allow infusion at ambient temperature. There are several curing agents for this type of resin available. In our case a curing agent had been chosen in order to achieve an appropriate pot life and infusion time window. The foam core for the stringer had been made out of a closed cell PU (polyurethane) material which was easy to apply in the mold. First trials with an infusion at elevated temperature had shown that the foam was not very resistant to withstand the pressure caused by the vacuum process. At room temperature instead the foam showed good stability during the evacuation of the vacuum bag.
1.1.2 Layup The layup chosen for this specimen is a dummy layup in order to achieve necessary requirements and create various features. Figure 4 represents a section cut and displays the material used, order of layup as well as the staggering over the stringer.
Figure 4 Section cut of the schematic layup of specimen
1.2 Prototype of robotic end-effector In previous papers the concept of the robotic end-effector had been presented [2]. So to keep this short just the fundamental features will be highlighted. The end-effector consists of a standard flange that connects towards the robotic hand. The load carrying structure itself had been built from aluminum profiles. The profiles can be adjusted in length and their position can be changed, the end-effector is therefore able to carry up to 3 halogen lamps in a very flexible constellation. Additionally the elevation of the camera can be adjusted.

Figure 5 Robotic end-effector mounted on industrial robot
1.3 Measurement localisation through hand eye calibration In order to achieve precise measurement localization one needs to know where the camera is located at the time of measurement. Although using an industrial robot as a very accurate manipulator it is necessary to have knowledge about the mounting of the camera on the robot flange. In robotics this circumstance is described with the term hand eye calibration. There are various methods available. This reaches from geometric measurement, either tactile or optical, up to virtual simulation based on CAD (computer aided design) data. A common approach is to use the camera itself in order to get the offset values from flange coordinate system to camera coordinate system. Feuerstein [3] gives a great overview on several approaches. A literature study brought up that the Bougetj implementation [4] in combination with the work from ETH Zurich [5] were the most appropriate. The procedure requires a minimum of 10 images taken from a pattern as shown below (Figure 6). Each time the position and orientation of the robot flange is stored. Both had been fed into the given toolbox. The toolbox then analyses the images, does a calibration of
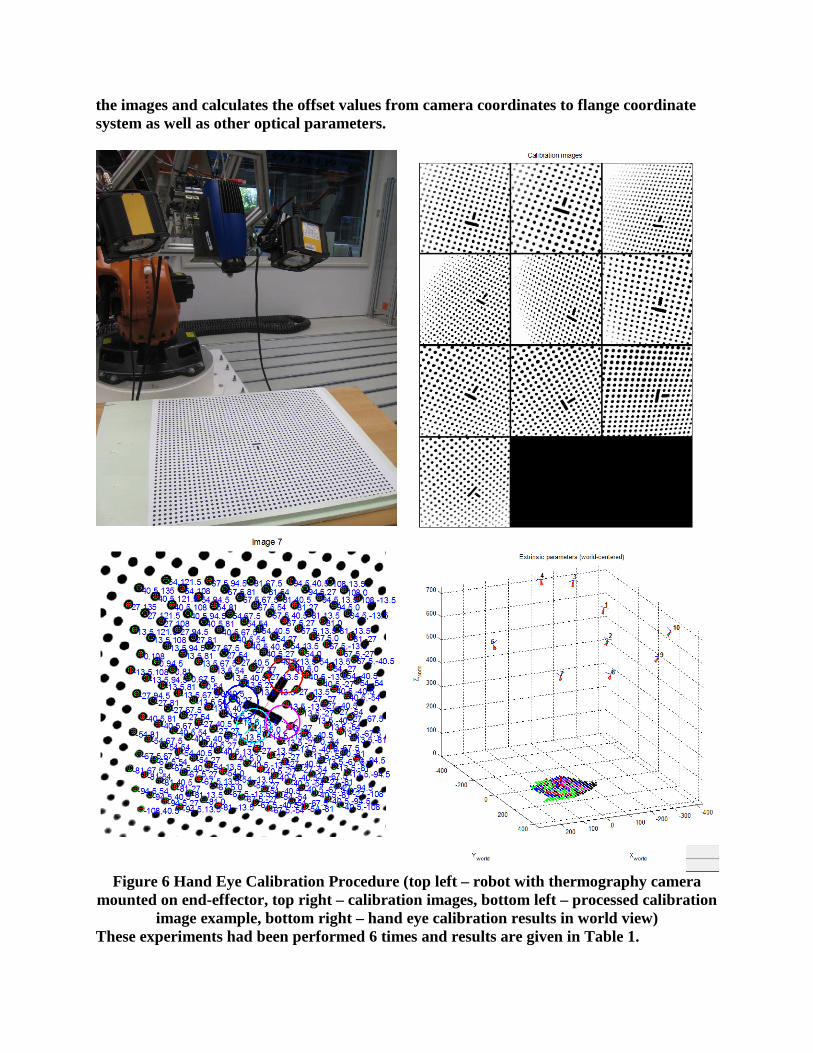
the images and calculates the offset values from camera coordinates to flange coordinate system as well as other optical parameters.
Figure 6 Hand Eye Calibration Procedure (top left – robot with thermography camera
mounted on end-effector, top right – calibration images, bottom left – processed calibration image example, bottom right – hand eye calibration results in world view)
These experiments had been performed 6 times and results are given in Table 1.

Table 1 Results from hand eye calibration
Average Translation [mm]
Standard Deviation [mm]
Average Rotation [°]
Standard Deviation [°]
X 22,547 0,048 A 149,503 0,012 Y 45,932 0,063 B 1,066 0,086 Z 939,489 0,104 C -33,847 0,046
The results give in Table 1 represent the TCP (tool center point) which had later been used, see 1.5.
1.4 Design and manufacturing of large scale specimen For the design of the large scale specimen a digital process chain had been applied, which means based on a digital model of the mold the composite definition had been made using Catia CPD (Composite Part Design). This led to a draping simulation and finally to 2D cut-pieces. A laser projection system, fed with data from CAD, helped to place the cut-pieces in the correct position in the mold as shown in Figure 7. The laser projection system had also been used for the positioning of artificial defects which will be described later on.
Figure 7 Manufacturing of specimen supported by CAD
After the layup the preform had been put in a vacuum bag and resin had been infiltrated by using a VAP® process. The curing at room temperature was followed by a debagging and manual trimming to achieve the final contour.
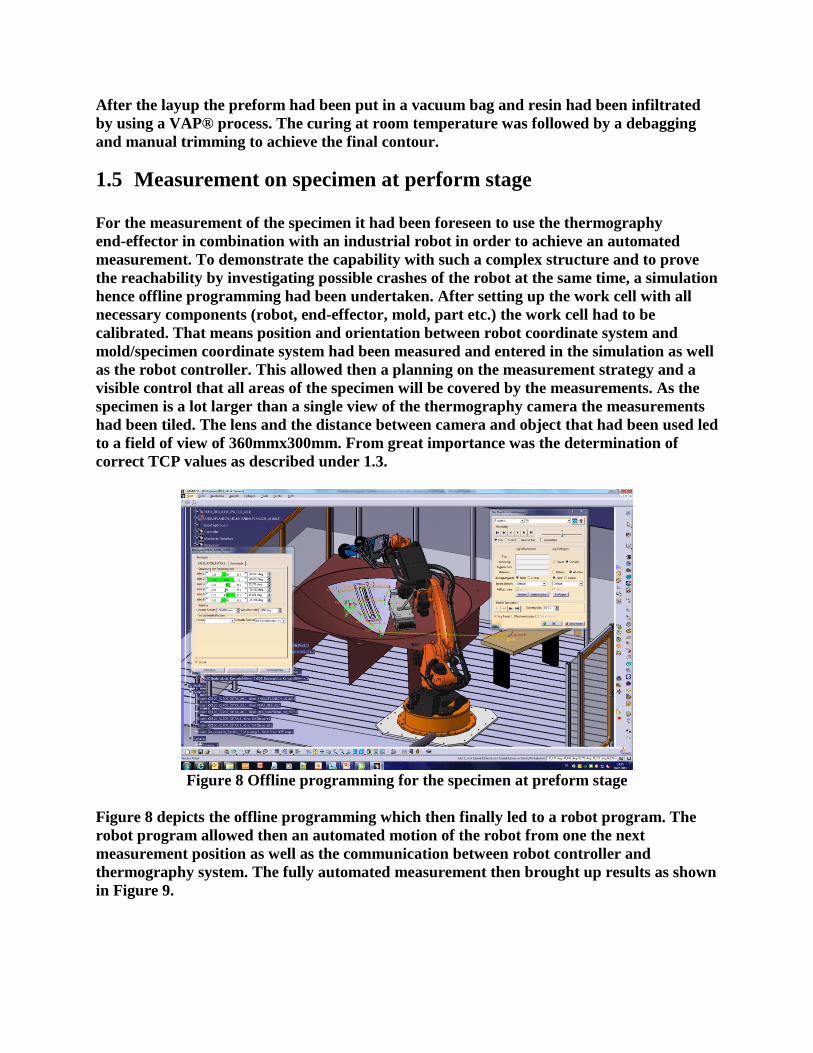
1.5 Measurement on specimen at perform stage For the measurement of the specimen it had been foreseen to use the thermography end-effector in combination with an industrial robot in order to achieve an automated measurement. To demonstrate the capability with such a complex structure and to prove the reachability by investigating possible crashes of the robot at the same time, a simulation hence offline programming had been undertaken. After setting up the work cell with all necessary components (robot, end-effector, mold, part etc.) the work cell had to be calibrated. That means position and orientation between robot coordinate system and mold/specimen coordinate system had been measured and entered in the simulation as well as the robot controller. This allowed then a planning on the measurement strategy and a visible control that all areas of the specimen will be covered by the measurements. As the specimen is a lot larger than a single view of the thermography camera the measurements had been tiled. The lens and the distance between camera and object that had been used led to a field of view of 360mmx300mm. From great importance was the determination of correct TCP values as described under 1.3.
Figure 8 Offline programming for the specimen at preform stage
Figure 8 depicts the offline programming which then finally led to a robot program. The robot program allowed then an automated motion of the robot from one the next measurement position as well as the communication between robot controller and thermography system. The fully automated measurement then brought up results as shown in Figure 9.
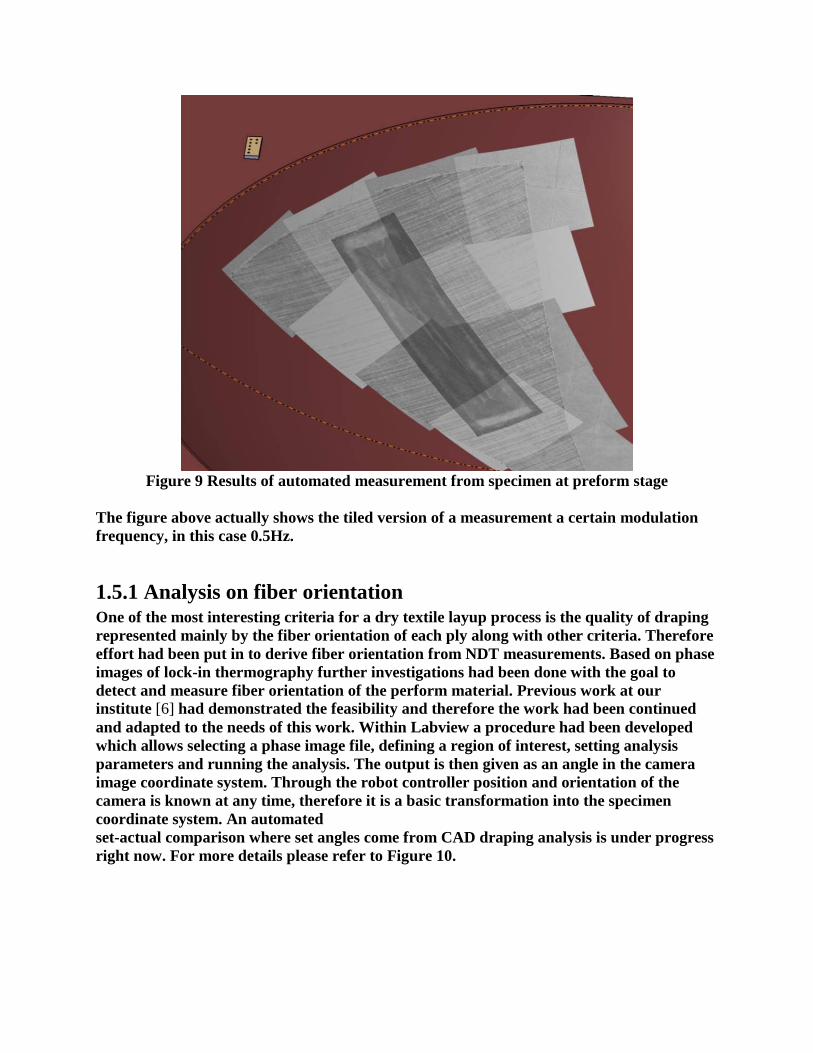
Figure 9 Results of automated measurement from specimen at preform stage
The figure above actually shows the tiled version of a measurement a certain modulation frequency, in this case 0.5Hz.
1.5.1 Analysis on fiber orientation One of the most interesting criteria for a dry textile layup process is the quality of draping represented mainly by the fiber orientation of each ply along with other criteria. Therefore effort had been put in to derive fiber orientation from NDT measurements. Based on phase images of lock-in thermography further investigations had been done with the goal to detect and measure fiber orientation of the perform material. Previous work at our institute [6] had demonstrated the feasibility and therefore the work had been continued and adapted to the needs of this work. Within Labview a procedure had been developed which allows selecting a phase image file, defining a region of interest, setting analysis parameters and running the analysis. The output is then given as an angle in the camera image coordinate system. Through the robot controller position and orientation of the camera is known at any time, therefore it is a basic transformation into the specimen coordinate system. An automated set-actual comparison where set angles come from CAD draping analysis is under progress right now. For more details please refer to Figure 10.

Figure 10 Detection and measurement of actual fiber orientation (top left – phase image of perform, top right – ROI (region of interest) analysis of fiber angle, bottom center – design
angles taken from CAD)
1.6 Measurement on cured specimen The measurement of the cured specimen had been performed similar to the specimen at perform stage. In order to achieve a common coordinate system the trimmed specimen had been mounted on a test rig. The test rig is a basic framework incorporating dedicated markers as shown in Figure 12 to allow two aspects.
1. Localization of specimen on test rig 2. Calibration of test rig within the robotic work cell
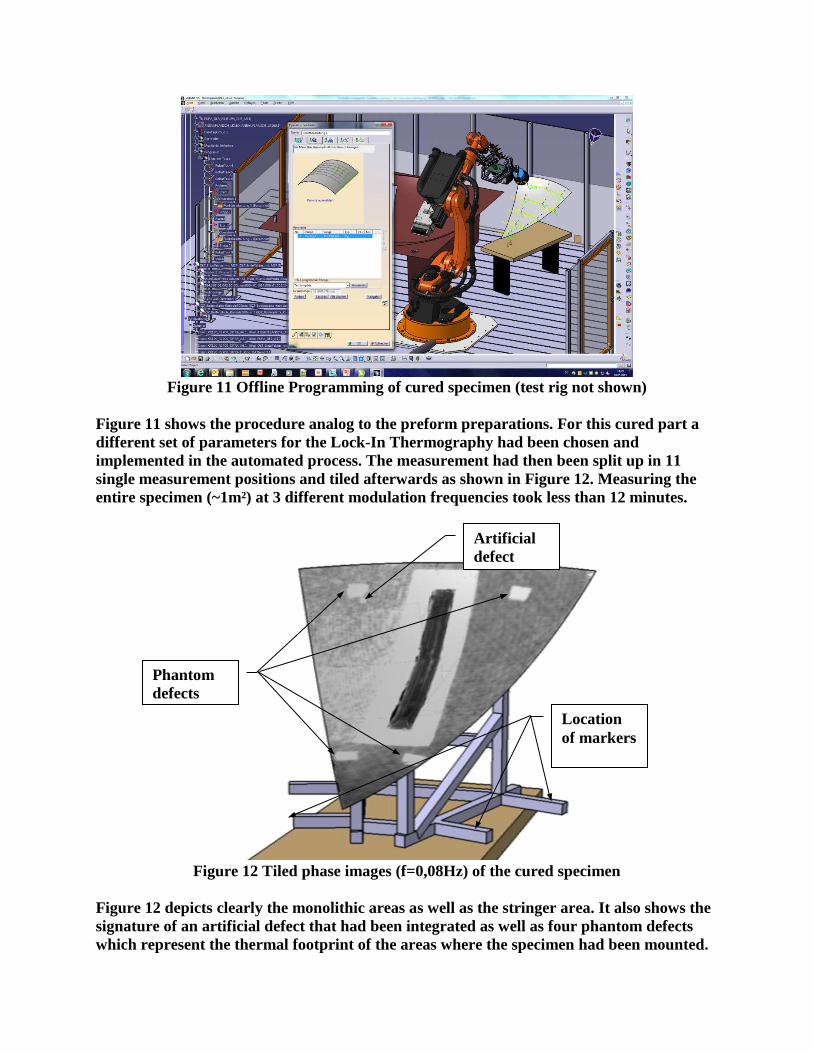
Figure 11 Offline Programming of cured specimen (test rig not shown)
Figure 11 shows the procedure analog to the preform preparations. For this cured part a different set of parameters for the Lock-In Thermography had been chosen and implemented in the automated process. The measurement had then been split up in 11 single measurement positions and tiled afterwards as shown in Figure 12. Measuring the entire specimen (~1m²) at 3 different modulation frequencies took less than 12 minutes.
Figure 12 Tiled phase images (f=0,08Hz) of the cured specimen
Figure 12 depicts clearly the monolithic areas as well as the stringer area. It also shows the signature of an artificial defect that had been integrated as well as four phantom defects which represent the thermal footprint of the areas where the specimen had been mounted.
Location of markers
Phantom defects
Artificial defect

More details about this can be found in section 1.6.1. Additionally the measurements showed significant defects along the stringer base. The darkest areas in the phase images (Figure 12) represent resin rich areas. These areas result from insufficient preforming in the area of transition from monolithic to sandwich. The residual cavities filled up with resin. The reason for the insufficient preforming was the usage of a material without binder.
1.6.1 Analysis on artificial defects As described in the previous section artificial defects had been integrated in the specimen. Figure 13 shows the procedure of integration of the artificial defects. Size and location had been determined in CAD, followed by a laser projection during the manufacturing allowing an accurate positioning.
Figure 13 Analysis on artificial defects within cured specimen (top left – CAD of artificial
defect, bottom left – laser projection during manufacturing, all right – phase image of artificial defect and phantom defect)
Phantom defect
Artificial defect

The analysis of the artificial defect had shown that there was significant coincidence between CAD and the phase image taken from the automated measurement. Size and location of the defect were matching excellent. The analysis of the phase and amplitude image had brought up general areas that are not homogeneous which reflects the material properties and the infusion characteristics. Other irregularities result from either peel ply removal or porosity on subsurface level. 3. Conclusions Within this study DLR has successfully demonstrated the feasibility of automated Lock-In Thermography in the context of manufacturing process chain observation especially at different process steps e.g. at perform stage as well as cured parts. One can see the detection, determination and localization of features even for large scale parts. These features range from fiber orientation, gaps, overlaps up to delaminations, undulation or even porosity [7]. Further work has to be done in qualitative characterization of these features as well as the automation in measurement and evaluation. DLR will emphasize its research in the investigation of relationships and sensitivities between features measured at various process steps. This should contribute to a better process knowledge and therefore higher quality of parts. References [1] V. Alliance, "VAP - Vacuum assisted process," 10 2013. [Online]. Available:
http://www.vap-info.com/en/download/VAP-vacuum-assisted-process.pdf. [2] T. Schmidt, "Automation in Production Integrated NDT Using Thermography," in
NDT in Aerospace, Augsburg, 2012. [3] M. Feuerstein, "Hand-Eye Calibration," Technical University of Munich, [Online].
Available: http://campar.in.tum.de/Chair/HandEyeCalibration. [Accessed 08 2013]. [4] J.-Y. Bouguetj, "Camera Calibration Toolbox for Matlab," [Online]. Available:
http://www.vision.caltech.edu/bouguetj/calib_doc/. [Accessed 10 2013]. [5] E. Zurich, "Fully automatic camera and hand to eye calibration," [Online]. Available:
https://www.vision.ee.ethz.ch/software/calibration_toolbox/calibration_toolbox.php. [Accessed 10 2013].
[6] F. Weyrauch, "ITOOL Final Report (Work Share DLR-BK)," Stuttgart, 08/2009. [7] G. Mayr, B. Plank, J. Sekelja and G. Hendorfer, "Active thermography as a
quantitative method for non-destructive evaluation of porous carbon fiber reinforced polymers," NDT & E International, no. 44(7), pp. 537-543, 01 2011.