Embed Size (px)
Citation preview
65
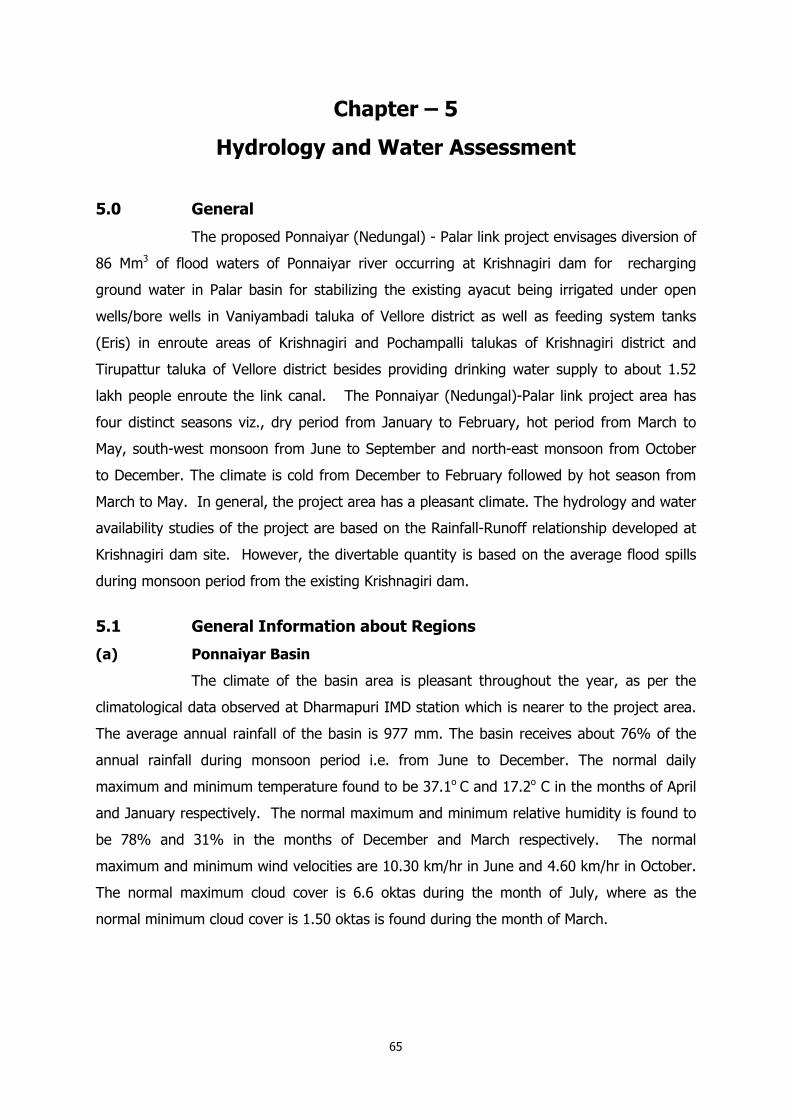
Chapter – 5
Hydrology and Water Assessment
5.0 General
The proposed Ponnaiyar (Nedungal) - Palar link project envisages diversion of
86 Mm3 of flood waters of Ponnaiyar river occurring at Krishnagiri dam for recharging
ground water in Palar basin for stabilizing the existing ayacut being irrigated under open
wells/bore wells in Vaniyambadi taluka of Vellore district as well as feeding system tanks
(Eris) in enroute areas of Krishnagiri and Pochampalli talukas of Krishnagiri district and
Tirupattur taluka of Vellore district besides providing drinking water supply to about 1.52
lakh people enroute the link canal. The Ponnaiyar (Nedungal)-Palar link project area has
four distinct seasons viz., dry period from January to February, hot period from March to
May, south-west monsoon from June to September and north-east monsoon from October
to December. The climate is cold from December to February followed by hot season from
March to May. In general, the project area has a pleasant climate. The hydrology and water
availability studies of the project are based on the Rainfall-Runoff relationship developed at
Krishnagiri dam site. However, the divertable quantity is based on the average flood spills
during monsoon period from the existing Krishnagiri dam.
5.1 General Information about Regions
(a) Ponnaiyar Basin
The climate of the basin area is pleasant throughout the year, as per the
climatological data observed at Dharmapuri IMD station which is nearer to the project area.
The average annual rainfall of the basin is 977 mm. The basin receives about 76% of the
annual rainfall during monsoon period i.e. from June to December. The normal daily
maximum and minimum temperature found to be 37.1o C and 17.2o C in the months of April
and January respectively. The normal maximum and minimum relative humidity is found to
be 78% and 31% in the months of December and March respectively. The normal
maximum and minimum wind velocities are 10.30 km/hr in June and 4.60 km/hr in October.
The normal maximum cloud cover is 6.6 oktas during the month of July, where as the
normal minimum cloud cover is 1.50 oktas is found during the month of March.
66
(b) Palar Basin
The climate of the Palar basin area is pleasant throughout the year except
during summer. The average annual rainfall of the basin is 891 mm. The basin receives
most of the rainfall from the south-west and north-east monsoons as such June to
December is considered as monsoon period. As per the climatological data of IMD
observatory located at Vellore the basin receives about 80% of the annual rainfall during the
monsoon period. The normal daily maximum and minimum temperature is 38.9o C in May
and 18.1o C in January respectively. The normal relative humidity varies from 37% in the
month of March to 86% in the month of December. The normal maximum and minimum
wind speed is found 10.4 km/hr during June and 5.5 km/hr during October. The normal
maximum cloud cover is 6.9 oktas during July and minimum cloud cover 2.0 oktas in May.
5.1.1 Specific Information
5.1.1.1 Drainage Basin
(a) Ponnaiyar Basin
The Ponnaiyar is a major river amongst the streams between Palar and
Cauvery. The Ponnaiyar basin is part of the basin area covered by the streams between
Palar and Cauvery. The basin area covered by the streams between Palar and Cauvery
comprises four rivers viz., Ongur, Varahanadi, Ponnaiyar including Gadilam and Vellar with
each of the four rivers draining independently in to the Bay of Bengal. The Ponnaiyar river
originates near Nandidurg in Kolar district of Karnataka State at an elevation of about 900 m
above mean sea level. The total length of the river is about 351 km and its average bed
slope is 1 in 390. The river basin lies between latitudes 11o 45’ N and 13o 30’ N and
longitudes 77o 33’ E and 79o 47’ E. The total catchment area of Ponnaiyar including Gadilam
rivers is 15679 km2 of which 3545 km2 lies in Karnataka, 133 km2 in Andhra Pradesh, 11961
km2 in Tamil Nadu and 40 km2 in Union Territory of Puducherry. The entire basin area
covered by the streams between Palar and Cauvery has been divided in to three hydrological
zones viz., Zone-I: Varahanadi basin (4513 km2), Zone-II: Ponnaiyar basin including
Gadilum river (15679 km2) and Zone-III: Vellar basin (8086 km2). The river network in
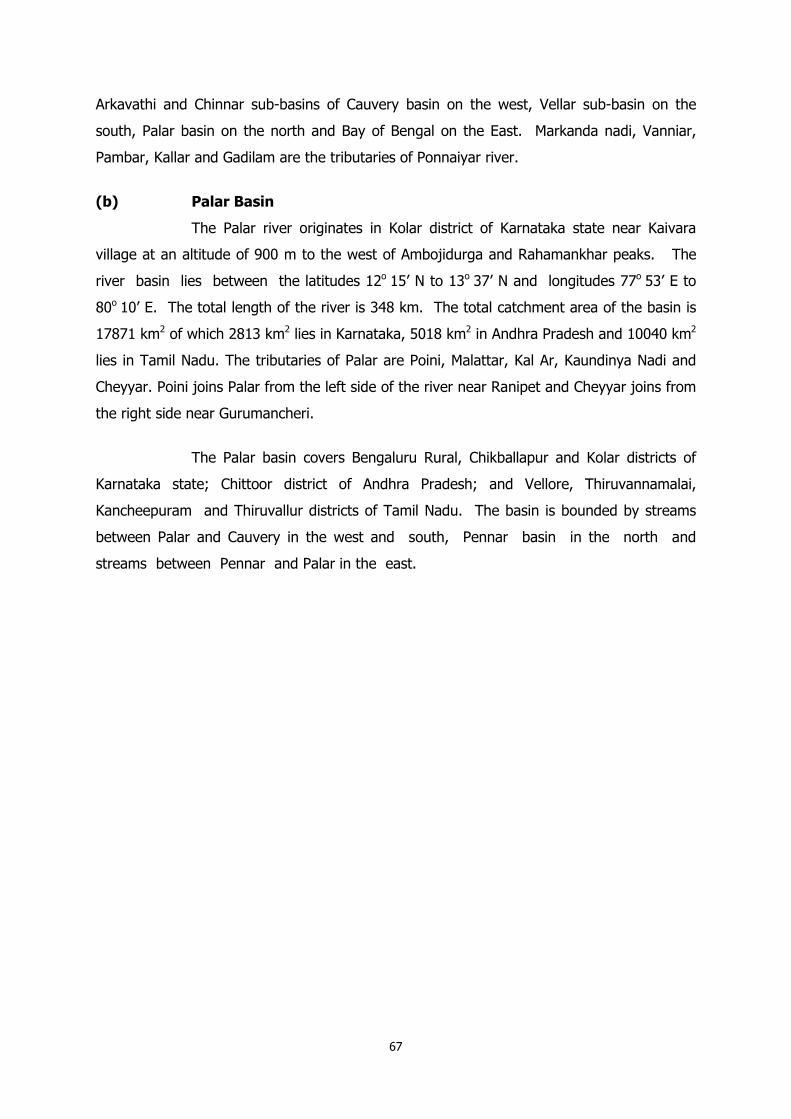
Ponnaiyar and Palar basins showing the above three Zones is depicted in Fig 5.1.
The Ponnaiyar basin covers Kolar, Chikballapur, Bengaluru urban including Bengaluru
city and Bengaluru rural districts of Karnataka; Chittoor district of Andhra Pradesh;
Dharmapuri, Krishnagiri, Salem, Vellore Thiruvannamalai, Villupuram and Cuddalore districts
of Tamil Nadu; and Union Territory of Puducherry. The Ponnaiyar basin is bounded by
67
Arkavathi and Chinnar sub-basins of Cauvery basin on the west, Vellar sub-basin on the
south, Palar basin on the north and Bay of Bengal on the East. Markanda nadi, Vanniar,
Pambar, Kallar and Gadilam are the tributaries of Ponnaiyar river.
(b) Palar Basin
The Palar river originates in Kolar district of Karnataka state near Kaivara
village at an altitude of 900 m to the west of Ambojidurga and Rahamankhar peaks. The
river basin lies between the latitudes 12o 15’ N to 13o 37’ N and longitudes 77o 53’ E to
80o 10’ E. The total length of the river is 348 km. The total catchment area of the basin is
17871 km2 of which 2813 km2 lies in Karnataka, 5018 km2 in Andhra Pradesh and 10040 km2
lies in Tamil Nadu. The tributaries of Palar are Poini, Malattar, Kal Ar, Kaundinya Nadi and
Cheyyar. Poini joins Palar from the left side of the river near Ranipet and Cheyyar joins from
the right side near Gurumancheri.
The Palar basin covers Bengaluru Rural, Chikballapur and Kolar districts of
Karnataka state; Chittoor district of Andhra Pradesh; and Vellore, Thiruvannamalai,
Kancheepuram and Thiruvallur districts of Tamil Nadu. The basin is bounded by streams
between Palar and Cauvery in the west and south, Pennar basin in the north and
streams between Pennar and Palar in the east.
68
69
5.1.1.2 Command Area
The Ponnaiyar (Nedungal) - Palar link project envisages diversion of 86 Mm3
of flood waters of Ponnaiyar river from Nedungal Anicut to the water starved Vaniyambadi
Taluka of Palar basin along with enroute areas of Krishnagiri and Vellore districts for
recharging the Ground water for stabilizing the existing irrigated area to an extent of about
9850 ha annually which is now being irrigated through open wells and bore wells. Out of
9850 ha an area of 7950 ha will be benefitted in Vaniyambadi Taluka of Vellore district by
utilising about 57.926 Mm3 of water and 1900 ha in enroute areas of Krishnagiri and Vellore
districts by utilising about 17.215 Mm3 besides providing drinking water supply to 1.52 lakh
people by utilising 3.882 Mm3.
5.1.1.3 Floods and Drainage
(a) Ponnaiyar Basin
The gauge and discharge data is being observed by the Public Works
Department, Govt. of Tamil Nadu at Krishnagiri dam on Ponnaiyar river which is about
16 km upstream of the existing Nedungal Anicut. The daily inflow data is available for a
period of 52 years i.e., from 1958-59 to 2009-10. The maximum observed flood at
Krishnagiri dam was 3007 cumec on 11.11.1903. The design flood of Krishnagiri dam was
4234 cumec.
(b) Palar Basin
The gauge and discharge data is being recorded by Central Water
Commission at Arcot G&D site on Palar river and is available from the year 1972. The
maximum observed discharge at this G&D site was 528.2 cumec on 13.09.1981.
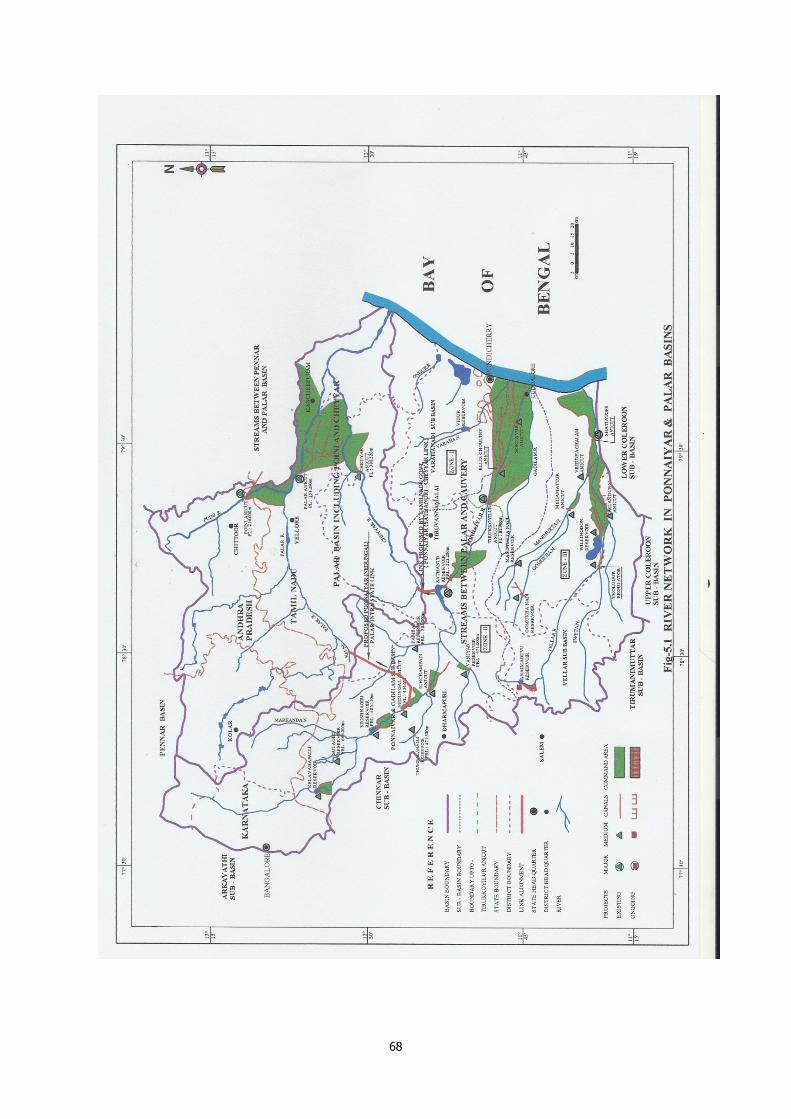
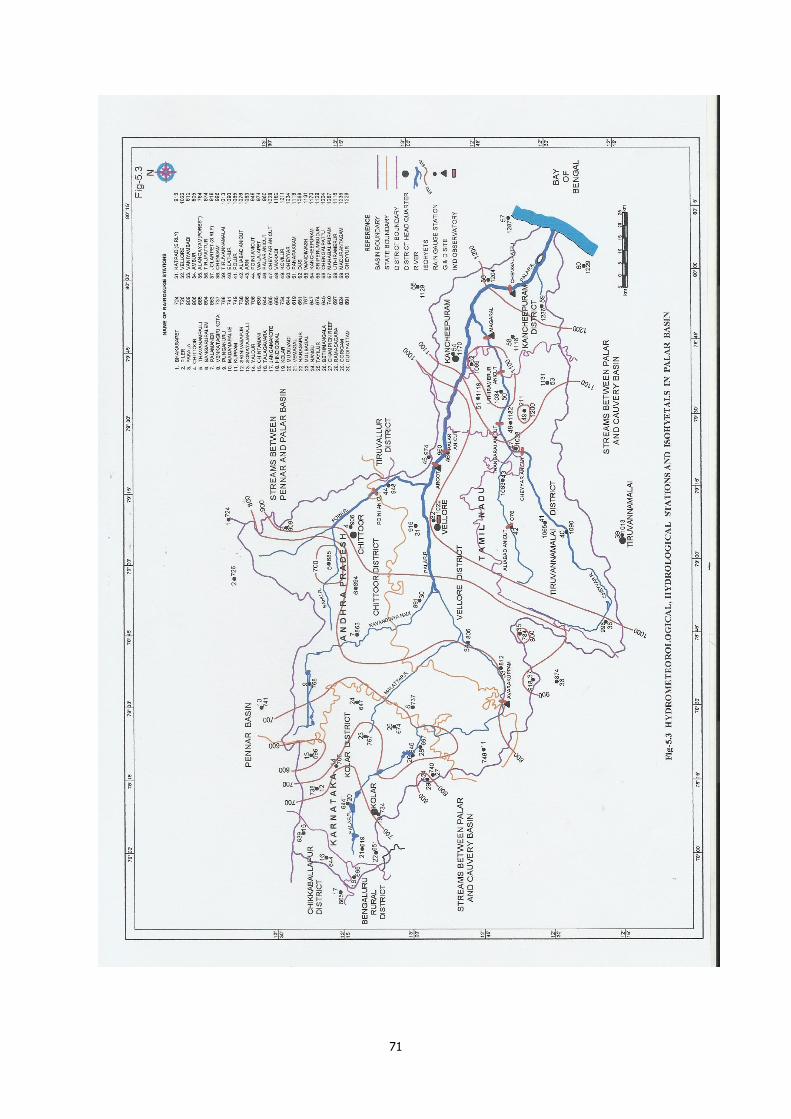
The Hydrometeorological, Hydrological stations and Isohyetals in Ponnaiyar
and Palar river systems are shown in Fig 5.2 and 5.3 respectively.
70
71
72
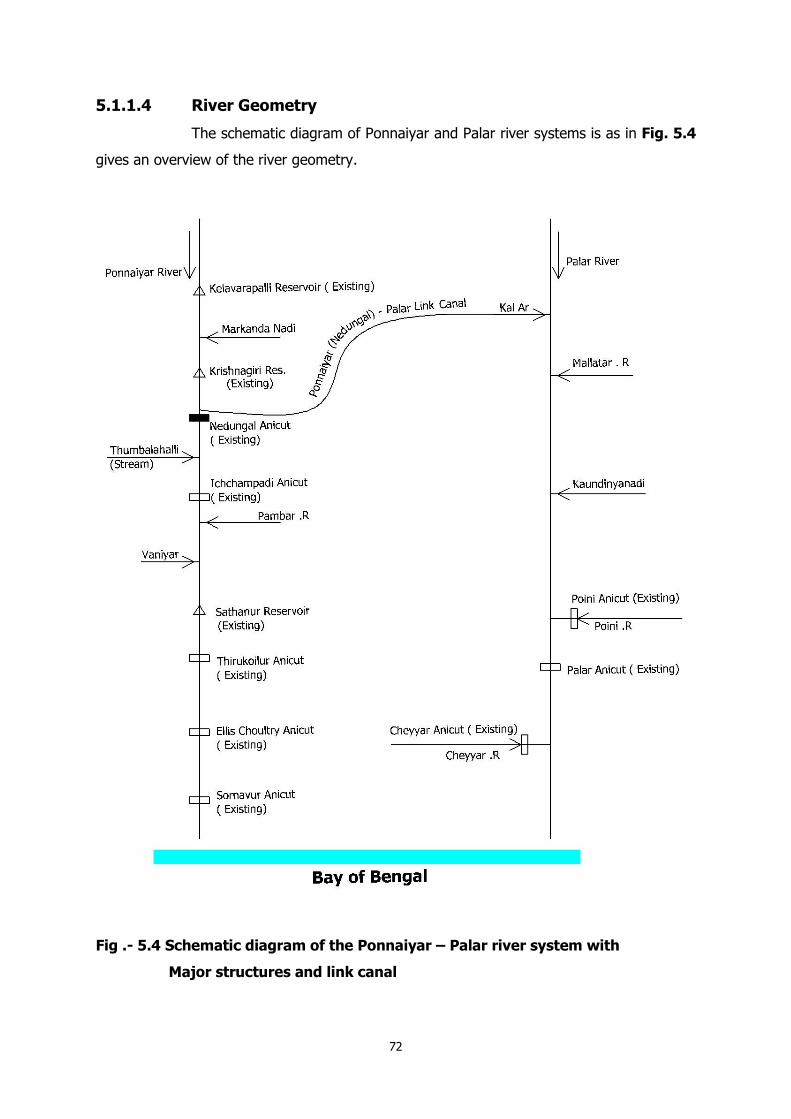
5.1.1.4 River Geometry
The schematic diagram of Ponnaiyar and Palar river systems is as in Fig. 5.4
gives an overview of the river geometry.
Fig .- 5.4 Schematic diagram of the Ponnaiyar – Palar river system with
Major structures and link canal
73
5.1.1.5 Groundwater Recharge
The proposed diversion through link canal recharges the ground water
enroute the link canal and in Palar basin, thereby raising ground water table as well as
improvement in the quality of water. As per the Central Ground Water Board studies the
long term water level fluctuation for the period from 1998 - 2007 indicates rise in water level
in Vellore district ranges from 0.0025 to 0.5264 m/year. The fall in water level ranges
between 0.568 to 2.3958 m/year.
5.1.1.6 Reservoir Area
The Ponnaiyar (Nedungal) - Palar link canal off-takes from the existing
Nedungal Anicut across Ponnaiyar river. The Anicut is situated in Krishnagiri Taluka of
Krishnagiri District near Nedungal Village at latitude 12o 22’ N and longitude 78o 16’ E. The
Anicut is located 16 km downstream of the existing Krishnagiri dam. The crest level of the
Anicut is 434.71 m. The Anicut is approachable by all weather roads nearby.
The flood water spills from existing Krishnagiri dam will be regulated to link
canal through existing Nedungal Anicut. The Krishnagiri dam is located in Krishnagiri District
of Tamil Nadu near Krishnagiri Town. The latitude and longitude of the Krishnagiri dam are
12o 28’ N and 78o 11’ E respectively. The catchment area of the Ponnaiyar river up to
Krishnagiri dam is 5428 km2. Height of the dam is 29.26 m and the length of earth dam and
masonry dam is 712.93 m and 277.67 m respectively. The spill way discharge capacity is
4061 cumec with 8 vents of 12.19 x 6.10 m size. The crest level of spillway is 477.01 m.
The submergence area of the reservoir at FRL 483.11 m is 10.723 km2 with gross storage
capacity of 47.184 Mm3.
5.1.1.7 Other Water Usage
The flood water spill down the existing Krishnagiri dam will be diverted into
link canal through Nedungal Anicut for stabilizing the existing area being irrigated through
open wells and bore wells by recharging the Ground water potential in Tirupattur and
Vaniyambadi talukas of Vellore District and Krishnagiri and Pochampalli talukas of Krishnagiri
District. In addition to irrigation use enroute villages will be supplied with domestic water to
the tune of 3.882 Mm3.
74
5.1.1.8 Navigation
The Ponnaiyar and Palar rivers are not presently used for any navigational
purpose. There is no proposal of navigation in the proposed Ponnaiyar (Nedungal) - Palar
link canal.
5.1.2 Data Availability
(a) Ponnaiyar Basin
5.1.2.1 Hydrological and Meteorological Investigations
Rainfall and Snowfall
There is no snowfall in Ponnaiyar basin. The precipitation in the basin is in
the form of rainfall and the intensity of rainfall varies fairly in time and space as observed
from the data. There are 67 raingauge stations in and around the Ponnaiyar basin, out of
which 18 stations are in the Ponnaiyar basin upto Krishnagiri dam site. The basin receives
almost 80% of the annual rainfall during monsoon period from June to December. The
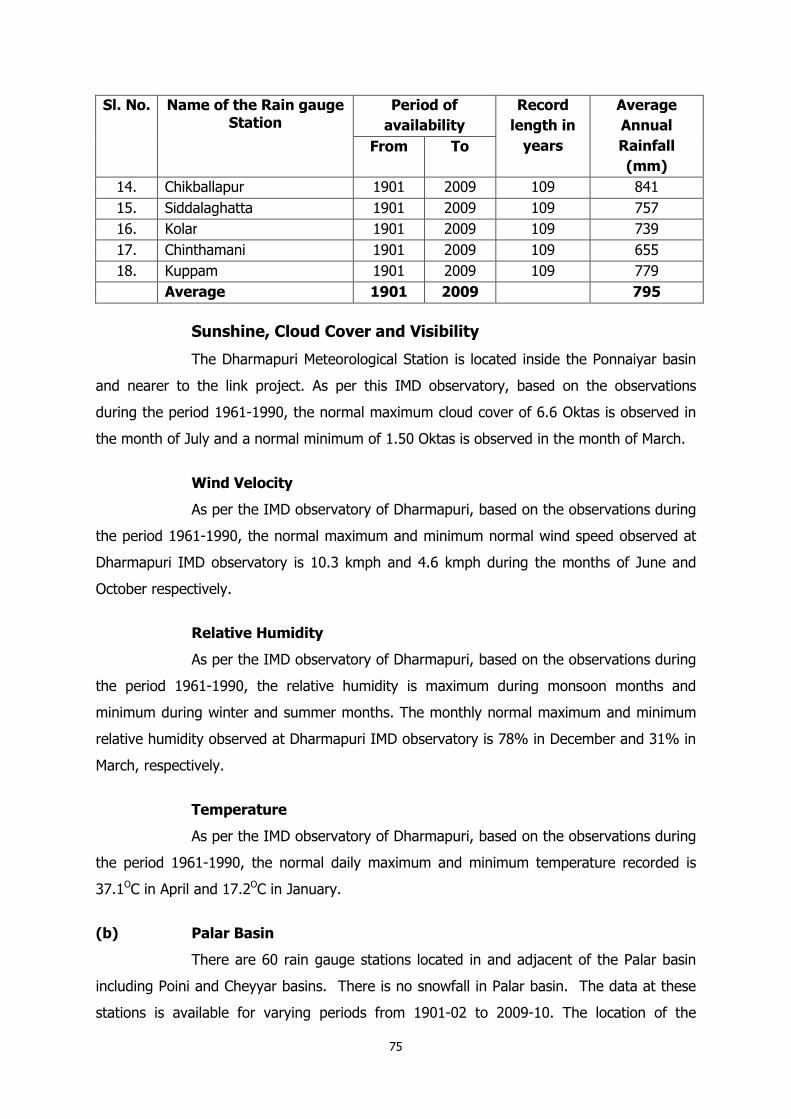
average annual rainfall of the Ponnaiyar basin upto Krishnagiri dam site is 795 mm. The
period of availability of rainfall data and average annual rainfall (mm) of each raingauge
station of Ponnaiyar basin up to Krishnagiri dam site is given below in Table-5.1. The
location of the existing rain gauges in the Ponnaiyar basin is shown in Fig 5.2.
Table-5.1
Raingauge Stations in Ponnaiyar Basin up to Krishnagiri Dam Site and their Period of Availability
Sl. No. Name of the Rain gauge Station
Period of availability
Record length in
years
Average Annual Rainfall (mm)
From To
1. Rayakota 1901 2009 109 702
2. Krishnagiri 1901 2009 109 882
3. Hosur 1901 2009 109 757
4. Denkanikota 1901 2009 109 997
5. Anekal 1901 2009 109 915
6. Bengaluru 1901 2009 109 949
7. Hebbal 1901 2009 109 806
8. Devanahalli 1901 2009 109 777
9. Hoskote 1901 2009 109 780
10. Sol Devanahalli 1901 2009 109 711
11. Doddabalapur 1901 2009 109 810
12. Malur 1901 2009 109 725
13. Bangarpet 1901 2009 109 730
75
Sl. No. Name of the Rain gauge Station
Period of
availability
Record
length in
years
Average
Annual
Rainfall
(mm)
From To
14. Chikballapur 1901 2009 109 841
15. Siddalaghatta 1901 2009 109 757
16. Kolar 1901 2009 109 739
17. Chinthamani 1901 2009 109 655
18. Kuppam 1901 2009 109 779
Average 1901 2009 795
Sunshine, Cloud Cover and Visibility
The Dharmapuri Meteorological Station is located inside the Ponnaiyar basin
and nearer to the link project. As per this IMD observatory, based on the observations
during the period 1961-1990, the normal maximum cloud cover of 6.6 Oktas is observed in
the month of July and a normal minimum of 1.50 Oktas is observed in the month of March.
Wind Velocity
As per the IMD observatory of Dharmapuri, based on the observations during
the period 1961-1990, the normal maximum and minimum normal wind speed observed at
Dharmapuri IMD observatory is 10.3 kmph and 4.6 kmph during the months of June and
October respectively.
Relative Humidity
As per the IMD observatory of Dharmapuri, based on the observations during
the period 1961-1990, the relative humidity is maximum during monsoon months and
minimum during winter and summer months. The monthly normal maximum and minimum
relative humidity observed at Dharmapuri IMD observatory is 78% in December and 31% in
March, respectively.
Temperature
As per the IMD observatory of Dharmapuri, based on the observations during
the period 1961-1990, the normal daily maximum and minimum temperature recorded is
37.1OC in April and 17.2OC in January.
(b) Palar Basin
There are 60 rain gauge stations located in and adjacent of the Palar basin
including Poini and Cheyyar basins. There is no snowfall in Palar basin. The data at these
stations is available for varying periods from 1901-02 to 2009-10. The location of the
76
existing rain gauges in the basin is shown in Fig. 5.3. The basin receives almost 80% of
the annual rainfall during monsoon period from June to December.
5.1.2.2 Pan Evaporation
Though there is a Pan-evaporimeter installed at Krishnagiri dam site, the pan
evaporation data observed at this site is not used for calculating the evaporation losses of
the reservoir since the link project envisages transfer of flood waters spilling down the
existing Krishnagiri dam and as such no simulation study has been carried out.
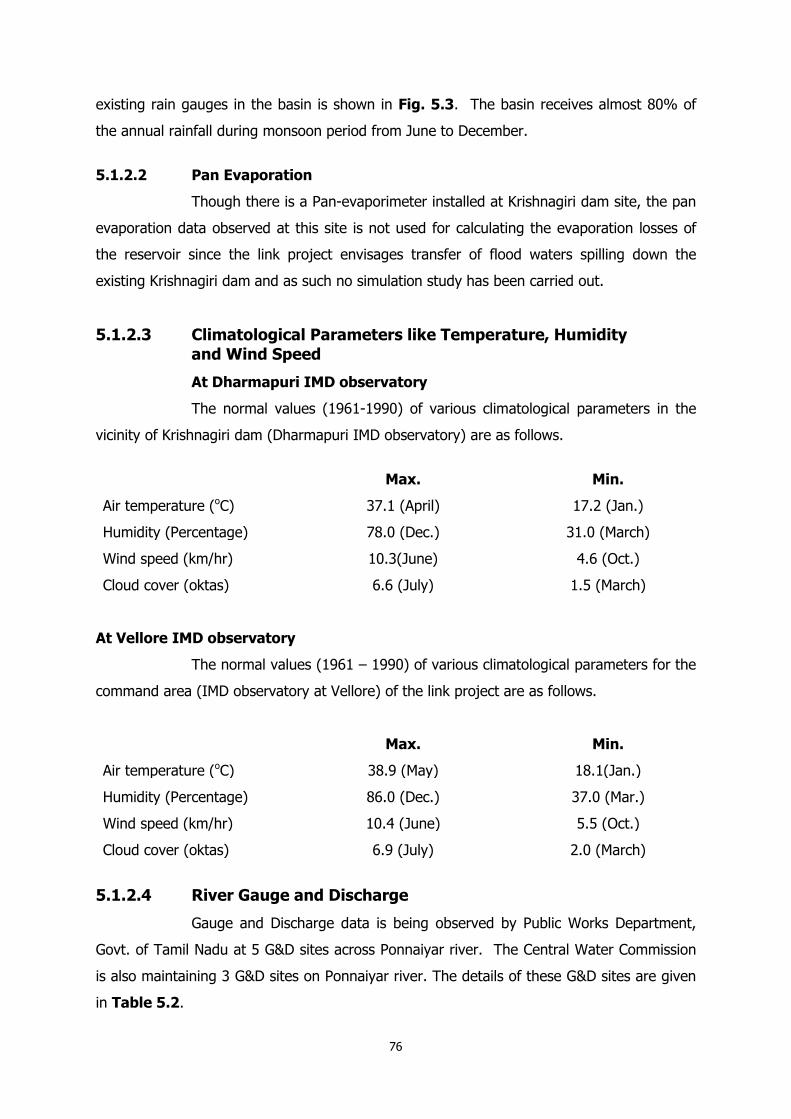
5.1.2.3 Climatological Parameters like Temperature, Humidity
and Wind Speed
At Dharmapuri IMD observatory
The normal values (1961-1990) of various climatological parameters in the
vicinity of Krishnagiri dam (Dharmapuri IMD observatory) are as follows.
Max. Min.
Air temperature (oC) 37.1 (April) 17.2 (Jan.)
Humidity (Percentage) 78.0 (Dec.) 31.0 (March)
Wind speed (km/hr) 10.3(June) 4.6 (Oct.)
Cloud cover (oktas) 6.6 (July) 1.5 (March)
At Vellore IMD observatory
The normal values (1961 – 1990) of various climatological parameters for the
command area (IMD observatory at Vellore) of the link project are as follows.
Max. Min.
Air temperature (oC) 38.9 (May) 18.1(Jan.)
Humidity (Percentage) 86.0 (Dec.) 37.0 (Mar.)
Wind speed (km/hr) 10.4 (June) 5.5 (Oct.)
Cloud cover (oktas) 6.9 (July) 2.0 (March)
5.1.2.4 River Gauge and Discharge
Gauge and Discharge data is being observed by Public Works Department,
Govt. of Tamil Nadu at 5 G&D sites across Ponnaiyar river. The Central Water Commission
is also maintaining 3 G&D sites on Ponnaiyar river. The details of these G&D sites are given
in Table 5.2.
77
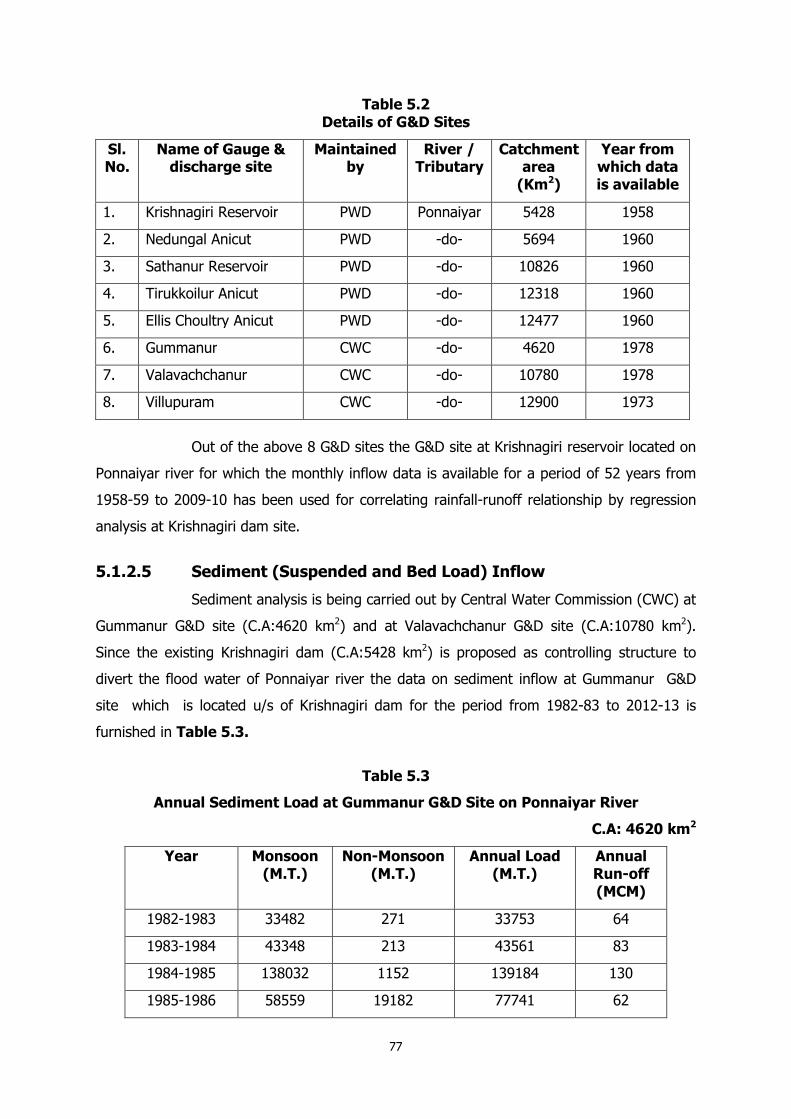
Table 5.2 Details of G&D Sites
Sl. No.
Name of Gauge & discharge site
Maintained by
River / Tributary
Catchment area
(Km2)
Year from which data is available
1. Krishnagiri Reservoir PWD Ponnaiyar 5428 1958
2. Nedungal Anicut PWD -do- 5694 1960
3. Sathanur Reservoir PWD -do- 10826 1960
4. Tirukkoilur Anicut PWD -do- 12318 1960
5. Ellis Choultry Anicut PWD -do- 12477 1960
6. Gummanur CWC -do- 4620 1978
7. Valavachchanur CWC -do- 10780 1978
8. Villupuram CWC -do- 12900 1973
Out of the above 8 G&D sites the G&D site at Krishnagiri reservoir located on
Ponnaiyar river for which the monthly inflow data is available for a period of 52 years from
1958-59 to 2009-10 has been used for correlating rainfall-runoff relationship by regression
analysis at Krishnagiri dam site.
5.1.2.5 Sediment (Suspended and Bed Load) Inflow
Sediment analysis is being carried out by Central Water Commission (CWC) at
Gummanur G&D site (C.A:4620 km2) and at Valavachchanur G&D site (C.A:10780 km2).
Since the existing Krishnagiri dam (C.A:5428 km2) is proposed as controlling structure to
divert the flood water of Ponnaiyar river the data on sediment inflow at Gummanur G&D
site which is located u/s of Krishnagiri dam for the period from 1982-83 to 2012-13 is
furnished in Table 5.3.
Table 5.3
Annual Sediment Load at Gummanur G&D Site on Ponnaiyar River
C.A: 4620 km2
Year Monsoon (M.T.)
Non-Monsoon (M.T.)
Annual Load (M.T.)
Annual Run-off (MCM)
1982-1983 33482 271 33753 64
1983-1984 43348 213 43561 83
1984-1985 138032 1152 139184 130
1985-1986 58559 19182 77741 62
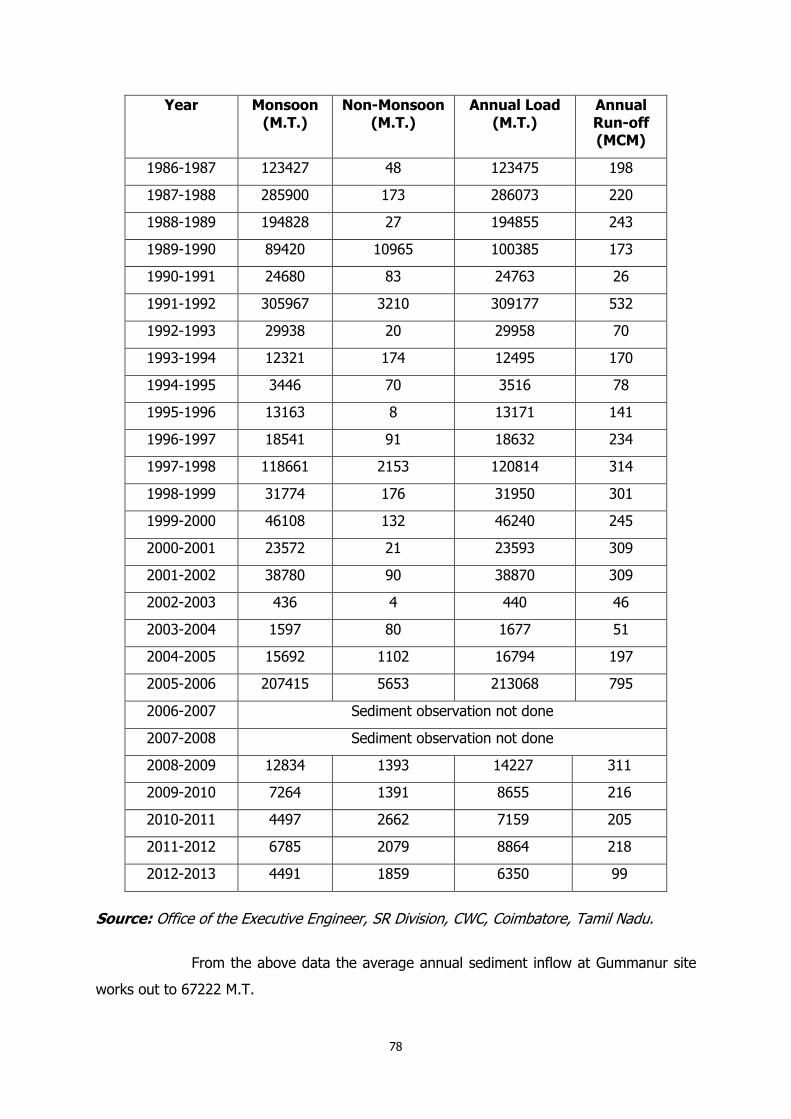
78
Year Monsoon (M.T.)
Non-Monsoon (M.T.)
Annual Load (M.T.)
Annual Run-off (MCM)
1986-1987 123427 48 123475 198
1987-1988 285900 173 286073 220
1988-1989 194828 27 194855 243
1989-1990 89420 10965 100385 173
1990-1991 24680 83 24763 26
1991-1992 305967 3210 309177 532
1992-1993 29938 20 29958 70
1993-1994 12321 174 12495 170
1994-1995 3446 70 3516 78
1995-1996 13163 8 13171 141
1996-1997 18541 91 18632 234
1997-1998 118661 2153 120814 314
1998-1999 31774 176 31950 301
1999-2000 46108 132 46240 245
2000-2001 23572 21 23593 309
2001-2002 38780 90 38870 309
2002-2003 436 4 440 46
2003-2004 1597 80 1677 51
2004-2005 15692 1102 16794 197
2005-2006 207415 5653 213068 795
2006-2007 Sediment observation not done
2007-2008 Sediment observation not done
2008-2009 12834 1393 14227 311
2009-2010 7264 1391 8655 216
2010-2011 4497 2662 7159 205
2011-2012 6785 2079 8864 218
2012-2013 4491 1859 6350 99
Source: Office of the Executive Engineer, SR Division, CWC, Coimbatore, Tamil Nadu.
From the above data the average annual sediment inflow at Gummanur site
works out to 67222 M.T.
79
5.1.2.6 Water Quality
Public Works Department (PWD), Govt. of Tamil Nadu collected the Water
samples of Krishnagiri Dam during all the months from different points such as reservoir,
seepage water from drainage galleries, toe-drain of earthen section for analysis at Soil
Mechanics and Research Division, WRO, PWD, Chennai for both chemical and physio-
chemical analysis for ascertaining the water quality status. The latest data for the period
from 2009 to 2013 on laboratory test results of the water samples of Krishnagiri reservoir
has been collected. Details on results of the water samples are given in Chapter-4
‘Surveys & Investigations’ under para 4.6.7.
5.2 Surface Water Balance of Ponnaiyar Basin upto
Krishnagiri Dam Site
5.2.1 Hydrological Data Requirement
For development of rainfall-runoff relationship monthly rainfall and concurrent
stream flow data is required. The inflows to the reservoir are affected by water utilization in
the upstream. Hence the utilization data of the upstream projects is also required to
compute the reservoir inflows. The periodic water demands, releases from the reservoir and
evaporation rates in the reservoir area are also required.
5.2.2 Time Unit for Simulation Studies
The project envisages diversion of flood waters spilled down the existing
Krishnagiri dam as such no simulation studies are carried out. However, monthly monsoon
spill data at Krishnagiri reservoir for the period from 1958 to 2009 is considered to estimate
flood water spills down the Krishnagiri reservoir.
5.2.3 Compilation and Processing of Basic Hydrological Data
5.2.3.1 Hydrological Investigation
As indicated above, the observed monthly inflow data at Krishnagiri reservoir
is available for the period from 1958-59 to 2008-09 and the same is used for development
of rainfall-runoff relationship by regression analysis at Krishnagiri dam site. The catchment
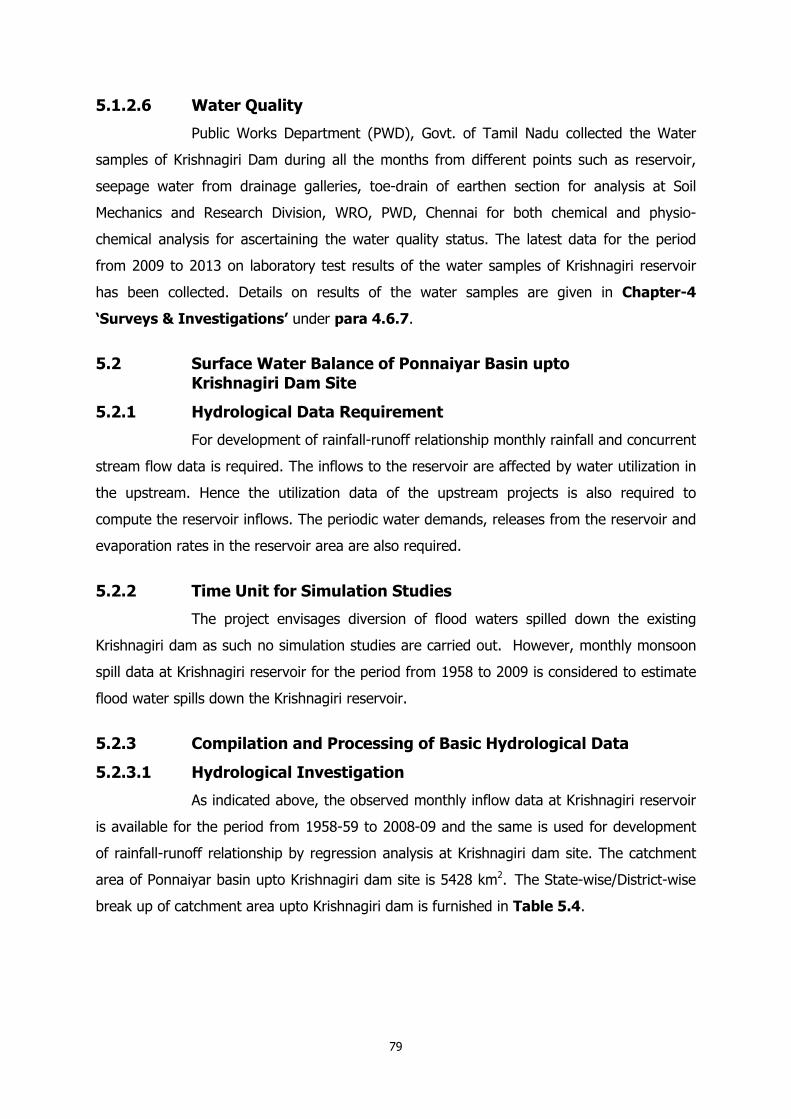
area of Ponnaiyar basin upto Krishnagiri dam site is 5428 km2. The State-wise/District-wise
break up of catchment area upto Krishnagiri dam is furnished in Table 5.4.
80
Table 5.4
District wise break-up of catchment area up to Krishnagiri Dam Site
Sl. No.
State / District Catchment area in km2
Percentage to the total Catchment area
1. Karnataka
a) Kolar 1143 21.06
b) Chikballapur 498 9.18
c) Bengaluru urban
Incl. Bengaluru City
797
(241+556)
14.68
d) Bengaluru rural 1107 20.39
Sub-total: 3545 65.31
2. Andhra Pradesh
a) Chittoor 94 1.73
3. Tamil Nadu
a) Krishnagiri 1789 32.96
Total 5428 100.00
5.2.3.2 Data from other Sources
Most of the data used in this study was collected from other Central and
State Govt. Agencies. Rainfall data was collected from IMD and Department of Economics
and statistics, Govt. of Karnataka and Tamil Nadu. The inflows, spills and upstream project
utilizations were collected from Water Resources Department, Govt. of Tamil Nadu.
5.2.4 Processing of Data
The following hydrological variables were processed in this study: (i) rainfall
data (ii) reservoir inflow data (iii) upstream project utilisation data (iv) export from the
basin and import to the basin upto Krishnagiri dam site and (v) monthly spill discharges
from Krishnagiri reservoir.
5.2.4.1 Quality of Data
There are some missing records in daily rainfall data. The missing data have
been estimated using standard statistical methods. Further, analysis of the rainfall-runoff
correlation is carried out at Krishnagiri dam site. The intercepting catchment area between
the existing Krishnagiri dam and Nedungal Anicut is 266 km2 and the contribution of yield
from this area is computed on proportionate area basis using the yield series developed at
the Krishnagiri dam site.
81
5.2.4.2 Filling of Short Data Gaps
The rainfall data up to Krishnagiri dam site is mostly available for all the 18
stations from 1901-02 to 2009-10 and the same has been considered in this study. The gaps
in the rainfall data have been filled using standard procedure. The missing records in rainfall
data have been estimated using standard statistical methods. These gaps are filled by the
normal ratio formula as given below:
Px = Nx/m [ P1/N1+ P2/N2+ ……… Pm/Nm]
Where,
Px = estimated rainfall of a station
Nx = normal rainfall of a station
P1, P2…… Pm = observed rainfall values of neighbouring stations
N1 N2 …….Nm = normal rainfall values of neighbouring stations
5.2.4.3 Adjustment of Records
The observed inflow data of Krishnagiri reservoir is available for the period
from 1970-71 to 2009-10. To compute the monsoon virgin yield series at Krishnagiri
reservoir actual upstream utilizations under the existing projects and regeneration on import
from Bengaluru water supply schemes are considered based on the proportionate area of
Bengaluru city lying in Ponnaiyar basin from the date of stage-wise commissioning of the
water supply schemes. The gross monsoon virgin yield series at Krishnagiri reservoir are
arrived by adding the inflow at Krishnagiri dam to the net upstream utilizations by the
irrigation projects and subtracting regeneration from the Bengaluru water supply scheme
(import) for each year from 1970-71 to 2009-10.
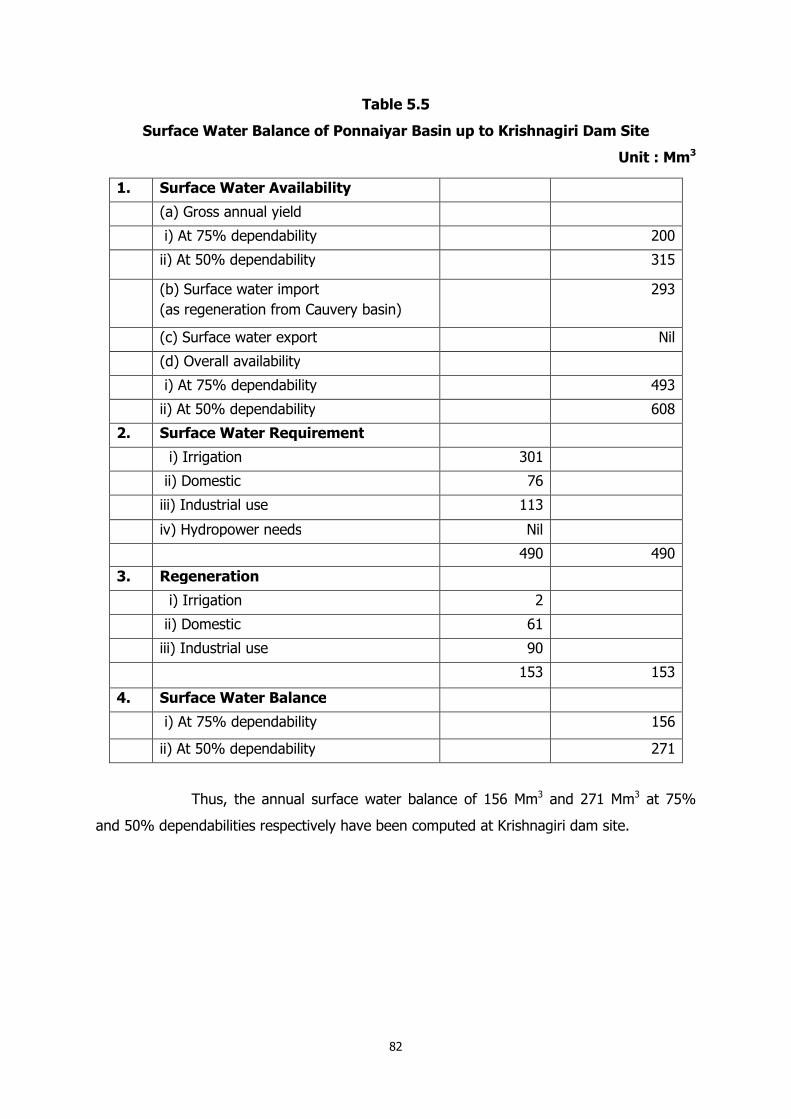
5.3 Water Balance upto Krishnagiri Dam Site
The 75% and 50% dependable annual yields as well as estimated utilisations
for various uses by 2050 AD are computed as per various approved guidelines of TAC of
NWDA. The details of Water Availability analysis and projected utilisations are furnished as
Appendix 5.1. The water balance taking into account the availability, import, export,
regeneration and water needs for the basin area up to Krishnagiri dam site is given in
Table 5.5.
82
Table 5.5
Surface Water Balance of Ponnaiyar Basin up to Krishnagiri Dam Site
Unit : Mm3
Thus, the annual surface water balance of 156 Mm3 and 271 Mm3 at 75%
and 50% dependabilities respectively have been computed at Krishnagiri dam site.
1. Surface Water Availability
(a) Gross annual yield
i) At 75% dependability 200
ii) At 50% dependability 315
(b) Surface water import
(as regeneration from Cauvery basin)
293
(c) Surface water export Nil
(d) Overall availability
i) At 75% dependability 493
ii) At 50% dependability 608
2. Surface Water Requirement
i) Irrigation 301
ii) Domestic 76
iii) Industrial use 113
iv) Hydropower needs Nil
490 490
3. Regeneration
i) Irrigation 2
ii) Domestic 61
iii) Industrial use 90
153 153
4. Surface Water Balance
i) At 75% dependability 156
ii) At 50% dependability 271
83
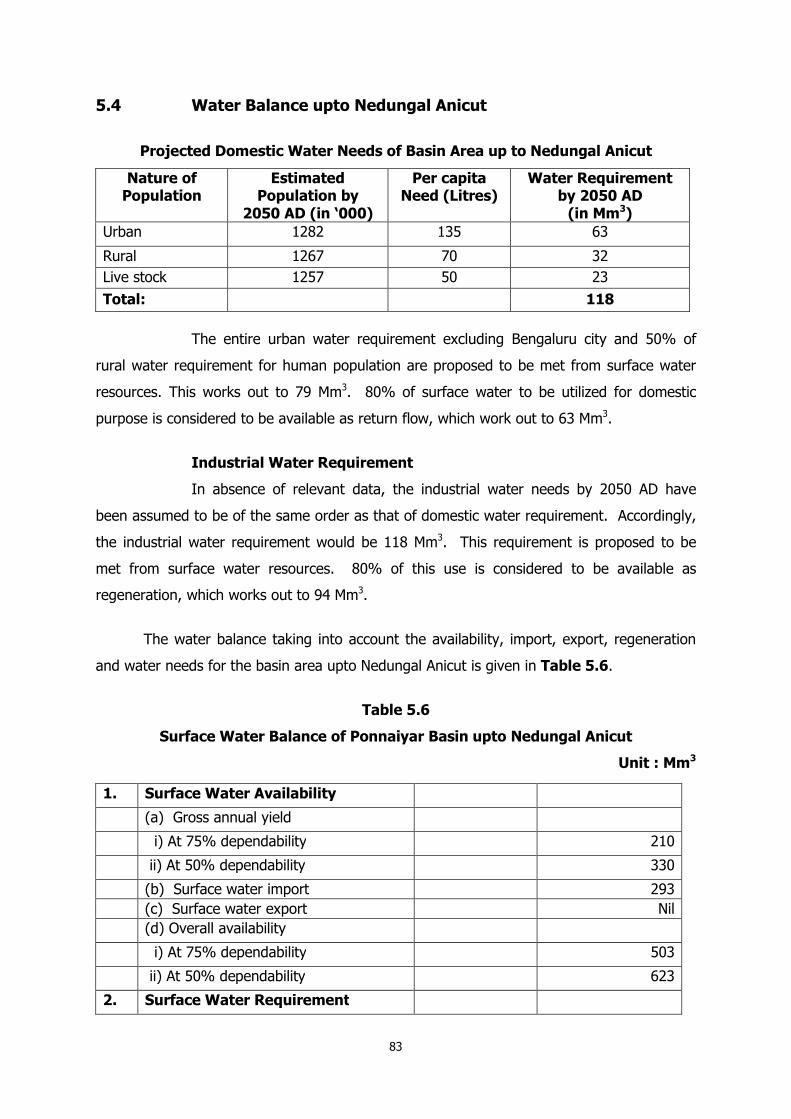
5.4 Water Balance upto Nedungal Anicut
Projected Domestic Water Needs of Basin Area up to Nedungal Anicut
Nature of Population
Estimated Population by
2050 AD (in ‘000)
Per capita Need (Litres)
Water Requirement by 2050 AD
(in Mm3)
Urban 1282 135 63
Rural 1267 70 32
Live stock 1257 50 23
Total: 118
The entire urban water requirement excluding Bengaluru city and 50% of
rural water requirement for human population are proposed to be met from surface water
resources. This works out to 79 Mm3. 80% of surface water to be utilized for domestic
purpose is considered to be available as return flow, which work out to 63 Mm3.
Industrial Water Requirement
In absence of relevant data, the industrial water needs by 2050 AD have
been assumed to be of the same order as that of domestic water requirement. Accordingly,
the industrial water requirement would be 118 Mm3. This requirement is proposed to be
met from surface water resources. 80% of this use is considered to be available as
regeneration, which works out to 94 Mm3.
The water balance taking into account the availability, import, export, regeneration
and water needs for the basin area upto Nedungal Anicut is given in Table 5.6.
Table 5.6
Surface Water Balance of Ponnaiyar Basin upto Nedungal Anicut
Unit : Mm3
1. Surface Water Availability
(a) Gross annual yield
i) At 75% dependability 210
ii) At 50% dependability
330
(b) Surface water import 293
(c) Surface water export Nil
(d) Overall availability
i) At 75% dependability 503
ii) At 50% dependability
623
2. Surface Water Requirement
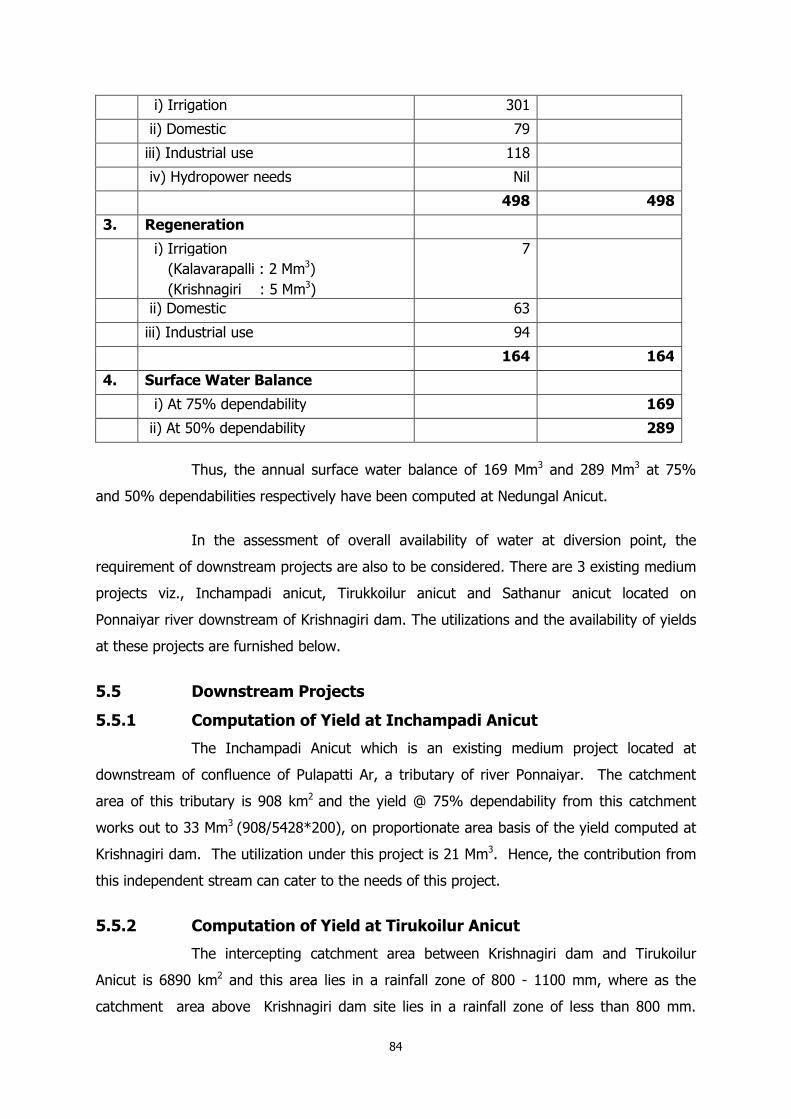
84
Thus, the annual surface water balance of 169 Mm3 and 289 Mm3 at 75%
and 50% dependabilities respectively have been computed at Nedungal Anicut.
In the assessment of overall availability of water at diversion point, the
requirement of downstream projects are also to be considered. There are 3 existing medium
projects viz., Inchampadi anicut, Tirukkoilur anicut and Sathanur anicut located on
Ponnaiyar river downstream of Krishnagiri dam. The utilizations and the availability of yields
at these projects are furnished below.
5.5 Downstream Projects
5.5.1 Computation of Yield at Inchampadi Anicut
The Inchampadi Anicut which is an existing medium project located at
downstream of confluence of Pulapatti Ar, a tributary of river Ponnaiyar. The catchment
area of this tributary is 908 km2 and the yield @ 75% dependability from this catchment
works out to 33 Mm3 (908/5428*200), on proportionate area basis of the yield computed at
Krishnagiri dam. The utilization under this project is 21 Mm3. Hence, the contribution from
this independent stream can cater to the needs of this project.
5.5.2 Computation of Yield at Tirukoilur Anicut
The intercepting catchment area between Krishnagiri dam and Tirukoilur
Anicut is 6890 km2 and this area lies in a rainfall zone of 800 - 1100 mm, where as the
catchment area above Krishnagiri dam site lies in a rainfall zone of less than 800 mm.
i) Irrigation 301
ii) Domestic 79
iii) Industrial use 118
iv) Hydropower needs Nil
498 498
3. Regeneration
i) Irrigation
(Kalavarapalli : 2 Mm3)
(Krishnagiri : 5 Mm3)
7
ii) Domestic 63
iii) Industrial use 94
164 164
4. Surface Water Balance
i) At 75% dependability 169
ii) At 50% dependability
289
85
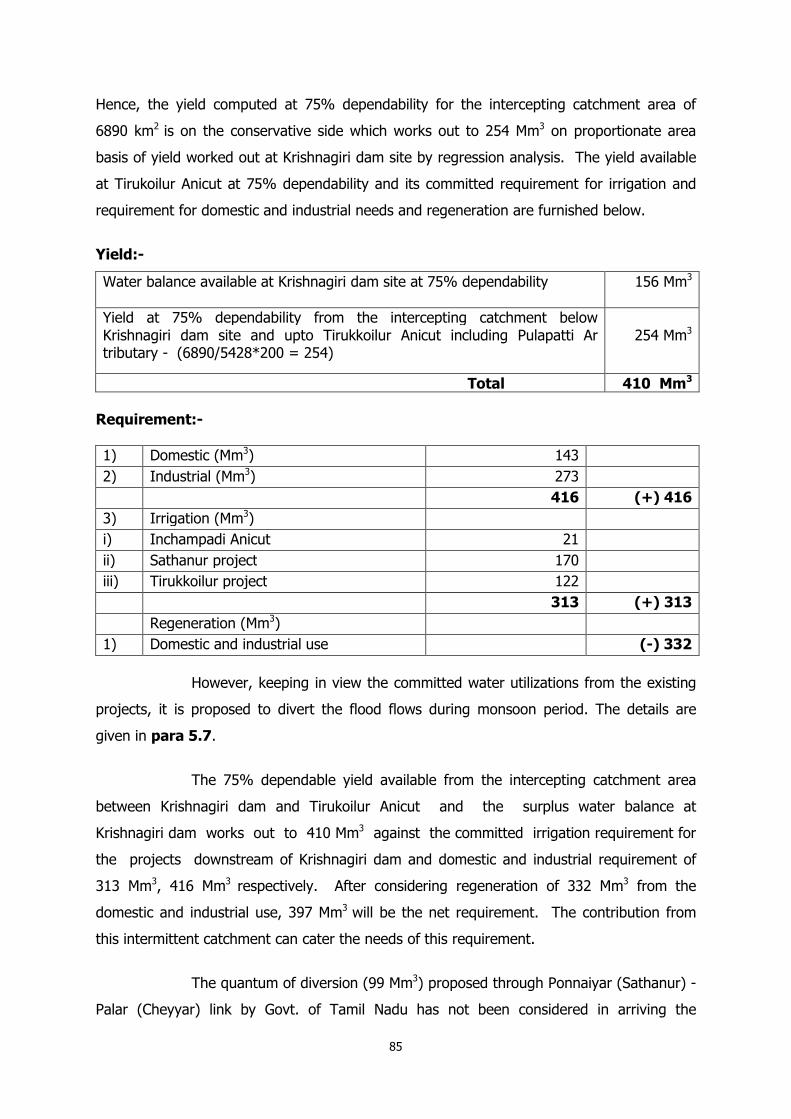
Hence, the yield computed at 75% dependability for the intercepting catchment area of
6890 km2 is on the conservative side which works out to 254 Mm3 on proportionate area
basis of yield worked out at Krishnagiri dam site by regression analysis. The yield available
at Tirukoilur Anicut at 75% dependability and its committed requirement for irrigation and
requirement for domestic and industrial needs and regeneration are furnished below.
Yield:-
Water balance available at Krishnagiri dam site at 75% dependability
156 Mm3
Yield at 75% dependability from the intercepting catchment below Krishnagiri dam site and upto Tirukkoilur Anicut including Pulapatti Ar tributary - (6890/5428*200 = 254)
254 Mm3
Total 410 Mm3
Requirement:-
1) Domestic (Mm3) 143
2) Industrial (Mm3) 273
416 (+) 416
3) Irrigation (Mm3)
i) Inchampadi Anicut 21
ii) Sathanur project 170
iii) Tirukkoilur project 122
313 (+) 313
Regeneration (Mm3)
1) Domestic and industrial use (-) 332
However, keeping in view the committed water utilizations from the existing
projects, it is proposed to divert the flood flows during monsoon period. The details are
given in para 5.7.
The 75% dependable yield available from the intercepting catchment area
between Krishnagiri dam and Tirukoilur Anicut and the surplus water balance at
Krishnagiri dam works out to 410 Mm3 against the committed irrigation requirement for
the projects downstream of Krishnagiri dam and domestic and industrial requirement of
313 Mm3, 416 Mm3 respectively. After considering regeneration of 332 Mm3 from the
domestic and industrial use, 397 Mm3 will be the net requirement. The contribution from
this intermittent catchment can cater the needs of this requirement.
The quantum of diversion (99 Mm3) proposed through Ponnaiyar (Sathanur) -
Palar (Cheyyar) link by Govt. of Tamil Nadu has not been considered in arriving the
86
availability of yield @ 75% dependability, since the proposal is framed for diversion of flood
flows of Ponnaiyar at Sathanur dam.
Ponnaiyar (Nedungal) – Palar Link Canal
Even though there is surplus water available at Krishnagiri dam and Nedungal
Anicut, only spills during flood season are proposed for diversion. Hence the hydrological
regime of the Ponnaiyar basin is not likely to be affected significantly. The diversion of water
is proposed during the months of October, November and December only.
5.6 Presentation of Hydrologic Inputs
5.6.1 Water Inflows
Water inflows observed at Krishnagiri G&D site on Ponnaiyar river were used
for Hydrological purpose. However, monthly spill data of Krishnagiri reservoir based on
regulated releases of flood/spills are used to assess the quantum of flood water for
proposed diversion.
5.6.2 Data Generation
The observed in-flow data at Krishnagiri reservoir is available for a continuous
period of about 52 years from 1958-59 to 2009-10. Therefore, the process of data
generation is not required.
5.6.3 Sedimentation Studies
5.6.3.1 Rate of Sedimentation
Sediment analysis was done by the Central Water Commission (CWC), at
Gummanur G&D site which is located upstream of Krishnagiri dam site. As per the sediment
data available at the site during the period from 1982-83 to 2012-13 the rate of average
annual sediment inflow to the reservoir works out to 67222 M.T, out of which 65343 M.T is
during the monsoon period.
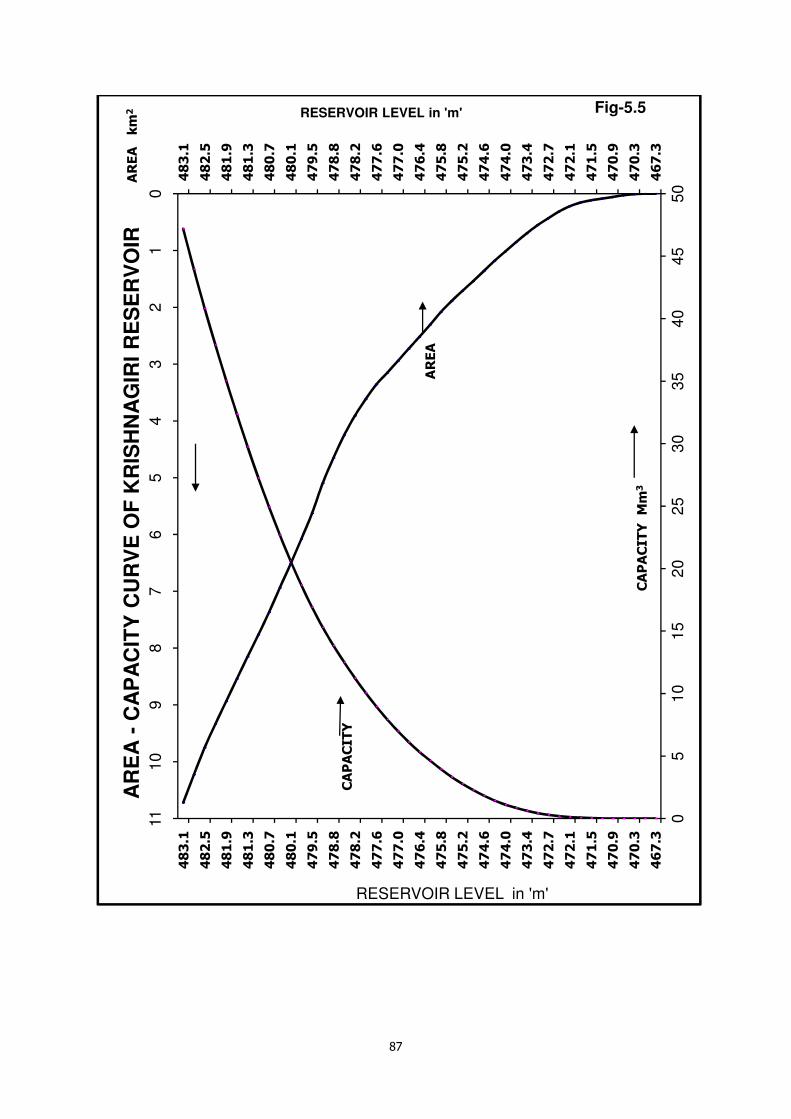
5.6.3.2 Area Capacity Curves
The existing Krishnagiri dam on Ponnaiyar river with a catchment area of
5428 Km2 is proposed as a controlling structure for transfer of water through the link canal.
The Elevation - Area - Capacity curves of Krishnagiri reservoir are presented in Fig. 5.5.
87
01
23
45
67
89
10
11
46
7.3
47
0.3
47
0.9
47
1.5
47
2.1
47
2.7
47
3.4
47
4.0
47
4.6
47
5.2
47
5.8
47
6.4
47
7.0
47
7.6
47
8.2
47
8.8
47
9.5
48
0.1
48
0.7
48
1.3
48
1.9
48
2.5
48
3.1
05
10
15
20
25
30
35
40
45
50
46
7.3
47
0.3
47
0.9
47
1.5
47
2.1
47
2.7
47
3.4
47
4.0
47
4.6
47
5.2
47
5.8
47
6.4
47
7.0
47
7.6
47
8.2
47
8.8
47
9.5
48
0.1
48
0.7
48
1.3
48
1.9
48
2.5
48
3.1
CA
PA
CIT
Y
Mm
3
AR
EA
k
m2
RESERVOIR LEVEL in 'm'
CA
PA
CIT
Y
AR
EA
AR
EA
-C
AP
AC
ITY
CU
RV
E O
F K
RIS
HN
AG
IRI
RE
SE
RV
OIR
RESERVOIR LEVEL in 'm' Fig-5.5
88
5.6.4 Potential Evapotranspiration and Rainfall
Normal potential evapo-transpiration data of Vellore IMD observatory is used
for computation of crop water requirement in the command area. The command area
proposed for stabilisation through this link project is being irrigated by waters from local
tanks and bore wells. The link canal feeds the tanks and recharges the ground water.
5.6.5 Flood Inputs
Flood water available at the Krishnagiri dam is proposed for diversion through
Ponnaiyar (Nedungal) – Palar link project. The monthly spill discharges for all the months
based on the daily data of Krishnagiri reservoir are collected from the Project authorities for
the period from 1958-59 to 2009-10 and used to estimate the quantum of flood water
spilling down the existing Krishnagiri dam which can be available for diversion.
5.6.6 Inputs for Water Quality
Different chemical and physio-chemical parameters of water quality of
Ponnaiyar river at Krishnagiri dam are observed by PWD, WRD, Govt. of Tamil Nadu
regularly and are being tested at water quality testing laboratory of Soil Mechanics and
Research Division, PWD, WRD, Chennai. From the test results of the water samples of
Ponnaiyar river collected at Krishnagiri dam from reservoir water, seepage water from
Earthen dam toe-drain and Drainage galleries it is seen that in general the water is fit for
domestic, industrial and agricultural purposes.
5.6.7 Low Flow Inputs
The monthly inflow details of Krishnagiri reservoir were collected for the
period from 1958-59 to 2009-10. From the inflow data it is seen that the average flow
during non-monsoon (January to May) i.e., lean flow season is about 20 Mm3 only which
works out to about 6.5% of average annual inflow.
5.6.8 Surface to Ground Water Recharge
The Ground water Division, Public Works Department, WRO, Vellore, Govt. of
Tamil Nadu has studied the possible ground water recharge zones and identified the areas
having possibilities of ground water recharge enroute the link canal as well as on either side
of the rivers Kal Ar and Palar in Vaniyambadi and Tirupattur talukas of Vellore district. The
details are discussed in Chapter-8: Irrigation Planning and Command Area.
89
5.7 Study of Spill Waters from Krishnagiri Dam and Quantum of
diversion and Link Canal Capacity
The monthly spill discharges for all the months at Krishnagiri reservoir are
collected for the years from 1958-59 to 2009-10 from project authorities, from which the
quantum of average monsoon flood spills at Krishnagiri dam site has been assessed to be
157 Mm3. Out of 157 Mm3, 86 Mm3 is proposed for diversion through the link canal. Details
are furnished in Annexure-5.1. The summary of daily spill data for the months of October,
November and December for the period from 1979-80 to 2009-10 is furnished at
Annexures-5.2.1 to 5.2.3. The canal has been designed for 68 cumec capacity to flow for
a period of 18 days annually.
5.8 Design Flood and Diversion Flood
Since the diversion is proposed from the existing Nedungal Anicut, the
aspects of design flood and diversion flood etc. are not discussed in the present study.
5.9 Studies for Design of Drainage in the Command Area
No new command area is proposed to be brought under irrigation from the
project except stabilisation of existing command area through ground water recharge. As
such no studies are carried for design of drainage in the command area.
5.10 Determination of Levels for Locating Structures on Outlets
The crest level of the Nedungal anicut is 434.710 m. In order to divert
required water the pond level in the front of the proposed head regulator for link diversion is
considered as 435.01 m keeping in view the raise in water level during the floods. The sill
level of the Head Regulator is kept at 433.0 m with the FSL of the link canal at start as
434.450 m. The sill level of existing Barur channel sluice is 433.16 m, which is located just
60 m d/s of the proposed head regulator.
5.10.1 Location of Structures
The link project envisages construction of following components:
1. Canal Head Regulator at off-take point at Nedungal Anicut
2. A link canal of 54.15 km length with off-take at FSL 434.450 m from Nedungal
anicut.
3. Enroute Cross drainage and Cross masonry Structures.
90
5.10.2 Location of Outlets
There is no direct canal irrigation proposed enroute the link canal. However,
suitable outlets are proposed to be provided to feed the enroute existing system tanks. The
hydraulic particulars of these tanks are discussed in the Chapter – 6: Design Aspects.
5.11 Model Studies
Since the existing structures viz., Krishnagiri dam and Nedungal anicut are
proposed for regulation and diversion of flood flows, no model studies are required.
5.12 Minimum Flow for Environmental Consideration
Since, only flood water are proposed for diversion and also several small
streams are joining the Ponnaiyar river d/s of the diversion point viz., Nedungal anicut, no
adverse effect is anticipated on minimum flows in the river.
5.13 Effect of Project on Hydrologic Regime
During the flood period, the spillway operation of the Krishnagiri reservoir is
so controlled as to pass the design flood without adverse affects on the downstream side
due the floods. While the crest level of the spillway is at 477.01 m, the FRL and MWL are at
483.11 m and 484.63 m respectively. As per the flood rules of Krishnagiri Reservoir Project,
all the spillway gates shall be opened uniformly and the height of opening shall be increased
according to the intensity of flood. Whenever flood flows are received over 10000 cusecs
(280 cumec), the reservoir level will be gradually reduced to 482.50 m during the rising
floods. During the receding floods, the reservoir will be gradually filled upto FRL 483.11 m.
Since only the part of spills during the flood is contemplated for diversion through the link
canal, no adverse effect on d/s hydrologic regime is anticipated.
5.13.1 Effect on Low Flows
Since as already discussed, only flood flows during period of spill occurrence
are proposed for diversion during monsoon period, there will be no adverse effect on low
flows because of proposed diversion.
5.13.2 Effect on Peak Flood
It is expected that peak flood will be smoothened because of diversion of spill
flows during times of flood.
91
5.14 Water Allocation and Inter-state Aspects
Both Ponnaiyar and Palar basins are not covered under any tribunal awards.
Though the proposed project is an Intra-state link project of Govt. of Tamil Nadu, the
Ponnaiyar originates in Karnataka State. This aspect is already discussed in Chapter 3:
Interstate Aspects.