Embed Size (px)
Citation preview
3/14/18
1
One Sample Tests of Hypothesis
Dr. Richard Jerz
© 2018 rjerz.com1
Goals
• Understand what is meant by a hypothesisand hypothesis testing.
• Describe the steps in the hypothesis-testing procedure.
• Distinguish between a one-tailed and a two-tailed test of hypothesis.
• Conduct a test of hypothesis about a population mean.
• Describe Type I and Type II errors.• Define p-values. • Understand why we do this!
© 2018 rjerz.com2
The Language of Statisticians
• Hypothesis• Test of hypothesis• Null hypothesis, alternative hypothesis• Level of significance• P-values• Reject or not reject• Type 1 and type 2 errors
© 2018 rjerz.com3
Textbook Example
• The mean length of a small counterbalance bar is 43 millimeters, and the production supervisor is concerned that the adjustments of the machine producing the bars has changed. He asks the engineering department to investigate.
• The company (or equipment) producing the bars says “The mean length is 43 millimeters.”
• How should Engineering investigate this?
© 2018 rjerz.com4
What is a Hypothesis?
• A Hypothesis is a statement about the value of a population parameter developed for the purpose of testing. Examples of hypotheses made about a population parameter are:• The mean monthly income for systems analysts is
$3,625.• Twenty percent of all customers at Bovine’s Chop
House return for another meal within a month. • In our problem, the hypothesis, or statement
is “The process, or company thinks the bar length is 43 millimeters.”
© 2018 rjerz.com5
What might we do?
• We can believe the claim.• Go on with life• Spend our time and energy elsewhere
• Alternatively, we might want to verify the claim by taking a sample and seeing what the sample data suggests.
• “Certainty” is only known if we had the entire population of data. Neither the claim nor the sample have the entire population, therefore, we have some “uncertainty.”
© 2018 rjerz.com6
3/14/18
2
In Statistical Language:
• The claim is called the “hypothesis.” Recognize that the claim does not have supporting evidence, meaning “none” or “null,” and is called the “null hypothesis.”
• The “alternative,” based upon sample data is referred to as the “alternative hypothesis.”
• We can use symbology to represent this:• H0: null hypothesis (the “0” might correspond to
“none”• H1: alternate hypothesis (the “1” might represent
“some” data)• H0 and H1 are mutually exclusive and collectively
exhaustive • H0 is always presumed to be true (correct) • H1 (you, the statistician) has the burden of proof
that the data suggests something different © 2018 rjerz.com7
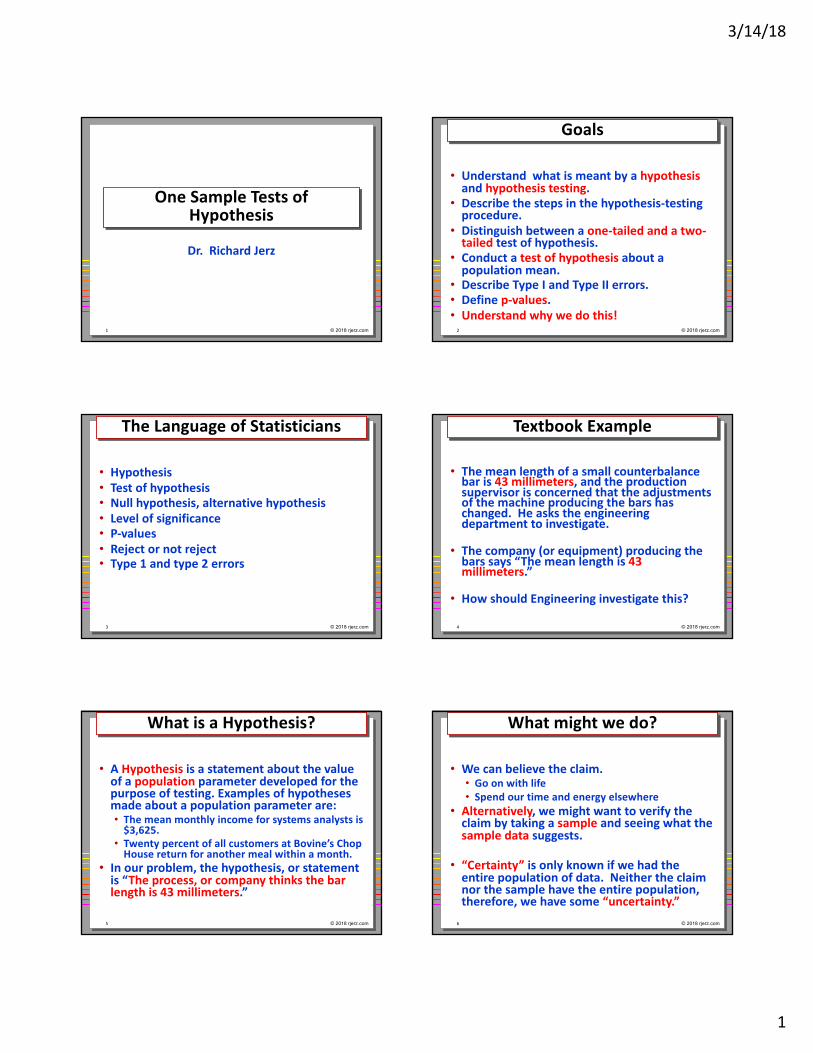
Graphic Representation
• Alternative Hypothesis• Null Hypothesis
© 2018 rjerz.com8
What to do?
• Answer: Let’s perform a test. Let’s compare the sample data with the claim point.
• If the claim point is similar to the claim of the sample data, you do nothing.
• If the claim is way off from what the sample data suggests, you speak up and say “Hey, I think your claim might not be true.”
© 2018 rjerz.com9
Graphic Representation
• Our test: Compare our sample data to the claim
© 2018 rjerz.com10
More Statistical Language:
• Our “test” that we perform is called “test of hypothesis.”
• We have already named the “red” region, we call this the “confidence interval.”
• What should we call the “white” region?• Statisticians call this the “level of significance”
and represent it with the symbol, α. • α = 1 – the confidence interval
• For example, a 90% confidence interval produces a 10% level of significance.
• α is also the risk that the sample data might be wrong. Do you want to be wrong 10%, 5%, 1%?
© 2018 rjerz.com11
More Statistical Language:
• Reject the claim means “reject the null hypothesis.”
• Do not reject the claim means, “do not reject the null.”
• We never “accept” the claim because accepting implies certainty. We are only certain when we have the entire population.
© 2018 rjerz.com12
3/14/18
3
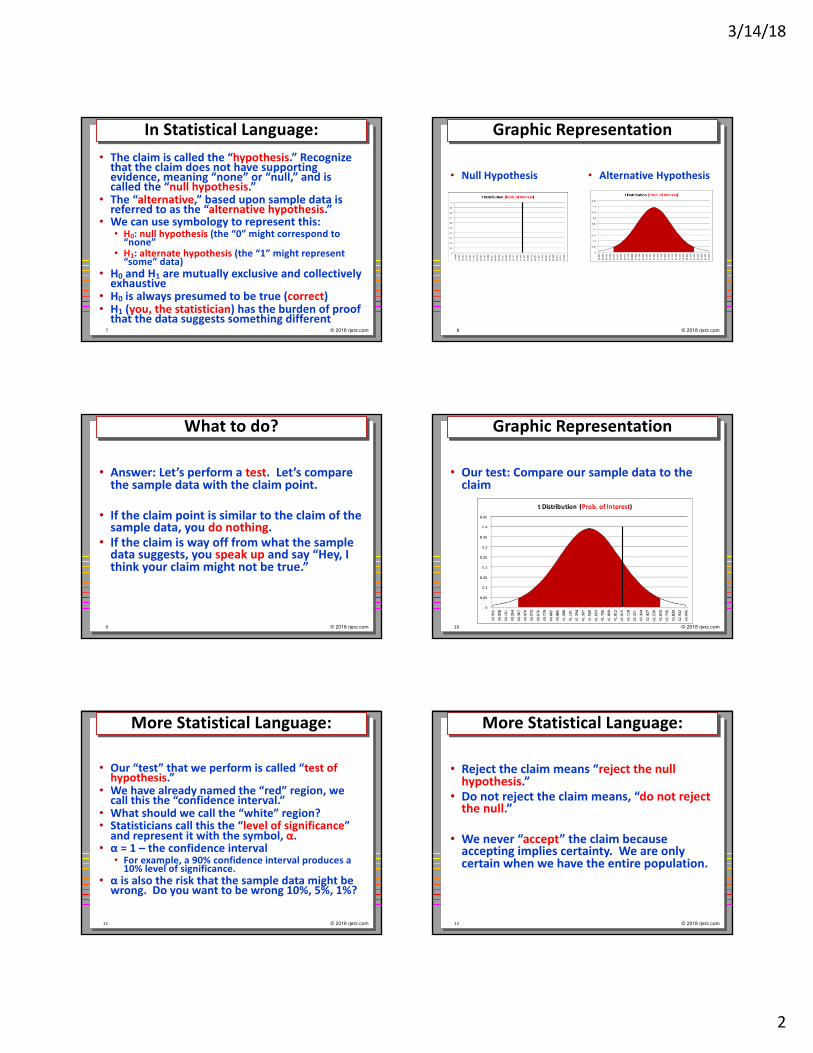
Type I and Type II Errors
© 2018 rjerz.com13
Analogy: Our Legal System
• What happened with O.J. Simpson. Did he kill his ex-wife, Nicole Brown?
© 2018 rjerz.com14
Hypothesis Scenarios for Testing a Mean (μ)
© 2018 rjerz.com15
One-tail vs. Two-tail Test
© 2018 rjerz.com16
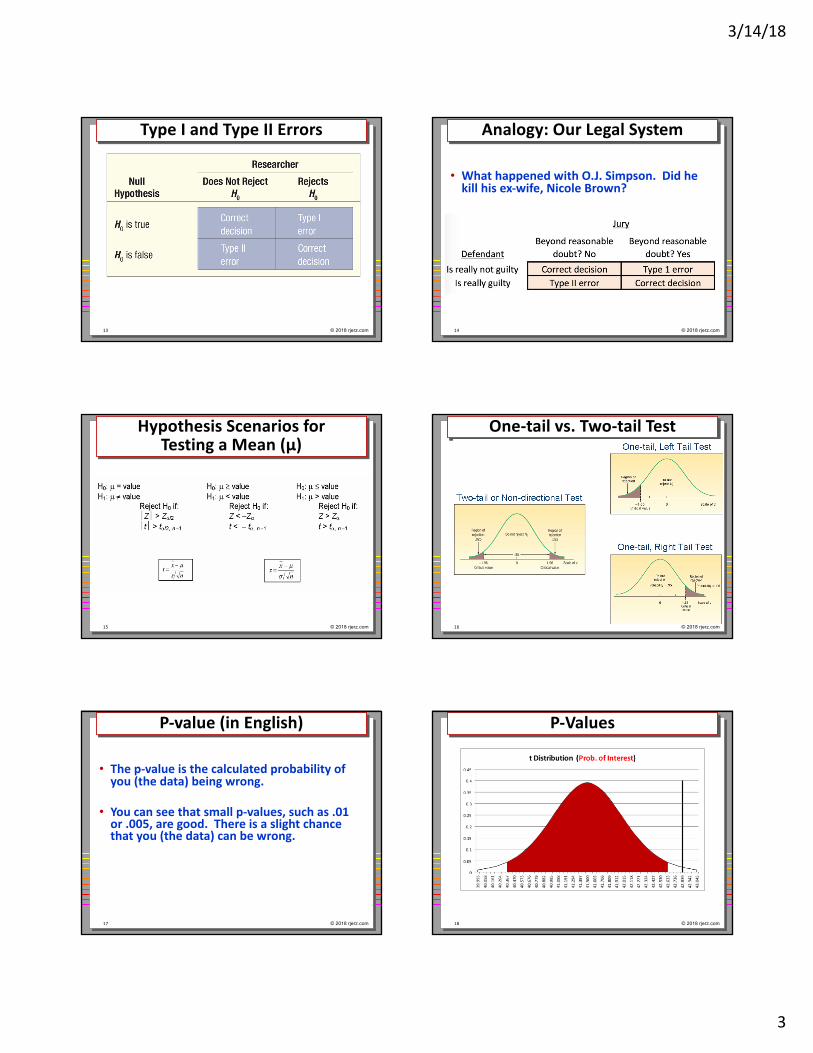
P-value (in English)
• The p-value is the calculated probability of you (the data) being wrong.
• You can see that small p-values, such as .01 or .005, are good. There is a slight chance that you (the data) can be wrong.
© 2018 rjerz.com17
P-Values
© 2018 rjerz.com18
3/14/18
4
P-value Interpretation
• I am willing to be wrong by rejecting the null hypothesis only 5% of the time, meaning a 5% level of significance.
• Assume that the p-value calculates to be 1%, meaning that I would be wrong by rejecting the null hypothesis only 1% of the time.
• Since the p-value is less than our level of significance, we reject the null hypothesis.
• If the p-value calculates to be greater than our level of significance, such as 22%, we would be wrong rejecting the null 22% of the time, but we only want to be wrong 5% of the time, so we do not reject the null.
© 2018 rjerz.com19
Interpreting the p-value
• .10, we have some evidence that H0 is not true.
• .05, we have strong evidence that H0 is not true.
• .01, we have very strong evidence that H0 is not true.
• .001, we have extremely strong evidence that H0 is not true.
• Remember that a small p-value only “suggests” that you won’t be wrong. Randomness of samples can still make you wrong.
© 2018 rjerz.com20
p-value Approach(from textbook)
“In recent years, spurred by the availability of computer software, additional information is often reported on the strength of the rejection or acceptance. This approach reports the probability of getting a value of the test statistic at least as extreme as the value actually obtained. This process compares the probability, called the p-value, with the significance level. If the p-value is smaller than the significance level, H0 is rejected. If it is larger than the significance level, H0 is not rejected.”
© 2018 rjerz.com21
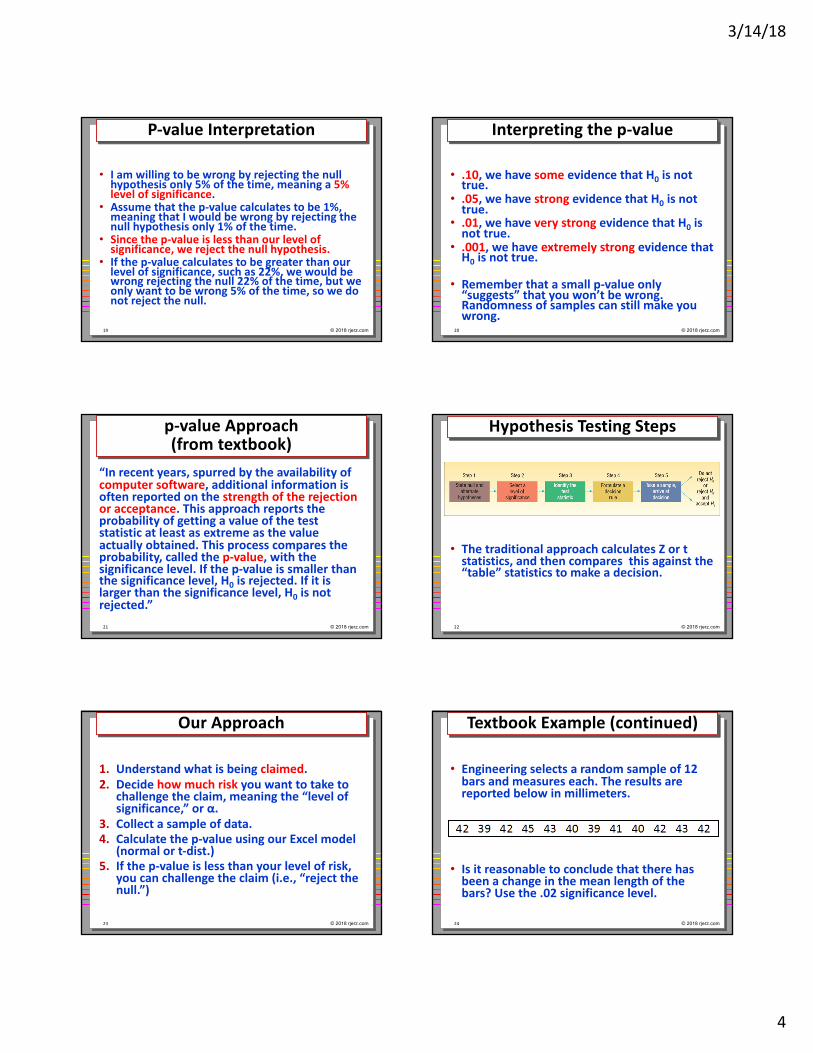
Hypothesis Testing Steps
• The traditional approach calculates Z or t statistics, and then compares this against the “table” statistics to make a decision.
© 2018 rjerz.com22
Our Approach
1. Understand what is being claimed.2. Decide how much risk you want to take to
challenge the claim, meaning the “level of significance,” or α.
3. Collect a sample of data.4. Calculate the p-value using our Excel model
(normal or t-dist.)5. If the p-value is less than your level of risk,
you can challenge the claim (i.e., “reject the null.”)
© 2018 rjerz.com23
Textbook Example (continued)
• Engineering selects a random sample of 12 bars and measures each. The results are reported below in millimeters.
• Is it reasonable to conclude that there has been a change in the mean length of the bars? Use the .02 significance level.
© 2018 rjerz.com24
3/14/18
5
Which distribution to use?
• Same as before:
• Do you know the population variance? Use the normal distribution.
• Do not know the population variance (i.e., only the sample data) use the t-distribution.
© 2018 rjerz.com25
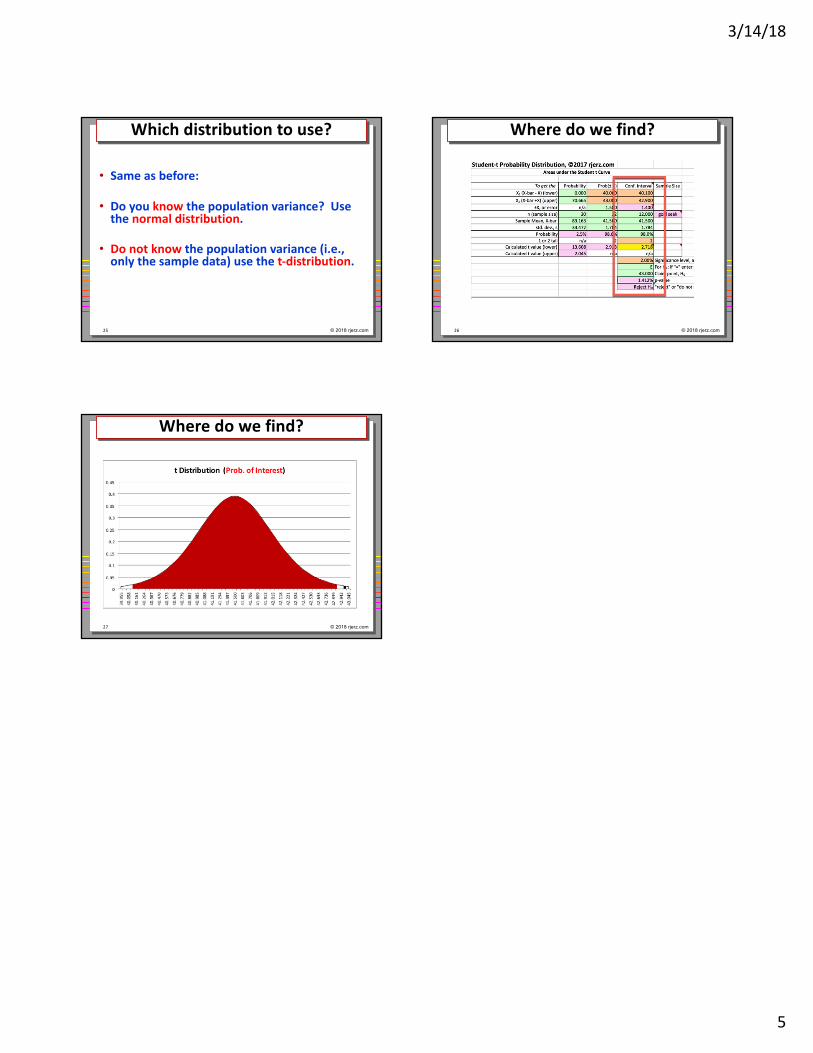
Where do we find?
© 2018 rjerz.com26
Where do we find?
© 2018 rjerz.com27