Embed Size (px)
Citation preview

CHALLENGES & OPPORTUNITIES IN CREATING ACCESSIBLE
POWER BI REPORTS
Meagan Longoria
March 24, 2018

About Me
■ Meagan Longoria
■ Microsoft Data Platform MVP
■ Solution Architect at BlueGranite
■ Blog: https://datasavvy.me
■ Twitter: @mmarie
■ LinkedIn: www.linkedin.com/in/meaganlongoria/

Most of us think about accessibility in data viz the wrong way
This report
design would be
GREAT if it
weren’t for the
users!
Art by Kendra Little

Change Your Mindset:Medical vs Social Model of Disability
Medical
■ Disability = Impairment
■ Impairment should be fixed via medical procedure and/or rehabilitation
■ In order for everyone to participate fully in society, everyone would need a non-disabled body and mind.
Social
■ Disability = societal barriers
■ Impairment does not inherently mean disability
■ In order for everyone to participate fully in society, society should change attitudes, and physical structures to accommodate those with impairments.

Change Your Mindset: Universal Design
Design and composition of an environment so that it can be accessed,
understood and used to the greatest extent possible by all people
regardless of their age, size, ability or disability
■ An approach and process that seeks to make a more inclusive
product
■ Benefits more than just disabled users
■ Does not expect that 100% universal solution will be achieved

Change Your Mindset: Graceful Degradation vs Progressive Enhancement
Graceful Degradation
Build for the most advanced/able user. Allow other users to have a downgraded experience.
>
Progressive Enhancement
Build so that all users can perform baseline functions. Add extra functionality for more advanced/able users.
<

Accessibility and Usability Go Hand in Hand
■ Usability: effectiveness, efficiency and satisfaction with which
specified users achieve specified goals
■ Accessibility: an attribute through which people with disabilities can
perceive, understand, navigate, and interact with the application
Usability
Accessibility

A FIRST LOOK AT POWER BI
ACCESSIBILITY FEATURES

STANDARDS & COMPLIANCE

Accessibility Laws: Section 508 of the Rehabilitation Act
■ Requires access for both members of the public and federal employees to technologies when developed, procured, maintained, or used by federal agencies
– Many state agencies adhere to 508 standards as well!
■ When compliance imposes an undue burden, agencies shall provide individuals with disabilities with the information and data involved by an alternative means of access
– You can always make an Excel file/Word doc, but then you have to
maintain two versions.

508 StandardsSample of Relevant Guidelines
■ Must work with a keyboard
■ Results of actions must be discerned textually
■ Color coding shall not be the only means of conveying information
■ When images are used to identify controls or status indicators, they must be consistent throughout the application
■ When animation is displayed, information shall be displayable in at least one non-animated format
■ At least one mode of operation that does not require visual acuity greater than 20/70 shall be provided, or support for assistive technology
■ Product support documentation provided to end-users shall be made available in alternate formats upon request

Accessibility Standards: WCAG 2.0Web Content Accessibility Guidelines
■ 4 principles:
– Perceivable
– Operable
– Understandable
– Robust
■ Guidelines and sufficient techniques
■ Levels A , AA, and AAA

WCAG 2.0Sample of Relevant Guidelines■ Non-text content has a text alternative (A)
■ Color is not used as the only visual means of conveying information or distinguishing a visual element. (A)
■ All functionality of the content is operable through a keyboard interface without requiring specific timings for individual keystrokes (A)
■ A mechanism is available to allow the purpose of each link to be identified from link text alone (A)
■ Text is used to convey information rather than images of text (AA)
■ Components that have the same functionality within a set of Web pages are identified consistently (AA)
■ The visual presentation of text and images of text has a contrast ratio of at least 4.5:1 (AA)
■ The visual presentation of text and images of text has a contrast ratio of at least 7:1 (AAA)
■ A mechanism is available for identifying specific definitions of words or phrases used in an unusual or restricted way, including idioms and jargon (AAA)

Areas of Accessibility
VisualMotor CognitiveHearing

HearingAccommodates presbycusis, acoustic trauma, auditory processing disorder, and otosclerosis, etc.
■ Audio should not auto-play and should allow the user to easily start and stop it
■ Video should be captioned or have a transcript
■ Audio should have a transcript
■ Shortcuts:
– Google Docs voice transcriptions (free)
– YouTube auto-captions (free)
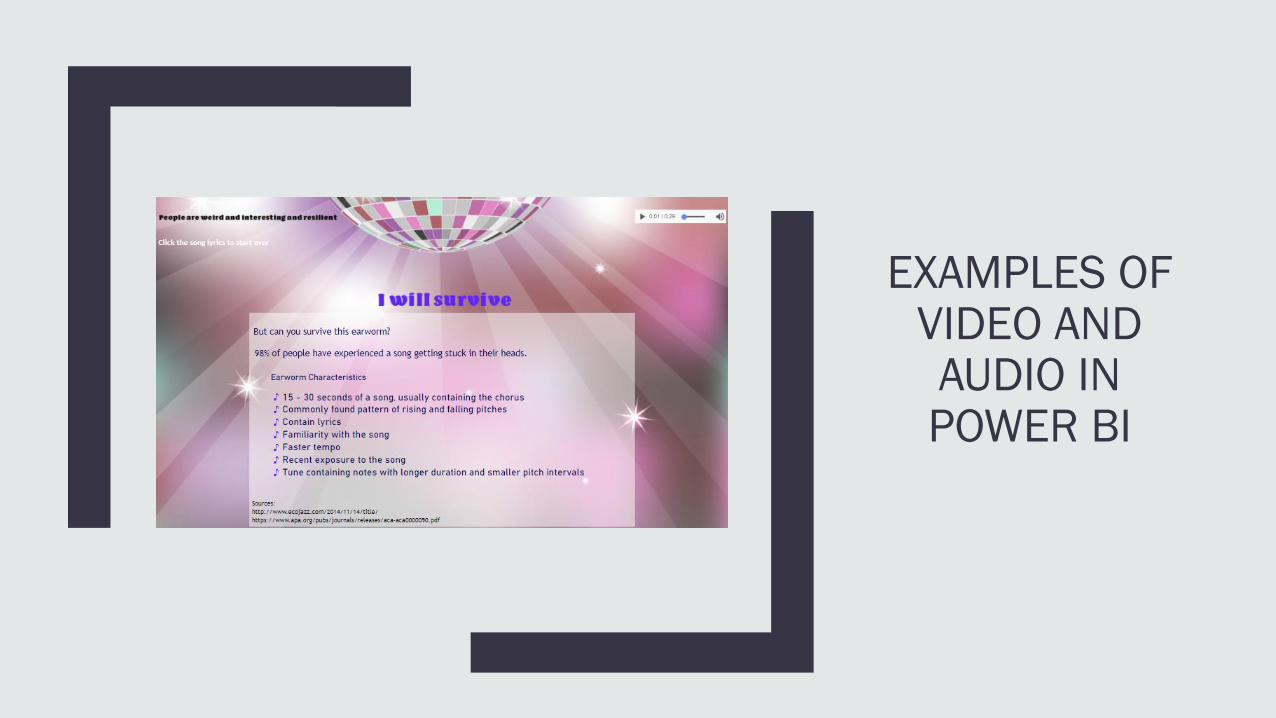
EXAMPLES OF VIDEO AND AUDIO IN POWER BI
CognitiveAccommodates Down’s syndrome, autism, dyslexia, dementia, etc.
■ These users need minimized distractions and simple, consistent user interfaces
■ Tips:
– Use clear, easy to read typeface
– Keep navigation elements consistent
– Minimize/eliminate movement
– Avoid the Play Axis
– Avoid unnecessarily complex language, jargon, or acronyms
– Beware overly complicated graphs

EXAMPLES OF EXCESSIVE COGNITIVE
LOAD

MotorAccommodates RSI, cerebral palsy, Parkinson’s, muscular dystrophy, etc.
■ These users may not use a mouse
■ Tips:
– Make sure important information is keyboard accessible
– Don’t place clickable elements too close together
– Don’t rely on tooltips to convey key information
– Beware of custom visuals that have moving elements

EXAMPLES OF A KEYBOARD
UNFRIENDLY REPORT

VisualAccommodates Color Vision Deficiency, Low Vision, Blindness
■ Important design attributes:
– Size
– Contrast
– Color
■ Power BI features:
– Alt text
– Markers on line and area charts
– Chart titles
– In-focus mode
– Accessible Show Data table
– Report themes
– Keyboard shortcuts
Tips for Visual AccessibilityAccommodates Color Vision Deficiency, Low Vision, Blindness
■ Don’t rely on color as the only indicator
■ Populate alt text for all non-decorative visuals
■ Avoid auto-playing video/audio
■ Beware the Play Axis
■ W3C recommends 18pt font or 14pt bold
■ Sans serif, wider stroke fonts are easiest to read
■ Pay attention to contrast between foreground and background

Testing Visual Accessibility
■ Keyboard Navigation
■ Mobile Device with Brightness on Low
■ Color Vision Deficiency
– Coblis http://www.color-blindness.com/coblis-color-blindness-simulator/
– Vischeck http://www.vischeck.com/vischeck/vischeckImage.php
■ Color Contrast
– WebAIM https://webaim.org/resources/contrastchecker/
– Accessible Colors http://accessible-colors.com/
■ Blur Tool
– The Squint Test https://chrome.google.com/webstore/detail/the-squint-
test/gppnipfbappicilfniaimcnagbpfflpg

SCREEN READER FRIENDLY REPORT

Power BI Accessibility Issues As of March 2018
■ Interactivity, bookmarks, and links are not keyboard accessible
■ Tab Order
■ Alt text is static
■ Pages don’t have names when viewed via Publish to Web
The Big Question:
Given the limitations, when do you decide to create an alternate version?

Accessibility Is Usability
■ Visual:
– Size
– Contrast
– Alt text
– Chart Titles
– Legible fonts
■ Cognitive
– Clear, easy to read typeface
– Consistent navigation elements
– Minimize element movement
– Avoid complex language or jargon
– Avoid overly complicated graphs
Preattentive
Attributes
Affordances
Cognitive Load

Accessibility Makes Business Sense
■ It’s expensive to maintain two versions
■ It’s more expensive to retrofit
■ Many accessibility standards enhance basic usability, which increases
adoption

Parting Thought
What if we build with inclusiveness in mind and
someone with an impairment is able to do their
job because of that?

Resources For Further Learning
■ A simple introduction to web accessibility: https://www.creativebloq.com/netmag/simple-introduction-web-accessibility-7116888
■ The A11y Project – resources: https://a11yproject.com/resources
■ Section 508 standards: https://www.access-board.gov/guidelines-and-standards/communications-and-it/about-the-section-508-standards/section-508-standards
■ Accessibility on DataSavvy.Me: https://datasavvy.me/category/accessibility/
■ Improving screen reader accessibility in Power BI reports: https://www.blue-granite.com/blog/improving-screen-reader-accessibility-in-power-bi-reports
■ How to meet WCAG 2.0: https://www.w3.org/WAI/WCAG20/quickref/?showtechniques=121
■ Accessible Colors: http://accessible-colors.com/
■ Colors A11y Stats: http://clrs.cc/a11y/
■ Incl.ca archives (Nicolas Steenhout): https://incl.ca/archives/
■ Your Interactive Makes Me Sick: https://source.opennews.org/articles/motion-sick/

Meagan Longoria
@mmarie
DataSavvy.Me
Questions & Comments