Embed Size (px)
Citation preview
Challenges to Labour Market Governance in Selected CIS Countries
Ellen Hansen, Alena Nesporova, Georg Picot and Ludek Rychly
Background paper prepared for the High-Level Tripartite Seminar on Labour Administration and Public Employment Services
Cyprus, 17-18 October1
Executive summary There are some large differences of GDP per capita between the countries participating in the seminar, with Kazakhstan on the high end and Tajikistan on the low end. Nevertheless, most countries are in the range of 3,000 to 5,500 US$. Services and industry are generally the biggest sectors in terms of economic output. Services are mainly on a small-scale basis. In industry, production of raw materials and goods with low degrees of processing dominate. Informal activities make up a large part of the economies concerned. While agriculture is overall the smallest sector in terms of output it is the biggest sector in terms of employment. In contrast, industry has a much lower share in employment than its share in output. Unemployment, as recorded by labour force surveys, is in the order of 10% for most countries where this data is available. In practice many people without a regular job resort to agricultural or informal activities. Long-term unemployment and youth unemployment give cause for concern. High poverty levels lead, in countries concerned, to large labour migration outflows. Labour ministries are the centre of elaborating, implementing and monitoring national labour policy. All labour ministries in the region have competencies for labour legislation, employment policy, social protection, wage policy, and employment service administration. Equal opportunities and migration are not covered by all. Ideally, labour administration should be integrated into a coordinated national economic and social policy. In the region, the necessary interministerial cooperation is mainly based on government programmes and strategies. Most labour ministries have their own research facilities to help basing policies on sound evidence. Public information about ministry structures and activities can in some cases still be improved. While all ministries can offer employees advantages in terms of employment conditions, low wage levels mean that recruiting high-qualified staff is a common problem. Labour ministries also have the main responsibility for ensuring participation of social partners in policy making. Consultation of employers’ and workers’ organizations is widespread in the countries of the region. Not all countries have an effective national tripartite council. In the last decades the role of many Public Employment Services (PES) worldwide has shifted from being mainly a job broker to being the chief executor of labour market policy. In line with this, the participating countries indicated on the ILO questionnaire that their PES carry out labour exchange as well as distribution of labour market information, labour market programmes, and administration of unemployment benefits. In most countries PES are administered either only by the labour ministry or by the ministry and a separate administrative agency. Some countries fund their PES through the general budget and some
1 The seminar held with kind support from the Cypriot and Greek Ministries of Labour and Social Protection.
1

through a separate fund. In general, international experience shows that PES should increasingly be seen as a flexible instrument of national economic and social development. Promoting productive and freely chosen employment for everyone requires, next to economic measures, labour market policies that assist those without jobs. All countries, except Kazakhstan, have unemployment benefit systems. But coverage and benefit levels are generally low. All countries are also running active labour market programmes. Public works and training are the first and second most widespread programmes respectively. In international experience, public works have often been critically assessed as to their low re-employment impact but appreciated for their important economic and social benefits for the community. With regard to large skill mismatches, the offer of training is very low.
2

Structure of the paper:
1. Economic and labour market situation ...................................................................... 4 1.1 The economic basis ................................................................................................ 4 1.2 Labour market challenges ...................................................................................... 9
2. Good governance: a challenge for labour administration ...................................... 14 2.1 Importance of good governance of labour issues and ILO Standards.................. 14 2.2 Labour administration and national labour policy ............................................... 15 2.3 Evidence-based policy.......................................................................................... 16 2.4 Structure and staff ................................................................................................ 17 2.5 Promotion of social dialogue................................................................................ 18
3. The role of Public Employment Services ................................................................. 21 3.1 ILO perspective on PES ....................................................................................... 21 3.2 Scope and functions of PES ................................................................................. 22 3.3 International trends in PES administration........................................................... 24 3.4 The Role of Private Employment Agencies in labour market management ........ 25
4. Labour market policies .............................................................................................. 26 4.1 International labour standards on employment policy ......................................... 26 4.2 Labour market policies......................................................................................... 27 4.3 Unemployment benefit schemes .......................................................................... 28 4.4 Active labour market policies .............................................................................. 29
Annexes ............................................................................................................................... 33
3
This paper sets out the relevant background information for the seminar on labour administration and public employment services in Central Asia and the Caucasus. It addresses the economic and labour market situation of the participating countries (1.), the functioning of labour ministries and the role of social dialogue in labour market governance (2.), the public employment services (3.), and labour market policy (4.). Emphasis of the paper lies on prevalent tasks and current problems of labour market governance. To put the Caucasian and Central Asian experiences of labour market governance into context, the paper refers to the relevant ILO Conventions as well as to examples and experiences from other countries.
1. Economic and labour market situation This section first gives an overview of the basic economic indicators (1.1.). This will serve as a background for focussing on labour market issues (1.2.).
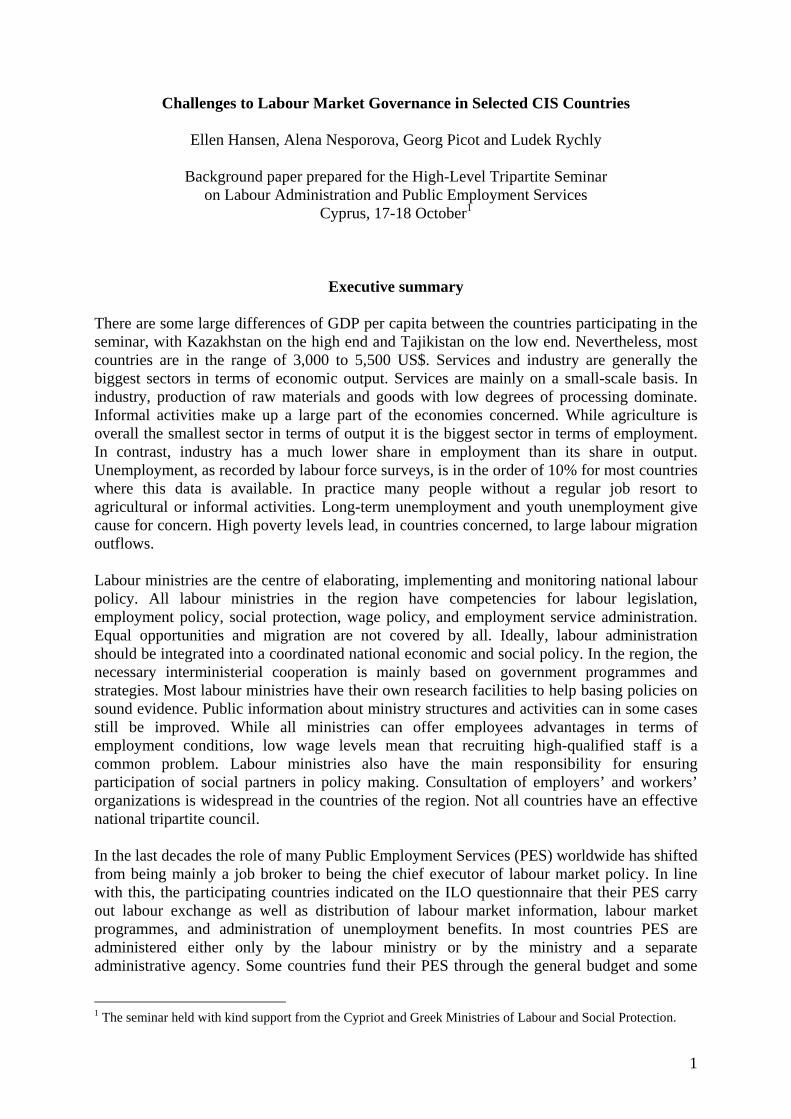
1.1 The economic basis Among the seven countries from Central Asia and the Caucasus that are presented here Kazakhstan visibly has the largest economy, with a gross domestic output of 148.1 billion US$ in 2004. It is followed by Uzbekistan with 81.9 billion US$. The other national economies range between 11.7 billion US$ (Tajikistan) and 36.2 billion US$ (Azerbaijan) (see Figure 1). Figure 12:
GDP 2004
148,112
81,896
36,23
28,343
21,813
17,241
17,102
11,677
0 20 40 60 80 100 120 140 160
Kazakhstan
Uzbekistan
Azerbaijan
Turkmenistan
Georgia
Armenia
Kyrgyzstan
Tajikistan
bn US$ (PPPs)
Source: UNECE 2 Turkmenistan is included in the figures wherever data is available. This country will not be discussed in any
more detail though, as it does not take part in the seminar.
4

In terms of population Uzbekistan is by far the biggest country in the region, having a population of 26.1 millions (source: UNECE). The second largest population is found in Kazakhstan (15.0 millions). Most others are a fair bit smaller, ranging from 8.3 million (Azerbaijan) to 3.2 million inhabitants (Armenia). Taking into account population numbers, Kazakhstan had significantly the biggest GDP per capita in 2004 (9878 US$). All others are either close to half or below half of this amount; the least wealthy country being Tajikistan with a GDP per capita of 1741 US$ (see figure 2). Figure 2:
GDP per capita (2004)
1741
3140
3377
4366
4816
5366
5621
9878
0 2000 4000 6000 8000 10000 12000
Tajikistan
Uzbekistan
Kyrgyzstan
Azerbaijan
Georgia
Armenia
Turkmenistan
Kazakhstan
US$ (PPPs)
Source: UNECE All seven countries suffered from serious declines in GDP after the collapse of the Soviet Union. Before independence they had been integrated into the USSR economy. So independence cut national economies out of an established chain of production. It also implied loss of USSR subsidies. Four countries, Azerbaijan, Armenia, Georgia and Tajikistan, were additionally troubled by violent conflicts. Thus in 1992 decline rates in some countries were as low as -44.9% in Georgia, -41.8% in Armenia and -32.3% in Tajikistan (see figure 3)3. In the second half of the nineties economies began to recover. Armenia in 1994 was the first one to return to growth, followed by Georgia in 1995 and most others in 1996. In Tajikistan economic contraction persisted because of the civil war, only in 1997 it registered growth again at a modest rate of 1.7%. In 1998 the
3 A note of caution on GDP decline numbers in transition economies: Branko Milanovic writes that pre-
transition levels probably were overstated because of incentives to report overfulfillment of planned targets. Furthermore he stresses that post-change GDP numbers do not reflect the informal economy, the importance of which has risen in transition economies. Still, he leaves no doubt about significant declines in aggregate incomes (Milanovic, Branko 1998: Income, Inequality, and Poverty during the Transition from Planned to Market Economy, Washington DC, pp. 30ff.).
5

Russian financial crisis had some negative impact on growth in Kazakhstan, Kyrgyzstan, Georgia and to a lesser extent Uzbekistan. Since then, apart from a stagnation in Kyrgyzstan in 2002, all countries stuck to growth with some rates as high as 15.1% in Armenia in 2002. For 2005 the United Nations Economic Commission for Europe (UNECE) currently estimates growth rates between 4% for Kyrgyzstan and 14% in Azerbaijan.
6

Figure 3:
GDP growth rate (%, PPPs and prices of 2000)
-50
-40
-30
-20
-10
0
10
20
1991 1992 1993 1994 1995 1996 1997 1998 1999 2000 2001 2002 2003 2004 2005
ArmeniaAzerbaijanGeorgiaKazakhstanKyrgyzstanTajikistanTurkmenistanUzbekistan
Source: UNECE
7
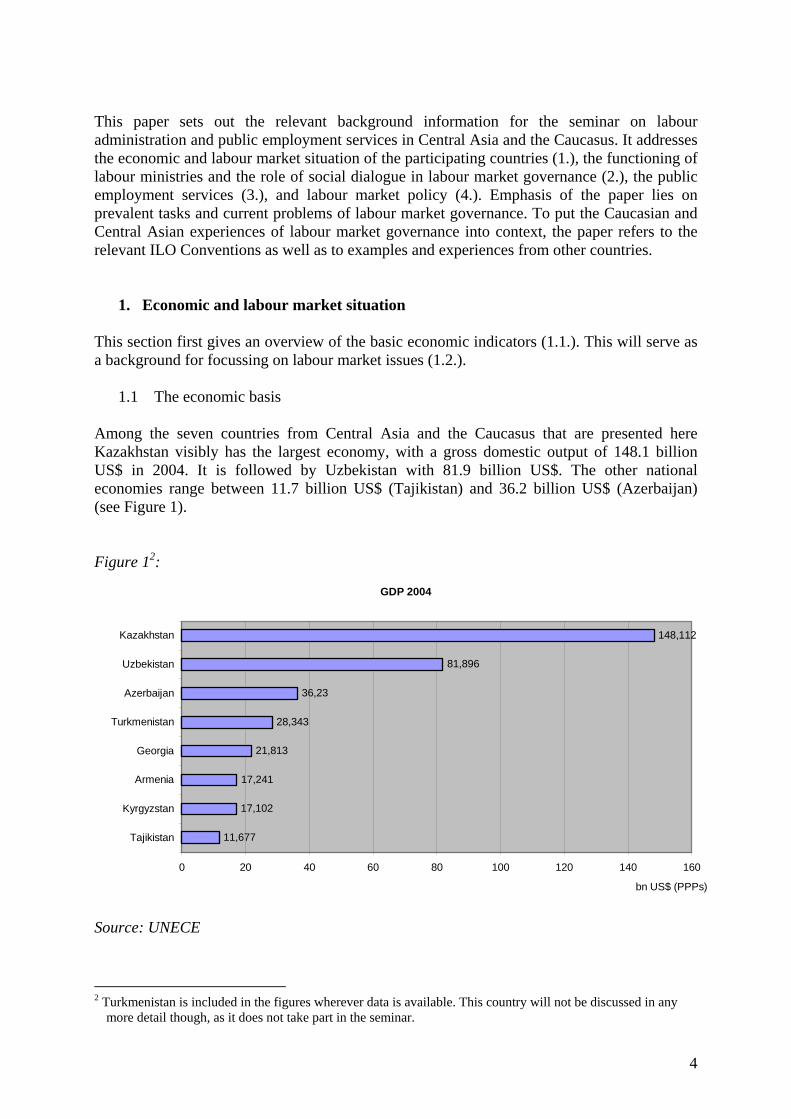
Did economic growth in the last years make up for the sharp declines after independence? According to UNECE data, by 2004 only Armenia, Kazakhstan and Uzbekistan have regained or surpassed their GDP levels of 1990. Azerbaijan is projected to get there in 2005. Concerning economic structures there is a significant difference that distinguishes the oil and gas rich countries Kazakhstan, Azerbaijan (and Turkmenistan) from the others. These hydrocarbon rich countries have attracted considerable amounts of foreign investment that pushed the industrial sector forward, with some spillover effects to services. The extracting sector therefore economically dominates in these countries. This can be seen in particular in Azerbaijan where 30.3% of gross value added came from this sector in 2004.4 In the industrial sectors of the not hydrocarbon rich countries there is usually also a small set of prevalent activities, such as gold mining in Kyrgyzstan and Uzbekistan, aluminium production in Tajikistan, and diamond processing in Armenia.5 So overall, production of raw materials and goods with low degrees processing is at the centre of the industrial sector in the region.6 The dynamic of the oil and gas sector reduces the relative importance of agriculture in the countries with large amounts of these resources (see figure 4). All other countries have a larger share of agriculture in value added. It is highest in Kyrgyzstan with 36.7%. In Uzbekistan and Tajikistan cotton is an important agricultural product for the economy as a whole. Figure 4:
Economic sectors' share in gross value added (2003)
23,4 13,4 20,4 8,336,7 28,1
38 52,3 25,4 37
22,1 33,7
38,6 34,454,2 54,7 41,2 38,2
0%10%20%30%40%50%60%70%80%90%
100%
Armen
ia
Azerba
ijan
Georgi
a
Kazak
hstan
Kyrgyz
stan
Tajikis
tan
ServicesIndustryAgriculture
Source: UNECE (data not available for Uzbekistan and Turkmenistan) Note: Industry includes energy and construction. Agriculture includes forestry, fishing and hunting.
4 Source: UNECE. This share includes quarrying and mining activities. 5 Economist Intelligence Unit (EIU): Country Profiles (CPs) for various countries and years, London. 6 Cf. Loukoianova, Elena and Unigovskaya, Anna 2004: Analysis of Recent Growth in Low-Income CIS
Countries, IMF Working Paper 04/151, Washington DC.
8
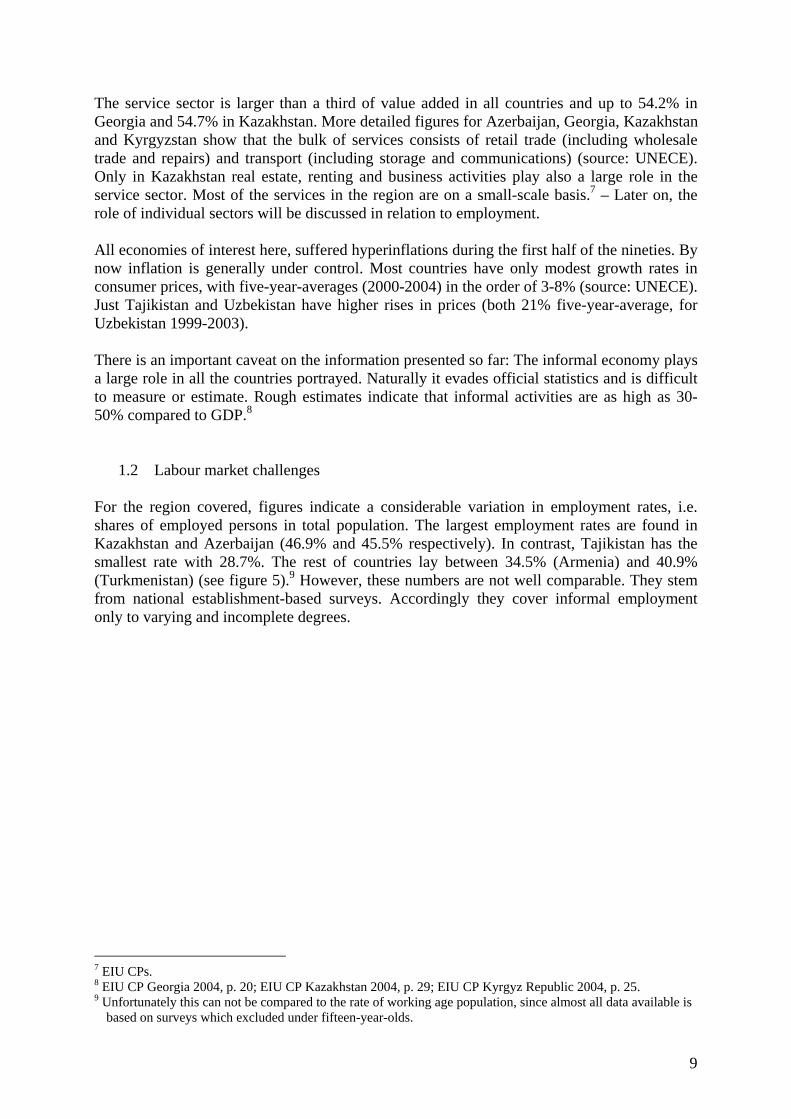
The service sector is larger than a third of value added in all countries and up to 54.2% in Georgia and 54.7% in Kazakhstan. More detailed figures for Azerbaijan, Georgia, Kazakhstan and Kyrgyzstan show that the bulk of services consists of retail trade (including wholesale trade and repairs) and transport (including storage and communications) (source: UNECE). Only in Kazakhstan real estate, renting and business activities play also a large role in the service sector. Most of the services in the region are on a small-scale basis.7 – Later on, the role of individual sectors will be discussed in relation to employment. All economies of interest here, suffered hyperinflations during the first half of the nineties. By now inflation is generally under control. Most countries have only modest growth rates in consumer prices, with five-year-averages (2000-2004) in the order of 3-8% (source: UNECE). Just Tajikistan and Uzbekistan have higher rises in prices (both 21% five-year-average, for Uzbekistan 1999-2003). There is an important caveat on the information presented so far: The informal economy plays a large role in all the countries portrayed. Naturally it evades official statistics and is difficult to measure or estimate. Rough estimates indicate that informal activities are as high as 30-50% compared to GDP.8
1.2 Labour market challenges For the region covered, figures indicate a considerable variation in employment rates, i.e. shares of employed persons in total population. The largest employment rates are found in Kazakhstan and Azerbaijan (46.9% and 45.5% respectively). In contrast, Tajikistan has the smallest rate with 28.7%. The rest of countries lay between 34.5% (Armenia) and 40.9% (Turkmenistan) (see figure 5).9 However, these numbers are not well comparable. They stem from national establishment-based surveys. Accordingly they cover informal employment only to varying and incomplete degrees.
7 EIU CPs. 8 EIU CP Georgia 2004, p. 20; EIU CP Kazakhstan 2004, p. 29; EIU CP Kyrgyz Republic 2004, p. 25. 9 Unfortunately this can not be compared to the rate of working age population, since almost all data available is
based on surveys which excluded under fifteen-year-olds.
9

Figure 5:
Employment rate (employed/population 2003)
28,7
34,5
36,4
37,3
39,8
40,9
45,5
46,9
0 5 10 15 20 25 30 35 40 45 50
Tajikistan
Armenia
Kyrgyzstan
Uzbekistan
Georgia
Turkmenistan
Azerbaijan
Kazakhstan
%
Source: UNECE UNECE figures on employment growth show that employment has taken a different course than economic output. Most countries did not register employment decline as steep as economic contraction. This was partly due to so called labour hoarding: many firms did not lay off their workers officially, although they were not able to pay wages.10 Since 2000 most countries stabilized their employment growth rates at a modest level. In 2003 most had rates between 0.1% and 2.8%. Taking a look at the employment-intensity of economic sectors reveals a striking aspect of the Caucasian and Central Asian labour markets. The share in total value added of sectors differs strongly from their share in total employment. This is particularly true for agriculture. In all countries for which differentiated output figures were available, except Kyrgyzstan, agriculture is the smallest sector compared to industry and services. In contrast, agriculture has the biggest share in employment in all countries, except Azerbaijan, where the difference is not huge, and except Kazakhstan, where we do not have comparable figures. In Georgia and Kyrgyzstan more than half of all employed work in agriculture. The smallest comparable figure of the proportion of agriculture in employment is 40% (Azerbaijan).11 Several reports indicate that these numbers reflect agriculture’s role as a refuge for unemployed. Many jobless turn to agriculture and often subsistence farming to secure their living.12
10 Torm, Nina 2003: The Nexus of Economic Growth, Employment and Poverty during Economic Transition: An
Analysis of Armenia, Kazakhstan, Kyrgyzstan, Moldova, Tajikistan and Uzbekistan, Issues in Employment and Poverty: Discussion Paper No. 13, Geneva, October 2003, p. 18.
11 Again, it has to be mentioned that this data should be treated cautiously. Numbers stem from different sources (household surveys and official estimates) and can not be assumed to account adequately for informal employment.
12 Loukoianova/Unigovskaya 2004, pp. 16f.; EIU CP Kyrgyz Republic 2004, pp. 28f.; EIU CP Georgia 2004, pp. 25f..
10
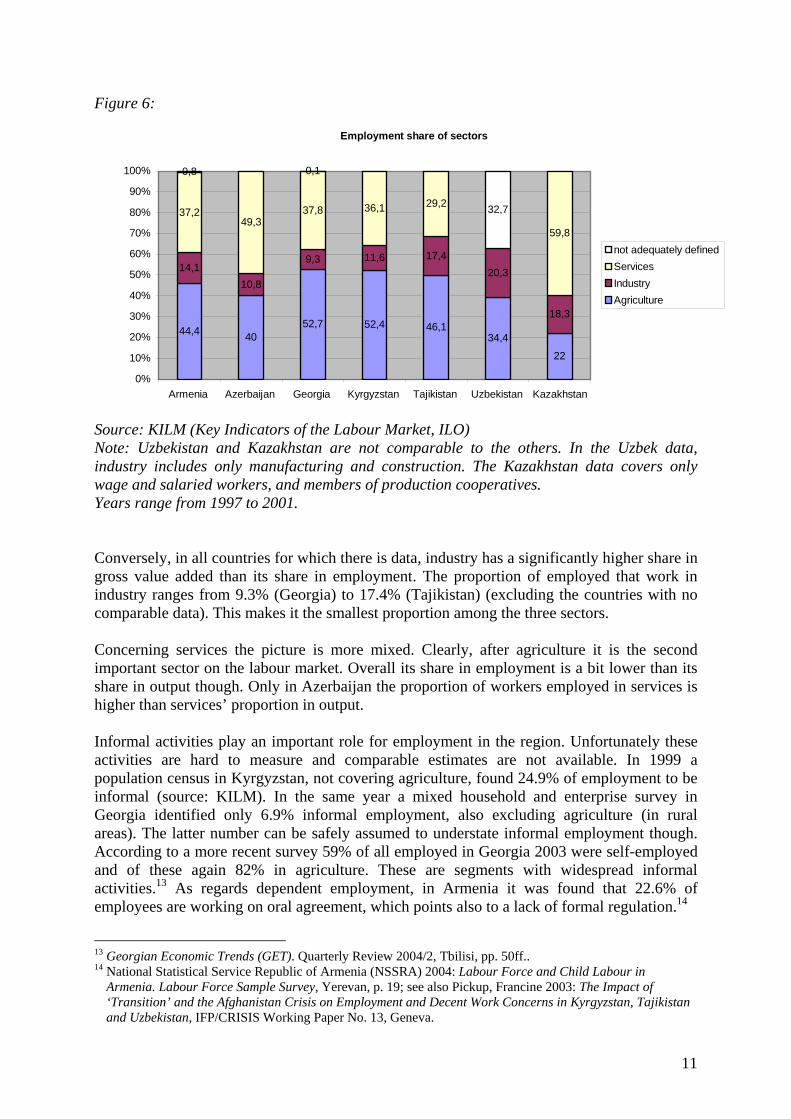
Figure 6:
Employment share of sectors
44,4 4052,7 52,4 46,1
34,4
22
14,110,8
9,3 11,6 17,420,3
18,3
37,249,3
37,8 36,1 29,2
59,8
0,8 0,1
32,7
0%
10%
20%
30%
40%
50%
60%
70%
80%
90%
100%
Armenia Azerbaijan Georgia Kyrgyzstan Tajikistan Uzbekistan Kazakhstan
not adequately definedServices Industry Agriculture
Source: KILM (Key Indicators of the Labour Market, ILO) Note: Uzbekistan and Kazakhstan are not comparable to the others. In the Uzbek data, industry includes only manufacturing and construction. The Kazakhstan data covers only wage and salaried workers, and members of production cooperatives. Years range from 1997 to 2001. Conversely, in all countries for which there is data, industry has a significantly higher share in gross value added than its share in employment. The proportion of employed that work in industry ranges from 9.3% (Georgia) to 17.4% (Tajikistan) (excluding the countries with no comparable data). This makes it the smallest proportion among the three sectors. Concerning services the picture is more mixed. Clearly, after agriculture it is the second important sector on the labour market. Overall its share in employment is a bit lower than its share in output though. Only in Azerbaijan the proportion of workers employed in services is higher than services’ proportion in output. Informal activities play an important role for employment in the region. Unfortunately these activities are hard to measure and comparable estimates are not available. In 1999 a population census in Kyrgyzstan, not covering agriculture, found 24.9% of employment to be informal (source: KILM). In the same year a mixed household and enterprise survey in Georgia identified only 6.9% informal employment, also excluding agriculture (in rural areas). The latter number can be safely assumed to understate informal employment though. According to a more recent survey 59% of all employed in Georgia 2003 were self-employed and of these again 82% in agriculture. These are segments with widespread informal activities.13 As regards dependent employment, in Armenia it was found that 22.6% of employees are working on oral agreement, which points also to a lack of formal regulation.14
13 Georgian Economic Trends (GET). Quarterly Review 2004/2, Tbilisi, pp. 50ff.. 14 National Statistical Service Republic of Armenia (NSSRA) 2004: Labour Force and Child Labour in
Armenia. Labour Force Sample Survey, Yerevan, p. 19; see also Pickup, Francine 2003: The Impact of ‘Transition’ and the Afghanistan Crisis on Employment and Decent Work Concerns in Kyrgyzstan, Tajikistan and Uzbekistan, IFP/CRISIS Working Paper No. 13, Geneva.
11

Registered unemployment in 2003 ranged between 0.2% of the labour force (Uzbekistan) and 2.5% (Georgia) in all countries except Armenia, which was at 9.8% (source: UNECE). But institutional incentives, such as unemployment benefits, to officially register as unemployed are often low in the countries concerned, just as not all unemployed are eligible to register.15 Therefore data from labour force surveys is more significant for depicting unemployment. But this is not equally available for all countries. In Armenia a labour force survey from 2004 found 31.6% of the working age population unemployed, 3.5 times more than the official unemployment rate.16 Azerbaijan, Georgia, Kazakhstan and Kyrgyzstan are the only other countries for which labour force survey data was available. The respective unemployment rates per labour force are:17
Azerbaijan 2003: 10.7% Georgia 2003: 10.7% Kazakhstan 2003: 8.8% Kyrgyzstan 2002: 12.5%
So on the official as well as on the survey count Armenia registers significantly higher unemployment.18 As already indicated above, unemployment numbers are mitigated by retreat of the unemployed into agricultural activities. This is reflected by large differences of urban and rural unemployment. Urban and rural unemployment rates can be contrasted as follows:
urban rural Armenia 2004 37.5% 18.1% Azerbaijan 2003 14% 7% Georgia 2003 22.1% 4.1%
People who drop out of the labour market for long periods lose their qualifications and find it particularly hard to get reintegrated. As far as numbers are available there is indication of a considerable share of long-term unemployment in the region. In Armenia 63.4% of unemployed persons were jobless for more than a year and in Azerbaijan 27.5%, while for Georgia long-term unemployment is also reported to be a significant problem.19 Furthermore in the Caucasian and Central Asian economies especially young people are threatened by unemployment. In Armenia, Azerbaijan, Kazakhstan and Kyrgyzstan the age group of 20-24, compared to the other age groups of 5 year range, has the highest share in unemployment: Armenia 19.7% (2003), Azerbaijan 30.8% (2003), Kazakhstan 17.6% (2003), Kyrgyzstan 16.6% (2002).20 In Georgia the group of 25-29 year-olds makes up the biggest
15 e.g. GET 2004, p. 49. 16 NSSRA 2004, p. 19. 17 Sources: State Statistical Committee of the Republic of Azerbaijan (SSCRA) 2004: Survey of the Economic
Activity of the Population of Azerbaijan: Methodology and Analysis of the Labour Market Situation, Baku; GET 2004; Laborsta.
18 There might be institutional reasons that keep jobless people in unemployment instead of resorting to survival strategies. Note, that Armenia has an additional financial assistance scheme for jobless beside unemployment benefits (see section 4.3.).
19 NSSRA 2004, SSCRA 2004, GET 2004. 20 NSSRA 2004, SSCRA 2004, Laborsta.
12
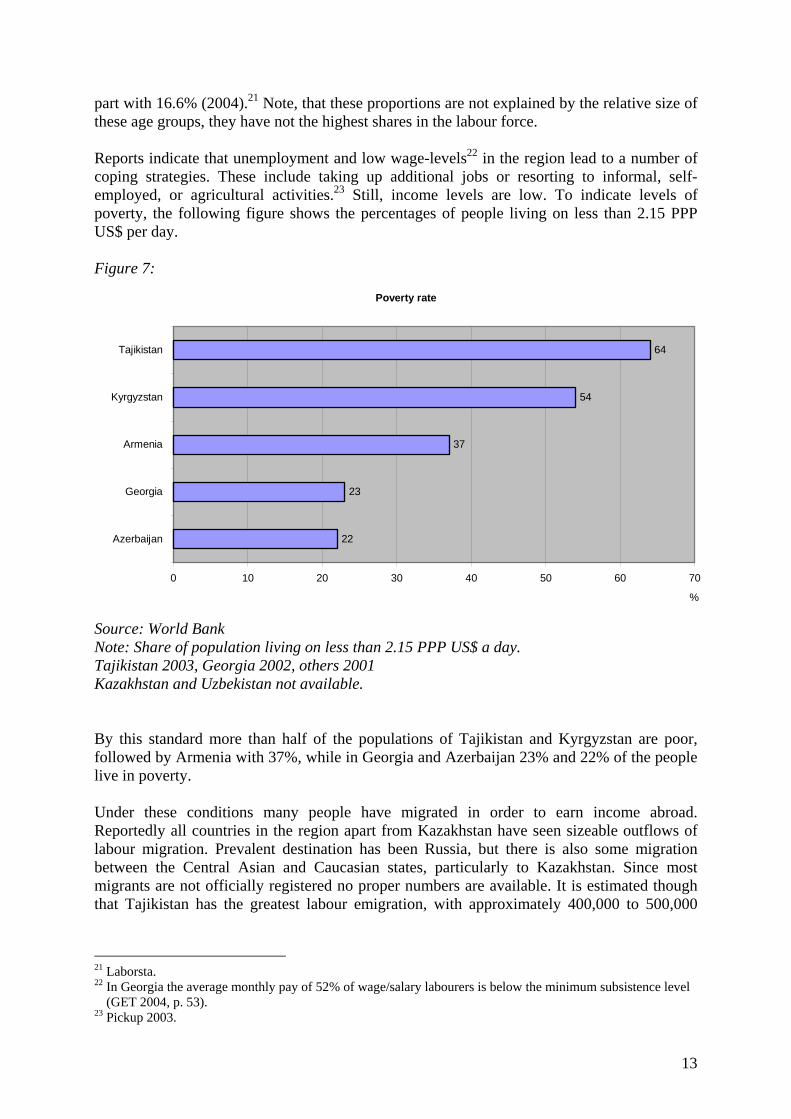
part with 16.6% (2004).21 Note, that these proportions are not explained by the relative size of these age groups, they have not the highest shares in the labour force. Reports indicate that unemployment and low wage-levels22 in the region lead to a number of coping strategies. These include taking up additional jobs or resorting to informal, self-employed, or agricultural activities.23 Still, income levels are low. To indicate levels of poverty, the following figure shows the percentages of people living on less than 2.15 PPP US$ per day. Figure 7:
Poverty rate
22
23
37
54
64
0 10 20 30 40 50 60 7
Azerbaijan
Georgia
Armenia
Kyrgyzstan
Tajikistan
%
0
Source: World Bank Note: Share of population living on less than 2.15 PPP US$ a day. Tajikistan 2003, Georgia 2002, others 2001 Kazakhstan and Uzbekistan not available. By this standard more than half of the populations of Tajikistan and Kyrgyzstan are poor, followed by Armenia with 37%, while in Georgia and Azerbaijan 23% and 22% of the people live in poverty. Under these conditions many people have migrated in order to earn income abroad. Reportedly all countries in the region apart from Kazakhstan have seen sizeable outflows of labour migration. Prevalent destination has been Russia, but there is also some migration between the Central Asian and Caucasian states, particularly to Kazakhstan. Since most migrants are not officially registered no proper numbers are available. It is estimated though that Tajikistan has the greatest labour emigration, with approximately 400,000 to 500,000
21 Laborsta. 22 In Georgia the average monthly pay of 52% of wage/salary labourers is below the minimum subsistence level
(GET 2004, p. 53). 23 Pickup 2003.
13
Tajiks working temporarily or permanently abroad.24 Aside from economic benefits, these migration flows also pose challenges to labour markets. In countries of origin they can lead to shortages of labour. In countries of destination immigrants often have an irregular residence status and are insufficiently protected by labour regulations.25 To conclude this section, it can be stated that employment creation is the dominant challenge to Central Asian and Caucasian labour markets. Not only unemployment and poverty, but also other issues, such as informal employment, high agricultural employment and labour migration, depend significantly on the creation of regular, decently paid jobs. Within the problem of unemployment, particular attention should be paid to the youth and the long-term unemployed.
2. Good governance: a challenge for labour administration
“We strongly believe in the fundamental importance of good governance in all countries at all levels of development for effective and equitable participation in the global economy. The basic principles, which we believe must guide globalization, are democracy, social equity, respect for human rights and the rule of law. These need to be reflected in institutions, rules and political systems within countries, and respected by all sectors of society.” (World Commission on the Social Dimension of Globalization)
2.1 Importance of good governance of labour issues and ILO Standards
There is no doubt that good governance in general, and good governance of labour issues in particular, have a substantial role in every modern society. This is particularly true for countries which are undertaking far-reaching economic and social reforms, when both the pace of policy decisions in the area of labour and social affairs and their sustainability may decisively influence the whole reform process. While ministries of labour have a pivotal role here, they also have the main responsibility for ensuring that the social partners have a place in policy-making and are recognized as key economic and social actors. From this point of view, social dialogue is an integral part of what is called “labour administration”. International experience with labour administration is embodied in the Labour Administration Convention, 1978 (No.150), and in the accompanying Labour Administration Recommendation, 1978 (No. 158). These standards provide general guidelines on labour administration and establish the general institutional framework needed for preparation, administration and evaluation of national labour policy. Their purpose is to equip member States with efficient administrative structures in this area. A member, which ratifies the Convention is required by Article 4, in a manner appropriate to national conditions, to ensure the organization and effective operation of a system of labour administration, the functions and responsibilities of which are properly coordinated. The Convention and Recommendation, remaining very flexible and adapted to national conditions, establish nevertheless some basic principles that are to be followed. 24 World Bank 2005: Republic of Tajikistan Poverty Assessment Update, Washington DC, p. 10. 25 Olimova, Saodat and Bosc, Igor 2003: Labour Migration from Tajikistan, Dushanbe; Pickup 2003; Oxford
Analytica 2005: Central Asia: Population flows may threaten stability, www.oxan.com.
14

Out of seven countries attending this seminar, only two (Kyrgyzstan and Armenia) ratified Convention No. 150, and these ratifications are very recent (2003 and 2005). This chapter is therefore focused on some basic principles of this Convention.
2.2 Labour administration and national labour policy While the term “labour administration“ is quite large and covers all public administration bodies responsible for and/or engaged in labour administration, in the vast majority of countries there are ministries of labour at the centre of the system and in most cases they carry out the bulk of the functions of the system. Thus the following paragraphs will deal mainly with the ministries of labour, while the next chapter of this paper concerns public employment services. The role of labour administration is to elaborate, implement, control and evaluate national labour policy, which should not be restricted just to employment and social policy. The classical functions of labour ministries include labour protection, employment, industrial relations and cooperation with employers’ and workers’ organizations. It is worth pointing out that certain aspects of national labour policy have become increasingly important in recent years, such as promotion of equality of opportunity and treatment in employment, training and skills upgrading, and management of migration trends. All labour ministries participating in this seminar display in their official names their responsibility for labour and social protection. The only notable exception is Georgia, where the health portfolio is included as a third responsibility. Ministry of Labour and Social Issues of the Republic of Armenia
Ministry of Labour and Social Protection of population of the Republic of Azerbaijan Ministry of Labour, Health and Social Affairs of Georgia Ministry of Labour and Social Protection of Population of the Republic of Kazakhstan Ministry of Labour and Social Protection of Kyrgyz Republic Ministry of Labour and Social Protection of Population of the Republic of Tajikistan From the competencies listed in the ILO questionnaire equal opportunities and migration (and possibly labour inspection) are the only competencies not covered by all ministries. Other competencies mentioned by some ministries are vocational training and social research.
labour legislation 6/6* employment policy 6/6 social protection 6/6 wage policy 6/6 equal opportunities 5/6 exception: Tajikistan Migration 4/6 exceptions: Armenia, Kyrgyzstan employment services administration 6/6 labour inspection administration 5/6 Tajikistan (option missing on questionn.) other areas 3/6 Tajikistan: vocational education
research in social affairs Kyrgyzstan: vocational training Azerbaijan: scientific provision of social policy development
* 6/6 means six countries out of six countries etc.
15

Under Article 6 of Convention No. 150, the competent bodies within the system of labour administration shall participate in the coordination of national employment policy. Since national employment policy must be integrated in the framework of a coordinated economic and social policy, coordination is provided either by a national body or by an interministerial commission responsible for the various components of the national policy in question. The survey question on interministerial bodies was not answered by all countries. Furthermore, answers varied strongly. This might have been due to different interpretation of the question.
- In Azerbaijan the labour ministry is represented in a State Committee for programmes on various social, employment and demographic issues.
- In Kyrgyzstan the ministry is member of a Coordination Council on HIV/AIDS,
tourism and education.
- In Kazakhstan it works together with other ministries and regional administrations within the framework of:
o Programme on employment o Strategy on development of the industrial sector o Programme on development of the construction sector
In all three programmes the Ministry of Industry and Trade and the Ministry of Education and Sciences (and others) are also involved. The Ministry of Labour’s part is to analyse labour demand and supply.
These replies seem to indicate that interministerial coordination takes place more in the context of programmes and strategies than on the basis of institutionalised bodies, which might create a problem.
2.3 Evidence-based policy Under the Labour Administration Convention, the competent bodies within the system of labour administration shall “study and keep under review the situation of employed, unemployed and underemployed persons”. As a general rule, the ministries of labour and other ministries which share with it certain responsibilities for labour and employment have a department or associated structures that study conditions of work and employment. The information they receive comes essentially from labour inspection services, employment services or social security institutions. Often they also work in liaison with universities or research institutes. Among the Central Asian and Caucasian countries almost all ministries of labour have their own research facilities (usually labour and social policy research institutes) and most cooperate with external public institutions. Only in Georgia the ministry does not have its own facility. And only the Georgian and the Kazakh labour ministries cooperate with private institutions (as well as public external ones).
16
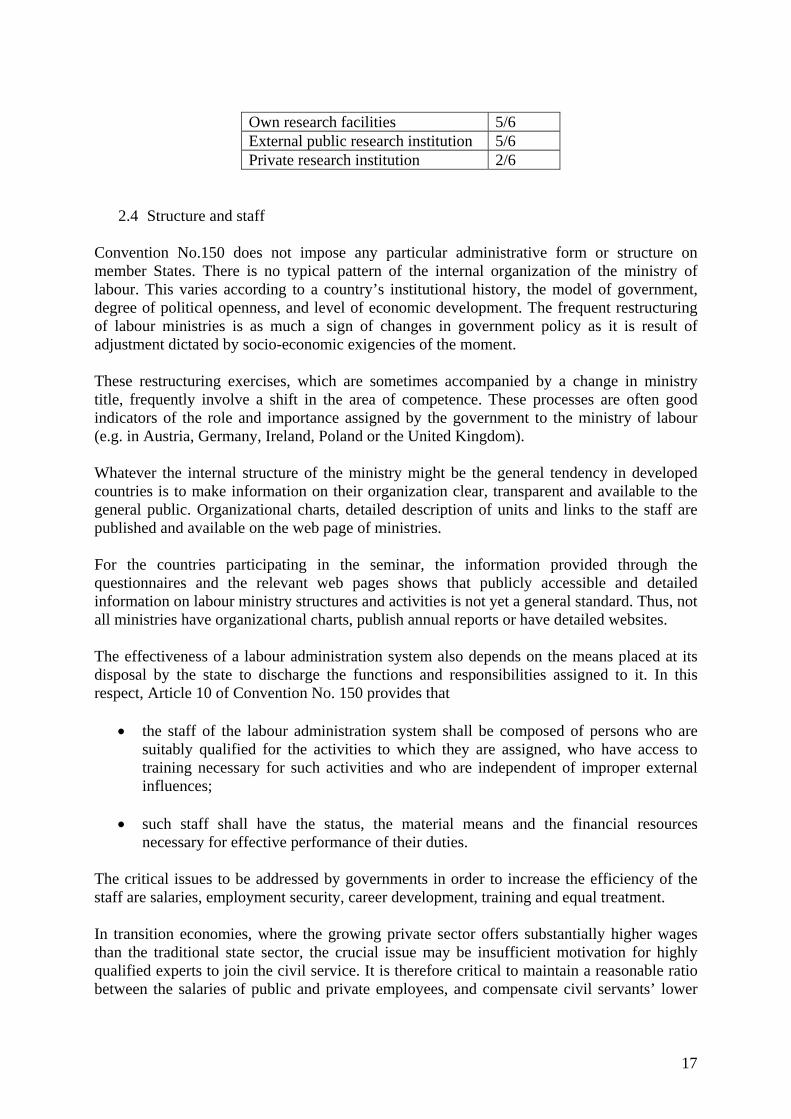
Own research facilities 5/6 External public research institution 5/6 Private research institution 2/6
2.4 Structure and staff Convention No.150 does not impose any particular administrative form or structure on member States. There is no typical pattern of the internal organization of the ministry of labour. This varies according to a country’s institutional history, the model of government, degree of political openness, and level of economic development. The frequent restructuring of labour ministries is as much a sign of changes in government policy as it is result of adjustment dictated by socio-economic exigencies of the moment. These restructuring exercises, which are sometimes accompanied by a change in ministry title, frequently involve a shift in the area of competence. These processes are often good indicators of the role and importance assigned by the government to the ministry of labour (e.g. in Austria, Germany, Ireland, Poland or the United Kingdom). Whatever the internal structure of the ministry might be the general tendency in developed countries is to make information on their organization clear, transparent and available to the general public. Organizational charts, detailed description of units and links to the staff are published and available on the web page of ministries. For the countries participating in the seminar, the information provided through the questionnaires and the relevant web pages shows that publicly accessible and detailed information on labour ministry structures and activities is not yet a general standard. Thus, not all ministries have organizational charts, publish annual reports or have detailed websites. The effectiveness of a labour administration system also depends on the means placed at its disposal by the state to discharge the functions and responsibilities assigned to it. In this respect, Article 10 of Convention No. 150 provides that
• the staff of the labour administration system shall be composed of persons who are suitably qualified for the activities to which they are assigned, who have access to training necessary for such activities and who are independent of improper external influences;
• such staff shall have the status, the material means and the financial resources
necessary for effective performance of their duties. The critical issues to be addressed by governments in order to increase the efficiency of the staff are salaries, employment security, career development, training and equal treatment. In transition economies, where the growing private sector offers substantially higher wages than the traditional state sector, the crucial issue may be insufficient motivation for highly qualified experts to join the civil service. It is therefore critical to maintain a reasonable ratio between the salaries of public and private employees, and compensate civil servants’ lower
17

salaries with other advantages, including incentives to increase the staff members’ qualifications. All countries answering the ILO questionnaire have specific legislation for civil servants. Only Georgia and Azerbaijan did not indicate that their staff is, in addition, governed by general labour legislation. This leads to varying ranges of advantages for civil servants, as can be seen from the table below.
higher salaries 2/5 job security 2/5 working hours 2/5 annual leave 4/5 pension entitlement 3/5 other 1/5
Note: No information from Kyrgyzstan on this question. Other: additional salaries paid on the occasion of annual leave (Kazakhstan). All countries stated that their labour ministry salaries are lower than in the private sector and the same as in other ministries. In Tajikistan only, labour ministry salaries are also lower than those in other ministries. Furthermore, all countries confirmed that the salary level is an obstacle to hiring highly qualified officials. At the same time most countries indicated that highly qualified experts are nevertheless interested in careers at the ministry. Therefore, other favourable conditions of employment apparently make civil service attractive, while low salaries are really the main cause of recruitment problems.
2.5 Promotion of social dialogue Convention No. 150 contains provisions on industrial relations, which are supplemented by Recommendation No. 158. The role played by labour administration in this area, with full respect for the autonomy of employers’ and workers’ organizations, is to promote tripartite cooperation. According to Convention No. 150, the competent bodies shall “make their services available to employers and workers, and their respective organizations […] with a view to the promotion – at national, regional and local levels as well as at the level of the different sectors of economic activity – of effective consultations and cooperation between public authorities and bodies and employers’ and workers’ organizations, as well as between such organizations” and, furthermore, “make technical advice available to employers and workers and their respective organizations at their request.” The Recommendation, dealing with the administration’s role of encouragement of effective labour relations, lists various means to achieve this goal, namely :
• the free exercise of the right to association, • the right to organize and to bargain collectively, • providing advisory services, • promoting the machinery of voluntary negotiation, • conciliation and mediation bodies.
18
The functions of labour administration in the area of industrial relations as well as in the other fields of activity can be performed effectively only in close cooperation with employers’ and workers’ organizations. Accordingly, the Convention provides for the active participation of social partners, stipulating that every state ratifying the Convention “shall make arrangements […] to secure, within the system of labour administration, consultation, cooperation and negotiation between the public authorities and the most representative organizations of employers and workers”. The three forms of social partners’ participation (consultation, cooperation, negotiation) may be happening either ad hoc for a specific purpose and for a limited period, or may be institutionalised. An examination of national practices shows a wide variety of bodies for consultation, cooperation and negotiation. Their role may take a number of different forms: consultation in preparing draft legislation or regulations, participation in the implementation, participation in the design and formulation of government policy, participation in decision-making within bodies responsible for certain labour administration activities, etc. The composition of these bodies also varies a great deal. They are traditionally tripartite, but may also be joint bodies, comprising only social partners. In other cases, they also include representatives of interest groups and independent experts. According to their level, role and composition, their names differ: economic and social council, national labour advisory boards, sectoral advisory boards, etc. A specific category of industrial relations institutions represent conciliation and mediation services, quasi-judicial bodies that have functions of investigation, mediation and decision-making.
19

The table below summarizes the information given by labour ministries on national tripartite councils. Country Name of standing
body Additional Information Links between
national tripartite council and ministry
Armenia – “A regional committee for employment assistance is established.”
–
Azerbaijan Commission on Conclusion of General Collective Agreement
Tripartite national committee established by the labour laws for a General Collective Agreement.
Minister is member of Tripartite Committee
Georgia Social-economic issues regulation permanent tripartite council
- secretariat of council at ministry
- ministry main source of funding
- council chaired by minister
Kazakhstan Republican tripartite commission on social partnership and regulation of social and labour relations (RTC)
“[…] to discuss and protect the interests of the social partners by means of consultations and negotiations […]”
- secretariat of RTC at the ministry
- no financing required, consultative role
- chaired by deputy prime-minister
Kyrgyzstan Republican Tripartite Commission
Government appoints Coordinator of commission who chairs the sessions.
Tajikistan Department of agreements and collective contracts
- develops agreements at national level.
- monitors collective contracts at regional and sectoral level.
Links between the council and the ministry are established by a general agreement for 2003-2005.
Armenia is therefore the only country without a national tripartite council. In Azerbaijan, there is a national tripartite council, which serves only for the purpose of the conclusion of a national tripartite agreement. For Tajikistan it is not evident whether the body concerned is a department of the ministry (as the name indicates) or a tripartite council established by agreement with the ministry (as the information on links between council and ministry indicates). According to the information given by the questionnaires, consultation of social partners by labour ministries is widespread, as a part of the policy process as well as in administration. In addition there is also some degree of cooperation in designing policy documents.
20
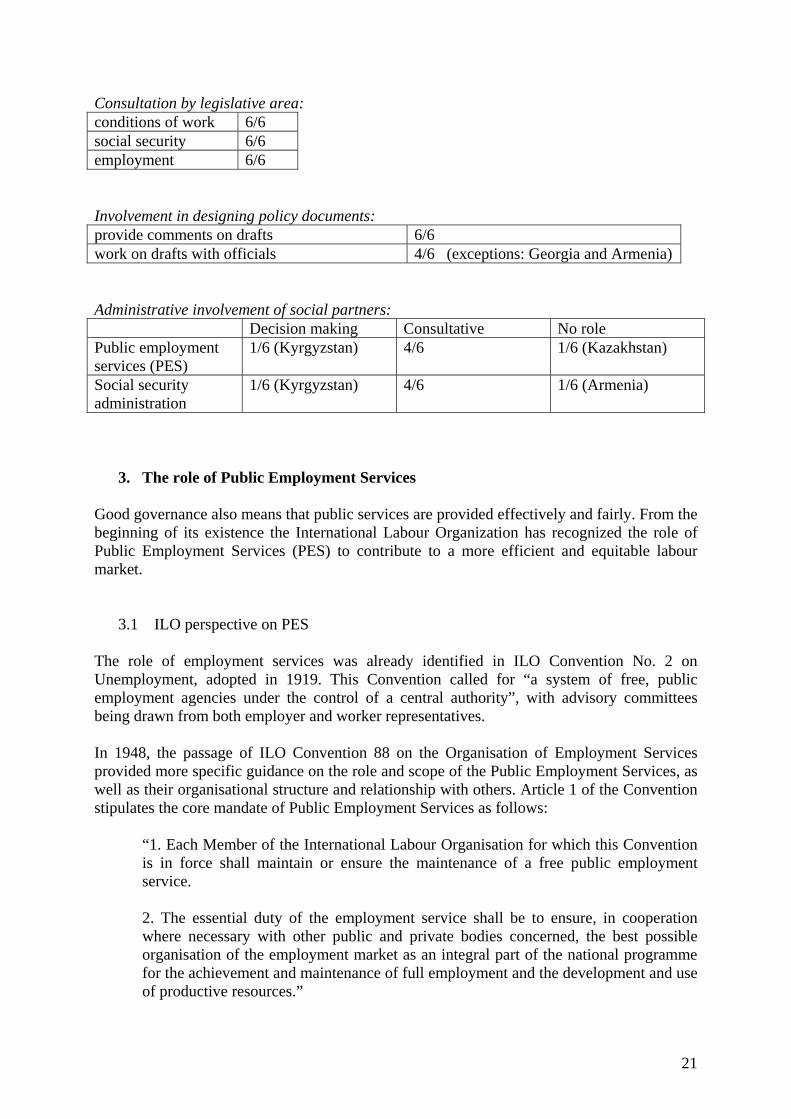
Consultation by legislative area: conditions of work 6/6 social security 6/6 employment 6/6 Involvement in designing policy documents: provide comments on drafts 6/6 work on drafts with officials 4/6 (exceptions: Georgia and Armenia) Administrative involvement of social partners: Decision making Consultative No role Public employment services (PES)
1/6 (Kyrgyzstan) 4/6 1/6 (Kazakhstan)
Social security administration
1/6 (Kyrgyzstan) 4/6 1/6 (Armenia)
3. The role of Public Employment Services Good governance also means that public services are provided effectively and fairly. From the beginning of its existence the International Labour Organization has recognized the role of Public Employment Services (PES) to contribute to a more efficient and equitable labour market.
3.1 ILO perspective on PES The role of employment services was already identified in ILO Convention No. 2 on Unemployment, adopted in 1919. This Convention called for “a system of free, public employment agencies under the control of a central authority”, with advisory committees being drawn from both employer and worker representatives. In 1948, the passage of ILO Convention 88 on the Organisation of Employment Services provided more specific guidance on the role and scope of the Public Employment Services, as well as their organisational structure and relationship with others. Article 1 of the Convention stipulates the core mandate of Public Employment Services as follows:
“1. Each Member of the International Labour Organisation for which this Convention is in force shall maintain or ensure the maintenance of a free public employment service.
2. The essential duty of the employment service shall be to ensure, in cooperation where necessary with other public and private bodies concerned, the best possible organisation of the employment market as an integral part of the national programme for the achievement and maintenance of full employment and the development and use of productive resources.”
21

The general tasks of employment services as stipulated in the ILO Convention 88 on Organisation of Employment Services consist of:
⋅ recruiting and placing workers; ⋅ facilitating occupational and geographical mobility; ⋅ collecting and analysing data on the labour market situation; ⋅ cooperating in the administration of unemployment insurance; ⋅ assisting in social and economic planning.
Four of the 87 countries that have ratified Convention 88 are represented at this meeting:
Cyprus (ratification in 1960), Azerbaijan (1993), Kazakhstan (2001), Georgia (2002).
3.2 Scope and functions of PES In recent decades the role of PES has shifted in many countries from that of job broker or labour exchange to that of the chief executor of national labour market policy. In particular its role has grown in the management of various active labour market programmes. The PES may also play a key role in the development of labour market information and the administration of unemployment benefits. To demonstrate the scope and scale of the activities of Public Employment Services worldwide, the World Association of Public Employment Services (WAPES) conducted surveys of its members in 2002 and 2003. Based upon the responses of 58 of the organization’s 90 member countries, the following observations can be made. Public Employment Services worldwide provide the following services:
• 3/4 run a labour exchange, with 3/4 of these on the internet. • Almost 9/10 provide labour market information. • Almost half administer unemployment insurance programmes. • Concerning labour market programmes: • 4/5 manage job search assistance programmes. • 4/5 manage vocational training programmes. • 4/5 manage self employment programmes. • 3/4 manage programmes for persons with disabilities. • 3/4 manage programmes for youth. • 2/3 manage active programmes for employers. • Over half manage programmes for the long-term unemployed. • 2/5 manage programmes for women. • 2/5 manage programmes for older workers. • 1/3 manages programmes for immigrants.
22

Based upon the information provided to the ILO, all of the countries participating in this seminar provide a mix of functions through their PES. Of the active labour market programmes, public works programmes and training programmes are the most common. The PES can be situated in several different ways in a country’s institutional structure. In Georgia and Tajikistan, for example, the PES is administered as part of the ministry. In Azerbaijan it is a separate agency. In Armenia, Kyrgyzstan and Kazakhstan there is shared responsibility between the ministry and a separate agency. The source or sources of funding for the PES can vary as well. Among the countries participating in the seminar two provide funding for their PES out of the general budget and two out of a separate fund (see table below). Armenia works with a combination of both sources, while in Kazakhstan PES are funded by local administrations. general budget Kyrgyzstan, Georgia separate fund Tajikistan, Azerbaijan Azerbaijan: State Fund of Social Protection combination Armenia other Kazakhstan funding provided by local administrations As a result of the national labour market policy, the institutional structure, the sources of funding and other factors, the numbers and distributions of PES staff differ also among countries. The following chart shows wide differences in staff numbers as reported on the ILO questionnaires. Azerbaijan and Georgia have 447 and 576 PES employees respectively, while in Kazakhstan, Kyrgyzstan and Tajikistan staff numbers range from 1,023 to 1,172. Furthermore the chart shows that Azerbaijan and Kazakhstan have considerably more regional and local than national staff. Figure 8:
PES staff
612
544
10
348
55
560
515
1013
228
392
0 200 400 600 800 1000 1200 1400
Tajikistan
Kyrgyzstan
Kazakhstan
Georgia
Azerbaijan
national staff regional and local staff
Source: ILO questionnaire
23
Moreover, according to the information from the questionnaires Kazakhstan has a lot more regional and local offices (213) than the other countries that answered this question (68-85 offices). This is sensible considering that Kazakhstan is geographically by far the biggest country in the region, and considering that Public Employment Services have to be delivered close to the people.
3.3 International trends in PES administration There are a number of external influences on the Public Employment Service: Labour supply and demand conditions change, as do customer demands. This often leads to changes in national employment policies. In a number of countries there is also pressure to reduce public expenditures. Furthermore, we witness a rapid growth of private employment agencies in a number of countries, which has meant increased competition in delivery of services. At the same time the availability of improved information and communications technology tools has grown, making it possible to automate processes and make services more efficient and accessible. These factors present a number of challenges for national policymakers and employment service administrators. First is the question of what employment services can be provided privately and what services should be available as public services. Second is the challenge of improving the balance and integration among the main PES functions: labour market information, job broking, administration of labour market adjustment programmes, and administration of unemployment benefit programmes. Next, in many countries there is a strong need to improve analysis of labour market trends, and particularly for improving vocational guidance and training programme planning. There are also challenges of improving the use of information and communication technologies and improving management tools to effectively decentralise and outsource services. Last but certainly not least there is a constant pressure to improve the recruitment, development and retention of PES staff. Along with these programme and administrative challenges there are also more political challenges. These include improving decision-making with social partners and local government. They also include improving accountability to stakeholders—focusing upon results-based management. Successes in these areas help to win the confidence of government policymakers and influence policymaking. These external influences are shaping Public Employment Services in a number of ways. First, there is an emphasis upon improving labour market information. Second, there has been a trend toward more active, rather than passive labour market measures, particularly in developed countries. Next, there has been a shift toward customer-centred services and the replacement of standardized sequences of services with tiered delivery systems. Self-service delivery tools are increasingly common. Last of all, services are becoming increasingly integrated among service providers, as in one-stop service delivery.
24
Looking at these trends, what is most important to remember? • The PES is often the primary public labour market institution responsible for
implementing labour market policy through public services. • The PES, however, should not be viewed as a provider of rigidly defined functions,
particularly job brokerage, but as a flexible instrument of national economic and social development and growth.
• To do this demands a more strategic approach: 1) gaining a more sophisticated understanding of the operation of the labour market; 2) recognizing that public sector financing does not have to mean sole government service delivery; and 3) developing a capability to adjust services to adapt to changing conditions.
• Developing this strategic approach demands developing partnerships with other service providers in the public, private and civil society sectors, at the same time that the PES makes large investments in developing a highly skilled, forward-thinking and adaptable staff.
3.4 The Role of Private Employment Agencies in labour market management The partnership of public employment services with private employment agencies is currently an issue of interest in a number of countries. But this is not a new issue. The 1919 ILO Unemployment Convention No. 2 included language that stated that where both public and private employment agencies existed, steps should be taken to co-ordinate their operations. For much of the twentieth century the potential for abuse and exploitation of workers overshadowed the benefits of private employment agencies (PREAs), and they were banned in a number of countries. However, changes in the structure and operation of labour markets have presented expanding opportunities for PREAs, and they are now increasing in many countries. The growing recognition of their positive contribution has led to a reconsideration of their role. This new attitude was codified in ILO Convention No. 181 on Private Employment Agencies, adopted in 1997. Since the adoption of this Convention it has been ratified by 18 countries, including Georgia in 2002. The Private Employment Agencies Convention also responded to the growing pressures faced by firms as a result of increasing international competition. The Convention balances firms’ needs for flexibility to expand or reduce their workforce with workers’ needs for employment stability, a safe work environment, decent conditions of work, and a safety net when they are unable to work. The Convention proposes criteria as a means of striking this balance. There is often confusion, however, in understanding the different roles that the government plays in relation to public employment services as opposed to private employment services. In the first case, the government is the financier and usually the direct provider of services, including job placement or labour exchange, labour market information and labour market programmes. Increasingly in some developed countries this role is contracted out in part to private non-profit or for-profit employment agencies. But in all these cases the government remains the source of funding. When the government provides the funding there are mechanisms within the contracting process to enforce adherence to rules. However, in the case of private employment agencies as businesses that rely on customers paying privately, the government role is to regulate them as businesses. In this role a
25
government needs to determine whether or not private agencies can operate as businesses, and, if so, under what conditions. This regulatory role of government over the functioning of business exists in many sectors of private economic activity. It can be delegated to sub-national level, particularly in federal states; but it remains a government responsibility. The ILO is in the process of developing guidelines on the regulation of private employment agencies.
4. Labour market policies26 Economically developed, transition and developing countries alike all over the world are confronted with high unemployment and/or underemployment and are in need of effective labour market intervention. In response to this new challenge, the countries are amending their labour legislation, strengthening national labour market institutions and drawing up employment and labour market policies, which conform to the key international labour standards set by the ILO in the field of employment promotion. This chapter first refers to the main ILO standards concerning employment policy. Then it provides a review of labour market policies applied in economically advanced, transition and developing countries and compares their design, coverage, targeting, evaluation and financing. This diverse world experience is then confronted with the information on labour market policies in the Caucasus and Central Asian countries, collected through the ILO questionnaire.
4.1 International labour standards on employment policy The basic international labour standard in this context is ILO Convention No. 122 on Employment Policy, adopted in 1964. The Convention urges governments of ratifying countries to formulate and implement, in close collaboration with the social partners – employers and workers – an active policy promoting full, productive and freely chosen employment. For achieving these employment goals the Convention requests the countries, within the framework of a coordinated economic and social policy, to set up appropriate measures and to take the necessary steps for their application, including the launching of special labour market programmes in their support. Governments report regularly to the ILO on national efforts to meet the obligations set by the Convention and the results achieved. The International Labour Office studies the reports and recommends appropriate measures to strengthen the policy impact on the labour market.27
The general principles of an active employment policy are elaborated further in ILO Recommendation No. 122 of the same year. The Recommendation takes account of the various possible causes of unemployment and suggests a wide range of policies to tackle them. Policies promoting economic growth, investment and job creation obviously play the crucial role. In addition to economic measures, an emphasis is put on policies/programmes aimed at helping jobseekers, both unemployed and underemployed, to find and fit themselves
26 This chapter draws on the forthcoming ILO publication Labour market policies: formulation, implementation,
evaluation written by U. Efendioglu, A. Nesporova, C. O’Leary and J. Owens. Sources for all the figures given in this chapter are also to be found there.
27 Depending on the importance given to individual conventions, the reporting period may be from one year to four years. In the case of Convention No.122, reporting is requested every two years.
26

for new jobs. Such policies/programmes are designed to identify and pass on available jobs to jobseekers and to screen job candidates with regard to vacant jobs’ requirements; help jobseekers reach new jobs with the support of mobility grants; improve employability of jobseekers through vocational training; and promote re-employment of disadvantaged groups through subsidized employment, job creation measures, public works, assistance in self-employment and other measures. At the same time, the Recommendation calls for appropriate income support to help unemployed and underemployed persons and their dependants to meet their basic needs. ILO Convention No. 122 and Recommendation No. 122 are closely related instruments and they make explicit reference to several other ILO Conventions, in particular the Employment Service Convention No.88, Human Resources Convention No.142, Labour Administration Convention No.150, Vocational Rehabilitation and Employment (Disabled Persons) Convention No.159 and Employment Promotion and Protection against Unemployment Convention No.168. The most important Convention No. 122 has been ratified by all the Caucasus and Central Asian countries with the exception of Turkmenistan. Other above mentioned conventions have so far been ratified by only some of the countries (Convention No. 88 by Azerbaijan, Georgia and Kazakhstan, Convention No. 142 by Azerbaijan, Georgia, Kyrgyzstan and Tajikistan, Convention No. 150 only by Kyrgyzstan, Convention No. 159 by Azerbaijan, Kyrgyzstan and Tajikistan, while none of these countries has ratified Convention No. 168). The process of ratification is only the first step towards ensuring the compliance of relevant national legislation with this international norm. Much more important is to improve the legislation accordingly and to enforce the legislation so that the principles and regulations are indeed observed by all parties in the labour market and reflected in national policies and practices. Regular reporting on the observance of ratified conventions by the government with comments from the social partners can help a lot in this effort.
4.2 Labour market policies The first group of policies mentioned in Recommendation No. 122 – job mediation, vocational training, subsidized employment, public works, self-employment promotion, mobility grants and others – are called active labour market policies (ALMPs). Income support policies such as unemployment benefit schemes or unemployment assistance schemes but also policies aimed at reducing labour supply such as early retirement compensation are called passive labour market policies (PLMPs). However, this distinction is not as clear as stated. Some confusion might arise due to the new trend, found in many countries, requiring welfare recipients to participate in employment programmes in order to receive benefits. The benefits are becoming less generous and more conditional on proof of job search activity and readiness to participate in active programmes. This transforms the traditional passive benefits into active measures. On the other hand, policies such as public works and sheltered employment often reduce the likelihood of finding regular employment, thus creating a dependency on the welfare system and rendering them in this sense passive. The overall policy trend is towards activation of jobseekers, both actual jobseekers and potential jobseekers from the currently inactive population, so that they actively search and take up new (regular) jobs and, if jobs are not readily available, to join active labour market programmes.
27
ALMPs are often considered as a complement to passive policies. In the OECD as well as the transition countries a major part of the budget for employment promotion is devoted to passive policies. These policies are politically more centre-staged and acquire greater funding. Thus, due to a PLMP-oriented political arena, in many countries, ALMPs have a residual role, reflected in general by much lower fund allocation.
4.3 Unemployment benefit schemes Unemployment benefits (UB) are a general standard in economically developed countries. Transition countries introduced UB systems widely at the beginning of the 1990s. However, in developing countries unemployment benefit systems are still rather rare. The criteria to qualify for UBs differ largely across countries. In the OECD countries there has been a general trend towards tightening eligibility criteria for UBs as well as towards reducing the level of benefits and the length of their payment. Most OECD countries have programmes that offer temporary compensation for loss of earnings under the obligation of meeting certain conditions. UBs in these countries are based on contributions made over the working years and a common requirement is to have contributed a minimum number of years. UB is of a limited duration varying from six months in Italy, the UK and the US to 10-15 months in Germany, Greece, Luxembourg, Spain, and up to 60 months in Denmark, France, and the Netherlands. The duration varies according to the employment record (Belgium, France, Greece, Japan, the Netherlands, Spain, and Switzerland) and age (Austria, Finland, France, Germany, the Netherlands, Portugal, Sweden, and Switzerland) or can be fixed. The benefit level is generally dependent on previous earnings but may also depend on employment record, age, family situation and may be subject to minimum and maximum limits. The replacement rates28 range from 20% in Italy to 90% in Sweden. As to the coverage by benefits, the share of benefit recipients among the labour force thus largely varies by country from 1.37% in Spain to 19.61% in Denmark (data of 2001). Public spending on UB schemes moves between 0.30% of GDP in the US to 1.9% of GDP in the Netherlands and Germany. The transition countries during the last two decades have developed UB systems following the examples of OECD countries. Registered unemployed in transition countries are entitled to receive benefits if they have worked six months during the previous year (Estonia) or 12 months during the previous three years (Czech Republic) or four years (Hungary). The Czech Republic and Estonia have a maximum duration of benefits of six months, while in Bulgaria, Hungary, Ukraine and the Russian Federation they last up to one year. However, this varies according to length of service and age of the unemployed persons who may receive benefits for a longer period. The reason for being unemployed also has a bearing on the maximum duration. The level of benefits depends on several factors such as the last wage of the recipient, the work record, the reason for unemployment or the regional labour market situation. The replacement rates in most cases decline during the period of unemployment from 60 - 80% in the first period to about 50 per cent in the second period. In all transition countries the level of benefits is relatively low. In most countries it is less than one-third of the average wage and in some CIS countries it is well below the subsistence minimum. Consequently, many of the claimants are forced into the informal labour market to gain
28 The replacement rate is the average benefit as a percentage of the last salary.
28
additional income. The share of UB recipients among those in registered unemployment varied between 24.8% in Bulgaria and 89.5% in the Russian Federation in 1998. The countries spent between 0.1% (Estonia) and 0.9% (Hungary) of their GDP on funding UB schemes in that year. In Asia only few countries have a UB system: Bangladesh, China, Iran, the Republic of Korea and Taiwan (China). However even within these countries coverage is limited. UBs are often restricted to the public sector and large companies, while the self-employed and employees in SMEs are often excluded from coverage. The Republic of Korea spent 0.16% of GDP on UBs, other Asian countries do not provide this information. The Caucasus and Central Asian countries are also running national unemployment benefit schemes with the exception of Kazakhstan, which abolished its scheme in the second half of the 1990s and now relies on social assistance provided by municipalities. The coverage of registered jobseekers by UB is very low – 7% in Armenia and Kyrgyzstan, 10.6% in Azerbaijan and 15% in Georgia. Apart from UBs, Armenia also provides additional financial assistance to jobseekers in particular need. In responses to the ILO questionnaire no information has been provided on the eligibility for benefits, duration of their payment or their level. Reports indicate that the levels are very low – e.g. in Georgia 14 Lari per month provided over a period of six months, compared to a minimum consumption basket of 119 Lari. This may contribute to low unemployment registration, as jobseekers are not motivated to register at PES.29
4.4 Active labour market policies There are marked differences in the use of and participation in ALMPs among different parts of the world as well as between countries. Some countries rely mainly on the labour market to absorb the unemployed while others provide different types of programmes. In transition countries it varies from country to country but participation rates are in general low. Developing countries, on the other hand, seem to rely more on ALMPs such as public works and training rather than on passive policies such as UBs and unemployment assistance. However, the participation in developing countries is still significantly lower than in developed countries. Although participation rates are an important indicator for the evaluation of a programme’s success, high participation does not necessarily mean high effectiveness of ALMPs. The real indication would be to measure how many of these participants find a regular, stable and decent job, i.e. placement rates. OECD countries have recorded participation rates30 in ALMPs at over 8% on average in 2000.31 There is, however, a wide disparity among OECD countries. Their rates range from 2% or less of the labour force in the United Kingdom, to almost 22% in Denmark in 2000. There are several aspects that are usually associated with widespread use of ALMPs: Countries in the OECD such as France and Germany with high long-term unemployment have been found to rely heavily on ALMPs. In this context analyses point out that large use of ALMPs usually goes along with a high tax wedge, widespread employment protection policies and high trade union density. Countries with high replacement rates in their UB 29 GET 2004, pp. 49, 53; EIU CP Georgia 2004, pp. 15f. 30 Participant inflows to active labour market programmes as a percentage of the total labour force. 31 Countries not covered, apart from the four transition countries, are Belgium, Canada, Germany, Greece, Italy,
Japan, Portugal, Switzerland, and the United States.
29
system are typically also associated with intense use of ALMPs. Furthermore, those countries, which have UBs that last less than one year, tend not to rely heavily on ALMPs, the opposite being true for those countries with indefinite UBs. Labour market training belongs to the most frequently used programmes in OECD countries, due to the need for a well-educated labour force that keeps up with technological changes. An OECD review pointed out that greater success of such measures lies in the small-scale design, selective targeting, and inclusion of on-the-job components. In contrast, public works, popular in the 1980s, have been cut down significantly, due to negative results in their evaluation. They are usually used to keep the work-related skills of long-term unemployed current and as a poverty relief. Employment subsidies are applied for certain vulnerable groups. They aim to encourage employers to hire disadvantaged groups by offering incentives such as wage subsidies or tax exemptions from social security payments. They also stimulate employees to take up employment by avoiding welfare benefit traps.32 The starting up of small enterprises by unemployed persons is also widely promoted. According to policy evaluations this is best suited for short-term unemployed who are relatively well educated and below 40. Assistance offered includes business training, counselling, subsidized credits, cheap premises and others. The cost effectiveness of these schemes is quite high. In terms of fund allocation, the OECD countries spend on average 0.8% of their GDP on ALMP, ranging from 0.2% in the US to 2.1% in Sweden. Transition countries have used active labour market policies rather frequently in the process of economic change and restructuring. Participation rates vary between countries, with Estonia, Hungary, the Russian Federation and Ukraine exceeding 25% of their registered unemployed. Labour market training is the most frequent ALMP in countries like Estonia and Ukraine. It is usually offered to unemployed jobseekers with low and obsolete skills but increasingly provided also to workers who are still employed but threatened with redundancy due to their obsolete skills. The latter type of retraining seems to be particularly effective – the placement rates move up to 90% while for training of unemployed persons the rates move around 50%. In a number of countries labour offices prefer to organize specific training for existing jobs. In order to avoid future job placement problems, they agree with employers to guarantee recruitment of retrained workers. Public works projects have also been used significantly in many transition countries like Bulgaria, Hungary, the Russian Federation, Slovakia or Ukraine. Some countries such as the Czech Republic have decreased the use of public works as the transition process progressed. The trend is towards linking public works to socially beneficial projects such as ecologically sound infrastructure projects or repairing damage caused by natural disasters (floods, droughts, etc.). According to evaluation results, less than 10% of public works participants are able to find a regular job afterwards. The placement rate much improves if public works are combined with on-the-job training. Employment subsidies are usually targeted at vulnerable groups such as the long-term unemployed, unemployed youth, and disadvantaged regions. Some countries like Czech Republic, Hungary, Poland or Slovakia rely extensively on this type of ALMP. The success rates are quite good as around 50% of participants find re-employment after the programme’s completion. Business promotion programmes are relatively modest in size as they are not suitable for everybody and rather expensive. They 32 Welfare benefit trap occurs when the level of benefits is close to the expected wage level creating
disincentives for the worker to take up an available (usually low-skilled and low-paid) job. However, it may occur even in cases when jobseekers get low benefits and/or insurance contributions are paid for them by the public employment service while they can supplement their social incomes by incomes from informal work.
30

boost high redeployment rates though (e.g. 85% in Hungary). Transition countries spend on average much less than the OECD countries on ALMPs: only Hungary, Poland and Slovakia allocated some 0.3% of their GDP for active programmes in 1998, in other countries this share was at or below 0.1%. In East Asian countries ALMPs vary between countries in their importance as a policy instrument since in certain countries there is no tradition of their implementation. In others, such as China, the re-employment programmes of laid-off workers from state-owned enterprises are quite extensive, offering re-employment assistance, vocational guidance, retraining and assistance in self-employment. The only widespread use of ALMPs in East Asia has been public works. The financial crisis emphasized their function for poverty relief as in most of the East Asian countries no UB scheme exists. Retraining was not actively used until 1997 due to low unemployment rates in these countries. After the crisis, with soaring unemployment and underemployment, the need arose to develop appropriate policies. Training has expanded in the Republic of Korea, Thailand and the Philippines. However, due to fiscal pressures, the spending on governmental training programmes remained limited and countries attempt to involve increasingly private sector providers. Employment subsidies are applied in a few countries. In Malaysia they are used to encourage employers to use pay cuts, flexible working hours and part-time work rather than retrenchment in case of downsizing. In Korea the government offered subsidies to firms that agreed to maintain at least 60% of their staff during the financial crisis. Income tax reductions and grants or loans from the employment offices have recently been introduced also in China. Furthermore, the countries in the region are trying to improve access to credit and the terms of financing for people who wish to start or expand their own businesses. They often provide also assistance with managing, technology and business training and stimulate micro-credit schemes. The Republic of Korea spent 0.31% of GDP on ALMP in 2001, for other countries this information is not available. The Caucasus and Central Asian countries are also running ALMPs. Among these programmes public works and training prevail. In all countries answering the ILO questionnaire, except Kazakhstan and Azerbaijan, public works is the most widespread programme. In Kyrgyzstan 29.4% of registered jobseekers took part in public works, while this share equalled 10.9% in Armenia, 3.5% in Azerbaijan and 1.5% in Georgia (all figures in this paragraph are for 2004). Kazakhstan reported only an absolute number of participants, i.e. 78,700, and Tajikistan 22,939 persons. Labour market training was provided to 8.8% of registered jobseekers in Kyrgyzstan, 3.8% in Azerbaijan, 0.7% in Georgia and 0.5% in Armenia. Kazakhstan reported 2,111 participants in labour market training and Tajikistan 6,047 persons. However, Kazakhstan is running a major training programme for youth in which 621,000 young people took part in 2004. Four out of six countries have also launched a self-employment/small business support scheme. In Kazakhstan altogether 443,000 persons took part in this scheme while in Kyrgyzstan 3.1% and in Georgia 0.4% of all registered jobseekers were supported in starting up their businesses. Tajikistan provided the figure of 682 entrepreneurs benefiting from this programme. Armenia and Azerbaijan do not have such a programme. Other ALMPs applied in these countries include job clubs in Azerbaijan (2,824 participants), in Tajikistan (414 participants) and in Kazakhstan (no number provided), subsidized employment in Kazakhstan (2,900 participants) and training for persons with disabilities in Armenia (50 persons). Azerbaijan also gives the share of jobseekers placed with the help of labour exchanges – 38.7%. As to the funding of labour market programmes, Azerbaijan allocated 0.022% of its GDP to ALMP and 0.017% to UBs, Georgia 0.05% to all labour market programmes and Armenia 0.07% to ALMPs.
31

Comparison of the Caucasian and Central Asian countries with other transition countries thus shows very weak income protection of unemployed persons as well as their extremely limited access to ALMPs (with a notable exception of Kazakhstan) in the former group of countries. Moreover, no information is available on the placement rates of the programmes’ participants. As now all these countries are achieving sound economic growth rates, more extensive use of labour market policies could improve the matching between labour supply and demand, help vulnerable groups to (re-)integrate in the labour market and contribute to poverty reduction. Concluding remark This paper serves as a reference document for seminar discussions. It refrains from drawing any comprehensive conclusions or deriving specific policy recommendations from the information presented. Instead, possible conclusions shall be discussed by participants during the seminar. The suggestions arising from these debates will be summarized in the last session of the event. All this information will be used in the future technical cooperation of the ILO with the CIS countries in the field of labour administration, public employment services and labour market policies.
32
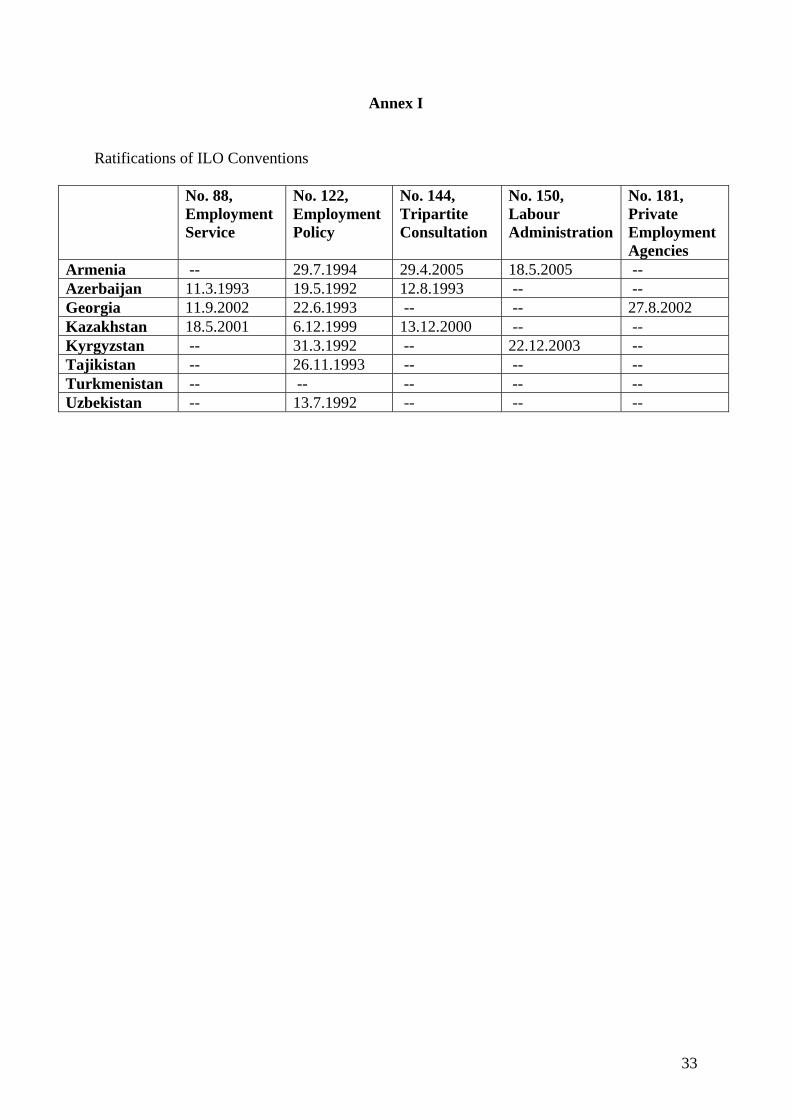
Annex I Ratifications of ILO Conventions
No. 88, Employment Service
No. 122, Employment Policy
No. 144, Tripartite Consultation
No. 150, Labour Administration
No. 181, Private Employment Agencies
Armenia -- 29.7.1994 29.4.2005 18.5.2005 -- Azerbaijan 11.3.1993 19.5.1992 12.8.1993 -- -- Georgia 11.9.2002 22.6.1993 -- -- 27.8.2002 Kazakhstan 18.5.2001 6.12.1999 13.12.2000 -- -- Kyrgyzstan -- 31.3.1992 -- 22.12.2003 -- Tajikistan -- 26.11.1993 -- -- -- Turkmenistan -- -- -- -- -- Uzbekistan -- 13.7.1992 -- -- --
33
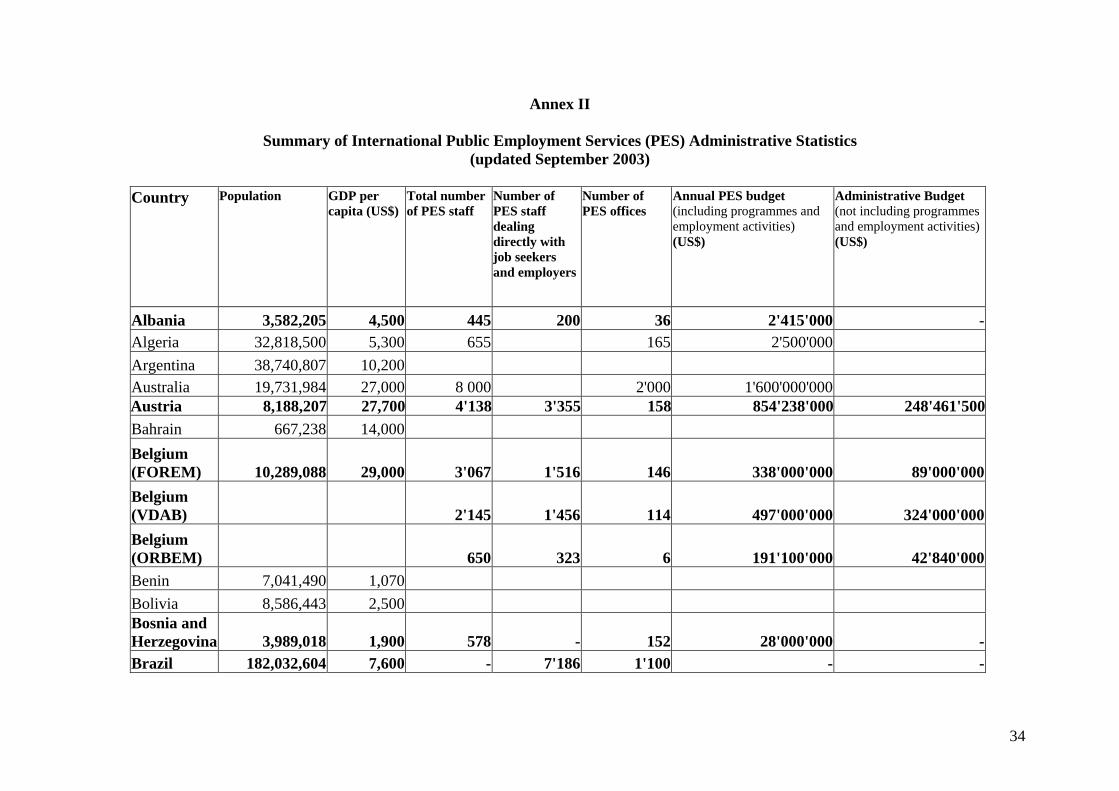
Annex II
Summary of International Public Employment Services (PES) Administrative Statistics (updated September 2003)
Country Population GDP per
capita (US$)Total number of PES staff
Number of PES staff dealing directly with job seekers and employers
Number of PES offices
Annual PES budget (including programmes and employment activities) (US$)
Administrative Budget (not including programmes and employment activities) (US$)
Albania 3,582,205 4,500 445 200 36 2'415'000 -Algeria 32,818,500 5,300 655 165 2'500'000Argentina 38,740,807 10,200Australia 19,731,984 27,000 8 000 2'000 1'600'000'000 Austria 8,188,207 27,700 4'138 3'355 158 854'238'000 248'461'500Bahrain 667,238 14,000Belgium (FOREM) 10,289,088 29,000 3'067 1'516 146 338'000'000 89'000'000Belgium (VDAB) 2'145 1'456 114 497'000'000 324'000'000Belgium (ORBEM) 650 323 6 191'100'000 42'840'000Benin 7,041,490 1,070Bolivia 8,586,443 2,500Bosnia and Herzegovina 3,989,018 1,900 578 - 152 28'000'000 -Brazil 182,032,604 7,600 - 7'186 1'100 - -
34
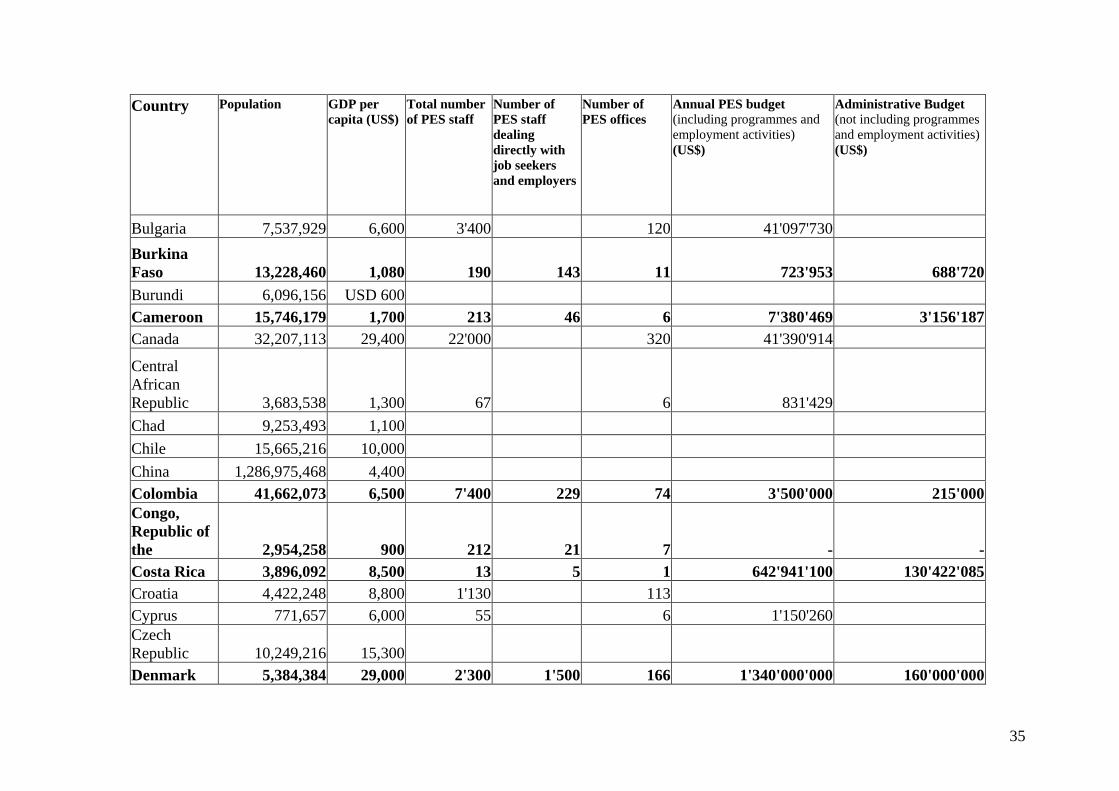
Country Population GDP percapita (US$)
Total number of PES staff
Number of PES staff dealing directly with job seekers and employers
Number of PES offices
Annual PES budget (including programmes and employment activities) (US$)
Administrative Budget (not including programmes and employment activities) (US$)
Bulgaria 7,537,929 6,600 3'400 120 41'097'730Burkina Faso 13,228,460 1,080 190 143 11 723'953 688'720Burundi 6,096,156 USD 600 Cameroon 15,746,179 1,700 213 46 6 7'380'469 3'156'187 Canada 32,207,113 29,400 22'000 320 41'390'914
Central African Republic 3,683,538 1,300 67 6 831'429Chad 9,253,493 1,100Chile 15,665,216 10,000China 1,286,975,468 4,400Colombia 41,662,073 6,500 7'400 229 74 3'500'000 215'000 Congo, Republic of the 2,954,258 900 212 21 7 - -Costa Rica 3,896,092 8,500 13 5 1 642'941'100 130'422'085 Croatia 4,422,248 8,800 1'130 113 Cyprus 771,657 6,000 55 6 1'150'260 Czech Republic 10,249,216 15,300Denmark 5,384,384 29,000 2'300 1'500 166 1'340'000'000 160'000'000
35

Country Population GDP percapita (US$)
Total number of PES staff
Number of PES staff dealing directly with job seekers and employers
Number of PES offices
Annual PES budget (including programmes and employment activities) (US$)
Administrative Budget (not including programmes and employment activities) (US$)
Djibouti 457,130 1,300 Dominican Republic 8,715,602 6,100 30 22 9 - - Ecuador 13,710,234 3,100 El Salvador 6,470,379 4,700 25 7 Estonia 1,408,556 10,900 260 232 16 18'063 2'025Finland 5,190,785 26,200 3'200 2'600 148 2'230'680'000 157'500'000 France 60,180,529 25,700 22'500 945 1'785'000'000 Gabon 1,321,560 5,700 32 2 800'000Germany 82,398,326 26,600 85'220 12'500 830 55'821'150'000 4'620'000'000 Greece 10,665,989 19,000 Guatemala 13,909,384 3,700 Guinea 9,030,220 2,000 35 4 203'037Honduras 6,669,789 2,600 31 3 94'378Hungary 10,045,407 13,300Iceland 280,798 25,000Ireland 3,924,140 30,500 2'300 76 800'000'000Israel 6,116,533 19,000 980 100Italy 57,998,353 25,000Ivory Coast 16,962,491 1,500 Japan 127,214,499 28,000 15'000 2'500 600 - -
36

Country Population GDP percapita (US$)
Total number of PES staff
Number of PES staff dealing directly with job seekers and employers
Number of PES offices
Annual PES budget (including programmes and employment activities) (US$)
Administrative Budget (not including programmes and employment activities) (US$)
Kenya 31,639,091 1,020 200 41 400'000Latvia 2,348,784 8,300 533 241 62 11'403'163 3'137'875Lebanon 3,727,703 5,400Liberia 3,317,176 1,100Lithuania 3,592,561 8,400 1'465 814 46 48'687'010 14'873'446Macedonia 2,063,122 5,000Mali 11,626,219 860 140 107 9 1'850'000 755'000Malta 400,420 17,000Mauritania 2,912,584 1,900 6 3 35'000Mauritius 1,210,447 11,000 86 58 14 667'333 sameMexico 104,907,991 9,000 - - 139 1'052'090'716 34'093'481Mongolia* 2,712,315 1,840 30 126'771'306 4'931'754Morocco 31,689,265 3,900Netherlands 16,150,511 26,900 4500 3600 130 350'000'000 350'000'000 New Zealand 3,951,307 20,200 Nicaragua 5,128,517 2,500 10 8 30'000Niger 11,058,590 830 29 20 - 248'958 214'565Norway 4,546,123 31,800 3'000 253Panama 2,960,784 6,000 45 10 32'416'000Paraguay 6,036,900 4,200Peru 28,409,897 4,800 120 40 800'000
37

Country Population GDP percapita (US$)
Total number of PES staff
Number of PES staff dealing directly with job seekers and employers
Number of PES offices
Annual PES budget (including programmes and employment activities) (US$)
Administrative Budget (not including programmes and employment activities) (US$)
Philippines 84,619,974 4,200 55 1'681 221'568Poland 38,622,660 9,500Portugal 10,102,022 18,000 4'000 118 892'812'303Romania 22,271,839 7,400 3'750 - 278 138'270'670 18'785'540Saudi Arabia 24,293,844 10,500Senegal 10,580,307 1,500Slovakia 5,430,033 12,200 5'137 1'734 88 276'548'000 51'909'000Slovenia 1,935,677 18,000South Africa 42,768,678 10,000 Spain 40,217,413 20,700 8'499 4'540 766 17'149'530'512 404'336'120 Sweden 8,878,085 25,400 10'361 325 5'000'000'000Switzerland 7,318,638 31,700 2'172 1'516 126 4'500'000'000 20'000'000Thailand 64,265,276 6,900 1'556 84Togo 5,429,299 1,500 47 14 71'000Tunisia 9,924,742 6,500 978 80 35'000'000Turkey 68,109,469 7,000 1'709 - 248 40'620'000 18'120'000 Uganda 25,632,794 1,260United Kingdom 60,094,648 25,300 125'000 1'500 4'400'000'000United States 290,342,554 37,600 Uruguay 3,413,329 7,800
38
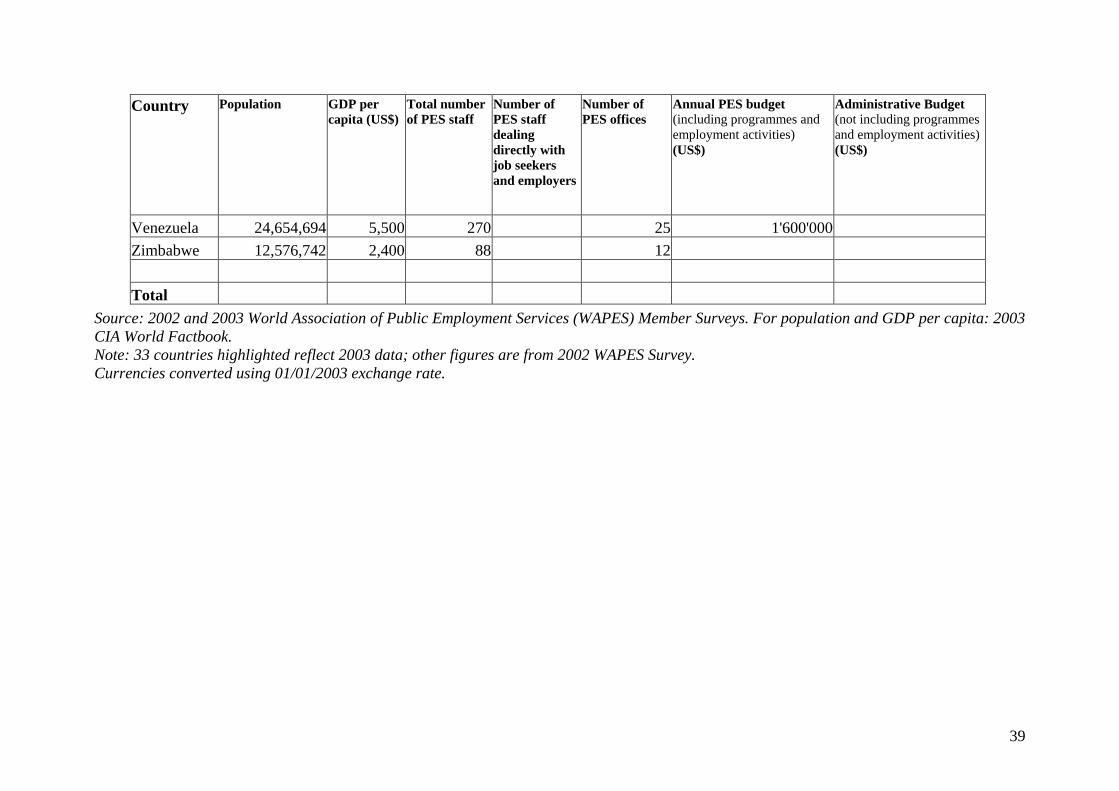
Country Population GDP percapita (US$)
Total number of PES staff
Number of PES staff dealing directly with job seekers and employers
Number of PES offices
Annual PES budget (including programmes and employment activities) (US$)
Administrative Budget (not including programmes and employment activities) (US$)
Venezuela 24,654,694 5,500 270 25 1'600'000Zimbabwe 12,576,742 2,400 88 12 Total
Source: 2002 and 2003 World Association of Public Employment Services (WAPES) Member Surveys. For population and GDP per capita: 2003 CIA World Factbook. Note: 33 countries highlighted reflect 2003 data; other figures are from 2002 WAPES Survey. Currencies converted using 01/01/2003 exchange rate.
39

Annex III
Summary of International Public Employment Service (PES) Programme Activities (Updated September 2003)
Main Business Areas of Services Given By PES Labour Market Programme Administration
Labo
ur
Exch
ange
Com
pute
rised
Jo
b B
ank/
Job
mat
chng
i
a arke
t
rogr
ams
rain
i
elf
mpl ro
gram
s
rogr
ams
rogr
ams
for
rogr
ams
for
ed
igr
Lbo
ur
Exch
ange
on
the
Inte
rnet
Une
mpl
oym
ent
Insu
ranc
e
Labo
ur
MIn
form
atio
n A
ctiv
e P
for e
mpl
oyer
s
Voca
tiona
l G
uida
nce
Voca
tiona
l T
ng
Job
Sear
ch
Ass
ista
nce
SE
oym
ent
P
Prog
ram
s fo
r w
omen
Yout
h P
P Old
er W
orke
rs
Prog
ram
s fo
r th
e D
isab
led
P the
long
-term
un
empl
oy
Prog
ram
s fo
r Im
mig
rant
s
Prog
ram
s fo
r pe
ople
with
h
heed
ucat
ion
Prog
ram
s fo
r m
obili
wty
or
kers
C
oope
ratio
n w
ith h
ealth
au
thor
ities
C
oope
ratio
with
soc
ial
serv
ices
n
auth
oriti
es
Albania X X X X X X X X XAlgeria X X
Argentina
Australia X X X X X X X X X X X
Austria X X X X X X X X X X X X X X X X X XBahrain Belgium (FOREM) X X X X X X X X X X X X X X XBelgium (VDAB) X X X X X X X X X X X X X X X X X XBelgium (ORBEM) X X X X X X X X X X X X X X X XBenin
Bolivia Bosnia and Herzegovina X X X X X X X X XBrazil X X X X X X X XBulgaria X X X X X X X X X X XBurkina Faso X X X X X X X X XBurundi
40
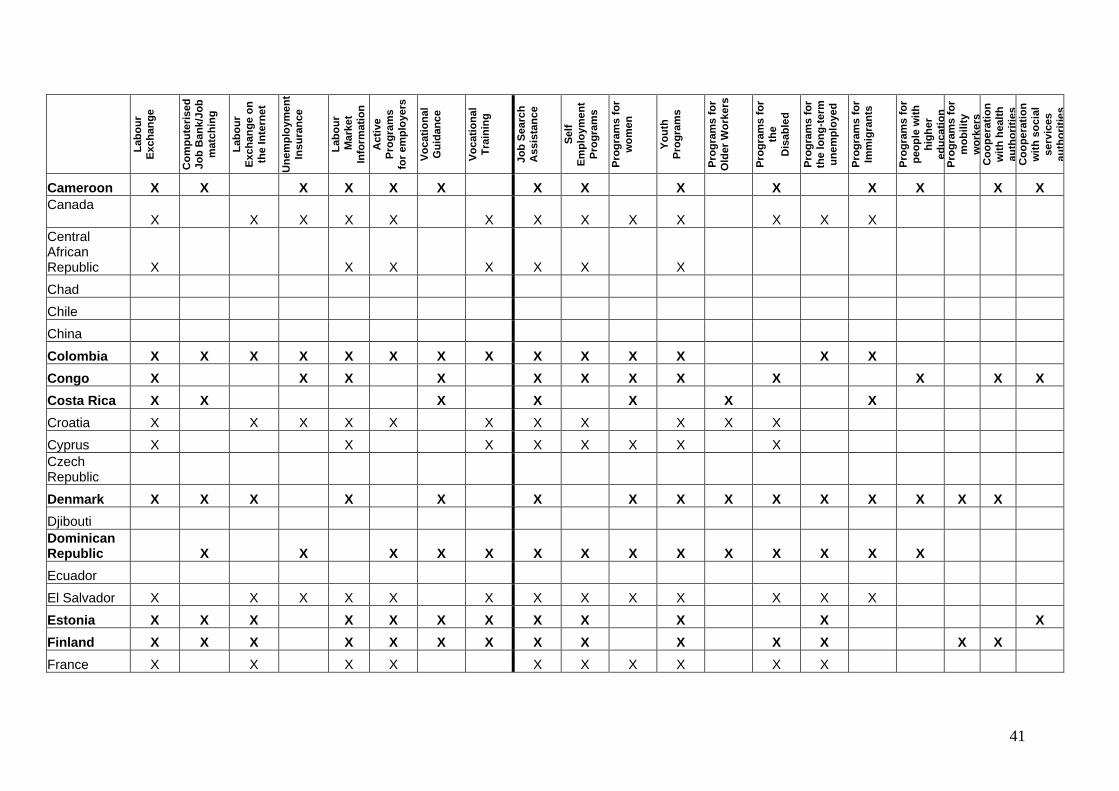
Labo
ur
Exch
ange
Com
pute
rised
Jo
b B
ank/
Job
mat
chng
i
a arke
t fo ro
gram
s
rain
i
elf
mp ro
gram
s
rogr
ams
rogr
ams
for
rogr
ams
for
ed
r
Lbo
ur
Exch
ange
on
the
Inte
rnet
Une
mpl
oym
ent
Insu
ranc
e
Labo
ur
MIn
rmat
ion
Act
ive
Pfo
r em
ploy
ers
Voca
tiona
l G
uida
nce
Voca
tiona
l T
ng
Job
Sear
ch
Ass
ista
nce
SE
loym
ent
P
Prog
ram
s fo
r w
omen
Yout
h P
P Old
er W
orke
rs
Prog
ram
s fo
r th
e D
isab
led
P the
long
-term
un
empl
oy
Prog
ram
s fo
r Im
mig
rant
s
Prog
ram
s fo
r pe
ople
with
hi
ghe
educ
atio
nP
mob
ilwr
fog
ram
sor
ity
or
kers
C
oope
ratio
n w
ith h
alth
e
auth
oriti
es
Coo
pera
tion
with
soc
ial
serv
ices
au
thor
ities
Cameroon X X X X X X X X X X X X X XCanada X X X X X X X X X X X X X Central African Republic X X X X X X X
Chad
Chile
China
Colombia X X X X X X X X X X X X X XCongo X X X X X X X X X X X XCosta Rica X X X X X X XCroatia X X X X X X X X X X X
Cyprus X X X X X X X XCzech Republic
Denmark X X X X X X X X X X X X X X XDjibouti Dominican Republic X X X X X X X X X X X X X XEcuador
El Salvador X X X X X X X X X X X X X
Estonia X X X X X X X X X X X XFinland X X X X X X X X X X X X X XFrance X X X X X X X X X X
41
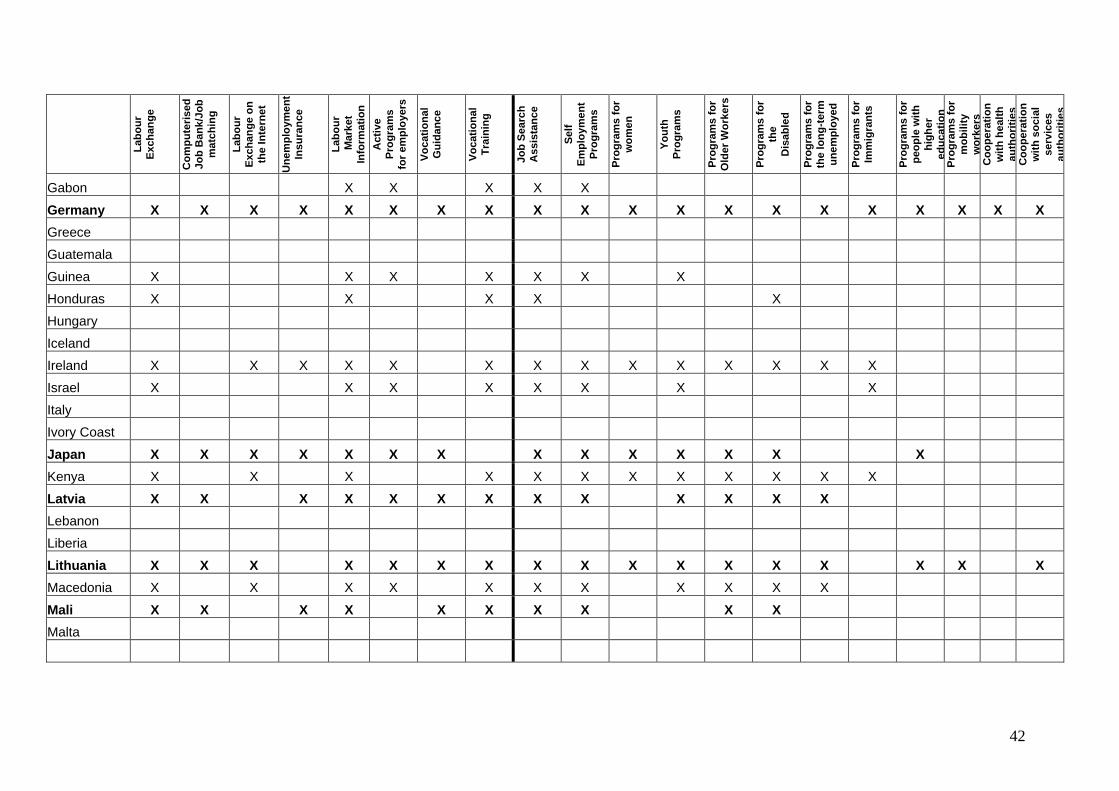
Labo
ur
Exch
ange
Com
pute
rised
Jo
b B
ank/
Job
mat
chng
i
a arke
t fo ro
gram
s
rain
i
elf
mp ro
gram
s
rogr
ams
rogr
ams
for
rogr
ams
for
ed
Prog
ram
s fo
r pe
ople
with
hi
gher
Lbo
ur
Exch
ange
on
the
Inte
rnet
Une
mpl
oym
ent
Insu
ranc
e
Labo
ur
MIn
rmat
ion
Act
ive
Pfo
r em
ploy
ers
Voca
tiona
l G
uida
nce
Voca
tiona
l T
ng
Job
Sear
ch
Ass
ista
nce
SE
loym
ent
P
Prog
ram
s fo
r w
omen
Yout
h P
P Old
er W
orke
rs
Prog
ram
s fo
r th
e D
isab
led
P the
long
-term
un
empl
oy
Prog
ram
s fo
r Im
mig
rant
s
educ
atio
nP
mob
ilwrogr
ams
for
ity
orke
rs
Coo
pera
tion
with
hal
th
eau
thor
ities
C
oope
ratio
n w
ith s
ocia
l se
rvic
es
auth
oriti
es
Gabon X X X X X
Germany X X X X X X X X X X X X X X X X X X X XGreece
Guatemala
Guinea X X X X X X X
Honduras X X X X X
Hungary
Iceland
Ireland X X X X X X X X X X X X X X
Israel X X X X X X X X
Italy
Ivory Coast
Japan X X X X X X X X X X X X X XKenya X X X X X X X X X X X X
Latvia X X X X X X X X X X X X XLebanon
Liberia
Lithuania X X X X X X X X X X X X X X X X XMacedonia X X X X X X X X X X X
Mali X X X X X X X X X XMalta
42

Labo
ur
Exch
ange
Com
pute
rised
Jo
b B
ank/
Job
mat
chng
i
a arke
t fo ro
gram
s
rain
i
elf
mp ro
gram
s
rogr
ams
rogr
ams
for
rogr
ams
for
ed
r
Lbo
ur
Exch
ange
on
the
Inte
rnet
Une
mpl
oym
ent
Insu
ranc
e
Labo
ur
MIn
rmat
ion
Act
ive
Pfo
r em
ploy
ers
Voca
tiona
l G
uida
nce
Voca
tiona
l T
ng
Job
Sear
ch
Ass
ista
nce
SE
loym
ent
P
Prog
ram
s fo
r w
omen
Yout
h P
P Old
er W
orke
rs
Prog
ram
s fo
r th
e D
isab
led
P the
long
-term
un
empl
oy
Prog
ram
s fo
r Im
mig
rant
s
Prog
ram
s fo
r pe
ople
with
hi
ghe
educ
atio
nP
mob
ilwr
fog
ram
sor
ity
or
kers
C
oope
ratio
n w
ith h
alth
e
auth
oriti
es
Coo
pera
tion
with
soc
ial
serv
ices
au
thor
ities
Mauritania X
Mauritius X X X X X X X X X X X X X XMexico X X X X X X X X X X X X X X X X XMongolia X X X X X X XMorocco
Netherlands X X X X X X X XNew Zealand
Nicaragua X X X X X X X X X X X X X
Niger X X X X X X X X X X X X X X X XNorway X X X X X X X X X X X X X X
Panama X X
Paraguay
Peru X X X X X X XPhilippines X X X X X X X X X
Poland
Portugal X X X X X X X X X X
Romania X X X X X X X X X X X X X X X X X XSaudi Arabia X X X X X X X X X X X X XSenegal
Slovakia X X X X X X X X X X X X X X X X X X X
43

Labo
ur
Exch
ange
Com
pute
rised
Jo
b B
ank/
Job
mat
chng
i
a arke
t fo ro
gram
s
rain
i
elf
mp ro
gram
s
rogr
ams
rogr
ams
for
rogr
ams
for
ed
r
Lbo
ur
Exch
ange
on
the
Inte
rnet
Une
mpl
oym
ent
Insu
ranc
e
Labo
ur
MIn
rmat
ion
Act
ive
Pfo
r em
ploy
ers
Voca
tiona
l G
uida
nce
Voca
tiona
l T
ng
Job
Sear
ch
Ass
ista
nce
SE
loym
ent
P
Prog
ram
s fo
r w
omen
Yout
h P
P Old
er W
orke
rs
Prog
ram
s fo
r th
e D
isab
led
P the
long
-term
un
empl
oy
Prog
ram
s fo
r Im
mig
rant
s
Prog
ram
s fo
r pe
ople
with
hi
ghe
educ
atio
nP
mob
ilwr
fog
ram
sor
ity
or
kers
C
oope
ratio
n w
ith h
alth
e
auth
oriti
es
Coo
pera
tion
with
soc
ial
serv
ices
au
thor
ities
Sloveni a
South Africa
Spain X X X X X X X X X X X X X X X X XSweden X X X X X X X X X X X X X X
Switzerland X X X X X X X X X X X X X X X X X XThailand X X X X X X
Togo X
Tunisia X X X X X X X X X X
Turkey X X X X XUganda United Kingdom X X X X X X X X X X X
United States
Uruguay
Venezuela
Zimbabwe X X X X
Source: 2002 and 2003 World Association of Public Employment Services (WAPES) Member Surveys. Note: 33 countries highlighted reflect 2003 data; other figures are from the 2002 Survey. The following columns were not included in the 2002 survey: Computerised job bank/ job matching, vocational guidance, programs for people with higher education, programs for mobility workers, cooperation with health authorities, cooperation with social services authorities.
44


![LABOUR ACT [CHAPTER 28:01] AND SELECTED REGULATIONS](https://img.pdfslide.net/doc/110x75/6182058e6d409507ed5ee03c/labour-act-chapter-2801-and-selected-regulations.jpg)