Embed Size (px)
Citation preview
change title
Performance on the nine specific objectives of the CAP
©Copyright: iStock
1
version: May 2020
This factsheet provides an overview of the agricultural sector and rural development in the EU-27. The factsheet
presents facts and figures for each of the 9 specific objectives of the Common Agricultural Policy after 2020, as
proposed by the Commission on 1 June 2018 (COM(2018)392 final). The information reflects all common context
indicators and impact indicators in relation to agriculture and rural development for which data is available to
date. This factsheet is based on available information received from Member States by the Commission up to May
2020. It is made available without prejudice to any finding in respect of Member State compliance with the
regulatory framework and does not prejudge on Member States' future CAP Strategic Plans.
2
Table of contents
List of abbreviations p. 4
Overview p. 5
p. 18
Specific objective 2: Enhance market orientation and increase competitiveness
Specific objective 9: Improve the response of EU agriculture to societal demands on food and health,
including safe, nutritious and sustainable food, as well as animal welfare
Cross-cutting objective: Fostering knowledge, innovation and digitalisation in agriculture
Specific objective 8: Promote employment, growth, social inclusion and local development in rural
areas, including bio-economy and sustainable forestry
Specific objective 7: Attract young farmers and facilitate business development in rural areas
Specific objective 6: Contribution to the protection of biodiversity, enhance ecosystem services and
preserve habitats and landscapes
Specific objective 1: Support viable farm income and resilience across the Union to enhance food
security
Indicator overview
Methodology
p. 6
p. 21
p. 24
p. 26
p. 29
p. 32
p. 34
p.35
Specific objective 5: Foster sustainable development and efficient management of natural resources
such as water, soil and air
Specific objective 4: Contribute to climate change mitigation and adaptation, as well as sustainable
energy
Specific objective 3: Improve the farmers' position in the value chain
p. 9
p. 13
p. 15
3
List of abbreviations
AECM Agri-environment-climate measures
AIR Annual implementation report
AL Arable land
ANC Areas with natural constraints
AWU Annual working unit
CAP Common Agricultural Policy
CATS Clearance of accounts Audit Trailing System
CMEF Common Monitoring and Evaluation Framework
COP Cereals, Oilseed and Protein crops
DG AGRI Directorate-General for Agriculture and Rural Development
DG ENV Directorate-General for Environment
EAFRD European Agricultural Fund for Rural Development
EEA European Environment Agency
EBB European Biodiesel Board
EBCC European Bird Census Council
EIP-AGRI European Innovation Platform for agricultural productivity and sustainability
ESVAC European Surveillance of Veterinary Antimicrobial Consumption
EU European Union
FADN Farm Accountancy Data Network
FNVA Farm Net Value Added
FY Financial Year
GDP Gross Domestic Product
GHG Greenhouse gasses
GNB Gross Nutrient Balance
IA Impact Assessment
JRC Joint Research Center
LFA Less Favoured Areas
LU Livestock Unit
LUCAS Land use and land cover survey
MS Member State
NEC National Emission Ceilings
NUTS Nomenclature of Territorial Units for Statistics
OG Operational Groups
PC Permanent Crops
PCU Population correction unit
PECBMS Pan-European Common Bird Monitoring Scheme
PG Permanent grassland
PMEF Performance Monitoring and Evaluation Framework
PPP Plant protection products
PPS Purchasing Power Standard
RD Rural Development
RE renewable energy
SFC System for Fund Management in the European Union
TFP Total Factor Productivity
toe tonnes of oil equivalent
UAA Utilised Agricultural Area
4
Overview
Greenhouse gas emissions (GHG) from agriculture have declined substantially between 1990 and
2010. Since then, emission levels appear to be relatively stable. Emissions from agriculture (including
croplands and grasslands) account for roughly 12.6% of total EU GHG emissions in 2017.
In 2018, farmers earned on average just under half of what could be gained in other jobs, while it
was 37% a decade ago in 2008.
The trade balance in the EU-27 is positive and followed a positive trend in which both imports and
exports are increasing over time. 2019 was a record year for both imports and exports of EU agri-
food products.
Agriculture is characterised by a stagnant and low share of value added in the value chain (around
25% of the total value added), due to high input costs, variation in production and incorporation of
new services.
The agricultural income per worker steadily increased over time to EUR 18 200 in 2019. Direct
payments provide a safety net to farmers, which form about 1/4 of the agricultural income.
The employment rate in rural areas has increased and the gap with urban areas has almost
disappeared in 2018, when 72% of the working-age population (aged 20 to 64) were employed in
rural areas.
In addition, the rural poverty rate in the EU-27 decreased over time from 30% in 2010 to 23.7% in
2018. It shows a continuous downward trend between 2010 and 2018.
At the end of 2018, 52% of rural households were served by a Next Generation Access network
compared to 81% of total EU rural households. There is a clear improvement on the situation over
time in rural areas, but closing the connectivity gap of rural areas with regard to Next Generation
Access remains a challenge.
The nitrogen surplus in EU-27 remained more or less stable in the last decade (2005-2015) at around
50 kg N per hectare per year. The target under the Farm to Fork strategy aims to reduce by 50% the
nutrient losses on agricultural land by 2030.
Landscape features are supplying many benefits to agro-ecosystems and the wider environment.
Currently, about 0.5% of the agricultural area is covered by landscape features. In addition, 4.1% is
land laying fallow.
In the EU-27 the share of young farmers below 35 years of age in the total number of farm managers
decreased over time between 2010 and 2016 towards 5.1%.
The overall sales of veterinary anitmicrobials across the EU-27 have decreased by more one third
between 2010 and 2017 weighted for those MS that provided data each year.
The total area under organic farming is increasing in the EU-27, covering almost 13 million hectares
in 2018. With 8.0% of the total utilized agricultural area under organic farming in 2018, the EU-27
area follows a positive trend.
In the EU-27, the share of managers with basic agricultural training equals 23%, whereas 9%
achieved a full agricultural training in 2016. This share is rather slowly increasing between 2010 and
2016. Full agricultural training means any training course continuing for the equivalent of at least two
years full time training after the end of compulsory education and completed at an agricultural
college, university or other institute of higher education in agriculture.
5
©Copyright: iStock
SUPPORT VIABLE FARM INCOME AND RESILIENCE
ACROSS THE UNION TO ENHANCE FOOD SECURITY
6
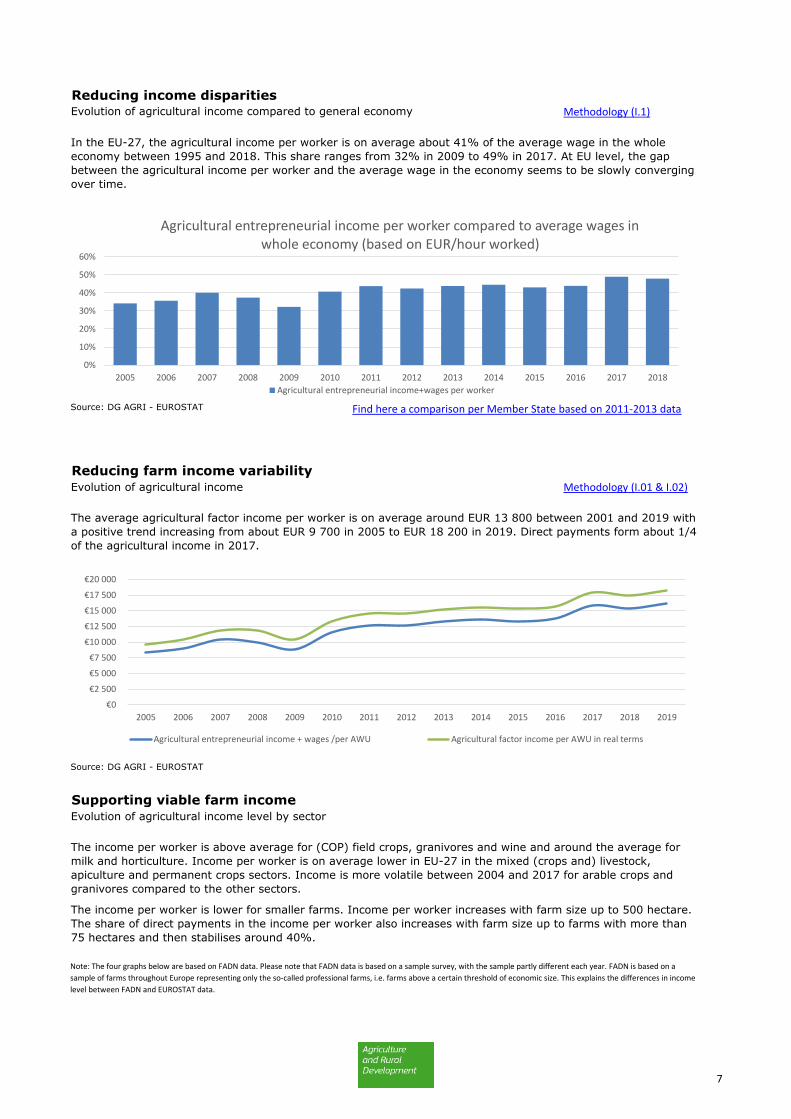
Reducing income disparitiesEvolution of agricultural income compared to general economy Methodology (I.1)
Source: DG AGRI - EUROSTAT Find here a comparison per Member State based on 2011-2013 data
Reducing farm income variabilityEvolution of agricultural income Methodology (I.01 & I.02)
Source: DG AGRI - EUROSTAT
Supporting viable farm incomeEvolution of agricultural income level by sector
Note: The four graphs below are based on FADN data. Please note that FADN data is based on a sample survey, with the sample partly different each year. FADN is based on a
sample of farms throughout Europe representing only the so-called professional farms, i.e. farms above a certain threshold of economic size. This explains the differences in income
level between FADN and EUROSTAT data.
The average agricultural factor income per worker is on average around EUR 13 800 between 2001 and 2019 with
a positive trend increasing from about EUR 9 700 in 2005 to EUR 18 200 in 2019. Direct payments form about 1/4
of the agricultural income in 2017.
In the EU-27, the agricultural income per worker is on average about 41% of the average wage in the whole
economy between 1995 and 2018. This share ranges from 32% in 2009 to 49% in 2017. At EU level, the gap
between the agricultural income per worker and the average wage in the economy seems to be slowly converging
over time.
The income per worker is above average for (COP) field crops, granivores and wine and around the average for
milk and horticulture. Income per worker is on average lower in EU-27 in the mixed (crops and) livestock,
apiculture and permanent crops sectors. Income is more volatile between 2004 and 2017 for arable crops and
granivores compared to the other sectors.
The income per worker is lower for smaller farms. Income per worker increases with farm size up to 500 hectare.
The share of direct payments in the income per worker also increases with farm size up to farms with more than
75 hectares and then stabilises around 40%.
€0
€2 500
€5 000
€7 500
€10 000
€12 500
€15 000
€17 500
€20 000
2005 2006 2007 2008 2009 2010 2011 2012 2013 2014 2015 2016 2017 2018 2019
Agricultural entrepreneurial income + wages /per AWU Agricultural factor income per AWU in real terms
0%
10%
20%
30%
40%
50%
60%
2005 2006 2007 2008 2009 2010 2011 2012 2013 2014 2015 2016 2017 2018
Agricultural entrepreneurial income per worker compared to average wages in whole economy (based on EUR/hour worked)
Agricultural entrepreneurial income+wages per worker
7
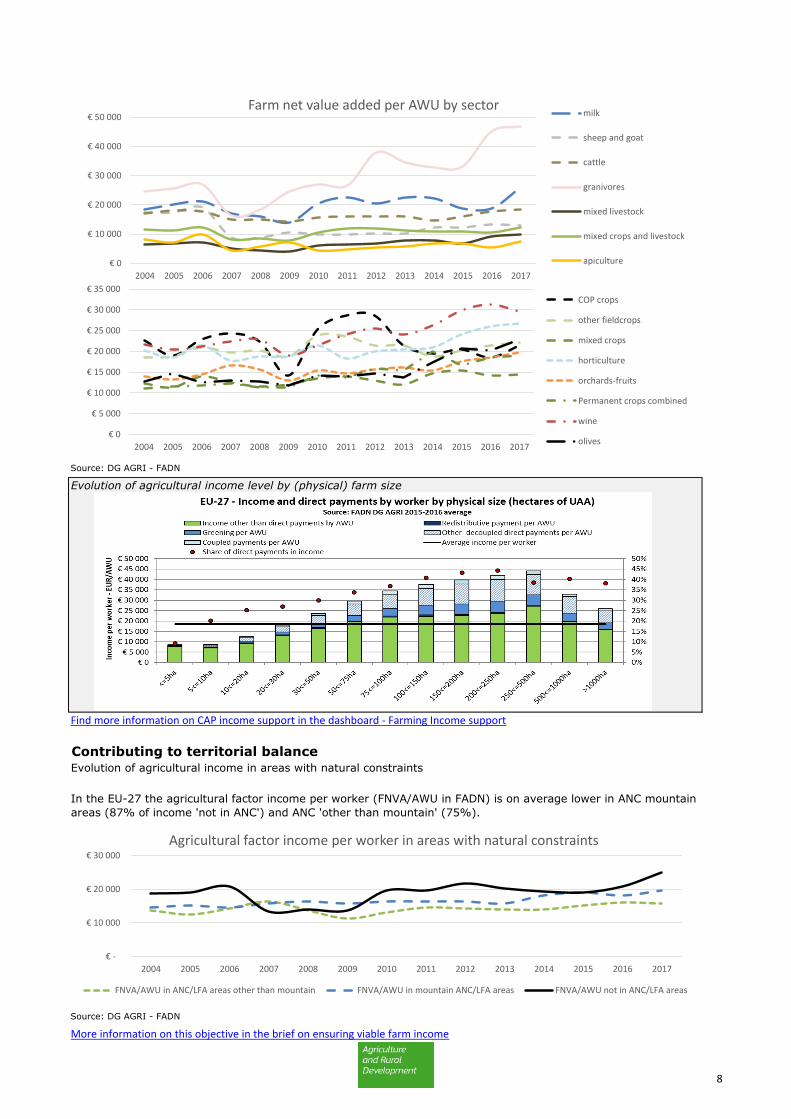
Source: DG AGRI - FADN
Evolution of agricultural income level by (physical) farm size
Find more information on CAP income support in the dashboard - Farming Income support
Contributing to territorial balanceEvolution of agricultural income in areas with natural constraints
Source: DG AGRI - FADN
More information on this objective in the brief on ensuring viable farm income
In the EU-27 the agricultural factor income per worker (FNVA/AWU in FADN) is on average lower in ANC mountain
areas (87% of income 'not in ANC') and ANC 'other than mountain' (75%).
€ -
€ 10 000
€ 20 000
€ 30 000
2004 2005 2006 2007 2008 2009 2010 2011 2012 2013 2014 2015 2016 2017
Agricultural factor income per worker in areas with natural constraints
FNVA/AWU in ANC/LFA areas other than mountain FNVA/AWU in mountain ANC/LFA areas FNVA/AWU not in ANC/LFA areas
€ 0
€ 5 000
€ 10 000
€ 15 000
€ 20 000
€ 25 000
€ 30 000
€ 35 000
2004 2005 2006 2007 2008 2009 2010 2011 2012 2013 2014 2015 2016 2017
COP crops
other fieldcrops
mixed crops
horticulture
orchards-fruits
Permanent crops combined
wine
olives
€ 0
€ 10 000
€ 20 000
€ 30 000
€ 40 000
€ 50 000
2004 2005 2006 2007 2008 2009 2010 2011 2012 2013 2014 2015 2016 2017
Farm net value added per AWU by sectormilk
sheep and goat
cattle
granivores
mixed livestock
mixed crops and livestock
apiculture
8
©Copyright: iStock
ENHANCE MARKET ORIENTATION
AND INCREASE COMPETITIVENESS
9
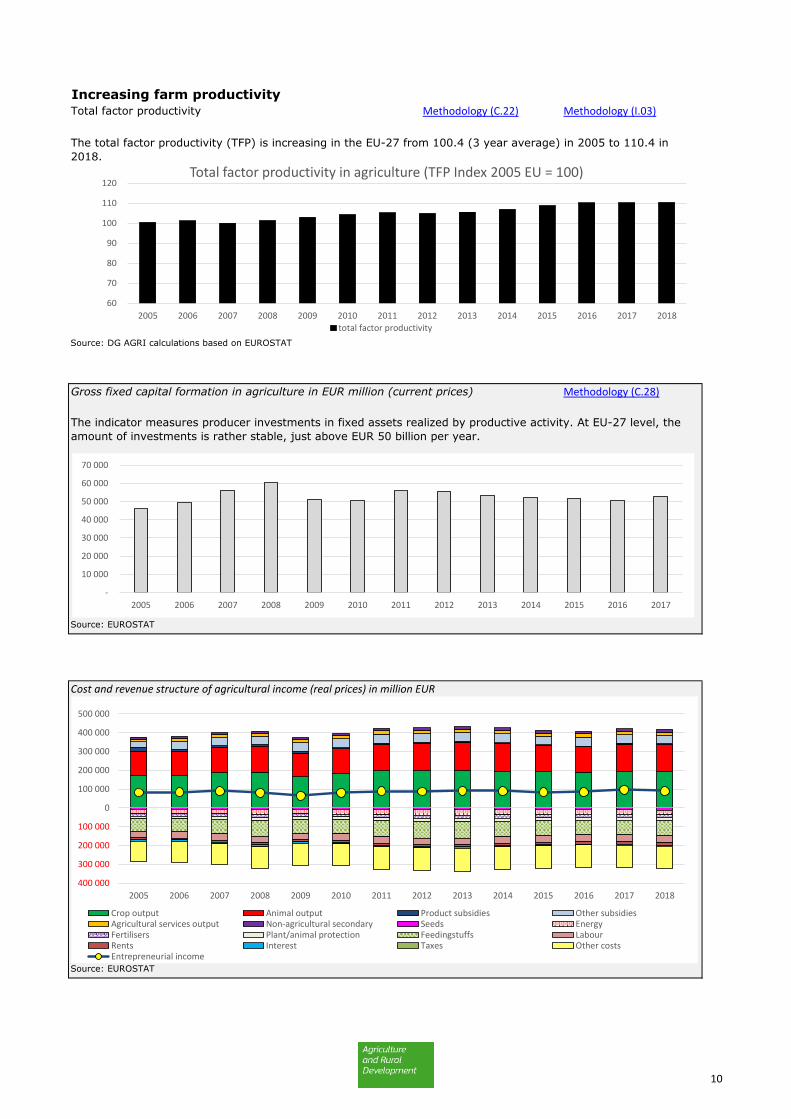
Increasing farm productivityTotal factor productivity Methodology (C.22) Methodology (I.03)
Source: DG AGRI calculations based on EUROSTAT
Gross fixed capital formation in agriculture in EUR million (current prices) Methodology (C.28)
Source: EUROSTAT
Cost and revenue structure of agricultural income (real prices) in million EUR
Source: EUROSTAT
The indicator measures producer investments in fixed assets realized by productive activity. At EU-27 level, the
amount of investments is rather stable, just above EUR 50 billion per year.
The total factor productivity (TFP) is increasing in the EU-27 from 100.4 (3 year average) in 2005 to 110.4 in
2018.
60
70
80
90
100
110
120
2005 2006 2007 2008 2009 2010 2011 2012 2013 2014 2015 2016 2017 2018
Total factor productivity in agriculture (TFP Index 2005 EU = 100)
total factor productivity
400 000
300 000
200 000
100 000
0
100 000
200 000
300 000
400 000
500 000
2005 2006 2007 2008 2009 2010 2011 2012 2013 2014 2015 2016 2017 2018
Crop output Animal output Product subsidies Other subsidiesAgricultural services output Non-agricultural secondary Seeds EnergyFertilisers Plant/animal protection Feedingstuffs LabourRents Interest Taxes Other costsEntrepreneurial income
-
10 000
20 000
30 000
40 000
50 000
60 000
70 000
2005 2006 2007 2008 2009 2010 2011 2012 2013 2014 2015 2016 2017
10
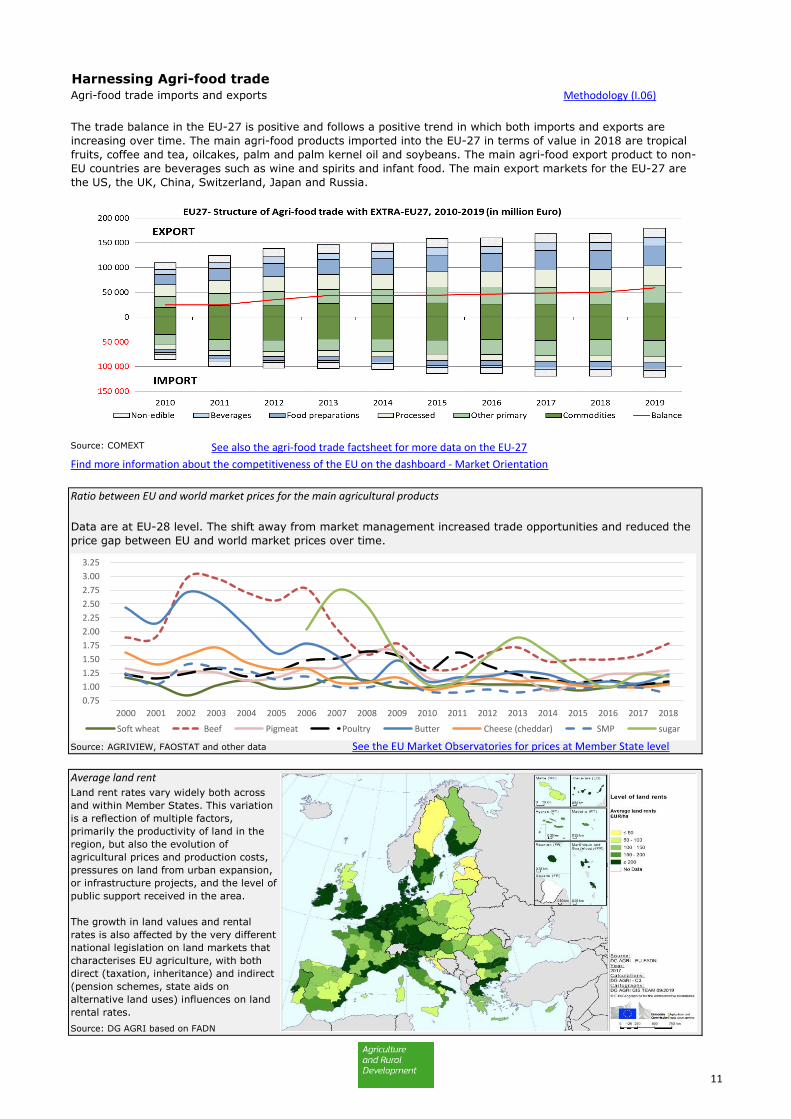
Harnessing Agri-food tradeAgri-food trade imports and exports Methodology (I.06)
Source: COMEXT See also the agri-food trade factsheet for more data on the EU-27
Find more information about the competitiveness of the EU on the dashboard - Market Orientation
Ratio between EU and world market prices for the main agricultural products
Source: AGRIVIEW, FAOSTAT and other data See the EU Market Observatories for prices at Member State level
Average land rent
Source: DG AGRI based on FADN
Data are at EU-28 level. The shift away from market management increased trade opportunities and reduced the
price gap between EU and world market prices over time.
Land rent rates vary widely both across
and within Member States. This variation
is a reflection of multiple factors,
primarily the productivity of land in the
region, but also the evolution of
agricultural prices and production costs,
pressures on land from urban expansion,
or infrastructure projects, and the level of
public support received in the area.
The growth in land values and rental
rates is also affected by the very different
national legislation on land markets that
characterises EU agriculture, with both
direct (taxation, inheritance) and indirect
(pension schemes, state aids on
alternative land uses) influences on land
rental rates.
The trade balance in the EU-27 is positive and follows a positive trend in which both imports and exports are
increasing over time. The main agri-food products imported into the EU-27 in terms of value in 2018 are tropical
fruits, coffee and tea, oilcakes, palm and palm kernel oil and soybeans. The main agri-food export product to non-
EU countries are beverages such as wine and spirits and infant food. The main export markets for the EU-27 are
the US, the UK, China, Switzerland, Japan and Russia.
0.75
1.00
1.25
1.50
1.75
2.00
2.25
2.50
2.75
3.00
3.25
2000 2001 2002 2003 2004 2005 2006 2007 2008 2009 2010 2011 2012 2013 2014 2015 2016 2017 2018
Soft wheat Beef Pigmeat Poultry Butter Cheese (cheddar) SMP sugar
11
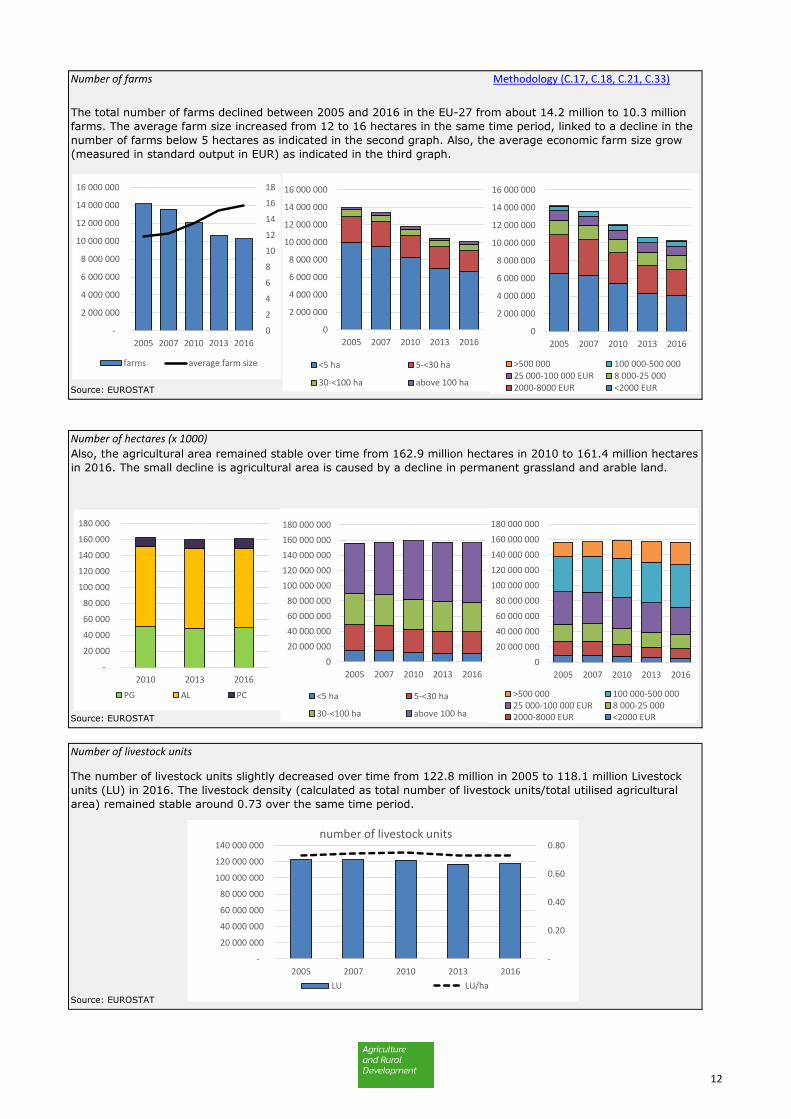
Number of farms Methodology (C.17, C.18, C.21, C.33)
Source: EUROSTAT
Number of hectares (x 1000)
Source: EUROSTAT
Number of livestock units
Source: EUROSTAT
The total number of farms declined between 2005 and 2016 in the EU-27 from about 14.2 million to 10.3 million
farms. The average farm size increased from 12 to 16 hectares in the same time period, linked to a decline in the
number of farms below 5 hectares as indicated in the second graph. Also, the average economic farm size grow
(measured in standard output in EUR) as indicated in the third graph.
Also, the agricultural area remained stable over time from 162.9 million hectares in 2010 to 161.4 million hectares
in 2016. The small decline is agricultural area is caused by a decline in permanent grassland and arable land.
The number of livestock units slightly decreased over time from 122.8 million in 2005 to 118.1 million Livestock
units (LU) in 2016. The livestock density (calculated as total number of livestock units/total utilised agricultural
area) remained stable around 0.73 over the same time period.
0
2
4
6
8
10
12
14
16
18
-
2 000 000
4 000 000
6 000 000
8 000 000
10 000 000
12 000 000
14 000 000
16 000 000
2005 2007 2010 2013 2016
farms average farm size
-
20 000
40 000
60 000
80 000
100 000
120 000
140 000
160 000
180 000
2010 2013 2016
PG AL PC
-
0.20
0.40
0.60
0.80
-
20 000 000
40 000 000
60 000 000
80 000 000
100 000 000
120 000 000
140 000 000
2005 2007 2010 2013 2016
number of livestock units
LU LU/ha
0
2 000 000
4 000 000
6 000 000
8 000 000
10 000 000
12 000 000
14 000 000
16 000 000
2005 2007 2010 2013 2016
<5 ha 5-<30 ha
30-<100 ha above 100 ha
0
2 000 000
4 000 000
6 000 000
8 000 000
10 000 000
12 000 000
14 000 000
16 000 000
2005 2007 2010 2013 2016
>500 000 100 000-500 00025 000-100 000 EUR 8 000-25 0002000-8000 EUR <2000 EUR
0
20 000 000
40 000 000
60 000 000
80 000 000
100 000 000
120 000 000
140 000 000
160 000 000
180 000 000
2005 2007 2010 2013 2016
<5 ha 5-<30 ha
30-<100 ha above 100 ha
0
20 000 000
40 000 000
60 000 000
80 000 000
100 000 000
120 000 000
140 000 000
160 000 000
180 000 000
2005 2007 2010 2013 2016
>500 000 100 000-500 00025 000-100 000 EUR 8 000-25 0002000-8000 EUR <2000 EUR
12
©Copyright: iStock
IMPROVE THE FARMERS' POSITION IN THE VALUE
CHAIN
13
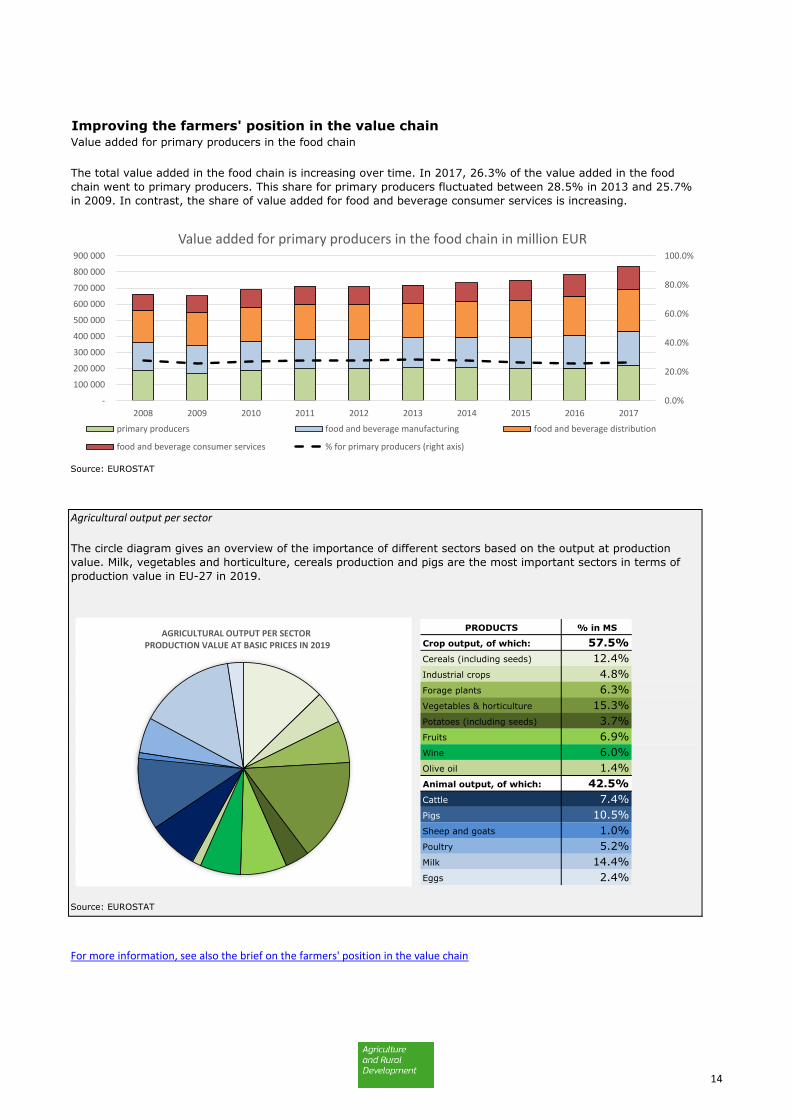
Improving the farmers' position in the value chainValue added for primary producers in the food chain
Source: EUROSTAT
Agricultural output per sector
% in MS
57.5%
Cereals (including seeds) 12.4%
Industrial crops 4.8%
Forage plants 6.3%
Vegetables & horticulture 15.3%
Potatoes (including seeds) 3.7%
Fruits 6.9%
Wine 6.0%
Olive oil 1.4%
Animal output, of which: 42.5%
Cattle 7.4%
Pigs 10.5%
Sheep and goats 1.0%
Poultry 5.2%
Milk 14.4%
Eggs 2.4%
Source: EUROSTAT
For more information, see also the brief on the farmers' position in the value chain
Crop output, of which:
PRODUCTS
The circle diagram gives an overview of the importance of different sectors based on the output at production
value. Milk, vegetables and horticulture, cereals production and pigs are the most important sectors in terms of
production value in EU-27 in 2019.
The total value added in the food chain is increasing over time. In 2017, 26.3% of the value added in the food
chain went to primary producers. This share for primary producers fluctuated between 28.5% in 2013 and 25.7%
in 2009. In contrast, the share of value added for food and beverage consumer services is increasing.
0.0%
20.0%
40.0%
60.0%
80.0%
100.0%
-
100 000
200 000
300 000
400 000
500 000
600 000
700 000
800 000
900 000
2008 2009 2010 2011 2012 2013 2014 2015 2016 2017
Value added for primary producers in the food chain in million EUR
primary producers food and beverage manufacturing food and beverage distribution
food and beverage consumer services % for primary producers (right axis)
AGRICULTURAL OUTPUT PER SECTORPRODUCTION VALUE AT BASIC PRICES IN 2019
14
©Copyright: iStock
CONTRIBUTE TO CLIMATE CHANGE MITIGATION
AND ADAPTATION, AS WELL AS SUSTAINABLE
ENERGY
15
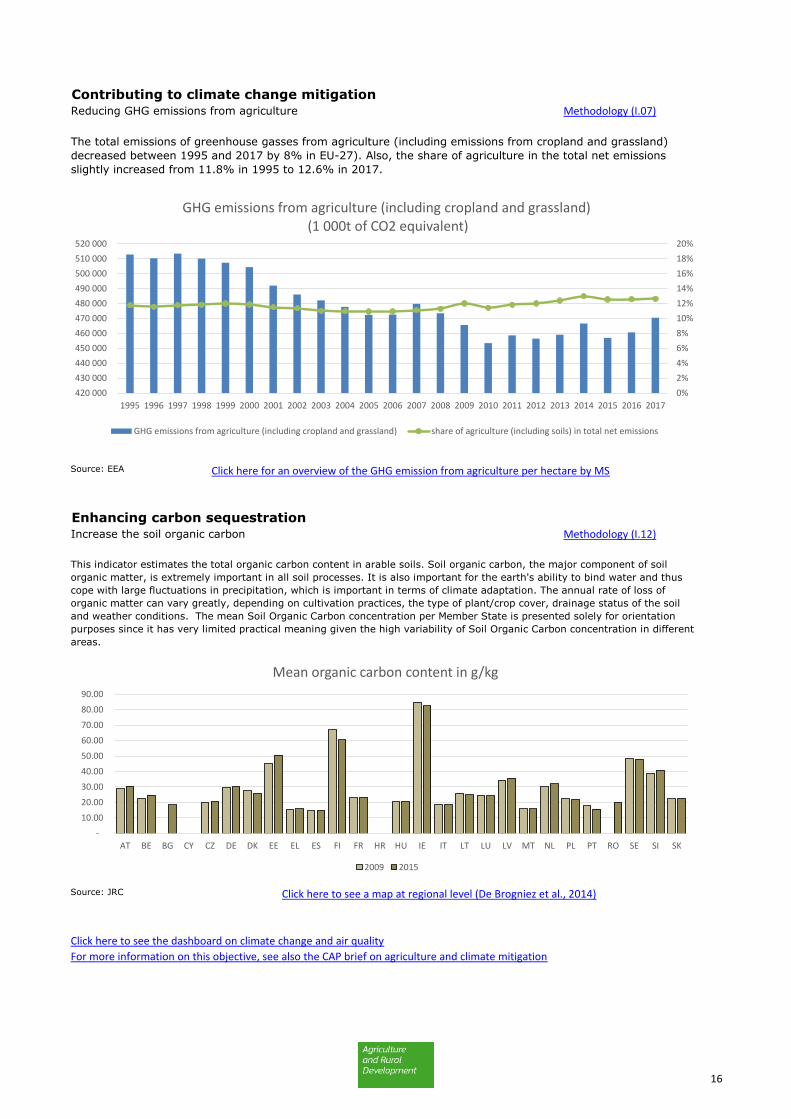
Contributing to climate change mitigationReducing GHG emissions from agriculture Methodology (I.07)
Source: EEA Click here for an overview of the GHG emission from agriculture per hectare by MS
Enhancing carbon sequestrationIncrease the soil organic carbon Methodology (I.12)
Source: JRC Click here to see a map at regional level (De Brogniez et al., 2014)
Click here to see the dashboard on climate change and air quality
For more information on this objective, see also the CAP brief on agriculture and climate mitigation
The total emissions of greenhouse gasses from agriculture (including emissions from cropland and grassland)
decreased between 1995 and 2017 by 8% in EU-27). Also, the share of agriculture in the total net emissions
slightly increased from 11.8% in 1995 to 12.6% in 2017.
This indicator estimates the total organic carbon content in arable soils. Soil organic carbon, the major component of soil
organic matter, is extremely important in all soil processes. It is also important for the earth's ability to bind water and thus
cope with large fluctuations in precipitation, which is important in terms of climate adaptation. The annual rate of loss of
organic matter can vary greatly, depending on cultivation practices, the type of plant/crop cover, drainage status of the soil
and weather conditions. The mean Soil Organic Carbon concentration per Member State is presented solely for orientation
purposes since it has very limited practical meaning given the high variability of Soil Organic Carbon concentration in different
areas.
0%
2%
4%
6%
8%
10%
12%
14%
16%
18%
20%
420 000
430 000
440 000
450 000
460 000
470 000
480 000
490 000
500 000
510 000
520 000
1995 1996 1997 1998 1999 2000 2001 2002 2003 2004 2005 2006 2007 2008 2009 2010 2011 2012 2013 2014 2015 2016 2017
GHG emissions from agriculture (including cropland and grassland) (1 000t of CO2 equivalent)
GHG emissions from agriculture (including cropland and grassland) share of agriculture (including soils) in total net emissions
-
10.00
20.00
30.00
40.00
50.00
60.00
70.00
80.00
90.00
AT BE BG CY CZ DE DK EE EL ES FI FR HR HU IE IT LT LU LV MT NL PL PT RO SE SI SK
Mean organic carbon content in g/kg
2009 2015
16
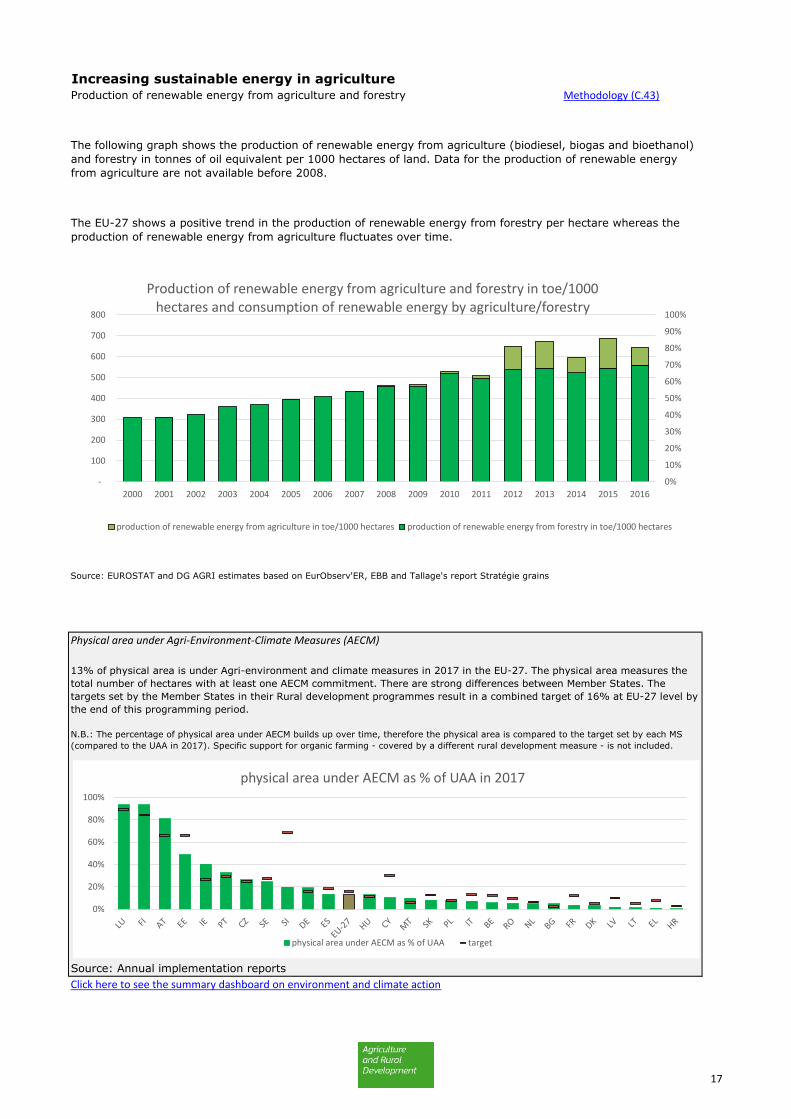
Increasing sustainable energy in agricultureProduction of renewable energy from agriculture and forestry Methodology (C.43)
Source: EUROSTAT and DG AGRI estimates based on EurObserv'ER, EBB and Tallage's report Stratégie grains
Physical area under Agri-Environment-Climate Measures (AECM)
Source: Annual implementation reports
Click here to see the summary dashboard on environment and climate action
The following graph shows the production of renewable energy from agriculture (biodiesel, biogas and bioethanol)
and forestry in tonnes of oil equivalent per 1000 hectares of land. Data for the production of renewable energy
from agriculture are not available before 2008.
The EU-27 shows a positive trend in the production of renewable energy from forestry per hectare whereas the
production of renewable energy from agriculture fluctuates over time.
13% of physical area is under Agri-environment and climate measures in 2017 in the EU-27. The physical area measures the
total number of hectares with at least one AECM commitment. There are strong differences between Member States. The
targets set by the Member States in their Rural development programmes result in a combined target of 16% at EU-27 level by
the end of this programming period.
N.B.: The percentage of physical area under AECM builds up over time, therefore the physical area is compared to the target set by each MS
(compared to the UAA in 2017). Specific support for organic farming - covered by a different rural development measure - is not included.
0%
10%
20%
30%
40%
50%
60%
70%
80%
90%
100%
-
100
200
300
400
500
600
700
800
2000 2001 2002 2003 2004 2005 2006 2007 2008 2009 2010 2011 2012 2013 2014 2015 2016
Production of renewable energy from agriculture and forestry in toe/1000 hectares and consumption of renewable energy by agriculture/forestry
production of renewable energy from agriculture in toe/1000 hectares production of renewable energy from forestry in toe/1000 hectares
0%
20%
40%
60%
80%
100%
physical area under AECM as % of UAA in 2017
physical area under AECM as % of UAA target
17
©Copyright: iStock
FOSTER SUSTAINABLE DEVELOPMENT AND
EFFICIENT MANAGEMENT OF NATURAL RESOURCES
SUCH AS WATER, SOIL AND AIR
18
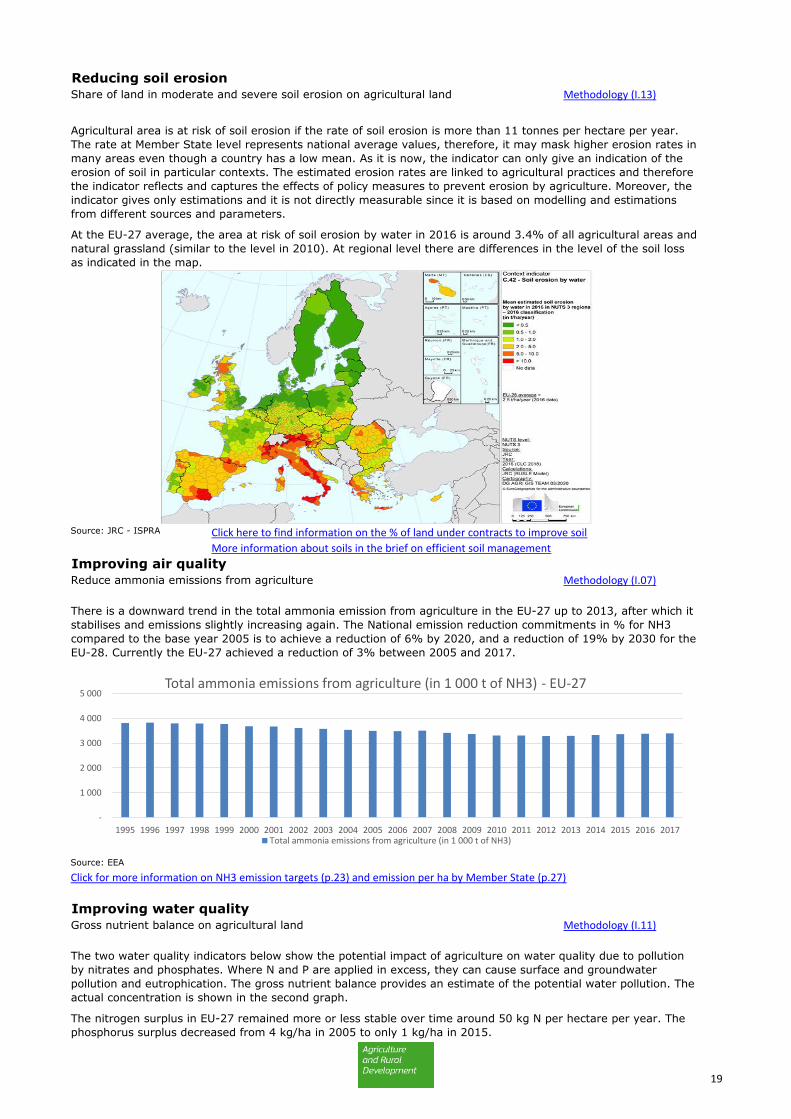
Reducing soil erosionShare of land in moderate and severe soil erosion on agricultural land Methodology (I.13)
Source: JRC - ISPRA Click here to find information on the % of land under contracts to improve soil
More information about soils in the brief on efficient soil management
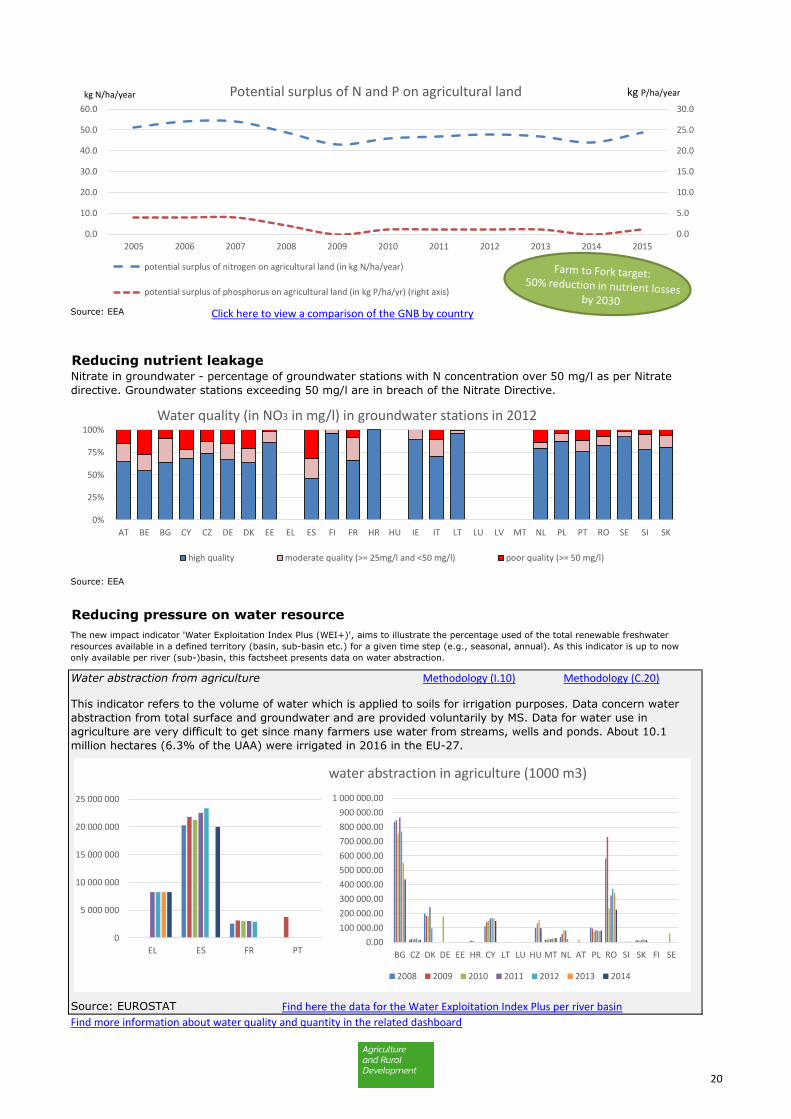
Improving air qualityReduce ammonia emissions from agriculture Methodology (I.07)
Source: EEA
Click for more information on NH3 emission targets (p.23) and emission per ha by Member State (p.27)
Improving water qualityGross nutrient balance on agricultural land Methodology (I.11)
The two water quality indicators below show the potential impact of agriculture on water quality due to pollution
by nitrates and phosphates. Where N and P are applied in excess, they can cause surface and groundwater
pollution and eutrophication. The gross nutrient balance provides an estimate of the potential water pollution. The
actual concentration is shown in the second graph.
Agricultural area is at risk of soil erosion if the rate of soil erosion is more than 11 tonnes per hectare per year.
The rate at Member State level represents national average values, therefore, it may mask higher erosion rates in
many areas even though a country has a low mean. As it is now, the indicator can only give an indication of the
erosion of soil in particular contexts. The estimated erosion rates are linked to agricultural practices and therefore
the indicator reflects and captures the effects of policy measures to prevent erosion by agriculture. Moreover, the
indicator gives only estimations and it is not directly measurable since it is based on modelling and estimations
from different sources and parameters.
At the EU-27 average, the area at risk of soil erosion by water in 2016 is around 3.4% of all agricultural areas and
natural grassland (similar to the level in 2010). At regional level there are differences in the level of the soil loss
as indicated in the map.
The nitrogen surplus in EU-27 remained more or less stable over time around 50 kg N per hectare per year. The
phosphorus surplus decreased from 4 kg/ha in 2005 to only 1 kg/ha in 2015.
There is a downward trend in the total ammonia emission from agriculture in the EU-27 up to 2013, after which it
stabilises and emissions slightly increasing again. The National emission reduction commitments in % for NH3
compared to the base year 2005 is to achieve a reduction of 6% by 2020, and a reduction of 19% by 2030 for the
EU-28. Currently the EU-27 achieved a reduction of 3% between 2005 and 2017.
-
1 000
2 000
3 000
4 000
5 000
1995 1996 1997 1998 1999 2000 2001 2002 2003 2004 2005 2006 2007 2008 2009 2010 2011 2012 2013 2014 2015 2016 2017
Total ammonia emissions from agriculture (in 1 000 t of NH3) - EU-27
Total ammonia emissions from agriculture (in 1 000 t of NH3)
19
Source: EEA Click here to view a comparison of the GNB by country
Reducing nutrient leakage
Source: EEA
Reducing pressure on water resource
Water abstraction from agriculture Methodology (I.10) Methodology (C.20)
Source: EUROSTAT Find here the data for the Water Exploitation Index Plus per river basin
Find more information about water quality and quantity in the related dashboard
The new impact indicator 'Water Exploitation Index Plus (WEI+)', aims to illustrate the percentage used of the total renewable freshwater
resources available in a defined territory (basin, sub-basin etc.) for a given time step (e.g., seasonal, annual). As this indicator is up to now
only available per river (sub-)basin, this factsheet presents data on water abstraction.
Nitrate in groundwater - percentage of groundwater stations with N concentration over 50 mg/l as per Nitrate
directive. Groundwater stations exceeding 50 mg/l are in breach of the Nitrate Directive.
The nitrogen surplus in EU-27 remained more or less stable over time around 50 kg N per hectare per year. The
phosphorus surplus decreased from 4 kg/ha in 2005 to only 1 kg/ha in 2015.
This indicator refers to the volume of water which is applied to soils for irrigation purposes. Data concern water
abstraction from total surface and groundwater and are provided voluntarily by MS. Data for water use in
agriculture are very difficult to get since many farmers use water from streams, wells and ponds. About 10.1
million hectares (6.3% of the UAA) were irrigated in 2016 in the EU-27.
0%
25%
50%
75%
100%
AT BE BG CY CZ DE DK EE EL ES FI FR HR HU IE IT LT LU LV MT NL PL PT RO SE SI SK
Water quality (in NO3 in mg/l) in groundwater stations in 2012
high quality moderate quality (>= 25mg/l and <50 mg/l) poor quality (>= 50 mg/l)
0.0
5.0
10.0
15.0
20.0
25.0
30.0
0.0
10.0
20.0
30.0
40.0
50.0
60.0
2005 2006 2007 2008 2009 2010 2011 2012 2013 2014 2015
Potential surplus of N and P on agricultural land
potential surplus of nitrogen on agricultural land (in kg N/ha/year)
potential surplus of phosphorus on agricultural land (in kg P/ha/yr) (right axis)
kg N/ha/year kg P/ha/year
0
5 000 000
10 000 000
15 000 000
20 000 000
25 000 000
EL ES FR PT0.00
100 000.00
200 000.00
300 000.00
400 000.00
500 000.00
600 000.00
700 000.00
800 000.00
900 000.00
1 000 000.00
BG CZ DK DE EE HR CY LT LU HU MT NL AT PL RO SI SK FI SE
water abstraction in agriculture (1000 m3)
2008 2009 2010 2011 2012 2013 2014
20
©Copyright: iStock
CONTRIBUTION TO THE PROTECTION OF
BIODIVERSITY, ENHANCE ECOSYSTEM SERVICES
AND PRESERVE HABITATS AND LANDSCAPES
21
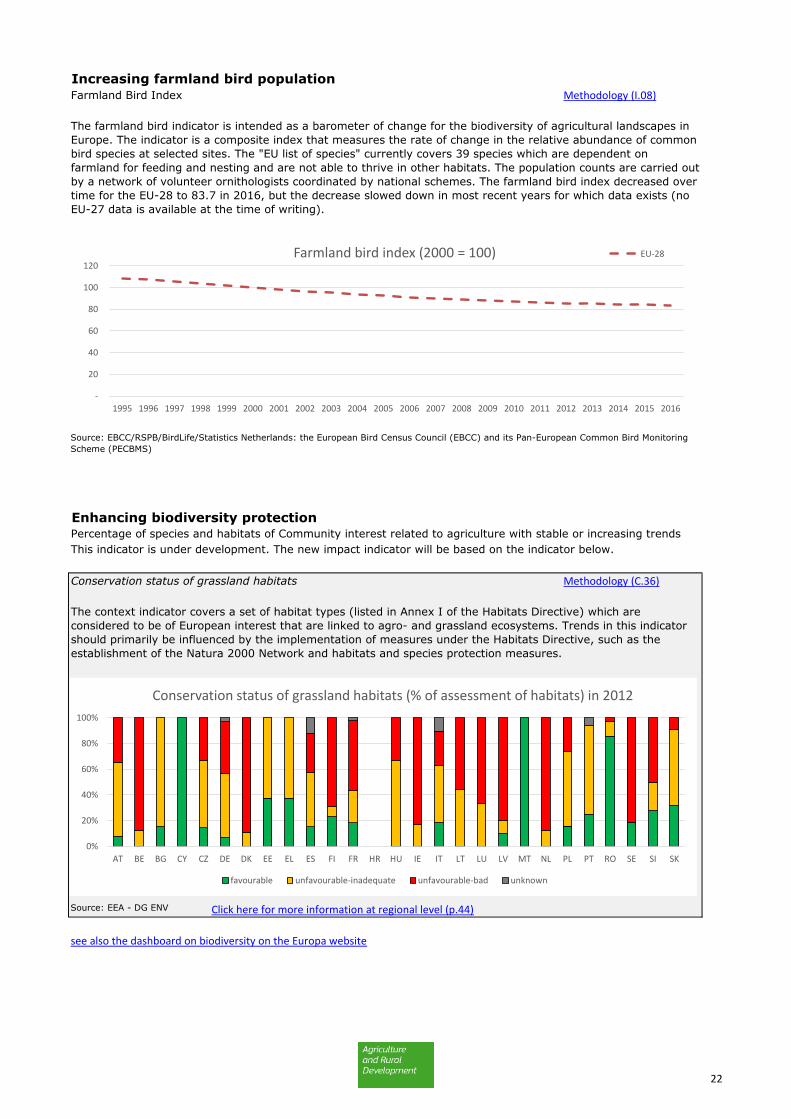
Increasing farmland bird populationFarmland Bird Index Methodology (I.08)
Enhancing biodiversity protectionPercentage of species and habitats of Community interest related to agriculture with stable or increasing trends
This indicator is under development. The new impact indicator will be based on the indicator below.
Conservation status of grassland habitats Methodology (C.36)
Source: EEA - DG ENV Click here for more information at regional level (p.44)
see also the dashboard on biodiversity on the Europa website
Source: EBCC/RSPB/BirdLife/Statistics Netherlands: the European Bird Census Council (EBCC) and its Pan-European Common Bird Monitoring
Scheme (PECBMS)
The context indicator covers a set of habitat types (listed in Annex I of the Habitats Directive) which are
considered to be of European interest that are linked to agro- and grassland ecosystems. Trends in this indicator
should primarily be influenced by the implementation of measures under the Habitats Directive, such as the
establishment of the Natura 2000 Network and habitats and species protection measures.
The farmland bird indicator is intended as a barometer of change for the biodiversity of agricultural landscapes in
Europe. The indicator is a composite index that measures the rate of change in the relative abundance of common
bird species at selected sites. The "EU list of species" currently covers 39 species which are dependent on
farmland for feeding and nesting and are not able to thrive in other habitats. The population counts are carried out
by a network of volunteer ornithologists coordinated by national schemes. The farmland bird index decreased over
time for the EU-28 to 83.7 in 2016, but the decrease slowed down in most recent years for which data exists (no
EU-27 data is available at the time of writing).
-
20
40
60
80
100
120
1995 1996 1997 1998 1999 2000 2001 2002 2003 2004 2005 2006 2007 2008 2009 2010 2011 2012 2013 2014 2015 2016
Farmland bird index (2000 = 100) EU-28
0%
20%
40%
60%
80%
100%
AT BE BG CY CZ DE DK EE EL ES FI FR HR HU IE IT LT LU LV MT NL PL PT RO SE SI SK
Conservation status of grassland habitats (% of assessment of habitats) in 2012
favourable unfavourable-inadequate unfavourable-bad unknown
22
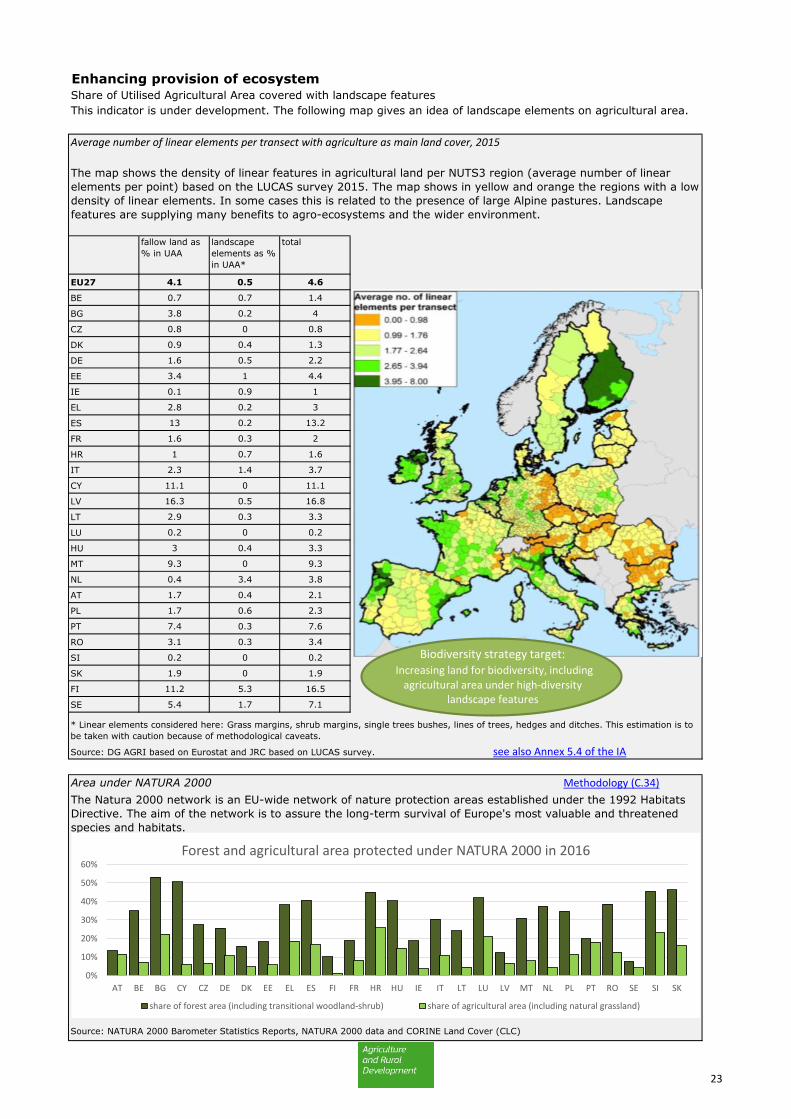
Enhancing provision of ecosystemShare of Utilised Agricultural Area covered with landscape features
This indicator is under development. The following map gives an idea of landscape elements on agricultural area.
Average number of linear elements per transect with agriculture as main land cover, 2015
fallow land as
% in UAA
landscape
elements as %
in UAA*
total
EU27 4.1 0.5 4.6
BE 0.7 0.7 1.4
BG 3.8 0.2 4
CZ 0.8 0 0.8
DK 0.9 0.4 1.3
DE 1.6 0.5 2.2
EE 3.4 1 4.4
IE 0.1 0.9 1
EL 2.8 0.2 3
ES 13 0.2 13.2
FR 1.6 0.3 2
HR 1 0.7 1.6
IT 2.3 1.4 3.7
CY 11.1 0 11.1
LV 16.3 0.5 16.8
LT 2.9 0.3 3.3
LU 0.2 0 0.2
HU 3 0.4 3.3
MT 9.3 0 9.3
NL 0.4 3.4 3.8
AT 1.7 0.4 2.1
PL 1.7 0.6 2.3
PT 7.4 0.3 7.6
RO 3.1 0.3 3.4
SI 0.2 0 0.2
SK 1.9 0 1.9
FI 11.2 5.3 16.5
SE 5.4 1.7 7.1
Source: DG AGRI based on Eurostat and JRC based on LUCAS survey. see also Annex 5.4 of the IA
Area under NATURA 2000 Methodology (C.34)
Source: NATURA 2000 Barometer Statistics Reports, NATURA 2000 data and CORINE Land Cover (CLC)
The Natura 2000 network is an EU-wide network of nature protection areas established under the 1992 Habitats
Directive. The aim of the network is to assure the long-term survival of Europe's most valuable and threatened
species and habitats.
The map shows the density of linear features in agricultural land per NUTS3 region (average number of linear
elements per point) based on the LUCAS survey 2015. The map shows in yellow and orange the regions with a low
density of linear elements. In some cases this is related to the presence of large Alpine pastures. Landscape
features are supplying many benefits to agro-ecosystems and the wider environment.
* Linear elements considered here: Grass margins, shrub margins, single trees bushes, lines of trees, hedges and ditches. This estimation is to
be taken with caution because of methodological caveats.
0%
10%
20%
30%
40%
50%
60%
AT BE BG CY CZ DE DK EE EL ES FI FR HR HU IE IT LT LU LV MT NL PL PT RO SE SI SK
Forest and agricultural area protected under NATURA 2000 in 2016
share of forest area (including transitional woodland-shrub) share of agricultural area (including natural grassland)
Biodiversity strategy target:Increasing land for biodiversity, including
agricultural area under high-diversity landscape features
23
©Copyright: iStock
ATTRACT YOUNG FARMERS AND FACILITATE
BUSINESS DEVELOPMENT IN RURAL AREAS
24
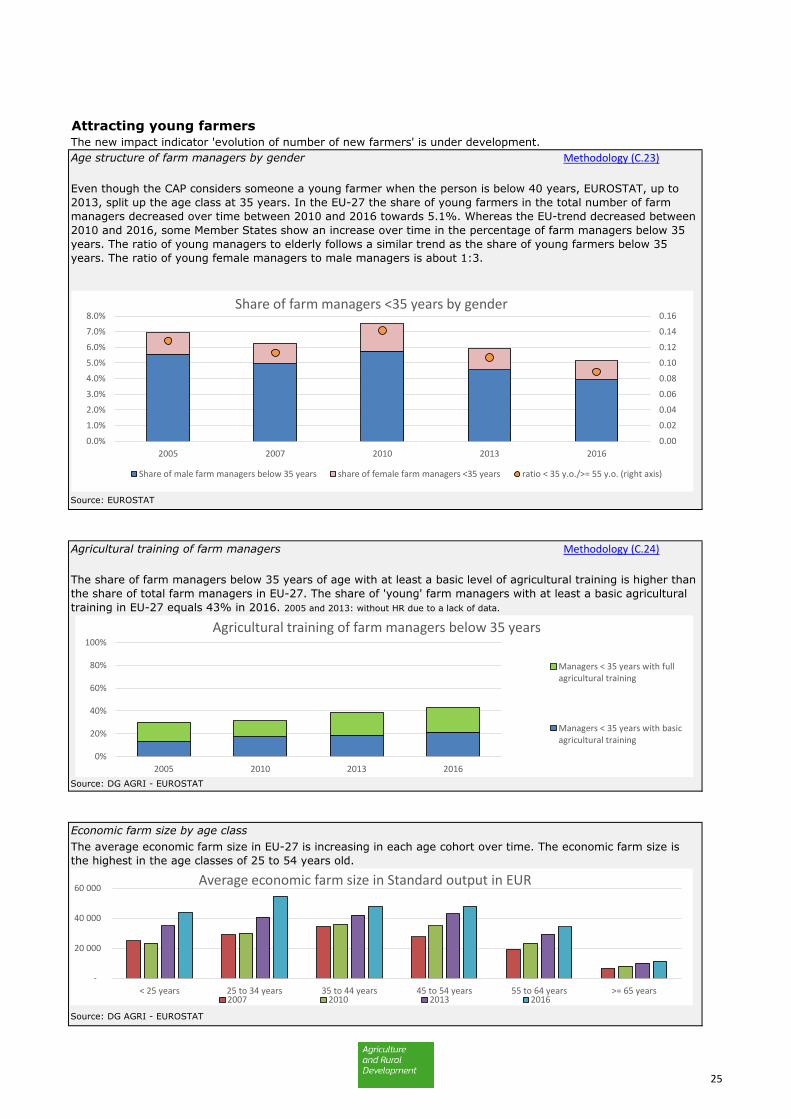
Attracting young farmersThe new impact indicator 'evolution of number of new farmers' is under development.
Age structure of farm managers by gender Methodology (C.23)
Source: EUROSTAT
Agricultural training of farm managers Methodology (C.24)
Source: DG AGRI - EUROSTAT
Economic farm size by age class
Source: DG AGRI - EUROSTAT
The share of farm managers below 35 years of age with at least a basic level of agricultural training is higher than
the share of total farm managers in EU-27. The share of 'young' farm managers with at least a basic agricultural
training in EU-27 equals 43% in 2016. 2005 and 2013: without HR due to a lack of data.
The average economic farm size in EU-27 is increasing in each age cohort over time. The economic farm size is
the highest in the age classes of 25 to 54 years old.
Even though the CAP considers someone a young farmer when the person is below 40 years, EUROSTAT, up to
2013, split up the age class at 35 years. In the EU-27 the share of young farmers in the total number of farm
managers decreased over time between 2010 and 2016 towards 5.1%. Whereas the EU-trend decreased between
2010 and 2016, some Member States show an increase over time in the percentage of farm managers below 35
years. The ratio of young managers to elderly follows a similar trend as the share of young farmers below 35
years. The ratio of young female managers to male managers is about 1:3.
0.00
0.02
0.04
0.06
0.08
0.10
0.12
0.14
0.16
0.0%
1.0%
2.0%
3.0%
4.0%
5.0%
6.0%
7.0%
8.0%
2005 2007 2010 2013 2016
Share of farm managers <35 years by gender
Share of male farm managers below 35 years share of female farm managers <35 years ratio < 35 y.o./>= 55 y.o. (right axis)
0%
20%
40%
60%
80%
100%
2005 2010 2013 2016
Agricultural training of farm managers below 35 years
Managers < 35 years with fullagricultural training
Managers < 35 years with basicagricultural training
-
20 000
40 000
60 000
< 25 years 25 to 34 years 35 to 44 years 45 to 54 years 55 to 64 years >= 65 years
Average economic farm size in Standard output in EUR
2007 2010 2013 2016
25
©Copyright: iStock
PROMOTE EMPLOYMENT, GROWTH, SOCIAL
INCLUSION AND LOCAL DEVELOPMENT IN RURAL
AREAS, INCLUDING BIO-ECONOMY AND
SUSTAINABLE FORESTRY
26
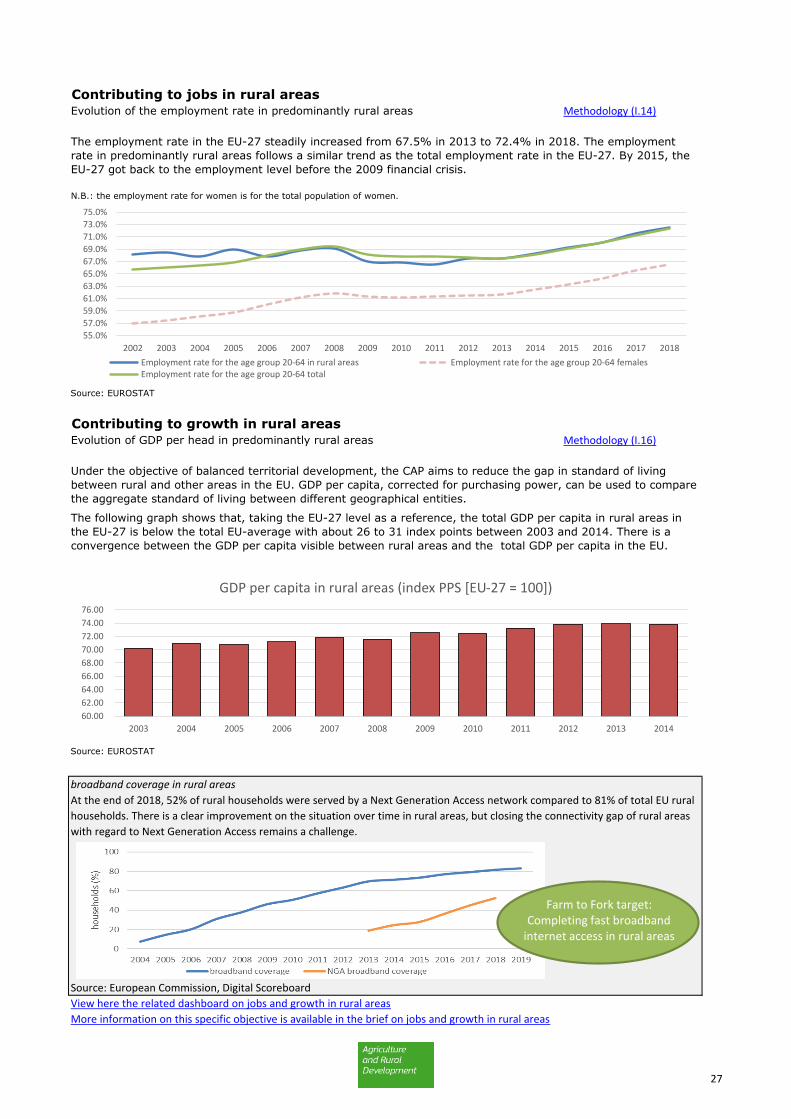
Contributing to jobs in rural areasEvolution of the employment rate in predominantly rural areas Methodology (I.14)
Source: EUROSTAT
Contributing to growth in rural areasEvolution of GDP per head in predominantly rural areas Methodology (I.16)
Source: EUROSTAT
broadband coverage in rural areas
Source: European Commission, Digital Scoreboard
View here the related dashboard on jobs and growth in rural areas
More information on this specific objective is available in the brief on jobs and growth in rural areas
The employment rate in the EU-27 steadily increased from 67.5% in 2013 to 72.4% in 2018. The employment
rate in predominantly rural areas follows a similar trend as the total employment rate in the EU-27. By 2015, the
EU-27 got back to the employment level before the 2009 financial crisis.
N.B.: the employment rate for women is for the total population of women.
Under the objective of balanced territorial development, the CAP aims to reduce the gap in standard of living
between rural and other areas in the EU. GDP per capita, corrected for purchasing power, can be used to compare
the aggregate standard of living between different geographical entities.
The following graph shows that, taking the EU-27 level as a reference, the total GDP per capita in rural areas in
the EU-27 is below the total EU-average with about 26 to 31 index points between 2003 and 2014. There is a
convergence between the GDP per capita visible between rural areas and the total GDP per capita in the EU.
At the end of 2018, 52% of rural households were served by a Next Generation Access network compared to 81% of total EU rural
households. There is a clear improvement on the situation over time in rural areas, but closing the connectivity gap of rural areas
with regard to Next Generation Access remains a challenge.
55.0%
57.0%
59.0%
61.0%
63.0%
65.0%
67.0%
69.0%
71.0%
73.0%
75.0%
2002 2003 2004 2005 2006 2007 2008 2009 2010 2011 2012 2013 2014 2015 2016 2017 2018
Employment rate for the age group 20-64 in rural areas Employment rate for the age group 20-64 femalesEmployment rate for the age group 20-64 total
60.00
62.00
64.00
66.00
68.00
70.00
72.00
74.00
76.00
2003 2004 2005 2006 2007 2008 2009 2010 2011 2012 2013 2014
GDP per capita in rural areas (index PPS [EU-27 = 100])
Farm to Fork target:Completing fast broadband
internet access in rural areas
27
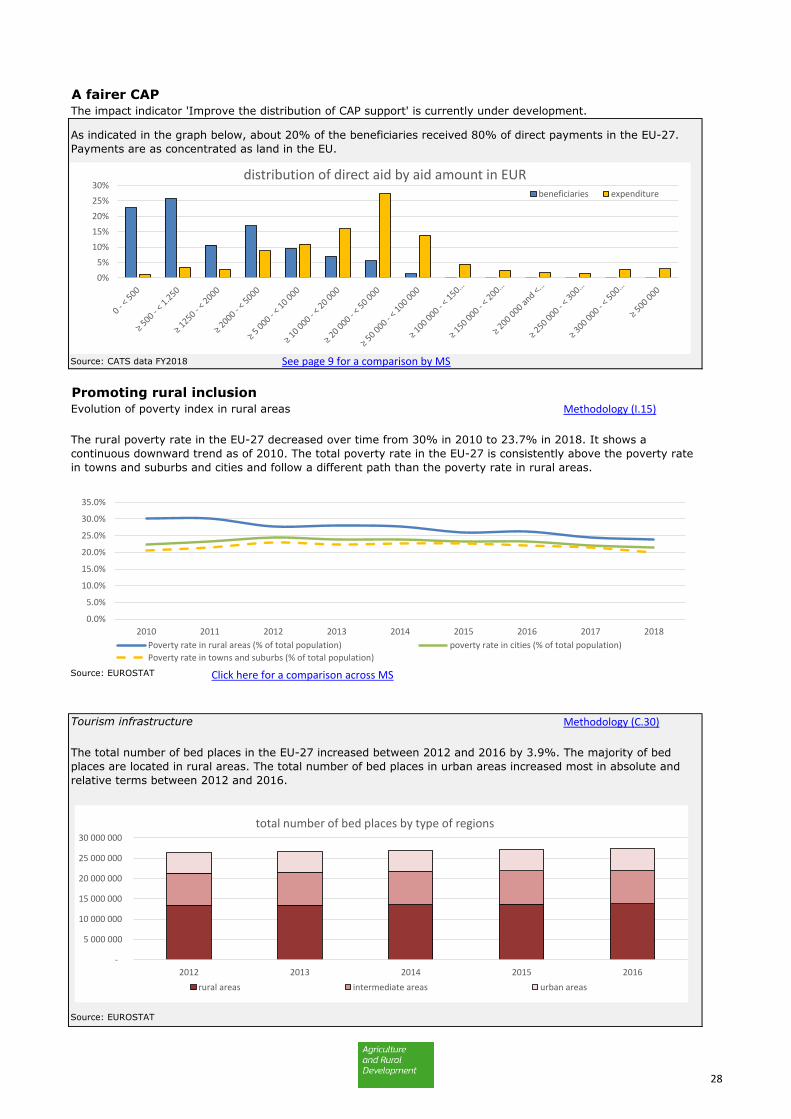
A fairer CAPThe impact indicator 'Improve the distribution of CAP support' is currently under development.
Source: CATS data FY2018 See page 9 for a comparison by MS
Promoting rural inclusionEvolution of poverty index in rural areas Methodology (I.15)
Source: EUROSTAT Click here for a comparison across MS
Tourism infrastructure Methodology (C.30)
Source: EUROSTAT
The total number of bed places in the EU-27 increased between 2012 and 2016 by 3.9%. The majority of bed
places are located in rural areas. The total number of bed places in urban areas increased most in absolute and
relative terms between 2012 and 2016.
As indicated in the graph below, about 20% of the beneficiaries received 80% of direct payments in the EU-27.
Payments are as concentrated as land in the EU.
The rural poverty rate in the EU-27 decreased over time from 30% in 2010 to 23.7% in 2018. It shows a
continuous downward trend as of 2010. The total poverty rate in the EU-27 is consistently above the poverty rate
in towns and suburbs and cities and follow a different path than the poverty rate in rural areas.
0.0%
5.0%
10.0%
15.0%
20.0%
25.0%
30.0%
35.0%
2010 2011 2012 2013 2014 2015 2016 2017 2018
Poverty rate in rural areas (% of total population) poverty rate in cities (% of total population)
Poverty rate in towns and suburbs (% of total population)
0%
5%
10%
15%
20%
25%
30%distribution of direct aid by aid amount in EUR
beneficiaries expenditure
-
5 000 000
10 000 000
15 000 000
20 000 000
25 000 000
30 000 000
2012 2013 2014 2015 2016
total number of bed places by type of regions
rural areas intermediate areas urban areas
28
©Copyright: iStock
IMPROVE THE RESPONSE OF EU AGRICULTURE TO
SOCIETAL DEMANDS ON FOOD AND HEALTH, INCLUDING
SAFE, NUTRITIOUS AND SUSTAINABLE FOOD, AS WELL
AS ANIMAL WELFARE
29
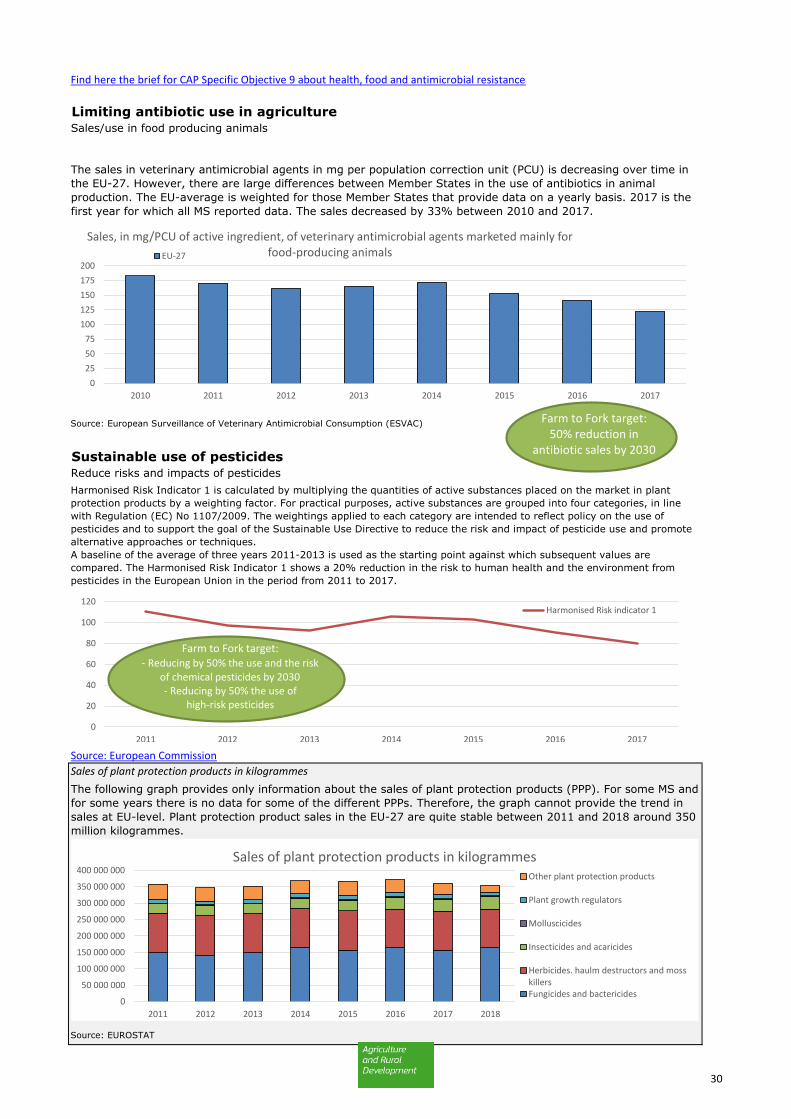
Find here the brief for CAP Specific Objective 9 about health, food and antimicrobial resistance
Limiting antibiotic use in agricultureSales/use in food producing animals
Source: European Surveillance of Veterinary Antimicrobial Consumption (ESVAC)
Sustainable use of pesticidesReduce risks and impacts of pesticides
Source: European Commission
Sales of plant protection products in kilogrammes
Source: EUROSTAT
The sales in veterinary antimicrobial agents in mg per population correction unit (PCU) is decreasing over time in
the EU-27. However, there are large differences between Member States in the use of antibiotics in animal
production. The EU-average is weighted for those Member States that provide data on a yearly basis. 2017 is the
first year for which all MS reported data. The sales decreased by 33% between 2010 and 2017.
The following graph provides only information about the sales of plant protection products (PPP). For some MS and
for some years there is no data for some of the different PPPs. Therefore, the graph cannot provide the trend in
sales at EU-level. Plant protection product sales in the EU-27 are quite stable between 2011 and 2018 around 350
million kilogrammes.
Harmonised Risk Indicator 1 is calculated by multiplying the quantities of active substances placed on the market in plant
protection products by a weighting factor. For practical purposes, active substances are grouped into four categories, in line
with Regulation (EC) No 1107/2009. The weightings applied to each category are intended to reflect policy on the use of
pesticides and to support the goal of the Sustainable Use Directive to reduce the risk and impact of pesticide use and promote
alternative approaches or techniques.
A baseline of the average of three years 2011-2013 is used as the starting point against which subsequent values are
compared. The Harmonised Risk Indicator 1 shows a 20% reduction in the risk to human health and the environment from
pesticides in the European Union in the period from 2011 to 2017.
0
50 000 000
100 000 000
150 000 000
200 000 000
250 000 000
300 000 000
350 000 000
400 000 000
2011 2012 2013 2014 2015 2016 2017 2018
Sales of plant protection products in kilogrammesOther plant protection products
Plant growth regulators
Molluscicides
Insecticides and acaricides
Herbicides. haulm destructors and mosskillersFungicides and bactericides
0
25
50
75
100
125
150
175
200
2010 2011 2012 2013 2014 2015 2016 2017
Sales, in mg/PCU of active ingredient, of veterinary antimicrobial agents marketed mainly for food-producing animalsEU-27
Farm to Fork target:50% reduction in
antibiotic sales by 2030
0
20
40
60
80
100
120
2011 2012 2013 2014 2015 2016 2017
Harmonised Risk indicator 1
Farm to Fork target:- Reducing by 50% the use and the risk
of chemical pesticides by 2030- Reducing by 50% the use of
high-risk pesticides
30
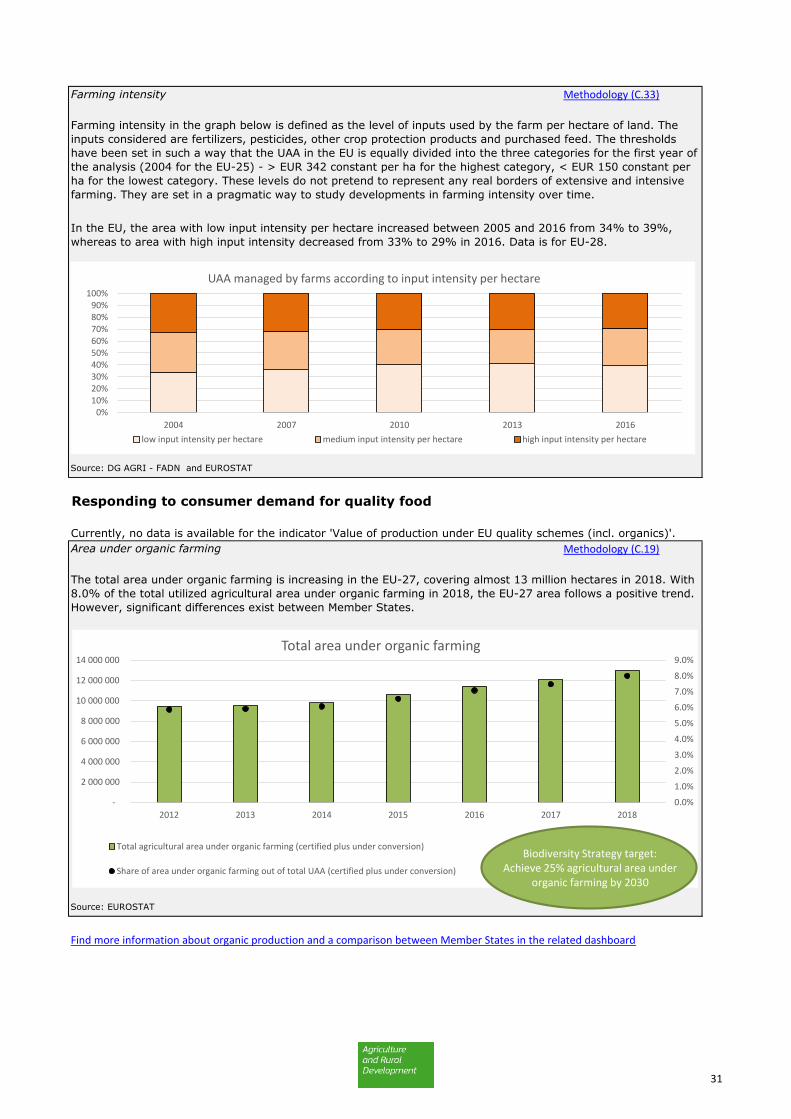
Farming intensity Methodology (C.33)
Source: DG AGRI - FADN and EUROSTAT
Responding to consumer demand for quality food
Area under organic farming Methodology (C.19)
Source: EUROSTAT
Find more information about organic production and a comparison between Member States in the related dashboard
The total area under organic farming is increasing in the EU-27, covering almost 13 million hectares in 2018. With
8.0% of the total utilized agricultural area under organic farming in 2018, the EU-27 area follows a positive trend.
However, significant differences exist between Member States.
Farming intensity in the graph below is defined as the level of inputs used by the farm per hectare of land. The
inputs considered are fertilizers, pesticides, other crop protection products and purchased feed. The thresholds
have been set in such a way that the UAA in the EU is equally divided into the three categories for the first year of
the analysis (2004 for the EU-25) - > EUR 342 constant per ha for the highest category, < EUR 150 constant per
ha for the lowest category. These levels do not pretend to represent any real borders of extensive and intensive
farming. They are set in a pragmatic way to study developments in farming intensity over time.
In the EU, the area with low input intensity per hectare increased between 2005 and 2016 from 34% to 39%,
whereas to area with high input intensity decreased from 33% to 29% in 2016. Data is for EU-28.
Currently, no data is available for the indicator 'Value of production under EU quality schemes (incl. organics)'.
0.0%
1.0%
2.0%
3.0%
4.0%
5.0%
6.0%
7.0%
8.0%
9.0%
-
2 000 000
4 000 000
6 000 000
8 000 000
10 000 000
12 000 000
14 000 000
2012 2013 2014 2015 2016 2017 2018
Total area under organic farming
Total agricultural area under organic farming (certified plus under conversion)
Share of area under organic farming out of total UAA (certified plus under conversion)
0%10%20%30%40%50%60%70%80%90%
100%
2004 2007 2010 2013 2016
UAA managed by farms according to input intensity per hectare
low input intensity per hectare medium input intensity per hectare high input intensity per hectare
Biodiversity Strategy target:Achieve 25% agricultural area under
organic farming by 2030
31
FOSTERING KNOWLEDGE, INNOVATION AND
DIGITALISATION IN AGRICULTURE
32
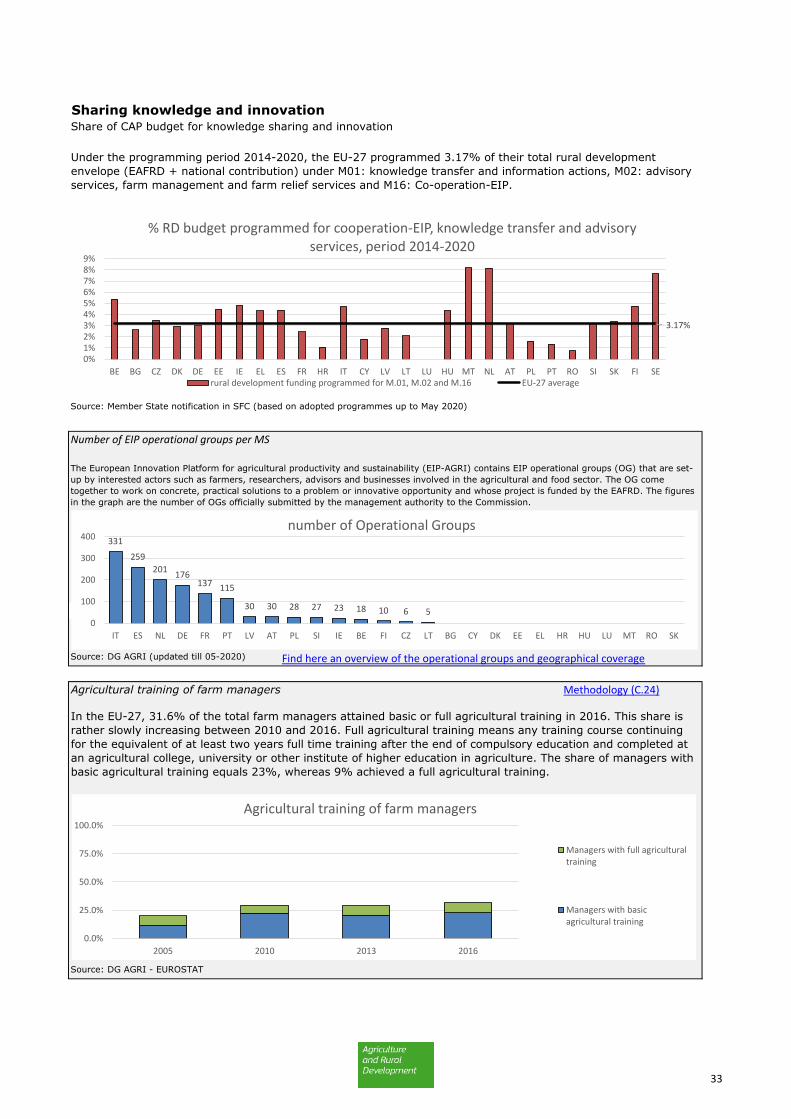
Sharing knowledge and innovationShare of CAP budget for knowledge sharing and innovation
Source: Member State notification in SFC (based on adopted programmes up to May 2020)
Number of EIP operational groups per MS
Source: DG AGRI (updated till 05-2020) Find here an overview of the operational groups and geographical coverage
Agricultural training of farm managers Methodology (C.24)
Source: DG AGRI - EUROSTAT
In the EU-27, 31.6% of the total farm managers attained basic or full agricultural training in 2016. This share is
rather slowly increasing between 2010 and 2016. Full agricultural training means any training course continuing
for the equivalent of at least two years full time training after the end of compulsory education and completed at
an agricultural college, university or other institute of higher education in agriculture. The share of managers with
basic agricultural training equals 23%, whereas 9% achieved a full agricultural training.
Under the programming period 2014-2020, the EU-27 programmed 3.17% of their total rural development
envelope (EAFRD + national contribution) under M01: knowledge transfer and information actions, M02: advisory
services, farm management and farm relief services and M16: Co-operation-EIP.
The European Innovation Platform for agricultural productivity and sustainability (EIP-AGRI) contains EIP operational groups (OG) that are set-
up by interested actors such as farmers, researchers, advisors and businesses involved in the agricultural and food sector. The OG come
together to work on concrete, practical solutions to a problem or innovative opportunity and whose project is funded by the EAFRD. The figures
in the graph are the number of OGs officially submitted by the management authority to the Commission.
3.17%
0%1%2%3%4%5%6%7%8%9%
BE BG CZ DK DE EE IE EL ES FR HR IT CY LV LT LU HU MT NL AT PL PT RO SI SK FI SE
% RD budget programmed for cooperation-EIP, knowledge transfer and advisory services, period 2014-2020
rural development funding programmed for M.01, M.02 and M.16 EU-27 average
0.0%
25.0%
50.0%
75.0%
100.0%
2005 2010 2013 2016
Agricultural training of farm managers
Managers with full agriculturaltraining
Managers with basicagricultural training
331
259
201176
137 115
30 30 28 27 23 18 10 6 50
100
200
300
400
IT ES NL DE FR PT LV AT PL SI IE BE FI CZ LT BG CY DK EE EL HR HU LU MT RO SK
number of Operational Groups
33
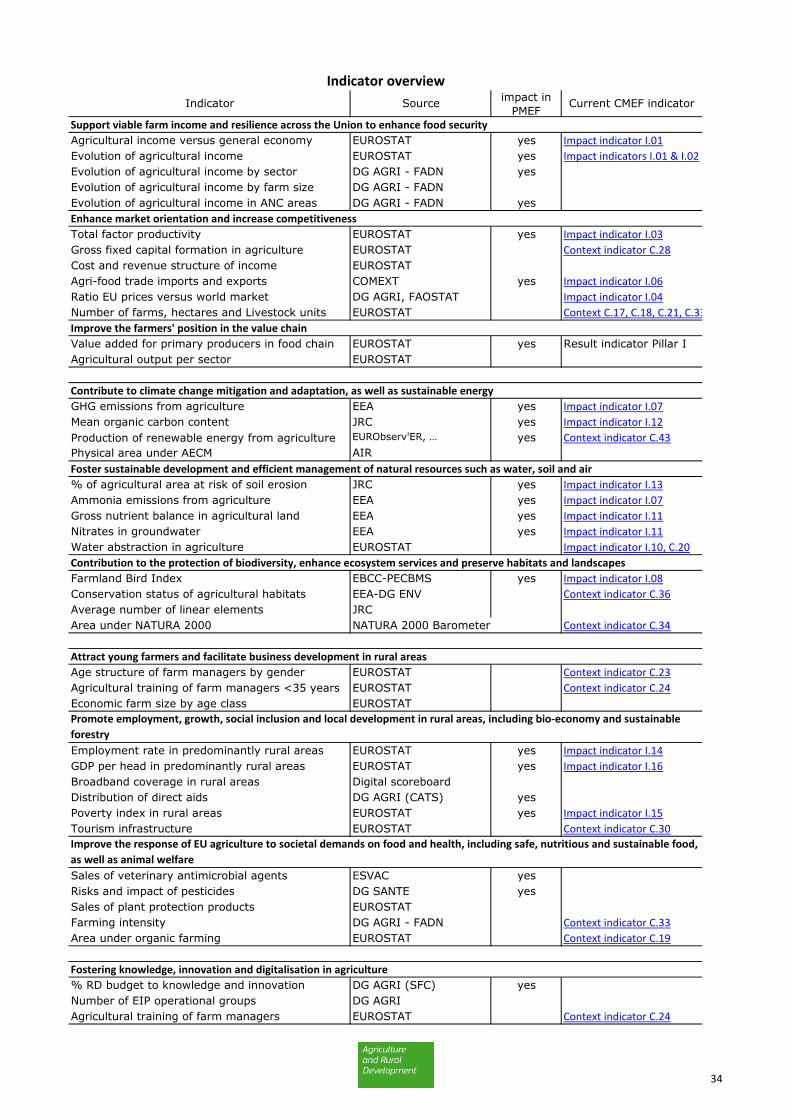
impact in
PMEF
Support viable farm income and resilience across the Union to enhance food security
Agricultural income versus general economy EUROSTAT yes Impact indicator I.01
Evolution of agricultural income EUROSTAT yes Impact indicators I.01 & I.02
Evolution of agricultural income by sector DG AGRI - FADN yes
Evolution of agricultural income by farm size DG AGRI - FADN
Evolution of agricultural income in ANC areas DG AGRI - FADN yes
Enhance market orientation and increase competitiveness
Total factor productivity EUROSTAT yes Impact indicator I.03
Gross fixed capital formation in agriculture EUROSTAT Context indicator C.28
Cost and revenue structure of income EUROSTAT
Agri-food trade imports and exports COMEXT yes Impact indicator I.06
Ratio EU prices versus world market DG AGRI, FAOSTAT Impact indicator I.04
Number of farms, hectares and Livestock units EUROSTAT Context C.17, C.18, C.21, C.33
Improve the farmers' position in the value chain
Value added for primary producers in food chain EUROSTAT yes Result indicator Pillar I
Agricultural output per sector EUROSTAT
Contribute to climate change mitigation and adaptation, as well as sustainable energy
GHG emissions from agriculture EEA yes Impact indicator I.07
Mean organic carbon content JRC yes Impact indicator I.12
Production of renewable energy from agriculture yes Context indicator C.43
Physical area under AECM AIR
Foster sustainable development and efficient management of natural resources such as water, soil and air
% of agricultural area at risk of soil erosion JRC yes Impact indicator I.13
Ammonia emissions from agriculture EEA yes Impact indicator I.07
Gross nutrient balance in agricultural land EEA yes Impact indicator I.11
Nitrates in groundwater EEA yes Impact indicator I.11
Water abstraction in agriculture EUROSTAT Impact indicator I.10, C.20
Contribution to the protection of biodiversity, enhance ecosystem services and preserve habitats and landscapes
Farmland Bird Index EBCC-PECBMS yes Impact indicator I.08
Conservation status of agricultural habitats EEA-DG ENV Context indicator C.36
Average number of linear elements JRC
Area under NATURA 2000 NATURA 2000 Barometer Context indicator C.34
Attract young farmers and facilitate business development in rural areas
Age structure of farm managers by gender EUROSTAT Context indicator C.23
Agricultural training of farm managers <35 years EUROSTAT Context indicator C.24
Economic farm size by age class EUROSTAT
Employment rate in predominantly rural areas EUROSTAT yes Impact indicator I.14
GDP per head in predominantly rural areas EUROSTAT yes Impact indicator I.16
Broadband coverage in rural areas Digital scoreboard
Distribution of direct aids DG AGRI (CATS) yes
Poverty index in rural areas EUROSTAT yes Impact indicator I.15
Tourism infrastructure EUROSTAT Context indicator C.30
Sales of veterinary antimicrobial agents ESVAC yes
Risks and impact of pesticides DG SANTE yes
Sales of plant protection products EUROSTAT
Farming intensity DG AGRI - FADN Context indicator C.33
Area under organic farming EUROSTAT Context indicator C.19
Fostering knowledge, innovation and digitalisation in agriculture
% RD budget to knowledge and innovation DG AGRI (SFC) yes
Number of EIP operational groups DG AGRI
Agricultural training of farm managers EUROSTAT Context indicator C.24
Indicator Source Current CMEF indicator
EURObserv'ER, …
Promote employment, growth, social inclusion and local development in rural areas, including bio-economy and sustainable
forestry
Improve the response of EU agriculture to societal demands on food and health, including safe, nutritious and sustainable food,
as well as animal welfare
Indicator overview
34
Methodology
For example: Sharing knowledge and innovation
Share of CAP budget for knowledge sharing and innovation
For example: Agricultural training of farm managers
Complementary information
Here you can access the different CAP indicator dashboards
https://ec.europa.eu/agriculture/statistics/factsheets_en
This factsheet provides an overview of the current state of the agricultural sector and rural development in the EU-
27 based on a common set of indicators. The factsheet follows the order of the nine specific objectives and
includes the impact indicators that are in Annex I of the CAP Strategic Plan proposal. It includes the context
indicators in the new Performance Monitoring and Evaluation Framework (PMEF) for which data is available to
date.
The statistical factsheets published on the EUROPA website present the main economic and agricultural data for
each country and the European Union: key data, population and economy, CAP expenditure and distribution of
direct aids, agricultural input, output and income, agricultural labour input, agricultural prices, agricultural trade
and farm structure:
The factsheets are complementary to the CAP dashboards that are grouped by theme and focus on the results
that are achieved by the CAP in a dynamic IT tool. A number of graphs in these factsheets are similar to the ones
in the CAP dashboards, but provide longer time series:
The name of the impact indicators that are in the new PMEF, are in bold. The description of the impact indicator is
given below the name.
All impact indicators are also context indicators in the existing Common Monitoring and Evaluation Framework
(CMEF) and the future PMEF. The table of contents provides a link to the methodological fiches of the impact and
context indicators that already exist in the current CMEF. It is possible that some of these fiches will be updated
for the PMEF. The table also indicates which indicators are already in the CMEF and which indicators are proposed
as impact indicators in the new PMEF.
Indicators that are not impact indicators in the new PMEF are used as a proxy in case the new impact indicator is
still under development. Additional data is presented in graphs where this is relevant and available. These
indicator names are shown in italics and surrounded by a light grey box.
35