Embed Size (px)
Citation preview
Changes in Compulsory Schooling and the
Causal Effect of Education on Health: Evidence from Germany
Daniel Kemptner§, Hendrik Jürges
#, and Steffen Reinhold
*
Final version: January 06, 2010
Abstract
In this paper we investigate the causal effect of years of schooling on health and health-related
behavior in West Germany. We apply an instrumental variables approach using as natural
experiments several changes in compulsory schooling laws between 1949 and 1969. These
law changes generate exogenous variation in years of schooling both across states and over
time. We find evidence for a strong and significant causal effect of years of schooling on
long-term illness for men but not for women. Moreover, we provide somewhat weaker
evidence of a causal effect of education on the likelihood of having weight problems for both
sexes. On the other hand, we find little evidence for a causal effect of education on smoking
behavior. Overall, our estimates suggest significant non-monetary returns to education with
respect to health outcomes and not necessarily with respect to health-related behavior.
Keywords: School reform, Health, Obesity, Smoking, Instrumental Variables
JEL-Codes: I12, I21
Acknowledgements: For their most helpful comments, we would like to thank Michael Lechner, participants at
the Annual Meeting of the Committee on Population Economics 2010 of the German Economic Association
(VfS), our colleagues Eberhard Kruk and Stefan Listl, and two anonymous reviewers.
§ DIW Berlin, Graduate Center, Mohrenstr. 58, 10117 Berlin, Germany. Email: [email protected]
# Schumpeter School of Business and Economics, University of Wuppertal, Rainer-Gruenter-Str. 21 (FN.01),
42119 Wuppertal, Germany. Email: [email protected]* MEA University of Mannheim, L13, 17, 68131 Mannheim, Germany. Email: [email protected]
1
1. Introduction
One of the most robust findings in both the economic and medical literature is the
positive association between education and health (e.g. see the survey articles by Cutler &
Lleras-Muney 2008 or Grossman 2006). This relationship can be found in many countries, at
different education levels and for various indicators of health. In fact, the relationship between
education or socio-economic status in a wider sense and health is so ubiquitous that is often
simply referred to as "the" gradient (Deaton 2003). However, the association between
education and health behavior does not necessarily reflect a causal effect of education on
health and there is now a lively debate, especially in the economics literature, whether this
association (or how much of it) is causal.
This discussion is highly policy-relevant because, among the components of socio-
economic status (education, income, and occupation), education seems to be the one that – in
the long run – appears to be most amenable to public policy interventions. Moreover, as noted
by Deaton (2002), it is important to frame social policy in terms of health and wealth
simultaneously. Improving one at the expense of the other involves a difficult and probably
unnecessary trade-off. One possible policy instrument for improving health and wealth
simultaneously is education. If education improves both wealth and health, giving people
access to more and better education will – in the long run – be a more successful policy than
redistributing income or expanding public health care expenditures.
The question is thus: does education improve health? One theoretical explanation why
more education might causally lead to better health is that education raises an individual's
efficiency in health production, i.e. education raises the marginal productivity of inputs into
health production (Grossman 1972). Just like more educated people are more productive in
labor market activities they are likely to be more productive in non-market activities, which
include the production of their own health (or the health of their children). Better educated
people would thus be healthier even if inputs were held fixed.
Another (complementary) theoretical explanation is that education changes the inputs
into health production (through information) and thereby increases allocative efficiency. Most
prominently, education might change health behaviors such as smoking or bad nutrition habits
(Rosenzweig & Schulz 1981, Cutler & Lleras-Muney 2010). It has been shown that education
is associated with substantially reduced smoking and obesity rates, two important causes of
premature deaths (Mokdad et al. 2004). For example, smoking rates in Germany are 48%
among less educated men, as opposed to 20% among men with college degrees (Deutsches
2
Krebsforschungszentrum 2004). Education might improve health behaviors for several
reasons. First, better educated people might be better informed about negative health
consequences of smoking and overeating, either because they learned about these
consequences in school, or because better educated people find it easier to obtain and evaluate
such information (Kenkel 1991, Nayga 2000, de Walque 2007). Second, education could also
influence health behavior through higher income, different social environments, a different
sense of control, or an impact of education on time preferences, e.g. because schooling
focuses students' attention on the future (Fuchs 1982, Becker & Mulligan 1997).
Despite many convincing arguments why there should be a causal effect of formal
education on health, concerns about an interpretation of correlations as causal relationships
remain. Most importantly, unobserved heterogeneity could drive both educational attainment
at younger ages and health outcomes at older ages. For instance, Carneiro et al. (2007) find
strong correlations between cognitive and non-cognitive skills measured at age 11 and
measures of educational success such as having continued school beyond age 16 – reported at
age 23 – or the highest educational qualification obtained – measured at age 43. Moreover,
they find strong correlations between cognitive and non-cognitive skills measured at age 11
and the probability of smoking at age 16 (measured at age 16), and self-assessed health,
depression and mental health problems in adulthood (all measured at age 42). This is evidence
for the presence of – usually unobserved – variables driving the relationship between
education and health.
The aim of the present paper is to estimate the causal effect of schooling on health
exploiting variations in compulsory schooling laws in Western Germany. We follow the
approach of Pischke and von Wachter (2005, 2008) who have used changes in years of
compulsory schooling to estimate the causal effect of education on earnings. The authors
found zero returns to schooling on wages. However, when estimating a reduced form
regression of body mass index on the change in compulsory schooling laws they found a
significant effect. Our objective is to take this line of research further and assess the non-
monetary returns of education by considering other health outcomes and also important
dimensions of health-related behavior such as smoking. There is now a number of papers
exploiting reforms in mandatory schooling laws across different countries, for instance the
United States (Lleras-Muney 2005), the United Kingdom (Oreopolous 2006, Silles 2009,
Clark & Royer 2010), or France (Albouy & Lequien 2008). The results of these studies are
mixed, showing negative effects of education on mortality (i.e. positive effects on health) in
the US (Lleras-Muney 2005) but not in France (Albouy & Lequien 2008) or in the UK (Clark

3
& Royer 2010). In contrast, strong positive effects on self-rated health in the UK are found by
Silles (2009).1 Yet further studies for the UK, assessing the effect of compulsory schooling on
morbidity using objective health measures such as blood pressure, BMI, or levels of
inflammatory blood markers (Clark & Royer 2010, Jürges, Kruk & Reinhold 2009) find no
effects, while Powdhtavee (2010) finds negative effects on hypertension.
Our study extends the existing literature by analyzing compulsory schooling laws in
Germany to assess the causal effect of education in yet another economic environment where
the economic returns to education at the margin of the educational reform were shown to be
pretty low. In addition, our paper complements earlier work on the health effect of education
in (Western) Germany, using the abolition of fees in academic track schools and academic
track school constructions as different sources of exogenous variation in schooling (Jürges,
Reinhold & Salm 2009, Reinhold & Jürges 2009).
The paper is structured as follows. In the next section we will describe the German
school system and the changes in compulsory schooling laws as our institutional background.
Section 3 explains which data we use and shows descriptive statistics. Section 4 describes our
identification strategy and its assumptions. Section 5 shows the results. Various robustness
checks are reported in Section 6 and Section 7 gives a summary and discussion.
2. Institutional Background
In Germany, the federal states are responsible for educational policy. Still, the
educational systems in all German states are very similar and thus share many common
features (see Figure 1). Children generally enter primary school at the age of six. After
(normally 4 years) in primary school, students attend one of three secondary school tracks
which are in most cases taught at geographically separate schools. Hauptschule is the basic
track leading to a basic school leaving certificate after grade 8 or 9. Realschule is a more
demanding intermediate track which leads to a school leaving certificate after grade 10.
Having finished school, both students from the basic track and the middle track usually start
an apprenticeship or a school-based vocational training. Gymnasium is the academic track
leading to a general university-entrance diploma (Abitur) after grade 12 or 13.2 It is
1 Oreopoulos (2006) reports strong positive effect on self-rated health. However, a re-analysis of the data has
basically reduced this effect to zero (see revised Table 5 posted on the AER website).2 In addition to the three common track types, some states also have comprehensive schools where all students
are taught together (with internal tracking to some degree) or "middle schools", combining basic and
intermediate track. Both types of school are relatively new and not relevant in our study.
4
noteworthy that, after being allocated to one of the three secondary school tracks, students
rarely move between tracks, so that the track choice at the age of 10 usually has a strong
implication for the entire life course (Dustmann 2004, Jürges & Schneider 2007). The
selection process itself depends on a mix of formal exams, grades in primary school,
recommendations by the class teacher, and parental choice.
--- about here Figure 1 (description of school system) ---
Since World War II, the German school system has undergone a number of reforms,
among them the abolition of secondary school fees (Riphahn 2008), or the large-scale
expansion of academic track schools (Jürges, Reinhold & Salm 2009). The reform we try to
exploit in the present paper is the prolonging of compulsory basic track schooling from eight
to nine years. Since education policy is in the hands of state governments, this reform has
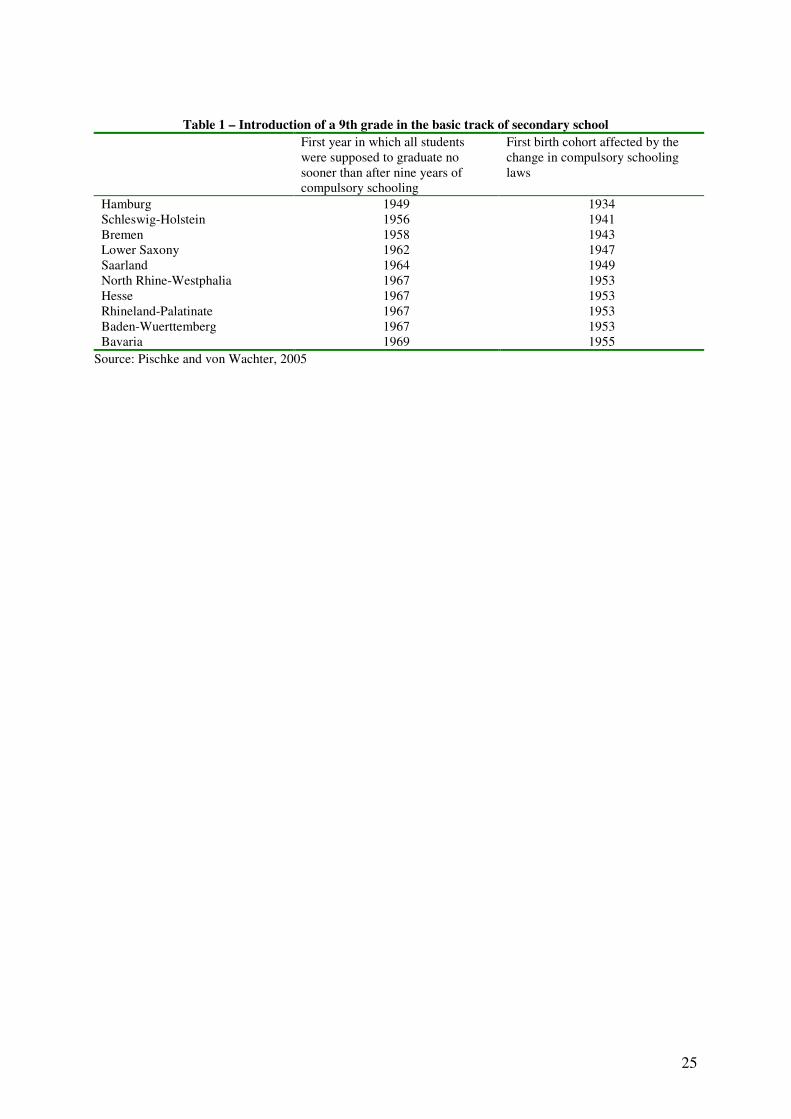
taken place at different points in time. Table 1 (taken from Pischke & von Wachter 2005)
contains, by federal state, the first year when all students were supposed to stay in school for
at least 9 years and the corresponding birth cohorts that were first affected by the reform. The
first state to introduce a 9th grade in the basic track was Hamburg in 1949. The last state was
Bavaria introducing a 9th grade in 1969. Interestingly, the data show a fairly consistent north-
south pattern, with northern states being earlier reformers than southern states. Southern states
tend to be politically more conservative and have a higher proportion of Catholics. Such
political and cultural differences could give rise to differences in health and health behavior as
well. In our analysis, we therefore control for level differences between states and also allow
for state-specific trends. Note further that in contrast to education policy, health policy is the
sole responsibility of the federal government. This is important because it lends credibility to
our main identifying assumption of no correlation between state trends in education and
health policies. In a similar vain we argue that due to nationwide public television health
information (e.g. on the hazards of smoking or obesity) should be disseminated in all states at
the same time and at a similar speed.
--- about here Table 1 (school reform year and cohorts) ---
In some states, changes in compulsory schooling laws were undertaken simultaneously
with other reforms. When compulsory schooling was raised to nine years, some German states
also moved the start of the school year to early summer (cf Pischke, 2007). This implied the
introduction of two short school years so that affected cohorts did in fact nominally complete
9 instead of 8 grades although they spent only one third of a complete school year longer in
school compared to the previous cohorts unaffected by the reform. It is hard to assess how
5
much more these cohorts learnt in comparison to previous cohorts. But potentially we
underestimate the effect of the increase in compulsory schooling if we do not take this
transient shortening of the school year into account, and our estimates would then be
interpreted as lower bounds of the true effect. We address this problem thoroughly in our
section on robustness checks.
3. Data and Descriptive Statistics
The data used in our study are taken from five years of the German Microcensus
(1989, 1995, 1999, 2002, and 2003). The Microcensus is an annual, representative survey of
one per cent of the households in Germany. Participation in the Microcensus is mandatory.
However, the questions on health and health-related behavior are voluntary and are asked of a
45 percent random subsample only. The data contain, for each individual, sex and age, highest
school degree and the current state of residence. In our analysis, we include cohorts born
between 1930 and 1960 and currently living in the ten former West German states (excluding
Berlin). We further restrict our analytical sample to individuals of German nationality and
exclude individuals from the sample who have received their highest school degree in the
former German Democratic Republic. Questions on health status (long-term illness and work-
related disability), available only in the 2002 survey, were asked of working age individuals
(16–65 years). We thus need to restrict our analysis to cohorts born between 1937 and 1960
when using the 2002 data on health status. We further exclude all individuals living in
Hamburg from the 2002 survey since the change in compulsory schooling laws there first
affected cohorts born in 1934 and thus there is no exogenous variation in schooling.
Direct information on years in school as such is not available in the Microcensus. But
the data provide the highest secondary school degree attained by each respondent. We use this
information, together with both the number of years usually taken to obtain a certain degree
and the compulsory schooling laws in the respective state, to impute years of schooling in
each state, cohort and secondary school type. A dummy variable indicating whether the
compulsory schooling laws require 8 or 9 years of schooling will serve as an instrument for an
individual’s years of schooling. Individuals without any school degree are either assigned 8 or
9 years of schooling depending on the compulsory schooling laws in effect. Since
geographical information is limited to state of residence at the time of the survey, we need to
assume that a person has attended school in his state of residence. This raises concerns about
the validity of the results of our analysis which we will address in a robustness check.
6
We measure health and health-related behavior of the respondents by a number of
variables. Current health is measured by an indicator variable whether someone suffers from
long-term illness (we do not have information on specific diagnoses) and whether this illness
limits the type or amount of work they can do (work disability). As mentioned above, this
information is only available in 2002 and only for working age individuals. Another measure
of current health is the body mass index (BMI), derived from self-reported information on
weight and height in the 1999 and 2003 surveys. We used BMI to construct two dummy
variables indicating overweight (BMI greater than 25) and obesity (BMI greater than 30).
Note that our definition of overweight includes obesity. Also note that BMI, overweight or
obesity can also be interpreted as indicators of future health because they are significant risk-
factors for future health problems, e.g. diabetes or cardiovascular disease. We measure health
behavior by information on smoking. In 1989, 1995, 1999, and 2003, individuals were asked
whether they were smoking currently and, if not, whether they had ever smoked. We use this
information to identify quitters. Information on number of cigarettes smoked is only reported
in rather broad bands. Analyses based on this measure delivers qualitatively similar results
compared to our results using just binary information on smoking status. We generally pool
all survey years which contain the same dependent variables, because each survey year
represents an independent random sample.
--- about here Table 2 (data description) ---
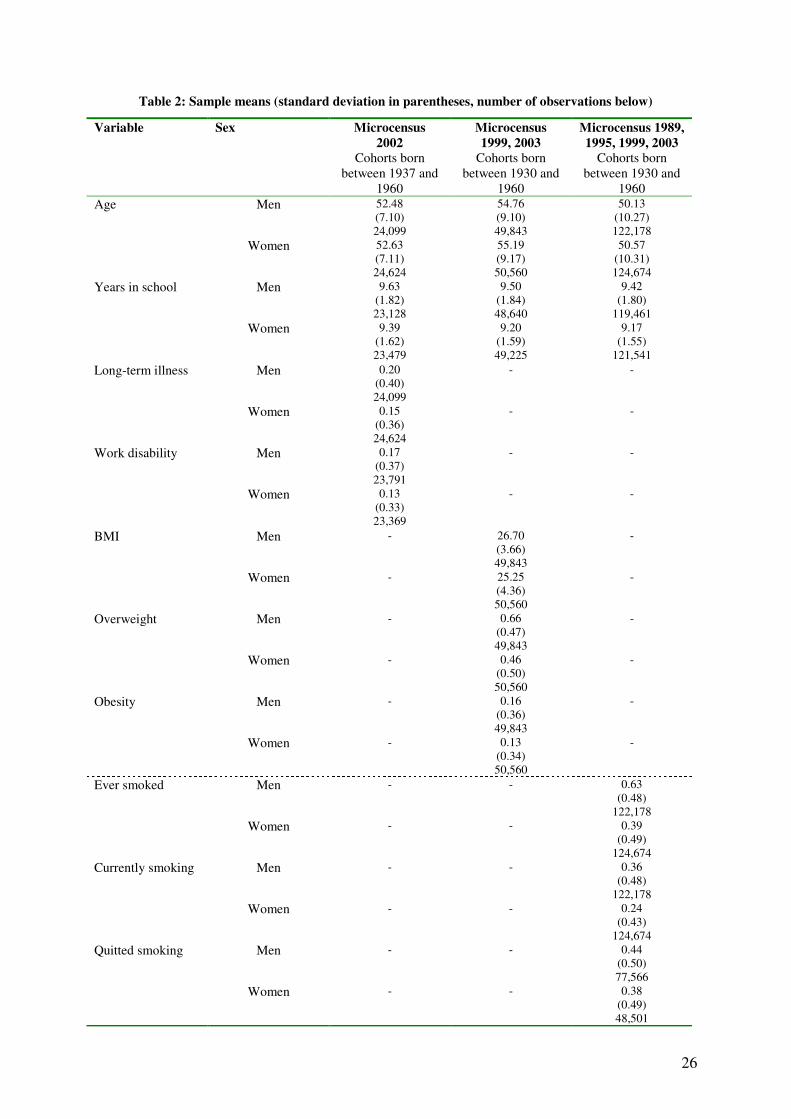
Descriptive statistics are presented in Table 2. There are roughly 25,000 individuals
per sex in the 2002 "current health" sample. These individuals were born between 1937 and
1960 and were on average 52 to 53 years old in 2002. Mean years in school were 9.6 years for
men and 9.4 years for women. 20% of men and 15% of women were suffering from a long
term illness. 17% of men and 13% of women suffered from a long-term illness that limited the
amount or type of work they could do, i.e. they were work disabled. In the "BMI sample",
interviewed in 1999 and 2003, there are about 50,000 observations per sex. Average BMI was
26.7 for men and 25.3 for women. 66% of men were overweight or obese compared to only
44% of women. Obesity rates were 16% for men and 13% for women. These sex differences
can also be seen when looking at the kernel density estimates (Figure 2) showing that the
distribution is shifted to the right for men. For both sexes, one can see that a lot of the
probability mass is concentrated in the BMI region around 25. For men, it even peaks at
around those values.
---about her Figure 2---

7
For the analysis of smoking behavior, we have the largest samples with more than
120,000 observations for each sex. Overall, 63% of men and 39% of women reported having
ever smoked. Current smoking rates are 36% for men and 24% for women. This implies that
44% of men (38% of women) in our sample who ever smoked have stopped smoking.
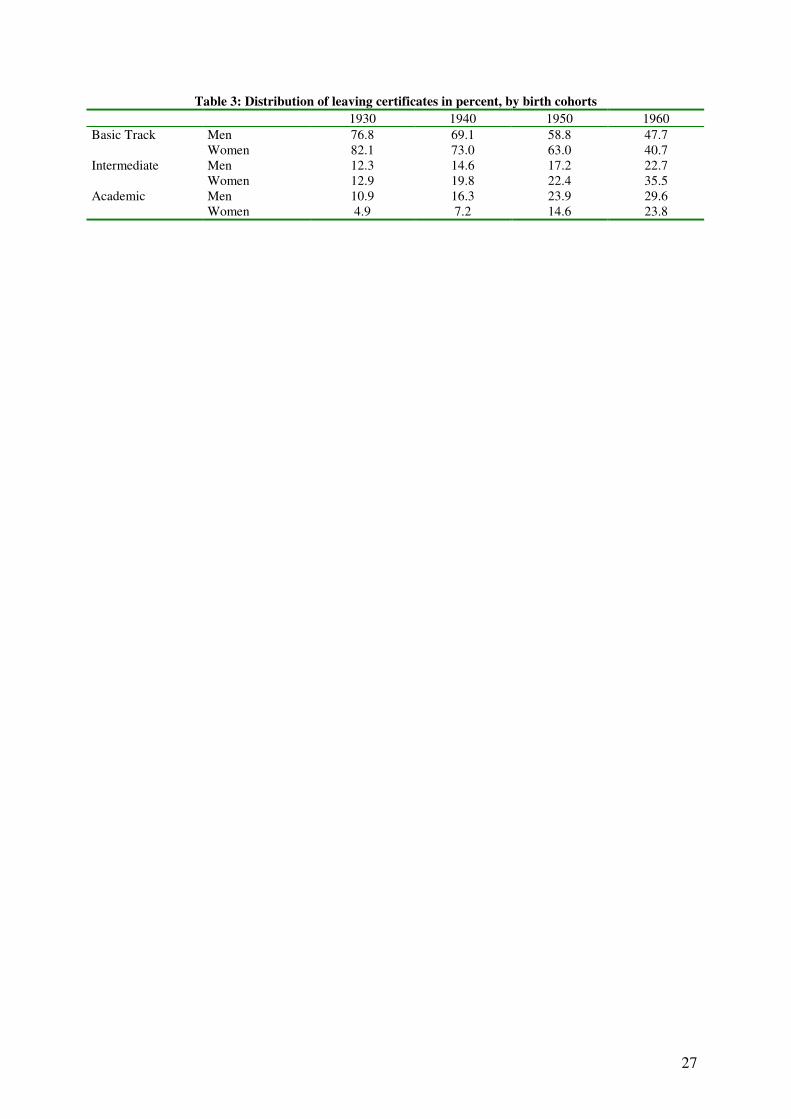
--- about here Table 3 (distribution of leaving certificates) ---
Table 3 shows the proportion of individuals in the birth cohorts 1930, 1940, 1950, and
1960 who graduated from each of the three secondary school tracks. These data clearly show
the educational expansion in West Germany after the Second World War. More than three
quarters of the population born in 1930 received at most basic track schooling. This
proportion has decreased to less than 50% among those born in 1960. Moreover, the decline
was much larger for women than for men. Both intermediate and academic track education
has increased correspondingly. As a consequence, there is substantial variation across birth
cohorts and states with respect to mean years of schooling (see Table 3 for cohorts and Figure
3 for selected states).
---about here Figure 3---
Figure 3 shows upward trends in average years of levels for four selected Western
German states (graphs for other states look very similar), from values below 9 years for the
1930 birth cohorts to values above 10 years for the 1960 birth cohorts. In addition to those
time trends for the whole period, one can also see jump of about 0.6 years in mean years of
schooling at the time the change in mandatory schooling laws took effect. There are some
more noteworthy points in Figure 3. For instance, Lower-Saxony and North Rhine-Westphalia
were very much on the same "expansion path" until Lower-Saxony lengthened the basic track,
and North Rhine-Westphalia caught up after prolonging mandatory schooling 6 years later.
Further, the pictures illustrate the need to control for state-specific trends, as for example
Schleswig-Holstein has a flatter increase in average educational attainment than Baden-
Wuerttemberg (and other states). In our basic specification, we will thus control for state-
specific linear trends in addition to (common) time fixed effects to control for these different
paths of the educational expansion across states.
4. Empirical strategy
We estimate both OLS and IV models. The former are estimated for descriptive
purposes while the latter are given a causal interpretation. All equations are estimated for men
8
and women separately and with robust standard errors which are clustered by state and year of
birth. Our OLS model linking the health outcome to an individual’s years of schooling is
specified as:
( ) isurveycohortstatestateii cohortageSH εηνδµβββ +∑+∑+∑ ×++++= 2210 (1)
where Hi is a variable indicating some health outcome for individual i. Si denotes
individual i’s years of schooling. cohortstate νµ , and surveyη are fixed effects accounting for
heterogeneity between federal states, between birth cohorts and between survey years. In
addition, we add linear cohort-state interaction effects ( cohortstate ×δ ) controlling for state-
specific deviations from the common (non-parametrically estimated) nationwide trend
captured by the cohort dummies (thus if k is the number of states, we estimate 1−k state
fixed effects and 1−k state specific cohort effects). Note that we cannot include a linear age
effect because it is perfectly collinear with cohort and survey year combined. Yet we are able
to include quadratic age term in order to address potentially non-linear age effect. When using
the 2002 wave only, the survey-specific fixed effects and the quadratic in age are excluded
from the right-hand side of equation (1).
The method of instrumental variables – using changes in compulsory schooling laws
discussed above as instruments – allows dealing with the potential endogeneity of education
in equation (1) and thus allows estimating a causal effect of education on health and health-
related behavior. Our identification rests on the assumption that – conditional on covariates –
compulsory schooling laws or changes therein are uncorrelated with health outcomes and
health behaviors, except through their effect via education. Technically, we assume that state
education policies are independent of any unobserved determinants of health in the second
stage (health) equation.
One particular concern is that state-specific trends in health or health behavior may be
correlated with both the change in compulsory schooling laws and unobserved characteristics
of the individuals that are themselves health determinants. If this was the case, the association
between the instrument and the health outcome would not only be due to the association
between the instrument and years of schooling. For example, there may be macroeconomic
factors such as higher per capita growth which positively affect both the income of (parental)
households and a state’s resources which are available for reforms of the schooling system
(such as financing one more school year for more than half of each cohort). If schools are
financed by income taxes, there might also be a negative contemporaneous correlation
9
between net parental household income and education expenses. In any case, as long as
parental household income affects health (Case, Lubotsky & Paxson 2002, Reinhold & Jürges
2009), state-specific trends in economic development may compromise the validity condition.
For this reason, we estimate the IV-model controlling for state-specific linear trends. These
trends should also capture effects of other measures of public policy which might be
implemented together with the change in compulsory schooling laws. In additional robustness
checks, we also investigate the robustness of our results to the inclusion of state-specific
quadratic and cubic trends.
We estimate the following first stage equation:
( ) isurveycohortstatestateii cohortageZS ωλτκργγγ +∑+∑+∑ ×++++= 2210 (2)
where Si denotes again years of schooling. Zi is an instrumental variable indicating whether
compulsory schooling laws require individual i to stay at least 8 or 9 years in school. When
constructing the schooling variable Si, we assigned 8 or 9 years of schooling to the basic track
according to the applicable compulsory schooling laws. Thus, the association between the
instrumental variable and the schooling variable (γ1) arises by construction. cohortstate τρ , and
surveyλ are fixed effects accounting for heterogeneity between federal states, birth cohorts
and survey years. and cohortκ represents a state specific linear cohort trend. Inserting years of
schooling predicted from equation (2), Ŝi, into equation (1) yields the second stage equation:
( ) isurveycohortstatestateii cohortageSH εηνδµβββ +∑+∑+∑ ×++++= 2210
ˆ (3)
When using the 2002 wave only, the survey-specific fixed effects and the quadratic in age are
excluded from the right-hand side of equations (2) and (3).
There are two concerns about the interpretation of our parameter of interest β1 in
equation (3). First, it is possible that the change in factual school attendance has not occurred
sharply when a 9th
grade of compulsory schooling was introduced. Pischke and von Wachter
(2005) show that the introduction of reform was somewhat spread out and did not occur
sharply. As a consequence, years of schooling may be understated for some students in basic
track shortly before the introduction of 9th
grade and overstated for some students in the basic
track shortly after the introduction of the 9th
grade. The "true" first stage estimate accounting
for this type of one-sided measurement error may thus be lower than our estimate of γ1. Our
IV-estimates would then suffer from attenuation bias and our results have to be interpreted as
lower bounds. Back-of-the-envelope calculations based on numbers provided in Pischke and
10
von Wachter (2005, Figure 3) suggest that the true effects are not more than 15% larger than
the estimates presented in our paper.3
Second, to allow for heterogeneous effects of education on health, we need to assume
monotonicity, i.e. we need to rule out that after the lengthening of mandatory schooling some
students decide to go to school shorter than they would without the reform (i.e. we assume
that there are no "defiers"). In our case it seems plausible to assume that individuals with
already high educational attainment (in intermediate or academic track) do not get less
schooling because the mandatory years in basic track are raised by one year. This assumption
would be violated if individuals chose a less demanding track or dropped out of school in
reaction to the raise in years of compulsory schooling. We assess in a further robustness check
whether this scenario is plausible. With heterogeneous causal effects and when the
monotonicity assumption holds, we identify the effect of education only on compliers, i.e.
individuals whose number of years in school is affected positively by the reform (Angrist and
Imbens, 1995), which also includes individuals who decide to stay longer than the mandatory
9 years. Moreover, since the number of years in school is a multi-valued treatment, the IV
estimates are equal to a weighted average of all complier-specific causal effects.
5. Results
5.1 OLS results
Long-term illness and work disability. OLS regression results are shown in Table 4.
The OLS coefficients indicate a significant association between current health and education
in both sexes. It is, however, stronger for men than for women. One more year in school is
linked with a reduction in the likelihood of suffering from a long-term illness of 2.9
percentage points for men but only 1.2 percentage points for women. The association between
years of schooling and long term illness is of substantive relevance considering that the
overall prevalence rate of long term illness is 20% for men and 15% for women. The
association between years in school and the probability of being work disabled is very
pronounced and significant for both sexes, and it has about the same magnitude as the
association of schooling and long-term illness.
--- about here Table 4 (OLS results) ---
3 On the other hand, reduced form (or "intention-to-treat") estimates, which do not suffer from any measurement
problem in actual years of schooling but which measure the reform effect on compliers and always-takers
combined, are about one third smaller than IV-estimates (see Table A1 in the appendix).
11
BMI, overweight and obesity. The OLS estimates also indicate a significant
association between years in school and body weight. Here, the association is much stronger
for women than for men. One more year in school is linked with a decrease in BMI of 0.27
kg/m2 for men and 0.47 kg/m
2 for women. In terms of overweight and obesity this means that
each additional year in school is linked with a 3.1 (1.8) percentage point lower probability of
being overweight (obese) for men, and a 4.7 (2.0) percentage point lower probability of being
overweight (obese) for women. Again, these are fairly strong associations.
Smoking. Smoking behavior is also strongly related to schooling, but more so for men
than for women. The OLS estimates show that one more year of schooling is linked with a 2.6
percentage point lower proportion of men who ever smoked but only a 0.5 percentage point
lower proportion of women who ever smoked. With respect to current smoking, the estimates
suggest that one more year of schooling is associated with a decrease in the likelihood of
being a smoker of 3.2 percentage points for men and of 2.1 percentage points for women.
Further, the OLS estimates suggest a stronger association between years of schooling and the
probability of quitting smoking for women than for men. One more year of schooling is
associated with an increase in the probability of having quitted smoking of 4.1 percentage
points among women and of 2.7 percentage points among men.
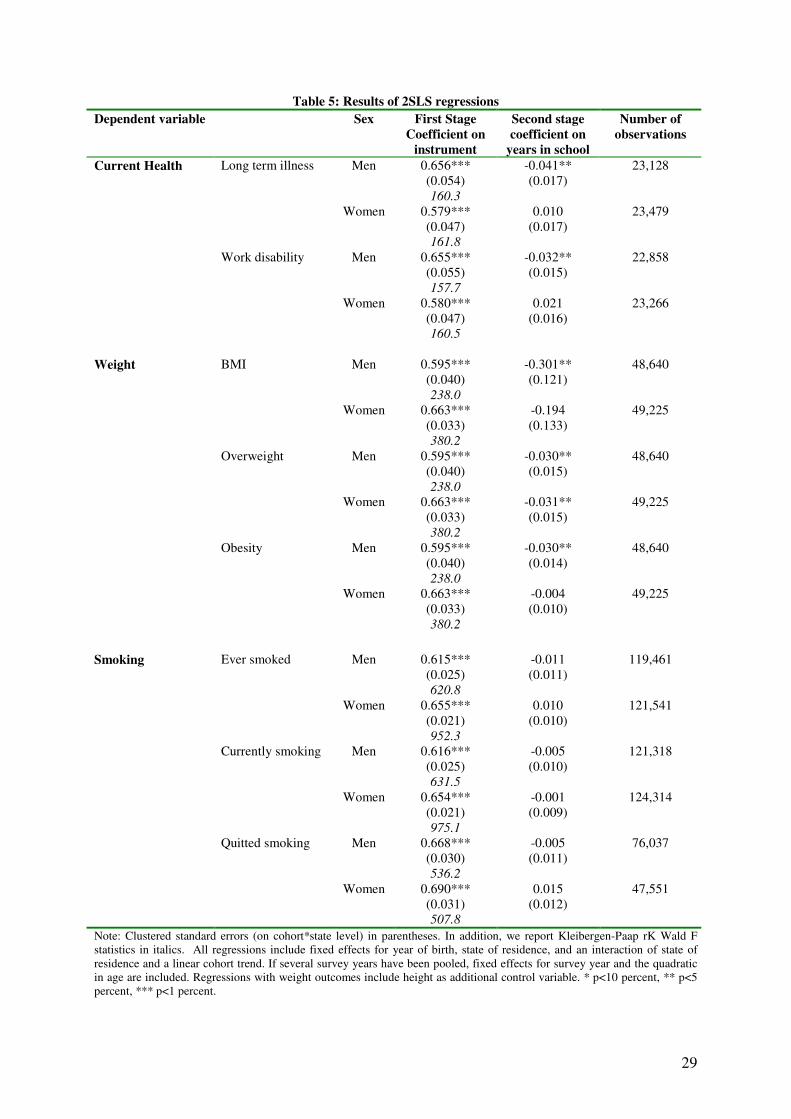
5.2 Instrumental variables results
Table 5 shows the relevant first and second stage coefficients from our IV estimation.
As indicated by the first stage results, mandatory schooling laws have high explanatory power
with respect to years of schooling. The introduction of a compulsory 9th
grade leads to an
average increase of about 0.6 years in school. We use the Kleibergen-Paap weak identification
test to assess the strength of our instruments. All test statistics are above 157 giving no rise to
concerns about weak instrument problems.4 It is also interesting to investigate for whom we
identify the effect of education on health. Following Acemoglu and Angrist (2000), we
estimate the average causal response weights, i.e. the weight different complier groups
contribute to our estimate. Not surprisingly, we find that these weights are concentrated on
individuals having nine years of schooling (96.5%) and much less weight on individuals with
10 years of schooling (2.3%) or even higher levels of schooling (1.2%). Thus, we largely
4 It has to be taken into account that the German Microcensus does not contain a direct measure of years of
schooling. Since we assigned 8 or 9 years of schooling to the basic track according to the applicable compulsory
schooling laws, the strong association between the instrumental variable and the schooling variable arises largely
by construction.
12
identify an effect for individuals in the basic track getting nine instead eight years of
schooling.
--- about here Table 5 (IV results) ---
Long-term illness and work disability. IV estimates of the effect of schooling on health
outcomes differ substantially between men and women. For men, we find a large and
significant causal effect of years of schooling on health. Our results indicate that one more
year of schooling reduces the likelihood of suffering from a long term illness by 4.1
percentage points for men (5% significance level). Furthermore, the estimates for men suggest
that one more year of schooling leads to a reduction in the likelihood of work disability of 3.2
percentage points, which is close to the OLS result. In contrast to men, women appear not to
gain from more schooling in terms of current health. The IV coefficients for women now have
a positive sign but have become insignificant.
One possible explanation for the difference between men and women in the effect of
education on work disability is that men with low levels of education tend to work more often
in sectors where hard physical labor is performed, in particular in those older cohorts where
labor force participation of women was much lower. For this reason, an additional year of
schooling could be of particular relevance for the working conditions of men if it pushes men
from blue to white collar jobs. Education is associated with non-manual labor occupations
where dangers to physical health through exposure to injury, dangerous chemicals or adverse
ergonomic conditions are reduced (WHO 2003). Furthermore, it could be the case that an
individual with given health problems, as for instance back problems, would be able to work
in a white-collar job but not in a blue-collar job anymore. If this was the case, we would also
expect more cases of work disability for blue-collar workers. To investigate this hypothesis
further, we included a set of occupational dummy variables in our regressions for long-term
illness or work disability.5 We found that the size of the coefficient on years of schooling was
reduced by roughly 25% for men (detailed results not shown). Part of the education effect on
health thus seems to work through occupational choice. We also found that the effect of
education on working in a white-collar job was smaller for women than for men. Therefore, it
seems that gender differences in the effect of education on long term illness and work
disability can partly be explained through the choice of occupational sector.
5 Note that we did not include occupational dummies in our main regressions because occupation is itself
determined by education.
13
BMI, overweight, and obesity. For men's BMI, we find a significant effect of about the
same size as the OLS results. One more year in school decreases male BMI by 0.3 kg/m2.
Among women, the effect approximately halves in size and becomes insignificant. Each year
in school significantly reduces the probability of being overweight by 3.0 percentage points
for men and 3.1 percentage points for women. Our effect sizes are consistent with the
estimates for BMI in Pischke and von Wachter (2008, Table 3) who find a reduced form
coefficient on mandatory schooling laws of -0.16 kg/m2
in the pooled sample of men and
women. The relatively small effect on BMI and the strong effect on overweight can be
explained by the fact that a lot of the density mass is concentrated right around the critical
threshold of a BMI of 25 (see Figure 1). The effect size is again in the range of the OLS
coefficients for men but somewhat smaller for women. With respect to obesity, we obtain
significant IV coefficients only for men but not for women.
Smoking behavior. In contrast to our health outcome measures and in contrast to the
corresponding OLS results, our IV estimates do not suggest any significant effect of education
on smoking behavior. This holds for having ever smoked, being a current smoker, and for
having quitted smoking and for both sexes. With one exception, the IV coefficients have
become much smaller than the OLS estimates and some coefficients even change signs. We
checked whether the effect of education on smoking behavior is so different from the other
health variables studied here because the data come from a longer and on average earlier
period by restricting the sample to the survey years 1999 and 2003. IV estimates remained
essentially zero.
6. Robustness Checks
We now address several concerns regarding our empirical strategy as mentioned
before. First, we only have information on the current state of residence, but not on the state
in which the individual has finished schooling. We thus restrict our sample to four contiguous
states that have changed mandatory schooling laws at the same time. Second, we relax our
assumption that the secular trends in health in Western Germany can be captured by (a
common) cohort fixed effects plus a linear state-specific trends by estimating models adding
also quadratic and cubic state-specific trends. Third, we investigate whether the mandatory
schooling reforms had additional effects on track choice and dropping out behavior – as
explained below this will give us some idea about the plausibility of the monotonicity
assumption. And fourth, concurrent with raising compulsory schooling to nine years, the start

14
of the school year was shifted from Easter to the end of summer in all German states. This
was done by introducing short school years reducing the time spent in school by up to two
thirds of a school year in some states (cf. Pischke, 2007). We account for this problem by
recoding our endogenous variable years of schooling accordingly.
6.1 Restricting the sample to four contiguous states
A major concern about the validity of our results stems from the fact that geographical
information is limited to state of residence at the time of the survey. Thus, we have to assume
that a person has attended school in his current state of residence when constructing the
instrumental variable as well as the schooling variable. This introduces a measurement error
in both the instrument and the endogenous regressor, schooling. This is one source of
attenuation bias discussed in Pischke and von Wachter (2005, 2008). We address this concern
here by restricting our sample to four contiguous states that have reformed mandatory
schooling simultaneously (see Figure 4).
--- about here Figure 4 (Map) ---
Baden-Wuerttemberg, Rhineland-Palatinate, Hesse, and North Rhine-Westphalia
introduced the 9th
grade of compulsory schooling in 1967. In 1970, these four states
represented 57% of the West German population. Since they do not border on a city state and
contain large cities themselves, migration between the four states and other German states
should be a minor issue. Furthermore, migration occurring within those four states does not
matter since the 9th
grade has been introduced in the same year. In a first step, we analyzed
the same birth cohorts as previously (1930-1960), simply restricting our sample to the four
contiguous states. When restricting the sample we obtain qualitatively very similar results
compared to the whole sample (detailed results not shown), indicating that attenuation bias
due to migration between the states is not a major driver of our results.
The effect of the reform can in some sense be more satisfactorily estimated if we
restrict our analysis to cohorts who are just affected and just not affected by the introduction
of the 9th
year of compulsory schooling in the basic track. Including birth cohorts born
between 1930 and 1960 was useful in the original analysis (including all federal states)
because school reforms were dispersed over a larger time period. The downside is that one
might be concerned about the ability to adequately capture the time trends even in the fairly
flexible specification that we use. In the four-state sample, we can further restrict the sample
to cohorts to the last cohort for whom the change in compulsory schooling laws was not yet
15
applicable and the first cohort who was supposed to attend 9 years of schooling in the basic
track. One problem with this approach, however, is that for those four states the raise in
compulsory schooling laws takes place at the same time as the move of the start of the school
year to the summer. This rescheduling was done by introducing short school years. While
completing nine grades instead of eight the cohorts immediately affected by this rescheduling
spent only around 8 and a third years in school which is not much more than the previous
cohorts. We address this question separately below. In any case, we can interpret our
coefficient estimates as a lower bound for the effect of an additional school year.
Our identification rests on the assumption that cohorts just before and just after the
reform took effect are very similar and differ only with respect to the treatment. In this case,
we do not rely on estimating unobserved trends on the state level. In other words, we assume
that the potential no-treatment outcomes of the two cohorts are identical. Technically, this
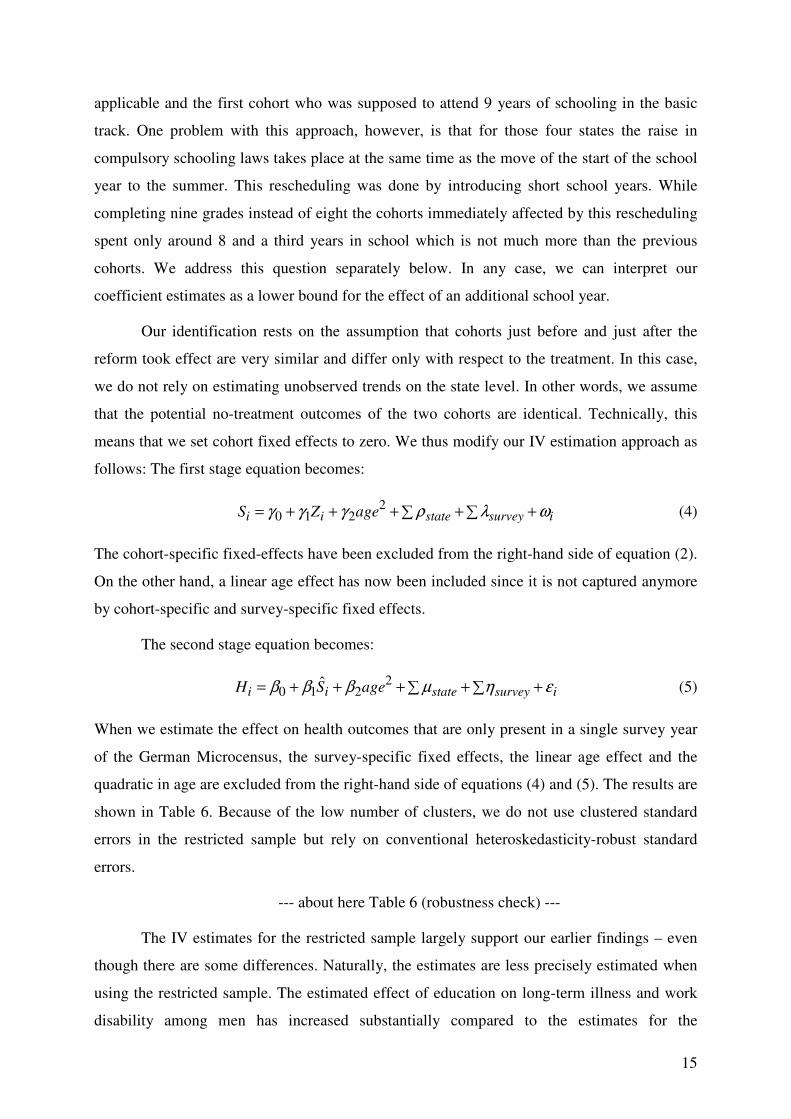
means that we set cohort fixed effects to zero. We thus modify our IV estimation approach as
follows: The first stage equation becomes:
isurveystateii ageZS ωλργγγ +∑+∑+++= 2210 (4)
The cohort-specific fixed-effects have been excluded from the right-hand side of equation (2).
On the other hand, a linear age effect has now been included since it is not captured anymore
by cohort-specific and survey-specific fixed effects.
The second stage equation becomes:
isurveystateii ageSH εηµβββ +∑+∑+++= 2210
ˆ (5)
When we estimate the effect on health outcomes that are only present in a single survey year
of the German Microcensus, the survey-specific fixed effects, the linear age effect and the
quadratic in age are excluded from the right-hand side of equations (4) and (5). The results are
shown in Table 6. Because of the low number of clusters, we do not use clustered standard
errors in the restricted sample but rely on conventional heteroskedasticity-robust standard
errors.
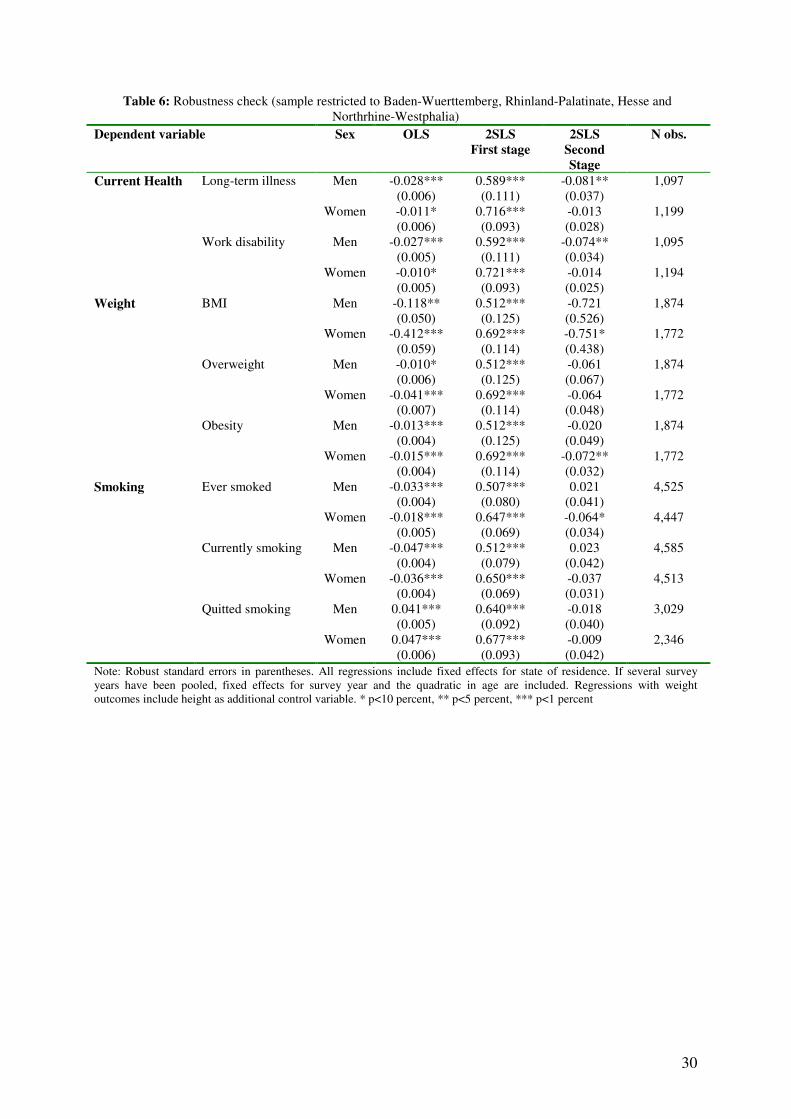
--- about here Table 6 (robustness check) ---
The IV estimates for the restricted sample largely support our earlier findings – even
though there are some differences. Naturally, the estimates are less precisely estimated when
using the restricted sample. The estimated effect of education on long-term illness and work
disability among men has increased substantially compared to the estimates for the
16
unrestricted sample. For women, the point estimates have turned negative but they remain
statistically insignificant. We also find substantially larger effects of years in school on BMI.
Compared to the point estimates in the full sample the effects have more than doubled in size
for men. For women they have more than tripled. Statistical significance is weak, however,
which may be a result of the small size of the restricted sample. Similarly, despite
substantially larger point estimates, we find a statistically significant effect of years in school
on the probability of being overweight or obese only for women – which is in contrast to our
results for the unrestricted sample.
Finally, considering smoking behavior, most effects remain insignificant although
there are some changes with respect to the effect sizes. However, we find a significant effect
of years of schooling on the probability of ever having smoked for women (at the 10%
significance level) suggesting that among women, one more year of schooling causes a
decrease in the probability of ever having smoked of 6.4 percentage points. Compared to the
prevalence rate of 52.4% in the restricted sample, the estimated effect is relatively large.
6.2 Allowing for more flexible state-specific trends
We now analyze whether controlling for state-specific linear cohort trends in addition
to (common) cohort fixed effects is sufficient to control for unobserved trends at the state
level which might be correlated with health and with the decision to institute mandatory
schooling laws. one becomes more comfortable with the results. We present additional results
including state specific quadratic or cubic trends in Table 7.
--- about here Table 7 (flexible state-specific trends)---
These results indicate that for men our results are very robust to the inclusion of more
flexible state-specific trends. For long-term illness and work disability the coefficients
maintain their significance levels and even slightly increase in size indicating a strong
protective effect of education for men. For women, however, we still find basically a zero
effect for long-term illness and work disability. These results are mirrored for BMI, and the
probabilities of being overweight or obese. For men, the coefficients on education do not
change much as one models the state-specific trends more flexible. However, for women, we
now find a zero effect on weight problems. For smoking, we still do not find any significant
results. These robustness checks suggest that there is only weak evidence for a causal effect of
education for women’s health in our sample when using our instrument (weak meaning it
relies on more restrictive assumptions). However, our findings for men are strengthened.
17
6.3 Track Choice and Drop out
Next, we investigate whether the mandatory schooling reforms had additional effects
on track choice and dropping out behavior. The sign of such effects is ex ante unclear. As
shown previously, our instruments mainly identify the effect of schooling for individuals who
acquire now 9 instead of 8 years of schooling. One crucial assumption in models with
treatment effect heterogeneity is monotonicity, i.e. that all individuals react to the instruments
in the same way (Angrist and Imbens, 1995). In our context monotonicity implies that
individuals never prefer less education, e.g. they (weakly) prefer 10 years of schooling
(feasible only in intermediate track before and after the reform) to 9 years (in basic track, after
the reform) to 8 years (in basic track, before the reform). Extending the basic track by one
year would thus push students in basic track from attending 8 to attending 9 years, while the
choices of intermediate track students would remain unaffected (intermediate track students
just do not care whether the basic track takes 8 or 9 years).
Can we imagine a situation in which the monotonicity assumption would be violated,
i.e. where students get less schooling after the reform? "Defiers" in the sense that lengthening
the basic track pushes students from attending 9 to attending 8 years in basic track cannot
exist if the reform is enforced by law. However, for some the schooling choice before the
reform was between 8 years in basic track and 10 years in intermediate track, and the choice
after the reform was between 9 years in basic track and 10 years in intermediate track. Thus if
someone's optimal number of years of education was about 9 years, prolonging basic track by
one year would open up the opportunity to optimize education decisions by reducing
schooling from 10 years in intermediate track to 9 years in basic track, and therefore also
changing the track and the ensuing school leaving certificate. Yet other students may not
complete school in reaction to the reform, i.e. although they stay one year longer in basic
track, they leave without a certificate. Hence it would be reassuring if we found no effect of
compulsory schooling laws on track choice, or that students attend a more demanding track in
reaction to compulsory schooling laws, and no effect on "drop-out" rates.6
Another reason to look at track choice is to assess the potential role of peer effects. For
instance, Jürges, Reinhold, and Salm (2009) look at the construction of new academic track
6 Even if there are defiers of the described sort, we can at least argue that our estimates provide a lower bound
estimate of the effect of education on health - assuming that causal effects of education on compliers and defiers
have the same sign. Moreover, we can also reason that the latter group should be quantitatively unimportant
compared to compliers, because they must come from the smaller group of intermediate track students.

18
schools increasing years of schooling mainly by increasing the proportion of students
attending academic track schools. These shifts, however, also change the composition of
students within the different school tracks. If we found only small effects of changes in
compulsory schooling in basic track on track choice then the reforms would also likely not
affect the composition of peers in the different school tracks.
To investigate track choice, we created a new dummy for students who graduated from
the middle or academic track, and regressed this dummy on the same explanatory variables as
in the previous analysis and compulsory schooling (detailed results available upon request).
We find that lengthening compulsory schooling by one year increased the probability of
attending middle school or academic track by around 1.5 percentage points for women and
0.6 percentage points for men. Thus, the net effect is positive but small, especially for men.
While we cannot exclude the possibility that some students chose a less demanding school
track as a reaction to increased compulsory schooling, we believe this is a minor concern. The
main effect of the compulsory schooling reform appears to be the increase in the length of
schooling for basic track students and not a big change in the student composition. Similarly,
we created a dummy variable for leaving school without a degree and regressed this variable
on all explanatory variables and compulsory schooling laws. The results are a bit more
ambiguous. For men, we find that compulsory schooling laws decreased the likelihood of
dropping out by around 0.25 percentage points (statistically significant on the 5% level),
while for women we find a positive, albeit not significant effect of around 0.12 percentage
points. Thus, compulsory schooling laws had not much of an effect on leaving school without
certificate. If anything, fewer students leave without certificate. Again, this poses no problem
for our analysis because in this case the monotonicity assumption is not violated.
6.4. Confounding Effects of Short School Years
Another potential problem of our analysis is that the increase in compulsory schooling
was accompanied by the introduction of short school years in some German states (see
Pischke, 2007 for a detailed description). In the years 1966-67 the start of the school year was
shifted from Easter to the end of summer. All states except Bavaria, Hamburg, and West-
Berlin introduced two short school years (of 8 months each) for students attending school at
this time to accommodate the change in the schedule. Thus, although the first cohorts after the
introduction of compulsory schooling have completed nine formal grades instead of eight,
they have not spent much more time in the class room compared to the previous cohorts who
19
were subject to eight (full) years of compulsory schooling. Bavaria did not introduce short
school years because the school year already started in summer, and Hamburg and West-
Berlin opted for one extra-long school year. The introduction of the short school years could
affect our results because we possibly over-estimate the true extent of schooling of the
affected cohorts. For this reason, we perform a robustness check by recoding our endogenous
variable "years of schooling" taking into account actual time spent in school instead of highest
grade completed. The results are shown in table 8.7
---Table 8 (robustness check short school years) about here---
The results indicate that our estimates are not very sensitive to the exact definition of
short school years. The result for smoking among women is an exception indicating that years
of schooling increase the likelihood that women have ever smoked substantially. We can only
speculate about the reason for this finding. Perhaps recoding the endogenous variable
increased the weight of states without short school years in our estimates. Note, however, that
this effect is transitory, as there is no statistically significant effect on current smoking among
women.
7. Summary and Discussion
The present paper contributes to the growing literature on identifying the causal link
between education and health and health-related behavior. Economic theory has identified
causal effects of education on health through several plausible channels: (a) education raises
efficiency in health production; (b) education changes inputs into health production (through
information) and thereby increases allocative efficiency; (c) education itself changes time
preference (and thus inputs into health production) because schooling focuses students'
attention on the future; (d) education has an indirect effect mediated through higher income,
occupational status, better housing, or healthier environmental conditions.
Numerous studies have indeed documented a strong positive empirical association
between education and health. Interpretation of this correlation as causal is difficult, however,
because education is most likely an endogenous variable, for instances because unobserved
"pre-treatment" variables such as time preferences or cognitive and social skills, possibly
drive both education and health behavior, or because health at younger ages, e.g. in early
childhood affects both educational achievement and later life health. Recent empirical work
7 Notice that the number of observations is lower in this sample because for individuals born in 1960 we cannot
20
addresses causality issues head on using natural experiments such as exogenous changes in
compulsory schooling laws for identification. Our paper is directly linked to this literature.
Using data from several German Microcensuses, we exploit changes in years of compulsory
schooling in West German federal states that took effect between 1949 and 1969 to estimate
the causal effect of years in school on long-term illness, work disability, BMI (and
overweight/obesity) and current and former smoking measured in 1989 to 2003.
We find evidence for a strong and significant negative causal effect of years of
schooling on long-term illness and work disability among men. Our IV estimates are slightly
larger than OLS but in contrast to some of the existing literature they tend to be in the same
range. For women, however, we do not find any significant causal effects on health status. We
also find some evidence for negative causal effects of education on male body weight and
somewhat less convincing support for a negative effect on female body weight.
The literature on causal effects of education on health is usually silent on sex
differences. However, there is a large literature on sex differences in health levels and their
reasons (e.g. Verbrugge 1989, Case & Paxson 2005). Reasons for sex differences in health
mentioned are (1) differences in biological risk, i.e. intrinsic differences based on human
biology, (2) differences in acquired risk, i.e. health risks due to work and other activities,
including health-related activities, (3) psychosocial differences, i.e. differences in health
perception and believes, (4) differences in reporting styles, i.e. how illnesses and symptoms
are communicated, and (5) differences in health care utilization and the effects of health care
on current diseases and the onset of future diseases.
One might hypothesize that education mediates those "pathways" differently for
different sexes. For instance, education could mediate differences in acquired risk if women
with low levels of education are less likely to perform hard physical labor than men. Thus, if
education reduces the likelihood of being in a physically demanding job – and more so for
men than for women – a stronger effect of education on health for men could result. Indeed,
some supplementary analyses show that the effect of education on long-term health and work
disability for men seems to be partly mediated through its effect on the probability of being a
blue-collar worker. Overall, however, gender differences in the SES-health link appear to be
underresearched. The five possible pathways mentioned in the preceding paragraph could
serve as promising starting points.
know for sure how many short school years they were exposed to.
21
We also address some possible concerns about the validity of our results. One concern
is that, because we only know individuals' current state of residence and not the state where
they actually finished school, migration between the states results in measurement error in
both the instrument and schooling. Our robustness check – exploiting that fact that four large
contiguous states have lengthened compulsory schooling in the same year – suggests that
migration is unlikely to compromise our estimation results. Further, we address the concern of
unobserved state-specific trends which could be correlated with the instrument are biasing our
results. In our most flexible specification, we allow for (common) cohort fixed effects and
cubic state-specific cohort trends. These robustness checks do not alter our main conclusions.
Next, we address the concern that changes in mandatory schooling laws could also affect the
likelihood that a student leaves school without a degree or induces track changes that actually
reduce the number of years in school. Such behavior would violate the monotonicity
assumption made in the presence of heterogeneous treatment effects. Regression results
indicate very small effects on track choice that are unlikely to threaten the validity of our
main results. Finally, we allow for the fact that students affected by the mandatory schooling
reform also underwent so-called short school years. Recoding our endogenous variable to
account for short school years does not alter our results either.
In conclusion, the results or our paper can be put in the context of the existing
theoretical and empirical literature as follows: based on our analysis, we can only partly
distinguish between the four theoretical arguments for a causal effect of education on health
mentioned above. A link via better health inputs in terms of less smoking is not supported by
our data.8 Overweight and obesity can be interpreted not only as indicators of future health
problems but also as indicators of past health behavior. Thus our findings on weight indirectly
support the health input argument, although more so for men than for women. Again, changes
in occupation from manual to non-manual could be an explanation. Further, we have not
looked at income or wages in our paper. Considering existing evidence – using an identical
identification strategy – changes in mandatory schooling had no causal effect on wages
(Pischke & von Wachter 2008), the link between education and health via higher income (and
thus favorable living conditions) appears unlikely. Finally, it must also be noted that our
parameters only identify the effect of education for compliers to the specific reforms of
raising mandatory school leaving age. Interventions at other stages of the life-cycle or more
8 This is surprising because Jürges, Reinhold and Salm (2009) do find an effect of education on schooling using
similar data using the construction of academic track schools as instruments. Possibly, these differences arise
because they look at a different part of the schooling distribution and because in their set-up the composition of
22
specific interventions might have stronger and more systematic effects on health outcomes
and health behavior.
peers in the schools also changes as more students are drawn into academic track schools. We leave this question
to further research.
23
ReferencesAcemoglu, D. and J. D. Angrist (2000): “How Large are the Social Returns to Education? Evidence from
Compulsory Schooling Laws,” In: National Bureau of Economics Macroeconomics Annual 2000.
Editors: Ben S. Bernanke and Kenneth S. Rogoff. MIT Press Cambridge.
Albouy, V. and L. Lequien (2009): “ Does compulsory education lower mortality?”, Journal of Health
Economics, Vol. 28, pp. 155-168.
Angrist, J. D. and G.W. Imbens (1995): “Two-stage least squares estimation of average causal effects in models
with variable treatment intensity.” Journal of the American Statistical Association, Vol. 90 (130), pp.
431-442.
Becker, G.S. and C.B. Mulligan (1997): The endogenous determination of time preference, Quarterly Journal of
Economics 112, 729-758.
Carneiro, Pedro, Claire Crawford and Alissa Goodman (2007): The Impact of Early Cognitive and Non-
Cognitive Skills on Later Outcomes. CEE DP 92. London School of Economics.
Case, A., D. Lubotsky, and C. Paxson (2002): Economic Status and Health in Childhood: The Origins of the
Gradient. American Economic Review, Vol. 92, No. 5, pp. 1308-1334
Case, A. & Paxson, C. (2005): Sex Differences in Morbidity and Mortality. Demography 42 (2), 189-214.
Clark, D. and H. Royer (2010): “The Effect of Education on Adult Mortality and Health: Evidence from the
United Kingdom”, NBER Working Paper 16013.
Cutler, David, and Adriana Lleras-Muney (2008): Education and Health: Evaluating theories and evidence. In:
The effects of social and economic policy on health. Editors: J. Newhouse, R. Schoeni, G. Kaplan, and
H. Polack, forthcoming, Russell Sage Press.
Cutler, David, and Adriana Lleras-Muney (2010): Understanding differences in health behaviors by education.
Journal of Health Economics 29 (1), 1-28.
Deaton , A. (2002): Policy implications of the gradient of health and wealth, Health Affairs 21 (2), 13-30.
Deaton, A. (2003): Health, Income and Inequality. NBER Reporter, Spring 2003.
Deutsches Krebsforschungszentrum (2004): Rauchen und soziale Ungleichheit – Konsequenzen für die
Tabakkontrollpolitik [Smoking and Health Inequality – Implications for tobacco control policy].
Heidelberg.
Dustmann, C. (2004): Parental Background, Secondary School Track Choice, and Wages, Oxford Economic
Papers, Vol. 56, pp. 209 - 230.
Fuchs, Victor (1982): Time Preference and Health: An Explanatory Study. pp. 93-120 in: VR Fuchs, Economic
aspects of health, University of Chicago Press.
Grossman, Michael (1972), On the concept of health capital and the demand for health. Journal of Political
Economy 80 (2), 223-255.
Grossman, Michael (2006), Education and non-market outcomes. In: Handbook of the Economics of Education,
edited by: Eric Hanushek and Finis Welch, Elsevier Science.
Jürges, H. E. Kruk, and S. Reinhold (2009): The effect of compulsory schooling on health – evidence from
biomarkers. MEA discussion paper 183-09.
Jürges, H, S. Reinhold, and M. Salm (2009): “Does schooling affect health behavior? Evidence from the
educational expansion in Germany,” IZA discussion paper 4330.
Jürges, Hendrik and Kerstin Schneider (2007): " What can go wrong will go wrong: birthday effects and early
tracking in the German school system. CESIfo Working Paper No. 2055.
Kenkel, Donald (1991): Health behavior, health knowledge, and schooling. Journal of Political Economy, 99,
287-305.
Lleras-Muney, A. (2005): “The Relationship between Education and Adult Mortality in the United States”,
Review of Economic Studies, Vol. 72, pp. 189-221.
Mokdad, Ali H,, James S. Marks, Donna F. Stroup, and Julie F. Gerberding (2004): Actual causes of death in the
United States, 2000. Journal of the American Medical Association, 291, 1238-1245.
Nayga, Rudolfo M. (2000): Schooling, health knowledge, and obesity. Applied Economics, 32, 815-832.
Oreopoulos, P. (2006): “Estimating average and local average treatment effects of education when compulsory
schooling laws really matter,” American Economic Review, Vol. 96 (1), pp. 152-175.
24
Pischke, J.-S. and T. von Wachter (2005): “Zero Returns to Compulsory Schooling in Germany: Evidence and
Interpretation”, IZA Discussion Paper #1645.
Pischke, J.-S. (2007): “The Impact of Length of the School Year on Student Performance and Earnings:
Evidence from The German Short School Years,” Economic Journal, Vol. 117, pp. 1216-1242.
Pischke, J.-S. and T. von Wachter (2008): “Zero Returns to Compulsory Schooling in Germany: Evidence and
Interpretation”, The Review of Economics and Statistics, Vol. 90 (3), pp. 592-598.
Powdthavee, Nattavudh (2010): "Does Education Reduce the Risk of Hypertension? Estimating the Biomarker
Effect of Compulsory Schooling in England". IZA Discussion Paper 4847.
Reinhold, S. and H. Jürges (2009): “Secondary school fees and the causal effect of schooling on health
behavior.” Health Economics, forthcoming.
Reinhold, S. and H. Jürges (2009b): "Parental Income and Child Health in Germany". MEA Discussion Paper
175-2009.
Riphahn, Regina (2008): The effect of secondary school fees on educational attainment. LASER Discussion
Papers - Paper No. 21.
Rosenzweig, MR and Schulz. TP (1981): Education and Household Production of Child Health. In: Proceedings
of the American Statistical Association (Social Statistics Section), 382-387.
Silles, M. (2009): "The Causal Effect of Education on Health: Evidence from the United Kingdom", Economics
of Education Review 28 (1), 122-128.
Verbrugge, L.M. (1989) The twain meet: empirical explanations of sex differences in health and mortality.
Journal of Health and Social Behavior 30 (3):282-304.
De Walque, Damien (2007): Does education affect smoking behaviors? Evidence using the Vietnam draft as an
instrument for college education, Journal of Health Economics, 26, 877-895.
World Health Organization (2003): Social determinants of health. The solid facts. 2nd
edition,
http://www.euro.who.int/document/e81384.pdf, accessed March 16, 2010.
25
Table 1 – Introduction of a 9th grade in the basic track of secondary school
First year in which all students
were supposed to graduate no
sooner than after nine years of
compulsory schooling
First birth cohort affected by the
change in compulsory schooling
laws
Hamburg 1949 1934
Schleswig-Holstein 1956 1941
Bremen 1958 1943
Lower Saxony 1962 1947
Saarland 1964 1949
North Rhine-Westphalia 1967 1953
Hesse 1967 1953
Rhineland-Palatinate 1967 1953
Baden-Wuerttemberg 1967 1953
Bavaria 1969 1955
Source: Pischke and von Wachter, 2005
26
Table 2: Sample means (standard deviation in parentheses, number of observations below)
Microcensus
2002
Microcensus
1999, 2003
Microcensus 1989,
1995, 1999, 2003
Variable Sex
Cohorts born
between 1937 and
1960
Cohorts born
between 1930 and
1960
Cohorts born
between 1930 and
1960
Men 52.48
(7.10)
24,099
54.76
(9.10)
49,843
50.13
(10.27)
122,178
Age
Women 52.63
(7.11)
24,624
55.19
(9.17)
50,560
50.57
(10.31)
124,674
Men 9.63
(1.82)
23,128
9.50
(1.84)
48,640
9.42
(1.80)
119,461
Years in school
Women 9.39
(1.62)
23,479
9.20
(1.59)
49,225
9.17
(1.55)
121,541
Men 0.20
(0.40)
24,099
- -Long-term illness
Women 0.15
(0.36)
24,624
- -
Men 0.17
(0.37)
23,791
- -Work disability
Women 0.13
(0.33)
23,369
- -
Men - 26.70
(3.66)
49,843
-BMI
Women - 25.25
(4.36)
50,560
-
Men - 0.66
(0.47)
49,843
-Overweight
Women - 0.46
(0.50)
50,560
-
Men - 0.16
(0.36)
49,843
-Obesity
Women - 0.13
(0.34)
50,560
-
Men - - 0.63
(0.48)
122,178
Ever smoked
Women - - 0.39
(0.49)
124,674
Men - - 0.36
(0.48)
122,178
Currently smoking
Women - - 0.24
(0.43)
124,674
Men - - 0.44
(0.50)
77,566
Quitted smoking
Women - - 0.38
(0.49)
48,501
27
Table 3: Distribution of leaving certificates in percent, by birth cohorts
1930 1940 1950 1960
Basic Track Men 76.8 69.1 58.8 47.7
Women 82.1 73.0 63.0 40.7
Intermediate Men 12.3 14.6 17.2 22.7
Women 12.9 19.8 22.4 35.5
Academic Men 10.9 16.3 23.9 29.6
Women 4.9 7.2 14.6 23.8

28
Table 4 –OLS results
Dependent variable Sex Coefficient
on years in
school
Standard
Error
Number of
observations
Men -0.029*** 0.001 23,128Long term illness
Women -0.012*** 0.002 23,479
Men -0.029*** 0.001 22,858
Current Health
Work disability
Women -0.013*** 0.001 23,266
Men -0.271*** 0.010 48,640BMI
Women -0.465*** 0.013 49,225
Men -0.031*** 0.001 48,640Overweight
Women -0.047*** 0.002 49,225
Men -0.018*** 0.001 48,640
Weight
Obesity
Women -0.020*** 0.001 49,225
Men -0.026*** 0.001 119,461Ever smoked
Women -0.005** 0.002 121,541
Men -0.032*** 0.001 121,318Currently smoking
Women -0.021*** 0.002 124,314
Men 0.027*** 0.001 76,037
Smoking
Quitted smoking
Women 0.041*** 0.002 47,551
Note: Standard errors clustered on cohort*state level. * p<10 percent, ** p<5 percent, *** p<1 percent. All regressions
include fixed effects for year of birth, state of residence, and an interaction of state of residence and a linear cohort trend. If
several survey years have been pooled, fixed effects for survey year and the quadratic in age are included. . Regressions with
weight outcomes include height as additional control variable..
29
Table 5: Results of 2SLS regressions
Dependent variable Sex First Stage
Coefficient on
instrument
Second stage
coefficient on
years in school
Number of
observations
Men 0.656***
(0.054)
160.3
-0.041**
(0.017)
23,128Long term illness
Women 0.579***
(0.047)
161.8
0.010
(0.017)
23,479
Men 0.655***
(0.055)
157.7
-0.032**
(0.015)
22,858
Current Health
Work disability
Women 0.580***
(0.047)
160.5
0.021
(0.016)
23,266
Men 0.595***
(0.040)
238.0
-0.301**
(0.121)
48,640BMI
Women 0.663***
(0.033)
380.2
-0.194
(0.133)
49,225
Men 0.595***
(0.040)
238.0
-0.030**
(0.015)
48,640Overweight
Women 0.663***
(0.033)
380.2
-0.031**
(0.015)
49,225
Men 0.595***
(0.040)
238.0
-0.030**
(0.014)
48,640
Weight
Obesity
Women 0.663***
(0.033)
380.2
-0.004
(0.010)
49,225
Men 0.615***
(0.025)
620.8
-0.011
(0.011)
119,461Ever smoked
Women 0.655***
(0.021)
952.3
0.010
(0.010)
121,541
Men 0.616***
(0.025)
631.5
-0.005
(0.010)
121,318Currently smoking
Women 0.654***
(0.021)
975.1
-0.001
(0.009)
124,314
Men 0.668***
(0.030)
536.2
-0.005
(0.011)
76,037
Smoking
Quitted smoking
Women 0.690***
(0.031)
507.8
0.015
(0.012)
47,551
Note: Clustered standard errors (on cohort*state level) in parentheses. In addition, we report Kleibergen-Paap rK Wald F
statistics in italics. All regressions include fixed effects for year of birth, state of residence, and an interaction of state of
residence and a linear cohort trend. If several survey years have been pooled, fixed effects for survey year and the quadratic
in age are included. Regressions with weight outcomes include height as additional control variable. * p<10 percent, ** p<5
percent, *** p<1 percent.
30
Table 6: Robustness check (sample restricted to Baden-Wuerttemberg, Rhinland-Palatinate, Hesse and
Northrhine-Westphalia)
Dependent variable Sex OLS 2SLS
First stage
2SLS
Second
Stage
N obs.
Men -0.028***
(0.006)
0.589***
(0.111)
-0.081**
(0.037)
1,097Long-term illness
Women -0.011*
(0.006)
0.716***
(0.093)
-0.013
(0.028)
1,199
Men -0.027***
(0.005)
0.592***
(0.111)
-0.074**
(0.034)
1,095
Current Health
Work disability
Women -0.010*
(0.005)
0.721***
(0.093)
-0.014
(0.025)
1,194
Men -0.118**
(0.050)
0.512***
(0.125)
-0.721
(0.526)
1,874BMI
Women -0.412***
(0.059)
0.692***
(0.114)
-0.751*
(0.438)
1,772
Men -0.010*
(0.006)
0.512***
(0.125)
-0.061
(0.067)
1,874Overweight
Women -0.041***
(0.007)
0.692***
(0.114)
-0.064
(0.048)
1,772
Men -0.013***
(0.004)
0.512***
(0.125)
-0.020
(0.049)
1,874
Weight
Obesity
Women -0.015***
(0.004)
0.692***
(0.114)
-0.072**
(0.032)
1,772
Men -0.033***
(0.004)
0.507***
(0.080)
0.021
(0.041)
4,525Ever smoked
Women -0.018***
(0.005)
0.647***
(0.069)
-0.064*
(0.034)
4,447
Men -0.047***
(0.004)
0.512***
(0.079)
0.023
(0.042)
4,585Currently smoking
Women -0.036***
(0.004)
0.650***
(0.069)
-0.037
(0.031)
4,513
Men 0.041***
(0.005)
0.640***
(0.092)
-0.018
(0.040)
3,029
Smoking
Quitted smoking
Women 0.047***
(0.006)
0.677***
(0.093)
-0.009
(0.042)
2,346
Note: Robust standard errors in parentheses. All regressions include fixed effects for state of residence. If several survey
years have been pooled, fixed effects for survey year and the quadratic in age are included. Regressions with weight
outcomes include height as additional control variable. * p<10 percent, ** p<5 percent, *** p<1 percent
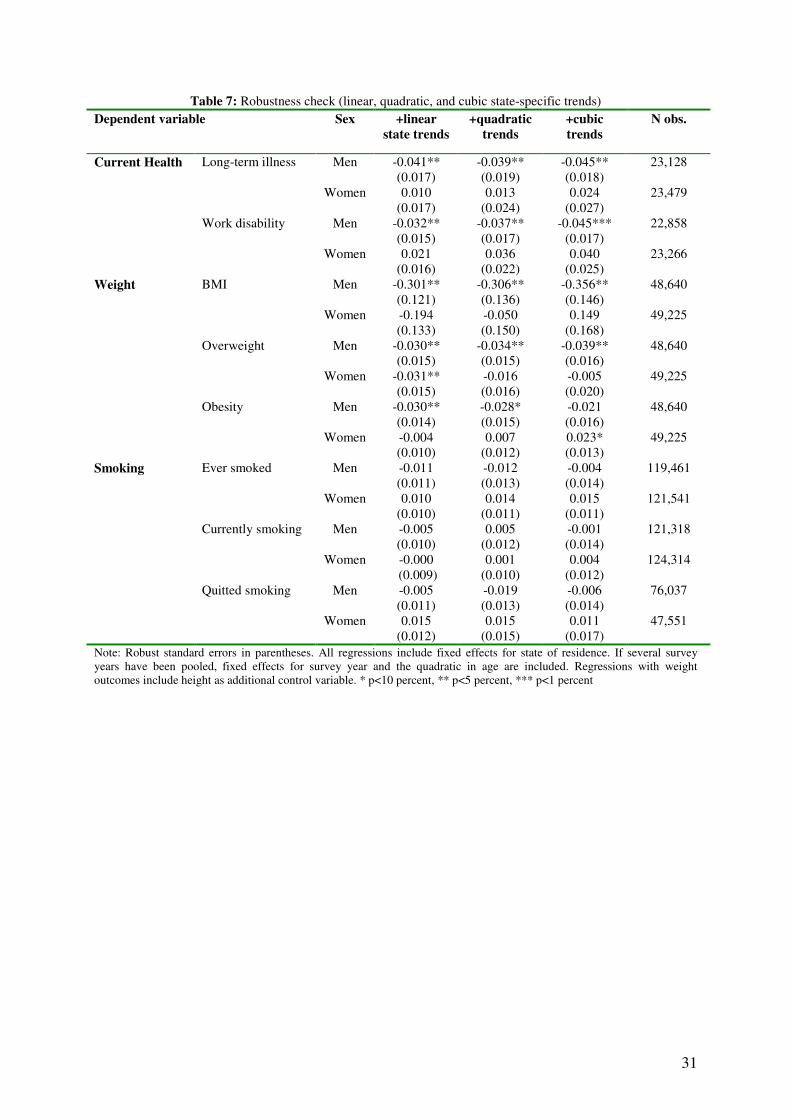
31
Table 7: Robustness check (linear, quadratic, and cubic state-specific trends)
Dependent variable Sex +linear
state trends
+quadratic
trends
+cubic
trends
N obs.
Men -0.041**
(0.017)
-0.039**
(0.019)
-0.045**
(0.018)
23,128Long-term illness
Women 0.010
(0.017)
0.013
(0.024)
0.024
(0.027)
23,479
Men -0.032**
(0.015)
-0.037**
(0.017)
-0.045***
(0.017)
22,858
Current Health
Work disability
Women 0.021
(0.016)
0.036
(0.022)
0.040
(0.025)
23,266
Men -0.301**
(0.121)
-0.306**
(0.136)
-0.356**
(0.146)
48,640BMI
Women -0.194
(0.133)
-0.050
(0.150)
0.149
(0.168)
49,225
Men -0.030**
(0.015)
-0.034**
(0.015)
-0.039**
(0.016)
48,640Overweight
Women -0.031**
(0.015)
-0.016
(0.016)
-0.005
(0.020)
49,225
Men -0.030**
(0.014)
-0.028*
(0.015)
-0.021
(0.016)
48,640
Weight
Obesity
Women -0.004
(0.010)
0.007
(0.012)
0.023*
(0.013)
49,225
Men -0.011
(0.011)
-0.012
(0.013)
-0.004
(0.014)
119,461Ever smoked
Women 0.010
(0.010)
0.014
(0.011)
0.015
(0.011)
121,541
Men -0.005
(0.010)
0.005
(0.012)
-0.001
(0.014)
121,318Currently smoking
Women -0.000
(0.009)
0.001
(0.010)
0.004
(0.012)
124,314
Men -0.005
(0.011)
-0.019
(0.013)
-0.006
(0.014)
76,037
Smoking
Quitted smoking
Women 0.015
(0.012)
0.015
(0.015)
0.011
(0.017)
47,551
Note: Robust standard errors in parentheses. All regressions include fixed effects for state of residence. If several survey
years have been pooled, fixed effects for survey year and the quadratic in age are included. Regressions with weight
outcomes include height as additional control variable. * p<10 percent, ** p<5 percent, *** p<1 percent
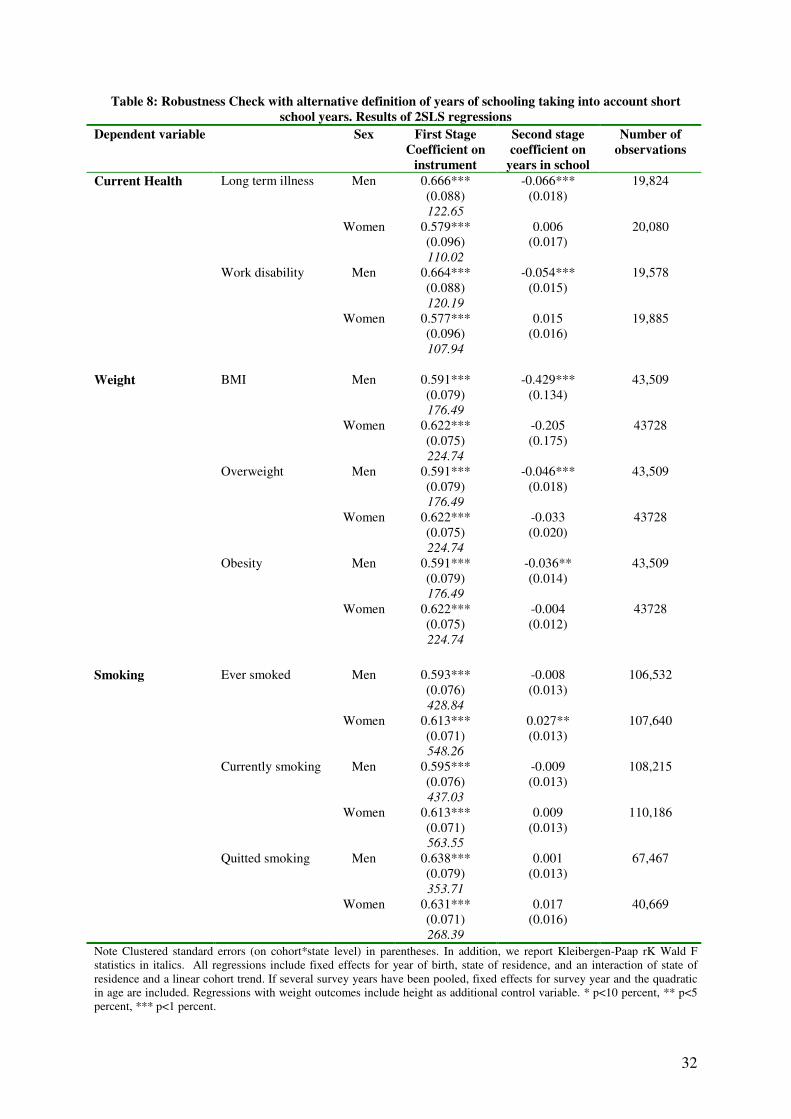
32
Table 8: Robustness Check with alternative definition of years of schooling taking into account short
school years. Results of 2SLS regressions
Dependent variable Sex First Stage
Coefficient on
instrument
Second stage
coefficient on
years in school
Number of
observations
Men 0.666***
(0.088)
122.65
-0.066***
(0.018)
19,824Long term illness
Women 0.579***
(0.096)
110.02
0.006
(0.017)
20,080
Men 0.664***
(0.088)
120.19
-0.054***
(0.015)
19,578
Current Health
Work disability
Women 0.577***
(0.096)
107.94
0.015
(0.016)
19,885
Men 0.591***
(0.079)
176.49
-0.429***
(0.134)
43,509BMI
Women 0.622***
(0.075)
224.74
-0.205
(0.175)
43728
Men 0.591***
(0.079)
176.49
-0.046***
(0.018)
43,509Overweight
Women 0.622***
(0.075)
224.74
-0.033
(0.020)
43728
Men 0.591***
(0.079)
176.49
-0.036**
(0.014)
43,509
Weight
Obesity
Women 0.622***
(0.075)
224.74
-0.004
(0.012)
43728
Men 0.593***
(0.076)
428.84
-0.008
(0.013)
106,532Ever smoked
Women 0.613***
(0.071)
548.26
0.027**
(0.013)
107,640
Men 0.595***
(0.076)
437.03
-0.009
(0.013)
108,215Currently smoking
Women 0.613***
(0.071)
563.55
0.009
(0.013)
110,186
Men 0.638***
(0.079)
353.71
0.001
(0.013)
67,467
Smoking
Quitted smoking
Women 0.631***
(0.071)
268.39
0.017
(0.016)
40,669
Note Clustered standard errors (on cohort*state level) in parentheses. In addition, we report Kleibergen-Paap rK Wald F
statistics in italics. All regressions include fixed effects for year of birth, state of residence, and an interaction of state of
residence and a linear cohort trend. If several survey years have been pooled, fixed effects for survey year and the quadratic
in age are included. Regressions with weight outcomes include height as additional control variable. * p<10 percent, ** p<5
percent, *** p<1 percent.
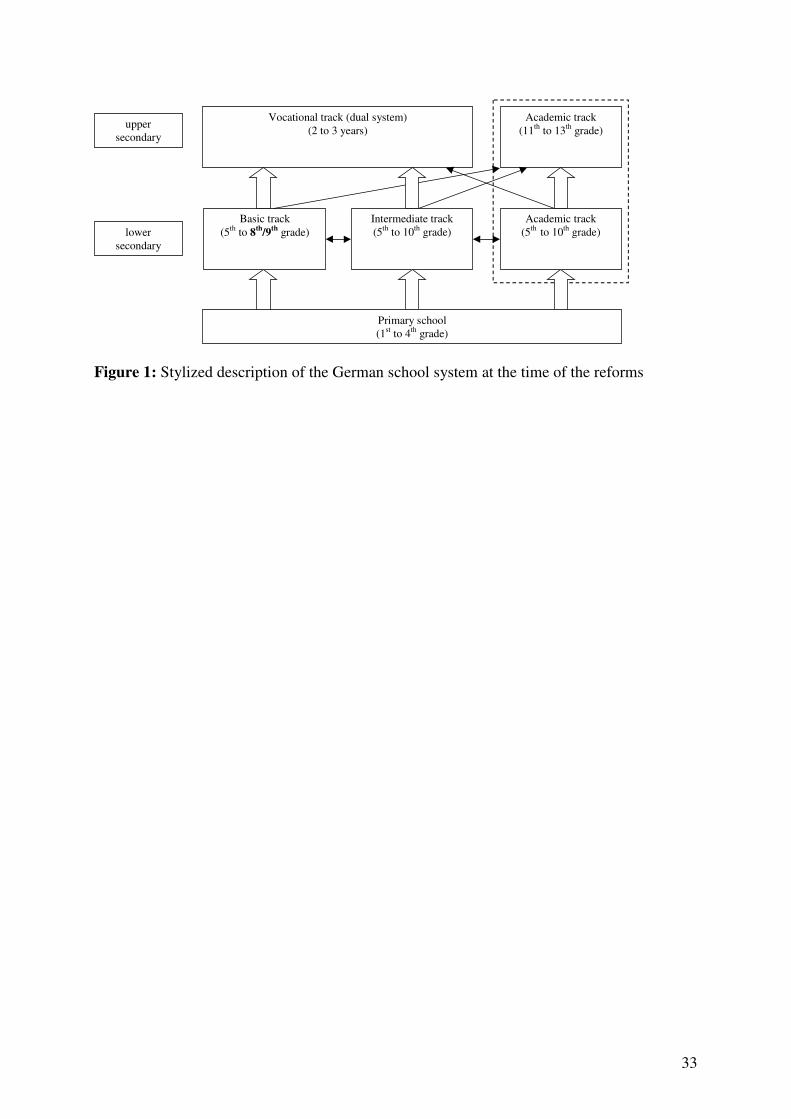
33
Vocational track (dual system)
(2 to 3 years)
Intermediate track
(5th
to 10th
grade)
Academic track
(5th
to 10th
grade)
Academic track
(11th
to 13th
grade)
Primary school
(1st to 4
th grade)
upper
secondary
lower
secondary
Basic track
(5th
to 8th
/9th
grade)
Figure 1: Stylized description of the German school system at the time of the reforms
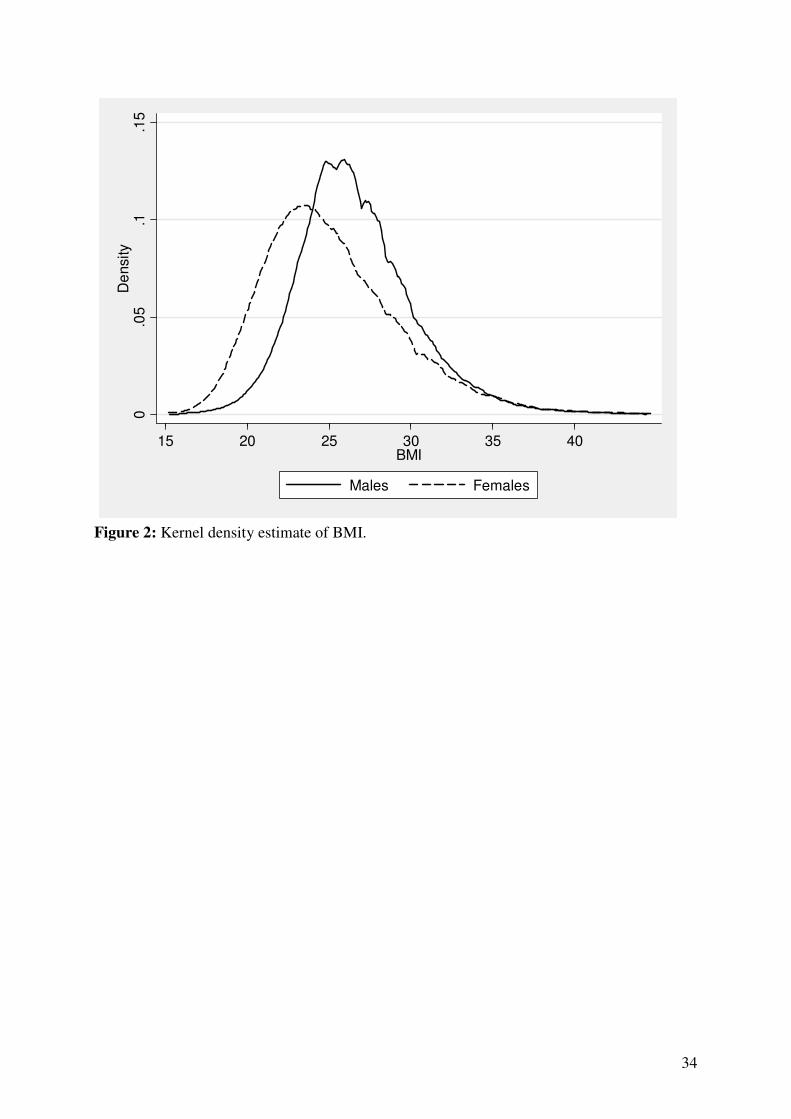
34
0.0
5.1
.15
De
nsity
15 20 25 30 35 40BMI
Males Females
Figure 2: Kernel density estimate of BMI.
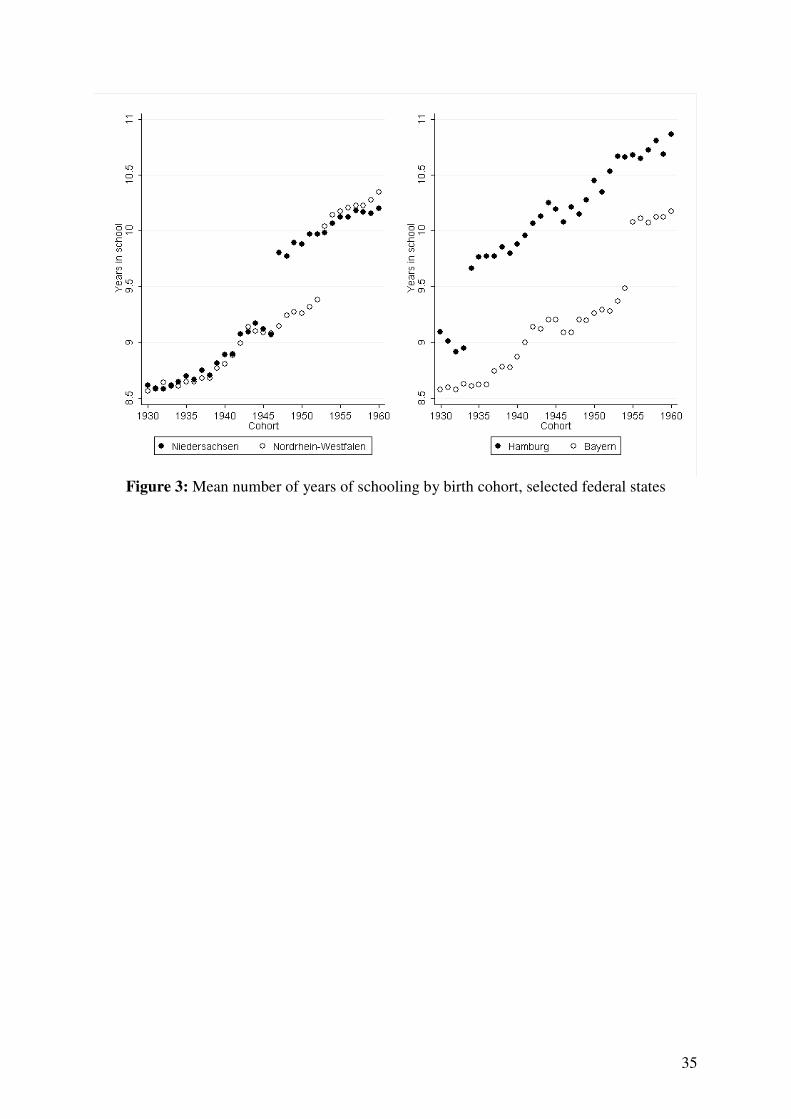
35
Figure 3: Mean number of years of schooling by birth cohort, selected federal states

36
Figure 4: Map of West Germany showing the four contiguous states that lengthened
compulsory schooling in the same year (NW=Northrhine-Westphalia, HE=Hesse,
RP=Rhineland-Palatinate, BW=Baden-Wuerttemberg)
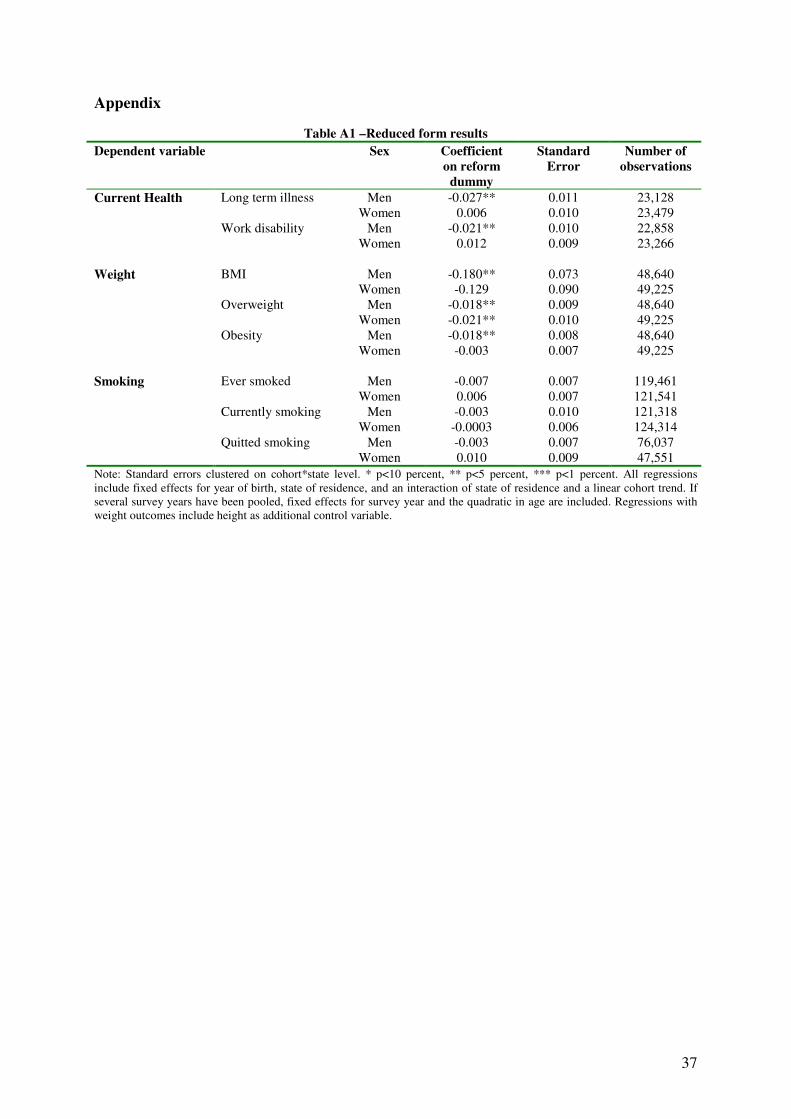
37
Appendix
Table A1 –Reduced form results
Dependent variable Sex Coefficient
on reform
dummy
Standard
Error
Number of
observations
Men -0.027** 0.011 23,128Long term illness
Women 0.006 0.010 23,479
Men -0.021** 0.010 22,858
Current Health
Work disability
Women 0.012 0.009 23,266
Men -0.180** 0.073 48,640BMI
Women -0.129 0.090 49,225
Men -0.018** 0.009 48,640Overweight
Women -0.021** 0.010 49,225
Men -0.018** 0.008 48,640
Weight
Obesity
Women -0.003 0.007 49,225
Men -0.007 0.007 119,461Ever smoked
Women 0.006 0.007 121,541
Men -0.003 0.010 121,318Currently smoking
Women -0.0003 0.006 124,314
Men -0.003 0.007 76,037
Smoking
Quitted smoking
Women 0.010 0.009 47,551
Note: Standard errors clustered on cohort*state level. * p<10 percent, ** p<5 percent, *** p<1 percent. All regressions
include fixed effects for year of birth, state of residence, and an interaction of state of residence and a linear cohort trend. If
several survey years have been pooled, fixed effects for survey year and the quadratic in age are included. Regressions with
weight outcomes include height as additional control variable.