Embed Size (px)
Citation preview
��
Changes in Groundwater Conditions in the Edwards and Trinity Aquifers, 1987-1997,for Portions of Bastrop, Bell, Burnet, Lee, Milam, Travis, and Williamson Counties, Texas
November 1999
Report 350
Changes in GroundwaterConditions in the Edwards
and Trinity Aquifers,1987-1997, for Portions ofBastrop, Bell, Burnet, Lee,
Milam, Travis, andWilliamson Counties, Texas
November 1999
��
Changes in Groundwater Conditions in the Edwards and Trinity Aquifers, 1987-1997,for Portions of Bastrop, Bell, Burnet, Lee, Milam, Travis, and Williamson Counties, Texas
November 1999
Texas Water Development BoardReport 350
Changes in Groundwater Conditions in theEdwards and Trinity Aquifers, 1987-1997, forPortions of Bastrop, Bell, Burnet, Lee, Milam,Travis, and Williamson Counties, Texas
byCindy Ridgeway andHarald Petrini
November 1999
��
Changes in Groundwater Conditions in the Edwards and Trinity Aquifers, 1987-1997,for Portions of Bastrop, Bell, Burnet, Lee, Milam, Travis, and Williamson Counties, Texas
November 1999
Texas Water Development Board
Craig D. Pedersen, Executive Administrator
Texas Water Development Board
William B. Madden, Chairman, DallasNoé Fernández, Vice Chairman, McAllenElaine M. Barrón, M.D., Member, El Paso
Charles L. Geren, Member, Fort WorthJack Hunt, Member, HoustonWales H. Madden, Jr., Member, Amarillo
Authorization for use or reproduction of any original material contained in thispublication, i.e., not obtained from other sources, is freely granted. The Board wouldappreciate acknowledgment.
Published and Distributedby the
Texas Water Development BoardP.O. Box 1323, Capitol Station
Austin, Texas 78711-3231
iiiiii
��
Changes in Groundwater Conditions in the Edwards and Trinity Aquifers, 1987-1997,for Portions of Bastrop, Bell, Burnet, Lee, Milam, Travis, and Williamson Counties, Texas
November 1999
TABLE OF CONTENTSPage
ABSTRACT .................................................................................................................................................. ix
INTRODUCTION ...................................................................................................................................... 1
Purpose ................................................................................................................................................... 1
Location ................................................................................................................................................... 1
HYDROGEOLOGY ..................................................................................................................................... 5
Geology ................................................................................................................................................... 5
Water-level Fluctuations ............................................................................................................................. 6
Edwards Aquifer ..................................................................................................................................... 7
Trinity Group Aquifer ............................................................................................................................. 10
Burnet County ................................................................................................................................. 10
Travis County .................................................................................................................................. 10Williamson County .......................................................................................................................... 14
Water Quality ............................................................................................................................................ 15
POPULATION AND WATER DEMANDS ................................................................................................ 21
Population ................................................................................................................................................. 21
Historical Water Uses ................................................................................................................................. 21
Projected Water Demands .......................................................................................................................... 26
WATER AVAILABILITY .............................................................................................................................. 31
Groundwater Availability ........................................................................................................................... 31
Edwards aquifer ..................................................................................................................................... 31
Trinity Group aquifer ............................................................................................................................. 33
Surface Water Availability ........................................................................................................................... 34
DISCUSSION AND CONCLUSIONS ........................................................................................................ 35
REFERENCES ............................................................................................................................................. 37
LIST OF FIGURES
Figure 1. Location of study area (depicted in red on the State map), surrounding counties, and spatial
extent of the Edwards and Trinity Group aquifers. ........................................................................... 2
Figure 2. Graphs of total monthly precipitation values and the respective rain gage locations
in the study area. ............................................................................................................................ 8
Figure 3. Water-level hydrographs for selected wells completed in the Edwards aquifer. .................................... 9
Figure 4. Potentiometric surface map for the Edwards aquifer from data collected 1997-1998. ........................ 11
Figure 5. Water-level changes in the Edwards aquifer based on data collected 1987-1988 and data
collected 1997-1998. ..................................................................................................................... 12
Figure 6. Water-level hydrographs for selected wells completed in the Trinity Group aquifer. ............................ 13
Figure 7. Potentiometric surface map for the Trinity Group aquifer from data collected 1997-1998. ................ 16
Figure 8. Water-level changes in the Trinity Group aquifer based on data collected 1987-1988 and
data collected 1997-1998 .............................................................................................................. 17
Figure 9. Water quality from samples collected in 1997 from the Edwards aquifer. .......................................... 18
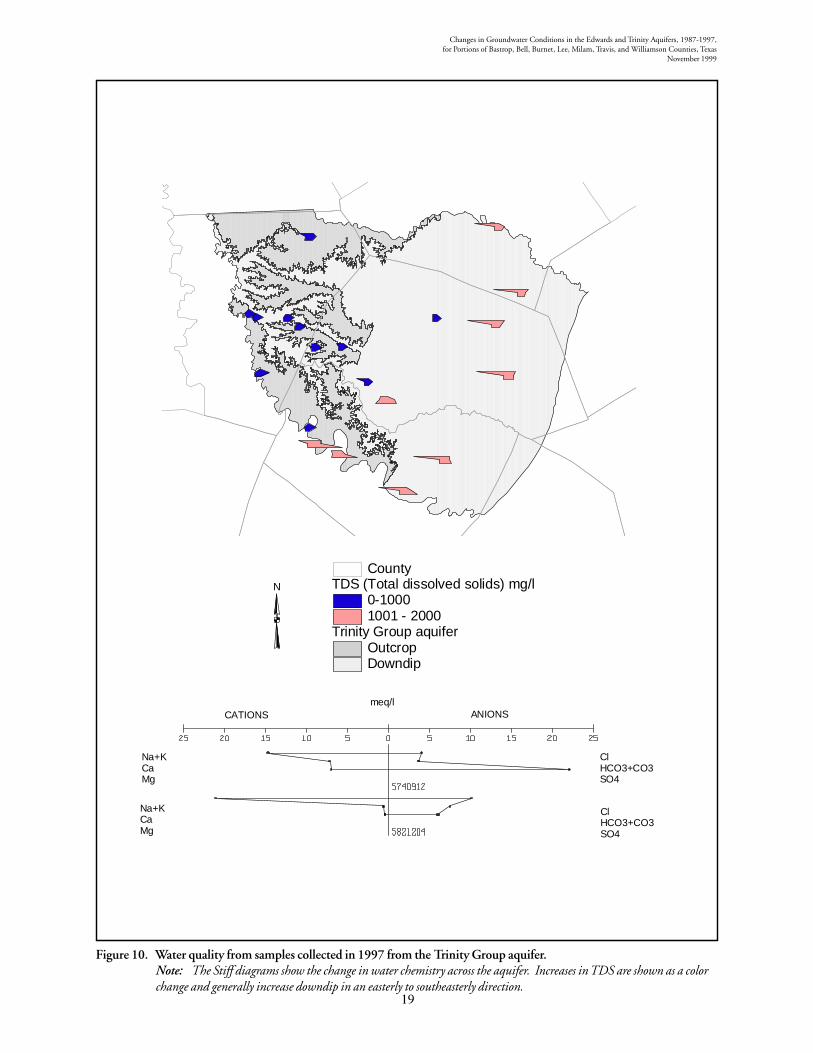
Figure 10. Water quality from samples collected in 1997 from the Trinity Group aquifer. ................................... 19
v
�
Changes in Groundwater Conditions in the Edwards and Trinity Aquifers, 1987-1997,for Portions of Bastrop, Bell, Burnet, Lee, Milam, Travis, and Williamson Counties, Texas
November 1999
TABLE OF CONTENTS (cont’d.)
LIST OF TABLESPage
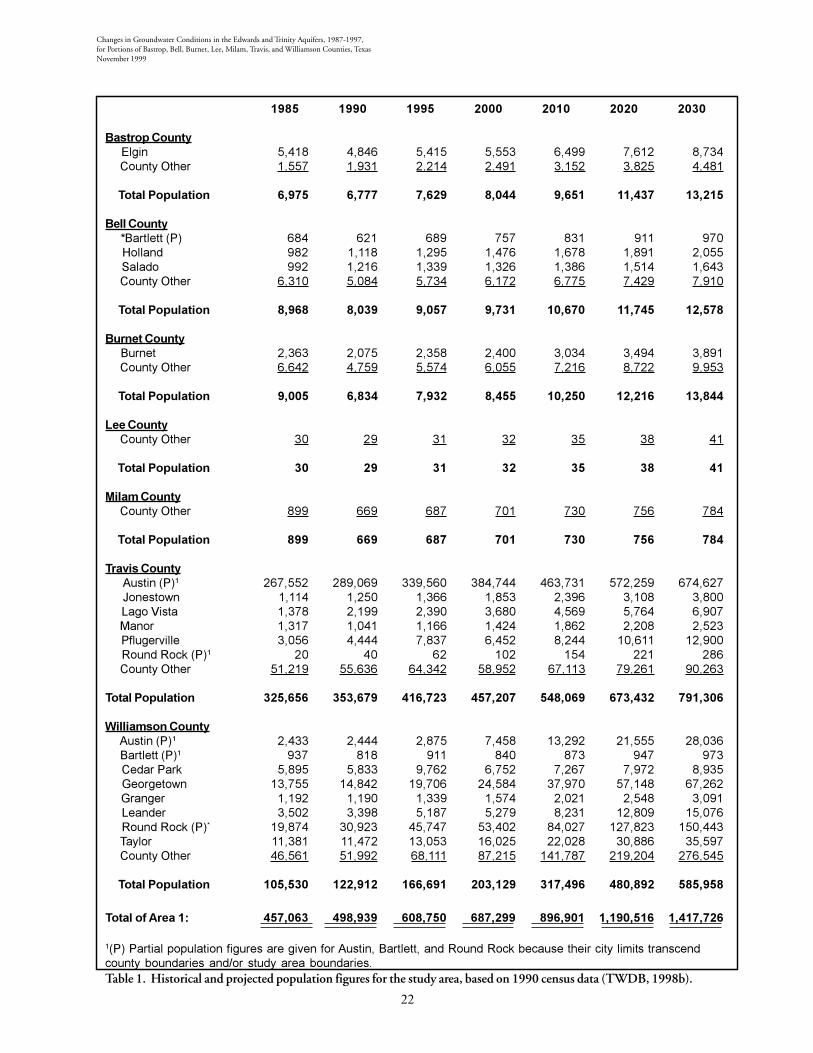
Table 1. Historical and projected population figures for the study area, based on 1990census data (TWDB, 1998b). ........................................................................................................ 22
Table 2. Historical water uses for the study area. ............................................................................................ 23
Table 3. Historical groundwater pumpage in Williamson County (TWDB, 1998b). ...................................... 27
Table 4. Projected water demands by source type for study area. .................................................................... 28
Table 5. Projected water demands by source type for Williamson County. ...................................................... 30
vii
��
Changes in Groundwater Conditions in the Edwards and Trinity Aquifers, 1987-1997,for Portions of Bastrop, Bell, Burnet, Lee, Milam, Travis, and Williamson Counties, Texas
November 1999
ix
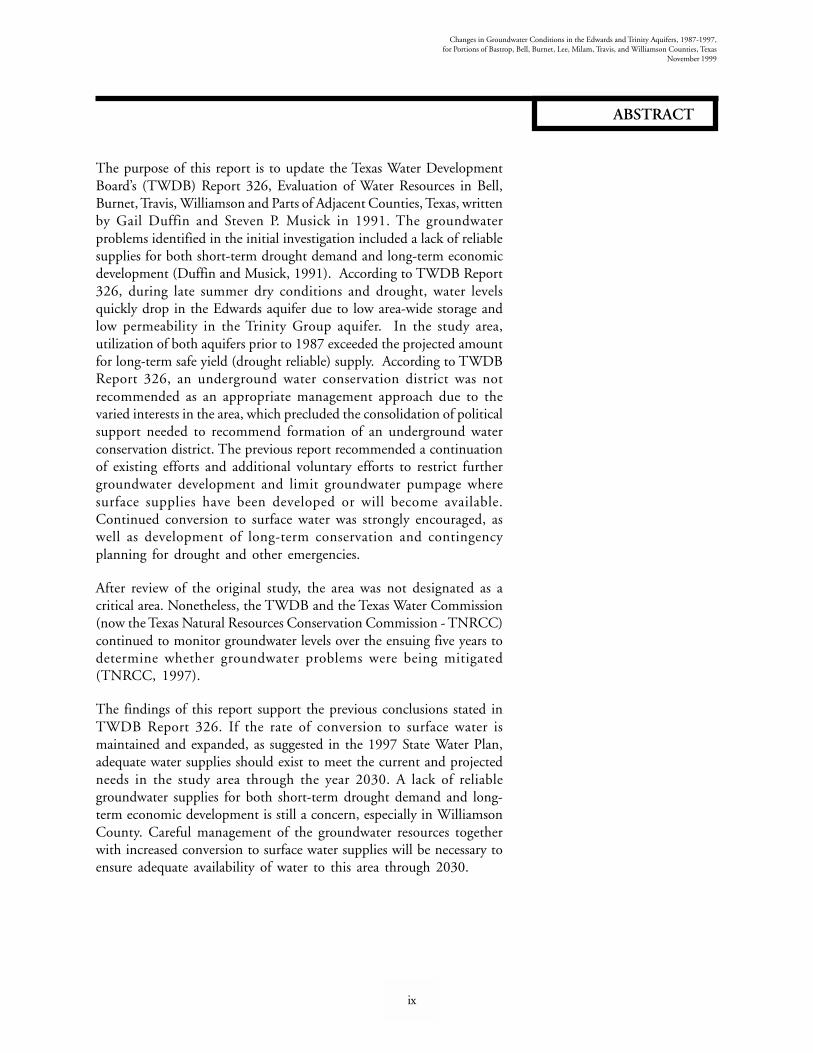
ABSTRACT
The purpose of this report is to update the Texas Water DevelopmentBoard’s (TWDB) Report 326, Evaluation of Water Resources in Bell,Burnet, Travis, Williamson and Parts of Adjacent Counties, Texas, writtenby Gail Duffin and Steven P. Musick in 1991. The groundwaterproblems identified in the initial investigation included a lack of reliablesupplies for both short-term drought demand and long-term economicdevelopment (Duffin and Musick, 1991). According to TWDB Report326, during late summer dry conditions and drought, water levelsquickly drop in the Edwards aquifer due to low area-wide storage andlow permeability in the Trinity Group aquifer. In the study area,utilization of both aquifers prior to 1987 exceeded the projected amountfor long-term safe yield (drought reliable) supply. According to TWDBReport 326, an underground water conservation district was notrecommended as an appropriate management approach due to thevaried interests in the area, which precluded the consolidation of politicalsupport needed to recommend formation of an underground waterconservation district. The previous report recommended a continuationof existing efforts and additional voluntary efforts to restrict furthergroundwater development and limit groundwater pumpage wheresurface supplies have been developed or will become available.Continued conversion to surface water was strongly encouraged, aswell as development of long-term conservation and contingencyplanning for drought and other emergencies.
After review of the original study, the area was not designated as acritical area. Nonetheless, the TWDB and the Texas Water Commission(now the Texas Natural Resources Conservation Commission - TNRCC)continued to monitor groundwater levels over the ensuing five years todetermine whether groundwater problems were being mitigated(TNRCC, 1997).
The findings of this report support the previous conclusions stated inTWDB Report 326. If the rate of conversion to surface water ismaintained and expanded, as suggested in the 1997 State Water Plan,adequate water supplies should exist to meet the current and projectedneeds in the study area through the year 2030. A lack of reliablegroundwater supplies for both short-term drought demand and long-term economic development is still a concern, especially in WilliamsonCounty. Careful management of the groundwater resources togetherwith increased conversion to surface water supplies will be necessary toensure adequate availability of water to this area through 2030.
�
Changes in Groundwater Conditions in the Edwards and Trinity Aquifers, 1987-1997,for Portions of Bastrop, Bell, Burnet, Lee, Milam, Travis, and Williamson Counties, Texas
November 1999
INTRODUCTION
Purpose
The purpose of this report is to update the Texas Water DevelopmentBoard’s (TWDB) Report 326, Evaluation of Water Resources in Bell,Burnet, Travis, Williamson and Parts of Adjacent Counties, Texas, writtenby Gail Duffin and Steven P. Musick in 1991. Report 326 was preparedin response to the 1985 passage of House Bill 2 by the 69th TexasLegislature. This Act called for the identification and study of areasthat were experiencing or are anticipated to experience criticalgroundwater problems within the next 20 years.
The present study is in response to Senate Bill 1, passed in 1997 bythe 75th Texas Legislature. This Act requires the identification of thoseareas of the State that are experiencing or are expected to experiencecritical water problems within the next 25 years, including shortagesof surface water or groundwater, land subsidence resulting fromgroundwater withdrawal, and contamination of groundwater supplies.
Report 326 addressed groundwater problems in the study area relatedto unreliable supplies during short-term drought demands and long-term economic development. In addition, water quality in both of themajor aquifers in the study area (the Trinity Group and Edwardsaquifers) did not meet all of the Texas Department of Health standardsfor public water supply systems, particularly in the deeper down-dipportions of both aquifers.
Location
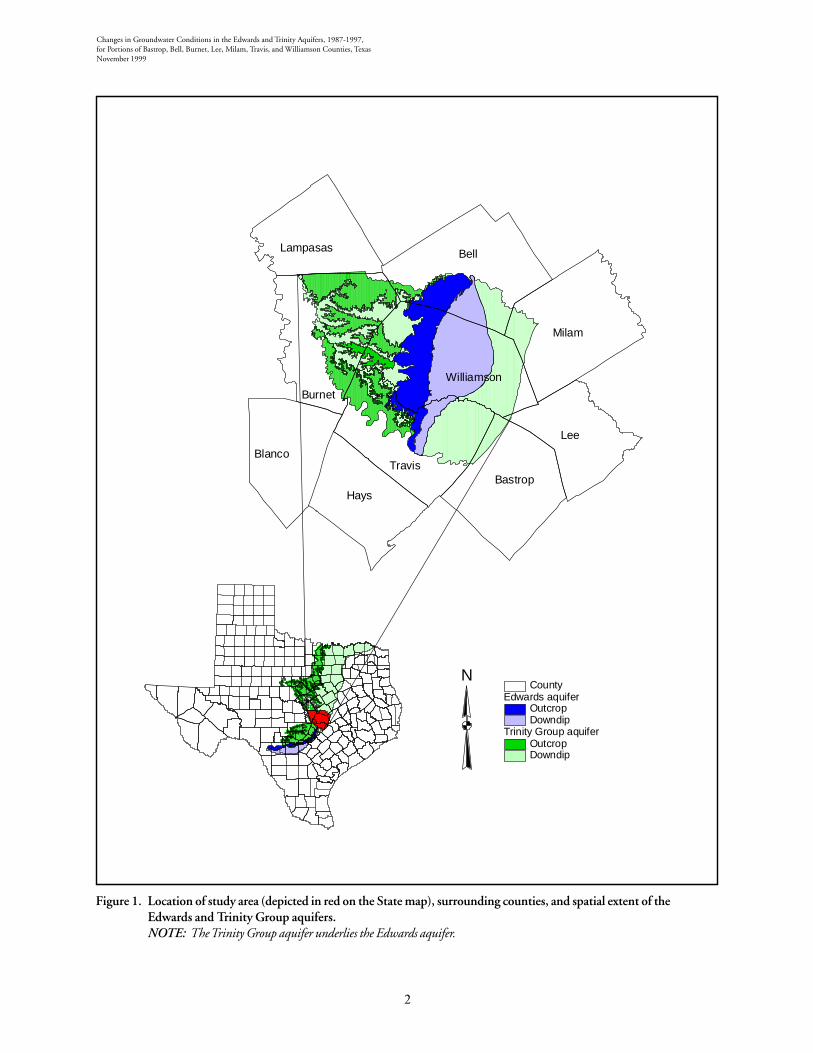
The study area, covering approximately 2,710 square miles, consists ofportions of seven counties: Bastrop, Bell, Burnet, Lee, Milam, Travis,and Williamson (Figure 1). The study area includes portions of boththe Trinity Group and the Edwards aquifers and is delineated by thefollowing boundaries:
● North - Lampasas and Little Rivers;
● South - Colorado River;
● East - the downdip limit of fresh to slightly saline water(1,000 milligrams per liter of total dissolved solids) in thelower member of the Trinity Group aquifer; and,
● West - the updip limit of the Travis Peak Formation (lowerTrinity Group) outcrop (Duffin and Musick, 1991).
�
Changes in Groundwater Conditions in the Edwards and Trinity Aquifers, 1987-1997,for Portions of Bastrop, Bell, Burnet, Lee, Milam, Travis, and Williamson Counties, TexasNovember 1999
Figure 1. Location of study area (depicted in red on the State map), surrounding counties, and spatial extent of theEdwards and Trinity Group aquifers.NOTE: The Trinity Group aquifer underlies the Edwards aquifer.
Lampasas Bell
Milam
Lee
BastropHays
BlancoTravis
Burnet
Williamson
Trinity Group aquiferOutcropDowndip
Edwards aquiferOutcropDowndip
CountyN

�
Changes in Groundwater Conditions in the Edwards and Trinity Aquifers, 1987-1997,for Portions of Bastrop, Bell, Burnet, Lee, Milam, Travis, and Williamson Counties, Texas
November 1999
The region has moderately high relief with small limestone-cappedmesas, steeply angled valleys, and dendritic drainage patterns. Thesoils are typically dark, gravelly, shallow to deep calcareous clays in theuplands, and reddish-brown to dark gray clay loams and clays in thebottomlands. Hot summers and mild winters characterize the climate(Werchan and Coker, 1983). Cyclic droughts occur in the region, mostrecently in 1996 and 1998.
�
Changes in Groundwater Conditions in the Edwards and Trinity Aquifers, 1987-1997,for Portions of Bastrop, Bell, Burnet, Lee, Milam, Travis, and Williamson Counties, Texas
November 1999
HYDROGEOLOGY
Geology
The stratigraphic units in the study area containing groundwater rangein age from the Ordovician Ellenburger Group to Holocene alluvium.The most important water-bearing formations, the Cretaceous Edwardsand Trinity Group, are predominately limestones. The Balcones FaultZone, with displacements of up to 400 feet, parallels the easternboundary of the study area (Senger and others, 1990). Thedisplacements generally restrict groundwater movement in a downdipdirection and are thought to allow water of poor quality to flow intothe aquifers along fault planes (Duffin and Musick, 1991). A “badwater” zone exists along the fault boundary (Senger and others, 1990).
The Edwards aquifer consists of the following:
● Georgetown Formation,
● Edwards Group, and
● Comanche Peak Formation.
The Edwards Group, composed of massive- to thin-bedded limestonesand dolostones, contains most of the aquifer. Honeycomb textures,caverns, and voids in collapse breccias account for most of the significantaquifer porosity. The formation thins from about 300 feet in the Austinarea to 100 feet in southern Bell County (Senger and others, 1990).Water-table conditions exist in the outcrop area and artesian conditionspredominate under the confining Del Rio Clay. TWDB Reports 326(Duffin and Musick, 1991) and 293 (Baker and others, 1986), andSenger and others (1990) provide additional details.
The Trinity Group aquifer consists of the following:
● lower Trinity hydrologic unit, containing the Hosston andSligo members of the Travis Peak Formation,
● middle Trinity hydrologic unit, containing the Cow Creeklimestone and Hensell sand members of the Travis PeakFormation, and the lower member of the Glen RoseFormation, and
● upper Trinity hydrologic unit, containing the upper memberof the Glen Rose Formation and the Paluxy Formation(Duffin and Musick, 1991).
The lower Trinity hydrologic unit consists of a lower calcareousconglomeritic section, a middle calcareous section, and an uppercalcareous clastic section. Regionally, the lower unit of the TrinityGroup aquifer dips east to southeast. It ranges in thickness from 100feet in the west to around 900 feet downdip in Milam County. Between
�
Changes in Groundwater Conditions in the Edwards and Trinity Aquifers, 1987-1997,for Portions of Bastrop, Bell, Burnet, Lee, Milam, Travis, and Williamson Counties, TexasNovember 1999
the lower Trinity hydrologic unit and the middle Trinity hydrologicunit, the Hammett shale member of the Travis Peak Formation acts asa confining bed. The Hammett shale is a fossiliferous, calcareous, anddolomitic shale interbedded with thin limestone and sand layers(Duffin and Musick, 1991).
The middle Trinity hydrologic unit consists of a lower calcareous sectionwith intermittent gypsum or anhydrite beds, a middle calcareousconglomerate section, and an upper calcareous section (Duffin andMusick, 1991).
The upper Trinity hydrologic unit consists of the upper Glen RoseFormation, containing alternating marl and limestone beds. Stair-step topography typifies the upper Glen Rose Formation in outcropdue to erosional characteristics of the lithology. Gypsum and anhydritebeds, which are present in some areas, have often been dissolved leavingsolution channels (Duffin and Musick, 1991). TWDB Reports 339(Bluntzer, 1992), 326 (Duffin and Musick, 1991), 273 (Ashworth,1983), and 195 (Klempt and others, 1975), provide additional details.
Water-level Fluctuations
Hydrographs derived from wells in the Trinity Group and Edwardsaquifers were compiled from thirty years of data and evaluated for water-level fluctuations and potential long-term water-level trends.Hydrographs that were included in TWDB Report 326 were usedonly when additional measurements had been collected since the initialinvestigation. Water-level measurements discussed in this report extendthrough January 1998. Additional wells were selected and included inthis report to obtain a spatially representative array of regional trends(TWDB, 1998). The hydrographs generally reflect changes in waterlevels associated with changes in annual rainfall and public supplypumpage.
In addition, potentiometric surface maps for each aquifer in the studyarea were constructed to analyze current regional flow patterns. Thegroundwater flow direction in the study area is generally to the east-southeast with anomalies occurring in areas of public supply pumpageand where faults influence flow patterns. To establish changes in waterlevels in the past decade, the 1997 to 1998 data were compared tomeasurements collected in 1987 through 1988 from the same set ofwells (TWDB, 1998). The results were graphically plotted andcontoured.
Rainfall records were reviewed to establish trends and to determine if acorrelation exists between recharge from precipitation on the outcropsto rising and falling water levels in the wells (National Climatic DataCenter, 1998). Typically, unconfined portions of aquifers have rapidresponses to precipitation while confined portions may experience adelayed response that could be on the order of months to years. The
�
Changes in Groundwater Conditions in the Edwards and Trinity Aquifers, 1987-1997,for Portions of Bastrop, Bell, Burnet, Lee, Milam, Travis, and Williamson Counties, Texas
November 1999
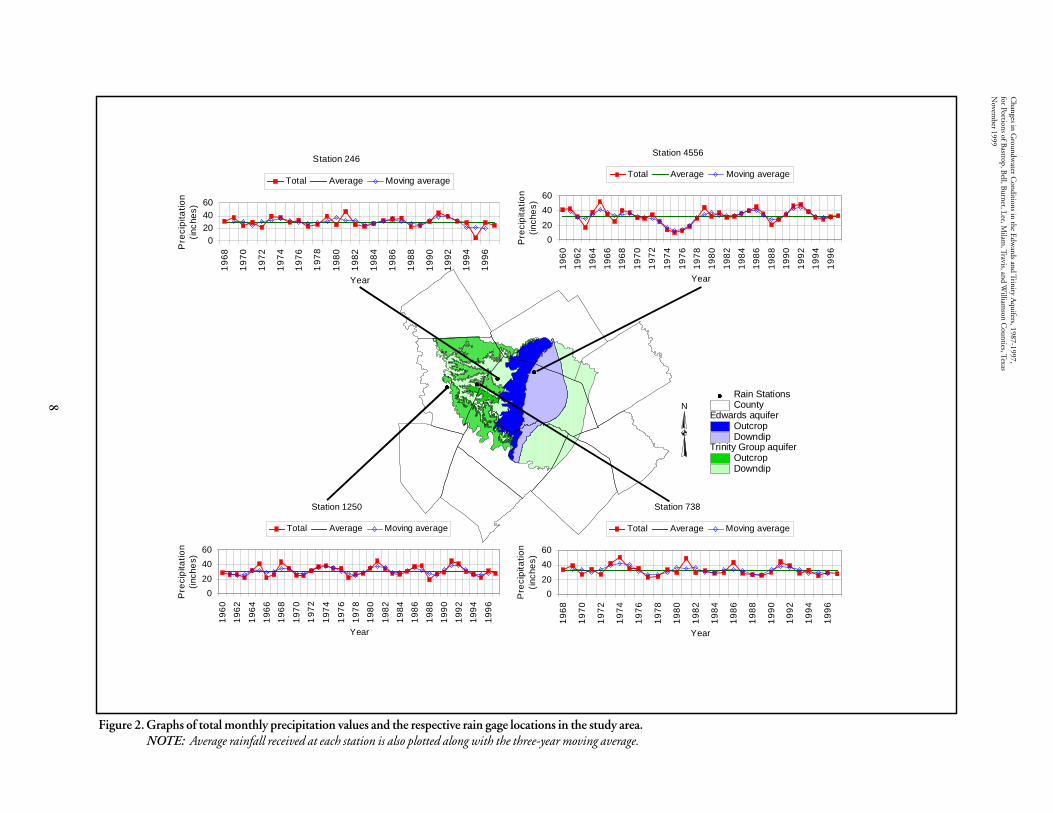
criteria for rain gage selection was based on proximity to the rechargezone and the completeness of historical rainfall records. A total of fourrain gage stations were selected to show rainfall variation across thestudy area from the early to mid-1960s to mid-1997 (Figure 2). Inaddition to total monthly rainfall values, the average rainfall receivedat each station and a three-year moving average was calculated andplotted. Based on these values, an average of 31.87 inches ofprecipitation per year fell on the area since the 1960s. The movingaverage indicates that the study area received below averageprecipitation for the last 3 to 4 years (1993-1997).
Edwards aquifer
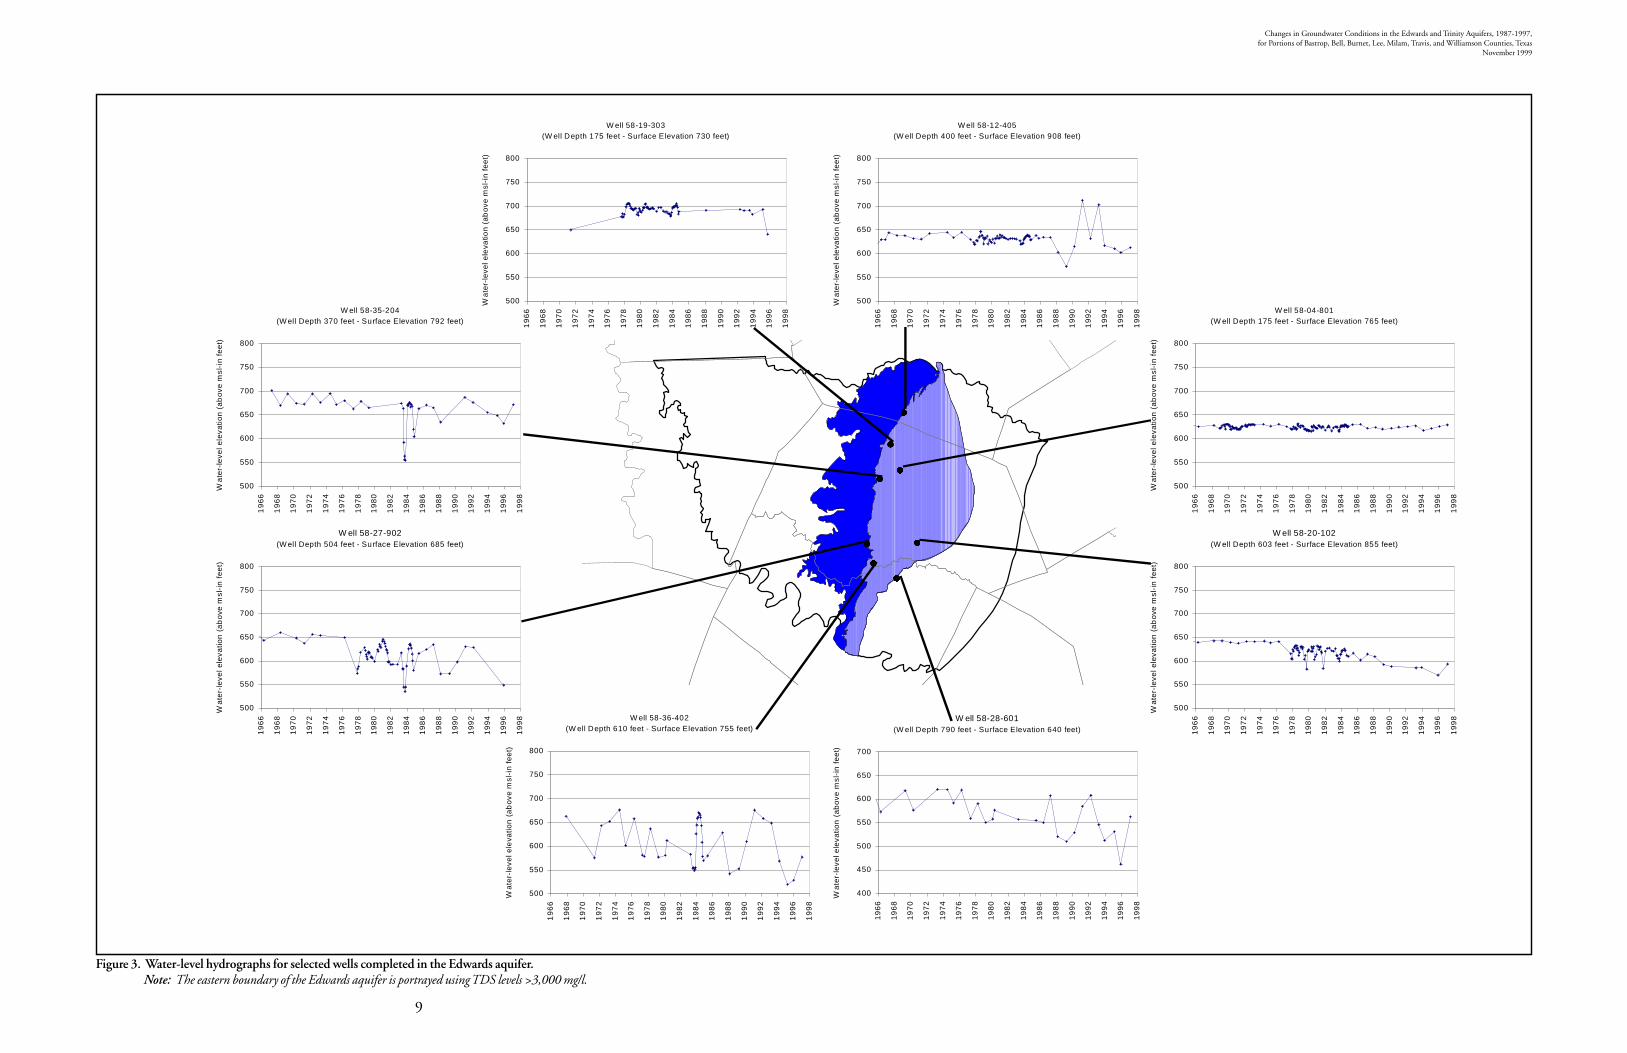
Water-level data available for the Edwards aquifer indicates significantfluctuations in water levels have occurred over time (Figure 3). Anoticeable decrease in water levels was observed during the severedroughts of 1983 to 1984 and 1996. Measurements included anddiscussed in this report extend through January 1998; therefore, theeffects associated with the summer drought of 1998 are not reflected.
Wells 58-35-204 and 58-27-902 experienced the most significant waterlevel declines (up to 120 feet of drawdown) during the 1983-1984drought. Wells 58-19-303, 58-27-902, 58-12-405, and 58-36-402reflect drawdown of up to 130 feet during the period of timeculminating with the 1996 drought. The wells that were measuredsince 1996 exhibited a rise in water levels through 1997, indicating arelatively rapid rebound from drought conditions. Overall, the wellsfound near the recharge zone of the Edwards aquifer (wells58-04-801, 58-12-405, 58-19-303, and 58-35-204) have currentwater levels equal to or slightly below water levels measured in the1960s. The wells located downdip, near the Williamson-Travis countyline, mostly in the artesian portion of the aquifer, show a decrease inwater levels over time and are more affected by pumpage from nearbytowns and cities (wells 58-20-102, 58-28-601, 58-36-402, and58-27-902). The two wells depicted with the most erratic historicalwater levels are wells 58-36-402 and 58-28-601. Well 58-36-402 islocated in Travis County near the center of pumpage for the city ofPflugerville and is not located near any major Edwards aquifer spring.Because it is located in the confined portion of the aquifer and awayfrom the natural recharge zone, its water levels are subject to widefluctuations as a result of pressure changes created by nearby pumpage.Well 58-28-601, located in Williamson County to the northeast ofwell 58-36-402, shows a similar trend. It is one of three public supplywells for the town of Hutto and is also influenced by nearby pumpage.
Water-level data from the winter of 1997 indicate groundwater flowpatterns have not changed significantly in the study area portion ofthe Edwards aquifer since the initial study (Duffin and Musick, 1991).The predominant direction of the hydraulic gradient is to the east, as
�
Changes in G
roundwater C
onditions in the Edw
ards and Trinity Aquifers, 1987-1997,
for Portions of Bastrop, B
ell, Burnet, Lee, M
ilam, Travis, and W
illiamson C
ounties, TexasN
ovember 1999
Figure 2. Graphs of total monthly precipitation values and the respective rain gage locations in the study area.NOTE: Average rainfall received at each station is also plotted along with the three-year moving average.
��
����
��
Trinity Group aquiferOutcropDowndip
Edwards aquiferOutcropDowndip
County�� Rain Stations
N
Station 4556
0
20
40
60
19
60
19
62
19
64
19
66
19
68
19
70
19
72
19
74
19
76
19
78
19
80
19
82
19
84
19
86
19
88
19
90
19
92
19
94
19
96
Year
Pre
cip
itatio
n (i
nche
s)
Total Average Moving average
Station 246
0204060
19
68
19
70
19
72
19
74
19
76
19
78
19
80
19
82
19
84
19
86
19
88
19
90
19
92
19
94
19
96
Year
Pre
cip
itatio
n (i
nche
s)Total Average Moving average
Station 738
0
20
40
60
19
68
19
70
19
72
19
74
19
76
19
78
19
80
19
82
19
84
19
86
19
88
19
90
19
92
19
94
19
96
Year
Pre
cip
itatio
n (i
nche
s)Total Average Moving average
Station 1250
0
20
40
60
19
60
19
62
19
64
19
66
19
68
19
70
19
72
19
74
19
76
19
78
19
80
19
82
19
84
19
86
19
88
19
90
19
92
19
94
19
96
Year
Pre
cip
itatio
n (i
nche
s)
Total Average Moving average
Changes in Groundwater Conditions in the Edwards and Trinity Aquifers, 1987-1997,for Portions of Bastrop, Bell, Burnet, Lee, Milam, Travis, and Williamson Counties, Texas
November 1999
�
�
�
�
� �
�
�
W ell 58-19-303(W ell Depth 175 feet - Surface Elevation 730 feet)
500
550
600
650
700
750
800
19
66
19
68
19
70
19
72
19
74
19
76
19
78
19
80
19
82
19
84
19
86
19
88
19
90
19
92
19
94
19
96
19
98
Wa
ter-
leve
l ele
vatio
n (
ab
ove
msl
-in
fe
et)
W ell 58-12-405(W ell Depth 400 feet - Surface Elevation 908 feet)
500
550
600
650
700
750
800
19
66
19
68
19
70
19
72
19
74
19
76
19
78
19
80
19
82
19
84
19
86
19
88
19
90
19
92
19
94
19
96
19
98
Wa
ter-
leve
l ele
vatio
n (
ab
ove
msl
-in
fe
et)
W ell 58-04-801(W ell Depth 175 feet - Surface Elevation 765 feet)
500
550
600
650
700
750
800
19
66
19
68
19
70
19
72
19
74
19
76
19
78
19
80
19
82
19
84
19
86
19
88
19
90
19
92
19
94
19
96
19
98
Wa
ter-
leve
l ele
vatio
n (
ab
ove
msl
-in
fe
et)
W ell 58-20-102(W ell Depth 603 feet - Surface Elevation 855 feet)
500
550
600
650
700
750
800
19
66
19
68
19
70
19
72
19
74
19
76
19
78
19
80
19
82
19
84
19
86
19
88
19
90
19
92
19
94
19
96
19
98
Wa
ter-
leve
l ele
vatio
n (
ab
ove
msl
-in
fe
et)
W ell 58-35-204(W ell Depth 370 feet - Surface Elevation 792 feet)
500
550
600
650
700
750
800
19
66
19
68
19
70
19
72
19
74
19
76
19
78
19
80
19
82
19
84
19
86
19
88
19
90
19
92
19
94
19
96
19
98
Wa
ter-
leve
l ele
vatio
n (
ab
ove
msl
-in
fe
et)
W ell 58-27-902(W ell Depth 504 feet - Surface Elevation 685 feet)
500
550
600
650
700
750
800
19
66
19
68
19
70
19
72
19
74
19
76
19
78
19
80
19
82
19
84
19
86
19
88
19
90
19
92
19
94
19
96
19
98
Wa
ter-
leve
l ele
vatio
n (
ab
ove
msl
-in
fe
et)
W ell 58-36-402(W ell Depth 610 feet - Surface Elevation 755 feet)
500
550
600
650
700
750
800
19
66
19
68
19
70
19
72
19
74
19
76
19
78
19
80
19
82
19
84
19
86
19
88
19
90
19
92
19
94
19
96
19
98
Wa
ter-
leve
l ele
vatio
n (
ab
ove
msl
-in
fe
et)
W ell 58-28-601(W ell Depth 790 feet - Surface Elevation 640 feet)
400
450
500
550
600
650
700
19
66
19
68
19
70
19
72
19
74
19
76
19
78
19
80
19
82
19
84
19
86
19
88
19
90
19
92
19
94
19
96
19
98
Wa
ter-
leve
l ele
vatio
n (
ab
ove
msl
-in
fe
et)
Figure 3. Water-level hydrographs for selected wells completed in the Edwards aquifer.Note: The eastern boundary of the Edwards aquifer is portrayed using TDS levels >3,000 mg/l.
9
�
Changes in Groundwater Conditions in the Edwards and Trinity Aquifers, 1987-1997,for Portions of Bastrop, Bell, Burnet, Lee, Milam, Travis, and Williamson Counties, TexasNovember 1999
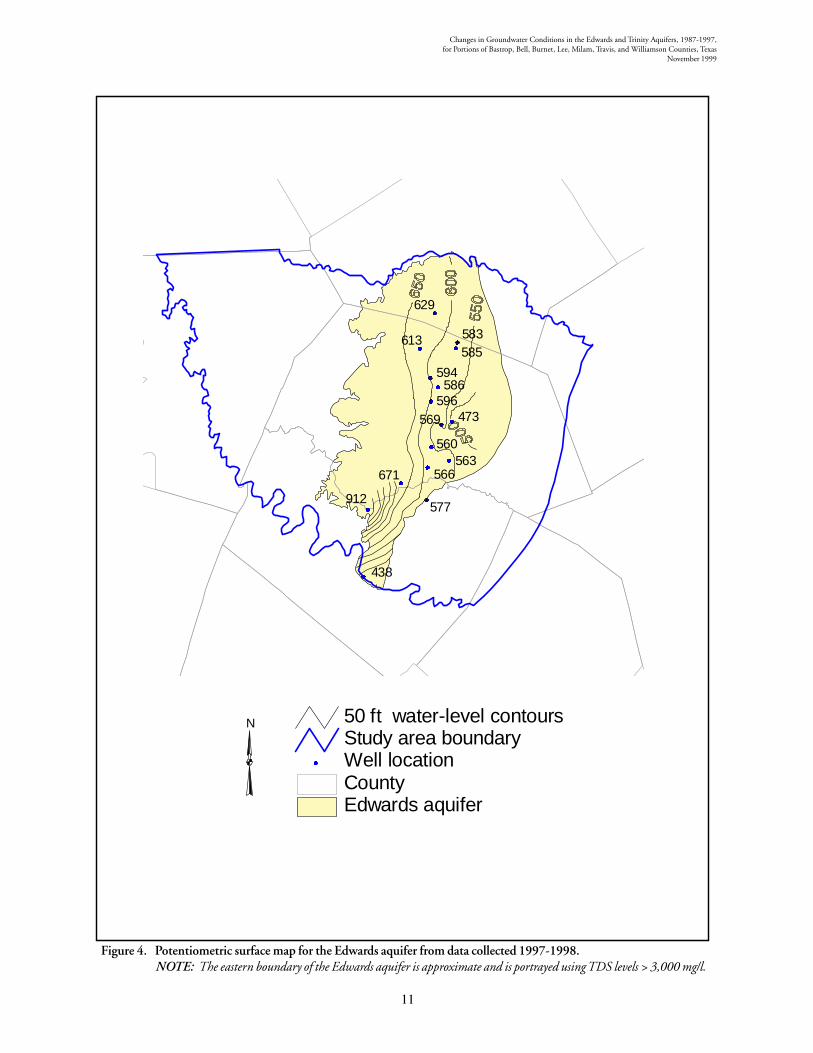
shown by the potentiometric surface in Figure 4. From the north-central part of the City of Austin, a moderate southerly componentdominates as groundwater generally flows toward the Colorado River.
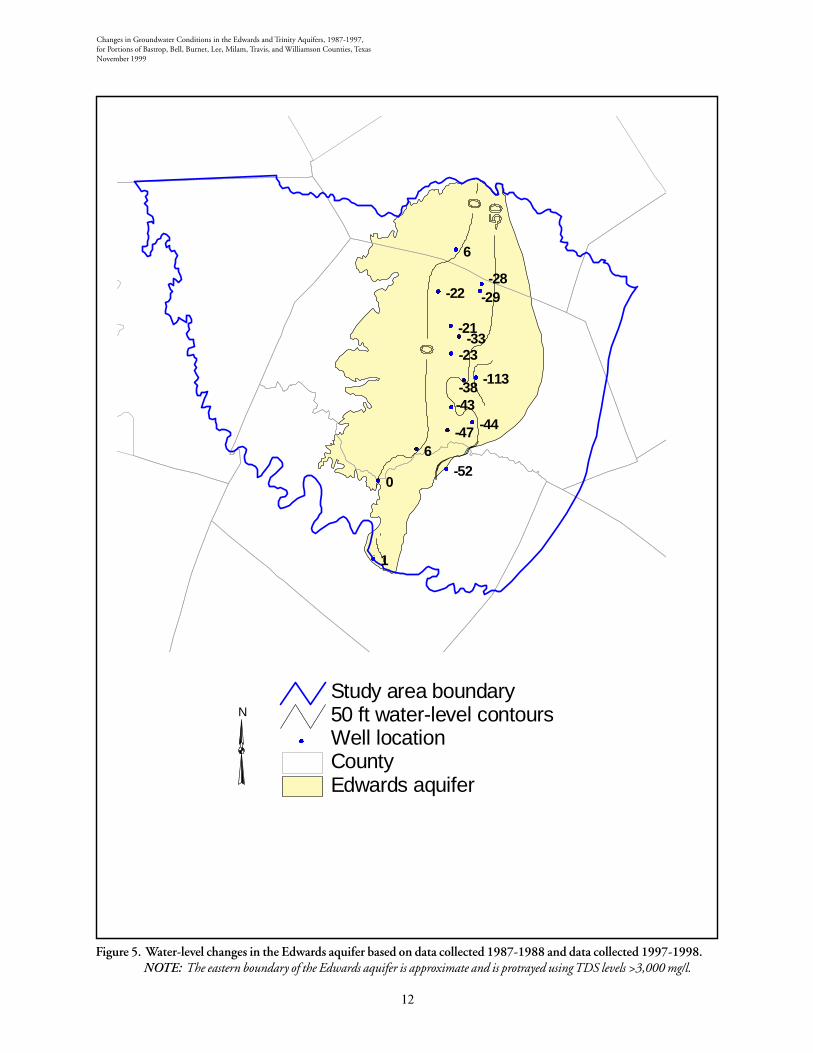
A comparison of water-level elevations from the winter of 1987 to thewinter of 1997 indicates an overall decrease in water levels in the middleto eastern portion of the aquifer (Figure 5). In the late 1980s, waterlevels in wells located in the eastern section were between 665 to 437feet above mean sea level (msl). The average water elevation was 625feet above msl. The same twenty-two wells were re-measured in 1997to 1998 and found to have an average water-level elevation of 595 feetabove msl (an average decrease of 30 feet), with water levels rangingfrom 671 to 437 feet above msl. Limited well control of the two datasets restricted a full interpretation of drawdown along the far easternand western fringe of the study area. Of the wells investigated sincethe initial study was conducted, eleven wells displayed a decrease inwater levels between zero and 50 feet, one well had a water-level decreasemeasuring between 50 and 100 feet, and water levels in another wellfell 113 feet in the past decade (Well 58-20-901).
Trinity Group aquifer
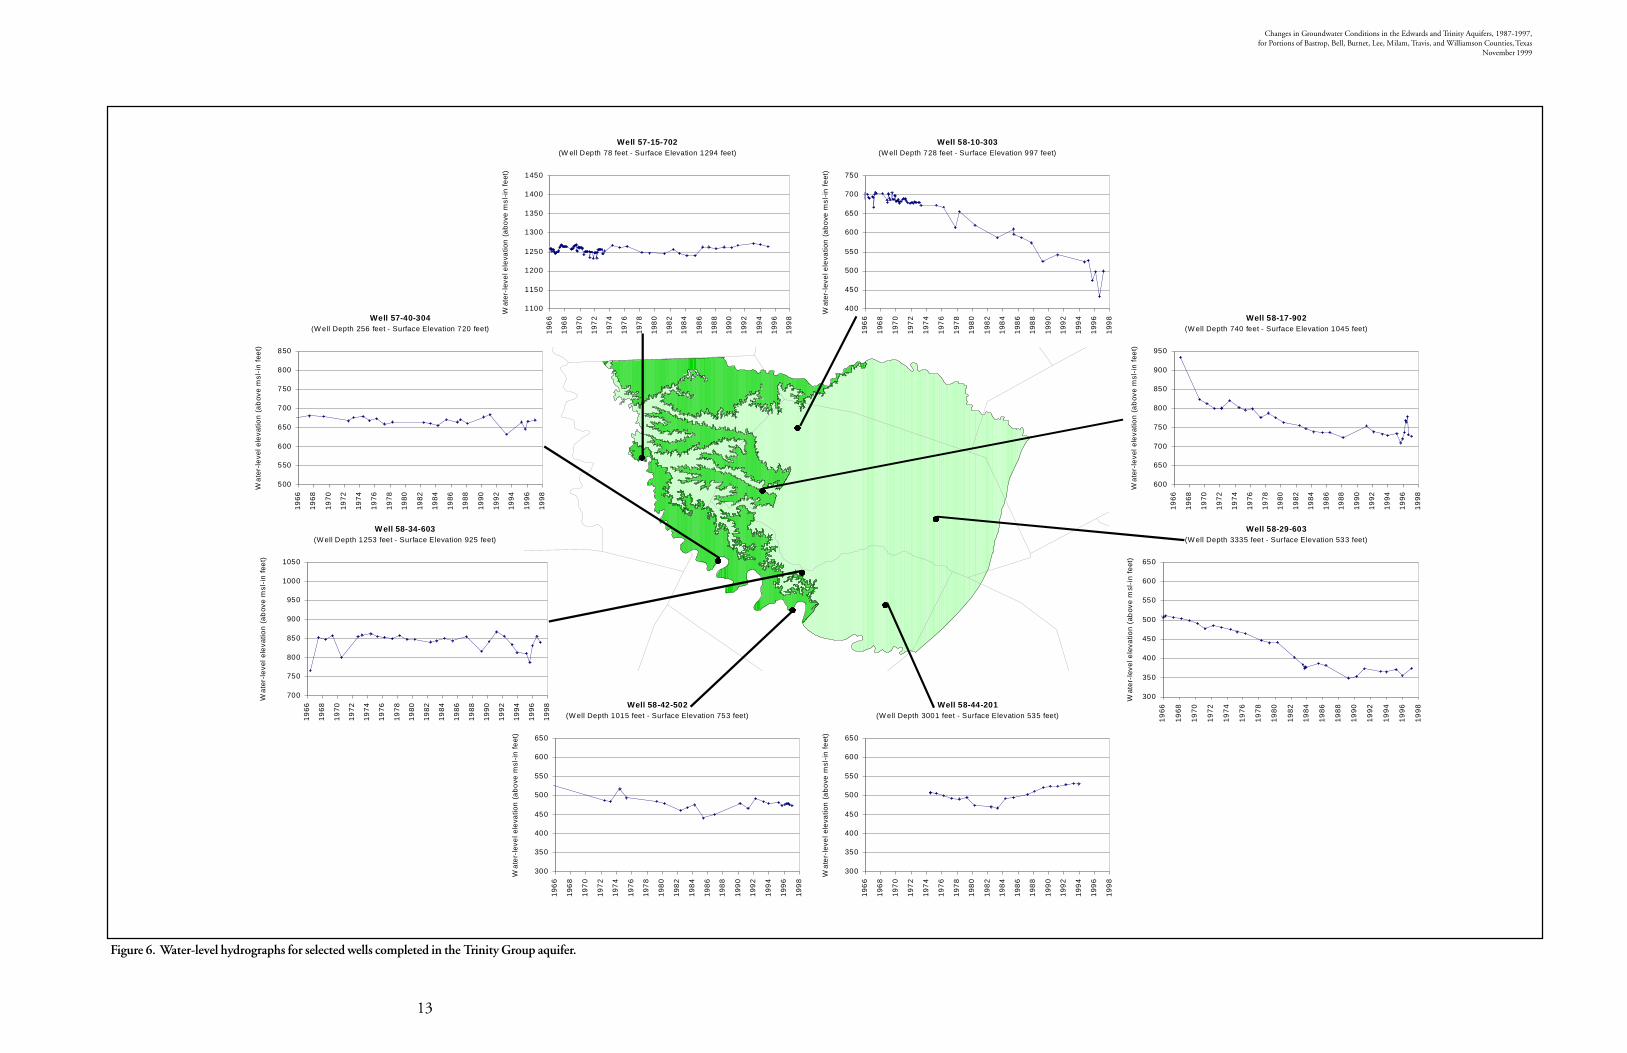
Abrupt changes in water-level elevations were not generally observedin the Trinity Group aquifer (Figure 6). The two main reasons forsignificant drawdown are normally associated with changes in annualrainfall and industrial or public-supply production (Duffin and Musick,1991). In the unconfined recharge zone (shown in Figure 6 as thedarkly shaded area), water levels are primarily influenced byprecipitation and to a lesser degree by public-supply production. Inthe confined portions of the aquifer however, (shown in Figure 6 as thelightly shaded area), drawdown is generally influenced more by public-supply production than by precipitation.
Grouping the wells from Figure 6 by county, the following observationscan be made:
Burnet County
57-15-702 (located near the City of Burnet): Water levels remainedrelatively steady throughout the study period. The waterlevel fluctuated no more than 37 feet between 1966 and1986, and rose approximately 14 feet between 1987 and1997.
Travis County
57-40-304 (located in western Travis County): The water level wasrelatively stable between 1966 and 1986, less than 26feet of water level fluctuations were observed. The waterlevel dropped 50 feet between 1992 and 1994 and
��
Changes in Groundwater Conditions in the Edwards and Trinity Aquifers, 1987-1997,for Portions of Bastrop, Bell, Burnet, Lee, Milam, Travis, and Williamson Counties, Texas
November 1999
Figure 4. Potentiometric surface map for the Edwards aquifer from data collected 1997-1998.NOTE: The eastern boundary of the Edwards aquifer is approximate and is portrayed using TDS levels > 3,000 mg/l.
��
��
��
��
��
��
��
����
��
��
��
��
��
��
��
438
577
671
912
566563
560
473596586
594
585583613
629
569
Edwards aquiferCounty
�� Well locationStudy area boundary50 ft water-level contoursN
��
Changes in Groundwater Conditions in the Edwards and Trinity Aquifers, 1987-1997,for Portions of Bastrop, Bell, Burnet, Lee, Milam, Travis, and Williamson Counties, TexasNovember 1999
Figure 5. Water-level changes in the Edwards aquifer based on data collected 1987-1988 and data collected 1997-1998.NOTE: The eastern boundary of the Edwards aquifer is approximate and is protrayed using TDS levels >3,000 mg/l.
��
��
��
��
��
��
��
����
��
��
��
��
��
��
��
1
-526
0
-47 -44-43
-113-38
-23-33
-21
-29-28
-22
6
Edwards aquiferCounty
�� Well location50 ft water-level contoursStudy area boundary
N
Changes in Groundwater Conditions in the Edwards and Trinity Aquifers, 1987-1997,for Portions of Bastrop, Bell, Burnet, Lee, Milam, Travis, and Williamson Counties, Texas
November 1999
�
�
�
�
�
�
�
�
�
Well 57-15-702(W ell Depth 78 feet - Surface Elevation 1294 feet)
1100
1150
1200
1250
1300
1350
1400
1450
19
66
19
68
19
70
19
72
19
74
19
76
19
78
19
80
19
82
19
84
19
86
19
88
19
90
19
92
19
94
19
96
19
98
Wat
er-
leve
l ele
vatio
n (
ab
ove
msl
-in
feet
)
Well 57-40-304(W ell Depth 256 feet - Surface Elevation 720 feet)
500
550
600
650
700
750
800
850
19
66
19
68
19
70
19
72
19
74
19
76
19
78
19
80
19
82
19
84
19
86
19
88
19
90
19
92
19
94
19
96
19
98
Wa
ter-
leve
l ele
vatio
n (
ab
ove
msl
-in
fee
t)
Well 58-42-502(W ell Depth 1015 feet - Surface Elevation 753 feet)
300
350
400
450
500
550
600
650
19
66
19
68
19
70
19
72
19
74
19
76
19
78
19
80
19
82
19
84
19
86
19
88
19
90
19
92
19
94
19
96
19
98
Wa
ter-
leve
l ele
vatio
n (
ab
ove
msl
-in
feet
)
Well 58-34-603(W ell Depth 1253 feet - Surface Elevation 925 feet)
700
750
800
850
900
950
1000
1050
19
66
19
68
19
70
19
72
19
74
19
76
19
78
19
80
19
82
19
84
19
86
19
88
19
90
19
92
19
94
19
96
19
98
Wa
ter-
leve
l ele
vatio
n (
ab
ove
msl
-in
fee
t)
Well 58-44-201(W ell Depth 3001 feet - Surface Elevation 535 feet)
300
350
400
450
500
550
600
650
19
66
19
68
19
70
19
72
19
74
19
76
19
78
19
80
19
82
19
84
19
86
19
88
19
90
19
92
19
94
19
96
19
98
Wa
ter-
leve
l ele
vatio
n (
ab
ove
msl
-in
feet
)
Well 58-29-603(W ell Depth 3335 feet - Surface Elevation 533 feet)
300
350
400
450
500
550
600
650
19
66
19
68
19
70
19
72
19
74
19
76
19
78
19
80
19
82
19
84
19
86
19
88
19
90
19
92
19
94
19
96
19
98
Wat
er-
leve
l ele
vatio
n (
abov
e m
sl-i
n f
eet
)
Well 58-10-303(W ell Depth 728 feet - Surface Elevation 997 feet)
400
450
500
550
600
650
700
750
19
66
19
68
19
70
19
72
19
74
19
76
19
78
19
80
19
82
19
84
19
86
19
88
19
90
19
92
19
94
19
96
19
98
Wat
er-
leve
l ele
vatio
n (
ab
ove
msl
-in
feet
)
Well 58-17-902(W ell Depth 740 feet - Surface Elevation 1045 feet)
600
650
700
750
800
850
900
950
19
66
19
68
19
70
19
72
19
74
19
76
19
78
19
80
19
82
19
84
19
86
19
88
19
90
19
92
19
94
19
96
19
98
Wa
ter-
leve
l ele
vatio
n (
ab
ove
msl
-in
fee
t)
Figure 6. Water-level hydrographs for selected wells completed in the Trinity Group aquifer.
13
��
Changes in Groundwater Conditions in the Edwards and Trinity Aquifers, 1987-1997,for Portions of Bastrop, Bell, Burnet, Lee, Milam, Travis, and Williamson Counties, TexasNovember 1999
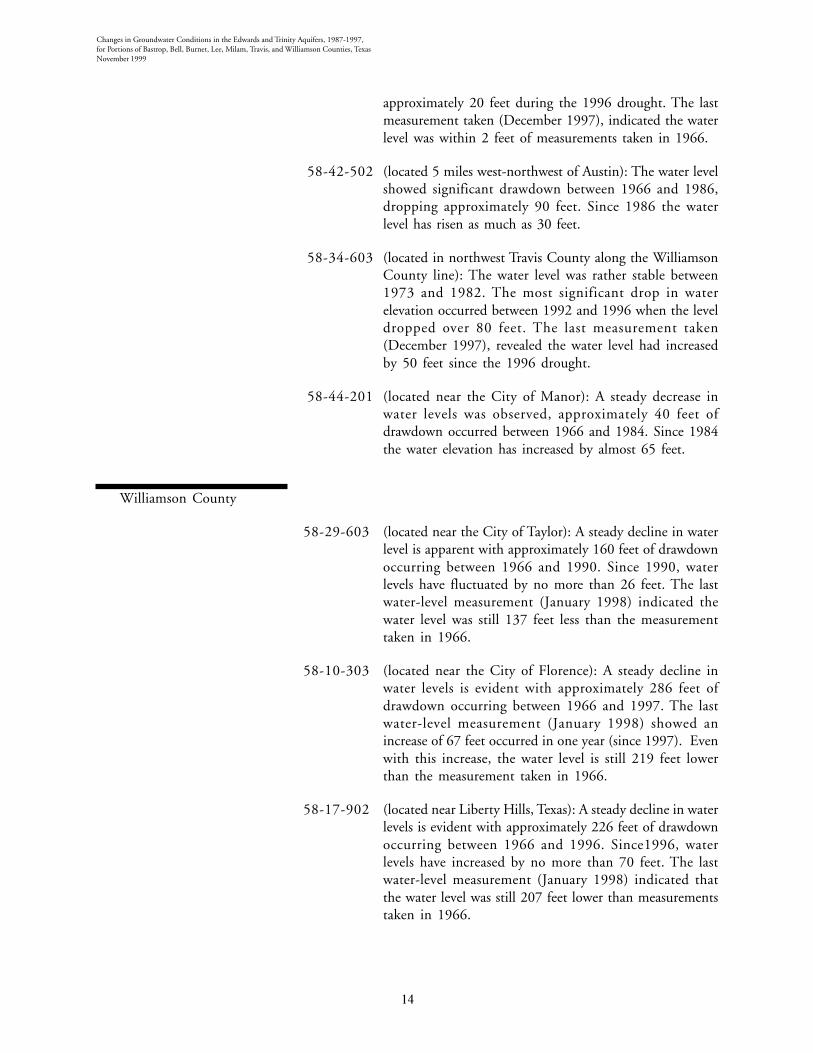
approximately 20 feet during the 1996 drought. The lastmeasurement taken (December 1997), indicated the waterlevel was within 2 feet of measurements taken in 1966.
58-42-502 (located 5 miles west-northwest of Austin): The water levelshowed significant drawdown between 1966 and 1986,dropping approximately 90 feet. Since 1986 the waterlevel has risen as much as 30 feet.
58-34-603 (located in northwest Travis County along the WilliamsonCounty line): The water level was rather stable between1973 and 1982. The most significant drop in waterelevation occurred between 1992 and 1996 when the leveldropped over 80 feet. The last measurement taken(December 1997), revealed the water level had increasedby 50 feet since the 1996 drought.
58-44-201 (located near the City of Manor): A steady decrease inwater levels was observed, approximately 40 feet ofdrawdown occurred between 1966 and 1984. Since 1984the water elevation has increased by almost 65 feet.
Williamson County
58-29-603 (located near the City of Taylor): A steady decline in waterlevel is apparent with approximately 160 feet of drawdownoccurring between 1966 and 1990. Since 1990, waterlevels have fluctuated by no more than 26 feet. The lastwater-level measurement (January 1998) indicated thewater level was still 137 feet less than the measurementtaken in 1966.
58-10-303 (located near the City of Florence): A steady decline inwater levels is evident with approximately 286 feet ofdrawdown occurring between 1966 and 1997. The lastwater-level measurement (January 1998) showed anincrease of 67 feet occurred in one year (since 1997). Evenwith this increase, the water level is still 219 feet lowerthan the measurement taken in 1966.
58-17-902 (located near Liberty Hills, Texas): A steady decline in waterlevels is evident with approximately 226 feet of drawdownoccurring between 1966 and 1996. Since1996, waterlevels have increased by no more than 70 feet. The lastwater-level measurement (January 1998) indicated thatthe water level was still 207 feet lower than measurementstaken in 1966.
��
Changes in Groundwater Conditions in the Edwards and Trinity Aquifers, 1987-1997,for Portions of Bastrop, Bell, Burnet, Lee, Milam, Travis, and Williamson Counties, Texas
November 1999
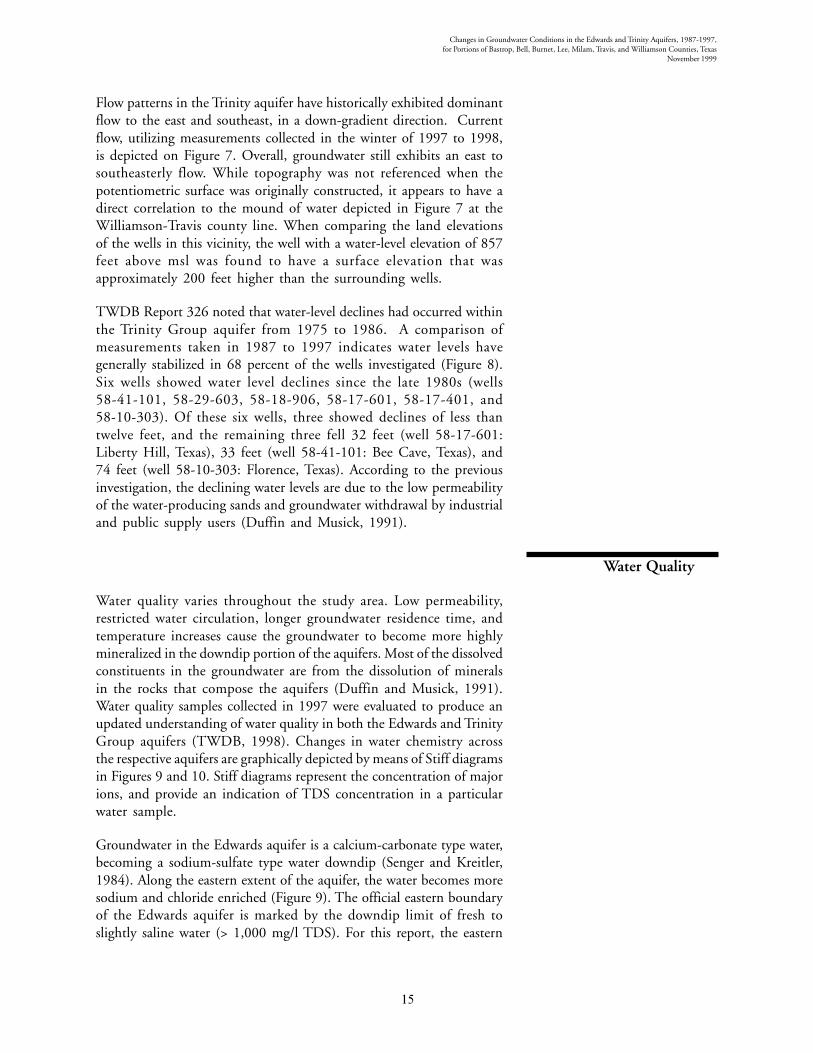
Flow patterns in the Trinity aquifer have historically exhibited dominantflow to the east and southeast, in a down-gradient direction. Currentflow, utilizing measurements collected in the winter of 1997 to 1998,is depicted on Figure 7. Overall, groundwater still exhibits an east tosoutheasterly flow. While topography was not referenced when thepotentiometric surface was originally constructed, it appears to have adirect correlation to the mound of water depicted in Figure 7 at theWilliamson-Travis county line. When comparing the land elevationsof the wells in this vicinity, the well with a water-level elevation of 857feet above msl was found to have a surface elevation that wasapproximately 200 feet higher than the surrounding wells.
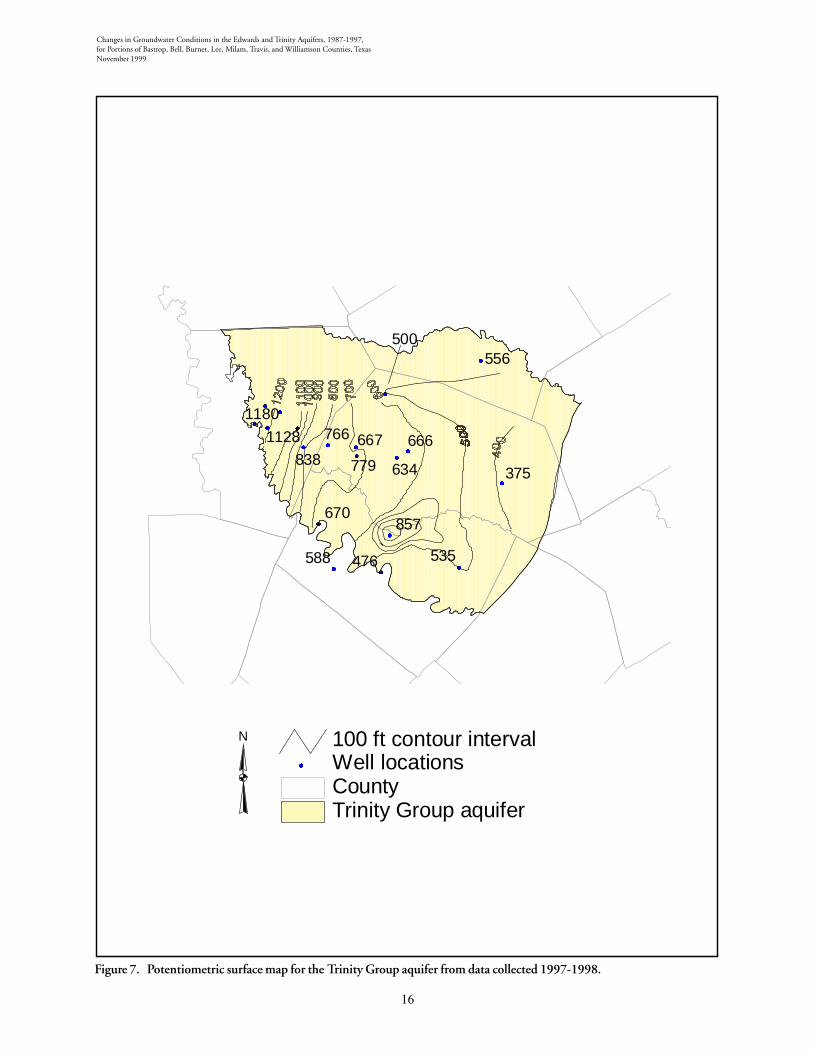
TWDB Report 326 noted that water-level declines had occurred withinthe Trinity Group aquifer from 1975 to 1986. A comparison ofmeasurements taken in 1987 to 1997 indicates water levels havegenerally stabilized in 68 percent of the wells investigated (Figure 8).Six wells showed water level declines since the late 1980s (wells58-41-101, 58-29-603, 58-18-906, 58-17-601, 58-17-401, and58-10-303). Of these six wells, three showed declines of less thantwelve feet, and the remaining three fell 32 feet (well 58-17-601:Liberty Hill, Texas), 33 feet (well 58-41-101: Bee Cave, Texas), and74 feet (well 58-10-303: Florence, Texas). According to the previousinvestigation, the declining water levels are due to the low permeabilityof the water-producing sands and groundwater withdrawal by industrialand public supply users (Duffin and Musick, 1991).
Water Quality
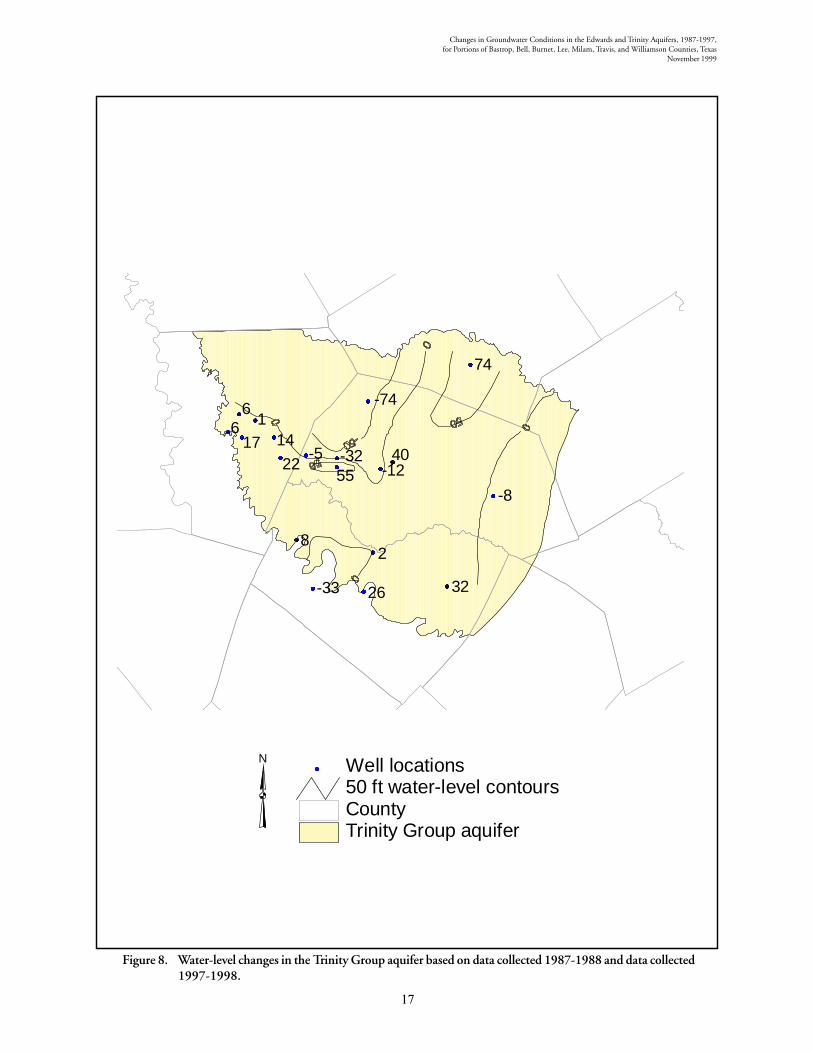
Water quality varies throughout the study area. Low permeability,restricted water circulation, longer groundwater residence time, andtemperature increases cause the groundwater to become more highlymineralized in the downdip portion of the aquifers. Most of the dissolvedconstituents in the groundwater are from the dissolution of mineralsin the rocks that compose the aquifers (Duffin and Musick, 1991).Water quality samples collected in 1997 were evaluated to produce anupdated understanding of water quality in both the Edwards and TrinityGroup aquifers (TWDB, 1998). Changes in water chemistry acrossthe respective aquifers are graphically depicted by means of Stiff diagramsin Figures 9 and 10. Stiff diagrams represent the concentration of majorions, and provide an indication of TDS concentration in a particularwater sample.
Groundwater in the Edwards aquifer is a calcium-carbonate type water,becoming a sodium-sulfate type water downdip (Senger and Kreitler,1984). Along the eastern extent of the aquifer, the water becomes moresodium and chloride enriched (Figure 9). The official eastern boundaryof the Edwards aquifer is marked by the downdip limit of fresh toslightly saline water (> 1,000 mg/l TDS). For this report, the eastern
��
Changes in Groundwater Conditions in the Edwards and Trinity Aquifers, 1987-1997,for Portions of Bastrop, Bell, Burnet, Lee, Milam, Travis, and Williamson Counties, TexasNovember 1999
Figure 7. Potentiometric surface map for the Trinity Group aquifer from data collected 1997-1998.
����
��
��
��
��
����
����
��
��
��
��
������
��
��
535476588
857
375
666
634779
667766
556
670
838
1128
1180
500
Trinity Group aquiferCounty
�� Well locations100 ft contour intervalN
��
Changes in Groundwater Conditions in the Edwards and Trinity Aquifers, 1987-1997,for Portions of Bastrop, Bell, Burnet, Lee, Milam, Travis, and Williamson Counties, Texas
November 1999
Figure 8. Water-level changes in the Trinity Group aquifer based on data collected 1987-1988 and data collected1997-1998.
����
��
��
��
��
����
����
��
��
��
��
������
��
��
3226-33
2
-8
40-1255
-32-5
-74
74
8
22
14176 1
6
Trinity Group aquiferCounty50 ft water-level contours
�� Well locationsN
��
Changes in Groundwater Conditions in the Edwards and Trinity Aquifers, 1987-1997,for Portions of Bastrop, Bell, Burnet, Lee, Milam, Travis, and Williamson Counties, TexasNovember 1999
Figure 9. Water quality from samples collected in 1997 from the Edwards aquifer.Note: The Stiff diagrams usually show the change in water chemistry across the aquifer. Increases in TDS are shown as acolor change (red indicates TDS levels > 1,000 mg/l) and supports the general delineation of the “bad-water” linemarking the official eastern boundary (not shown).
CATIONS ANIONSmeq/l
Na+KCaMg
ClHCO3+CO3SO4
Na+KCaMg
ClHCO3+CO3SO4
Edwards aquiferDowndipOutcrop
Study area boundaryCounty
TDS (Total dissolved solids) mg/l0-10001001 - 2000
N
�
Changes in Groundwater Conditions in the Edwards and Trinity Aquifers, 1987-1997,for Portions of Bastrop, Bell, Burnet, Lee, Milam, Travis, and Williamson Counties, Texas
November 1999
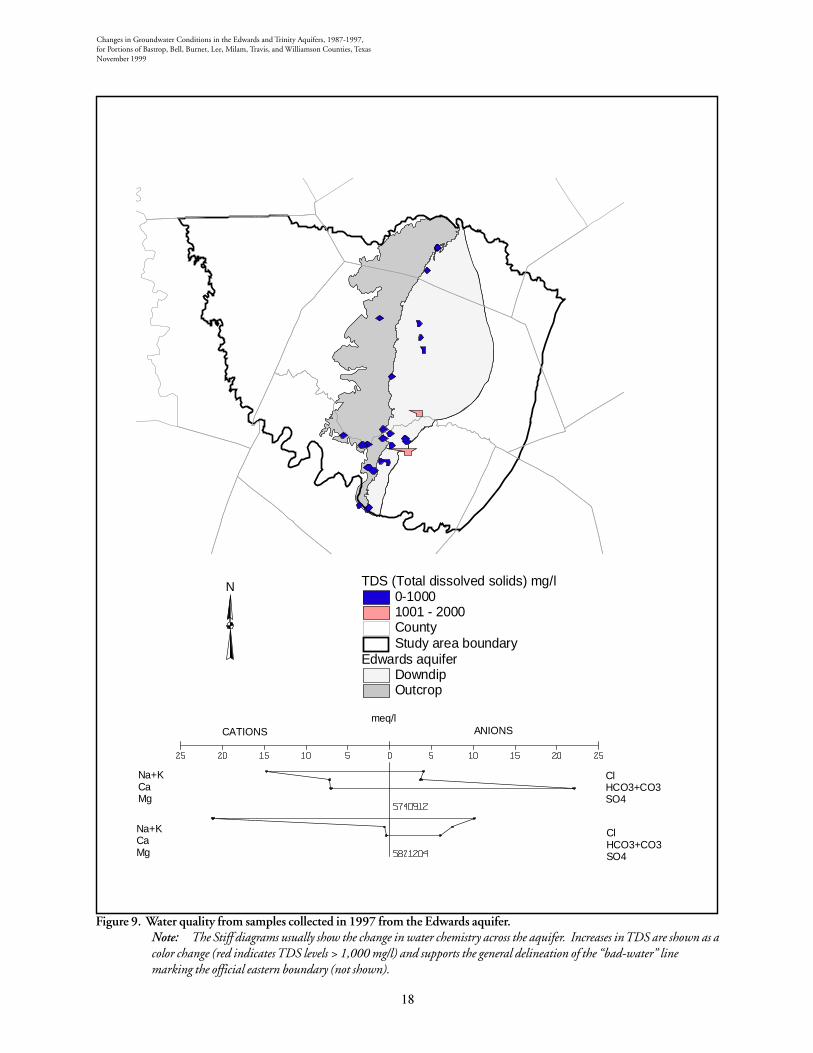
Figure 10. Water quality from samples collected in 1997 from the Trinity Group aquifer.Note: The Stiff diagrams show the change in water chemistry across the aquifer. Increases in TDS are shown as a colorchange and generally increase downdip in an easterly to southeasterly direction.
CATIONS ANIONSmeq/l
Na+KCaMg
ClHCO3+CO3SO4
Na+KCaMg
ClHCO3+CO3SO4
Trinity Group aquiferOutcropDowndip
TDS (Total dissolved solids) mg/l0-10001001 - 2000
CountyN
�
Changes in Groundwater Conditions in the Edwards and Trinity Aquifers, 1987-1997,for Portions of Bastrop, Bell, Burnet, Lee, Milam, Travis, and Williamson Counties, TexasNovember 1999
boundary of the Edwards aquifer was extended to where TDS levelswere greater than 3,000 mg/l, as discussed in TWDB Report 325(Flores, 1990). The red Stiff Diagrams in Figure 9 mark the easternboundary of the Edwards aquifer.
Groundwater in the western portion of the study area, within the TrinityGroup aquifer, is a calcium-magnesium-carbonate type water (Figure10). The water becomes a sodium-sulfate or sodium-chloride type waterdowndip. The quality of water degenerates downdip, to the south andsoutheast, as indicated by the increased levels of TDS (Figure 10).
Additional data and interpretation of the chemical quality of water inthe study area can be found in TWDB Reports 195 (Klempt andothers, 1975), 293 (Baker and others, 1986), and 276 (Brune andDuffin, 1983).
��
Changes in Groundwater Conditions in the Edwards and Trinity Aquifers, 1987-1997,for Portions of Bastrop, Bell, Burnet, Lee, Milam, Travis, and Williamson Counties, Texas
November 1999
POPULATION ANDWATER DEMANDS
Population
The procedure for calculating population within the study area wasupdated using ARCINFO�, a Geographic Information System (GIS)software program (Environmental Systems Research Institute, 1998).In the original report (Duffin and Musick, 1991), census blocks werelaid over maps delineating the study area boundaries and the area andpercentage of population within partial census blocks were hand-calculated. For this report, the 1990 census-block data was downloadedinto ARCINFO� and the program internally calculated area andpopulation percentages for partial census blocks (TWDB, 1998b).
The study area population has increased since the initial study wasconducted in the 1980s (Duffin and Musick, 1991). Table 1 containspopulation figures and projections for the study area from 1985 to theyear 2030. Total population within the study area increased by 151,687residents, or 33 percent, from 1985 to 1995. From 1995 to the year2030, a total estimated population increase of approximately 808,976people, or 133 percent, is projected. Most of the increase is projectedto occur within Williamson County and the northern portion of TravisCounty. Between 1995 and 2030, the population in WilliamsonCounty is expected to increase by 419,267 people, or 252 percent.The area projected to have the second largest growth, northern TravisCounty, is estimated to increase from a population of 416,723 in 1995to a population of 791,306 in 2030. This is approximately a 90 percentincrease. The areas projected to have a smaller population increaseinclude Milam, Lee, and southern Bell counties. Between 1995 and2030, the population in these more rural-type settings is estimated toincrease 14 to 39 percent.
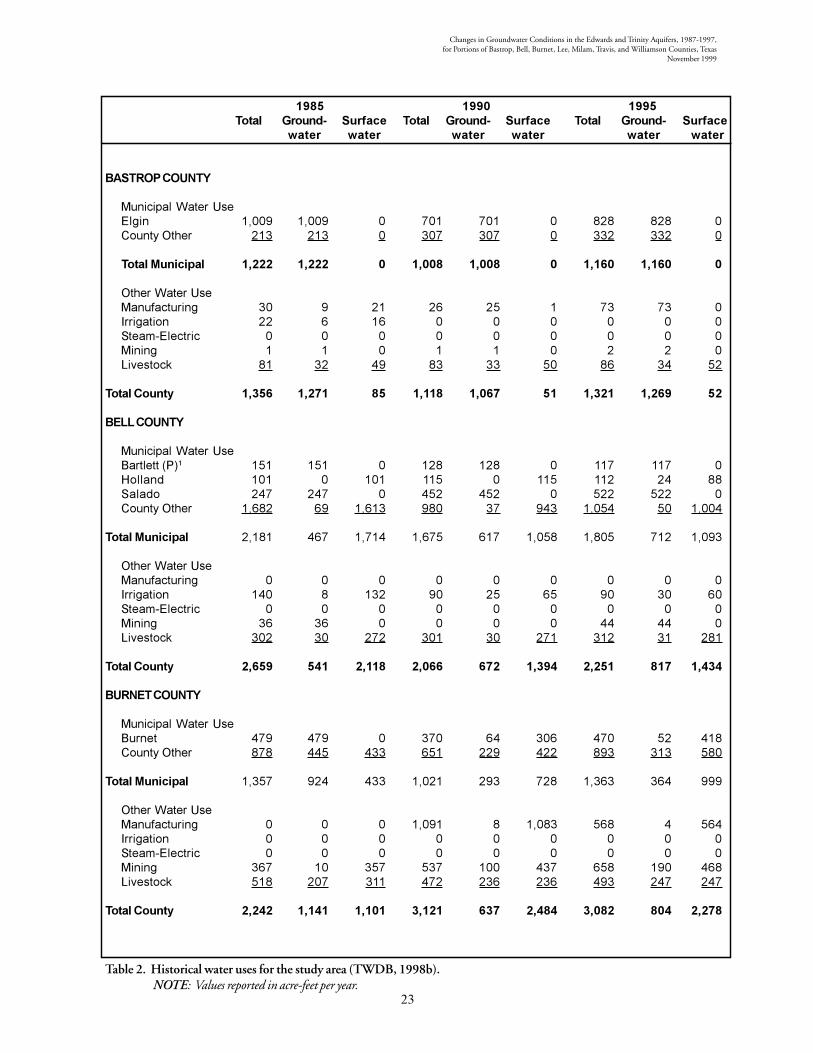
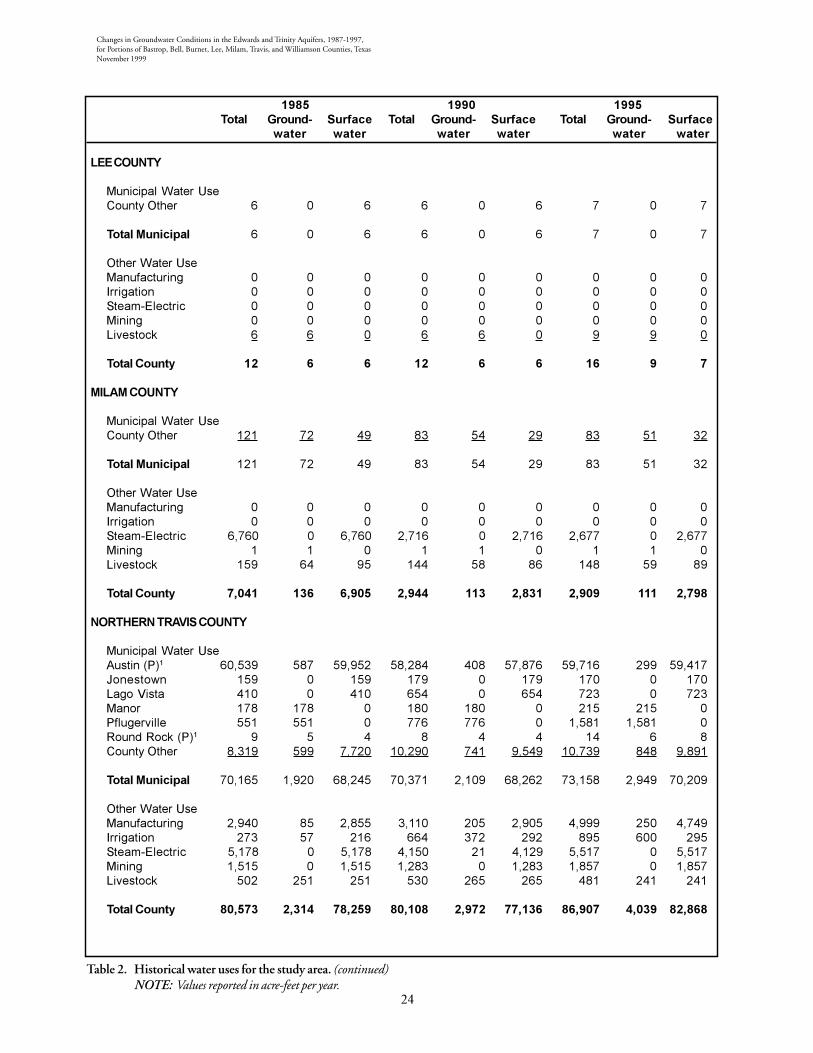
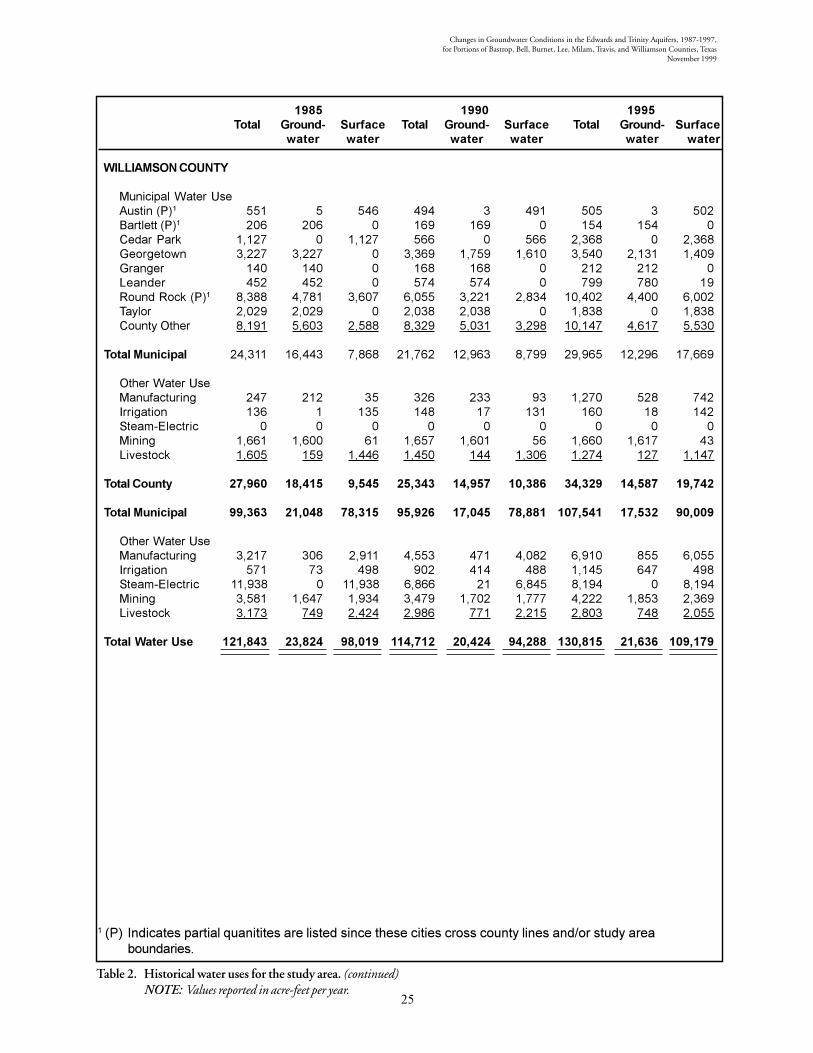
Historical Water Uses
Table 2 shows the historical water use for the partial counties in thestudy area (TWDB, 1998b). In 1995, approximately 130,815 acre-feet of water was used to meet the water demands for the people residingwithin the study area. Of this amount, approximately 83 percent wasderived from surface water (109,179 acre-feet), and the remaining 17percent (21,636 acre-feet) came from various groundwater sources. In1995, the only partial county that used more groundwater than surfacewater was Bastrop County, with groundwater supplying 96 percent ofits water demand. The next major consumer of groundwater in thestudy area was Williamson County; in 1995 groundwater supplied 42percent of its water demand. As was noted in TWDB Report 326,Williamson County is slowly converting to surface water to meet itsgrowing water demands. In 1985, groundwater supplied 66 percent
��
Changes in Groundwater Conditions in the Edwards and Trinity Aquifers, 1987-1997,for Portions of Bastrop, Bell, Burnet, Lee, Milam, Travis, and Williamson Counties, TexasNovember 1999
���� ���� ���� ���� ���� ���� ����
��� ��� �������������� ��� ��� ��� ���� ���� ���� ��� ����������������� ���� �� ��� ��� ��� ���� ��
������ ���� ����� � ����� ����� ����� ����� ����� ������ ������
������ ���������������������� �� �� ��� ��� � � �� �����!�����" ��� �� ���� ��� ���� ��� �� �������#���"� ��� ��� � � � �� � �� �� �� ����������������� �� �� � ��� ���� ����� ���� ���
������ ���� ����� � ����� ����� ����� ����� ������ ������ ������
�������� ��������������� �� � �� �� �� �� �� � �� �������������������� ���� ���� ���� �� �� ���� ����� ����
������ ���� ����� � ����� ����� ����� ����� ������ ������ ������
����� ��������������������� �� � � �
������ ���� ����� � �� �� �� �� �� �� ��
������ ��������������������� ��� ��� ��� � � ��� ��
������ ���� ����� � ��� ��� ��� ��� ��� ��� ���
�� ��� ����������$�%�������� ������� ���� �� ���� ��� � �� ������� �����������&���%��'� � ��� � �� ��� �� �� � � �� �����(����)�%�� � �� ���� �� � ��� ���� ���� ��� ������*���� � � � ��� �� ���� ��� � ���� ������+�����,���� � �� � ��� � ���� ��� �� ��� �����-���"�-�./����� � �� � � �� �������������������� ���� ���� � �� � ������ ��� ����� � ���
� ���� ����� � ������� ������� ������� ������� ������� ������� �������
!����� ��� ���������$�%�������� �� �� ����� ���� ���� ����� ��� ������������������� � � �� � � �� �� �� �������"������/ ����� ��� ����� ����� ����� ����� ��� ������0�������'� ���� ��� ��� � ���� ���� ���� �����������0������ ��� �� � � ��� �� � ���� � ������(���"�� �� � � �� ���� ����� ��� ��� � �� �������-���"�-�./����� ���� ��� ���� � � � �� �� ����� � � �����1����� � � ��� � � �� �� ��� �� ���� ���������������������� ���� ����� ��� ����� ���� ���� ������
������ ���� ����� � ������� ������� ������� ������� ������� ������� �������
� ��� "�#����$ ������� ������� ������� ������� ������� ��������� ���������
�������������2�2��������+�����%�������,���+���$�%�����������������"�-���"�-�./�3�.��%��������.������4��%�����%.��".������3���"����%���"5���%��"�������3���"����%6Table 1. Historical and projected population figures for the study area, based on 1990 census data (TWDB, 1998b).
��
Changes in Groundwater Conditions in the Edwards and Trinity Aquifers, 1987-1997,for Portions of Bastrop, Bell, Burnet, Lee, Milam, Travis, and Williamson Counties, Texas
November 1999
���� ���� ����� �� %� ��&' (��")� � �� %� ��&' (��")� � �� %� ��&' (��")�
*��� *��� *��� *��� *��� *���
�#(�+,���,-.�/
*���.�2���7�����8%������ � � � � � � ��� ��� ������������ � � � � � �
� �������)��� ����� ����� � ����� ����� � ����� ����� �
������7�����8%�*���+�.������ � � �� �� � � 9��������� �� � � #���4:���.���. *����� � � (�,�%��./ � � � � � �� ��
� ���� ���� ����� ����� �� ����� ����� �� ����� ����� ��
�0����,-.�/
*���.�2���7�����8%�������������� � � �� �� � � !�����" � � � � ��#���"� �� �� �� �� ��� ��� ������������ ���� �� �� �� � � � � � �
� �������)��� ��� �� �� ���� �� � �� �� � �� � �
������7�����8%�*���+�.������ 9��������� � � � �� �� � � #���4:���.���. *����� � � (�,�%��./ � ��� �� � ��
� ���� ���� ����� ��� ����� ����� ��� ����� ����� ��� �����
�-+.0���,-.�/
*���.�2���7�����8%������� �� �� � � � � �� ������������� ��� � �� ��� �� �� ��
� �������)��� � �� �� � � �� ��� � � � ���
������7�����8%�*���+�.������ � � � � � ��� ��9��������� #���4:���.���. *����� �� �� � � � ��� � ��(�,�%��./ �� � � �� � � � � � �� ��
� ���� ���� ����� ����� ����� ����� ��� ����� ����� ��� �����
Table 2. Historical water uses for the study area (TWDB, 1998b).NOTE: Values reported in acre-feet per year.
��
Changes in Groundwater Conditions in the Edwards and Trinity Aquifers, 1987-1997,for Portions of Bastrop, Bell, Burnet, Lee, Milam, Travis, and Williamson Counties, TexasNovember 1999
���� ���� ����� �� %� ��&' (��")� � �� %� ��&' (��")� � �� %� ��&' (��")�
*��� *��� *��� *��� *��� *���
�00��,-.�/
*���.�2���7�����8%������������� � � � � � �
� �������)��� � � � � � �
������7�����8%�*���+�.������ 9��������� #���4:���.���. *����� (�,�%��./ � � � � � �
� ���� ���� �� � � �� � � �� � �
�1�#���,-.�/
*���.�2���7�����8%������������� � �� � � � �� � � �
� �������)��� � �� � � � �� � � �
������7�����8%�*���+�.������ 9��������� #���4:���.���. ���� ���� ���� ���� ����� �����*����� (�,�%��./ �� � �� �� �� � �� ��
� ���� ���� ����� ��� ����� ����� ��� ����� ����� ��� �����
.,+�20+.��+#31(��,-.�/
*���.�2���7�����8%�$�%�������� � �� � ��� ������ ����� � ������ ����� ��� ����&���%��'� �� �� �� �� � � (����)�%�� �� �� �� �� *���� �� �� � � �� �� �+�����,���� �� �� ��� ��� ��� ��� -���"�-�./����� � � � � ������������� �� � ��� ���� ��� � ���� �� � �� ����
� �������)��� � ��� ��� ����� � � � �� � ������ � ��� ���� � �� �
������7�����8%�*���+�.������ ��� �� ����� � � � ��� � ���� �� ���9��������� �� �� �� �� �� ��� ��� � ���#���4:���.���. ���� ���� �� � ��� ���� ����*����� ��� ��� ��� ��� ���� ����(�,�%��./ � � �� �� � ��� ��� � � �
� ���� ���� ������ ����� ������ ������ ����� ������ ������ ����� ������
Table 2. Historical water uses for the study area. (continued)NOTE: Values reported in acre-feet per year.
��
Changes in Groundwater Conditions in the Edwards and Trinity Aquifers, 1987-1997,for Portions of Bastrop, Bell, Burnet, Lee, Milam, Travis, and Williamson Counties, Texas
November 1999
���� ���� ����� �� %� ��&' (��")� � �� %� ��&' (��")� � �� %� ��&' (��")�
*��� *��� *��� *��� *��� *���
!1��1#�(,.��,-.�/
*���.�2���7�����8%�$�%�������� �� � �� � � � � � �������������� � � � � �� �� � � ��"������/ ��� ��� ��� ��� �� �� �� ��0�������'� ���� ���� � �� ���� �� �� �� � �0������ �� �� �� �� (���"�� �� �� �� �� ��� �� �-���"�-�./����� �� �� ��� �� � �� �� ��� ��� � � � �� �1����� �� �� �� �� �� � �� � �� � �� ������������� ��� ��� ����� �� �� �� ���� �� ��� ���
� �������)��� �� �� ����� ����� ���� ����� ������ ����� �����
������7�����8%�*���+�.������ �� �� � �� � � ��� ��� ��9��������� � � � � � � �#���4:���.���. *����� ��� �� � ���� �� �� ��� ��� (�,�%��./ �� � �� �� �� � � ��� �� ��
� ���� ���� ������ ������ ����� ������ ������ ������ ������ ������ ������
� �������)��� ������ ������ ������ ������ ������ ������ ������� ������ ������
������7�����8%�*���+�.������ ��� � ��� ��� � � �� ��� ��� �� ��9��������� �� � �� � � �� �� �� ��#���4:���.���. �� � �� � ����� � ���� ��� ���*����� ��� ��� �� ��� �� � ���� ���� ��� �� ��(�,�%��./ �� �� ��� ����� �� ���� ��� �� �� ��
� ���!����-� ������� ������ ������ ������� ������ ������ ������� ������ �������
Table 2. Historical water uses for the study area. (continued)NOTE: Values reported in acre-feet per year.
������ ������ ��������������� ������ ���� ������� ������ ��� ����������� ������� ��������������� �
��
Changes in Groundwater Conditions in the Edwards and Trinity Aquifers, 1987-1997,for Portions of Bastrop, Bell, Burnet, Lee, Milam, Travis, and Williamson Counties, TexasNovember 1999
of Williamson County’s water demand, compared to 59 percent in1990 and 42 percent in 1995 (see Table 2 for details).
For comparison, Table 3 shows the total amount of groundwater pumpedin Williamson County. More importantly, this table includesgroundwater pumped in Williamson County and used both inWilliamson County and elsewhere. In 1985, Williamson Countypumped a total of 18,182 acre-feet of groundwater. Six years later (arelatively “wet” year), Williamson County pumped 15,883 acre-feet ofgroundwater. However, in 1996 (during a relatively “dry” year), a totalof 19,226 acre-feet of groundwater was pumped. Basically, populationin the study area shows a steady increase, while per capita groundwaterusage appears to be declining. However, historical trends suggest thatduring periods of drought, dependency upon groundwater increases.
Projected Water Demands
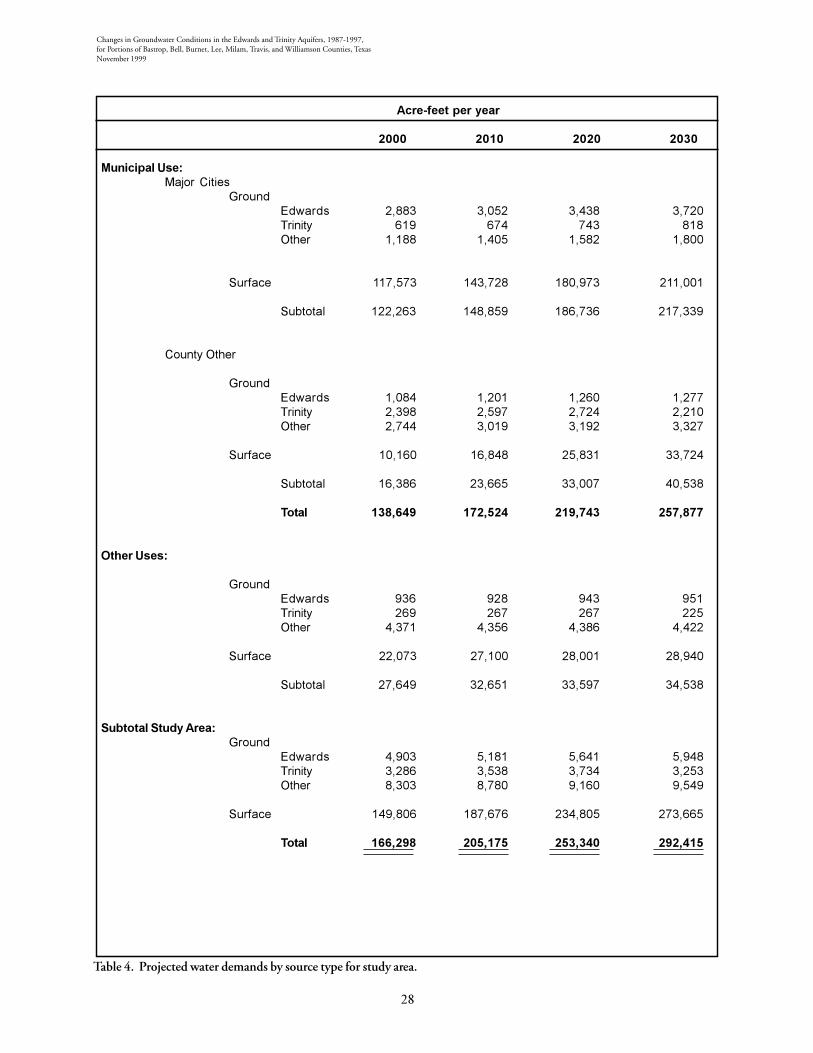
Table 4 shows the projected water demands and groundwater supplysources by “major city” and “county other” for municipal use, and otheruses, which includes manufacturing, steam-electric generation, mining,irrigation, and livestock. The numbers provided were based on estimatesdeveloped by the TWDB and include information that was used todevelop the 1997 State Water Plan (TWDB, 1997).
Allocation of available or new water supplies for future water use wasdetermined by analysis of data provided by TWDB’s water supplyallocation model MADNESS (TWDB, 1998c). The allocation modelfirst uses measures that are cost effective and have limited impact onthe environment. If for any reason this approach cannot be used, wateruse and supply management measures that are more costly, controversial,or environmentally sensitive are considered. By incorporating waterconservation procedures and savings, efficient use of all existing waterresources is first explored before pursuing new water supply sources.Alternative water supply measures include but are not limited to: inter-basin transfers, new reservoir development or expansion of existingreservoirs, importing water from nearby under-utilized reservoirs oraquifers, reuse of water for non-municipal demands, and aquifer storageand recovery (TWDB,1998c).
Under projected conditions, the total annual water requirement for thestudy area is expected to increase 76 percent from the year 2000 to theyear 2030. In 2030, the projected water demand is estimated to be292,415 acre-feet per year. Total groundwater use is projected toincrease by 14 percent from the year 2000 to the year 2030. Bycomparison, water supplied from surface water sources is projected toincrease by 83 percent for the same time period. By the year 2030, it isprojected that 94 percent of the total demand will be furnished bysurface water.

��
Changes in Groundwater Conditions in the Edwards and Trinity Aquifers, 1987-1997,for Portions of Bastrop, Bell, Burnet, Lee, Milam, Travis, and Williamson Counties, Texas
November 1999
���� ���� ���� ���� ���� ���� ���� ���� ���� ���� ���� ���� ����
%� ��&*���
������� ��� ��� � � �� ����� ���� ����� ���� ����� ����� ��� � ���� � ��� �����
������������� ��� ���� ���� ���� ��� �� ��� �� �� ��� ���� ���� ���
����� �� �� �� �� �� ��� ��� �� �� ��� �� ��� � �
��������� � �� � � ���� ������ ������ ������ ������ ��� � ������ ������ � ���� ������ ������ ������
������������� ����� ����� ����� ����� ����� ����� ����� ����� ����� ����� ����� ����� �����
������� �������������� ��� �� ������ ������ ������ ������ ���� ����� ����� ��� �� ������ ������ ��� � ������
� �%��4���"��,����3���%�22���2������������������������� ��"'��"%��;��+���:� ������.��:+���5�������"�1�������0���2��;��+���:��������.��:+���5�����6
Table 3. Historical groundwater pumpage in Williamson County (TWDB, 1998b).
��
Changes in Groundwater Conditions in the Edwards and Trinity Aquifers, 1987-1997,for Portions of Bastrop, Bell, Burnet, Lee, Milam, Travis, and Williamson Counties, TexasNovember 1999
Table 4. Projected water demands by source type for study area.
#)��'"�����������
���� ���� ���� ����
����)����-�$*�<��������%
0����"�"'��"% ���� � �� � � ��� 1������ �� �� � ������� ��� � � ���� ��
#��+�.� ���� ���� � ��� ��
#�3����� ����� ����� ���� � ��� �
������������
0����"�"'��"% � � �� ��� ����1������ �� �� ����� ���� ��� ����� ��� � � ��� � ��
#��+�.� �� ���� ���� ���
#�3����� �� �� � ���� � � �� �
� �� ������� ������� ������� �������
,�4���-�$
0����"�"'��"% � � ��� � ��1������ ��� ��� ��� �������� � � � �� � �� ���
#��+�.� ��� � ��� ��� ����
#�3����� ����� ���� ���� �� �
(�5� ���(��&��#��$0����"
�"'��"% �� ��� ��� ����1������ ���� �� � �� ��� ����� �� ���� ��� ����
#��+�.� ��� � ������ � �� � �� ����
� �� ������� ������� ������� �������
�
Changes in Groundwater Conditions in the Edwards and Trinity Aquifers, 1987-1997,for Portions of Bastrop, Bell, Burnet, Lee, Milam, Travis, and Williamson Counties, Texas
November 1999
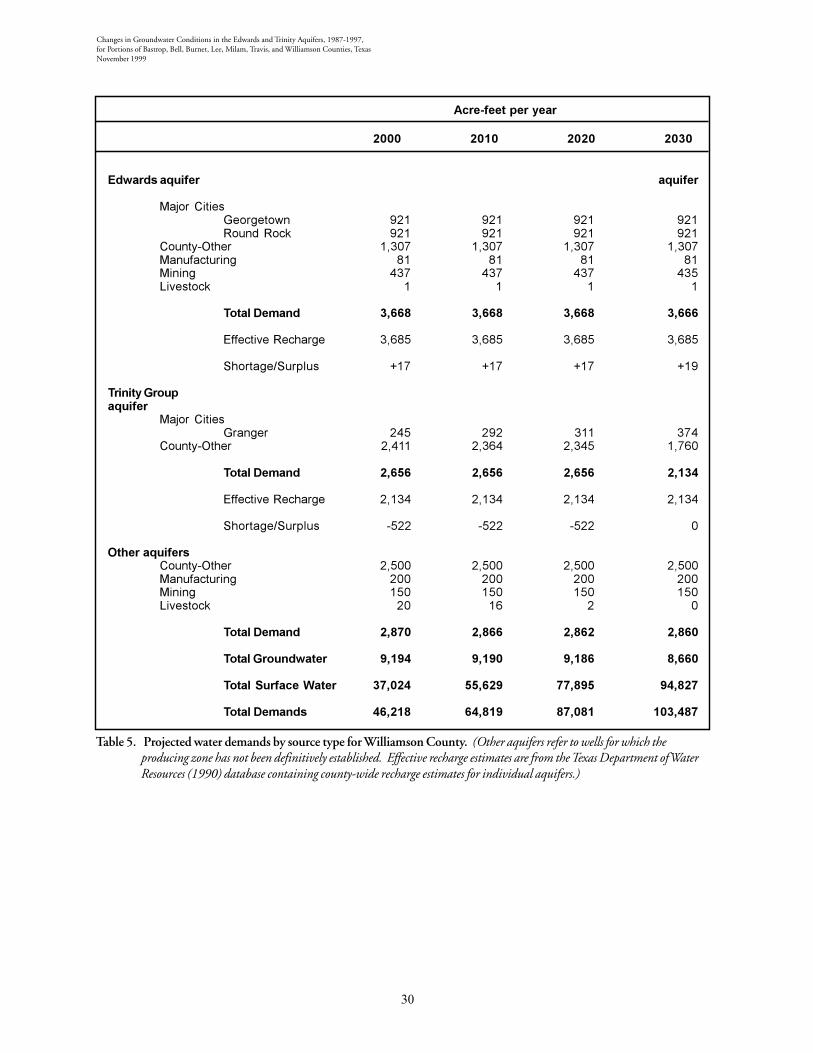
Table 5 shows the projected water demands and groundwater supplysources for Williamson County (TWDB, 1997). Due to estimatedlimitations on the local groundwater supply sources, projected usefrom both the Edwards and Trinity Group aquifers is expected to decreaseby 6 percent between 2000 and 2030. Meanwhile, projected demandsbeing met by surface water are expected to increase by 156 percent.Overall, the projected annual water requirement for Williamson Countyis expected to increase 124 percent from the year 2000 to the year2030.
�
Changes in Groundwater Conditions in the Edwards and Trinity Aquifers, 1987-1997,for Portions of Bastrop, Bell, Burnet, Lee, Milam, Travis, and Williamson Counties, TexasNovember 1999
Table 5. Projected water demands by source type for Williamson County. (Other aquifers refer to wells for which theproducing zone has not been definitively established. Effective recharge estimates are from the Texas Department of WaterResources (1990) database containing county-wide recharge estimates for individual aquifers.)
#)��'"�����������
���� ���� ���� ����
0&*�& 6��"�� 6��"��
*�<��������%0�������'� �� �� �� ��-���"�-�./ �� �� �� ��
������:����� � � � � � � � �*���+�.������ � � � �*����� � � � �(�,�%��./
� ���7���& ����� ����� ����� �����
�++�.��,��-�.����� ���� ���� ���� ����
#�������5#��2��% =� =� =� =�
��������%� ��6��"��
*�<��������%0������ �� ��� �
������:����� �� �� � �� � ���
� ���7���& ����� ����� ����� �����
�++�.��,��-�.����� �� �� �� ��
#�������5#��2��% :��� :��� :���
,�4���6��"��������:����� ��� ��� ��� ��� *���+�.������ � � � � *����� � � � � (�,�%��./ � � �
� ���7���& ����� ����� ����� �����
� ���%� ��&*��� ����� ����� ����� �����
� ���(��")��!��� ������ ������ ������ ������
� ���7���& ������ ������ ������ �������
��
Changes in Groundwater Conditions in the Edwards and Trinity Aquifers, 1987-1997,for Portions of Bastrop, Bell, Burnet, Lee, Milam, Travis, and Williamson Counties, Texas
November 1999
WATER AVAILABILITY
Groundwater Availability
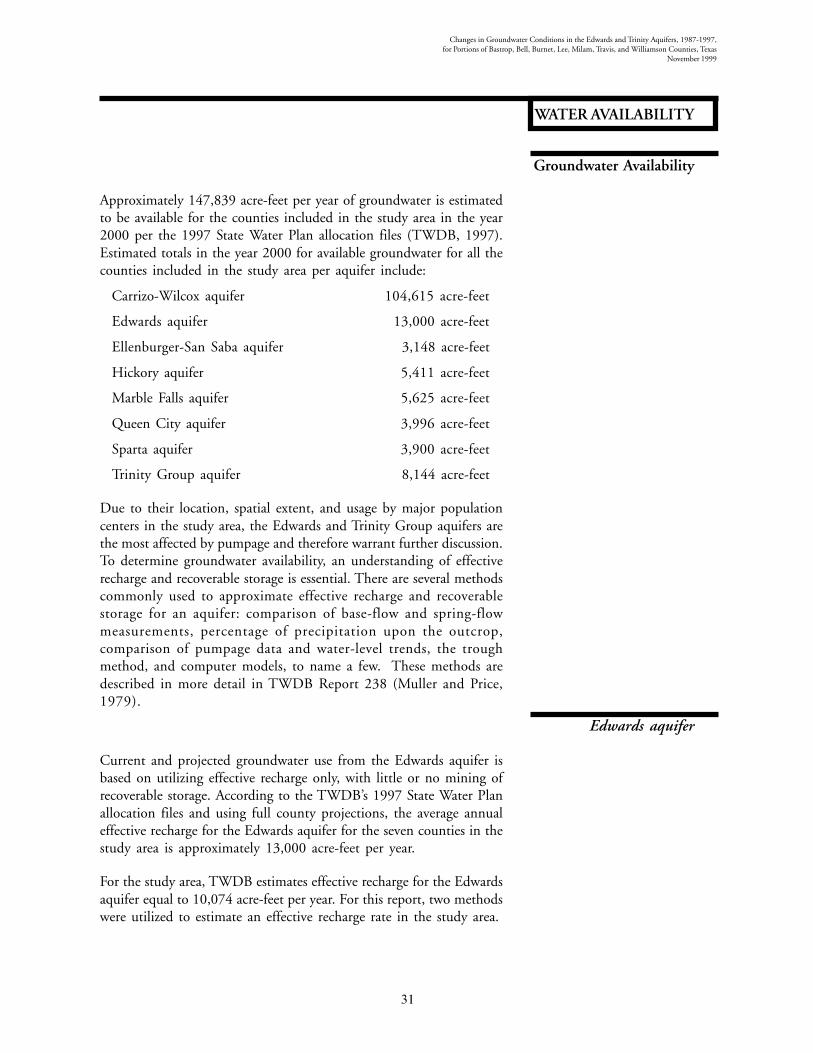
Approximately 147,839 acre-feet per year of groundwater is estimatedto be available for the counties included in the study area in the year2000 per the 1997 State Water Plan allocation files (TWDB, 1997).Estimated totals in the year 2000 for available groundwater for all thecounties included in the study area per aquifer include:
Carrizo-Wilcox aquifer 104,615 acre-feet
Edwards aquifer 13,000 acre-feet
Ellenburger-San Saba aquifer 3,148 acre-feet
Hickory aquifer 5,411 acre-feet
Marble Falls aquifer 5,625 acre-feet
Queen City aquifer 3,996 acre-feet
Sparta aquifer 3,900 acre-feet
Trinity Group aquifer 8,144 acre-feet
Due to their location, spatial extent, and usage by major populationcenters in the study area, the Edwards and Trinity Group aquifers arethe most affected by pumpage and therefore warrant further discussion.To determine groundwater availability, an understanding of effectiverecharge and recoverable storage is essential. There are several methodscommonly used to approximate effective recharge and recoverablestorage for an aquifer: comparison of base-flow and spring-flowmeasurements, percentage of precipitation upon the outcrop,comparison of pumpage data and water-level trends, the troughmethod, and computer models, to name a few. These methods aredescribed in more detail in TWDB Report 238 (Muller and Price,1979).
Edwards aquifer
Current and projected groundwater use from the Edwards aquifer isbased on utilizing effective recharge only, with little or no mining ofrecoverable storage. According to the TWDB’s 1997 State Water Planallocation files and using full county projections, the average annualeffective recharge for the Edwards aquifer for the seven counties in thestudy area is approximately 13,000 acre-feet per year.
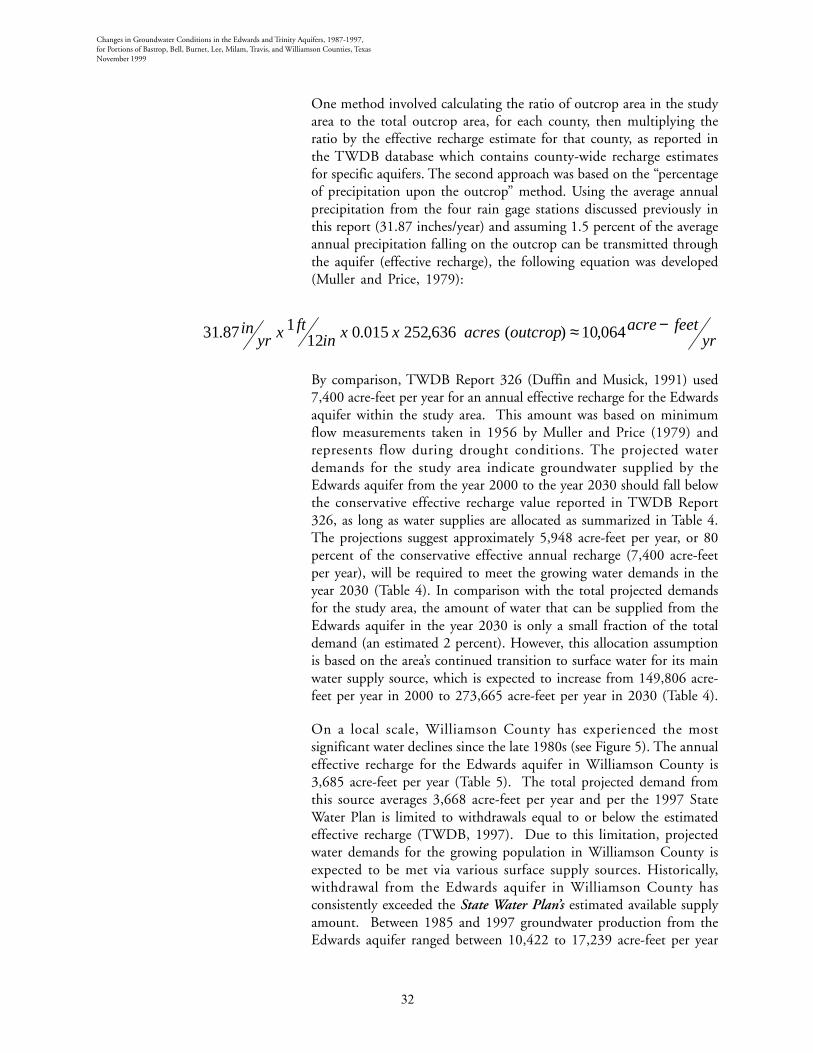
For the study area, TWDB estimates effective recharge for the Edwardsaquifer equal to 10,074 acre-feet per year. For this report, two methodswere utilized to estimate an effective recharge rate in the study area.
��
Changes in Groundwater Conditions in the Edwards and Trinity Aquifers, 1987-1997,for Portions of Bastrop, Bell, Burnet, Lee, Milam, Travis, and Williamson Counties, TexasNovember 1999
One method involved calculating the ratio of outcrop area in the studyarea to the total outcrop area, for each county, then multiplying theratio by the effective recharge estimate for that county, as reported inthe TWDB database which contains county-wide recharge estimatesfor specific aquifers. The second approach was based on the “percentageof precipitation upon the outcrop” method. Using the average annualprecipitation from the four rain gage stations discussed previously inthis report (31.87 inches/year) and assuming 1.5 percent of the averageannual precipitation falling on the outcrop can be transmitted throughthe aquifer (effective recharge), the following equation was developed(Muller and Price, 1979):
By comparison, TWDB Report 326 (Duffin and Musick, 1991) used7,400 acre-feet per year for an annual effective recharge for the Edwardsaquifer within the study area. This amount was based on minimumflow measurements taken in 1956 by Muller and Price (1979) andrepresents flow during drought conditions. The projected waterdemands for the study area indicate groundwater supplied by theEdwards aquifer from the year 2000 to the year 2030 should fall belowthe conservative effective recharge value reported in TWDB Report326, as long as water supplies are allocated as summarized in Table 4.The projections suggest approximately 5,948 acre-feet per year, or 80percent of the conservative effective annual recharge (7,400 acre-feetper year), will be required to meet the growing water demands in theyear 2030 (Table 4). In comparison with the total projected demandsfor the study area, the amount of water that can be supplied from theEdwards aquifer in the year 2030 is only a small fraction of the totaldemand (an estimated 2 percent). However, this allocation assumptionis based on the area’s continued transition to surface water for its mainwater supply source, which is expected to increase from 149,806 acre-feet per year in 2000 to 273,665 acre-feet per year in 2030 (Table 4).
On a local scale, Williamson County has experienced the mostsignificant water declines since the late 1980s (see Figure 5). The annualeffective recharge for the Edwards aquifer in Williamson County is3,685 acre-feet per year (Table 5). The total projected demand fromthis source averages 3,668 acre-feet per year and per the 1997 StateWater Plan is limited to withdrawals equal to or below the estimatedeffective recharge (TWDB, 1997). Due to this limitation, projectedwater demands for the growing population in Williamson County isexpected to be met via various surface supply sources. Historically,withdrawal from the Edwards aquifer in Williamson County hasconsistently exceeded the State Water Plan’s estimated available supplyamount. Between 1985 and 1997 groundwater production from theEdwards aquifer ranged between 10,422 to 17,239 acre-feet per year
yrfeetacreoutcropacresxxin
ftxyrin −≈ 064,10)(636,252015.012
187.31
��
Changes in Groundwater Conditions in the Edwards and Trinity Aquifers, 1987-1997,for Portions of Bastrop, Bell, Burnet, Lee, Milam, Travis, and Williamson Counties, Texas
November 1999
(Table 3). This equates to 2.8 to 4.7 times the estimated availablesupply of 3,685 acre-feet per year. It is also noted that during periodsof drought, the effects of reduced recharge will accelerate current trendsof declining water levels, as illustrated in figure 3.
Trinity Group aquifer
The 1997 State Water Plan assumed the available groundwater fromthe Trinity Group aquifer would consist of the annual effective rechargeof 5,500 acre-feet per year and mining an additional 2 percent (1,200acre-feet per year) of the total recoverable storage (59,838 acre-feet)until the year 2030 (Muller and Price, 1979). After 2030, supplyfrom the aquifer would be based on the estimated effective recharge of5,500 acre-feet per year. The projected water demands and allocationsfor the study area indicate groundwater supplied by the Trinity Groupaquifer from the year 2000 to the year 2030 should fall below theaverage annual recharge amount of 5,500 acre-feet per year, as estimatedin TWDB Report 326 (Duffin and Musick, 1991). The projectionssuggest approximately 3,253 acre-feet per year, or 59 percent of theeffective annual recharge, will be required to meet the growing waterdemands in the year 2030 (TWDB, 1998c). This allocation assumesthat the substantial increase in total water demands in the study areawill be met primarily via surface water supplies (Table 4). By the year2030 only 1 percent of the total demands are expected to be met viapumpage from the Trinity Group aquifer
The evaluation of water-level changes since the 1960s indicated themost consistent water-level declines have been measured in WilliamsonCounty (see hydrographs in Figure 6). The annual effective rechargefor the Trinity Group aquifer in Williamson County is an estimated2,134 acre-feet per year (TWDB, 1998c). Table 5 shows the projecteddemand from the Trinity Group aquifer in Williamson County isexpected to exceed the effective recharge amount up until the year2030 by 522 acre-feet per year. The additional groundwater is beingsupplied by the “recoverable storage” as described in TWDB Report238 (Muller and Price, 1979). Furthermore, Table 5 shows total futuredemands far exceed the amounts that can be provided by the TrinityGroup aquifer and are expected to be met via surface water supplies.Historically, withdrawal from the Trinity Group aquifer in WilliamsonCounty has consistently exceeded the State Water Plan’s estimatedavailable supply amount. Between 1985 and 1997, pumpage fromthe Trinity Group aquifer ranged between 3,370 to 5,395 acre-feetper year (Table 3). This equates to 1.3 to 2.0 times the estimatedavailable supply of 2,656 acre-feet per year.
��
Changes in Groundwater Conditions in the Edwards and Trinity Aquifers, 1987-1997,for Portions of Bastrop, Bell, Burnet, Lee, Milam, Travis, and Williamson Counties, TexasNovember 1999
Surface Water Availability
There are currently five major reservoirs in the Brazos River basin andeight major reservoirs in the Colorado River basin that lie near or withinthe study area (Duffin and Musick, 1991). Of the fivereservoirs located in the Brazos River basin, three are located withinthe study area: Lake Georgetown, Granger Lake, and Stillhouse HollowLake. Of the other two reservoirs, located outside the study area in theBrazos River basin (Belton Lake and Alcoa Lake), only Belton Lakesupplies users within the study area. The Alcoa Corporation uses AlcoaLake as an industrial water supply source. The total firm yield fromthe Brazos River basin reservoirs is 218,855 acre-feet per year (TWDB,1998). A pipeline is currently under construction to transport surfacewater from Stillhouse Hollow to Round Rock and Georgetown and istentatively scheduled to begin operation by the year 2000.
The majority of the reservoirs located within the Colorado River basinin the vicinity of the study area are part of the LCRA’s Highland Lakessystem: Lake Buchanan, Inks Lake, Lake LBJ, Lake Marble Falls, LakeTravis, and Lake Austin. Most of these lakes are “pass through” lakesand/or hydroelectric power generation lakes. The system’s firm yield,445,266 acre-feet per year, is stored in Lake Travis and Lake Buchanan(TWDB, 1998). The other two reservoirs in the Colorado River basin(Walter E. Long and Lake Bastrop), currently do not supply water tousers in the study area. Of the eight reservoirs located within theColorado River basin, only three are located within or on the studyarea boundaries: Lake Travis, Lake Austin, and Decker Lake. Sufficientsurface water supplies exist from either the City of Austin or the LCRAfor the northern portion of Travis County and parts of Burnet Countythat lie within the study area for the 25-year planning period discussedin this report (TWDB, 1997).
Additionally, several smaller ponds and reservoirs with capacities lessthan 5,000 acre-feet exist in the study area and supply local needs.With the installation of a pipeline from Stillhouse Hollow to WilliamsonCounty, surface water supplies are adequate to meet current andprojected needs through 2030.
��
Changes in Groundwater Conditions in the Edwards and Trinity Aquifers, 1987-1997,for Portions of Bastrop, Bell, Burnet, Lee, Milam, Travis, and Williamson Counties, Texas
November 1999
DISCUSSION ANDCONCLUSIONS
Groundwater issues may present a problem in the study area. Raingage data suggest the area has received below average rainfall for thepast several years (Figure 2). With less recharge entering the aquifers,combined with increases in population and water demands, water levelshave not recovered to pre-drought and pre-development levels.
The Edwards aquifer, which typically has rapid responses toprecipitation and pumping, had not fully recovered from the 1996drought when this report was prepared, as seen in the hydrographsdepicted in Figure 3. Water levels have declined in the eastern portionof the Edwards aquifer in Williamson County in the past decade (Figure5). This can partially be attributed to the observation period endingduring a period of low precipitation and recharge. However, pumpagefrom the Edwards aquifer has consistently exceeded the estimatedavailable supply between 1985 and 1997 in Williamson County (Table5).
Water-level declines in the Trinity Group aquifer appear to havedecreased in intensity in the past decade and have generally leveledout (Figures 6 and 8). However, areas that continue to meet demandsthrough groundwater pumpage show overall declines since the 1960s,with the most significant water-level declines occurring in WilliamsonCounty. Areas that have converted to surface water (Travis County) orareas located in the recharge zone (Burnet County) show relativelystable water-level trends.
If the rate of conversion to surface water is maintained and expanded,as suggested in the 1997 State Water Plan, adequate water suppliesshould exist to meet the current and projected needs in the study areathrough the year 2030. However, from a more local perspective, itappears production of groundwater since the 1960s has had the mostsignificant impact in Williamson County. As previously stated in TWDBReport 326, a lack of reliable groundwater supplies for both short-term drought demand and long-term economic development is still aconcern. Careful management of the groundwater resources togetherwith increased conversion to surface water supplies will be necessary toensure adequate availability of water to this area through 2030.
��
Changes in Groundwater Conditions in the Edwards and Trinity Aquifers, 1987-1997,for Portions of Bastrop, Bell, Burnet, Lee, Milam, Travis, and Williamson Counties, Texas
November 1999
REFERENCES
Ashworth, John B., 1983, Ground-Water Availability of the Lower Cretaceous Formations in the HillCountry of South-Central Texas: Texas Water Development Board Report 273, 130 p.
Ashworth, John B., and Hopkins, Janie, 1995, Aquifers of Texas: Texas Water Development Board Report345, 69 p.
Baker, E.T. Jr., Slade, R.M., Dorsey, M.E., Ruiz, L.M., and Duffin, Gail L., 1986, Geohydrology of theEdwards Aquifer in the Austin Area, Texas: Texas Water Development Board Report 293, 215 p.
Bluntzer, Robert L., 1992, Evaluation of the Ground-Water Resources of the Paleozoic and CretaceousAquifers in the Hill Country of Central Texas: Texas Water Development Board Report 339,130 p.
Brune, Gunnar, and Duffin, Gail L., 1983, Occurrence, Availability, and Quality of Ground Water inTravis County, Texas: Texas Water Development Board Report 276,219 p.
Duffin, Gail, and Musick, Steven P., 1991, Evaluation of Water Resources in Bell, Burnet, Travis,Williamson, and Parts of Adjacent Counties, Texas: Texas Water Development Board Report 326,105 p.
Environmental Systems Research Institute, 1998, ARCINFO: Geographic Information System software.
Flores, Robert., 1990, Test Well Drilling Investigation to Delineate the Downdip Limits of Usable-Quality Ground Water in the Edwards Aquifer in the Austin Region, Texas: Texas WaterDevelopment Board Report 325, 70 p.
Kingston, Mike (ed).,1989, 1990-91 Texas Almanac: The Dallas Morning News, 607 p.
Klempt, William B., Perkins, Robert D., and Alvarez, Henry J., 1975, Ground-Water Resources of Partof Central Texas with Emphasis on the Antlers and Travis Peak Formations: Texas WaterDevelopment Board Report 195, Vol I. 528 p.
Muller, Daniel A., and Price, Robert D., 1979, Ground-Water Availability in Texas: Estimates andProjections Through 2030: Texas Department of Water Resources Report 238, 77 p.
National Climatic Data Center (NCDC), 1998, Climate Data: NCDC Summary of the Day - West 2:Hydrosphere Data Products, Vol 9.3, (CD-Rom).
Senger, Rainer K., Collins, Edward W., and Kreitler, Charles W., 1990, Hydrogeology of the NorthernSegment of the Edwards Aquifer, Austin Region: University of Texas at Austin, Bureau ofEconomic Geology Report of Investigations No. 192, 58 p.
Senger, Rainer K., and Kreitler, Charles W., 1984, Hydrogeology of the Edwards Aquifer, Austin Area,Central Texas: Bureau of Economic Geology Report of Investigations No. 141, 35 p.
��
Changes in Groundwater Conditions in the Edwards and Trinity Aquifers, 1987-1997,for Portions of Bastrop, Bell, Burnet, Lee, Milam, Travis, and Williamson Counties, TexasNovember 1999
Texas Natural Resource Conservation Commission (TNRCC), 1997, Groundwater ConservationDistricts: Report to the 75th Legislature: Texas Natural Resource Conservation Commission WaterPlanning and Assessment Division, 83 p.
Texas Department of Water Resources, 1990, Groundwater availability estimates, unpublished data.
Texas Water Development Board, 1997, Water for Texas: A Consensus-Based Update to the State WaterPlan: Texas Water Development Board, 345 p.
___ , 1998a, Groundwater Database: Texas Water Development Board, Water Resources Network.
___ , 1998b, Current and projected population and consumptive water demand forecasts: Texas WaterDevelopment Board, Water Resources Planning Division.
___ , 1998c, MADNESS water allocation model: Texas Water Development Board, Water ResourcesPlanning Division.
Werchan, Leroy E. and Coker, John L. (eds)., 1983, Soil Survey of Williamson County, Texas: NaturalResources Conservation Service, 152 p.