Embed Size (px)
Citation preview
DRAFT
NOT FOR CITATION
Changes in household organization and female headship patterns in South Africa in the 1990s in a time of HIV/AIDS and other macro-social transformations
M. Giovanna Merli
Alberto Palloni
Nompumelelo Nzimande
Erika Barth Cottrell
Center for Demography and Ecology Department of Sociology
University of Wisconsin, Madison Paper presented at the Population Association of America, Philadelphia, PA. April 1-3, 2005. The 1991 and 1996 census data were provided by the African Census Analysis Project (ACAP). We thank Tukufu Zuberi for making the data available and Tim Cheney for assistance in preparing the data sets. We also thank David Lam for sharing with us the 2001 census data, and Russell Dimond for programming assistance. This research was supported in part by NIA supplements to the University of Wisconsin Center for the Demography of Health and Aging (144-LK74 and 144-LK71).
1
Introduction
The 1990s have seen profound political, social and demographic changes in South
Africa. The period immediately preceding and following the collapse of the apartheid
regime deeply changed the nature of population movements between rural and urban
areas. This period also coincided with the rapid growth of HIV incidence rates and the
consequent increases in AIDS mortality among young adults by the end of the decade. In
addition to these two landmark events, forces of modernization continued to penetrate
various segments of South African society, gnawing at traditional family relations,
institutions and ideologies, a process was already well advanced in areas of high
population concentrations located near to or around large urban centers such as Cape
Town, Pretoria, Johannesburg and Durban. These cities are neural centers of government
and service sectors, and have experienced sustained inflows of rural migrants. Finally,
the effects of South Africa’s unique pension laws, in combination with high prevalence of
youth unemployment, may have encouraged the adoption of new residential
arrangements, e.g. by inducing changes in individual coresidential preferences.
Any of these macrosocial phenomena, let alone their simultaneous operation,
must have had some visible effects on family structure, headship patterns and,
consequently, on dimensions of individual well-being related to the family. By family
structure we mean the combination of an array of kin relations that are relevant for most
individuals, individual residential patterns, and household composition and functioning.
All three of these components and their combinations, play an important role in
individuals’ life course trajectories, careers, and ultimately, their levels of well-being.
Few studies have focused on the South African family, and even fewer have
investigated the causal connections between observable patterns of family structure and
social transformations.1 As a result we know little about the changed landscape of South
African families, and even less about the nature of adjustment to the aforementioned
transformations.
1 The exception to this is the growing body of South African studies over the last twenty years on changes in urban and rural domestic boundaries as a result of labor migration under rapidly changing social circumstances. See, inter alia, Murray 1976, 1981; Spiegel 1986, 1987, 1994a, 1994b; Spiegel, Watson and Wilkinson 1996; and Crankshaw 1996. (Cited in Russel 1998).
2
This paper contributes to our knowledge in this area by accomplishing three
related goals. The first is to formulate a simple framework to interpret aggregate changes
in household structure and headship patterns and to associate them with large-scale
societal changes. The second is to provide a snapshot of changes in individual living
arrangements and household organization during the decade between 1991 and 2001. We
focus on observed residential arrangements and kinship relations within households. We
do not explore in any depth the transformation of kinship relations as such but, instead,
we use what we know about these relations to understand the nature of individual
residential patterns and household composition. We also do not delve into the complex
issue of changes in individual well-being that follow the adoption of different residential
patterns. The third objective is to advance and test a few conjectures about the
combination of forces that induced the observed changes in household composition and
headship. We provide enough substantive and empirical material to partially identify the
mechanisms responsible for the observed change, and to track the connections between
changes in household type and headship patterns, on the one hand, and the
aforementioned broad societal transformations, on the other.
IDENTIFICATION PROBLEM
The problems we confront are not unique to our material object of study, but they are
generalized to all studies of families and household changes. These are problems of
identification of causal connections and can be categorized in two classes.
Preferences and demographic constraints
Are observed changes in household composition and female headship the outcome of
changes in individual (group) preferences or in demographic constraints?
The question of whether these observed changes are the result of individual or
group preferences, the outcome of demographic changes, or both, is a key question since
the most important theories about family changes invoke expectations that directly
implicate individuals (groups) decision-making. This question is central in studies of
historical family change in Western Europe (Wachter et al. 1978) and the United States
(Ruggles 1987). Although these concerns are not directly addressed in studies of family
3
change in contemporary Africa, they are, however, tangentially alluded to and, in some
cases, explicitly mentioned (e.g. Weisner, Bradley and Kilbride 1997).
To define the problem more precisely it is useful to resort to a simple example.
Imagine that during an interval of time we observe a gradual shift in the distribution of
households: from a distribution where the modal household type is stem or extended to a
distribution dominated by nuclear households. Precisely this type of trajectory was
posited in modernization theory to be characteristic of the transition from a traditional
regime of household formation to a modern one. If the observed changes are associated
with shifts in individual preferences and family decision-making, it would behoove us to
seek the roots of such ideological changes. They could be found, for example, in changes
affecting the division of labor, mode of production or rules governing ownership of and
access to means of production, or on erosion of the affective and emotional basis of
household formation. The problem arises because similar magnitudes of the shift in
distribution of household type could be obtained if fertility had declined enough to
constrain the supply of kin available to become members of households, even if no
transformations of individual or group preferences took place. Thus, without
information on individual or group preferences, it is difficult to use observable household
distributions to make claims about preferences. In the absence of such information, there
is only one way out and it involves a counterfactual: to search empirical support showing
that the observed changes could not have been produced unless ideological
transformations of a given magnitude had taken place. As a rule, such counterfactuals are
quite difficult to support, they require special methodologies and a great deal of luck.
Luck because if the observed changes are large enough that no conceivable demographic
change could have produced them, one can at least attribute a measurable fraction of
observed changes in household composition to ideologies, preferences and rules. This is
unlikely to occur under most conditions but especially within short periods of time, when
changes in households are likely to be of small magnitude and, in principle at least,
associated with a number of possible sources.
While most studies of family and household change roam over periods spanning
several decades, the focus of this paper is a time interval (1991-2001) of modest
proportions. Admittedly, the events taking place in South Africa in the 1990s are so
4
powerful and their effects potentially so vast that observed changes in households may be
much larger than what they would have been if the regime of social changes had been
less severe. This is indeed a partial advantage in our favor. The flip side of the coin is that
the scale of the events is such that it may have induced equally powerful transformation
on the demographic constraints as well as in the regime of household preferences. The
upshot is that, at least in the case of South Africa, luck is not abundant and we must resort
to special procedures to produce informative inferences.
Multiple causal paths
Under some conditions, resolution of the preference-demographic constraint conundrum
could lead directly to an equally baffling one, namely, to the inability to judge whether
changes in demographic constraints (or in the regime of preferences) are attributable to
one of two or more candidate events or causal factors. Again, let us deal with a simple
example. Suppose we observe a shift from a regime where heads of households are
predominantly males in their prime adult ages to one where heads are predominantly
older adults. Suppose also that the society under study is one that, during the same period
of time, experiences significant increases in adult mortality due to HIV/AIDS and large-
scale labor force migration flows. Even if it were possible to assert that the observed
changes in headship rates are largely attributable to demographic changes (as opposed to
changes in preferences), how can we decide whether the changes are the product of
migration patterns, HIV/AIDS or a combination of both? The point is moot if one is not
interested in the investigation of the association between household transformation and
the root cause of demographic changes. Yet, an important part of the literature on
HIV/AIDS makes a powerful and believable claim about its relevance for many facets of
social and economic life, including households and families. Hence, the issue cannot be
ignored.
SOCIETAL TRANSFORMATIONS AND CHANGES IN FAMILIES, HOUSEHOLDS AND HEADSHIP
PATTERNS IN SOUTH AFRICA
In this section we describe the most important transformations experienced by South
Africa’s society prior to and during the period under examination. The description is
5
necessarily sketchy, as our most important purpose is to identify in each case the
expected change in the regimes of demographic forces and of household and headship
preferences.
Apartheid and labor migration
Apartheid and its associated system of separate development imposed restrictions on
spatial mobility, education, and employment of black South Africans, by forcibly
resettling them to the homelands, four of which were made “independent states” in the
1960s and 1970s (Transkei, Bophuthatswana, Venda and Ciskei, or the TBVC states).
This regime supported a migrant labor system, of circular character, which involved a
large segment of the African adult population and affected almost every African
household. Through the enforcement of influx control laws, African men working in the
mining industries, on white farms, and in towns and cities were systematically denied the
right to settle there with their families. Single sex hostels were built in all major cities to
host rural African laborers. This system encouraged male out-migration but kept families
divided by forcing heavy restrictions on residential changes of migrants’ wives, children
and elderly relatives (Murray 1980, 1987; Russell 1998). It transformed once undivided
rural households into “stretched households”, that is spatially divided units connected by
kinship and remittances (Spiegel, Watson and Wilkinson 1996). After the collapse of
apartheid and the reintegration into South Africa of the TBVC states, migration involved
broader age groups as well as women (Posel and Casale 2002; Collinson et al. 2003).
The intensification of migration resulted in the rapid peri-urbanization of formerly rural
areas bordering large metropolitan areas and in the swelling of the population of black
townships living in backyard shacks (Kinsella and Ferreira 1997; Spiegel et al. 1996;
Percival and Homer-Dixon 1995). The intensification of migration flows coincided with
the drying up of sources of labor absorption, particularly mining (Seidman 1997).
Beside a shortage of urban housing, high rates of unemployment estimated between 25
and 60 percent (Cunningham et al. 1997) discouraged rural black South African families
from settling permanently in urban areas and increased the circular character of migration
and the degree of fluidity of rural households.
6
The relaxation of migratory restrictions in the early 1990s may have had a number
of consequences for household structure and headship patterns. First, if migration flows
under apartheid broke up families and households, with male migrants leaving behind
their spouses to head households composed by mothers and children, the disintegration of
this regime and the intensification of migration should translate into larger fractions of
females migrating to join their husbands already at place of destination. This will result
in a decline of female headed-households and an increase in nuclear households or
households composed by husband and wife.
Second, under apartheid, exclusively male migration may have induced the
merging of households headed by a young adult woman with those headed by elderly
parents or parents-in-law, resulting in high prevalence of extended families and an older
mean age of heads. The erosion of this regime and the process of family reunification
that may have followed should tilt the age distribution of heads towards younger ages.
Third, the lifting of migration restrictions may have not only encouraged family
reunification but may have also intensified the stimulus for migration of different
members of the household. This should triggered an increase in migration among
younger (married and unmarried) males and females, and an overall increase in female
migration, leading to a younger age distribution of household heads, a higher fraction of
households composed of couples with no cohabiting children, a larger fraction of solitary
households and of households made of grandparents and their young grandchildren
(“skip-generation” households).
Finally, all three outcomes of reunification implicitly assume that this process did
not have enough time to impact individuals’ preferences. In fact, we have assumed
throughout that the potential outcomes of reunification result from a mixture of
preexisting preferences and additional freedom of movement.
The HIV/AIDS epidemic
With its 5 million cases (UNAIDS 2002), South Africa is currently the country with the
largest number of people infected with the HIV/AIDS virus in the world. The rapidity
with which the HIV virus has spread is exceptional. In less than a decade, adult HIV
prevalence from antenatal surveys increased from 1 percent in 1990, 7.6 percent in 1994
7
to the current 26.5 percent (Department of Health 2003). The epidemic has so far taken a
tragic toll, with a significant increase in mortality at young and mid-adult ages since the
late 1980s, mainly attributable to AIDS, and an estimated 40% of adult deaths age 15-49
due to AIDS in year 2000 (Dorrington et al. 2001). The age patterns of mortality by sex
are different, with women experiencing excess mortality due to AIDS in young adulthood
at a later date than men, due to different sex-specific incidence curves and the dynamics
of HIV transmission from males to females. Women, however, are rapidly catching up.
Increasing evidence shows that women become infected at younger ages than men.
Several community studies found the highest HIV prevalence rates among young African
women between ages 20 and 24 (Coleman and Wilkinson 1997; Auvert et al. 2002), an
indication of women’s vulnerability to the risk of infection promoted by a generalized
gender inequity in the face of the epidemic. Without treatment to prevent the progression
from HIV to AIDS, Dorrington et al. (2001) estimated that the cumulative number of
AIDS deaths is expected to reach between 5 and 7 million by 2010.
Most striking about the AIDS epidemic, especially if compared with other
epidemic diseases in the African and Asian regions, is that it affects most severely the
working age population, and children (Quinn et al. 1986). This age selectivity together
with the disease’s long period of incubation, which typically ranges from 7 to 10 years in
Sub-Saharan Africa (Boerma et al. 1998), and the low probability of survival has serious
consequences for social organizations that are equal if not more powerful than those
observed for other diseases in Africa. Strategies adopted by households and families to
cope with the depletion of human and material resources induced by HIV/AIDS may
range from changes in household structure and patterns of living arrangements to
reorganization of the division of labor in the domestic domain, shifts in norms regarding
female, child and elderly labor force participation, and depletion of assets and cash
reserves. The particular menu of adjusting strategies chosen will depend on the social
group and some, though not all, of the changes in household structure introduced by
HIV/AIDS could be reflected in observable shifts in living arrangements of children,
women and the elderly, as a consequence of the excess mortality due to AIDS as well as
the prolonged period of morbidity associated with it.
8
Four consequences for households and headship patterns should result from the
spread of HIV/AIDS. First, the most direct consequence of excess mortality due to AIDS
should be an increase of orphanhood and widowhood. Second, there should be an
increase in skip-generation households in the areas most affected by the epidemic. This is
because children of parents with HIV/AIDS or those whose parents have died could be
taken into grandparents households. Other adjustments are of course possible, including
fosterage to other relatives and also the rise of child headed households. Third, as
widowhood rises, we may find marked increases in female headship rates.2 Fourth, the
number of extended households may increase and the age distribution of heads could
become older if grandparents disproportionately take the burden of heading households
with adult children affected by HIV/AIDS or, alternatively, younger and tilted toward
females if the burden of the disease is deflected away from the older generation towards
the female partners of people with AIDS.
Modernization and ideological shifts in family formation
Modernization theories have generally emphasized the roles of individual preferences and
relegated the role of demographic factors to a secondary place. The most important
insight offered by modernization theory is that as a result of economic transformation
brought about by industrialization, the widespread establishment of wage labor, and the
increasing influence of larger institutions associated with a central state, there is a
decoupling of production and family division of labor. The family based economy is
swept and displaced by wage labor and the advent of a strong linkage of most of its
members to a labor market rather than to the family farm or craft shop. The traditional
family relinquishes its role as the sole socialization agent and overseer of education of
children. These two changes alone lead to an erosion of social control over family
members and the weakening of emotional ties that sustain traditional adherence to a
family and its patriarch. These transformations alter individuals’ preferences for
2 The extent to which this will happen will depend on widow remarriage practices as well as traditions regarding declaration of marital status within households. The widowhood impact of excess adult mortality will be masked in areas where remarriage is quick and swift. More cumbersome is the case when no remarriage occurs but widows are not recognized as such and confounded with other women whose spouse is absent. The increment of widowhood can also be offset by mortality of females due to AIDS. For all these reasons, we expect that widowhood measures will understate the impact if increased mortality.
9
household formation, residential arrangements, and allegiance to kin. First, the timing of
marriage is left to individual choice and so is the selection of partner. This could lead to
increases in ages at marriage and even to a decline in the prevalence of marriage in
settings where arranged marriages were the rule. The need to migrate to hold a job may
exacerbate the disruption in marriage patterns but lead to changes consistent with those
suggested above. Second, the creation of a new household, as opposed to remaining in
the parental home, becomes a preferred strategy among young adults. Extended
households become a device to offset negative effects of exogenous conditions but not
the preferred arrangement. The direct consequence of this is a reduction in the size of
households, an increase in solitary households as well as an increase in headship rates at
younger ages and especially among unmarried women.
Some of the transformations that erode traditional families have been present in
African societies for a long time, particularly in the most urbanized areas. But the shift in
preferences about marriage formation and dissolution and about household formation and
dissolution could occur just as well in the absence of thorough changes in the economy.
Indeed, the diffusion of a “western” ideal of family life can by itself propel changes as
much as it does in the case of fertility. Thus, a shift toward later and less universal
marriage, a move toward nuclear households or rising prevalence of young women living
alone may spread in many areas, not necessarily according to the degree of economic
transformations. A further complication is that the mixture of local traditions with the
new ideas about marriage and households may lead to the adoption of very diverse
transitional forms that are not quite predictable from traditional indicators such as degree
of urbanization, industrialization, or the extent of central government influence.
At the very least we would expect that increased modernization in South Africa
largest urban areas should lead to increases in age at marriage, probably a decrease in the
fraction of women ever married and to a higher prevalence of nuclear households, and
solitary households especially those headed by women.
The South African pension system
10
South Africa is an exception among African countries in its formal economic support for
older citizens. Originally intended for white South Africans without employment
pension, in early 1993 pension legislation was extended to all South Africans. Women
age 60+ and men age 65+ are eligible for a means-tested general social pension. In the
World Bank’s1993 Living Standards Measurement Survey (LSMS), nearly 80% of age-
qualified Africans reported receiving a social pension (Case and Deaton 1998). Similar
to the effect of HIV/AIDS which may draw adult children back to their elderly parents’
homes, pension sharing with an elderly relative may have become a reason for adult
children to join their elderly parents’ households and share the elderly pensions,
especially in times of high unemployment. This should make households more extended
and the age distribution of heads older.
These predictions are consistent with a particular type of reaction to the new
pension system, namely, that adult children join the parental home. But this may not be
the case. If elderly are the ones to join their adult children the age distribution of
household heads would decrease together with an increase in the prevalence of three
generation households.
As a summary of the previous discussion, Table 1 displays the conjectured
changes in households and headship patterns and locates them according to two axes: the
first is the causative social transformation at the origin of the change. The second is the
dimension of the change, either in demographic conditions or in actual preferences and
ideologies about families. We distinguish four demographic conditions that can exert
pressure on households (fertility, mortality, health and migration), and two targets for
individual preferences (timing of marriage and household extension).
The first and most important caveat is that, although it is theoretically feasible that
all four events could change both preferences and demographic regimes, for our purposes
only a few associations are justified. Thus, HIV/AIDS and the breakup of apartheid may,
in the long run, affect marriage preferences and even the choices of household living
arrangements. But their demographic effects are dominant in the short run and this is
what we emphasize in our investigation. These problematic relations are flagged with a
question mark (“?”) in the table or with a qualification (“long run”). Second there are
associations that could go in opposite directions. We do not know, for example, how the
11
patterns of headship will change as a result of the pension system. It may well be that the
observed changes are contingent on the nature of preexisting conditions. Third and
finally, the associations are not spatially uniform. Quite obviously we would expect the
outcomes associated with HIV/AIDS to be more visible in areas most affected by
HIV/AIDS. By the same token, some of the consequences of the break up of apartheid
will be felt in areas experiencing heavy outflow of migrants and other consequences,
perhaps of opposite nature, in areas experiencing heavy migration inflows. Similarly, we
may find that comparable pressures in household configuration and headship can be
exerted by more than one demographic condition, especially those triggered by
HIV/AIDS or by the breakup of apartheid, thus complicating the identification of the
effects of each condition.
DATA SOURCES
Our examination of patterns of change in household configuration and headship relies
primarily on the analysis of a 10% sample of the 1991 census of the Republic of South
Africa conducted under apartheid and 10 percent samples of the first two censuses
conducted in post-apartheid South Africa in 1996 and 2001.
The 1991 census of the population of the Republic of South Africa (RSA) is well
known for its apartheid-induced distortions in coverage which produced significant
underenumeration especially in the self governing territories (SGTs), i.e. the six
homelands which remained part of the RSA after “independence” was granted to the four
TBVCs (Orkin 2000). Moreover, in many urban townships, informal settlements, and
rural areas that fell into the SGTs, where residents were overwhelmingly African,
mapping was not uniformly available and many areas were not demarcated into census
enumeration areas. Teams of enumerators “swept” through some of these areas without
prior demarcation or lists. In other areas, considered inaccessible due to political unrest
or other reasons, dwellings were counted using aerial photographs, and population
characteristics imputed using household densities obtained from sample surveys. In
perhaps the most extreme demonstration of the impact of apartheid on official statistics,
when areas covered by aerial photographs and sample surveys were found with an
unexpected number of women (wives and children of male migrant workers were barred
12
from cohabiting with their husbands in areas of migration destination) women were
reclassified as males. This resulted in the reclassification of 250,000 women in these
areas (Orkin 2000). Even after various adjustments, the underenumeration of the black
African population in the 1991 census was estimated at 17% (Zuberi and Khalfani 1999).
The granting of “independence” to the TBVCs further complicates the comparability of
data sources in the 1990s, because in 1991 the TBVCs conducted their own censuses. The
TBVCs were reintegrated into South Africa between 1992 and 1993, and provincial
boundaries redefined to yield nine provinces.
Both the 1996 and 2001 counted the whole South African population and
standardized methodologies of data collection for all areas (Cronje and Budlender 2004).
For the present analysis, we used the version of the 2001 census with imputed missing
data. Statistics South Africa offers users of 2001 census data a combination of two kinds
of imputations for the 2001 data: “logical” imputations, where “a consistent value is
calculated or deduced from other information relating to the individual or household” and
“hotdeck” imputations (Statistics South Africa 2001). We are not aware of any
imputation of missing data undertaken to correct the 1996 census data we use.
Our focus on household dynamics restricts the analyses to the population enumerated
in households and excludes the population living in hostels and institutions. 6.6% of the
population enumerated in the 1991 census and 4% of the population enumerated in the
1996 census lived in hostels or institutions. The percentage of the 2001 population living
in institutions was 1.37%.3
Issues of census comparability
There are several important issues related to our ability to compare censuses over time.
First, the empirical geographic basis of the 1991 census is different from those of the
1996 and 2001 censuses. Whereas the 1996 and 2001 censuses covered the entire
country, the 1991 census excluded the former TBVCs. Where needed, we were able to
3 In the 1991 census, the population living in hostels and institutions was enumerated as individuals who, according to type of dwelling categorization, lived in hostels or retirement rooms. In the 1996 census, individuals living in hostels and institutions were administered an individual questionnaire, not a household questionnaire. We also excluded 32,973 cases (or 0.9% of the total 1996 census population) who were reported as living in households but who were administered an individual questionnaire. For these cases, relationship to household head was missing
13
use a version of the 1996 census subsetted to the same geographic areas as the 1991 RSA
census, which excludes the population residing in the former TBVC states, and compare
the 1991 census population with the 1996 population purged of the fraction of the
population enumerated in the former TBVCs. Second., the definitions of what constitutes
a household and a household head changed over time. A household in the 1991 census
was defined as “a person or a group of persons (whether related or not) who usually
occupy a dwelling or part thereof and who provide themselves with food and other
essentials for living or have made arrangements for such provision” (Central Statistical
Service 1991). Live-in domestic workers were classified alongside their employers’
households as unrelated members. In the 1996 and 2001 censuses, a household is “a
person or a group of persons who occupy a common dwelling and who provide
themselves jointly with food and other essentials for living.” Domestic workers are
classified as separate households (Statistics South Africa 1998, 2004).
In the 1996 and 2001 censuses, the household head is defined as the person
identified as such by him/herself or another household member. In the 1996 census, s/he
is defined as “the person who assumes responsibility for decision-making in the
household” without specifying responsibility for decision-making with respect to what
(Statistics South Africa 1998). In the 2001 census, the head is defined as the “main
decision maker who owned or rented the dwelling or the person who was the main
breadwinner, as chosen by the household… If two people are equal decision-makers, or
in a household of totally unrelated persons, the older or oldest can be named as the
household head” (Statistics South Africa 2004). In both censuses, a person who assumes
decision-making responsibility as the head of household in the absence of the designated
head is regarded as the acting head. From the scarce documentation available for the
1991 census, it is less clear what a household head is.
All three data sets contain information on the relationship of each member to
household head. But the number of relationships provided in each census varies. The
1991 census has the smallest number of relationships to household head (spouse, child,
14
other family, unrelated), with the most notable absence being the category of grandchild.
The 1996 and 2001 censuses are richer in details.4
To increase our ability to capture a broader range of household types, we imputed
the relationship of grandchildren of head in the 1991 census by estimating the proportion
of “other family” who are grandchildren of head in a nationally representative survey
conducted on a date close to 1991 and applying this proportion to 1991 data to obtain
grandchild status.5 We then degraded the 1996 and 2001 data by ignoring information
unavailable in the 1991 census, so that, beside household head, the only relations to head
used to construct household types were spouse, child, grandchild, other family, and
unrelated.
Main indicators
Household types: The most important effects of massive migration flows and the full
impact of HIV/AIDS will leave imprints on family relations, ties and organization.
Household configurations are only one aspect of family life and, in many cases, perhaps
not even the most important. However, with the available census data it is only possible
to focus on households rather than kinship networks and families. Only those kinship
relations realized within the physical boundaries of a residential dwelling, according to
the census definition of household, can be satisfactorily captured. On the one hand, these
are likely to miss much of the universe of kinship relations individuals participate in. On
the other, changes and adjustments of residential arrangements, including
4 The 1996 census question on relationship to household head includes Head/acting head of household, husband/wife/partner, Son/daughter/stepchild/adopted child, Brother/sister, Father/mother, Grandparent, Grandchild, Other relative (e.g. in-laws), Non-related person. In addition to these categories, the 2001 census has three additional categories for Parent-in-law, Son/daughter-in-law and Brother/sister-in-law. 5 The closest data source to the 1991 census is the South Africa’s Living Standard Measurement Survey (LSMS) conducted by the South Africa Labour and Development Research Unit at the University of Cape Town in association with the World Bank in 1993. The imputation procedure was carried out as follows: 1. We prepared a three-way table which cross-tabulates relation to head in 10-year age-categories with 10-year age of head categories in the 1993 LSMS data. 2. For age-of-relation to age-of-head cells where the proportion of grandchildren was greater than 80% in 1993 data, a 100% grandchildren status was imputed to 1991 data. 3. For cells where the proportion of grandchildren was between 10% and 80%, logit regression models were fitted to 1993 data with the binary dependent variable 0/1 for grandchildren, and sex, marital status and age as independent variables. The parameter estimates thus obtained were used to calculate the probability of being a grandchild in 1991. There probabilities were greater than 0.5, grandchild status was imputed. The success rate of imputation of grandchild status was evaluated by implementing this procedure based on 1993 data on 1996 census data where grandchild status is known. Success rate of imputation was 86.94%.
15

accommodation of non-family members and the establishment of non-kinship relations,
are important ways in which an individual experiences the erosion of traditional family
organization induced by the various forces under examination, and should be examined
as such.
Although there are a number of compelling typologies of household configuration, we
chose to define a set of classes or types that, in theory, should be uniquely sensitive to the
phenomena under study. We distinguish the following classes or types
1. Solitary type, consisting of an individual living alone.
2. Couples consisting of an individual living with his or her spouse/partner, no
children.
3. Incomplete nuclear households consisting of a single parent and his/her children
4. Nuclear households, consisting of parents and children.
5. Extended households, include three generations households.
6. Skipped generation households consisting of grandparents and grandchildren but
no adult children, with or without any other family member
7. Complex households – any of the above with one or more non-related person.
8. Other – residual category.
The classification we adopt here is designed to captures real changes mainly
associated with the impact of the epidemic and changes in migration flows. This is
reflected in our use of the "skip-generation household" and the "incomplete nuclear
household" two categories that are seldom used in conventional classifications of
household types.
In this paper we follow conventional historical demography practice and focus on the
distribution of total households by type rather than on the distribution of the population
by type of households. While these metrics generally lead to similar conclusions, the
latter is excessively sensitive to differences in fertility regimes that could mask or
(artificially) reveal shifts in household regimes.
Age-specific headship rates: Headship rates are defined as the proportion of
individuals in a given sex and age category who are designated as household heads. As
we will show later, headship rates are analogous to prevalence rates and lead to similar
interpretational difficulties. They are a function of the actual age-sex and composition
16
trait-specific headship rate and the population distribution by age, sex and other
population composition characteristics.
RESULTS
The discussion of results is in two parts. In the first part, we examine evidence of effects
of each of the four social events on the various outcomes of interest using findings from
other researchers in the area. In the second part, we use data from the 1991, 1996 and
2001 censuses to assess changes in household types and headship rates and to explore
potential mechanisms involved.
Findings from other research
Evidence for the effects of breakup of apartheid on household configuration:
Earlier studies of labor migration under apartheid already identified migration as a source
of household fragmentation. Murray’s (1980) examined evidence of the impact of
migrant labor on household structure in the rural periphery of southern Africa from
surveys conducted in Botswana, Lesotho and the TBVCs. His findings highlight diverse
household composition and frequent shifts in household membership, often leading to the
disintegration of nuclear households, conjugal instability, illegitimacy, and the rearing of
children by grandparents and other kin. These changes, however, have not weakened the
existence of extended households, consisting of three or more generation, only that they
often include an unmarried daughter with her children. In a later study, Murray examines
case studies from the same areas. He identifies female-headed households as a dominant
form of living arrangement in migrant labor societies, and skipped generation households
linked to “female absentees outside an extant conjugal relationship” (Murray 1987:243).
Spiegel’s (1986) study of 30 households in a Transkei village in today’s Eastern
Cape Province finds that labor migration is often associated with the need to place
dependents in fostering relationships. But another purpose of fostering, especially of a
first born child, was to provide help, financial or with domestic tasks, to elderly relatives,
especially maternal grandparents, an indication that skip-generation households are part
of traditional residential arrangements. A 1977 census conducted in the same village
17
found that 34.4% of the 296 households in the village included one or more children
whose fathers and mothers were not part of the domestic unit.
A 1992 household survey of three Transkei villages in Eastern Cape Province
revealed that widespread male migration to industrial centers of South Africa has led to
an increase in proportion of female headed household, often with a large number of
dependents. Altogether, 62% of the 96 households in the survey were headed by women,
with the following breakdown: 7% by never-married women, 21% by wives of migrants,
and 34% by widows. The high incidence of widowhood was related to the large age
difference between spouses and higher male mortality rates. Economic hardships often
forced migrants’ wives into migratory labor, leaving elderly women in charge of caring
for their unmarried daughters and their sons’ children (Siqwana-Ndulo 1998).
Summarizing evidence from recent studies and two qualitative surveys on the
impact of labor migration on South African black households, Smit (2001) points to
several forms of living arrangements triggered by the intensification of labor migration in
the post-apartheid period. Female-headed households are identified as a prevalent form
of household living arrangement, because wives of migrant workers remain in rural areas
to protect the rights to land. They either live alone with their children in incomplete
nuclear households, or are absorbed into the extended family. Once husbands are settled
in urban areas, they may facilitate the migration of their wives mostly to participate in
domestic service. Migration of both parents usually results in the formation of skipped-
generation households in rural areas, where grandparents become responsible for the care
of grandchildren, or less frequently in the fostering of these children by their father’s
brother, whom they will address as “father.” Though apparently more rare, instances of
children and their mothers joining their fathers in the cities are also cited.
Although most studies do not provide enough quantitative evidence to rank the
prevalence of various types of living arrangements at any point in time, nor do they
permit to contrast present and past patterns of household organization and headship, they
are indicative of some of the main patterns of change we hypothesized as a consequence
of the relaxation of migration restriction: Among these, reunification of husband and wife
in migration receiving areas (less frequently with children), an increase in skipped
18
generation households, and a widespread prevalence of female headed households in
migration sending areas.
Evidence for the effects of HIV/AIDS: With the exception of a few studies on the
direct economic costs for individuals and households (Ainsworth and Over 1999), most
research on the effects of the African epidemic on families and households focus on
particular members of families, such as mothers or children, and on the impact of adult
male deaths which raise widowhood and orphanhood. Studies on the impact of
HIV/AIDS on widowhood have focused on traditional behaviors such as widow
inheritance in exposing women to HIV infection, and the changes in such traditional
arrangements due to the epidemics in Uganda (Mukiza-Gampere and Ntozi, 1995). Ntozi
et al. (1999a) found that stigmatization of AIDS widows in Uganda influenced their
movements upon the loss of their spouse. Less healthy widows were more likely to leave
their late husbands’ homes and seek care in their natal villages, while healthier AIDS
widows were more likely to remarry or form new sexual partnerships.
Community studies provide evidence for the effects of the epidemic on household
organization (Barnett and Blaikie 1992; Boerma et al. 1999; Ntozi and Zirimenya 1999;
Urassa et al. 1997). In Uganda’s Rakai district, two or three generations with at least one
orphan, and individuals living alone were more common in AIDS-affected households
than unaffected ones, and in a significant fraction of households containing AIDS
victims, grandparents cared for orphans (Barnett and Blaikie 1992). The burden of AIDS
mortality and morbidity for households is shared by household members in a strict
hierarchy. In Uganda, care of AIDS orphans was left to the surviving parent, then to
grandparents, followed by older orphans, step-parents or members of the extended family
such as uncles. Paternal orphans were more likely to be fostered by uncles than cared for
by their mothers, because children belong to their father’s lineage (Ntozi et al. 1999b).
Grandparents were the main care providers to AIDS orphans in a study in Zimbabwe
(Foster et al. 1995). Data from the Kisesa community study show that terminally ill
people travel back to rural homes in seek of care by the extended family (Urassa et al.
2001). Elderly parents are the most likely caregivers of their infected children because
parents are the most sympathetic and are most likely to be informed of their children’s
AIDS diagnosis first (Ntozi 1997). Strikingly, similar patterns of caregiving were found
19
in Thailand (Knodel et al. 2001) where 27% of adults with "symptomatic" AIDS were
cared for by a parent. Two-thirds of the adults who died of an AIDS-related disease had
lived with or next to a parent by the terminal stage of illness, and a parent, usually the
mother, had acted as a main caregiver for about half. For 70%, either a parent or other
older-generation relative had provided at least some care. The vast majority of parents
were aged 50 or more and many were 60 or older.
In South Africa, Merli and Palloni (forthcoming) find an increasingly strong
association during the 1990s between the provincial level of HIV and the share of the
elderly who live with a double-orphaned grandchild under 15 suggesting that the fall in
the number of healthy children and the growing loss of children to AIDS experienced by
South African elderly living in South African provinces badly hit by the HIV/AIDS
epidemic may have increased the propensities of grandparents to take in their
grandchildren to ease the burden on their sick adult children or to care for their orphaned
grandchildren.
Changes in headship rates have been found to be a prominent household feature in
areas heavily affected by the AIDS epidemic. In Uganda, Ntozi and Zirimenya (1999)
found an increase in male-headed households and a corresponding decline in female-
headed households between 1992 and 1995, a pattern that could be the result of the
depletion of the pool of widows by remarriage. A very “untraditional” phenomenon,
married women heading households, was no longer unusual, as “inherited” widows
continued to stay in their late husbands’ homes or decided to marry one of their late
husband’s relatives. The researchers also found a decline in the proportion of households
headed by individuals in the age groups mostly affected by the AIDS epidemic and a
corresponding increase in the proportion of households headed by the elderly.
These studies suggest that changes in household composition as a result of
HIV/AIDS are contingent on the prevailing cultural and social environment. This is
especially the case for widowhood. The joint death of parents leads to higher prevalence
of orphanhood and therefore to either increased fosterage or higher prevalence of skip
generation households and older headship rates. Thirdly, to the extent that illness of an
adult head or his/head death prompts migration to join another household its effects is to
increase extension of households and to age the age distribution of heads.
20
Evidence for the effects of modernization: Studies of labor migration under
apartheid emphasize the role of apartheid policies in changing the economic function of
Southern African households, from loci of agricultural production to bases for the
reproduction of labor for South Africa’s gold mines and industrial development
(Marwick 1978; Martin and Beittel 1987). These findings are consistent with theories of
modernization since they suggest that the influence of apartheid was to promote, in those
areas most affected by it, a transition from traditional family arrangements to relations
that are close to what would be observed in a society dominated by a modern family
system. But there are other changes in the making that could be attributed the growing
influence of modernization. For example, Hosegood and Preston-White (2002) uncover a
shift toward a pattern of earlier initiation of unions. Using data from the African Center
Demographic Information System, they show striking age patterns of marital and sexual
partnerships: very high proportion of never married women and men by age 45-49, much
higher than what is seen nationwide in South Africa or in neighboring countries, and a
significant prevalence of widowhood already among young adults, and high proportion of
non-marital partnerships, especially among young people and young women in particular.
One interpretation offered by the authors to account for this phenomenon links it
to HIV/AIDS: establishing earlier conjugal partnerships is a way for young women to
secure their boyfriends’ sexual fidelity through co-residence thus shielding them from
HIV infection. But other explanations include increasing cost of bridewealth and
stronger agency played by young couples in marriage transactions and decision making.
The latter can only take place if there is an ideological shift favoring individualism, a key
dimension of modernization.
Evidence for the effects of pension system: Pension sharing within poor
households is reported for Zulu communities in KwaZulu Natal communities. An inquiry
conducted among 50 grandmothers in 1995 showed that the majority received state old-
age pension. All grandmothers lived with extended families, most in three-generation
households. Their pension was mainly used to cover their own and their co-resident
household members’ basic needs, most often those of grandchildren but also of
unemployed adult children, or of unmarried daughters with children living in the same
household (Møller and Sotshongaye 1996). Although this study does not directly
21
describe the process of adult children joining their elderly parents’ households or
viceversa with the purpose of pension sharing, its findings support the idea that pensions
“act as a magnet for economically weaker family members who form multigenerational
households around female pensioners” (Møller and Sotshongaye 1996:17).
Household types and female headship rates in South Africa: 1991-2001.
We first review changes in the distribution of households by type and identify drastic
shifts in the direction of reduction of incomplete nuclear households, especially those
headed by women, significant declines in nuclear households and modest increases in
extended households and skip-generation households. Because changes in the distribution
of households by type are more likely to be associated with changes in the distribution of
female headed households, we next evaluate changes in female headship rates and model
the probabilities of being a female head between 1991 and 2001 as a function of selected
characteristics.
Configuration of households: Figures 1 and 2 display the distribution of
households by type for all population groups and for Africans in 1991, 1996 and 2001,
and separately for male and female heads. There are several important regularities in
these figures. The first is that the change in the distribution of households by type is
greater between 1991 and 1996 than between 1996 and 2001. The second is that
incomplete nuclear household arrangements decrease sharply but much more so among
females than among male heads. Indeed, most of the shift in the distribution of
households over the 1990s is accounted for by reductions among incomplete nuclear
households headed by women. The third is that temporal changes in household
distributions are more marked among female-headed households than among male-
headed households, and especially among African female heads. While the period
between 1991 and 1996 is characterized by a large drop in incomplete nuclear
households, a rise in skipped generation and extended households and of solitary
households, most notable in the period between 1996 and 2001 is a rise in the prevalence
of solitary households, and among Africans, a rise in couples with no cohabiting children.
Are these changes consistent with our expectations? At least some of the increase
in solitary households between 1991 and 1996 can be explained by different definitions
22
of households in the two censuses, because domestic workers in 1991 were incorporated
in the households of their employers. This is also mirrored by the decline in the
prevalence of complex households. Most of the remaining changes are consistent with
changes expected to follow the lifting of migration restrictions. Because we do not expect
the effects of HIV/AIDS to be felt in the first intercensal period as the rise in AIDS
mortality is likely to follow 1996 due to a long period of incubation between HIV
infection and the onset of AIDS, the increases in skipped generation and extended
households and the drop in nuclear households we observe in the first intercensal period
are likely to be due to the lifting of migration restrictions.6 Family reunification upon the
lifting of migration restrictions may explain the large drop in incomplete nuclear
households between 1991 and 1996. Further reduction in the prevalence of incomplete
nuclear households headed by women and the increase in solitary households and
households composed by couples with no cohabiting children observed in the 1996-2001
period are consistent with a rise in female migration in the latter half of the 1990s. There
is little evidence from these data about how households adjusted to the rise in AIDS
mortality. HIV/AIDS is likely to lead to the dissolution of nuclear households and the
reinforcement of skipped generation and extended households. However, we observe
very little if any change in the prevalence of these household types especially among
Africans who are the fraction of the South African population hit hardest by the
HIV/AIDS epidemic.
In sum, household distributions have shifted between 1991 and 1996 promoting a
higher prevalence of skip-generation and extended households eroding the dominance of
incomplete households headed by women. Although we found no increase in extended
and skipped generation households during the latter part of the 1990s, the prevalence of
incomplete nuclear households has continued to decline during this period, but it has been
met by an increase in the proportion of women living alone. The bulk of all changes in
household distribution by type are associated with changes among female heads and it is
to these that we now turn.
6 We also considered the possibility that these changes may be due to the different coverage of the 1991 and 1996 censuses. However, when we compared the distribution of households estimated in the 1996 census with that estimated from a version of the 1996 census purged of the TBVCs, the difference was too small for this coverage issue to explain the changes in household composition between 1991 and 1996.
23
Increase in female headship rates: Age specific female headship rate by year for
all South African women and for black South African women are shown in Figures 3 and
4. These figures show an overall increase in female headship rates between 1991 and
2001. In each year, the rates increase steadily by age, reach a maximum at age 70 and
then decline, while for African women, this decline starts at somewhat younger ages.
While the increase with age is probably the result of changes in marital status and fewer
opportunities to reside with children and other family members as age advances, the
decline at the older ages is consistent with increased co-residence with adult children or
other family members. This age pattern is consistent with those observed in other
developing countries (Arias and Palloni 1999). The increase in female heads over time
appears to be proportionately larger at younger and mid-adult ages than at older ages.
This is surprising especially in light of the previous finding of changes in the distribution
of households away from those that are traditionally headed by women, such as
incomplete nuclear households.
What are then the mechanisms responsible for the observed increase in female
headship rates between 1991 and 2001, and how are they related to the process of
macrosocial transformations experienced by the South African population during this
period?
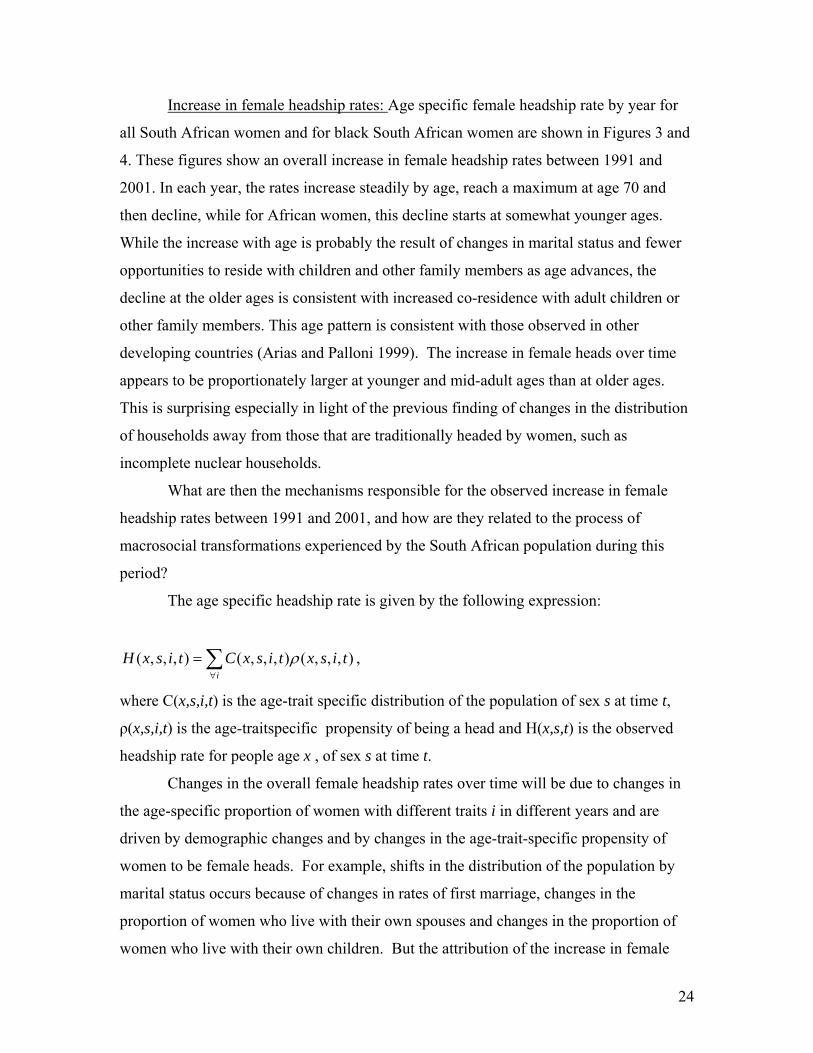
The age specific headship rate is given by the following expression:
∑∀
=i
tisxtisxCtisxH ),,,(),,,(),,,( ρ ,
where C(x,s,i,t) is the age-trait specific distribution of the population of sex s at time t,
ρ(x,s,i,t) is the age-traitspecific propensity of being a head and H(x,s,t) is the observed
headship rate for people age x , of sex s at time t.
Changes in the overall female headship rates over time will be due to changes in
the age-specific proportion of women with different traits i in different years and are
driven by demographic changes and by changes in the age-trait-specific propensity of
women to be female heads. For example, shifts in the distribution of the population by
marital status occurs because of changes in rates of first marriage, changes in the
proportion of women who live with their own spouses and changes in the proportion of
women who live with their own children. But the attribution of the increase in female
24

headship rates to a shift in the distribution of population by marital status or a shift in
marital-status specific propensities to be household head or both requires the
identification of the type of compositional change involved. Female propensities to be
head vary greatly by marital status. For example, increasing levels of divorce among
women or lower rates of first marriage, both leading to increases in headship rates, may
also reflect increasing propensities to lead a household. On the other hand, an increase in
female headship due to increases in widowhood following a rise in male mortality
implies change in the female population composition by marital status. But even when
an increase in widowhood explains an increase in female headship, propensities to be a
head, not composition may bring about such increase. Take the context of HIV/AIDS
mortality: rising male mortality is expected to affect the proportion of women who are
widowed and, other things being equal, to increase the proportion of women who are
heads. However, stigma associated with HIV/AIDS may increase the propensity of
widows to live alone, a departure from traditional living arrangements according to which
widows remarry or rejoin their natal kin upon the loss of their spouse.
The distribution of female-headed households by type may decrease female
headship rates if there is a shift away from households, such as incomplete nuclear
households, where female headship is traditionally highest, as may be the case with
family reunification following the lifting of migration restrictions in South Africa. But
shifts in the distribution of female headed households may increase female headship rates
if female migration increases the fraction of women living in solitary households.
Similarly, an increase in female headship rates may be due to shifts in propensities of
women to head their own households if, as a result of modernization, unmarried women
leave the parental home prior to marriage to establish their own.
Changes in headship rates may also result from changes in the composition of the
population by province of residence, e.g. shifts in the population distribution between
predominantly rural provinces which are traditionally areas of outmigration and
predominantly urban provinces which are typical destination of migrants from rural areas.
Thus changes in headship rates may be induced by migration when women migrate to
urban areas and become household heads. But changes in headship rates by province
may also be associated with differential propensities to be a female head if rural-urban
25

migration brings about an erosion of the traditional economy that supports the patriarchal
family system. Similarly education is expected to change ideologies about family
formation rules, with preference for later marriage and nuclear living arrangements upon
marriage among better educated women, while less educated women may be more likely
to experience early childbearing and household headship.
Demographic factors responsible for changes in household headship are also
expected to differ greatly by population group, with Africans bearing the brunt of the
effects of migration and mortality induced by the disintegration of the apartheid system
and the HIV/AIDS epidemic.
The decomposition of the growth of female headship rates in South Africa during
the 1991-1996 period and the 1996-2001 period into a component due to shifts in
population composition and a component due to shifts in propensities is carried out by
formulation of a logit model which models the probabilities of being a female head as a
function of age, marital status, education, province, population group and household type.
We decompose the overall growth in the headship rate within a multivariate
regression framework and forgo alternative approaches such as the calculation of an
indirectly standardized index of headship (Burch et al. 1987). The calculation of this
index by each of the characteristics that we posit are associated with observed changes in
female headship would have been too cumbersome.
Explaining the growth in the female headship rates in South Africa, 1991-2001.
Formulation of a logit model: Because the values of the headship rates correspond to
probabilities attaining values within the (0,1) interval, we formulate a model for their
logit transformation. The advantage of this is that the logit of the probability of being a
head takes all the values between - ∞ and + ∞.
)(* xx zLogitLogitY βα += ,
26
where LogitYx is the logarithm of the ratio of the probability of being a head to the
complement of this probability7 and Logit(zx) is the logit of a chosen set of standard
probabilities of being a head in the same age group. For the standard, we select the
average of the age-specific headship rates in 1991, 1996 and 2001 census. This model
can also be expressed as:
logit Y(x) = a + bx + β(logit zx),
where (a + bx) is α.
The parameters α and β change the level of the standard probabilities as follows: α is an
indicator of the headship “level” affecting headship at all ages in the same direction. α >0
implies higher levels of headship. β represents the slope of the headship function. A value
β > 1 leads to higher values of the probabilities of being a head at ages above the median
(approximately) and to lower values at ages below the median. As the parameter
decreases below 1 the reverse occurs. The covariates, x, are assumed to affect the value
of α, not the value of β. Covariates included in this model are marital status, education,
province of residence, population group and household type.
Models are fitted for all South African women ages 10 and older and separately
for black South African women. For each of these two groups, we first fit models
without controls for household type. When controls for household type are introduced,
women in solitary households are excluded because solitary households predict the
probability of being a head perfectly.
The effects of α and β on the standard female headship schedule, estimated from
logit models with no other covariates are illustrated in Table 2.
Consistent with the growth in headship rates over time we observed in Figures 3
and 4, higher α values in later years imply increases in the level of headship over time
among all South African women. β values above 1 in 1991 imply that the probability of
being a head in 1991 is higher at ages above the median than at ages below the median,
while in 1996 and 2001 this probability varies less by age. Among African women, a β
7 This is identical to the formulation of Brass’s logit system of mortality. However, the interpretation that we provide to the coefficients is subject to some inaccuracy because, unlike the probability of dying in a
27
equal to 0.89 in 1996 implies an age pattern of headship tilted towards ages below the
median. Values of α are lower (i.e. lower levels of headship) in models which exclude
women living alone because these are, by definition, household heads. Slightly higher
values of β imply a somewhat older headship schedule relative to the standard and are
consistent with the older headship schedule implied by the exclusion of women living
alone, who are likely to be younger.
The heterogeneity of the β parameter across census years is in agreement with our
expectations regarding the impact of the lifting of migration restrictions, which
encouraged the adoption of household headship by women in a broader age range either
because of their husband’s migration or because of their own migration, as well as with
our expectations regarding the effects of HIV/AIDS if the elderly assume the
responsibility of caring for their sick children or their orphaned grandchildren.
Tables 3a and 3b display the regression coefficients for models fitted to all South
African women for 1991, 1996 and 2001. These results reveal the following important
patterns: First, in all three years, the coefficients for marital status are the largest and they
are in the expected direction. Divorced, widowed and unmarried women are much more
likely to be household head than married or cohabiting women. The second is that the
probability of being a head is highest among African women. The third is that the effect
of education is in the expected direction only in 1996 with more educated women less
likely to be household head. In 1991 and 2001 the probability of being a head rises as
education increases. Under apartheid, less educated women whose husbands were absent
due to migration may have resided with their extended families, but by 2001, higher
female education may have increased women’s opportunities for migration and hence for
household headship. The fourth pattern is the higher probability of being a head
displayed by women living in Eastern Cape and Limpopo, two provinces which have
been traditionally sending migrants to the urban centers of Western Cape and to the
mines of Gauteng. Note however that in 1991, while the coefficient for Limpopo is very
high, the one for Eastern Cape is not. Eastern Cape is the region of South Africa where
two of the four former TBVCs, Transkei and Ciskei, are located. These results suffer
from the limited coverage of this province population in the 1991 census.
life table, the headship rate does not necessarily have an upper limit equal to 1.
28
In Table 3b, which controls for household type, the coefficients for household
type are equal to or greater than the other coefficients, including those of marital status.
The coefficient of women who head incomplete nuclear households is the largest,
followed by women heading skipped generation households and less conventional types
of households, which we have labeled “other.”
We also run models for African women. The patterns emerging from the
estimated coefficients for these models (not shown) are consistent with those observed
for models fitted to all South African women, with the exception that the estimated
coefficients of marital status are somewhat smaller in each year. This is due to the fact
that contrasts with the reference category (married women) are not as stark among
African women because of a larger fraction of married women who head households in
the African population than in other population groups.
Decomposition of overall change in headship rates as a function of selected
characteristics: We use logit models to decompose changes in headship rates over time
and assess the relative contribution of the effects of changes in individual propensities
and of changes in population composition to the overall change in headship rates between
1991 and 1996 and 1996 and 2001. To decompose the change between 1991 and 1996,
we proceed as follows: We first substitute the coefficients of 1991 with those of 1996,
and then we substitute the means of the logit of the standard age schedule of headship and
of the dummies of the covariates in 1991 with those in 1996. We then repeat this
operation substituting coefficients and means in 1996 with those of 1991.
Change over time is expressed as:
{[P3(a,b,c,d,e,f) – P1(A,B,C,D,E,F)] + [P2(A,B,C,D,E,F) – P4(a,b,c,d,e,f)]}/2 = δ-effects +
φ-effects + µ-effects,
where the δ-effects refer to the effects of changes over time in the composition of the
population by marital status, education, province, population group, and household type,
the φ-effects refer to the effects of changes over time in the estimated coefficients of
marital status, education, province, population group, and household type, and the µ-
effects refers to changes over time in the parameters α and β.
29

P1(A,B,C,D,E,F) and P3(a,b,c,d,e,f) express the probability to be a female head in
1991 and the probability to be a female head in 1991 standardized to reflect the
population composition or propensities by age, education, marital status, province,
population group and household type estimated in 1996. P2(A,B,C,D,E,F) and
P4(a,b,c,d,e,f) express the probability to be a female head in 1996 and the probability to
be a female head in 1996 standardized to reflect the population composition or
propensities estimated in 1991, where ∑+
∑=
+
+
x
x
ie
ePβα
βα
1.
To assess the contribution of each single factor to the total difference in
coefficients and to the total difference in means we let one factor vary at a time while
keeping all others constant, so that:
α-effect = {[P3(a,B,C,D,E,F) – P1(A,B,C,D,E,F)]+[ P2(A,B,C,D,E,F) – P4(a,B,C,D,E,F)]}/2 β-effect = {[P3(A,b,C,D,E,F) – P1(A,B,C,D,E,F)]+[ P2(A,B,C,D,E,F) – P4(A,b,C,D,E,F)]}/2,
where the α-effect is the effect for age and the β-effect is the effect for education. The
effects of the other variables are similarly derived (Das Gupta 1993:29).8
Table 4 displays the results of the decomposition carried out for all South African
women, with models without and with controls for household type. The top panel shows
results for the 1991-1996 decomposition and the bottom panel shows results for the 1996-
2001 decomposition. Table 5 shows corresponding results of the decomposition carried
out for African women only. In each table, composition effects are listed in the left-hand
panel and propensity effects are listed in the right-hand panel. The first column of each
panel lists the percentage contribution to the overall change in headship rates due to
composition or propensity effects, while the remaining columns show the size of the
contribution of composition and propensities by each of the variables in the models.9
Among the propensity effects, we also estimate the effect of the intercept, which reflects
8 A similar decomposition approach was carried out by Arias and Palloni (1999) to explain the changes in female headship rates in Latin America, with the difference that they only estimated P1(A,B,C,D,E,F) and P3(a,b,c,d,e,f). 9 The contribution of composition or of propensities by each of the variables in the model do not sum up to the total difference. The generally small residuals represent the interaction effects between composition and propensities.
30
propensities to be head a function of unobservable factors which we cannot measure and
account for in the models and are reflected in the reference categories of the dummy
variables in the models.
From Table 4 it is clear that the contribution of propensity effects to the overall
increase in the headship rate in both periods dwarf the contribution of composition
effects. For the 1991-1996 period, we estimate that about 80% of the total increase in
overall female headship experienced by all South African women is attributable to
propensity effects while the remaining 20 percent is attributable to composition effects.
The size of the composition effects is remarkably smaller than that of propensity effects.
Propensity to be head is strongly and positively affected by population group, while
education, provincial residence and to a lesser degree marital status reduce the propensity
to be head. This is consistent with the change in size and sign of the coefficients in Tables
3a. Apartheid kept men separated from their rural families and the contrast between
outmigration and immigration provinces in terms of female headship probabilities was
starker in 1991 than in 1996. With the introduction of controls for household type
(second row of top panels), the overall increase in propensity to be head is reduced by
propensities by household type, and the effect of province diminishes. This finding is
consistent with the shift between 1991 and 1996 away from households traditionally
headed by women, especially incomplete nuclear households, a type of living
arrangement more frequent in areas of outmigration. The size and the sign of the effect
of the intercept suggest that propensities by unobservable factors contribute importantly
and positively to the increase in propensity to be household head.
The results of the decomposition of changes between 1996 and 2001 indicate a
somewhat greater role played by changes in population composition: 66 percent of the
increase in female headship rates between 1996 and 2001 is contributed by increases in
propensities, the remaining 36 is due to population composition. Compared with the
composition effects estimated for the second half of the 1990s, education more strongly
affects the increase in female headship due to changes in composition. Propensities by
education also affect positively propensities to be head. This is consistent with increased
educational opportunities for all women in the post-apartheid period and increased
opportunities for female migration.
31
These results reveal a strong effect of propensities by population group on the
increase in the probability of being a head. Table 5 shows results of the decomposition
carried out for African women. The top left panel shows that between 1991 and 1996,
keeping propensities constant, changes in population distribution alone would reduce the
female headship rates by 17 percent. The contribution of composition effects has turned
more negative after the exclusion of women living alone, because this implies the
exclusion of a fraction of household heads. Compositions by marital status and by
household type are responsible for the negative contribution of composition effects to the
overall change in female headship. We suspect that the negative effect of marital status is
related to an anomalously low level of widowhood in the 1996 census relative to the 1991
census, especially among African women.10 The contribution of propensity by marital
status is positive, however, suggesting increasing propensities to head households by
marital status between 1991 and 1996. The propensity to head is strongly and negatively
affected by province, but this effect is dampened by the introduction of controls for
household type, pointing at the lower propensity to be head implied by the decline in
female-headed incomplete nuclear households as experienced by African women living
in provinces of out-migration. Most striking among the effects of propensities to head
households between 1991 and 1996 is the effect of the unobservable factors summarized
by the intercept. These unobservable factors are African women’s main route towards
increases in female headship between 1991 and 1996. Their effect is strengthened in
models which exclude women living in solitary households, an implication that
propensities to head households by unobservable factors pertain especially to women
who head other types of household.11
During the period 1996-2001, 65% of the increase in headship rates among black
South African women is due to changes in propensities, while the remaining is due to
changes in composition. Increases in propensities by marital status significantly
10 Levels of widowhood are particularly low in the 1996 censuses, lower than in 1991. This low level of widowhood in the 1996 census is surprising because the HIV/AIDS epidemic was more advanced in 1996 than in 1991. We doubt the quality of the 1996 census data on marital status. A comparison of the female age-specific widowhood rates estimated from the 1991 census, 1996 census, and the 1996, 1997, and 1998 October Household Surveys has shown lower widowhood rates in 1996 than in any of the other data sources, leading us to suspect underreporting of widowhood in the 1996 census. 11 The magnitude of these effects did not change when we carried out the decomposition with the version of the 1996 census reduced by the absence of the population of the former TBVCs.
32
contribute to the overall increase in propensities in the latter half of the 1990s, even after
controlling for household type. We have previously posited that the burden of HIV/AIDS
mortality and morbidity borne by women may drive up female headship as women are
widowed by AIDS or because they are left with the care of their sick spouse/partner.
Similarly, modernization may induce young unmarried women to establish their own
separate households because of individual preference for this type of living arrangements.
Finally, migration may increase African women’s propensities to head households by
marital status in the following ways: it may encourage migration of unmarried women to
urban areas or it may leave the responsibility to head households to married women
whose husbands have migrated. Although the effect of propensities by unobservable
factors on the overall increase in female headship rates is not as large as in the period
between 1991-1996 among African women, in the latter half of the 1990s, it is
comparable or greater in size than the effect of marital status, depending on whether or
not we control for household type in the model.
DISCUSSION AND CONCLUSIONS
We have described changes in the distribution of households by type and the growth in
female headship rates in South Africa over the 1990s using three consecutive censuses
conducted before and after major macrosocial transformations engulfed South African
society: the end of apartheid and the onset of the HIV/AIDS epidemic. The scale of these
events, together with forces of modernization and the indirect effect of welfare policies
directed at improving the well-being of the elderly must have transformed the social
landscape of South African families and households and induced specific adaptations in
terms of observable changes in residential arrangements and headship patterns. To
interpret these changes we have formulated a simple framework which associates them
with large-scale societal transformations. With this framework we have hypothesized the
direction of changes in the distribution of households by type as well as in age and gender
patterns of household headship and have drawn a distinction between various dimensions
of change, namely demographic conditions and individual preferences and ideologies
about families and households. Using data from three South African censuses taken five
years apart, our description of trends and patterns of household configuration and
33
headship has focused on two periods, the 1991-1996 period and the 1996-2001 period.
The post-apartheid lifting of migration restrictions has likely shaped changes in living
arrangements during both periods. However, although HIV/AIDS morbidity may have
induced special accommodations already by the middle of the 1990s, it is in the second
half of the 1990s that we expect the full impact of AIDS mortality.
The first notable finding from the description of changes over time in the
distribution of households is a decline in incomplete nuclear households, a type of
household traditionally headed by women, an increase in the prevalence of solitary
households, a drop in extended and skip-generation households. The bulk of these
changes have occurred in the first half of the 1990s, though the decline in incomplete
nuclear households and the increase in solitary households have continued through the
latter part of the 1900s, especially among women. All these changes are consistent with
our posited effect of the lifting of migration restriction with the demise of apartheid and
only partially with the onslaught of HIV/AIDS. The second main finding is an increase in
female headship rates at all ages over the 1990s, but especially at young and mid-adult
ages which has occurred despite the shift away from household traditionally headed by
women.
The decomposition carried out to assess the contribution of demographic
composition and propensities to shifts in female headship rates has shown that
propensities effects dwarf population composition effects. The bulk of these changes in
all cases are associated with shifts in status-specific female headship rates not to changes
in the composition of women by status. Thus, for example, the increase in overall female
headship rates between 1996 and 2001 is not a function of changes in the distribution of
women by marital status as much as it is the result of the increase in marital-status
specific female headship rates. Paradoxically, South African women’s route towards
increases in female headship between 1991 and 1996 and to a lesser extent between 1996
and 2001 consist in part of a departure from a propensity to head incomplete nuclear
households to greater propensities to head other types of households, and, especially
among Africa women, of greater propensities for female headship by unobservable
factors that could not be accounted for in our models. . The increase in propensity for
female headship by unobservable factor pertains especially, but is not limited to, female
34
heads living with other household members. These changes are consistent with the
intensification of migratory flows over the course of 1990s, if women, because of
migration of their husbands or partners, are left to head households and take care of
dependents, or if they themselves become migrants taking advantage of the lifting of
migration restrictions in the post-apartheid era.
The nature of the shifts in female headship in the latter half of the 1990s could be
consistent with household responses to the HIV/AIDS epidemic, especially since marital
status explains a significant fraction of the increase in propensities for female headship, a
pattern consistent with increases in widowhood, or women left with the care of their sick
partner. However, even after identifying the role played by propensity by marital status,
we find that comparable pressures in household headship that could be exerted by
HIV/AIDS could also be the outcome of migration which increases male temporary
absences or of young women’s earlier separation from the parental home induced by
modernization. These alternative explanations complicate the identification of the effect
of HIV/AIDS as distinct from those of other conditions.12
The solution to the problem of identification of causal pathways hinges on having
access to richer and better information such as longitudinal studies which allow the
estimation of less ambiguous indicators of behaviors and communities. Conventional
sources, such as censuses, reduce the analytical options to a handful of indicators that can
only sustain weak inferences. In the absence of more appropriate data sources, future
steps towards maximizing the use of census data for the purpose of identifying the effects
of HIV/AIDS and of migration on household configuration and headship patterns will
include the use of province as a piece of identifying information. There is a great
variation among South African provinces in terms of prevalence of HIV and intensity and
direction of migratory flows. The advantage of census data is that they are uniquely
suited to accommodate the performance of decomposition by sub-national unit without
loss of statistical power.
12 In future analyses, we may be able to gain further insights on the attribution of changes in propensity by marital status to a given macro-social transformation by further decomposing the trait-specific propensity effect into the effect of each dummy. This procedure can be used to identify the composition and/or propensity effects of the dummies of any of the variables which display the largest effects.
35
In future analyses we will also assess the extent to which our results are
influenced by the exclusion from each census of people living in hostels and institutions
by re-classifying and reincorporating these observations into each census as individuals
living alone. This reclassification is likely to affect most significantly the distribution of
household types in the 1991 census, especially that of male-headed households. We will
also assess the sensitivity of our results to the imputation of missing data in the 2001
census by utilizing a version of the 2001 census unadjusted for missing data.
One important implication of the findings from the present analysis is that the
scale of the transformations that have engulfed South African society during the 1990s
was so potent that, in only a decade-time, it has induced a revolution in preferences and
ideologies about family relations and obligations, household configuration and headship,
by far faster that the gradual shift in the distribution of household brought about but the
process of modernization in other historical and contemporary societies.
36
References Ainsworth, M., and M. Over. 1999. Confronting AIDS: Public Priorities in a Global Epidemic. New York: Oxford University Press. Arias, Elizabeth and Alberto Palloni. 1999. Prevalence and Patterns of Female-Headed Households in Latin America: 1970-1990. Journal of Comparative Family Studies 30(2): 257-279. Auvert, Bertrand et al. 2002. “High prevalence of HIV infection among youth in a South African mining town is associated with HSV-2 seropositivity and sexual behavior.” AIDS 15(7):pp? Barnett, T. and P. Blaikie. 1992. AIDS in Africa. Its Present and Future Impact. New York: The Guildford Press. Boerma, T., A.J. Nunn, A.G. Whitworth. 1998. “Mortality impact of the AIDS epidemic: evidence from community studies in less-developed countries”. AIDS 12(suppl.1): S3-S14. Boerma, T., M. Urassa , K. Senkoro, A. Klokke, and J.Z.L. Ng’weshemi. 1999. Spread of HIV infection in a rural area in Tanzania. AIDS 13:1233-1240. Burch, Thomas K., Shiva S. Halli, Ashok K. Madan, Kausar Thomas, and Lokky Wai. 1987. Measures of household composition and headship based on aggregate routine census data. In J. Bongaarts, T. Burch and K. Wachter, eds. Family Demography: Methods and their Application. Oxford: Clarendon Press. Case, A. and A. Deaton. 1998. Large cash transfers to the elderly in South Africa. The Economic Journal 108: 1330-1361. Central Statistical Service. 1991. Census 91. 1991 Population Census. Instruction Manual. Coleman, R. and Wilkinson, D. 1997. “Increasing HIV prevalence in a rural district of South Africa from 1992 to 1995,” Journal of Acquired Immune Deficiency Syndromes and Human Retrovirology. 16:50-53. Collinson, M., S. Tollman, K. Kahn and S. Clark. 2003. Highly prevalent circular migration: Households, mobility and economic status in rural South Africa. Presented at the Conference on African Migration in Comparative Perspective, Johannesburg, South Africa, 4-7 June, 2003. Cronje, M. and Budlender, D. 2004. Comparing Census 1996 and Census 2001: An operational perspective. South African Journal of Demography 9(1) 67-89.
37
Crush, Jonathan. 1995. “Mine migrancy in the contemporary era,” Chapter 2 in Jonathan Crush and James Wilmot, eds. Crossing Boundaries: Mine Migrancy in Democratic South Africa. Cape Town: Institute for Democracy in South Africa. Das Gupta, Prithwis.1993. Standardization and Decomposition of Rates: A User’s Manual. Current Population Reports, Series P23-186. Washington, D.C.: U.S. Bureau of the Census. Department of Health. 2003. National HIV and Syphilis Antenatal Seroprevalence Survey in South Africa, 2002. Summary Report. Pretoria: Department of Health. Dorrington, Rob, David Bourne, Debbie Bradshaw, Ria Laubscher and Ian M. Timaeus. 2001. “The impact of HIV/AIDS on adult mortality in South Africa.” Technical Report. Burden of Disease Research Unit. Medical Research Council. Foster G. et al. 1995. Orphan prevalence and extended family care in a peri-urban community in Zimbabwe. AIDS Care 7(1): 3-17. Hosegood, Victoria and Eleanor Preston-Whyte. 2002. Changing marriage and cohabitation patterns in rural Kwazulu-Natal, South Africa. Presented at the Population Association of America Meetings, May 9-12, Atlanta. Kilbride, Philip L. and Janet C. Kilbride. 1997. “Stigma, role overload and delocalization among contemporary Kenyan women,” pp. 208-226 in Thomas S. Weisner, Candice Bradley and Philip L. Kilbride, eds. African Families and the Crisis of Social Change. Westport, CT: Bergin and Garvey. Kinsella, K. and M. Ferreira. 1997. Aging Trends: South Africa. International Brief 97-2. Washington, D.C.: US Department of Commerce, Bureau of the Census. Knodel, J., M. VanLandingham, C. Saengtienchai and W. Im-em. 2001. Older people and AIDS: Quantitative evidence of the impact in Thailand. Social Science and Medicine 52(9): 1313-1327. Martin, William G. & Mark Beittel. 1987. “The Hidden Abode of Reproduction: Conceptualizing Households in Southern Africa,” Development and Change, 18: 215-234. Marwick, Max. 1978. “Household Composition and Marriage in a Witwatersrand African Township,” in W.J. Argyle and E. Preston-Whyte editors, Social System and Tradition in Southern Africa, Oxford University Press: 36-53. Merli, M. Giovanna and Alberto Palloni. Forthcoming. "The HIV/AIDS Epidemic, Kin Relations, Living Arrangements and the Elderly in South Africa.” In B. Cohen and J. Menken, eds. Aging in Africa. Washington, D.C.: National Academy of Science Press.
38
Møller and Welch. 1990. “Polygamy, Economic Security, and Well-Being of Retired Zulu Migrant Workers,” Journal of Cross-Cultural Gerontology, 5: 205-216. Møller, V. and A. Sotshongaye. 1996. “My family eat this money too”: pension sharing and self-respect among Zulu grandmothers. Southern African Journal of Gerontology 5(2):9-19. Mukiza-Gapere, J., and J.P.M. Ntozi. 1995. Impact of Aids on marriage patterns, customs and practices in Uganda. Health Transition Review. Vol 5, Supplement, Pp. 201-8. Murray, Colin. 1980. “Migrant Labour and Changing Family Structure in the Rural Periphery of Southern Africa,” Journal of Southern African Studies, 6(2): 139-156. Murray, Colin. 1987. “Class, Gender and the Household: The Development Cycle in Southern Africa,” Development and Change, 18: 235-49. Nhlapho, Margaret. 199X. “Domestic workers in South Africa. Migration World. XIX:1/2:21-23. Ntozi, J.P.M., F.E. Ahimbisibwe, N. Ayiga, J.O. Odwee and F.N. Okurut. 1999a. The effect of the AIDS epidemic on widowhood in Northern Uganda. Pp. 211-224 in The Continuing African HIV/AIDS Epidemic. Canberra, Australia: The Australian National University, National Centre for Epidemiology and Population Health, Health Transition Centre. Ntozi, J.P.M., F.E. Ahimbisibwe, J.O. Odwee, N. Ayiga and F.N.Okurut. 1999b. Orphan care: The role of the extended family in northern Uganda. Pp. 225-236 in The Continuing African HIV/AIDS Epidemic. Canberra, Australia: The Australian National University, National Centre for Epidemiology and Population Health, Health Transition Centre. Ntozi, J.P.M., and S. Zirimenya 1999. Changes in household composition and family structure during the AIDS epidemic in Uganda. Pp. 193-209 in I.O.Orubuloye, J.C. Caldwell and J.P.M. Ntozi (eds), The Continuing African HIV/AIDS Epidemic in Africa: Response and Coping Strategies. Canberra, Australia: Australian National University, National Centre for Epidemiology and Population Health, Health Transition Centre. Ntozi, J.P.M. 1997. AIDS morbidity and the role of the family in patient care in Uganda, Health Transition Review 7(supp): 1-22. Orkin, F.M. 2000. From apartheid to democracy: Global lessons from a national experience. Paper presented at the IAOS Conference 2000 on “Statistics, Development and Human Rights” Montreux, Switzerland 4-8 September, 2000. Orkin, Mark, Ros Hirschowitz and Pali Lehohla. 1997. “Accounting for the missing millions: The preliminary estimates from Census ’96.” http://www.und.ac.za/und/indic/archives/indicator/spring97/ORKIN2.htm.
39
Percival, V. and T. Homer-Dixon. 1995. Environmental scarcity and violent conflict: The case of South Africa. Occasional Paper, Project on Environment, Population and Security. Washington, DC: AAAS and the University of Toronto. Posel, D. and D. Casale. 2002. What has been happening to internal labour migration in South Africa, 1993-1999? Presented at the Development Policy Research Unit’s 2nd Annual Conference on Labor Markets and Poverty in South Africa. September 2002. Quinn T.C; J.M. Mann, J.W. Curran, P. Piot. 1986. “AIDS in Africa: An epidemiologic paradigm” Science 234(4779):955-63.
Ruggles, S. 1987. Prolonged Connections. The Rise of the Extended Family in Nineteenth-Century England and America. Madison, WI: The University of Wisconsin Press. Russel, Margo. 1998. Black urban households in South Africa. African Sociological Review. 2(1):174-180. Seidman, G. W. 1997. Restructuring Gold Mines, Redesigning Lives. Research in the Sociology of Work. Vol. 6:199-221. Siqwana-Ndulo, Nombulelo. 1998. “Rural African Family Structure in the Eastern Cape Province, South Africa,” Journal of Comparative Family Studies, 29(2): 407-417. Smit, Ria. 2001 “The impact of labor migration on African families in South Africa: Yesterday and today.” Journal of Comparative Family Studies 32(4):533-548. Spiegel, A. D. 1986. “The fluidity of household composition in Matatiele, Transkei: A methodological problem,” Africa 45(1):17-35. Spiegel, A.D., Watson and Wilkinson. 1996. Domestic diversity and fluidity among some African households in greater Cape Town. Social Dynamics 22(1): 7-30. Statistics South Africa. 1998. The people of South Africa. Population census, 1996. Definitions Report. Pretoria: Statistics South Africa. Statistics South Africa. 2001. Census 2001 10% Sample, Pretoria: Statistics South Africa. Statistics South Africa. 2004. Census 2001. Concepts and Definitions.Report No. 03-02-26 (2001). Pretoria: Statistics South Africa. Urassa, M., J.T. Boerma, J.Z.L. Ng’weshemi, R. Isingo, D. Schapink and Y. Kumugola. 1997. Orphanhood, child fostering and the AIDS epidemic in rural Tanzania. Health Transition Review 7(supp 2): 141-153.
40
Urassa, M., J.T. Boerma, R. Isingo, J. Ngalula, J.Z.L. Ng’weshemi, G. Mwaluko and B. Zaba. 2001. The impact of HIV/AIDS on mortality and household mobility in rural Tanzania. AIDS 15: 1-7. UNAIDS. 2002. South Africa: Epidemiological Fact Sheet. Geneva: World Health Organization. Van der Berg, Servaas, Rudolf Burger, Murray Leibbrandt and Cecil Mlatsheni. 2002. “Migration and the changing rural-urban interface in South Africa: What can we learn from census and survey data?” Paper presented at the DPRU/FES Conference on Labor Markets and Poverty in South Africa, Johannesburg, 22-24 October 2002. Wachter, K.W., E.A. Hammel, and P. Laslett. 1978. Statistical Studies of Historical Social Structure. New York: Academic Press. Weisner, Thomas S., Candice Bradley and Philip L. Kilbride, eds. 1997. African Families and the Crisis of Social Change. Westport, CT: Bergin and Garvey. Wilson, Francis. 1972. Migrant Labour in Southern Africa. Johannesburg: South African Council of Churches. Wilson, Francis. 1976. “International migration in Southern Africa,” International Migration Review 10(4):451-488. Zuberi, T. and A.K. Khalfani. 1999. Racial classification and the census in South Africa, 1911-1996. ACAP Working Paper No. 7. Philadelphia: University of Pennsylvania.
41
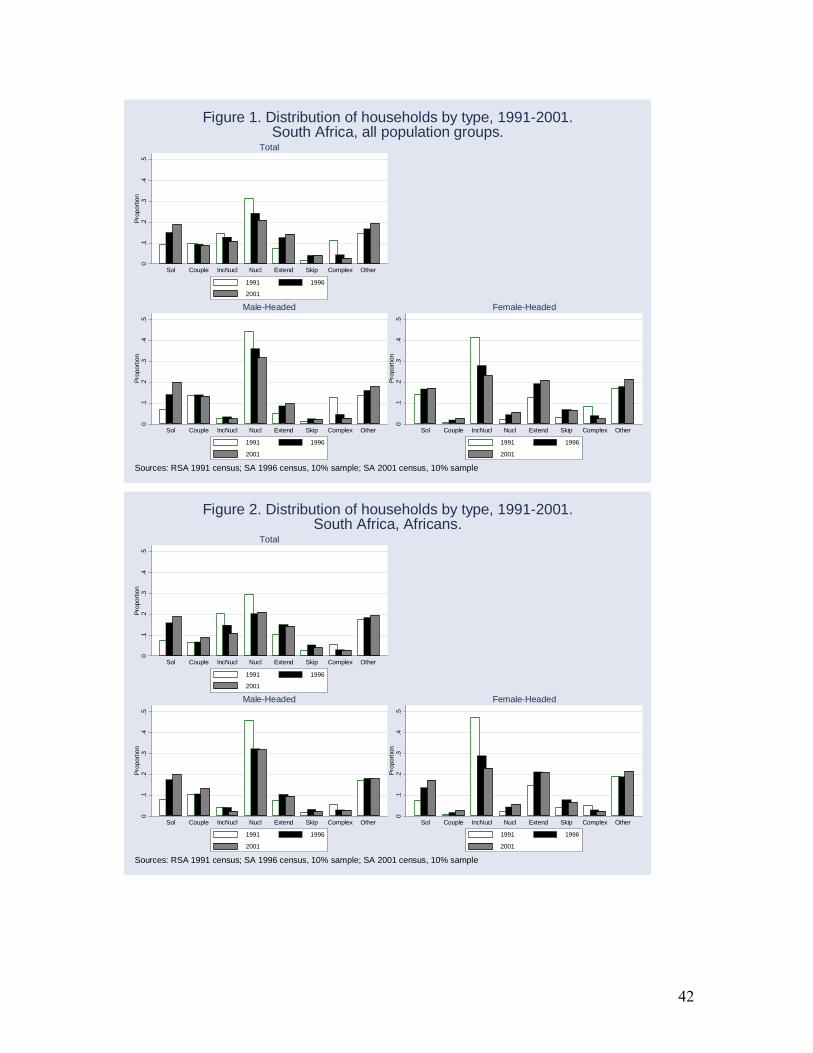
0.1
.2.3
.4.5
Prop
ortio
n
Sol Couple IncNucl Nucl Extend Skip Complex Other
Total
1991 1996
2001
0.1
.2.3
.4.5
Prop
ortio
n
Sol Couple IncNucl Nucl Extend Skip Complex Other
Male-Headed
1991 1996
2001
0.1
.2.3
.4.5
Prop
ortio
n
Sol Couple IncNucl Nucl Extend Skip Complex Other
Female-Headed
1991 1996
2001
Sources: RSA 1991 census; SA 1996 census, 10% sample; SA 2001 census, 10% sample
Figure 1. Distribution of households by type, 1991-2001.South Africa, all population groups.
0.1
.2.3
.4.5
Prop
ortio
n
Sol Couple IncNucl Nucl Extend Skip Complex Other
Total
1991 1996
2001
0.1
.2.3
.4.5
Prop
ortio
n
Sol Couple IncNucl Nucl Extend Skip Complex Other
Male-Headed
1991 1996
2001
0.1
.2.3
.4.5
Prop
ortio
n
Sol Couple IncNucl Nucl Extend Skip Complex Other
Female-Headed
1991 1996
2001
Sources: RSA 1991 census; SA 1996 census, 10% sample; SA 2001 census, 10% sample
Figure 2. Distribution of households by type, 1991-2001.South Africa, Africans.
42
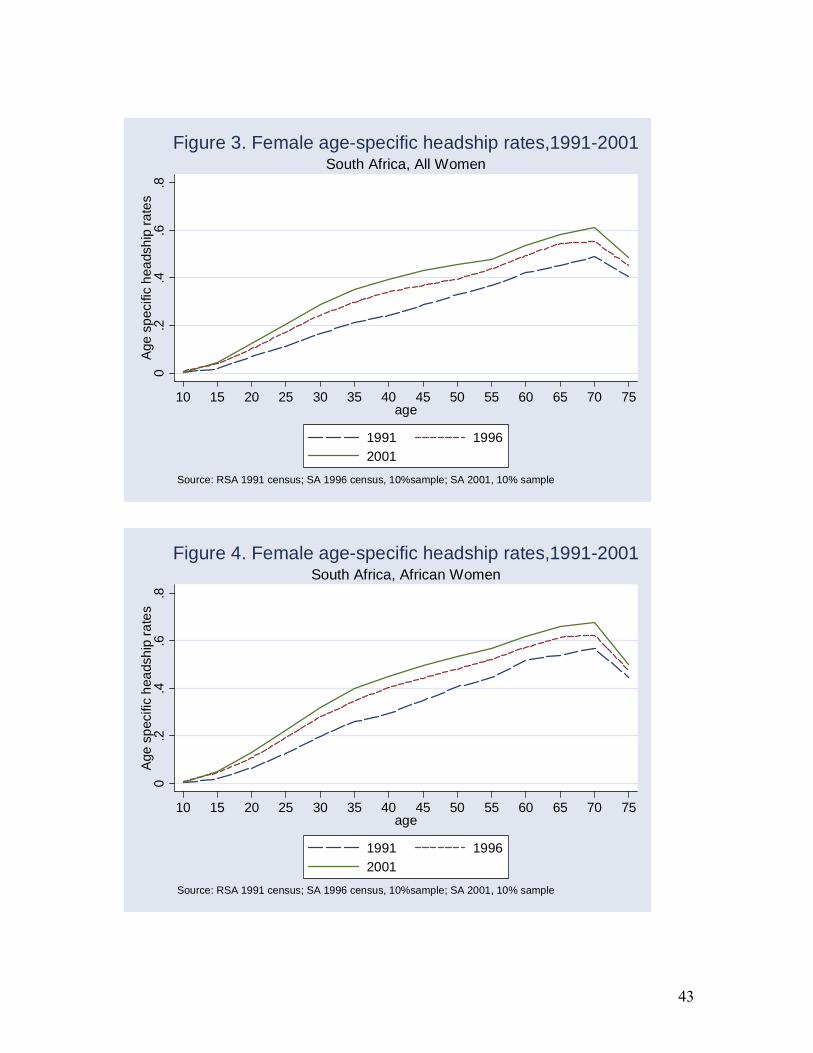
0.2
.4.6
.8A
ge s
peci
fic h
eads
hip
rate
s
10 15 20 25 30 35 40 45 50 55 60 65 70 75age
1991 19962001
Source: RSA 1991 census; SA 1996 census, 10%sample; SA 2001, 10% sample
South Africa, All WomenFigure 3. Female age-specific headship rates,1991-2001
0.2
.4.6
.8A
ge s
peci
fic h
eads
hip
rate
s
10 15 20 25 30 35 40 45 50 55 60 65 70 75age
1991 19962001
Source: RSA 1991 census; SA 1996 census, 10%sample; SA 2001, 10% sample
South Africa, African WomenFigure 4. Female age-specific headship rates,1991-2001
43
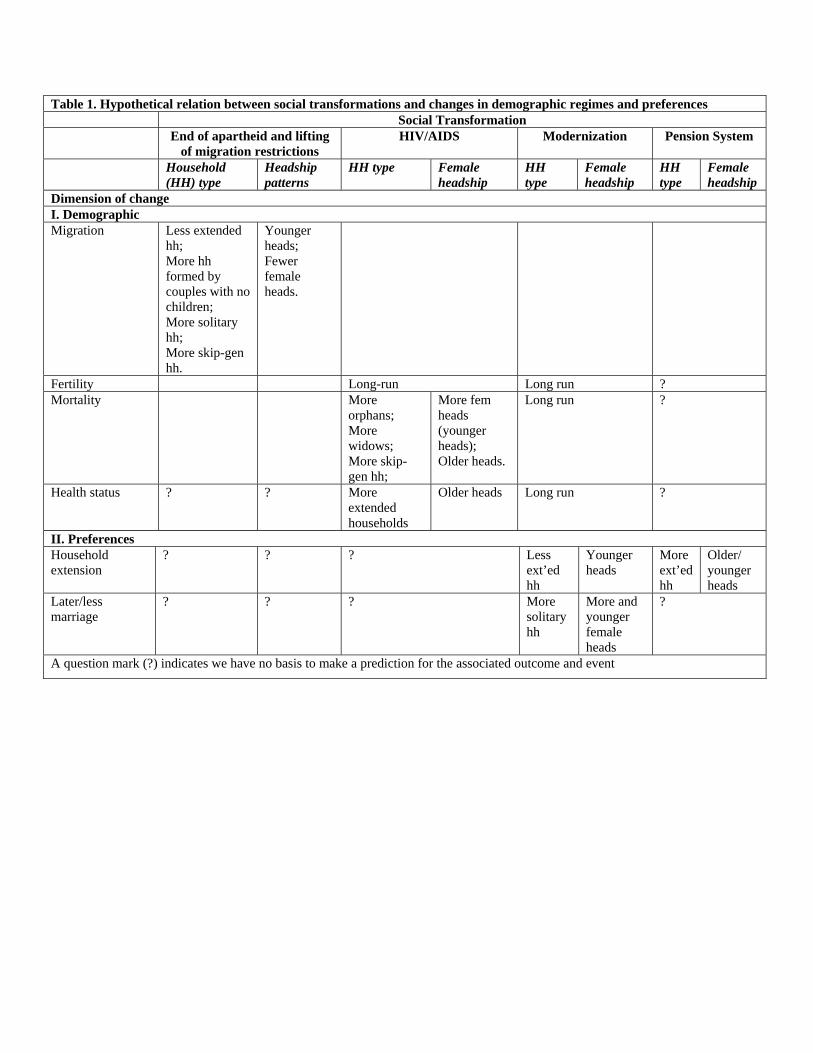
Table 1. Hypothetical relation between social transformations and changes in demographic regimes and preferences Social Transformation End of apartheid and lifting
of migration restrictions HIV/AIDS Modernization Pension System
Household (HH) type
Headship patterns
HH type Female headship
HH type
Female headship
HH type
Female headship
Dimension of change I. Demographic Migration Less extended
hh; More hh formed by couples with no children; More solitary hh; More skip-gen hh.
Younger heads; Fewer female heads.
Fertility Long-run Long run ? Mortality More
orphans; More widows; More skip-gen hh;
More fem heads (younger heads); Older heads.
Long run ?
Health status ? ? More extended households
Older heads Long run ?
II. Preferences Household extension
? ? ? Less ext’ed hh
Younger heads
More ext’ed hh
Older/ younger heads
Later/less marriage
? ? ? More solitary hh
More and younger female heads
?
A question mark (?) indicates we have no basis to make a prediction for the associated outcome and event
Table 2. Effect of alpha and beta on standard schedule of female headship. South Africa, 1991-2001.
Models which do not control for household typeAll women African women
1991 1996 2001 1991 1996 2001
alpha -0.25 0.05 0.30 -0.30 -0.06 0.24beta 1.12 0.98 1.02 1.09 0.89 0.99
Models which control for household typeAll women African women
1991 1996 2001 1991 1996 2001
alpha -0.39 -0.10 0.16 -0.36 -0.19 0.11beta 1.14 1.02 1.08 1.14 0.94 1.05
Sources: 1991 RSA census, 10% sample. 1996 South Africa census, 10% sample. 2001 South Africa census, 10% sample.
Table 3A: Estimated coefficients from a logit model predicting female headship. South Africa, all women.
Note: **p<0.01, * p<0.05
1991 1996 2001 Variable b se b se b se Logit (std) Primary Middle High school Tertiary (No education) Unmarried Divorced Widowed (Married) Eastern Cape Northern Cape Free State KwaZulu Natal North West Gauteng Mpumalanga Limpopo (WesternCape) African Coloured Indian (White) Intercept
.971** .089** -.026 .565** .221** .552** 2.47** 2.27** .038 .093 -.076 .546** -.195 -.266** .238** 1.190** .491** .075** -.951** -1.690**
.013 .031 .037 .055 .069 .034 .047 .034 .060 .062 .081 .055 .124 .050 .052 .052 .036 .034 .040 .051
.958** -.006 -.026** -.020* -.036** .592** 2.237** 2.05** .333** -.084** -.191** -.052** -.099** -.176** -.033* .374** 1.069** .2028** -.416** -1.350**
.003 .007 .008 .009 .007 .006 .012 .009 .011 .019 .014 .011 .013 .011 .014 .012 .009 .013 .019 .013
1.029** .066** .018* -.017* .239** .769** 2.130** 1.979** .102** -.025 -.165** -.089** -.154** -.018 -.019 .238** 1.008** .216** -.279** -1.131**
.003 .007 .007 .008 .010 .006 .012 .008 .010 .018 .013 .010 .012 .010 .012 .011 .009 .012 .019 .012
Table 3B: Estimated coefficients from a logit model predicting female headship. South Africa, all women
Note: **p<0.01, * p<0.05
1991 1996 2001 Variable b se b se b se Logit (std) Primary Middle High school Tertiary (No education) Unmarried Divorced Widowed (Married) Eastern Cape Northern Cape Free State KwaZulu Natal North West Gauteng Mpumalanga Limpopo (WesternCape) African Coloured Indian (White) Couple Incomp nuclear Extended Skipped Complex Other (Nuclear) Intercept
1.122** .122** -.005 .610** .128 -.582** 1.520** 1.427** -.006 .080 -.112 .373** -.039 -.189** .238** .878** .619** .484** -.581** .371** 4.696** 2.215** 2.475** 1.937** 2.174** -3.71**
.017 .036 .045 .07 .081 .045 .055 .039 .079 .076 .098 .071 .197 .072 .069 .069 .045 .046 .047 .13 .10 .111 .131 .108 .111 .132
1.019** -.003 -.027** .001 -.027** -.184** 1.430** 1.427** .297** -.017 -.174** -.024 .048** -.145** .057** .307** 1.401** .771** -.048 .348** 3.422** 1.050** 1.547** 1.280** 1.370** -2.840**
.0039 .0085 .008 .0102 .0083 .0076 .0137 .0097 .0138 .0228 .016 .0139 .015 .0141 .0165 .0149 .012 .0165 .0240 .0168 .0110 .0105 .0140 .0150 .0111 .0188
1.100** .054** .040** -.027** .176** -.041** 1.268** 1.429** .152** .039 -.068** .032* .032* .058** .109** .247** 1.279** .696** -.043 .231** 3.178** .498** .961** .838* 1.155** -2.182**
.0035 .007 .0075 .009 .0118 .0067 .0126 .009 .0122 .0204 .0150 .0123 .0139 .0121 .0145 .0134 .0124 .0154 .0234 .0140 .0098 .0091 .0121 .0161 .0094 .0174
Table 4. Decomposition of changes in the estimated probability of female headship. South Africa, 1991-1996 and 1996-2001: All population groups
1991-1996 period
Composition Effects Propensity Effects
Percent due to effect Total diff. Age Education Marital Province Pop Group HH Type Percent due to effect Tot diff Intercept Age Education Marital Province Pop Group HH Type
20.6 1.1 0.2 0.3 -0.5 -0.3 1.1 79.4 4.2 3.8 0.1 -1.4 -0.3 -2.7 4.8
10.3 0.5 0.4 0.2 -0.6 -0.2 0.9 -0.8 89.7 4.1 6.7 0.8 -1.0 0.9 -1.3 5.0 -7.1
1996-2001 period
Composition Effects Propensity Effects
Percent due to effect Total diff. Age Education Marital Province Pop Group HH Type Percent due to effect T.D. Intercept Age Education Marital Province Pop Group HH Type
34.3 1.3 1.0 -0.3 0.2 -0.1 0.2 65.7 2.5 2.8 -1.0 1.0 0.8 -0.4 -0.6
23.4 0.8 1.1 -0.2 0.1 -0.1 0.1 -0.7 76.6 2.7 6.5 -0.8 0.6 0.4 0.2 -1.1 -3.2
Sources: 1991 census; 1996 census, 10% sample; 2001 census, 10% sample.
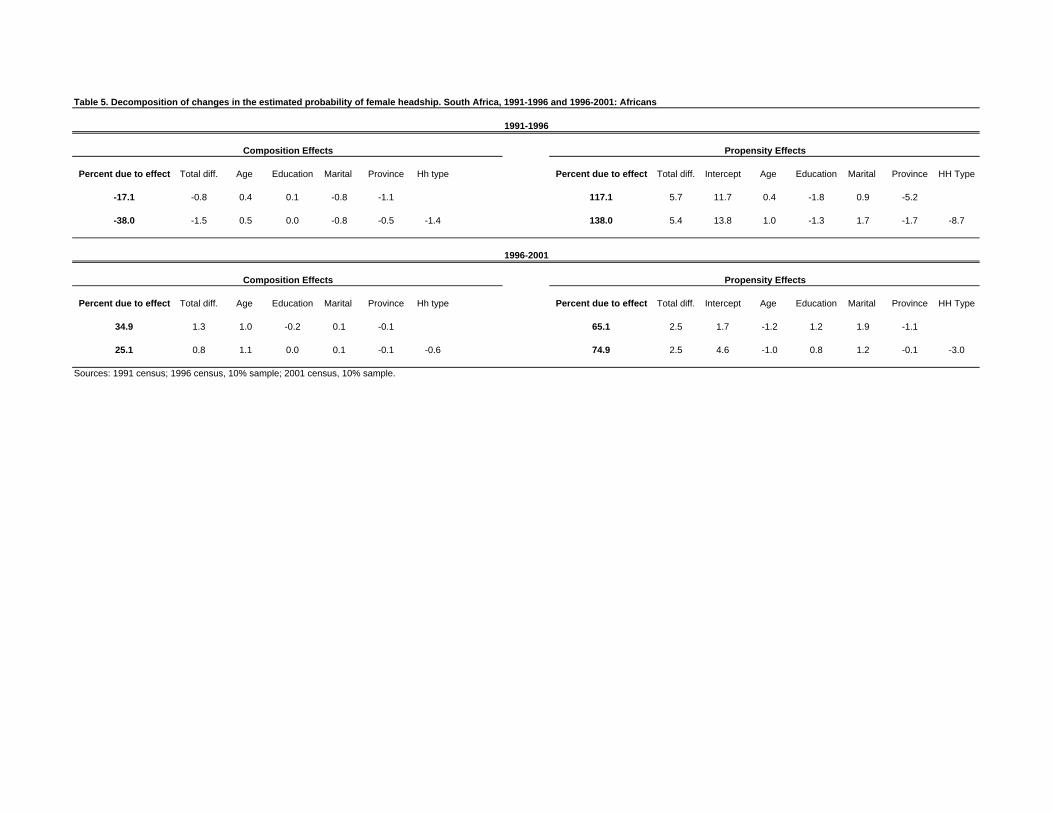
Table 5. Decomposition of changes in the estimated probability of female headship. South Africa, 1991-1996 and 1996-2001: Africans
1991-1996
Composition Effects Propensity Effects
Percent due to effect Total diff. Age Education Marital Province Hh type Percent due to effect Total diff. Intercept Age Education Marital Province HH Type
-17.1 -0.8 0.4 0.1 -0.8 -1.1 117.1 5.7 11.7 0.4 -1.8 0.9 -5.2
-38.0 -1.5 0.5 0.0 -0.8 -0.5 -1.4 138.0 5.4 13.8 1.0 -1.3 1.7 -1.7 -8.7
1996-2001
Composition Effects Propensity Effects
Percent due to effect Total diff. Age Education Marital Province Hh type Percent due to effect Total diff. Intercept Age Education Marital Province HH Type
34.9 1.3 1.0 -0.2 0.1 -0.1 65.1 2.5 1.7 -1.2 1.2 1.9 -1.1
25.1 0.8 1.1 0.0 0.1 -0.1 -0.6 74.9 2.5 4.6 -1.0 0.8 1.2 -0.1 -3.0
Sources: 1991 census; 1996 census, 10% sample; 2001 census, 10% sample.