Embed Size (px)
Citation preview
1
Changes in the soluble and insoluble compounds of shelf-stable orange juice in relation to non- enzymatic 1
browning during storage 2
3
Huong T. T. Phama*, Mona Bazmawea, Biniam Kebedea, b, Carolien Buvéa, Marc E. Hendrickxa and Ann M. Van 4
Loeya** 5
6
aKU Leuven, Department of Microbial and Molecular Systems (M2S), Laboratory of Food Technology, 7
Kasteelpark Arenberg 22 box 2457, 3001 Heverlee, Belgium 8
9
Current affiliation 10
bUniversity of Otago, Department of Food Science, Box 56, Dunedin 9054, New Zealand 11
12
13
14
15
16
* Author to whom correspondence should be addressed during submission process 17
Telephone: +32 16 37 42 84 18
E-mail: [email protected] 19
20
21
**Author to whom correspondence should be addressed on post-publication 22
Telephone: +32 16 32 15 67 23
E-mail: [email protected] 24
25
2
ABSTRACT 26
For the first time in literature, this study revealed the participation of polymeric components of orange 27
juice cloud and pulp (such as proteins, arabinogalactan proteins, or protein-pectin complexes) during non-28
enzymatic browning. In a quest to better understand the non-enzymatic browning of shelf-stable orange 29
juice during storage, the juice was fractionated into different fractions depending on the solubility in 30
water/ethanol and the obtained fractions were characterized. The results showed that brown compounds 31
formed during storage of orange juice distributed over water insoluble (pulp), ethanol insoluble (cloud), and 32
ethanol soluble (serum) fractions. In the ethanol insoluble fraction, the brown compounds are hypothesized 33
to be associated with proteins, arabinogalactan proteins and/or protein-pectin complexes of this fraction 34
without significantly changing their molecular weight distribution, monosaccharide composition, and protein 35
content. The changes in the ethanol soluble fraction including ascorbic acid degradation, acid-catalyzed 36
hydrolysis of sucrose, and formation of furfural and 5-hydroxymethylfurfural were highly correlated to the 37
browning development of the juice during storage. 38
KEYWORDS 39
Non-enzymatic browning; orange juice; storage; fractionations, soluble compounds, insoluble compounds 40
3
INTRODUCTION 41
Orange juice is one of the most popular and widely consumed juices in the world owing to its attractive 42
color, refreshing taste, and high nutritional value. Among the quality attributes of orange juice appreciated 43
by consumers, its bright orange color has been highlighted as largely influencing consumer acceptance.1 44
Unfortunately, upon storage, an unacceptable brownish color appears which limits the product’s shelf-life 45
and negatively influences consumers’ purchasing behavior.2 In shelf-stable orange juice, the formation of a 46
brown color during storage is mainly attributed to non-enzymatic browning (NEB).3–5 Besides orange juice, 47
NEB is also known to be a main cause of color deterioration during storage of other shelf-stable fruit juices 48
such as lemon juice, grapefruit juice, strawberry juice, mango juice, and apply juice. 6–10 49
Non-enzymatic browning in orange juice has been proposed in literature to involve multiple pathways, 50
namely ascorbic acid (AA) degradation, acid-catalyzed sugar degradation, and Maillard-associated 51
reactions.3,11–14 Most studies have attempted to quantitatively investigate the changes in NEB precursors 52
such as AA, glucose, and fructose or the formation of NEB intermediates like furfural, 53
5- hydroxymethylfurfural (HMF) and their relationship to browning during storage.5,13,15,16 Nonetheless, the 54
mechanisms of NEB are rather complex and have not been fully elucidated. Although the chemical structures 55
and the reaction pathways leading to various chromophores in model system of amino acids and pentoses 56
or hexoses have been described17, this classical Maillard reaction type is reported to be of minor importance 57
in citrus juice browning (including orange juice) during storage because of the high acidity involved.15 58
Orange juice is a complex system consisting of a serum phase (e.g. organic acids, sugars), and cloud and 59
pulp (e.g. proteins, polysaccharides) which have different solubility in water and/or ethanol thereby enabling 60
the separation of orange juice into different fractions.18,19 Although all these fractions are simultaneously 61
present in the orange juice, only the soluble compounds present in the serum such as AA and sugars have 62
received attention so far in studies related to NEB in citrus juices.3,5,12 On the other hand, the contribution of 63
insoluble compounds present in the cloud and pulp to the browning has not been investigated yet. 64
Nevertheless, in other food matrices such as coffee brew, brown compounds (i.e. melanoidines) are 65
commonly found to be associated with polymers including polysaccharides and proteins.20 Additionally, it 66
has also been proposed that the brown melanoidins might be formed by the crosslinking of low molecular 67
4
weight chromophores and high molecular weight colorless proteins.21 Therefore, we hypothesize that the 68
brown compounds which are formed in pasteurized shelf-stable orange juice during storage might also be 69
associated with naturally occurring polymers in the juice cloud and pulp. In addition, although the 70
composition of orange juice cloud has been well documented in literature,19,22,23 its changes during storage 71
are not studied yet. Hence, it was of interest to investigate the changes in the insoluble (cloud and pulp) and 72
soluble (serum) compounds of orange juice in relation to NEB during storage. 73
The main objective of this study was to gain a better understanding of NEB of orange juice during storage 74
through simultaneously (i) investigating the distribution of brown compounds over different fractions of 75
orange juice obtained through (stepwise-)fractionation and (ii) characterizing the changes in insoluble and 76
soluble compounds in relation to NEB. For these purposes, pasteurized shelf-stable orange juice was stored 77
at an elevated temperature (42 °C) for varying times. The non-stored and stored orange juice was 78
fractionated into water/ethanol insoluble and soluble fractions. The insoluble compounds were 79
characterized for their molecular weight distribution, monosaccharide composition, and protein content, and 80
changes in the soluble compounds such as AA, sugars, furfural, and HMF with storage time were quantified 81
as well. 82
MATERIALS AND METHODS 83
Materials 84
A single batch of freshly produced single strength shelf-stable orange juice (Minute Maid®) filled in 85
60 polyethylene terephthalate (PET) bottles of 330 mL was used in this study. The juice was reconstituted 86
from concentrate. pH and total soluble solid content (°Brix) of the orange juice were 3.9 and 11.3, 87
respectively, which remained unchanged during storage. 88
Storage and sampling of the orange juice 89
To generate samples at different storage moments in a short timeframe, an elevated temperature of 90
42 °C was applied for storage in the present study. This temperature was selected since previous work13 has 91
confirmed that storage of shelf-stable single strength orange juice at 42 °C only accelerates the NEB process 92
without including new reaction pathways. The orange juice was stored for 15 weeks at 42 °C in an incubator 93
5
protected from light. Sampling was done prior to the storage and at three different storage moments (5, 10, 94
and 15 weeks). At each sampling moment, 15 orange juice bottles were randomly taken from the incubators, 95
mixed, and uniformly divided into smaller portions. These tubes were frozen in liquid nitrogen and stored at 96
-40 °C until use. Prior to analysis, samples were thawed in a circulating water bath at 20 °C for a standardized 97
time and vortexed. 98
Color measurement 99
Color of the orange juice was measured using a Hunterlab ColorFlex® EZ colorimeter (D65 illuminant, 100
45°/ 0° geometry, and 10° observer angle, operating in a reflection mode) at room temperature. Prior to the 101
measurement, the instrument was calibrated with a standard black and white ceramic tile. To make the 102
measurements, a glass container was filled with 5 mL of sample, closed with a white ceramic plate and 103
covered with a black cylinder. Color measurement was performed in triplicate with five readings for each 104
sample. Color results were expressed as CIE L*a*b* value The L* value represents lightness, ranging from black 105
(0) to white (100). The a* and b* values indicate color direction green (-a*)/red (+a*) and blue (-b*)/ yellow 106
(+b*), respectively. These values were used to calculate the total color difference (ΔE*) (Eq. (1)) which is a 107
measure of the difference in color between the pasteurized stored sample and the pasteurized non-stored 108
sample (i.e. a control sample, subscript 0 in Eq. (1)). 109
∆𝐸∗ = √(𝐿∗ − 𝐿0∗ )2 + (𝑎∗ − 𝑎0
∗)2 + (𝑏∗ − 𝑏0∗)2 (1) 110
Browning index measurement 111
Browning index (BI) of the orange juice was determined using a spectrophotometric method described 112
by Klim & Nagy24 with slight modifications. The juice was centrifuged at 1000xg, 4 °C for 15 min (J2-HS 113
centrifuge, Beckman, Brea, CA, US) and the supernatant was collected. Subsequently, the supernatant was 114
mixed with 95% ethanol in a ratio 1:1, and the obtained solution was placed in an ice bath for 15 min for 115
flocculation, followed by a second centrifugation step (1000xg, 4 °C, and 15 min). The supernatant was 116
filtered (0.45 μm, hydrophilic) and the absorbance was measured at 420 nm using a spectrophotometer. 117
6
Fractionation of the ethanol soluble and ethanol insoluble fraction of orange juice 118
Orange juice is comprised of serum, cloud, and pulp. While the orange juice pulp consists of the large 119
particles (> 2 μm) that tend to settle upon storage and are pelletable under a mild centrifugation 18, the 120
orange juice cloud can be separated from the serum based on their difference in ethanol solubility. 121
Therefore, centrifugation and ethanol precipitation (at 70% ethanol) were used to separate these three 122
fractions of orange juice25–27. Furthermore, the orange juice cloud (ethanol insoluble fraction) is rich in 123
polymers such as pectin, proteins, celluloses, and hemicelluloses 18,19 which may be selectively precipitated 124
at different ethanol concentrations.26 Hence, a stepwise ethanol precipitation procedure with increasing 125
ethanol concentration was carried out to further fractionate the ethanol insoluble fraction into different sub-126
fractions. 127
Ethanol precipitation 128
Centrifugation and ethanol precipitation were applied to separate the serum, cloud, and pulp fractions. 129
A schematic overview of this step is shown in Figure 2A in the results and discussion section. Specifically, 130
200 mL of the juice was mildly centrifuged (1000xg, 4 °C, and 10 min) (J2-HS centrifuge, Beckman, Brea, CA, 131
US) to separate the large cell wall fragments (i.e. orange juice pulp) from the supernatant which contains 132
orange juice serum and cloud. The pellet was washed with ultrapure water, centrifuged (10000xg, 4 °C, and 133
15 min), suspended in ultrapure water, and lyophilized. To the supernatant, absolute ethanol was added 134
under continuous stirring until an ethanol concentration of 70% (v/v) was reached. The mixture was kept 135
overnight in centrifuge bottles at 4 °C for precipitation. The precipitation conditions (70% ethanol and 4 °C) 136
were chosen to maximize the amount of precipitated polymers. The mixture was centrifuged (10000xg, 4 °C, 137
and 15 min), and the ethanol precipitated material was washed with 70% (v/v) ethanol solution, centrifuged 138
(10000xg, 4 °C, and 15 min), dissolved in ultrapure water, and lyophilized resulting in a 70% ethanol 139
precipitated fraction (EP). The supernatant was subjected to a solvent evaporation using a rotavapor at 40 140
°C to remove ethanol yielding an ethanol soluble fraction (ES). In addition, carotenoids were removed from 141
all the fractions extracting with a solvent mixture containing hexane, ethanol, and acetone (2:1:1 (v/v/v)). 142
After that they were lyophilized yielding three fractions, namely the pellet, the EP, and the ES which were 143
stored in a desiccator until further use or analysis. 144
7
Stepwise ethanol precipitation 145
Since different types of polymers (polysaccharides and proteins) may be precipitated at different ethanol 146
concentrations, stepwise ethanol precipitation was used to further fractionate the 70% ethanol precipitated 147
fraction (EP) following a procedure adapted from Bekedam et al.28 Readers are referred to Figure 2B in the 148
results and discussion section for a visualization of this step. The lyophilized EP was dissolved overnight in 149
ultrapure water, then absolute ethanol was slowly added until an ethanol concentration of 20% was reached. 150
The solution was kept for precipitation and then centrifuged (10000xg, 4 °C, and 15 min) (J2-HS centrifuge, 151
Beckman, Brea, CA, US) to separate the supernatant and the residue. The residue was washed with 70% 152
ethanol and centrifuged (10000xg, 4 °C, and 15 min) while the supernatant was subjected to further ethanol 153
precipitation in which the ethanol concentration was stepwise increased to 40 and 60% following the same 154
procedure. Ethanol was removed by evaporation and the obtained fractions were lyophilized yielding EP20, 155
EP40 and EP60 for the materials that precipitated at 20, 40 and 60% ethanol, respectively and ES60 for the 156
soluble material at 60% ethanol. All the lyophilized fractions were stored in a desiccator until further analysis. 157
Characterization of the insoluble compounds 158
Molecular weight distribution 159
The molecular weight distribution of the samples was analyzed based on the work of Shpigelman et al.29 160
High performance size exclusion chromatography was performed on a series of three columns with exclusion 161
limits of 8x10⁴, 4x10⁶, and 1x10⁷ g mol-1, respectively, in combination with a guard column. Elution took place 162
at 35 °C with 0.1 M acetic acid in 0.1 M NaCl (pH 4.4) at 0.5 mL min-1. The eluent was monitored by refractive 163
index detection in combination with light scattering detection, and the absorbance was measured at 280 nm 164
by diode array detection in the Agilent 1200 system. Lyophilized samples were dissolved overnight in eluent 165
buffer and filtered (0.45 μm, hydrophilic) prior to injection (100 μL). All the samples were analyzed in 166
duplicate. 167
Monosaccharide composition analysis 168
Monosaccharides including neutral sugars and galacturonic acid were determined using high 169
performance anion exchange chromatography combined with pulsed amperometric detection following the 170
8
method described previously30 with some modifications. For hydrolysis of polysaccharides to 171
monosaccharides, 1 mg of the lyophilized sample was dissolved overnight in 1 mL ultrapure water and 80 μL 172
was dried in a test tube under a nitrogen evaporator at 45 °C. Next, 2 mL of 2M methanolic HCl was added 173
to the tube and gently mixed, then the methanolysis was carried out at 80 °C for 16 h in an oil bath. After 174
cooling to ambient temperature, the samples were dried at 30 °C under a nitrogen evaporator. Subsequently, 175
2 mL of 2M trifluoroacetic acid (TFA) was added to the samples and acid hydrolysis was done incubating the 176
samples at 121 °C for 1 h. The samples were cooled to ambient temperature and dried under a nitrogen 177
evaporator at 45 °C to remove TFA. Dried samples were dissolved in 400 µL of ultrapure water and filtered 178
(0.45 μm, hydrophilic) into dark brown vials with glass inserts for the analysis. The hydrolysis procedure was 179
performed in duplicate. 180
The determination of monosaccharides was performed on a HPLC (Dionex, Sunnyvale, CA, USA) equipped 181
with a CarboPacTM PA20 column, a CarboPac PA20TM guard column and an ED50 electrochemical detector. 182
The system was equilibrated for 5 min using 100 mM NaOH and for additional 5 min using 0.5 or 25 mM 183
NaOH depending on the eluent concentration used during sample elution. Samples (10 μL) were injected and 184
eluted at a flow rate of 0.5 mL min-1 with eluent concentration of 0.5 mM in order to detect fucose, rhamnose, 185
arabinose, galactose, glucose, xylose, mannose, and galacturonic acid. The analysis of the samples was 186
repeated using a 25 mM eluent concentration to obtain a better peak resolution for rhamnose and arabinose. 187
Commercial neutral sugar standards at different concentrations were used as external standards for 188
identification and quantification. 189
Protein analysis 190
Total nitrogen content of the samples was determined by the Dumas method using an EA 1108 elemental 191
analyzer. Protein content in the sample was calculated from the nitrogen content using a nitrogen-to-protein 192
conversion factor of 6.25.31 All samples were analyzed in duplicate. 193
9
Analysis of the soluble compounds related to non-enzymatic browning 194
Determination of the ascorbic acid and dehydroascorbic acid content 195
The determination of the ascorbic acid (AA) and dehydroascorbic acid (DHAA) content was performed 196
following a method proposed by Wibowo et al.13 Sample was mixed with extraction buffer (1% (w/v) m-197
phosphoric acid with 0.5% (w/v) oxalic acid, pH 2.0) in a ratio 1:3 (v/v). Subsequently, the mixture was 198
centrifuged (24000xg, 4 °C, and 15 min) (J2-HS centrifuge, Beckman, Brea, CA, US). pH of the obtained 199
supernatant was adjusted to 3.5 using 1M NaOH or 1M HCl. To determine the AA content, phosphate buffer 200
(20 mM NaH2PO4 + 1 mM Na2EDTA, pH 3.5) was added to part of the pH-adjusted supernatant in a ratio 2:1 201
and the mixture was filtered (0.45 μm, hydrophilic) prior to the HPLC analysis. The DHAA content was 202
quantified indirectly after reduction to AA by adding a reducing agent (TCEP 2.5 mM tris (2-carboxyl-ethyl) 203
phosphine in phosphate buffer, pH 3.5) to the other part of the pH-adjusted supernatant in a ratio 2:1 (v/v). 204
The mixture was centrifuged (19900xg, 23 °C, and 15 min) (Microfuge 22R, Beckman Coulter) and filtered 205
(0.45 μm, hydrophilic). 206
The analysis of AA was performed in a HPLC (Dionex, Sunnyvale, CA, USA) with an AD25 UV-Vis detection 207
at 245 nm. A prevail C18 column (250x4.6 mm, 5 μm particle size) with a corresponding guard column was 208
used for chromatographic separation. The mobile phase was a solution of 1 mM Na2EDTA and 10 mM 209
CH3COONH4 and an isocratic elution at 0.8 mL min-1 and 25 °C was performed. The injection volume was 25 μL. 210
Quantification was carried out using a calibration curve of AA in extraction buffer. 211
Determination of the sugar content 212
Sugar extraction and HPLC analysis were performed following the method of Vervoort et al.32 with slight 213
modifications. The sugar extraction was carried out in triplicate adding 50 μL of Carrez I (15% w/v K4[Fe(CN)6]) 214
and Carrez II (30% w/v ZnSO4) to 1 mL of sample. The mixture was vortexed, kept for 30 min (room 215
temperature), and centrifuged (19900xg, 4 °C, and 15 min) (Microfuge 22R, Beckman Coulter). The 216
supernatant was filtered (0.45 μm, hydrophilic) and 2 μL of a 10-fold dilution of the filtrate was injected into 217
the HPLC system. The analysis was performed using a HPLC (Agilent 1200 series, Santa Clare, CA, USA) with 218
evaporative light scattering detection. Separation was carried out on a Prevail C18 column (250x4.6 mm, 5 219
μm particle size), coupled to a Prevail C18 guard cartridge (7.5×4.6 mm, 5 μm particle size) at 30 °C using 220
10
isocratic elution with 75% (v/v) acetonitrile/water at 1 mL min- 1. Sugar standards (fructose, glucose, and 221
sucrose) were used for identification based on retention time, and standard curves were prepared for 222
quantification. 223
Determination of furfural and HMF content 224
Furfural and HMF were analyzed based on the previously described method13,32 with some modifications. 225
The extraction of furfural and HMF was performed in triplicate mixing 500 μL of each Carrez I reagent and 226
Carrez II reagent with 10 mL of the sample. Subsequently, the sample was kept at room temperature for 227
30 min and centrifuged (24000xg, 4 °C and 15 min) (J2-HS centrifuge, Beckman, Brea, CA, US). After that, 1 228
mL of the supernatant was applied on a C18 SPE pre-column (Sep-PAK Water, Milford, USA), preconditioned 229
with 2 mL methanol and 5 mL 0.5% acetic acid. Subsequently, 2 mL of ultra-pure water was used to wash the 230
SPE column, then 4.5 mL ethyl acetate was applied on the column to elute furfural and HMF, and the resulting 231
mixture was dried with anhydrous sodium sulphate. The eluate was filtered (0.45 μm, hydrophilic) and the 232
volume was adjusted to 5 mL with ethyl acetate. The chromatographic analysis was carried out in a HPLC 233
system (Agilent 1200 series, Santa Clare, CA, USA) with a UV-Vis detection. The separation was done using a 234
Zorbax Eclipse XDB C18 column (150×4.6 mm, 5 μm particle size) coupled to a Prevail C18 guard cartridge, at 235
25 °C and acetonitrile/water 5/95 (v/v) as mobile phase at 1 mL min-1 isocratic elution. Furfural was detected 236
at 277 nm and HMF was detected at 285 nm. Furfural and HMF standards were used for identification and 237
standard curves were established for quantification. 238
Data analysis 239
One-way ANOVA using JMP statistical software (JMP Pro 14.0.0, SAS Institute Inc.) was performed to 240
determine the statistical significance of duplicate means. When the mean values of two groups (i.e. between 241
the non-stored sample and 15 week-stored samples) were compared, a student’s t-test was applied, while a 242
post-hoc test using Tukey’s honest significant difference (HSD) was used to compare the mean values of more 243
than two groups (i.e. storage times). 244
11
RESULTS AND DISCUSSION 245
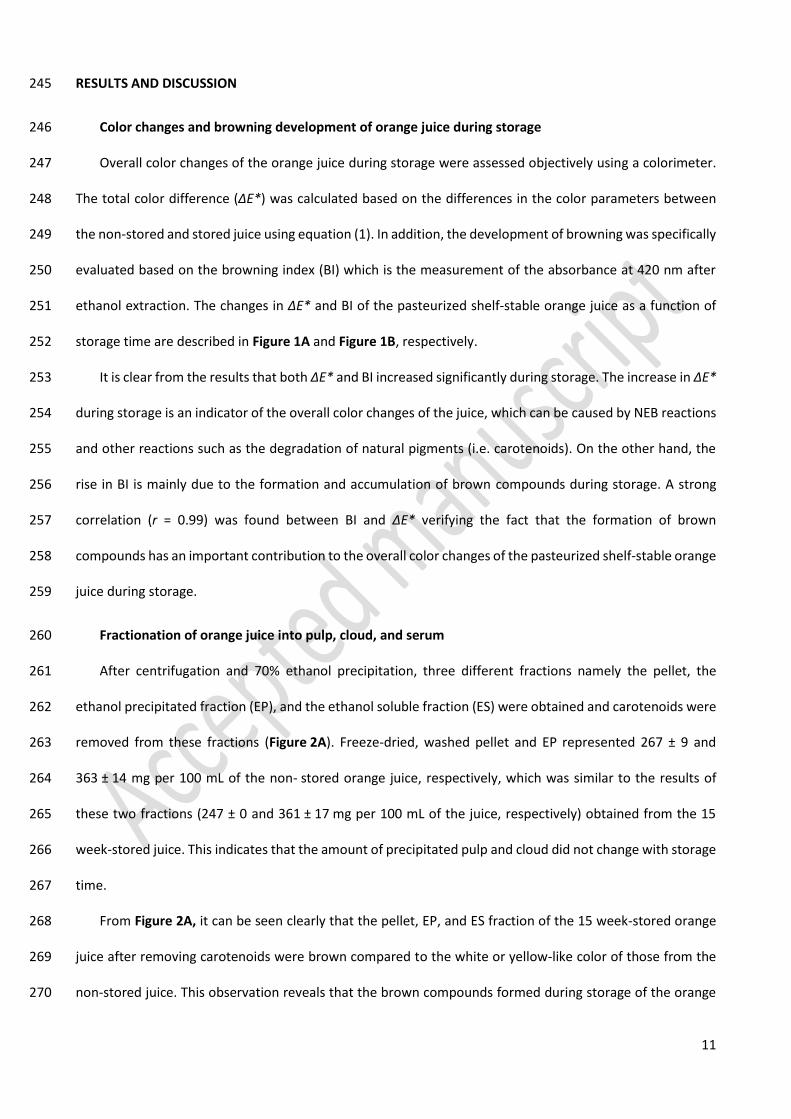
Color changes and browning development of orange juice during storage 246
Overall color changes of the orange juice during storage were assessed objectively using a colorimeter. 247
The total color difference (∆E*) was calculated based on the differences in the color parameters between 248
the non-stored and stored juice using equation (1). In addition, the development of browning was specifically 249
evaluated based on the browning index (BI) which is the measurement of the absorbance at 420 nm after 250
ethanol extraction. The changes in ∆E* and BI of the pasteurized shelf-stable orange juice as a function of 251
storage time are described in Figure 1A and Figure 1B, respectively. 252
It is clear from the results that both ∆E* and BI increased significantly during storage. The increase in ∆E* 253
during storage is an indicator of the overall color changes of the juice, which can be caused by NEB reactions 254
and other reactions such as the degradation of natural pigments (i.e. carotenoids). On the other hand, the 255
rise in BI is mainly due to the formation and accumulation of brown compounds during storage. A strong 256
correlation (r = 0.99) was found between BI and ∆E* verifying the fact that the formation of brown 257
compounds has an important contribution to the overall color changes of the pasteurized shelf-stable orange 258
juice during storage. 259
Fractionation of orange juice into pulp, cloud, and serum 260
After centrifugation and 70% ethanol precipitation, three different fractions namely the pellet, the 261
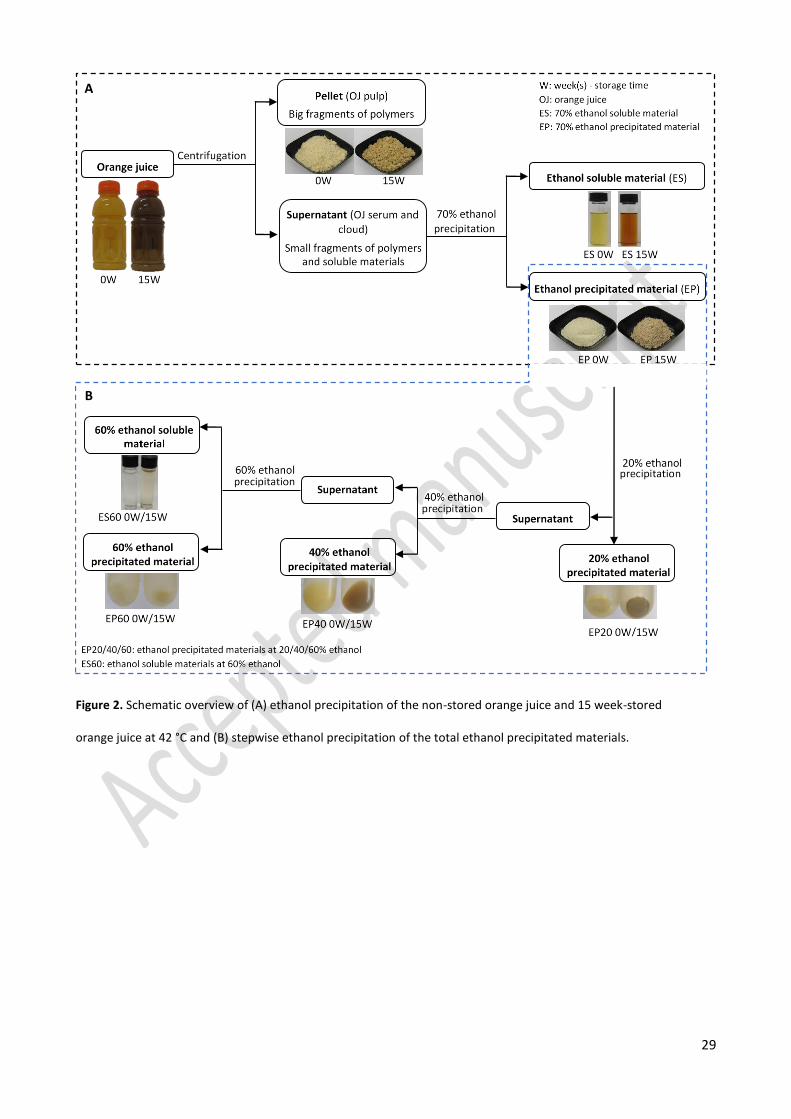
ethanol precipitated fraction (EP), and the ethanol soluble fraction (ES) were obtained and carotenoids were 262
removed from these fractions (Figure 2A). Freeze-dried, washed pellet and EP represented 267 ± 9 and 263
363 ± 14 mg per 100 mL of the non- stored orange juice, respectively, which was similar to the results of 264
these two fractions (247 ± 0 and 361 ± 17 mg per 100 mL of the juice, respectively) obtained from the 15 265
week-stored juice. This indicates that the amount of precipitated pulp and cloud did not change with storage 266
time. 267
From Figure 2A, it can be seen clearly that the pellet, EP, and ES fraction of the 15 week-stored orange 268
juice after removing carotenoids were brown compared to the white or yellow-like color of those from the 269
non-stored juice. This observation reveals that the brown compounds formed during storage of the orange 270
12
juice distributed over water/ethanol insoluble and ethanol soluble fractions. It has been stated that orange 271
juice pulp and cloud are rich in cell wall polysaccharides and proteins.18,19,23 Hence, the brown compounds 272
present in the pellet and EP fractions might be linked to water/ethanol insoluble polysaccharides and 273
proteins, while in the ES fraction, the brown compounds are possibly present in a free state. However, it 274
cannot be excluded that some of the brown compounds are long chain polymers that were also precipitated 275
together with natural occurring polymers of the juice during the ethanol precipitation step. 276
It has been intensively reported in literature that the degradation products from ascorbic acid and/or 277
sugars may polymerize in the presence or absence of amino acids to form brown compounds during storage 278
of shelf-stable citrus juices including orange juice.3,4 However, to the best of our knowledge, none of the 279
published data reveals the participation of the endogenous polymeric components of orange juice pulp and 280
cloud towards the juice browning or their association with the brown compounds. As the EP fraction (after 281
removing carotenoids) is mainly composed of polymers such as polysaccharides and proteins which may have 282
different solubility in ethanol, we intended to further fractionate this fraction using stepwise ethanol 283
precipitation with increasing concentration of ethanol in order to verify in which fractions brown compounds 284
are mainly present. 285
Further fractionation of the ethanol insoluble fraction 286
The ethanol precipitated fractions (EP) of the 15 week-stored and non-stored orange juice samples were 287
sub-fractionated with stepwise ethanol precipitation in which the concentration of ethanol was increased 288
from 20% to 40% and then to 60% (Figure 2B). Applying this method, four fractions were obtained, 20% 289
ethanol precipitated material (EP20), 40% ethanol precipitated material (EP40), 60% ethanol precipitated 290
material (EP60), and 60% ethanol soluble material (ES60). 291
For both the non-stored and 15 week-stored samples, most of the fractions were obtained in a significant 292
amount (higher than 15% w/w of starting material), except for the EP60 which only accounted for around 293
5% w/w of the starting material (EP). Although it can be noticed that all sub-fractions of the EP of 15 week-294
stored juice had a brown color, the EP20 and EP40 fractions had a much darker brown color, compared to 295
EP60 and ES60 revealing that almost all the brown compounds from the EP fraction stayed in the EP20 and 296
EP40 fractions which were precipitated at low ethanol concentrations (20 and 40%, respectively). 297
13
Characterization of the ethanol insoluble fraction and sub-fractions 298
The ethanol insoluble fraction (EP) (i.e. cloud) of orange juice, which contains mainly polysaccharides and 299
proteins19,22,23, also turned brown during storage. Therefore, it was of interest to verify whether the presence 300
of brown compounds in this fraction would change its physicochemical characteristics such as molecular 301
weight distribution, monosaccharide composition, and protein content. The characterization was made for 302
the EP and its sub-fractions (EP20, EP40, EP60, and ES60) of the 15 week-stored orange juice in comparison 303
to those of the non-stored juice. 304
Molecular weight distribution 305
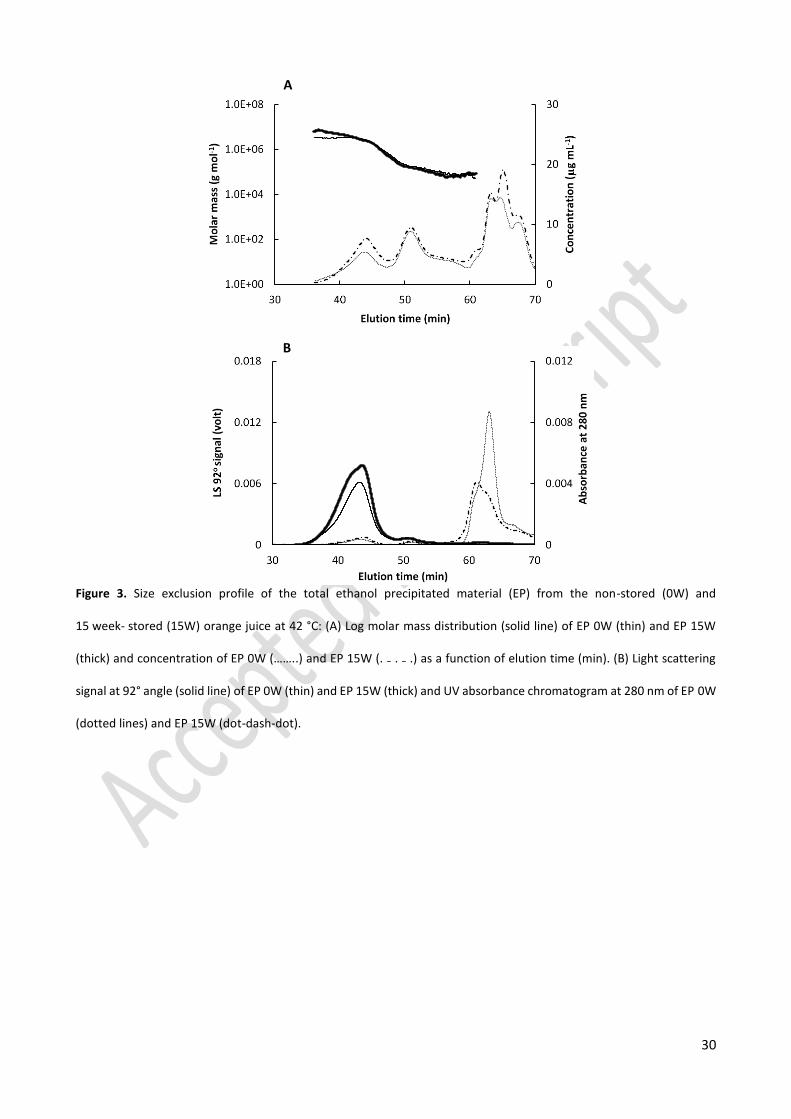
To investigate the effect of the presence of brown compounds to the EP fraction on the size of polymers 306
in these fractions, the molecular weight distribution of the EP from the 15 week-stored (EP 15W) and non-307
stored (EP 0W) juice were compared in Figure 3. Based on the concentration profile (dotted lines), the 308
EP 15W fraction, which had a brown color, consisted of two polymer populations with retention times from 309
35.5 min to 47.5 min and from 47.5 min to 60.0 min having a weight average molecular weight (Mw) of 2670 310
and 139 kDa, respectively. The materials that were eluted after 60.0 min were considered as low molecular 311
weight population. Similarly, the EP 0W fraction, which had a white color, also contained two polymer 312
populations with comparable retention times and Mw and had similar concentration profile. These results 313
revealed that the presence of brown compounds in the EP 15W fraction did not influence its molecular 314
weight distribution. Possible explanations could be that the brown compounds are small in size, or that they 315
account for a very small portion in the EP 15W fraction. Hence, their association to the large polymers in this 316
fraction does not significantly affect the overall polymer size. 317
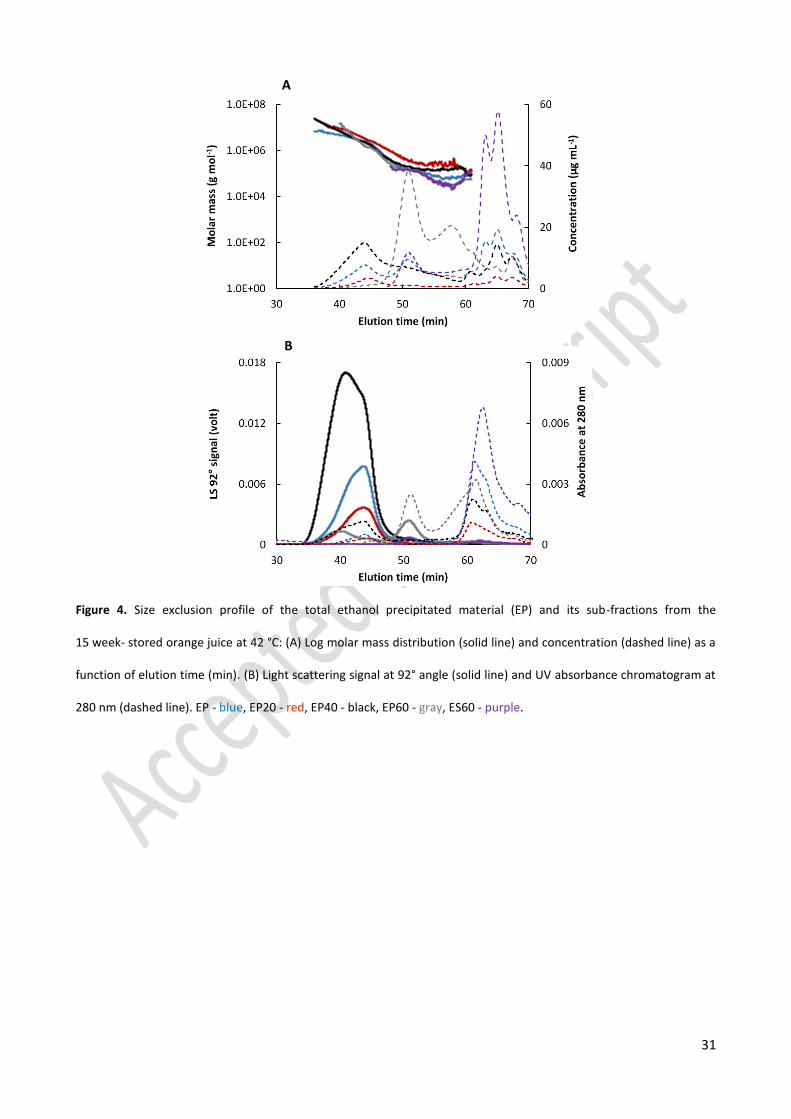
For the sub-fractions (EP20, EP40, EP60, and ES60) obtained from the EP 15W fraction, it was observed 318
that the EP20 and EP40 fractions which precipitated at 20 and 40% ethanol, respectively, contained the large 319
polymer populations of the EP 15W fraction (Figure 4). The EP60 and ES60 fractions possessed the small 320
polymer population with a high concentration, especially the EP60. From the results, it can be concluded that 321
the large polymers in orange juice cloud seem to precipitate at low ethanol concentrations while higher 322
ethanol concentrations were required to precipitate the smaller polymers. In addition, there was insignificant 323
difference in between sub-fractions of the EP 15W and EP 0W fraction (results not shown). 324
14
Monosaccharide composition 325
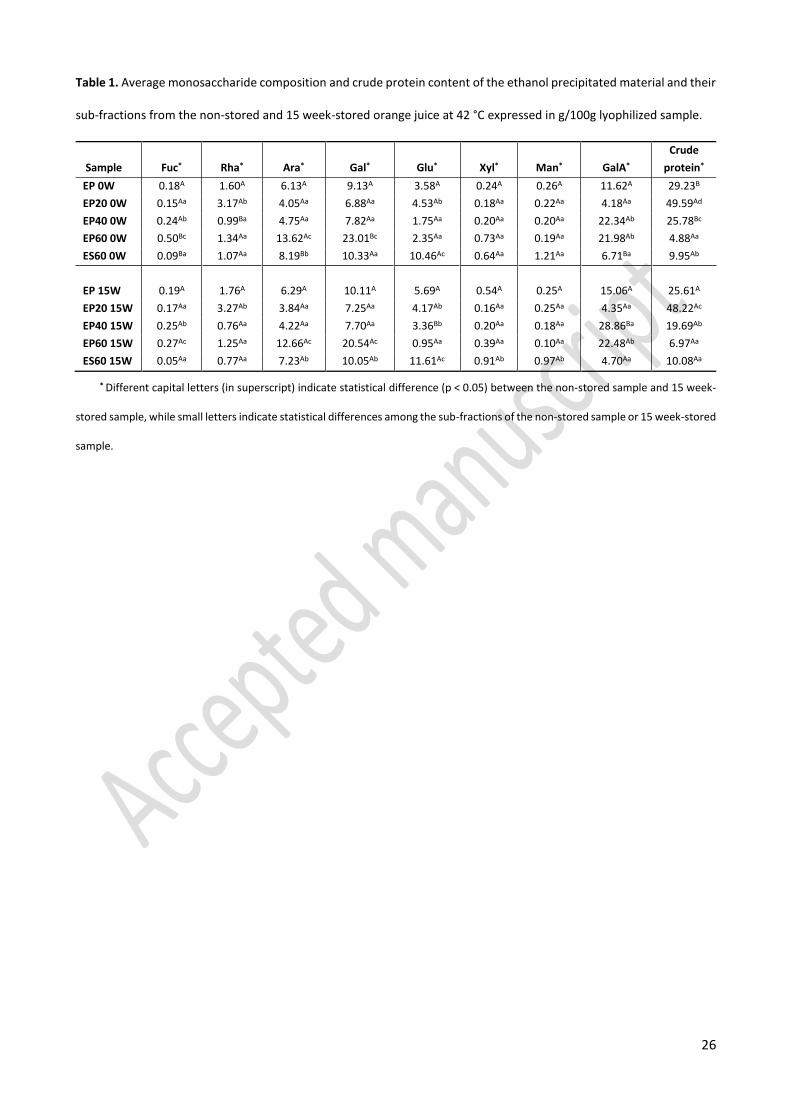
In Table 1, the monosaccharide composition of the ethanol insoluble fraction (EP) and its sub-fractions 326
(EP20, EP40, EP60, and ES60) obtained from the 15 week-stored (15W) and non-stored (0W) orange juice are 327
given. The main monosaccharide found in the EP fraction of both the non-stored and stored samples (EP 0W 328
and EP 15W) was galacturonic acid followed by galactose, arabinose, and glucose. As galacturonic acid is the 329
main monomer in pectin, the abundance of this uronic acid indicates that pectin is a predominant 330
polysaccharide in EP 0W and EP 15W. According to Klavons et al.19 pectin accounted for approximately 4.5% 331
of the orange juice cloud. These authors found that around 60% of the cloud pectin exists as previously 332
soluble pectin that is associated with insoluble proteins, 25-30% as calcium pectate and 15% as protopectin.19 333
The presence of galactose and arabinose might be related to the hydrolysis of arabinogalactan and/or the 334
side chains of pectin. The glucose residues might be a breakdown product of non-pectic polymers such as 335
celluloses and hemicelluloses or residues of the soluble sugar in orange juice that is trapped in the ethanol 336
insoluble material. According to the results, no significant difference (p < 0.05) can be observed for the 337
monosaccharide composition of the EP fraction from the non-stored and 15 week-stored juice. This means 338
that the presence of brown compounds in the EP fraction does not significantly alter its monosaccharide 339
composition. 340
Among the sub-fractions of the EP material, their monosaccharide composition did considerably vary for 341
both the non-stored and 15 week-stored samples (Table 1). Generally, the sub-fraction EP20 0W/15W 342
contained the lowest total carbohydrate content (22-23%) and possessed only about 4% of galacturonic acid 343
while this monosaccharide accounted for more than 20% of other sub-fractions precipitated at higher 344
ethanol concentrations (40 and 60%). This observation revealed that for both 0W and 15W samples, pectin 345
is more predominant among the polysaccharides in EP40 and EP60 while arabinogalactan is the most 346
important polysaccharide in EP20. Bekedam et al.20 have reported that arabinogalactan might be linked to 347
the brown compounds in coffee brew in the form of arabinogalactan proteins. This possible linkage can also 348
be valid for the brown compounds formed in orange juice during storage based on the intensive brown color 349
of the EP20 fraction of 15 week-stored orange juice and its considerable content of arabinogalactan. 350
However, the presence of brown compounds did not significantly alter the monosaccharide composition of 351
15
the sub-fractions when a comparison was made between the non-stored and 15 week-stored samples. The 352
most possible reasons could be that those monosaccharides studied are not present in the structure of the 353
brown compounds or the brown compounds just account for a small part of the polymer material. 354
Protein content 355
The protein content of the ethanol insoluble fraction (EP) and its sub-fractions is considered as a crude 356
protein content (Table 1) since no corrections were made for nitrogen from the non-protein nitrogen 357
containing compounds. The EP 0W possessed around 29% (w/w) of proteins which was significantly higher 358
than the protein content of the EP 15W. These results are in accordance with the observation of UV 359
absorbance at 280 nm (Figure 3B) which showed a higher absorbance peak of the small polymer population 360
for the EP 0W fraction compared to that of the EP 15W fraction. According to Brat et al.18 50% of the orange 361
juice cloud‘s alcohol insoluble residues is made of proteins, and the rest is made of cell wall materials. Since 362
proteins constitute less than 10% of primary cell walls, most of the proteins found in the orange juice cloud 363
are of intracellular rather than cell wall origin.18 In addition, the authors also reported that proteins were 364
mainly responsible for the nitrogen content of orange juice cloud. 365
After the sub-fractionation of the EP 15W fraction through the stepwise ethanol precipitation, it can be 366
seen that the EP20 15W fraction had the highest protein content with almost 50% w/w of the lyophilized 367
material, while the EP60 15W had the lowest protein content (only around 5% w/w). Similar distribution of 368
proteins was observed for the sub-fractions from the non-stored samples (0W). The intensive brown color of 369
the high protein containing fraction (EP20 15W) could probably be due to the linkage of brown compounds 370
to proteins or protein-pectin complexes in this fraction.21 A strong correlation between the melanoidin 371
content and protein content has been reported in coffee brew and the authors have concluded that proteins 372
are incorporated into the melanoidins.28 373
From the results of monosaccharide composition and protein content, it seems that the material which 374
is rich in protein tends to precipitate at a low concentration of ethanol (20%) while a higher ethanol 375
concentration (e.g. 40%) is required to be able to precipitate the material that is rich in cell wall 376
polysaccharides. On the other hand, the presence of the brown compounds in the ethanol insoluble material 377
seems not to have any significant influence on its monosaccharide composition and protein content. Possibly 378
16
the ratio of brown compounds to the insoluble material was probably relatively small, so that their presence 379
did not make any significant change in these attributes as was also observed previously for the molecular 380
weight distribution (Figure 4B). The EP 20 fraction which had the highest protein content seems to possess a 381
high amount of brown compounds as it has the most intensive brown color compared to the other fractions. 382
Based on this observation, it can be hypothesized that the brown compounds are linked to proteins, 383
arabinogalactan proteins, or protein-pectin complexes in this fraction. 384
Changes in different soluble compounds related to non-enzymatic browning 385
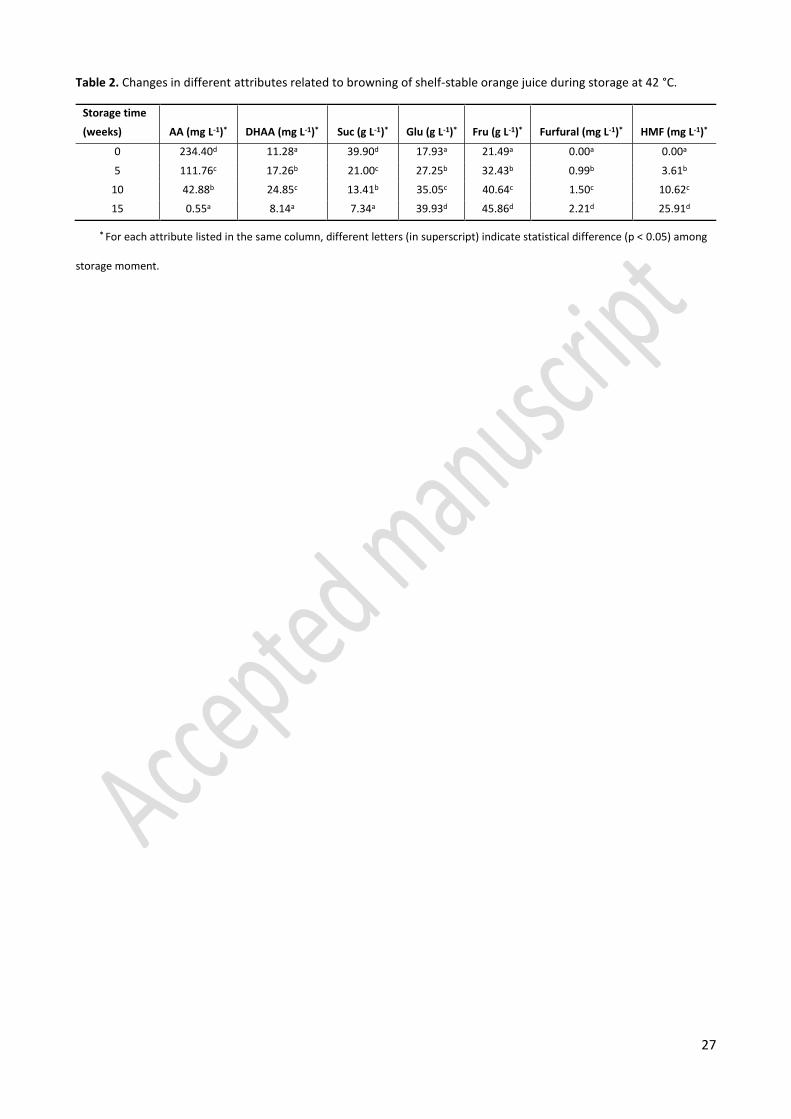
It has been proposed in literature that NEB in citrus juices including orange juice involves the degradation 386
of several reaction precursors such as AA and sugars, and formation of reaction intermediates namely 387
furfural and HMF.3,10,13,16,33 Therefore, the changes of aforementioned NEB precursors and intermediates 388
during storage were investigated and the obtained results were summarized in Table 2. 389
Ascorbic acid and dehydroascorbic acid content 390
During the accelerated storage at 42 °C, the AA content decreased by 52% after 5 weeks of storage and 391
was almost zero at the end of storage (Table 2). It was reported in literature that storage of commercial 392
orange juice at room temperature for 4 months caused a loss of 29% in the AA content.34 The faster drop in 393
the AA content observed in this study could be due to the high storage temperature used. 13,35 In addition, 394
Gómez Ruiz and co-workers36 stated that AA degradation increased with temperature and oxygen 395
concentration. The orange juice used in this study was packed in PET bottles which have a relatively high 396
oxygen permeability resulting in a continuous diffusion of oxygen during storage thus affecting the 397
degradation of AA37. The first-order kinetic model is the most widely used and cited model in literature 398
descibing the degradation of AA in model systems and orange juice systems. 13,36,38,39 The changes in AA 399
content in this work was not kinetically modelled since the data points were not sufficient. 400
In the presence of oxygen, AA is primarily oxidized to DHAA. The DHAA content increased significantly 401
(p < 0.05) during the first 10 weeks of storage, followed by a decrease to the end of storage (Table 2). The 402
increase, followed by a decrease in the DHAA content, observed in this study, is consistent with the results 403
reported previously40 for the changes in DHAA content of orange juice packed in materials with different 404
17
oxygen permeability. Furthermore, it could be observed that the increase in the DHAA content was much 405
smaller than the decrease in AA content. For instance, while the AA content decreased from 406
234.40 ± 3.16 mg L-1 to 111.76 ± 1.16 mg L-1 after 5 weeks of storage, the DHAA increased from 407
11.28 ± 1.49 mg L-1 to 17.26 ± 3.16 mg L-1. There are two possible reasons for the unbalance in AA degradation 408
and DHAA formation. First, DHAA is a very unstable compound which can be irreversibly hydrolyzed to 409
2, 3- diketogulonic acid. Therefore, the observed change in DHAA content is the net result of formation and 410
degradation reactions. The second reason could be that part of the AA content might decrease through the 411
anaerobic pathway in which DHAA is not formed. Consequently, the total vitamin C (AA plus DHAA) content 412
(results not shown) decreased over storage time and the overall nutritional quality of orange juice is 413
negatively affected upon storage. 414
Sugar content 415
During storage, the sucrose content significantly decreased (p < 0.05) while the glucose and fructose 416
content increased (Table 2). After 15 weeks of storage at 42 °C, approximately 82% of sucrose was hydrolyzed 417
while the glucose and fructose content increased more than double the initial level. The observed results in 418
sugar changes in the current work are in agreement with the literature data with the main mechanism being 419
the hydrolysis of sucrose to glucose and fructose under acidic conditions.13,33 However, it can be noticed that 420
the increase of glucose and fructose content did not coincide with the decrease of sucrose content. It is 421
possible that glucose and fructose were also formed from the hydrolysis of other carbohydrates like orange 422
juice fibers (e.g. pectin, hemicelluloses) during storage. The reducing sugars, including fructose and glucose, 423
can undergo acid-catalyzed decomposition to form reactive intermediates (e.g. HMF and/or 424
3- deoxyglucosone), which are important in NEB of citrus juices and orange juice.5,41 425
Furfural and 5-hydroxymethylfurfural content 426
The results (Table 2) show that both furfural and HMF were absent in the pasteurized shelf-stable orange 427
juice prior to storage and their concentration increased significantly with storage time. After 15 weeks 428
storage at 42 °C, the concentration of furfural was 2.21 mg L-1 while that of HMF was 25.91 mg L-1. It is 429
18
interesting to note that there was higher formation of HMF than furfural during storage, which is consistent 430
with the literature reported data for orange juice13 and for grapefruit juice.10 431
It is well established that furfural is primarily generated from AA via an anaerobic degradation 432
pathway10,42,43 while HMF is a breakdown product during the dehydration of glucose and fructose.10,41 The 433
formation of furfural and HMF in citrus juices is generally agreed to be related to the darkening of the juices 434
during storage. 3,10 While furfural is a known reactive compound, HMF has been regarded as a by-product 435
which only accumulates because of its low reactivity in browning reactions.10 436
The changes in AA and sugar content and the formation of furfural and HMF are consistent with the 437
results of the browning development (BI). This is in agreement with literature which has demonstrated that 438
AA and sugars are precursors of the NEB reactions and their degradation causes the formation of furfural 439
and HMF which are considered as NEB reaction intermediates.3 In conclusion, the changes in soluble 440
compounds observed in this study confirm the documented literature on NEB, while the participation of 441
polymeric components (e.g. proteins, arabinogalactan proteins, protein-pectin complexes) of orange juice 442
cloud and pulp during juice browning is demonstrated for the first time in literature. 443
ABBREVIATIONS USED 444
AA ascorbic acid 445
AIJN Association of the Industry of Juices and Nectars from fruits and vegetables of the European Union 446
BI browning index 447
DHAA dehydroascorbic acid 448
EP material precipitated in 70% ethanol solution 449
EP20 material precipitated in 20% ethanol solution 450
EP40 material precipitated in 40% ethanol solution 451
EP60 material precipitated in 60% ethanol solution 452
ES material soluble in 70% ethanol solution 453
ES60 material soluble in 60% ethanol solution 454
Fuc fucose 455
Fru fructose 456
19
GalA galacturonic acid 457
Gal galactose 458
Glu glucose 459
HMF 5-hydroxymethylfurfural 460
HPLC high-performance liquid chromatography 461
Man mannose 462
Mw weight average molecular weight 463
NEB non-enzymatic browning 464
PET polyethylene terephthalate 465
PPO polyphenol oxidase 466
Rha rhamnose 467
Suc sucrose 468
W week(s) 469
Xyl xylose 470
ACKNOWLEDGMENTS 471
Huong T. T. Pham is a doctoral researcher funded by the Interfaculty Council for Development 472
Cooperation (IRO). This research was financially supported be the Research Foundation Flanders (FWO) 473
[Project G0C3718N]. At the moment of the experimental work, Carolien Buvé was a PhD student funded by 474
the Research Foundation Flanders (FWO) [Project GOA7615N] and Biniam Kebede was a postdoctoral 475
researcher funded by the Research Foundation Flanders (FWO) (12K2216N). 476
REFERENCES 477
(1) Álvarez, J.; Pastoriza, S.; Alonso-Olalla, R.; Delgado-Andrade, C.; Rufián-Henares, J. A. Nutritional and 478
Physicochemical Characteristic of Commercial Spanish Citrus Juices. 2014, 164, 396–405. 479
https://doi.org/10.1016/j.foodchem.2014.05.047. 480
(2) Bacigalupi, C.; Lemaistre, M. H.; Boutroy, N.; Bunel, C.; Peyron, S.; Guillard, V.; Chalier, P. Changes in 481
Nutritional and Sensory Properties of Orange Juice Packed in PET Bottles: An Experimental and 482
20
Modelling Approach. Food Chem. 2013, 141 (4), 3827–3836. 483
https://doi.org/10.1016/j.foodchem.2013.06.076. 484
(3) Bharate, S. S.; Bharate, S. B. Non-Enzymatic Browning in Citrus Juice: Chemical Markers, Their 485
Detection and Ways to Improve Product Quality. J. Food Sci. Technol. 2014, 51 (10), 2271–2288. 486
https://doi.org/10.1007/s13197-012-0718-8. 487
(4) Handwerk, R. L.; Coleman, R. L. Approaches to the Citrus Browning Problem. A Review. J. Agric. Food 488
Chem. 1988, 36 (1), 231–236. https://doi.org/10.1021/jf00079a057. 489
(5) Paravisini, L.; Peterson, D. G. Mechanisms Non-Enzymatic Browning in Orange Juice During Storage. 490
Food Chem. 2019, 289 (January), 320–327. https://doi.org/10.1016/J.FOODCHEM.2019.03.049. 491
(6) Buvé, C.; Kebede, B. T.; De Batselier, C.; Carrillo, C.; Pham, H. T. T.; Hendrickx, M.; Grauwet, T.; Van 492
Loey, A. Kinetics of Colour Changes in Pasteurised Strawberry Juice during Storage. J. Food Eng. 493
2018, 216, 42–51. https://doi.org/10.1016/j.jfoodeng.2017.08.002. 494
(7) Wibowo, S.; Grauwet, T.; Gedefa, G. B.; Hendrickx, M.; Van Loey, A. Quality Changes of Pasteurised 495
Mango Juice during Storage. Part II: Kinetic Modelling of the Shelf-Life Markers. Food Res. Int. 2015, 496
78, 410–423. https://doi.org/10.1016/j.foodres.2015.09.001. 497
(8) Paravisini, L.; Peterson, D. G. Role of Reactive Carbonyl Species in Non-Enzymatic Browning of Apple 498
Juice during Storage. Food Chem. 2018, 245 (November 2017), 1010–1017. 499
https://doi.org/10.1016/j.foodchem.2017.11.071. 500
(9) Clegg, K. M. Non‐enzymic Browning of Lemon Juice. J. Sci. Food Agric. 1964, 15 (12), 878–885. 501
https://doi.org/10.1002/jsfa.2740151212. 502
(10) Lee, H. S.; Nagy, S. Quality Changes and Nonenzymic Browning Intermediates in Grapefruit Juice 503
During Storage. J. Food Sci. 1988, 53 (1), 168–172. https://doi.org/10.1111/j.1365-504
2621.1988.tb10201.x. 505
(11) Clegg, K. M.; Morton, A. D. Carbonyl Compounds and the Non-Enzymic Browning of Lemon Juice. J. 506
Sci. Fd Agric. 1965, 16, 191–198. 507
21
(12) Paravisini, L.; Peterson, D. G. Characterization of Browning Formation in Orange Juice during 508
Storage. ACS Symp. Ser. 2016, 1237, 55–65. https://doi.org/10.1021/bk-2016-1237.ch005. 509
(13) Wibowo, S.; Grauwet, T.; Santiago, J. S.; Tomic, J.; Vervoort, L.; Hendrickx, M.; Van Loey, A. Quality 510
Changes of Pasteurised Orange Juice during Storage: A Kinetic Study of Specific Parameters and 511
Their Relation to Colour Instability. Food Chem. 2015, 187, 140–151. 512
https://doi.org/10.1016/J.FOODCHEM.2015.03.131. 513
(14) Stadtman, E. R. Nonenzymatic Browning in Fruit Products. Adv. Food Res. 1948, 1 (C), 325–372. 514
https://doi.org/10.1016/S0065-2628(08)60211-6. 515
(15) Roig, M. G.; Bello, J. F.; Rivera, Z. S.; Kennedy, J. F. Studies on the Occurrence of Non-Enzymatic 516
Browning during Storage of Citrus Juice. Food Res. Int. 1999, 32 (9), 609–619. 517
https://doi.org/10.1016/S0963-9969(99)00128-3. 518
(16) Shinoda, Y.; Murata, M.; Homma, S.; Komura, H. Browning and Decomposed Products of Model 519
Orange Juice. Biosci. Biotechnol. Biochem. 2004, 68 (3), 529–536. 520
https://doi.org/10.1271/bbb.68.529. 521
(17) Hofmann, T. Structure, Color, and Formation of Low- and High-Molecular Weight Products Formed 522
by Food-Related Maillard-Type Reactions. In Chemistry and Physiology of Selected Food Colorants; 523
ACS Symposium Series; American Chemical Society, 2001; Vol. 775, pp 134-151 SE – 9. 524
https://doi.org/doi:10.1021/bk-2001-0775.ch009. 525
(18) Brat, P.; Rega, B.; Alter, P.; Reynes, M.; Brillouet, J. M. Distribution of Volatile Compounds in the 526
Pulp, Cloud, and Serum of Freshly Squeezed Orange Juice. J. Agric. Food Chem. 2003, 51 (11), 3442–527
3447. https://doi.org/10.1021/jf026226y. 528
(19) Klavons, J. A.; Bennett, R. D.; Vannier, S. H. Physical/Chemical Nature of Pectin Associated with 529
Commercial Orange Juice Cloud. J. Food Sci. 1994, 59 (2), 399–401. https://doi.org/10.1111/j.1365-530
2621.1994.tb06976.x. 531
(20) Bekedam, E. K.; De Laat, M. P. F. C.; Schols, H. A.; Van Boekel, M. A. J. S.; Smit, G. Arabinogalactan 532
22
Proteins Are Incorporated in Negatively Charged Coffee Brew Melanoidins. J. Agric. Food Chem. 533
2007, 55 (3), 761–768. https://doi.org/10.1021/jf063010d. 534
(21) Hofmann, T. Studies on Melanoidin-Type Colorants Generated from the Maillard Reaction of 535
Protein-Bound Lysine and Furan-2-Carboxaldehyde -- Chemical Characterisation of a Red Coloured 536
Domaine. Zeitschrift für Leb. und -forsch. A 1998, 206 (4), 251–258. 537
https://doi.org/10.1007/s002170050253. 538
(22) Scott, W. C.; Kew, T. J.; Veldhuis, M. K. Composition of Orange Juice Cloud. J. Food Sci. 1965, 30 (5), 539
833–837. https://doi.org/10.1111/j.1365-2621.1965.tb01850.x. 540
(23) Klavons, J. A.; Bennett, R. D.; Vannier, S. H. Nature of the Protein Constituent of Commercial Orange 541
Juice Cloud. J. Agric. Food Chem. 1991, 39 (9), 1545–1548. https://doi.org/10.1021/jf00009a001. 542
(24) Klim, M.; Nagy, S. An Improved Method to Determine Nonenzymic Browning in Citrus Juices. J. 543
Agric. Food Chem. 1988, 36 (6), 1271–1274. https://doi.org/10.1021/jf00084a036. 544
(25) Ognyanov, M.; Remoroza, C.; Schols, H. A.; Georgiev, Y.; Kratchanova, M.; Kratchanov, C. Isolation 545
and Structure Elucidation of Pectic Polysaccharide from Rose Hip Fruits (Rosa Canina L.). Carbohydr. 546
Polym. 2016, 151, 803–811. https://doi.org/10.1016/j.carbpol.2016.06.031. 547
(26) Bian, J.; Peng, F.; Peng, P.; Xu, F.; Sun, R.-C. Isolation and Fractionation of Hemicelluloses by Graded 548
Ethanol Precipitation from Caragana Korshinskii. Carbohydr. Res. 2010, 345, 802–809 Contents. 549
https://doi.org/10.1016/j.carres.2010.01.014. 550
(27) Ting, S. V.; Rouseff, R. L. Citrus Fruits and Their Products : Analysis, Technology; Dekker, 1986. 551
(28) Bekedam, E. K.; Schols, H.; van Boekel, M.; Smit, G. High Molecular Weight Melanoidins from Coffee 552
Brew. J. Agric. Food Chem. 2006, 54, 7658–7666. https://doi.org/10.1021/jf0615449. 553
(29) Shpigelman, A.; Kyomugasho, C.; Christiaens, S.; Van Loey, A. M.; Hendrickx, M. E. Thermal and High 554
Pressure High Temperature Processes Result in Distinctly Different Pectin Non-Enzymatic 555
Conversions. Food Hydrocoll. 2014, 39, 251–263. https://doi.org/10.1016/J.FOODHYD.2014.01.018. 556
(30) Santiago, J. S. J.; Kyomugasho, C.; Maheshwari, S.; Jamsazzadeh Kermani, Z.; Van de Walle, D.; Van 557
23
Loey, A. M.; Dewettinck, K.; Hendrickx, M. E. Unravelling the Structure of Serum Pectin Originating 558
from Thermally and Mechanically Processed Carrot-Based Suspensions. Food Hydrocoll. 2018, 77, 559
482–493. https://doi.org/10.1016/J.FOODHYD.2017.10.026. 560
(31) Chang, S. K. C.; Zhang, Y. Protein Analysis. In Food Analysis; Nielsen, S. S., Ed.; Springer International 561
Publishing: Cham, 2017; pp 315–331. https://doi.org/10.1007/978-3-319-45776-5_18. 562
(32) Vervoort, L.; Van Der Plancken, I.; Grauwet, T.; Timmermans, R. A. H.; Mastwijk, H. C.; Matser, A. M.; 563
Hendrickx, M. E.; Van Loey, A. Comparing Equivalent Thermal, High Pressure and Pulsed Electric 564
Field Processes for Mild Pasteurization of Orange Juice: Part II: Impact on Specific Chemical and 565
Biochemical Quality Parameters. Innov. Food Sci. Emerg. Technol. 2011, 12 (4), 466–477. 566
https://doi.org/10.1016/j.ifset.2011.06.003. 567
(33) Kennedy, J. F.; Rivera, Z. S.; Lloyd, L. L.; Warner, F. P.; Jumel, K. Studies on Non‐enzymic Browning in 568
Orange Juice Using a Model System Based on Freshly Squeezed Orange Juice. J. Sci. Food Agric. 569
1990, 52 (1), 85–95. https://doi.org/10.1002/jsfa.2740520110. 570
(34) Kabasakalis, V.; Siopidou, D.; Moshatou, E. Ascorbic Acid Content of Commercial Fruit Juices and Its 571
Rate of Loss upon Storage. Food Chem. 2000, 70 (3), 325–328. https://doi.org/10.1016/S0308-572
8146(00)00093-5. 573
(35) Klimczak, I.; Małecka, M.; Szlachta, M.; Gliszczyńska-Świgło, A. Effect of Storage on the Content of 574
Polyphenols, Vitamin C and the Antioxidant Activity of Orange Juices. J. Food Compos. Anal. 2007, 20 575
(3–4), 313–322. https://doi.org/10.1016/J.JFCA.2006.02.012. 576
(36) Gómez Ruiz, B.; Roux, S.; Courtois, F.; Bonazzi, C. Kinetic Modelling of Ascorbic and Dehydroascorbic 577
Acids Concentrations in a Model Solution at Different Temperatures and Oxygen Contents. Food 578
Res. Int. 2018, 106, 901–908. https://doi.org/10.1016/J.FOODRES.2018.01.051. 579
(37) Berlinet, C.; Brat, P.; Brillouet, J.-M.; Ducruet, V. Ascorbic Acid, Aroma Compounds and Browning of 580
Orange Juices Related to PET Packaging Materials and PH. J. Sci. Food Agric. 2006, 86 (13), 2206–581
2212. https://doi.org/10.1002/jsfa.2597. 582
24
(38) Van Bree, I.; Baetens, J. M.; Samapundo, S.; Devlieghere, F.; Laleman, R.; Vandekinderen, I.; Noseda, 583
B.; Xhaferi, R.; De Baets, B.; De Meulenaer, B. Modelling the Degradation Kinetics of Vitamin C in 584
Fruit Juice in Relation to the Initial Headspace Oxygen Concentration. Food Chem. 2012, 134 (1), 585
207–214. https://doi.org/10.1016/J.FOODCHEM.2012.02.096. 586
(39) Polydera, A. C.; Stoforos, N. G.; Taoukis, P. S. Comparative Shelf Life Study and Vitamin C Loss 587
Kinetics in Pasteurised and High Pressure Processed Reconstituted Orange Juice. J. Food Eng. 2003, 588
60 (1), 21–29. https://doi.org/10.1016/S0260-8774(03)00006-2. 589
(40) Zerdin, K.; Rooney, M. L.; Vermuë, J. The Vitamin C Content of Orange Juice Packed in an Oxygen 590
Scavenger Material. Food Chem. 2003, 82 (3), 387–395. https://doi.org/10.1016/S0308-591
8146(02)00559-9. 592
(41) Arena, E.; Fallico, B.; Marracone, E. Thermal Damage in Blood Orange Juice: Kinetics of 5-593
Hydroxymethyl-2-Furcarboxaldehyde Formation. Int. J. Food Sci. Technol. 2001, 36 (1995), 145–151. 594
https://doi.org/10.1017/CBO9781107415324.004. 595
(42) Robertson, G.; Samaniego, C. Effect of Initial Dissolved Oxygen Levels on the De- Gradation of 596
Ascorbic Acid and the Browning of Lemon Juice during Storage. Food Sci. 1986, 51 (1), 184–187. 597
(43) Yuan, J.-P.; Chen, F. Degradation of Ascorbic Acid in Aqueous Solution. J. Agric. Food Chem. 1998, 46, 598
5078−5082. https://doi.org/10.1021/jf9805404. 599
FIGURE CAPTIONS 600
Figure 1. Changes in (A) total color difference (∆E*) and (B) browning index (BI) of orange juice during storage 601
at 42 °C. 602
Figure 2. Schematic overview of (A) ethanol precipitation of the non-stored orange juice and 15 week-stored 603
orange juice at 42 °C and (B) stepwise ethanol precipitation of the total ethanol precipitated materials. 604
Figure 3. Size exclusion profile of the total ethanol precipitated material (EP) from the non-stored (0W) and 605
15 week- stored (15W) orange juice at 42 °C: (A) Log molar mass distribution (solid line) of EP 0W (thin) and 606
EP 15W (thick) and concentration of EP 0W (……..) and EP 15W (. ₋ . ₋ .) as a function of elution time (min). 607
25
(B) Light scattering signal at 92° angle (solid line) of EP 0W (thin) and EP 15W (thick) and UV absorbance 608
chromatogram at 280 nm of EP 0W (dotted lines) and EP 15W (dot-dash-dot). 609
Figure 4. Size exclusion profile of the total ethanol precipitated material (EP) and its sub-fractions from the 610
15 week- stored orange juice at 42 °C: (A) Log molar mass distribution (solid line) and concentration (dashed 611
line) as a function of elution time (min). (B) Light scattering signal at 92° angle (solid line) and UV absorbance 612
chromatogram at 280 nm (dashed line). EP - blue, EP20 - red, EP40 - black, EP60 - yellow, ES60 - green. 613
26
Table 1. Average monosaccharide composition and crude protein content of the ethanol precipitated material and their
sub-fractions from the non-stored and 15 week-stored orange juice at 42 °C expressed in g/100g lyophilized sample.
* Different capital letters (in superscript) indicate statistical difference (p < 0.05) between the non-stored sample and 15 week-
stored sample, while small letters indicate statistical differences among the sub-fractions of the non-stored sample or 15 week-stored
sample.
Sample Fuc* Rha* Ara* Gal* Glu* Xyl* Man* GalA*
Crude
protein*
EP 0W 0.18A 1.60A 6.13A 9.13A 3.58A 0.24A 0.26A 11.62A 29.23B
EP20 0W 0.15Aa 3.17Ab 4.05Aa 6.88Aa 4.53Ab 0.18Aa 0.22Aa 4.18Aa 49.59Ad
EP40 0W 0.24Ab 0.99Ba 4.75Aa 7.82Aa 1.75Aa 0.20Aa 0.20Aa 22.34Ab 25.78Bc
EP60 0W 0.50Bc 1.34Aa 13.62Ac 23.01Bc 2.35Aa 0.73Aa 0.19Aa 21.98Ab 4.88Aa
ES60 0W 0.09Ba 1.07Aa 8.19Bb 10.33Aa 10.46Ac 0.64Aa 1.21Aa 6.71Ba 9.95Ab
EP 15W 0.19A 1.76A 6.29A 10.11A 5.69A 0.54A 0.25A 15.06A 25.61A
EP20 15W 0.17Aa 3.27Ab 3.84Aa 7.25Aa 4.17Ab 0.16Aa 0.25Aa 4.35Aa 48.22Ac
EP40 15W 0.25Ab 0.76Aa 4.22Aa 7.70Aa 3.36Bb 0.20Aa 0.18Aa 28.86Ba 19.69Ab
EP60 15W 0.27Ac 1.25Aa 12.66Ac 20.54Ac 0.95Aa 0.39Aa 0.10Aa 22.48Ab 6.97Aa
ES60 15W 0.05Aa 0.77Aa 7.23Ab 10.05Ab 11.61Ac 0.91Ab 0.97Ab 4.70Aa 10.08Aa
27
Table 2. Changes in different attributes related to browning of shelf-stable orange juice during storage at 42 °C.
* For each attribute listed in the same column, different letters (in superscript) indicate statistical difference (p < 0.05) among
storage moment.
Storage time
(weeks) AA (mg L-1)* DHAA (mg L-1)* Suc (g L-1)* Glu (g L-1)* Fru (g L-1)* Furfural (mg L-1)* HMF (mg L-1)*
0 234.40d 11.28a 39.90d 17.93a 21.49a 0.00a 0.00a
5 111.76c 17.26b 21.00c 27.25b 32.43b 0.99b 3.61b
10 42.88b 24.85c 13.41b 35.05c 40.64c 1.50c 10.62c
15 0.55a 8.14a 7.34a 39.93d 45.86d 2.21d 25.91d

28
Figure 1. Changes in (A) total color difference (∆E*) and (B) browning index (BI) of orange juice during storage at 42 °C.
B
A
29
Figure 2. Schematic overview of (A) ethanol precipitation of the non-stored orange juice and 15 week-stored
orange juice at 42 °C and (B) stepwise ethanol precipitation of the total ethanol precipitated materials.
A
B
30
Figure 3. Size exclusion profile of the total ethanol precipitated material (EP) from the non-stored (0W) and
15 week- stored (15W) orange juice at 42 °C: (A) Log molar mass distribution (solid line) of EP 0W (thin) and EP 15W
(thick) and concentration of EP 0W (……..) and EP 15W (. ₋ . ₋ .) as a function of elution time (min). (B) Light scattering
signal at 92° angle (solid line) of EP 0W (thin) and EP 15W (thick) and UV absorbance chromatogram at 280 nm of EP 0W
(dotted lines) and EP 15W (dot-dash-dot).
A
B
31
Figure 4. Size exclusion profile of the total ethanol precipitated material (EP) and its sub-fractions from the
15 week- stored orange juice at 42 °C: (A) Log molar mass distribution (solid line) and concentration (dashed line) as a
function of elution time (min). (B) Light scattering signal at 92° angle (solid line) and UV absorbance chromatogram at
280 nm (dashed line). EP - blue, EP20 - red, EP40 - black, EP60 - gray, ES60 - purple.
A
B
32
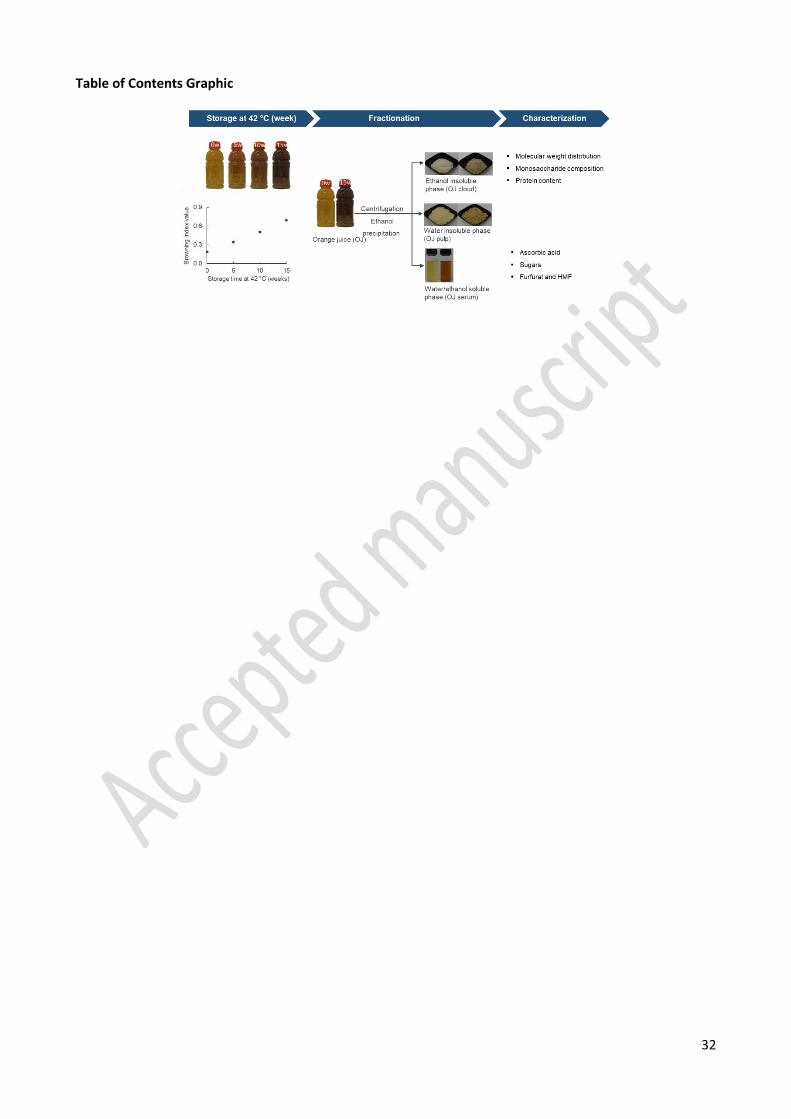
Table of Contents Graphic