Embed Size (px)
Citation preview
Changing water demand: Projecting water use in the Chicago region to 2050
HELPINGCOMMUNITIESPROSPER
IntroductionCommunities across the globe face an increasing array of water resource
challenges. Growing population, habitat degradation, and climate change continue
to impact the provision of clean, reliable water to residents and businesses. The
Chicago region is not immune. Despite access to Lake Michigan, significant
portions of the region — especially those dependent upon groundwater sources
— are already encountering water supply and quality issues. The region’s
comprehensive plan, ON TO 2050, anticipates these issues will grow unless
additional steps are taken to coordinate and conserve the region’s shared water
supply resources. While overall water use is stable, forecasted water demand
will exceed available groundwater supplies in some areas. Yet with additional
conservation and efficiency measures, the region can maintain its long-term
drinking water supplies.
Understanding future water demand is key for sustainable management. The ON
TO 2050 Regional Water Demand Forecast allows the region and municipalities
to assess long-range demands in the context of available water supply. The
forecast is designed to inform local and regional planners about the sufficiency
of water sources and encourage actions that conserve water, protect supply, and
pursue alternative drinking water sources. This guide provides a brief overview of
forecasted water demand by 2050, important factors driving water demand, and
how planning decisions can help to conserve shared water supply resources.
Future demand will exceed supply in some areas unless we coordinate and conserve our shared resources.
What is the demand forecast?
CMAP, Illinois-Indiana Sea Grant, and University of Illinois Extension developed the forecast to estimate future water demand to the year 2050 at the municipal, county, and regional scales as well as by water source and sector for the 7-county region. For more information on the methodology, see the ON TO 2050 Regional Water Demand Forecast report.1
2

Lake MichiganShallow GroundwaterMixed Groundwater SourcesSandstone GroundwaterOther Surface WaterFox RiverKankakee River
Figure 1. Primary water source 3
Note: The water source of a community is based on the source of the majority of withdrawals from all wells and intakes within community, including industrial and commercial businesses.
Source: CMAP ON TO 2050 Regional Water Demand Forecast.
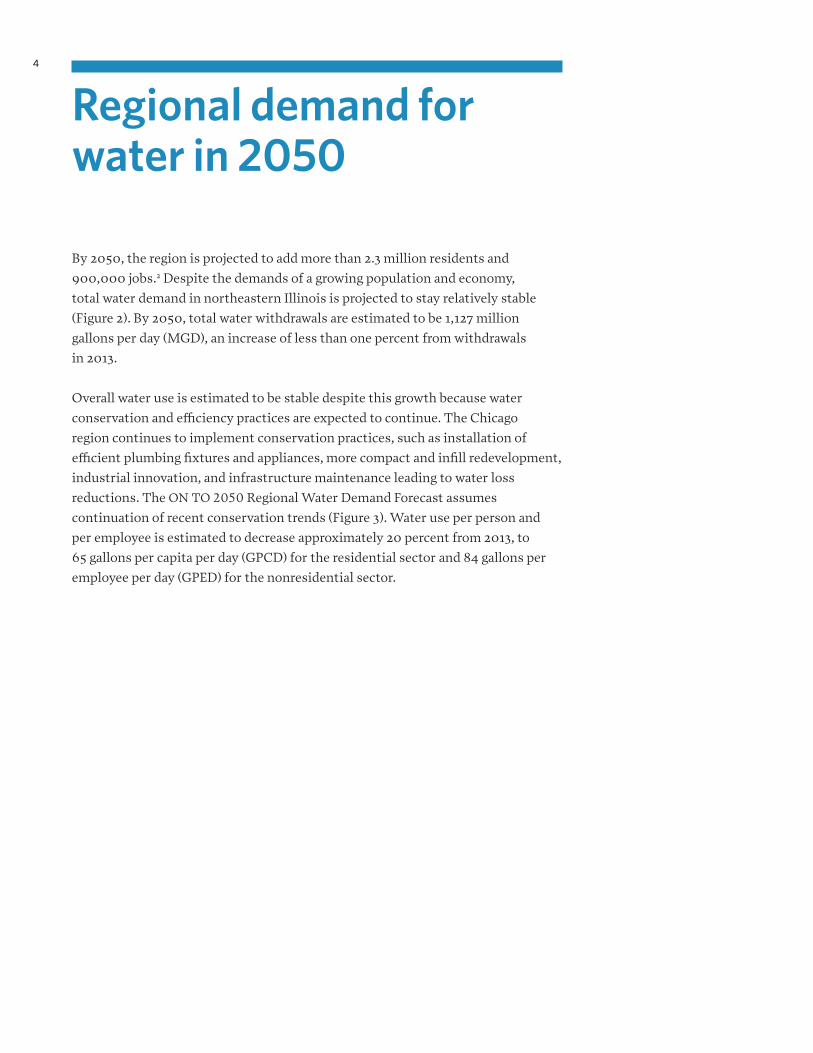
Regional demand for water in 2050
By 2050, the region is projected to add more than 2.3 million residents and
900,000 jobs.2 Despite the demands of a growing population and economy,
total water demand in northeastern Illinois is projected to stay relatively stable
(Figure 2). By 2050, total water withdrawals are estimated to be 1,127 million
gallons per day (MGD), an increase of less than one percent from withdrawals
in 2013.
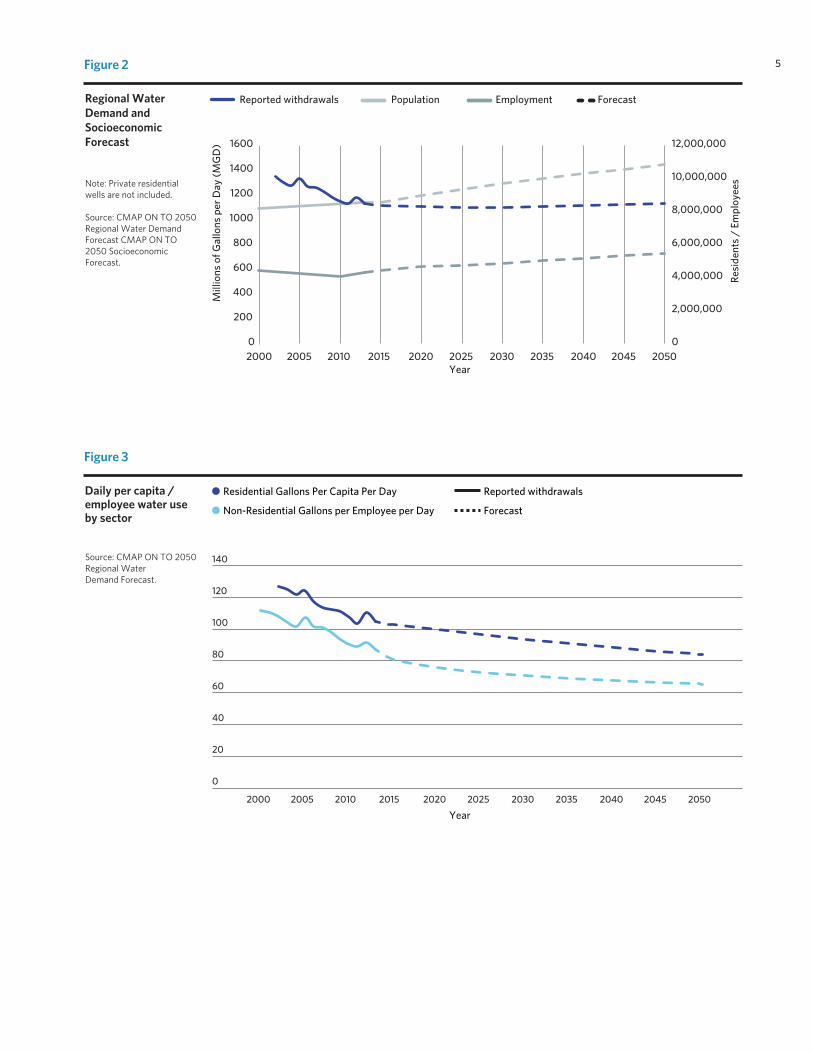
Overall water use is estimated to be stable despite this growth because water
conservation and efficiency practices are expected to continue. The Chicago
region continues to implement conservation practices, such as installation of
efficient plumbing fixtures and appliances, more compact and infill redevelopment,
industrial innovation, and infrastructure maintenance leading to water loss
reductions. The ON TO 2050 Regional Water Demand Forecast assumes
continuation of recent conservation trends (Figure 3). Water use per person and
per employee is estimated to decrease approximately 20 percent from 2013, to
65 gallons per capita per day (GPCD) for the residential sector and 84 gallons per
employee per day (GPED) for the nonresidential sector.
4
0
20
40
60
80
100
120
140
2000 2005 2010 2015 2020 2025 2030 2035 2040 2045 2050
Daily per capita / employee water use by sector
Source: CMAP ON TO 2050 Regional Water Demand Forecast.
Residential Gallons Per Capita Per Day
Non-Residential Gallons per Employee per Day
Reported withdrawals
Forecast
Year
0
2,000,000
4,000,000
6,000,000
8,000,000
10,000,000
12,000,000
20052000 2010 2015 2020 2025 2030 2035 2040 2045 20500
200
400
600
800
1000
1200
1400
1600
Resi
dent
s /
Empl
oyee
s
Year
Mill
ions
of G
allo
ns p
er D
ay (M
GD
)
Reported withdrawals ForecastPopulation EmploymentRegional Water Demand and Socioeconomic Forecast
Note: Private residential wells are not included.
Source: CMAP ON TO 2050 Regional Water Demand Forecast CMAP ON TO 2050 Socioeconomic Forecast.
Figure 2
Figure 3
5
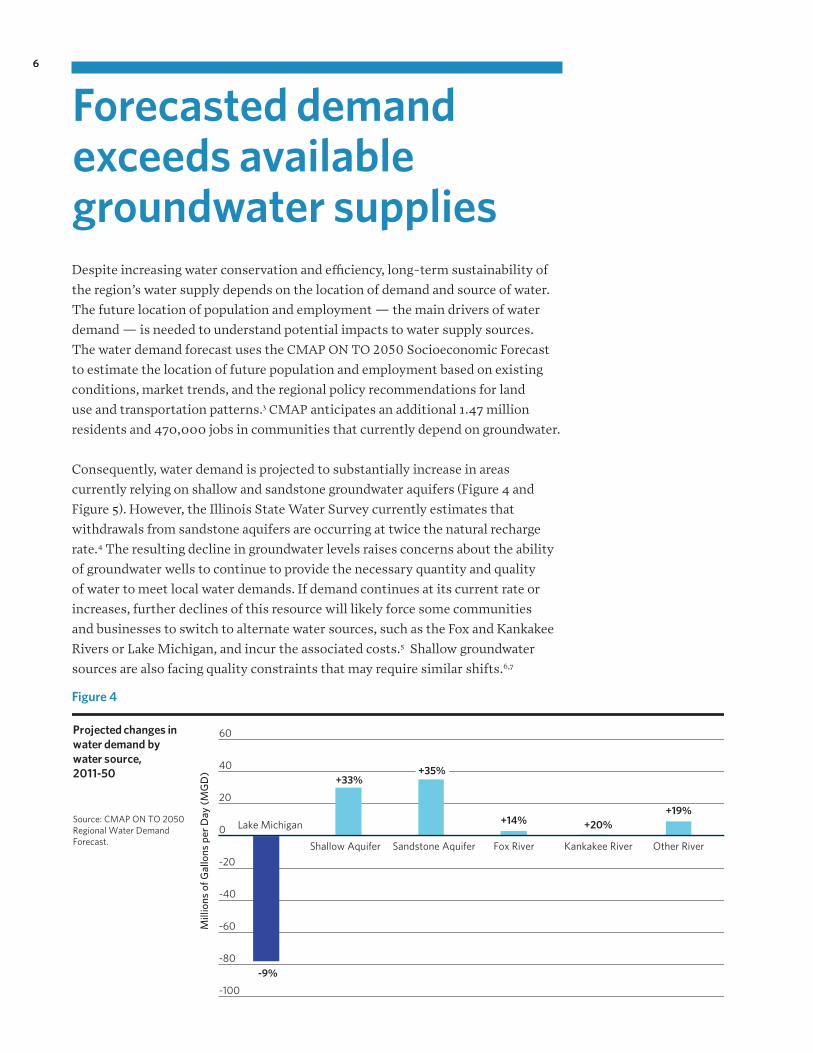
Forecasted demand exceeds available groundwater supplies
Projected changes in water demand by water source, 2011-50
-9%
+33%+35%
+14% +20%+19%
-100
-80
-60
-40
-20
0
20
40
60
Lake Michigan
Shallow Aquifer Sandstone Aquifer Fox River Kankakee River Other River
Source: CMAP ON TO 2050 Regional Water Demand Forecast.
Mill
ions
of G
allo
ns p
er D
ay (M
GD
)
Despite increasing water conservation and efficiency, long-term sustainability of
the region’s water supply depends on the location of demand and source of water.
The future location of population and employment — the main drivers of water
demand — is needed to understand potential impacts to water supply sources.
The water demand forecast uses the CMAP ON TO 2050 Socioeconomic Forecast
to estimate the location of future population and employment based on existing
conditions, market trends, and the regional policy recommendations for land
use and transportation patterns.3 CMAP anticipates an additional 1.47 million
residents and 470,000 jobs in communities that currently depend on groundwater.
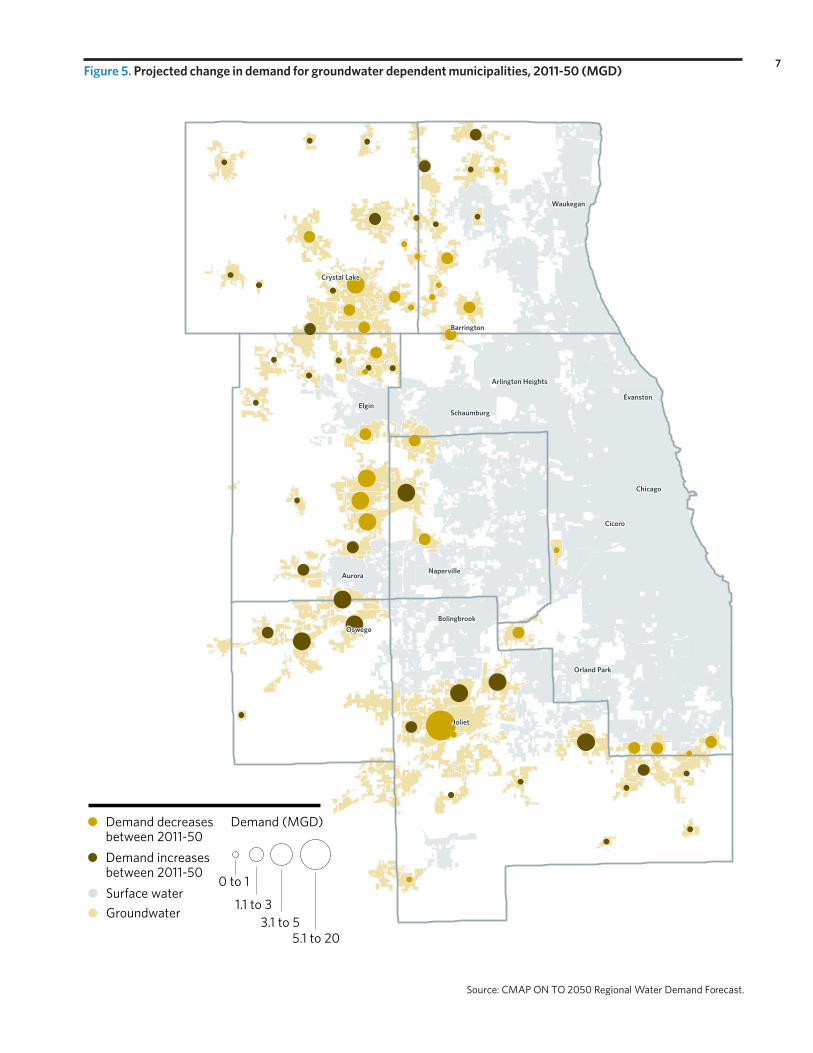
Consequently, water demand is projected to substantially increase in areas
currently relying on shallow and sandstone groundwater aquifers (Figure 4 and
Figure 5). However, the Illinois State Water Survey currently estimates that
withdrawals from sandstone aquifers are occurring at twice the natural recharge
rate.4 The resulting decline in groundwater levels raises concerns about the ability
of groundwater wells to continue to provide the necessary quantity and quality
of water to meet local water demands. If demand continues at its current rate or
increases, further declines of this resource will likely force some communities
and businesses to switch to alternate water sources, such as the Fox and Kankakee
Rivers or Lake Michigan, and incur the associated costs.5 Shallow groundwater
sources are also facing quality constraints that may require similar shifts.6,7
Figure 4
66
Arlington Heights
Aurora
Bolingbrook
Chicago
Cicero
Crystal Lake
ElginEvanston
Joliet
Naperville
Oswego
Schaumburg
Waukegan
Orland Park
Barrington
Demand (MGD)
3.1 to 51.1 to 3
0 to 1
5.1 to 20
Demand increases between 2011-50
Demand decreases between 2011-50
Surface waterGroundwater
Figure 5. Projected change in demand for groundwater dependent municipalities, 2011-50 (MGD)
Source: CMAP ON TO 2050 Regional Water Demand Forecast.
77
Switching sources, however, is not without challenges. Regulatory, technological,
and financial considerations may limit a community’s ability to use alternate water
sources. Cost, infrastructure capacity, as well as political, and legal complexity, (e.g.
Great Lakes Compact), will constrain Lake Michigan water as an option. Gaining
access to Lake Michigan water will not be feasible for all interested communities.
Access to the Fox and Kankakee Rivers is also regulated to ensure sufficient flows
during drought conditions to protect aquatic life.8 Even if several communities
are able to switch water sources, the supply constraints may remain for some time
given that historical withdrawals have surpassed sustainable yields.9 Therefore,
reducing demand on sandstone groundwater aquifers will also be needed to ensure
this resource continues to be available as a primary or secondary source
for communities.
Although communities and industrial and commercial facilities may switch water
sources in the coming years, predicting these changes is difficult; thus, the forecast
assumes that communities and facilities will continue to rely on their current
source.10 However, this is considered unlikely as water demand is projected to
outstrip supply in some areas.
One of the most cost effective ways to maintain water supplies is to conserve water.
8
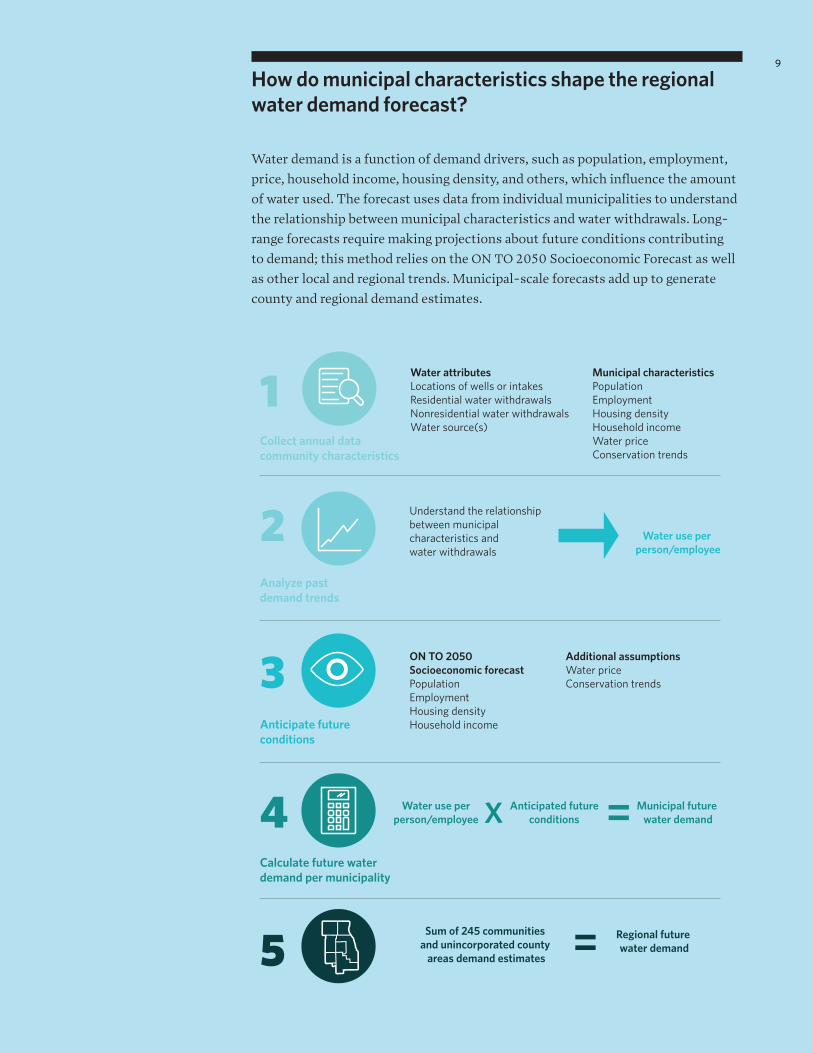
How do municipal characteristics shape the regional water demand forecast?
Water demand is a function of demand drivers, such as population, employment,
price, household income, housing density, and others, which influence the amount
of water used. The forecast uses data from individual municipalities to understand
the relationship between municipal characteristics and water withdrawals. Long-
range forecasts require making projections about future conditions contributing
to demand; this method relies on the ON TO 2050 Socioeconomic Forecast as well
as other local and regional trends. Municipal-scale forecasts add up to generate
county and regional demand estimates.
Collect annual data community characteristics
Water attributesLocations of wells or intakesResidential water withdrawals Nonresidential water withdrawals Water source(s)
Analyze past demand trends
Understand the relationship between municipal characteristics and water withdrawals
Anticipate future conditions
1
2
3
5 =
Water use per person/employee
Sum of 245 communities and unincorporated county
areas demand estimates
Regional future water demand
Municipal characteristicsPopulation EmploymentHousing densityHousehold incomeWater priceConservation trends
ON TO 2050 Socioeconomic forecastPopulation EmploymentHousing densityHousehold income
Additional assumptions Water priceConservation trends
Calculate future water demand per municipality
Water use per person/employee
Anticipated future conditions4 X = Municipal future
water demand
9
Stewardship of Lake Michigan water promotes resilience
Illinois withdraws, uses, and then diverts Lake Michigan water out of the Great
Lakes Basin to the Mississippi River system, a modification which resulted in a
U.S. Supreme Court Consent Decree that governs Illinois withdrawal of lake water.
The Illinois Department of Natural Resources (IDNR) manages the Lake Michigan
Water Allocation program and issues permits to communities and industries to
ensure that the State stays within the established diversion rate. In addition, IDNR
implements a water management and conservation program that requires wise
water management by Lake Michigan permittees.
The ON TO 2050 Regional Water Demand Forecast reconfirms the long-term trend
of declining water demand in areas served by Lake Michigan water (Figure 4 and
Figure 6). Even as population and employment increases are projected for the Lake
Michigan service region, conservation and efficiency practices are anticipated to
outweigh new demand from additional residents and employees.
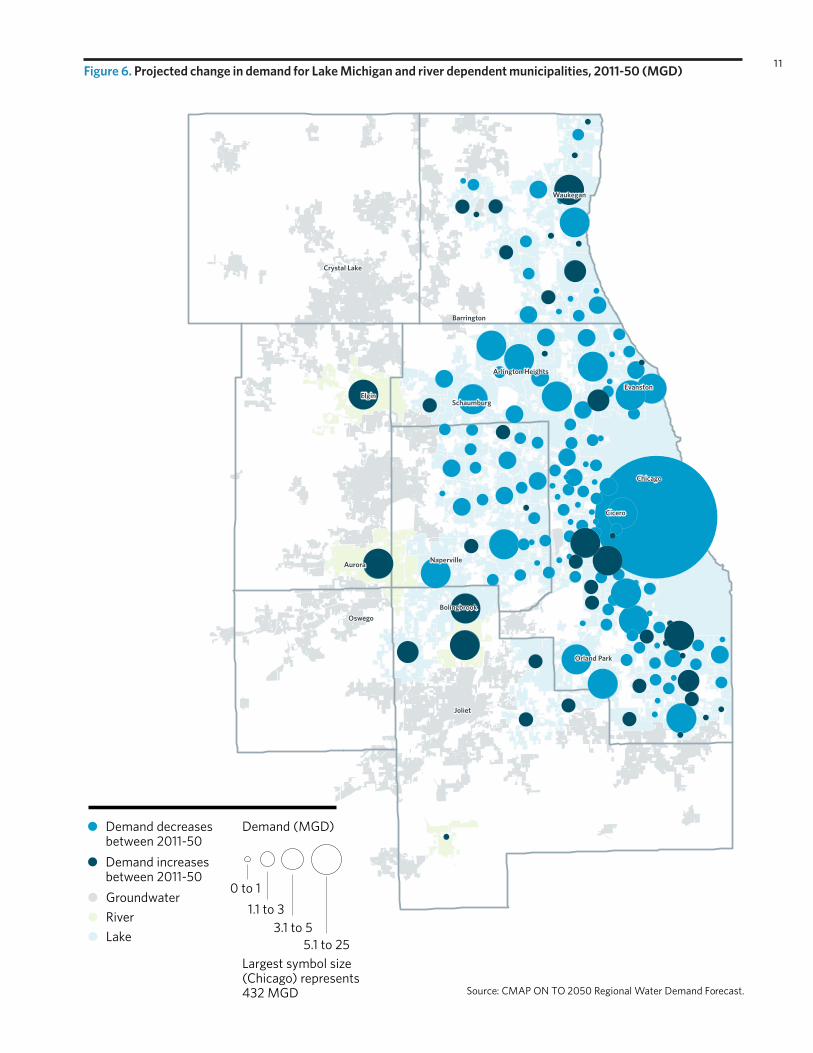
Continued declines in water demand in the current Lake Michigan service area
could allow water to be allocated to additional communities and industries,
including those relying on scarce groundwater sources. However, the Lake
Michigan Allocation process is complicated and requires ongoing assessment by
IDNR. Accounting for climate change — both within the region and nationwide
— will be particularly important. Climate change is anticipated to impact water
supplies in a variety of ways while also increasing water demand due to warming.11
Increasing conservation practices will better position the region to respond to both
groundwater constraints and climate change impacts.
10
Arlington Heights
Aurora
Bolingbrook
Chicago
Cicero
Crystal Lake
ElginEvanston
Joliet
Naperville
Oswego
Schaumburg
Waukegan
Orland Park
Barrington
Demand (MGD)
Largest symbol size (Chicago) represents 432 MGD
3.1 to 51.1 to 3
0 to 1
5.1 to 25
Demand increases between 2011-50
Demand decreases between 2011-50
GroundwaterRiverLake
Figure 6. Projected change in demand for Lake Michigan and river dependent municipalities, 2011-50 (MGD)
Source: CMAP ON TO 2050 Regional Water Demand Forecast.
11

River water offers opportunities
The ON TO 2050 Regional Water Demand Forecast anticipates growing demand
of river water to supply both municipal drinking water as well as water used for
industrial and commercial purposes (Figure 4 and Figure 6). Currently, Aurora and
Elgin use the Fox River for their drinking water supply. Water 2050 estimated that
the Fox River has the potential to support an additional 40 to 45 million gallons
of withdrawals in the future.12 The Kankakee River currently supplies the Village
of Wilmington and has potential to meet additional demands as well. Today,
several groundwater dependent communities are considering switching to river
water sources.
Many commercial and industrial businesses already rely on the Chicago, Calumet,
Des Plaines, and Fox Rivers, and the Cal-Sag and Chicago Sanitary and Ship Canals
for their water supply. Additional businesses that currently rely on groundwater
may be able to switch to river sources to meet their needs and reduce their reliance
on constrained supplies.
12

13
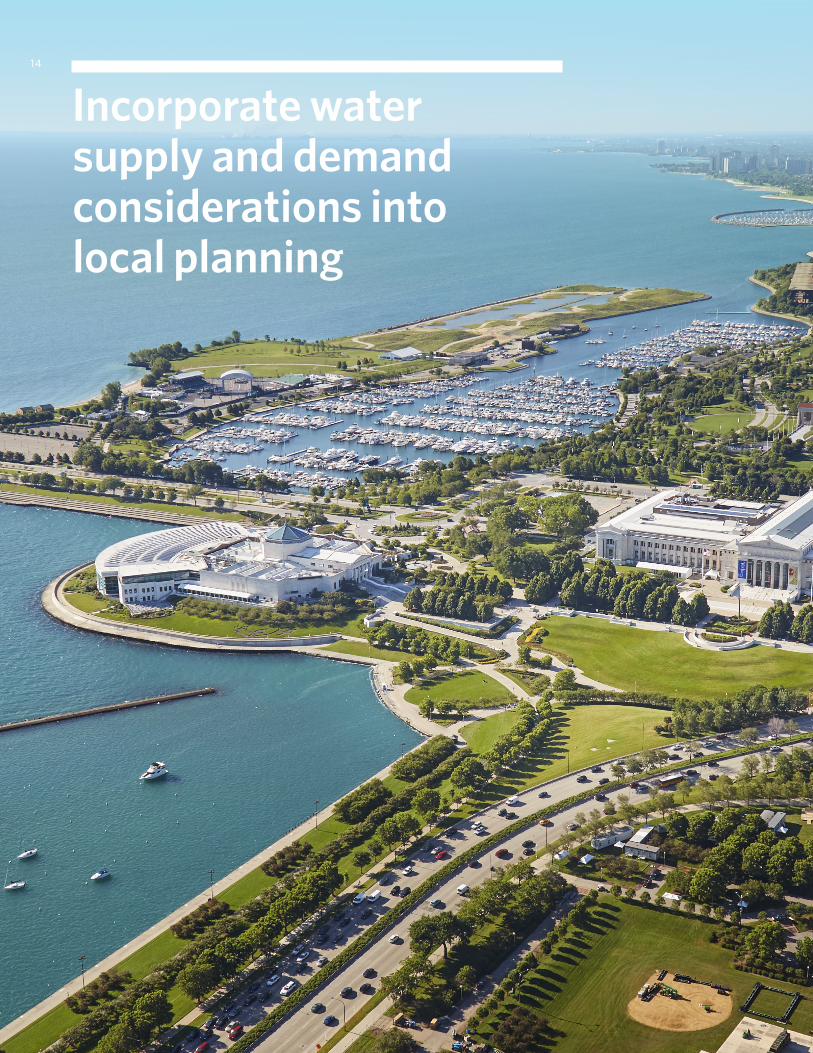
Incorporate water supply and demand considerations into local planning
14
Understanding both the available supply of water and current and future demand is
critical to making informed land use, transportation, and infrastructure investment
decisions. With some communities anticipating significant increases in water
demand by the year 2050, ensuring that there is an adequate and sustainable water
supply will become increasingly important. During a comprehensive planning
process, future land use plans should consider how proposed growth patterns
could impact available supplies and infrastructure capacity and adjust policies
accordingly. This could include actions that conserve water, protect supply, and
pursue alternative drinking water sources. As new development is proposed,
communities could review potential demand generated from the development
to help implement water resource goals. To make these assessments, land use
planners and water utility managers will need to work together and align local
planning efforts with current and future water supply constraints.
Declining water demand — as projected for the majority of communities in the
region by 2050 — benefits the entire region in maintaining a long-term supply.
Yet it presents its own set of challenges. Declining demand often means less billed
water per customer, and therefore, less revenue to cover the costs of maintaining
water service. Compact development is even more important in these situations
as adding additional infrastructure likely exacerbates the mismatch between costs
and revenues. Planners can help utility managers by supporting strategies such as
considering shared services with nearby communities and adjusting water rates to
be more resilient to variability in water use. The relationship between land use and
development, water demand, and water rates and revenues is ever evolving; land
use planners and water utility managers will need to continue to work together.
Local water demand forecasts can help bridge land use, transportation, and
municipal finance and asset management decisions as development patterns affect
water use and also long-term infrastructure maintenance costs. As part of the ON
TO 2050 Regional Water Demand Forecast, individual demand forecasts, reported
water withdrawals, and data on current and projected demand drivers for 245
municipalities are available for download via the CMAP DataHub. Local decision-
makers can incorporate forecast results in planning activities, update projections
as additional community data is available, and explore future scenarios. At a larger
scale, groups of municipalities can aggregate the demand forecast to a sub-regional
level and by water source to compare with water supply estimates.
15
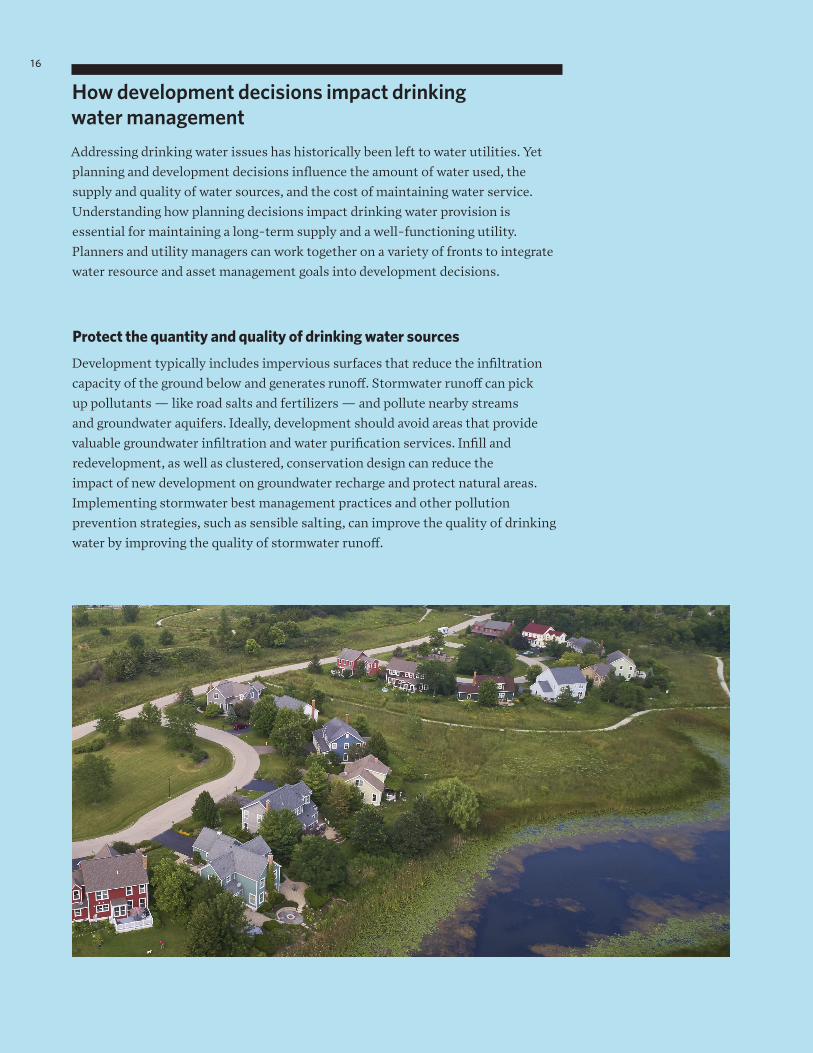
How development decisions impact drinking water managementAddressing drinking water issues has historically been left to water utilities. Yet
planning and development decisions influence the amount of water used, the
supply and quality of water sources, and the cost of maintaining water service.
Understanding how planning decisions impact drinking water provision is
essential for maintaining a long-term supply and a well-functioning utility.
Planners and utility managers can work together on a variety of fronts to integrate
water resource and asset management goals into development decisions.
Protect the quantity and quality of drinking water sources
Development typically includes impervious surfaces that reduce the infiltration
capacity of the ground below and generates runoff. Stormwater runoff can pick
up pollutants — like road salts and fertilizers — and pollute nearby streams
and groundwater aquifers. Ideally, development should avoid areas that provide
valuable groundwater infiltration and water purification services. Infill and
redevelopment, as well as clustered, conservation design can reduce the
impact of new development on groundwater recharge and protect natural areas.
Implementing stormwater best management practices and other pollution
prevention strategies, such as sensible salting, can improve the quality of drinking
water by improving the quality of stormwater runoff.
16

Reduce water use through land use and development standards
Certain land uses, building types, and development patterns consume more water
than others. In northeastern Illinois, residential rates of water use tend to be lower
in communities with more compact development.13 Compact development, as
well as water efficient plumbing, building, and landscaping standards can make it
easier for residents to reduce water use. In addition, implementing outdoor lawn
watering ordinances and other efficiency programs can reduce the amount of water
used throughout a community.
Reduce infrastructure costs through development design and location
Development patterns also play a role in water system design and infrastructure
maintenance. Larger lot sizes in widely dispersed development tracts typically
increase the length of pipes and other infrastructure needed to provide water
service. The additional infrastructure can lead to higher long-term costs due to
increased potential of water loss, replacement needs, and energy demands.
With water use held constant, studies have shown that a utility’s annualized
service costs per household for a ¼-acre residential lot are 50 percent less than
the costs for a 1-acre lot.14 At the same time, lower density developments have
fewer customers to shoulder the increased costs, leading to higher water prices
for residents.
The location of new development also matters. Infill development, as opposed to
greenfield development, can improve the efficiency of the system by increasing
the size of the customer base that helps maintain the existing infrastructure.
Greenfield development requires new infrastructure, and therefore, adds to the
system’s long-term capital costs.15
Water efficient plumbing fixtures can reduce water waste
and promote reuse
Compact development can minimize the amount of infrastructure needed
per household
Landscaping materials and watering restrictions can
reduce water use
17
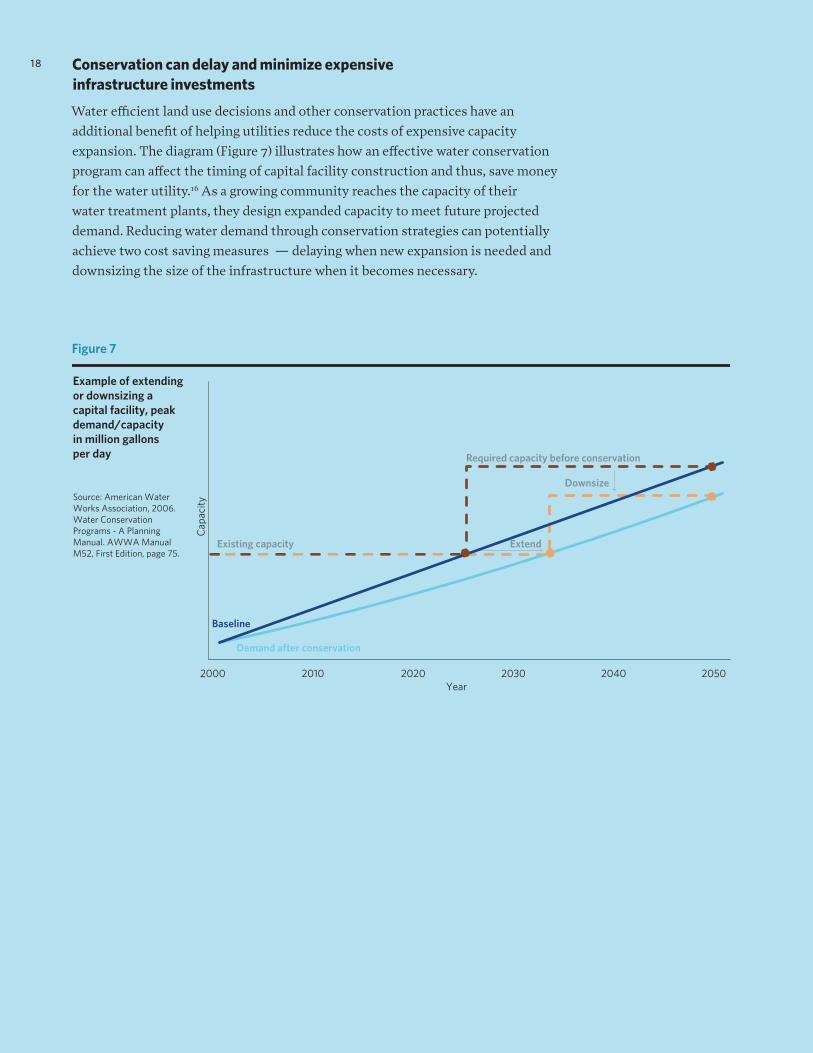
Conservation can delay and minimize expensive infrastructure investments
Water efficient land use decisions and other conservation practices have an
additional benefit of helping utilities reduce the costs of expensive capacity
expansion. The diagram (Figure 7) illustrates how an effective water conservation
program can affect the timing of capital facility construction and thus, save money
for the water utility.16 As a growing community reaches the capacity of their
water treatment plants, they design expanded capacity to meet future projected
demand. Reducing water demand through conservation strategies can potentially
achieve two cost saving measures — delaying when new expansion is needed and
downsizing the size of the infrastructure when it becomes necessary.
2000
Capa
city
Year2010 2020 2030 2040 2050
Example of extending or downsizing a capital facility, peak demand/capacity in million gallons per day
Source: American Water Works Association, 2006. Water Conservation Programs - A Planning Manual. AWWA Manual M52, First Edition, page 75.
Existing capacity
Baseline
Demand after conservation
Downsize
Required capacity before conservation
Extend
Figure 7
18

19
Increase conservation practices to maintain long-term supply
The ON TO 2050 Regional Water Demand Forecast reveals that existing
water supply challenges will continue to grow unless additional conservation
measures are taken. While overall water use is stable, forecasted water demand
will exceed available groundwater supplies in some areas. Addressing the water
supply constraints facing parts of the region will require increased conservation
practices throughout, not just in locations facing short-term supply challenges.
Regardless of a community’s location or source of water, water efficiency and
conservation is a critical strategy to maintain our long-term supply. ON TO 2050
recommends strategies to coordinate and conserve shared water supply resources.
By implementing conservation practices and carefully considering the location and
extent of new development, communities can work together to manage our shared
water resources.
20
Resources
For more information on how to incorporate water supply and demand
considerations into planning, see ON TO 2050 and the detailed conservation
best practices outlined in Water 2050.17,18 Download individual municipal water
demand forecasts, reported water withdrawals, and data on current and projected
demand drivers for 245 municipalities via the CMAP DataHub.
CMAP has an array of additional resources, including a model water conservation
ordinance and guides to full cost water pricing and landscaping irrigation
practices.19 To introduce fellow community leaders and elected officials to drinking
water management issues and solutions, see the Metropolitan Planning Council’s
Drinking Water 1-2-3.20
21

1 Chicago Metropolitan Agency for Planning, “ON TO 2050 Regional Water Demand Forecast for North-eastern Illinois, 2015-2050,” 2018, https://www.cmap.illinois.gov/programs/water/supply-planning/resources/2050-water-demand.
2 Chicago Metropolitan Agency for Planning, “ON TO 2050 Socioeconomic Forecast Appendix,” 2018, http://www.cmap.illinois.gov/documents/10180/911391/FINAL+Socioeconomic+Forecast+Appendix.pdf/84809136-9d7e-6a9e-f406-ff43c73744eb Additional population and employment values compare 2015 to 2050.
3 Ibid.
4 Abrams, Daniel B. 2017, “The Illinois Groundwater Flow Model: New Applications and Insights for North-eastern Illinois,” Presentation to the Northwest Water Planning Alliance Technical Advisory Committee on October 24, 2017.
5 Abrams, Daniel B. et all, 2015, “Changing Groundwater Levels in Sandstone Aquifers of Northern Illinois and Southern Wisconsin: Impacts on Available Water Supply,” Illinois State Water Survey, Contract Report 2015-02.
6 Walton R. Kelly, Daniel R. Hadley, Devin H. Mannix, “Shallow Groundwater Sampling in Kane Coun-ty, 2015,” Illinois State Water Survey, March 2016, http://www.isws.illinois.edu/pubdoc/CR/ISWSCR201604.pdf.
7 Walton R. Kelly, Samuel V. Panno, Keith Hackley, “The Sources, Distribution and Trends of Chloride in the Waters of Illinois,” Illinois State Water Survey, March 2012, http://www.isws.illinois.edu/pubdoc/B/ISWSB74.pdf.
8 “7-Day 10-Year Flow Maps,” Illinois State Water Survey, Prairie Research Institute, http://www.sws.uiuc.edu/docs/maps/lowflow/background.asp.
9 Abrams, Daniel B. “The Illinois Groundwater Flow Model: New Applications and Insights for Northeast-ern Illinois,” Presentation to the Northwest Water Planning Alliance Technical Advisory Committee on October 24, 2017.
10 Some water facilities rely on more than one water source and the proportion coming from each source can vary over time due to a variety of factors, including weather and infrastructure maintenance. To account for these variations, the forecast generated an average source mix from ten years of data (2003-13) and then used that ratio to estimate future water demand by source. Communities that made perma-nent transitions to different sources during this time period were accounted for; the average source mix was calculated from the time period using their new source.
11 Lall, U., T. Johnson, P. Colohan, A. Aghakouchak, C. Brown, G. McCabe, R. Pulwarty, and A. Sankarasu-bramanian, 2018: Water. In Impacts, Risks, and Adaptation in the United States: Fourth National Climate Assessment, Volume II [Reidmiller, D.R., C.W. Avery, D.R. Easterling, K.E. Kunkel, K.L.M. Lewis, T.K. May-cock, and B.C. Stewart (eds.)]. U.S. Global Change Research Program, Washington, DC, USA, pp. 145–173. doi: 10.7930/NCA4.2018.CH3.
12 Chicago Metropolitan Agency for Planning, “Water 2050: Northeastern Illinois Regional Water Supply/Demand Plan,” 2010, http://www.cmap.illinois.gov/programs/water/supply-planning/water-2050.
Endnotes22
13 Dziegielewski Benedykt, “Residential Water Use in Northeastern Illinois, Estimating Water-Use Effects of Infill Growth versus Exurban Expansion,” 2009, Southern Illinois University Carbondale, http://www.cmap.illinois.gov/documents/10180/14452/NE+IL+Residential+Water+Use.pdf/9a07c0d8-3733-48c3-94f6-abaa5bad1477.
14 Speir, Cameron and Stephenson, Kurt, “Does Sprawl Cost Us All: Isolating the Effects of Housing Patterns on Public Water and Sewer Costs,” 2002, Journal of the American Planning Association, 68:1, 56-70.
15 U.S. EPA, “Growing Toward More Efficient Water Use: Linking Development, Infrastructure, and Drinking Water Policies,” 2006, https://www.epa.gov/sites/production/files/2014-01/documents/growing_wa-ter_use_efficiency.pdf.
16 American Water Works Association, “Water Conservation Programs – A Planning Manual,” 2006. The savings available to a utility result from the difference in the present value of the costs associated with building a new facility in 2027 versus 2020, see page 75.
17 Chicago Metropolitan Agency for Planning, “Coordinate and conserve shared water supply resources,” ON TO 2050 Regional Comprehensive Plan, 2018, https://www.cmap.illinois.gov/2050/environment/water-supply.
18 Chicago Metropolitan Agency for Planning, “Water 2050: Northeastern Illinois Regional Water Supply/Demand Plan,” 2010, http://www.cmap.illinois.gov/programs/water/supply-planning/water-2050.
19 Chicago Metropolitan Agency for Planning, “Resources for Water Management,” https://www.cmap.illinois.gov/programs/water/supply-planning/resources.
20 Metropolitan Planning Council, “Drinking Water 1-2-3: A guide for local officials and community lead-ers,” 2018, https://drinkingwater123.metroplanning.org/.
23

FY19-0053 | IISG19-RCE-RLA-030 | APRIL 2019
The Chicago Metropolitan Agency for Planning (CMAP)
is our region’s comprehensive planning organization.
The agency and its partners developed and are now
implementing ON TO 2050, a new long-range plan to help
the seven counties and 284 communities of northeastern
Illinois implement strategies that address transportation,
housing, economic development, open space, the
environment, and other quality-of-life issues.
See www.cmap.illinois.gov for more information.
Funding acknowledgment This project was supported through the CMAP Water
Resources Planning program, which is funded by the
Illinois Department of Natural Resources and Illinois
Environmental Protection Agency. CMAP would like to
thank Illinois Department of Natural Resources Office
of Water, Illinois State Water Survey, Illinois-Indiana
Sea Grant, and University of Illinois Extension for their
support of this project.