Embed Size (px)
Citation preview
1. FISCAL CONSOLIDATION TARGETS, PLANS AND MEASURES IN OECD COUNTRIES – 1
RESTORING PUBLIC FINANCES, 2012 UPDATE © OECD 2012
Chapter 1
Fiscal consolidation targets, plans
and measures in OECD countries
This chapter discusses the consolidation efforts of OECD countries as of December 2011.
The data on fiscal deficit and gross debt for EU countries are updated based on actual
figures for 2010 and 2011, and recently adopted fiscal consolidation is taken into account
mainly for some countries that had not adopted the 2012 budget before the survey
deadline.
The chapter analyses current fiscal positions and announced fiscal strategies,
consolidation plans, deficit reduction plans, the specific measures aimed at expenditure
reduction and revenue enhancement, and recent reforms regarding pensions.
The statistical data for Israel are supplied by and under the responsibility of the relevant Israeli authorities. The use of
such data by the OECD is without prejudice to the status of the Golan Heights, East Jerusalem and Israeli settlements
in the West Bank under the terms of international law.

2 – 1. FISCAL CONSOLIDATION TARGETS, PLANS AND MEASURES IN OECD COUNTRIES
RESTORING PUBLIC FINANCES, 2012 UPDATE © OECD 2012
Introduction
Public finances are still in a dire position in many OECD member countries
Five years after the global financial crisis and two years after the start of the European
sovereign debt crisis most OECD countries have adopted fiscal consolidation packages
and are implementing substantial consolidation initiatives. In some countries, the crises
have led to record unemployment, economic stagnation, and vulnerable banks. A change
of government has occurred in several countries1 where the policy towards austerity and
debt reduction was an important element behind such change.
Supported by an economic recovery in 2010 and 2011 the current fiscal stance of
most OECD countries has strengthened over this period. However, as the economic
recovery faces obstacles, and in some countries it even turns into recession, voices calling
for a renewed focus on economic growth to complement the austerity packages have
become prominent. This is well reflected in financial markets, where fears come now
from many fronts, not just from fiscal austerity.
This report provides a comparative and transparent picture of OECD countries’
consolidation plans. For those countries that have adopted such plans, their time frame
typically extends to 2015. The survey presents, in a comparable way, current fiscal
positions and announced fiscal strategies, consolidation plans, and detailed expenditure
and revenue measures for 32 OECD member countries.2
Box 1.1. Definitions
What is consolidation? In this report, fiscal consolidation is defined as concrete policies
aimed at reducing government deficits and debt accumulation, e.g. active policies to improve the
fiscal position. Merely announcing an ambitious deficit target over the medium term with no
accompanying consolidation plan on how to achieve the deficit target is not regarded as
consolidation in this analysis. Consolidation plans and detailed measures are given as a per cent
of nominal GDP. The measures are quantified to the extent possible.
Deficits can also be reduced by economic growth leading to more revenues and less
expenditure, e.g. regarding unemployment, when more people find jobs (cycle effects). General
labour market and product market reforms are important for spurring economic growth
(e.g. changes in labour regulation or making product markets more competition-friendly). Such
reforms and cycle effects, however, have not been included in the present report.
There is no clear, uniform definition of what constitutes a spending reduction or a revenue
measure (e.g. tax expenditures) in a consolidation plan. In this analysis, measures are listed as
reported by countries. Normally, these measures would relate to the budget of the year before the
start of the consolidation plan (or the first year’s budget) or a forecasted baseline assuming
policies are unchanged. The consolidation plans and quantified measures are presented with a
cumulative impact over the consolidation period.
During the past two years, the economy in the OECD area partly recovered
and deficits shrank
This sub-section presents some key economic indicators based on the latest
OECD Economic Outlook projections (OECD, 2012a).
In most OECD countries, the economic recovery of 2010 was followed by subdued
growth in 2011, due to an economic slowdown following the euro-area debt crisis
(Figure 1.1A). At the beginning of 2012, the economy of most OECD countries came to a

1. FISCAL CONSOLIDATION TARGETS, PLANS AND MEASURES IN OECD COUNTRIES – 3
RESTORING PUBLIC FINANCES, 2012 UPDATE © OECD 2012
halt, with growth expectations turning bleaker in the following months. The OECD
expects that Japan, Canada and the United States will continue to enjoy reasonable
growth, whereas in Europe the outlook remains weak. The OECD expects that growth
will resume in 2013.
Owing to fiscal consolidation, structural reforms and general economic recovery, the
fiscal deficit of OECD countries shrank from 8.1% of GDP in 2009, to 7.5% of GDP in
2010 and to 6.3% in 2011 (Figure 1.1B). Such deficits would be unsustainable over a
longer run, but they are expected to narrow further to 5.3% in 2012 and 4.2% of GDP in
2013. The future increase of expenditures related to the ageing population in many OECD
countries will add to the challenge of an unsustainable financial situation.
Figure 1.1. Key economic indicators (OECD area)
StatLink 2 http://dx.doi.org/10.1787/888932696628
Notes: Fiscal balance is general government financial balance and gross debt is general government financial
liabilities as a per cent of nominal GDP. The underlying balance is general government financial balance
adjusted for the cycle and one-offs as a per cent of potential GDP. They are weighted averages.
Source: OECD (2012), OECD Economic Outlook, Vol. 2012/1 (No. 91), OECD Publishing,
doi:10.1787/eco_outlook-v2012-1-en.

4 – 1. FISCAL CONSOLIDATION TARGETS, PLANS AND MEASURES IN OECD COUNTRIES
RESTORING PUBLIC FINANCES, 2012 UPDATE © OECD 2012
Most OECD countries are implementing consolidation measures according to their
revised plans that are somewhat less front-loaded than presented in last year’s report.
While most of these consolidation measures are structural, some countries have also
applied substantial one-off measures and changes in accounting practices that may be
ephemeral. The structural challenge remains considerable in most OECD countries, not
only because of the responses to the fiscal crisis but also due to previous structural
deficits (Figure 1.1C). This is partly reflected in debt stocks, that continued to grow in the
past two years, pushing total gross debt in the OECD area to 103% of GDP in 2011 with
further increases expected in the next two years (Figure 1.1D).
Financial markets and politics influence consolidation
At a time when economic growth is still fragile and some OECD member countries
are in or on the brink of recession, no easy trade-offs exist between short-term growth and
the need to consolidate.
Pressures for fiscal consolidation remain strong. There is still a risk of serious
financial problems in several European countries. The high, and in some countries rising,
long-term sovereign bond yields show the financial market reactions to indications that
fiscal positions are unstable without substantial consolidation efforts. The high bond
yields demonstrate that the financial markets have serious concerns about governments’
ability to comply with repayment terms. Three OECD countries in the euro area (Greece,
Ireland and Portugal) have experienced serious financing problems and have entered into
programmes with the European Commission (EC), the European Central Bank (ECB) and
the International Monetary Fund (IMF) in order to secure sustainable financing. In
contrast, one country (Iceland) has successfully completed its IMF programme since last
year’s report. In addition, all countries are exposed to close scrutiny by the financial
markets and to financial risk assessment by the rating agencies, and some OECD
countries are at risk of downgrading. During the last year, some OECD countries lost
their triple A rating and other countries were set to a negative outlook.
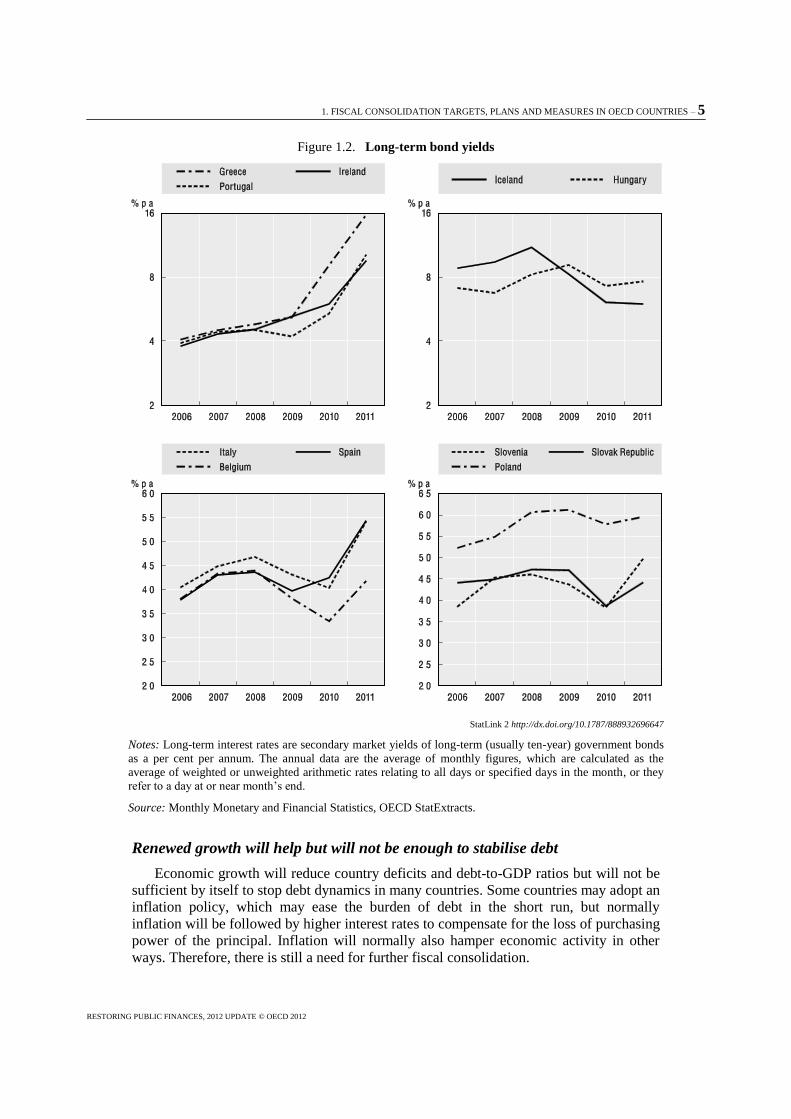
Figure 1.2 displays the development of long-term sovereign bond yields (ten years)
for different sets of countries. First, there are three countries that have long-standing
programmes with the EU and/or the IMF (Figure 1.2A). The situations in Greece and
Portugal are especially dire. Second, Hungary and Iceland keep facing very high
long-term yields – the former while seeking a programme with the IMF, the latter after
completing one (Figure 1.2B).
Large and long-standing EU economies have experienced different reactions by the
financial markets. While France and the United Kingdom have up to now succeeded in
providing credible fiscal consolidation plans in which the financial markets have
sufficient confidence, Italy and Spain have experienced serious reactions in the financial
markets which have triggered policy reactions. Belgium also experienced rising long-term
interest rates in 2011 (Figure 1.2C).
Some of the recent EU members that are OECD members also observed strong
challenges in 2011 concerning a lack of confidence in the financial markets resulting in
high and rising sovereign bond yields (Figure 1.2D).
Higher long-term interest rates and debt levels could hamper future economic growth,
increase the vulnerability of public finances to shifting market sentiments, and reduce the
scope for fiscal policies to counteract future economic downturns.
1. FISCAL CONSOLIDATION TARGETS, PLANS AND MEASURES IN OECD COUNTRIES – 5
RESTORING PUBLIC FINANCES, 2012 UPDATE © OECD 2012
Figure 1.2. Long-term bond yields
StatLink 2 http://dx.doi.org/10.1787/888932696647
Notes: Long-term interest rates are secondary market yields of long-term (usually ten-year) government bonds
as a per cent per annum. The annual data are the average of monthly figures, which are calculated as the
average of weighted or unweighted arithmetic rates relating to all days or specified days in the month, or they
refer to a day at or near month’s end.
Source: Monthly Monetary and Financial Statistics, OECD StatExtracts.
Renewed growth will help but will not be enough to stabilise debt
Economic growth will reduce country deficits and debt-to-GDP ratios but will not be
sufficient by itself to stop debt dynamics in many countries. Some countries may adopt an
inflation policy, which may ease the burden of debt in the short run, but normally
inflation will be followed by higher interest rates to compensate for the loss of purchasing
power of the principal. Inflation will normally also hamper economic activity in other
ways. Therefore, there is still a need for further fiscal consolidation.

6 – 1. FISCAL CONSOLIDATION TARGETS, PLANS AND MEASURES IN OECD COUNTRIES
RESTORING PUBLIC FINANCES, 2012 UPDATE © OECD 2012
Box 1.2. Iceland’s recovery
In 2011, Iceland successfully completed its three-year IMF-supported adjustment programme
worth USD 2.1 billion. The programme aimed at stabilising the exchange rate, making public
finances sustainable, and restructuring the financial system. All three of these objectives were
met.
The Icelandic economy returned to buoyant growth above 3% of GDP in 2011. The growth
rate is expected to moderate to 2.75% in 2012. Unemployment should fall to 5% by the end of
2013, and inflation should be on the way down to the authorities’ target (OECD, 2012a).
Before the crisis, Iceland had a banking sector that represented about ten times the national
GDP. The government restructuring of the banks resulted in a large increase in government debt
and imposed an urgent need to restore the government finances. The banking sector has now been
rationalised to two times the national GDP, and the core banking system has been recapitalised
and is fully functioning.
The government is pursuing needed fiscal consolidation and is committed to a surplus in
2014 as certain conditions are in place, mainly related to the stability of the financial system and
the strength of Iceland’s international reserves position. The government has taken the
opportunity of the crisis to redesign its fiscal rules and its medium-term fiscal framework. More
details are provided in the country note in Chapter 2 of this report.
Box 1.3. Calculation of the fiscal consolidation requirement
The OECD has calculated the fiscal consolidation requirement to stabilise general
government gross debt or to target a 60% debt-to-GDP ratio in the long-run perspective. The
required improvement is shown for the general government underlying primary balance which is
the cyclically adjusted balance excluding one-off revenue and spending measures, and interest
payments. The calculations were based on inter alia plausible, but stylised assumptions on
economic growth, interest rates and unemployment.
Figure 1.3 shows the total consolidation required to stabilise debt or achieve a gross general
government debt-to-GDP ratio equal to 60% of GDP by 2030, assuming the projected
improvement in the underlying primary balance between 2011 and 2013 conforms with
short-term projections in the OECD Economic Outlook, Vol. 2012/1 (No. 91) (OECD, 2012a),
with an additional constant improvement in the underlying primary balance each year between
2013 and 2030 of 0.5% of GDP (1% per annum for Japan) calculated so as to achieve the debt
target by 2030 (2040 for Japan). Consolidation requirements following changes in ageing-related
public spending and upward pressure on health spending are not explicitly included in the
calculations of fiscal consolidation requirements.
The figure shows the average improvement in the underlying primary balance between 2011
and 2030 necessary to stabilise government debt-to-GDP ratios or to bring them down to 60% of
GDP. When simply stabilising debt ratios, the average increase in the underlying primary
balance over this period corresponds closely to the peak increase over the same period. When
targeting 60%, however, the peak increase will be substantially higher than the average increase,
but past the peak the fiscal policy can be loosened and the underlying primary balance can
decrease before the debt ratio stabilises at 60% of GDP. More details on calculations and
essential assumptions are specified in the OECD Economic Outlook, Vol. 2012/1 (No. 91) (in
particular Box 4.2 on assumptions in the baseline long-term economic scenario, and Figure 4.1).
1. FISCAL CONSOLIDATION TARGETS, PLANS AND MEASURES IN OECD COUNTRIES – 7
RESTORING PUBLIC FINANCES, 2012 UPDATE © OECD 2012
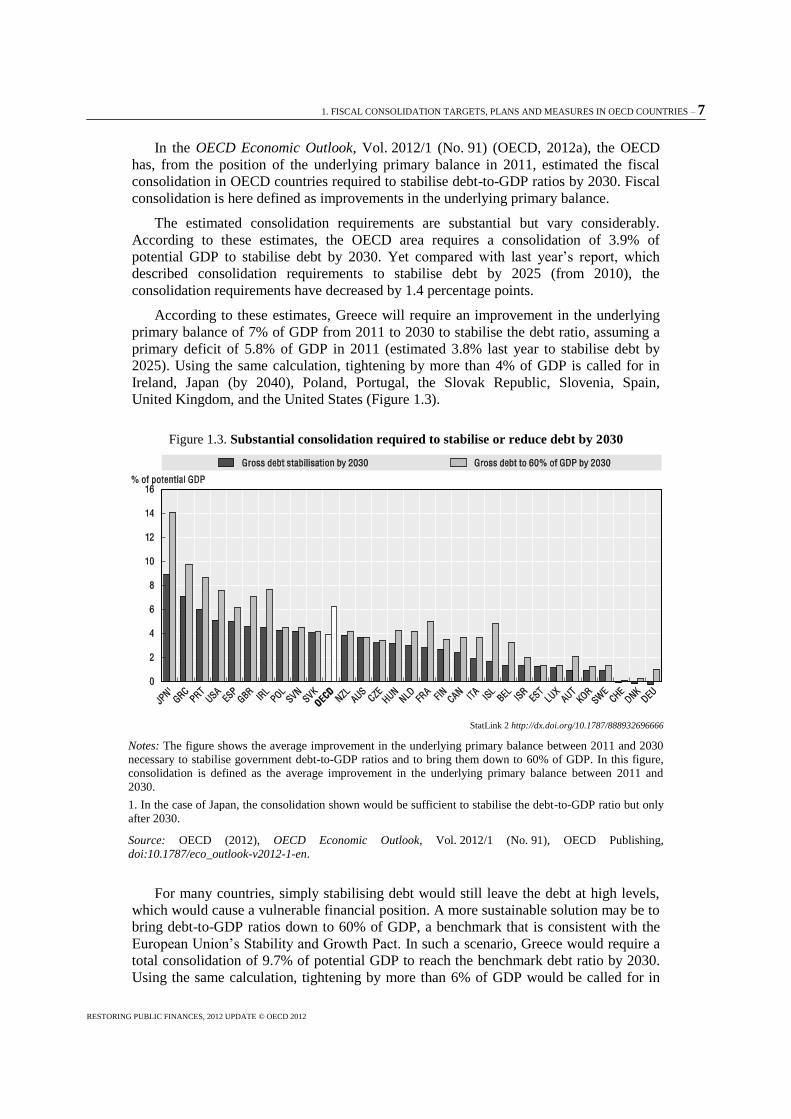
In the OECD Economic Outlook, Vol. 2012/1 (No. 91) (OECD, 2012a), the OECD
has, from the position of the underlying primary balance in 2011, estimated the fiscal
consolidation in OECD countries required to stabilise debt-to-GDP ratios by 2030. Fiscal
consolidation is here defined as improvements in the underlying primary balance.
The estimated consolidation requirements are substantial but vary considerably.
According to these estimates, the OECD area requires a consolidation of 3.9% of
potential GDP to stabilise debt by 2030. Yet compared with last year’s report, which
described consolidation requirements to stabilise debt by 2025 (from 2010), the
consolidation requirements have decreased by 1.4 percentage points.
According to these estimates, Greece will require an improvement in the underlying
primary balance of 7% of GDP from 2011 to 2030 to stabilise the debt ratio, assuming a
primary deficit of 5.8% of GDP in 2011 (estimated 3.8% last year to stabilise debt by
2025). Using the same calculation, tightening by more than 4% of GDP is called for in
Ireland, Japan (by 2040), Poland, Portugal, the Slovak Republic, Slovenia, Spain,
United Kingdom, and the United States (Figure 1.3).
Figure 1.3. Substantial consolidation required to stabilise or reduce debt by 2030
StatLink 2 http://dx.doi.org/10.1787/888932696666
Notes: The figure shows the average improvement in the underlying primary balance between 2011 and 2030
necessary to stabilise government debt-to-GDP ratios and to bring them down to 60% of GDP. In this figure,
consolidation is defined as the average improvement in the underlying primary balance between 2011 and
2030.
1. In the case of Japan, the consolidation shown would be sufficient to stabilise the debt-to-GDP ratio but only
after 2030.
Source: OECD (2012), OECD Economic Outlook, Vol. 2012/1 (No. 91), OECD Publishing,
doi:10.1787/eco_outlook-v2012-1-en.
For many countries, simply stabilising debt would still leave the debt at high levels,
which would cause a vulnerable financial position. A more sustainable solution may be to
bring debt-to-GDP ratios down to 60% of GDP, a benchmark that is consistent with the
European Union’s Stability and Growth Pact. In such a scenario, Greece would require a
total consolidation of 9.7% of potential GDP to reach the benchmark debt ratio by 2030.
Using the same calculation, tightening by more than 6% of GDP would be called for in

8 – 1. FISCAL CONSOLIDATION TARGETS, PLANS AND MEASURES IN OECD COUNTRIES
RESTORING PUBLIC FINANCES, 2012 UPDATE © OECD 2012
Ireland, Japan, Portugal, Spain, the United Kingdom and the United States. The following
countries would need to consolidate between 4% and 6% of GDP by 2030: France,
Hungary, Iceland, Italy, the Netherlands, New Zealand, Poland, and Slovenia. The OECD
area will need a total consolidation of 6.3% of potential GDP to curb debt to 60% of GDP
by 2030 (an increase of 0.1 percentage points from the estimate aiming for 2025, as
reported in last year’s report).
Four categories of countries in regard to fiscal consolidation
OECD countries are facing different consolidation needs and are responding
differently to them. Since last year’s report, the background for grouping countries has
changed somewhat: three countries have entered into programmes supported by the
European Commission, the European Central Bank and the International Monetary Fund;
several countries with relatively high consolidation needs are experiencing distinct
market pressure measured by the long-term government bond yields; and most countries
have adopted new measures and extended the implementation period. To capture such
heterogeneity, this report classifies countries into four groups as described below.
Category A. Countries with IMF/EU/ECB programmes
This category includes countries with a formal and ongoing programme with the
International Monetary Fund, the European Central Bank, and/or the European
Commission. Three OECD countries are in this position: Greece, Ireland and Portugal.
Such countries have formally committed to introducing substantial consolidation
measures and wide-ranging structural reforms. These countries have adopted the largest
consolidation packages for 2012-15, between 5.2% and 8.2% of GDP, averaging 6.6% of
GDP. According to OECD calculations, these countries have to consolidate by 8.7% on
average to achieve a debt-to-GDP ratio of 60% of GDP by 2030.
Category B. Countries under distinct market pressure
This category includes OECD countries with an average consolidation requirement
over the period 2012-30 above 3% of GDP and with an experienced change in long-term
interest rates over the period 2006-11 equal to or above zero. This category includes
Belgium, Hungary, Italy, Poland, the Slovak Republic, Slovenia and Spain.
These countries have observed close scrutiny from volatile financial markets;
however, they have been able to finance their debts without external programmes. In
particular, Italy and Spain have observed rising long-term interest rates since late 2011.
The markets eased to some extent thanks to the intervention of the ECB earlier in 2012.
However, the long-term interest rates are very high compared to Germany. Iceland still
faces high long-term interest rates after the completion of its IMF programme but high
interest rates are not new for this country and the interest rates actually have been reduced
over the period 2006-11. Belgium and Poland have experienced a positive development
of their long-term interest rates in the first half of 2012, which indicates a renewed
confidence of the financial markets. Nevertheless, the two countries still have a
substantial spread compared to Germany.
These countries have seen their interest rates increase over the period 2006-11. In
addition, these countries have large long-term fiscal consolidation needs, as calculated by
the OECD, ranging from 3.2% of GDP to 6.1%, and averaging 4.3% of GDP. They are
obliged to demonstrate decisive and credible fiscal policy to curb the deficit. Except for
Poland, the struggle to design and adopt fiscal consolidation has led to political

1. FISCAL CONSOLIDATION TARGETS, PLANS AND MEASURES IN OECD COUNTRIES – 9
RESTORING PUBLIC FINANCES, 2012 UPDATE © OECD 2012
turbulence and the fall of governments. These seven countries have adopted consolidation
packages for 2012-15 ranging between 2.3% and 5.2% of GDP, averaging 3.7% of GDP.
Category C. Countries with substantial deficits and/or debt but less market
pressure
Category C includes OECD countries which meet one or more of the following
criteria: an average consolidation requirement over the period 2012-30 higher than 3% of
GDP, an estimated average general government fiscal deficit of 2011-12 above 3% of
GDP, or the 2011 general government gross debt above 60% of GDP.
Several OECD countries that are members of the EU and have an ongoing excessive
deficit procedure with the European Commission fall into this category. In addition to the
seven EU countries in category B and the three countries in category A, the following
seven countries are being assessed by the European Commission in their efforts to reduce
the general government deficit below 3% of GDP: Austria, the Czech Republic,
Denmark, France, Germany3, the Netherlands, and the United Kingdom. According to
OECD calculations, these seven countries have varying long-term consolidation needs,
ranging up to 7% of GDP. All of these countries have adopted consolidation packages for
2012-15 ranging between 1.4% and 4.3% of GDP, of which France and the
United Kingdom have the largest volumes.
Other countries have not experienced external pressure to the same degree as the
countries mentioned above. However, four of these countries have introduced fiscal
consolidation plans or fiscal strategies in order to curb deficit and/or reduce debt: Canada,
Finland, Israel and New Zealand. In addition, Iceland has finished its IMF programme to
curb debt. These countries have either a deficit above 3% of GDP, a gross debt above
60% of GDP or a long-term average consolidation requirement above 3% of GDP. Most
of these countries have substantial long-term consolidation needs, ranging between 2%
and 4.8%. Most of the countries have adopted consolidation packages for 2012 and
beyond, ranging between 1.5% and 4.1% of GDP, to reduce the deficit or curb the debt.
Japan and the United States also have large long-term consolidation needs, high
debt-to-GDP ratios, and persistent and substantial deficits, but have not yet adopted
comprehensive consolidation strategies.
The average fiscal consolidation for 2012-15 adopted by the countries of category C
is 2.6% of GDP against a calculated average long-term consolidation need of 4.5% of
GDP.
Category D. Countries with no or marginal consolidation needs
Finally, there are ten countries that do not have consolidation at all or have announced
a very limited consolidation effort, for the simple reason that they do not need to
consolidate to achieve fiscal sustainability: Australia, Chile, Estonia, Korea,
Luxembourg, Mexico, Norway, Sweden, Switzerland and Turkey. These countries have
low long-term consolidation needs (on average 1.5% of GDP), their long-term interest
rates are reduced over the period 2006-11, and they have both low deficits (below or
close to 3% of GDP, or surpluses) and low gross debt-to-GDP ratios (below 50% of
GDP).

10 – 1. FISCAL CONSOLIDATION TARGETS, PLANS AND MEASURES IN OECD COUNTRIES
RESTORING PUBLIC FINANCES, 2012 UPDATE © OECD 2012
Evolution of fiscal deficits and gross debt
In this report, fiscal consolidation is defined as “active policies to improve the fiscal
position” (see Box 1.1 above). This guideline excludes any expected cyclical
improvements in deficits following an automatic rise in revenue and/or decrease in
entitlement spending associated with a recovering economy. By the same token, changes
in the fiscal stance stemming from policies aimed at promoting growth, while important
and desirable, are also more difficult to predict and quantify with confidence, and are thus
outside the scope of this report.
This section begins by first studying how fiscal deficits and debt have developed up
to 2011. Then it looks at targets for fiscal balance and gross debt. The next section
(1.4 below) will describe fiscal consolidation plans and the share of quantified, specific
measures in those plans.
Strengthened fiscal position after two-three years of fiscal consolidation
Substantial improvements in fiscal balances 2009-11
Most OECD countries have implemented substantial deficit reductions since 2009,
the year in which the most countries faced their highest fiscal deficit due to the combined
effects of the financial crisis and fiscal stimulus to recover economic growth. The average
improvement in overall fiscal deficit is about 2% of GDP in the OECD area. Hungary
(category B), Greece and Portugal (category A), followed by Iceland (category C) and
Turkey (category D) have achieved the largest improvements of the fiscal balance.
Greece, Hungary and Portugal are the three countries with the most impressive
improvements of the fiscal balance, by respectively 6.4, 8.6 and 5.9 percentage points of
GDP (from deficits of 15.6%, 4.5% and 10.2% respectively). Iceland and Turkey have
improved the fiscal balance by more than four percentage points from 2009 to 2011
(Figure 1.4).
On the contrary, the only country with a substantially widened fiscal deficit in this
period is New Zealand, primarily due to the impact of the earthquake in the Canterbury
region in 2010. Japan and Slovenia had a small increase in the fiscal deficit in this period.
Reductions of deficits in the period 2009-11 cannot be attributed to fiscal
consolidation only. The economy in most OECD countries recovered in this period,
which also had an impact on the development of the overall fiscal balance due to cyclical
improvements on the balance. Countries like, for example, Germany and Turkey have
experienced stronger improvements of the overall fiscal balance in this period than were
anticipated in their consolidation plans.
The impression shifts a little when looking at the underlying balance (structural). All
countries in category A have made substantial improvements in the underlying balance,
more than 2.8 percentage points of GDP. Greece and Iceland have improved their
underlying balance by 8.5 and 7.7 percentage points of GDP respectively. In category B,
all countries except Hungary improved their underlying balance between 0.5 percentage
points (Belgium) and 3.9 percentage points of GDP (Spain). In category C, the
Czech Republic has improved its underlying balance by 3 percentage points of GDP.
Estonia (category D) has improved the balance by 1.9 percentage points of GDP.

1. FISCAL CONSOLIDATION TARGETS, PLANS AND MEASURES IN OECD COUNTRIES – 11
RESTORING PUBLIC FINANCES, 2012 UPDATE © OECD 2012
Figure 1.4. Change in general government fiscal balances between 2009 and 2011
StatLink 2 http://dx.doi.org/10.1787/888932696685
Notes: The fiscal balance is the general government financial balance as a per cent of GDP. The overall
financial balance includes one-off factors, such as those resulting from the sale of mobile telephone licenses,
and are composed of the underlying, structural balance and the cyclical balance. The underlying balance, or
structural balance, is adjusted for the cycle and one-offs. The OECD average is unweighted (the
Slovak Republic and Turkey are not included).
Source: OECD (2012), OECD Economic Outlook, Vol. 2012/1 (No. 91), OECD Publishing,
doi:10.1787/eco_outlook-v2012-1-en. (OECD Economic Outlook No. 90 for Turkey).
Deviations from the deficit targets in 2010-11 vary
The OECD has calculated the deviation of the actual fiscal balance in 2010 and 2011
compared to the targeted fiscal balances described in last year’s report. Estonia, Denmark,
Germany, Hungary and Turkey have achieved a substantial positive deviation from the
planned figures. Except Hungary, these countries belong to categories C and D and are
not very affected by severe consolidation. Hungary substantially improved its balance by
one-off measures adopted in 2011, including the transfer of the assets of the private sector
pension funds to the government. Denmark, Estonia, Germany and Turkey have
experienced a more solid economic recovery than expected, which has resulted in a better
fiscal balance. Belgium, Poland and Portugal (categories A and B) also performed better
than targeted over the period, as well as Austria, the Czech Republic, Finland, France and
the United States (category C). By contrast, New Zealand experienced a widening deficit
in 2011 due to the negative fiscal shock of earthquakes in the Canterbury region. Greece
(category A), Slovenia and Spain (category B) and the United Kingdom (category C)
experienced a negative deviation from targets larger than 1% of GDP over the two-year
period (Figure 1.5).

12 – 1. FISCAL CONSOLIDATION TARGETS, PLANS AND MEASURES IN OECD COUNTRIES
RESTORING PUBLIC FINANCES, 2012 UPDATE © OECD 2012
Figure 1.5. Difference between implemented and planned fiscal balance in 2010 and 2011
StatLink 2 http://dx.doi.org/10.1787/888932696704
Notes: This figure shows the annual deviation of the fiscal deficit in 2010 and 2011 compared to the targeted
fiscal deficit presented in last year’s report. 2010 data for Denmark, Italy, the Netherlands, Switzerland and the
United States are not available and these countries are not included in the OECD average.
Sources: OECD Fiscal Consolidation Survey 2012, and OECD (2011), “Restoring Public Finances: Fiscal
Consolidation in OECD Countries”, Special issue of the OECD Journal on Budgeting, Volume 2011/2,
doi:10.1787/budget-v11-2-en.
Gross debt has surged since the financial crisis
Gross debt in most OECD countries has surged after 2007. The OECD average rise in
debt is 28.5 percentage points of GDP. Greece and Ireland (category A) and Iceland
(category C, previously with an IMF programme) are the three countries with the largest
increase of debt burdens. The debt in these countries has increased by 55 to 85 percentage
points of GDP, owing to the collapse of the banking sector in Iceland and Ireland and to
the severe problems of the Greek public finances. Portugal (category A), Spain
(category B) and Japan, the United Kingdom and the United States (category C) have all
seen their debt rise by 32.9 to 50.7 percentage points of GDP during the four years 2007-
11 (Figure 1.3B). The only countries that have reduced general government gross debt
during this period are Israel, Norway, Sweden and Switzerland (except Israel, all these
countries are in category D with no or marginal consolidation needs): their debt has
dropped by up to 5.8 percentage points of GDP, except Norway which reduced its debt by
22.9 percentage points of GDP.

1. FISCAL CONSOLIDATION TARGETS, PLANS AND MEASURES IN OECD COUNTRIES – 13
RESTORING PUBLIC FINANCES, 2012 UPDATE © OECD 2012
Figure 1.6. Change in gross debt from 2007 to 2011
StatLink 2 http://dx.doi.org/10.1787/888932696723
Note: Gross debt is general government gross financial liabilities as a per cent of GDP (SNA basis).
Sources: OECD (2012), OECD Economic Outlook, Vol. 2012/1 (No. 91), OECD Publishing,
doi:10.1787/eco_outlook-v2012-1-en, and OECD calculations.
Deficit reduction targets for 2014
Considerable deficit reductions are planned in the next few years
From their fiscal position in 2011, 15 OECD countries still intend to reduce their
fiscal deficit by 2.4 percentage points of GDP (the OECD area average) or more by 2014
(Figure 1.7). As many countries have extended their consolidation plans beyond 2014, the
total deficit reduction target is even larger. New Zealand is aiming for the largest
reduction in its deficit over the forecast horizon, from 9.2% of GDP in 2011 to 0.4% of
GDP in 2014. Greece, Ireland, Slovenia and Spain (categories A and B) are targeting a
deficit reduction of 4.4-6.3 percentage points of GDP by 2014, though these countries
(except Ireland) in 2010 and 2011 missed the deficit targets considerably (see Figure 1.5
above). Iceland and the United States (category C) plan to reduce their deficits by 4.1 and
6.4 percentage points of GDP respectively. Italy and Poland (category B), France and the
United Kingdom (category C) and Australia (category D) aim for deficit reductions
between 3 and 4 percentage points of GDP. Portugal (category A), Belgium and the
Slovak Republic (category B) plan for deficit reductions ranging between 2.4 and
2.9 percentage points of GDP. On the contrary, Hungary (category B) will see the 2011
surplus reverted into a deficit of about 2% of GDP given the concentration of large
one-off revenue-enhancing measures in 2011. Finland (category C) experienced a better
result than expected in 2010 and 2011, but the Finnish government expects a larger deficit
in the following years.

14 – 1. FISCAL CONSOLIDATION TARGETS, PLANS AND MEASURES IN OECD COUNTRIES
RESTORING PUBLIC FINANCES, 2012 UPDATE © OECD 2012
Figure 1.7. Intended fiscal balance from 2011 to 2014
StatLink 2 http://dx.doi.org/10.1787/888932696742
Notes: Deficit improvement is defined as the change from the overall fiscal deficit in 2011 to the targeted
deficit in 2014. The change in the fiscal deficit is reported by the national authorities and/or calculated by the
OECD. Denmark: 2013 instead of 2014. Japan: data based on last year’s report. 2014 data for Norway are not
available and this country is not included in the OECD average. Data for the United States are drawn from
Congressional Budget Office (2012), “Updated Budget Projections: Fiscal Years 2012 to 2022”, CBO, March,
www.cbo.gov/publications/43119.
Source: OECD Fiscal Consolidation Survey 2012.
Figure 1.8 plots the programmed fiscal balances for countries with the largest deficit
reduction targets to 2015. The figure also includes countries that had announced the
largest consolidation programmes by the end of 2011 (see Section 1.5 below). From
slightly different starting points, the projected pace in the improvement of deficits is
fairly similar across most countries. One clear exception is Hungary, due to the
exceptional one-off measures described above.
Gross debt projections 2007-15: still rising debts
A country’s gross debt level is an important indicator of long-term fiscal
sustainability. In the last OECD Economic Outlook (OECD, 2012a), the OECD projected
that the weighted average gross debt of OECD member countries would increase from
103% of GDP in 2011 to 111% in 2015 (Figure 1.9). This is a significant increase from
the pre-crisis level of 74% of GDP recorded in 2007, when only three countries (Greece,
Italy and Japan) exceeded a debt level of 100% of GDP. The OECD expects that, by
2015, ten OECD countries will carry a debt load in excess of 100% of GDP, namely
Greece, Ireland and Portugal (category A), Belgium and Italy (category B), France,
Iceland, Japan, the United Kingdom and the United States (category C) (Figure 1.9).

1. FISCAL CONSOLIDATION TARGETS, PLANS AND MEASURES IN OECD COUNTRIES – 15
RESTORING PUBLIC FINANCES, 2012 UPDATE © OECD 2012
Figure 1.8. Deficit trends (2011-15)
StatLink 2 http://dx.doi.org/10.1787/888932696761
Notes: The reported data are general government financial balances (on a Maastricht basis for EU countries) as
a per cent of nominal GDP except the United States (federal government). Data for the United States are drawn
from Congressional Budget Office (2012), “Updated Budget Projections: Fiscal Years 2012 to 2022”, CBO,
March, www.cbo.gov/publications/43119. Data for Italy are drawn from “Italy’s Stability Programme”
(Ministry of Finance, April 2012).
1. Japan’s deficit target is the primary balance, which is defined by the government as the fiscal balance minus
net receivable interest. Data for 2011-14 are based on last year’s report.
Sources: OECD Fiscal Consolidation Survey 2012, and OECD (2011), “Restoring Public Finances: Fiscal
Consolidation in OECD Countries”, Special issue of the OECD Journal on Budgeting, Volume 2011/2,
doi:10.1787/budget-v11-2-en.

16 – 1. FISCAL CONSOLIDATION TARGETS, PLANS AND MEASURES IN OECD COUNTRIES
RESTORING PUBLIC FINANCES, 2012 UPDATE © OECD 2012
Box 1.4. Hungary
In 2011, the general government fiscal balance of Hungary surged to a surplus estimated at 4.2%,
influenced by significant one-off items – primarily an asset transfer from private pension funds to the
state pension pillar. Despite a relatively favourable fiscal position in 2011, three years of sizeable fiscal
consolidation from 2006 to 2009, and additional planned consolidation for 2012 and beyond, a recent
deterioration in the underlying balance called for renewed efforts in 2012. This need was recognised by
the financial markets, as long-term interest and credit default swap rates on public debt have risen
significantly since the second quarter of 2011, the sovereign rating was downgraded to non-investment
grade, and several debt auctions failed or partially failed in late 2011.
The Hungarian government plans for a fiscal deficit of 2.5% of GDP in 2012. The government has
forecasted that the debt-to-GDP ratio will decline each year from 80.6% due to one-off measures in
2011, continuing fiscal consolidation and the impact of structural measures.
On 24 January 2012, the European Council decided to take action against Hungary, noting that the
country did not comply with the Council recommendation to correct the excessive deficit in a
sustainable manner. On 21-22 June 2012, the European finance ministers agreed that Hungary has taken
the necessary corrective action to achieve its targets and adopted a proposal for a Council decision to
lift the imposed suspension of EU funds in 2013. However, in July 2012 the IMF together with
representatives from the European Commission and observers from the European Central Bank started
discussions on an IMF/EU-supported programme following a request by the Hungarian authorities.
The current difficulties in Hungary come after substantial fiscal consolidation in the past,
adjustments of the fiscal rules and the budgetary framework, and an EUR 12.3 billion programme with
the IMF in 2008-10. More details are provided in the country note in Chapter 2.
Figure 1.9. Evolution in gross debt across OECD countries (2007-15)
StatLink 2 http://dx.doi.org/10.1787/888932696780
Note: The reported data are gross government liabilities as a per cent of nominal GDP.
Sources: OECD (2012), OECD Economic Outlook, Vol. 2012/1 (No. 91), OECD Publishing,
doi:10.1787/eco_outlook-v2012-1-en; OECD (2012), “OECD Economic Outlook No. 91”, OECD Economic
Outlook: Statistics and Projections (database), doi:10.1787/data-00606-en.
Ten OECD countries are expected to reduce debt by 2015 (Belgium, Canada,
Germany, Hungary, Iceland, Italy, Korea, Norway, Sweden, Switzerland). Except
Norway, the improvement of the debt is only limited, between 0% and 3.8% of GDP.

1. FISCAL CONSOLIDATION TARGETS, PLANS AND MEASURES IN OECD COUNTRIES – 17
RESTORING PUBLIC FINANCES, 2012 UPDATE © OECD 2012
The OECD expects that most countries will still face rising debt levels in the next
three years. For six countries, the projected debt increase is more than ten percentage
points: Ireland and Portugal (category A), Spain (category B) and Japan, the
United Kingdom and the United States (category C).
Box 1.5. Israel1
Since 2003, Israel has achieved a significant reduction in government expenditure, the
deficit and the debt-to-GDP ratio. The share of public expenditure in GDP has declined from
more than 50% of GDP in 2003 (and 59% in 1987) to 43% in 2008; and the debt-to-GDP ratio
was reduced from 99% in 2003 to 79.5% in 2009 and further to 74.2% in 2011. The global
economic crisis was quite moderate in Israel compared with concurrent developments in
developed countries, mainly reflecting the operation of automatic stabilizers.
From 2010, the Deficit Reduction and Budgetary Expenditure Limitation Law has
contributed to maintaining the fiscal stability of Israel, by setting limitations on both the deficit
level and the rate of growth of government expenditure. The main objectives of the proposed
fiscal rule are to balance between a continuing reduction of the public debt-to-GDP ratio and the
share of public expenditure required for supplying a proper level of public services.
A rapid return to a decreasing deficit trend (halted as a result of the global economic crisis)
is the main target for the short term. A decline in the debt-to-GDP ratio to about 60% within a
decade, similar to the EU target, serves as the main target for the medium term. The long-term
target is to reduce the debt-to-GDP ratio further. The fiscal rule determines that the real growth
of central government expenditure will be equal to the ratio of 60% of GDP (the medium-term
target) and the last known debt-to-GDP ratio, multiplied by the average GDP growth rate during
the ten previous years – provided there is consistency with the declining deficit ceiling as per the
legislation that targets 1% of GDP from 2014 onwards.
1. The statistical data for Israel are supplied by and under the responsibility of the relevant Israeli
authorities. The use of such data by the OECD is without prejudice to the status of the Golan Heights, East
Jerusalem and Israeli settlements in the West Bank under the terms of international law.
OECD member countries’ fiscal consolidation plans
This section will focus on countries’ fiscal consolidation plans: the size of
consolidation, the time span, and the composition of consolidation, based on the country
responses in the fiscal consolidation survey. The fiscal consolidation plans are expressed
as a cumulative effort since the financial crisis. For most countries, the fiscal
consolidation started in 2010. Some countries already made a decisive and prompt effort
in 2009, which is also included in this study. Fiscal consolidation implemented in 2008 is
not included (for example, in Estonia and Hungary).
Implemented fiscal consolidation 2009-11 and consolidation plans 2012
and beyond
Most OECD countries have revised their announced consolidation plans
This sub-section will analyse the impact of fiscal consolidation partly from the
perspective of what has been implemented up to 2011, and partly from the perspective of
plans for 2012 and beyond. The first topic is the impact of revisions of fiscal
consolidation plans.

18 – 1. FISCAL CONSOLIDATION TARGETS, PLANS AND MEASURES IN OECD COUNTRIES
RESTORING PUBLIC FINANCES, 2012 UPDATE © OECD 2012
Figure 1.10 shows the reported change of cumulative consolidation volume (2009-15)
observed in the survey this year compared to the described consolidation in last year’s
report. The cumulative consolidation volume reflects the countries’ total consolidation,
from 2009/10 when first adopted up to the end of the present plan.4 Two different
approaches emerge. Most OECD countries with fiscal consolidation have increased the
total consolidation volume. For example, Austria (category C), Belgium, Hungary and
Italy (category B) and Portugal (category A) have adopted substantially larger
consolidation plans than reported last year, between 2.4% and 5.1% of GDP. Also,
Poland and the Slovak Republic (category B) have increased their consolidation plans by
1.9% and 1.6% of GDP respectively. On average, the countries in category A have
increased their fiscal consolidation by 1 percentage point of GDP since last year’s report,
while the countries in category B have increased their consolidation by 2.2 percentage
points of GDP. In category C, the average increase of fiscal consolidation is
0.9 percentage points of GDP.
Figure 1.10. Revision of total consolidation volume (2009-15)
StatLink 2 http://dx.doi.org/10.1787/888932696799
Notes: The figure shows the changes in the cumulative fiscal consolidation volume in OECD countries with
fiscal consolidation. Positive (negative) figures indicate an increase (reduction) of fiscal consolidation as a
percentage of GDP compared to the consolidation reported in last year’s report.
Sources: OECD Fiscal Consolidation Survey 2012, and OECD (2011), “Restoring Public Finances: Fiscal
Consolidation in OECD Countries”, Special issue of the OECD Journal on Budgeting, Volume 2011/2,
doi:10.1787/budget-v11-2-en.
On the other hand, some countries report having reduced the total consolidation
volume, of which Estonia (category D) is the main example. On average, the countries in
category D that have announced a fiscal consolidation plan have reduced their fiscal
consolidation by 2.4 percentage points of GDP since last year’s report. Estonia has
implemented large front-loaded consolidation and is now gradually removing the planned
expenditure measures, thus reducing the total cumulative impact of consolidation
implemented from the start of the fiscal crisis in 2008. Greece (category A) also appears
to have reduced its total cumulative consolidation compared with the description in last
year’s report, by 3.3% of GDP. The main reason for this reduction is that Greece has
reported a considerably lower impact of consolidation implemented in 2011 than planned
last year, 2.5% of GDP against the planned impact of 6.5% of GDP.

1. FISCAL CONSOLIDATION TARGETS, PLANS AND MEASURES IN OECD COUNTRIES – 19
RESTORING PUBLIC FINANCES, 2012 UPDATE © OECD 2012
The time span of the consolidation plans is extended
The time span of the consolidation plans is more or less extended one year compared
to the situation described in last year’s report. Approximately 80% of the consolidation
plans cover the period up to 2014, and more than half of the plans cover the period up to
2015. One plan also includes 2016 (Austria). Two plans will end in 2013 (Denmark and
Portugal). The consolidation plans normally follow the time span of the medium-term
perspective of the budget estimates. Table 1.1 shows the distribution of plans according to
the planning horizon this year (row 2012) compared to the plans described in last year’s
report (row 2011). The columns show how many of the consolidation plans continue up
to the different years.
Table 1.1. Time span of consolidation plans (2009-15)
Total 2011 2012 2013 2014 2015 2016
2012 26a 3 6 16 1
2011 25 1 2 8 11 2 1
StatLink 2 http://dx.doi.org/10.1787/888932698528
a. The following countries did not provide data on an announced consolidation plan with a specific volume of
consolidation: Japan, Korea, Norway, Turkey (from 2012) and the United States. Australia reports
consolidation (especially in FY 2013) but applies a broader definition of the term consolidation than this report.
Sources: OECD Fiscal Consolidation Survey 2012, and OECD (2011), “Restoring Public Finances: Fiscal
Consolidation in OECD Countries”, Special issue of the OECD Journal on Budgeting, Volume 2011/2,
doi:10.1787/budget-v11-2-en.
The size of cumulative fiscal consolidation plans (2009-15) varies significantly
For countries with a consolidation plan, the size of the plan varies significantly
depending on the country’s fiscal position and the current status and time frame of the
consolidation plan. Unsurprisingly, countries with the largest economic imbalances and
the most rapid deterioration in public finances require larger fiscal consolidation. The
three countries with programmes with the IMF/EU/ECB (category A: Greece, Ireland and
Portugal) have adopted and announced the largest fiscal consolidation packages, all above
12% of GDP (Figure 1.11). On average, the countries in category A have adopted fiscal
consolidation plans of 16.2% of GDP. Eight countries have announced plans ranging
between 6% and 9.1% of GDP: Hungary, Italy, the Slovak Republic, Slovenia and Spain
(category B); and the Czech Republic, Iceland and the United Kingdom (category C).
Belgium and Poland (category B), and Austria, France, Germany and New Zealand
(category C) have announced plans with a cumulative impact of between 3% and 5% of
GDP. The average fiscal consolidation plans in categories B and C are 6.1% and 4.3% of
GDP respectively.

20 – 1. FISCAL CONSOLIDATION TARGETS, PLANS AND MEASURES IN OECD COUNTRIES
RESTORING PUBLIC FINANCES, 2012 UPDATE © OECD 2012
Figure 1.11. Implemented (2009-11) and planned consolidation (2012-15)
StatLink 2 http://dx.doi.org/10.1787/888932696818
Notes: The data are the sum of annual incremental consolidation from 2009/10 until 2015 as reported by the
national authorities. Only the following countries reported consolidation in 2009: Estonia, Hungary, Ireland,
Poland and Slovenia. Hungary’s 2007-08 consolidation is not included. Austria reports consolidation until
2016.
The following participating countries have not reported an announced concrete consolidation plan and are not
included in the figure: Korea, Japan and the United States. Australia reports consolidation (especially in
FY 2013) but applies a broader definition of the term consolidation than this report. Norway does not apply a
consolidation plan.
Source: OECD Fiscal Consolidation Survey 2012.
Box 1.6. Estonia is gradually withdrawing from fiscal consolidation
Estonia has implemented large front-loaded consolidation since the start of the fiscal crisis
in 2008 and is now gradually removing the expenditure measures, thus reducing the total
cumulative impact of the implemented consolidation. The overall size of fiscal consolidation
measures in Estonia is now driven by the revenue side, reflecting mainly the effects of earlier tax
rate increases. As Estonia will be gradually withdrawing from consolidation over the next few
years, the size of fiscal consolidation in 2012-15 appears as a negative value in Figure 1.11.
Estonia does not have an official consolidation plan after 2010 but continues to apply a
conservative fiscal policy that encompasses, among others, requirements for a structural surplus,
for a nominal surplus from 2013, and for the tax burden to return to the pre-crisis level. More
details are provided in the country note in Chapter 2.
Half of the planned cumulative consolidation for 2009-15 is already implemented
In total, around 50% of the countries that have announced consolidation plans have
implemented front-loaded fiscal consolidation efforts in 2010 and 2011 (more than 40%
of total announced consolidation); down from 66% reported previously. The OECD
countries of category A, for example, have the largest consolidation plans and have
tended to front-load those plans. Greece and Ireland implemented large consolidation

1. FISCAL CONSOLIDATION TARGETS, PLANS AND MEASURES IN OECD COUNTRIES – 21
RESTORING PUBLIC FINANCES, 2012 UPDATE © OECD 2012
efforts in 2010 and 2011: 10.3% and 12.8% of GDP respectively. Through these efforts,
the two countries have already implemented more than 50% of the total announced
consolidation volume of 18.5% and 17.9% respectively. On average, the countries in
category A have implemented fiscal consolidation up to 2011 of 9.6% of GDP.
Front-loading consolidation is not only associated with the countries in category A
that are obliged to consolidate by an agreement. For countries in the other categories,
however, it is mostly those with smaller consolidation needs that have chosen to
front-load consolidation. In category B, only Hungary, the Slovak Republic and Slovenia
are front-loading. In category C, only the Czech Republic and Iceland are front-loading.
Thus, many countries in categories B and C have scheduled the main part of
consolidation in the coming years. Notwithstanding, on average the OECD countries with
a consolidation plan have implemented 50% of the announced consolidation in 2009-11.
On average, the countries in categories B and C have implemented fiscal consolidation up
to 2011 of 2.5% and 1.7% of GDP respectively.
The only countries that have started to gradually reverse the impact of fiscal
consolidation are Estonia and Switzerland. Estonia has implemented a consolidation
volume of 3.7% of GDP already, but has ended the expenditure cuts and announces only
gradually diminishing revenue measures as from 2012. Turkey has not reported fiscal
consolidation as from 2012.
Compared to last year’s report, the implemented consolidation of OECD countries in
2009-11 is somewhat behind the plan. In this period, the OECD countries have
implemented fiscal consolidation by 2.8% of GDP against last year’s planned
consolidation of 3.3% of GDP.5 Belgium, Estonia, Finland, France, Greece and Hungary
have reported less implemented consolidation in 2009-11 than previously planned.
However, except for Estonia, these countries have extended their consolidation plans,
resulting in a slightly more back-loaded consolidation. On the other hand, Denmark,
Ireland and Portugal have reported more implemented consolidation in this period than
previously planned.
Planned fiscal consolidation for 2012 and beyond
Notwithstanding having implemented substantial fiscal consolidation, the
three countries with IMF/EU/ECB programmes (Greece, Ireland and Portugal) still have a
substantial remaining fiscal consolidation of 5.2-8.2%, averaging 6.6% of GDP in the
years 2012-15. Also, Italy has announced a considerable fiscal consolidation in 2012 and
beyond, of 5.2% of GDP (Figure 1.12). Nine countries have a remaining fiscal
consolidation of between 3% and 5% of GDP: Belgium, Hungary, Poland, the
Slovak Republic and Spain (category B); and Austria, France, New Zealand and the
United Kingdom (category C). On average, the countries in categories B and C have
planned fiscal consolidation for the years 2012-15 of 3.7% and 2.6% of GDP
respectively.
Most OECD countries which have announced a fiscal consolidation plan with
remaining fiscal consolidation in 2012 and beyond have planned to implement the largest
part by 2013. Portugal plans to implement fiscal consolidation in 2012-13 of 6.5% of
GDP in order to complete the requirements of the programme with the EU and the IMF.
Greece (4.9% of GDP), Ireland (3.7%), Italy (5%) and Spain (4.4%) will also implement
large fiscal consolidation in 2012-13. Belgium, Hungary and Poland plan to implement
about 3% of GDP in 2012-13. The average of the OECD area is calculated at 2.1% of
GDP in 2012-13 and 0.7% in 2014-15. On average, the countries in category A have

22 – 1. FISCAL CONSOLIDATION TARGETS, PLANS AND MEASURES IN OECD COUNTRIES
RESTORING PUBLIC FINANCES, 2012 UPDATE © OECD 2012
planned fiscal consolidation in the years 2012-13 of 5.1%. The average planned fiscal
consolidation in this period for the countries in categories B and C is 3.1% and 1.7% of
GDP respectively.
Figure 1.12. Consolidation plans in 2012-15
StatLink 2 http://dx.doi.org/10.1787/888932696837
Notes: The data are the sum of annual incremental consolidation from 2012-15 as reported by the national
authorities. Austria reports consolidation until 2016. Turkey did not report consolidation from 2012. The
following participating countries have not reported an announced concrete consolidation plan and are not
included in the figure: Korea, Japan and the United States. Australia reports consolidation (especially in
FY 2013) but applies a broader definition of the term consolidation than this report. Norway does not apply a
consolidation plan.
Source: OECD Fiscal Consolidation Survey 2012.
Estonia and Switzerland are the only countries that are planning to decrease the total
fiscal consolidation from 2012 and beyond. Turkey has not reported fiscal consolidation
as from 2012.
Remaining consolidation needed for 60% debt/GDP ratio
The governments of most OECD countries are well under way implementing fiscal
consolidation. If the governments’ consolidation efforts remain consistent with the
announced consolidation plans, the countries will take a considerable step on the path
towards a more sustainable fiscal position. This applies especially to the countries in
category A: Greece, Ireland and Portugal. Also Belgium, Hungary, Italy, Poland, the
Slovak Republic and Spain (category B) will achieve a substantial part of the required
average consolidation to curb gross debt-to-GDP ratio to a sustainable level (Figure 1.13).

1. FISCAL CONSOLIDATION TARGETS, PLANS AND MEASURES IN OECD COUNTRIES – 23
RESTORING PUBLIC FINANCES, 2012 UPDATE © OECD 2012
Figure 1.13. Fiscal balances need to be improved more to achieve 60% debt-to-GDP ratios
StatLink 2 http://dx.doi.org/10.1787/888932696856
Notes: The remaining consolidation need is the difference between the required average improvement in the
underlying primary balance to achieve a gross general government debt-to-GDP ratio equal to 60% of GDP by
2030 (by 2040 for Japan) and the consolidation announced by the government for the period 2012-15. For
Austria, Belgium, Denmark, Germany and Italy, the underlying primary balance is used in the calculation of
consolidation (short-term 2012-15 and long-term by 2030). For Italy, the short-term 2012-15 consolidation will
more than fulfil the long-term consolidation requirement. The consolidation requirement is not available for
Mexico and Turkey. Consolidation plans in 2012-15 are not available for Japan, Korea and the United States.
Australia reports consolidation (especially in FY 2013) but applies a broader definition of the term
consolidation than this report. Estonia and Switzerland announced a reversed consolidation in their plans for
2012-15 (not included in the calculation). For Denmark, a reversed consolidation in 2012-15 is estimated (not
included in the calculation). Norway does not apply a consolidation plan.
Sources: OECD Fiscal Consolidation Survey 2012; OECD (2012), OECD Economic Outlook, Vol. 2012/1
(No. 91), OECD Publishing, doi:10.1787/eco_outlook-v2012-1-en; and OECD calculations.
Box 1.7. Luxembourg
Luxembourg has lower deficits and lower gross debt than most OECD countries, and
appears in category D in this report. However, the government envisages increasing public
deficits and debt-to-GDP ratios in the coming years, with the public gross debt increasing to
25.9% of GDP in 2015. The government’s objective is to implement a series of budgetary
consolidation measures in order to reduce the public deficit and thus to create a greater
budgetary margin of manoeuvre to absorb possible negative shocks.
Luxembourg may serve as an example of a country that practices what Professor
Allen Schick prescribes: fiscal discipline must be maintained during growth periods in order for
governments to avoid crisis when the economy weakens (Schick, 2012). More details are
provided in the country note in Chapter 2.
The announced consolidation will be enough to stabilise debt in most of the countries,
but curbing debt-to-GDP ratio to 60% will require a stronger improvement in the
underlying primary balance than the announced consolidation plans (2012-15) will
provide. This assessment takes for granted that all measures in the announced
consolidation plans are structural. We know that some measures are one-offs.
Furthermore, the assumptions made by the governments may differ from the assumptions
in the OECD calculations of long-term consolidation needs, for example on economic

24 – 1. FISCAL CONSOLIDATION TARGETS, PLANS AND MEASURES IN OECD COUNTRIES
RESTORING PUBLIC FINANCES, 2012 UPDATE © OECD 2012
growth. Therefore the estimated remaining consolidation requirement will expresses a
minimum effort to achieve the debt targets in the long run, relative to the consolidation
efforts already planned by the governments.
Box 1.8. Calculation of the remaining fiscal consolidation requirement
The calculation of consolidation required to stabilise debt or to reduce debt levels to 60% of
GDP by 2030 uses 2011 as the base year (Figure 1.3 and Box 1.2). Remaining consolidation
needed is calculated by subtracting the consolidation announced for the period 2012-15
(Figure 1.5). Consolidation for the period 2012-15 is calculated as a per cent of the OECD
estimates of potential GDP from the “OECD Economic Outlook, Vol. 2012/1” assuming all
measures are structural. Countries included in Figure 1.3 but not in Figure 1.13 did not provide
data.
Most countries have specified and quantified measures in their plans
Most of the consolidation plans for 2009-15 are quantified with detailed specific
measures. However, a few countries did not provide a complete overview of detailed
concrete measures. Some countries did not spell out measures over all years, and for
some countries the specification of measures in all years did not completely add up to the
total announced plan covering the same period.
The countries in category A have announced the most ambitious consolidation plans
in order to restore market confidence and public finances. The two countries with the
largest consolidation, Greece and Ireland, have specified about two-thirds of the total
consolidation plan. Portugal has provided a complete specification of the consolidation
plan. These three countries are assessed quarterly by the EC, the ECB and the IMF
regarding progress in implementing the fiscal consolidation (Figure 1.14).
Most of the countries with large deficits in categories B and C have specified the
consolidation plan completely. However, for the United Kingdom, a number of
announced expenditure reductions in areas such as administration, defence, transport, etc.,
are not included in Figure 1.14 as these reductions are not quantified on an annual basis.
These measures are well specified, but the impact over years and in total has been
difficult to estimate.
Composition of measures: most countries rely on expenditure reductions
The survey responses indicate that fiscal consolidation for 2009-15 has a similar
focus on expenditure measures as last year, weighted on average two-thirds towards
expenditure reductions and one-third towards increased revenues (Figure 1.15). Still there
is a significant variation in the composition of consolidation measures. A number of
countries have structured their consolidation mostly (more than 80%) around expenditure
measures. Except for Hungary and Slovenia (category B), these are typically countries
with smaller consolidation plans. Some countries with large consolidation plans focus
their consolidation on expenditure reductions between the OECD average of 65% and
80%: Ireland (category A), the Slovak Republic and Spain (category B) and Austria,
Germany, Iceland and the United Kingdom (category C). In contrast, Estonia and Turkey
(category D) rely on tax increases for the majority of their consolidation, taking into
account that these countries are withdrawing from consolidation. Some countries with
larger consolidation including Greece and Portugal (category A) and Belgium, Italy and
Poland (category B) are choosing to take the middle ground.

1. FISCAL CONSOLIDATION TARGETS, PLANS AND MEASURES IN OECD COUNTRIES – 25
RESTORING PUBLIC FINANCES, 2012 UPDATE © OECD 2012
Figure 1.14. Share of quantified measures in the implemented/planned consolidation (2009-15)
StatLink 2 http://dx.doi.org/10.1787/888932696875
Notes: The figure shows the cumulative consolidation volume and the share of quantified expenditure and
revenue measures as reported in the country notes for the period 2009-2015 (2016 for Austria). Data for Korea
and the United States are not available. Data on quantified measures for Mexico are not available (not included
in the OECD average). Australia and Japan reported quantified measures (0.7% and 2.8% of GDP,
respectively) although they did not provide fiscal consolidation plans (Australia applies a broader definition of
the term consolidation than this report). Norway does not apply a consolidation plan.
Source: OECD Fiscal Consolidation Survey 2012.
Figure 1.15. Expenditure-based versus revenue-based measures (2009-15)
StatLink 2 http://dx.doi.org/10.1787/888932696894
Notes: Data are the cumulative contribution to consolidation from expenditure and revenue measures.
New Zealand and Slovenia have reported some revenue measures but they are not completely quantified (see
Chapter 2 for details).
Source: OECD Fiscal Consolidation Survey 2012.

26 – 1. FISCAL CONSOLIDATION TARGETS, PLANS AND MEASURES IN OECD COUNTRIES
RESTORING PUBLIC FINANCES, 2012 UPDATE © OECD 2012
On average, the countries in category A focus on expenditure cuts by 58% and on
revenue increases by 42%. The countries in categories B and C rely more on expenditure
cuts, focusing on average on expenditure cuts by 68% and 69% versus 32% and 31% on
revenue increases, respectively.
Major consolidation measures
After presenting basic background information on the composition of expenditure and
revenue in OECD member countries, this section presents the types of consolidation
measures and how often they are targeted or mentioned in the consolidation plans of
2009-15. By counting the measures in this way (frequency), it is possible to provide
information about the areas on which countries are focusing when reducing expenditures
or enhancing revenues. Information on the impact in per cent of GDP and on
cross-country comparison will be given for all measures that are quantified in the
consolidation plans. Likewise, this section compares the frequency and impact of the
current measures with those described in the report last year to find out how OECD
countries have revised their consolidation priorities and the measures dealing with
changes in the macroeconomic environment.
Expenditure in OECD member countries
The share of government expenditures varies across OECD member countries
Government expenditure as a share of GDP indicates the size of the government and
reflects historical and current political decisions about its role in providing services and in
redistributing income. However, a large part of the variation reflects the different
approaches to delivering goods and services and providing social support, rather than true
differences in the resources spent. For instance, if support is given through tax breaks
rather than direct expenditure, expenditure-to-GDP ratios will naturally be lower
(OECD, 2009).
The OECD average ratio of expenditure to GDP was just 39% in 2007, and it
increased in 2009 to 45% due to worldwide adoption of various fiscal stimulus packages.
In 2011, it decreased to 43% due to the initiation of fiscal consolidation effort by
numerous governments. This trend of fluctuation in terms of the ratio occurred in almost
all of OECD member countries during this period, though the variation of the ratio was
usually more significant for many debt-ridden countries such as Iceland and Ireland, and
for countries that have already implemented large consolidation, like Estonia
(Figure 1.16). However, there is no evidence of a one-to-one correlation between
expenditure as a percent of GDP and the cumulative fiscal consolidation.
Welfare and health are “big ticket” spending items
Governments can choose to spend their financial resources on a variety of goods and
services, such as providing child care, building infrastructure and subsidising alternative
energy sources. As of 2010, social protection including social welfare is the largest
category of spending and is on an increasing trend when compared with 2007. The
second-largest share of total expenditures is spent on health, followed by education,
which are both on a slightly decreasing trend from 2007 (reduced by 0.3 percentage
points and 0.4 percentage points since 2007 respectively). Economic affairs also account
for a major part of GDP, and are on an increasing trend since the financial crisis.
Payments on interest constitute around 5% of public expenditures across the OECD area.

1. FISCAL CONSOLIDATION TARGETS, PLANS AND MEASURES IN OECD COUNTRIES – 27
RESTORING PUBLIC FINANCES, 2012 UPDATE © OECD 2012
In general, OECD member countries spend the least amount of government financial
resources on environmental protection and on housing and community amenities
(Figure 1.17).
Figure 1.16. General government expenditure (2007-11)
StatLink 2 http://dx.doi.org/10.1787/888932696913
Note: The OECD average does not include Turkey.
Sources: OECD (2012), OECD Economic Outlook, Vol. 2012/1, No. 91, OECD Publishing,
doi:10.1787/eco_outlook-v2012-1-en (OECD Economic Outlook No. 90 for Turkey).
Figure 1.17. Structure of general government expenditures (2007-10)
StatLink 2 http://dx.doi.org/10.1787/888932696932
1. Interest expenditures are part of general public services (according to the COFOG classification).
Source: OECD National Accounts Statistics.

28 – 1. FISCAL CONSOLIDATION TARGETS, PLANS AND MEASURES IN OECD COUNTRIES
RESTORING PUBLIC FINANCES, 2012 UPDATE © OECD 2012
Figure 1.18 shows that, in the OECD area, interest payments by governments
represented on average 2.7% of GDP in 2011, a slightly increasing trend since 2007. In
particular, the countries with an IMF/EU programme (category A: Greece, Ireland,
Portugal) and some countries under close market scrutiny (category B) such as Slovenia
and Spain showed a significant increase in interest payments during 2009-11. The
United Kingdom also demonstrates the same pattern of increase. In contrast, interest
payments decreased over the same period by 2 percentage points of GDP in Iceland and
0.5 percentage points of GDP in Hungary due to completion of their IMF programmes
(Figure 1.18). Turkey reduced its interest payments between 2009 and 2011 by
0.9 percentage points of GDP. Although the amount a government pays on interest varies
greatly among OECD member countries, the expenditure on interest payments was much
higher than the OECD average in many debt-ridden countries such as Greece, Hungary,
Iceland, Italy and Portugal, as expected (Figure 1.18).
Figure 1.18. General government interest payments (2007-11)
StatLink 2 http://dx.doi.org/10.1787/888932696951
Notes: The data of Australia, Chile, Japan and New Zealand for 2011 are not available and these countries are
not included in the OECD average. The data for 2010 instead of 2011 were used for Canada, Israel, Korea,
Mexico, Switzerland, Turkey and the United States. The statistical data for Israel are supplied by and under the
responsibility of the relevant Israeli authorities. The use of such data by the OECD is without prejudice to the
status of the Golan Heights, East Jerusalem and Israeli settlements in the West Bank under the terms of
international law.
Source: OECD National Accounts Statistics.
But employee compensation in general government has decreased due to wage
cuts
The public sector is human capital intensive. Compensation of employees in general
government varies across member countries, and it is comparatively lower in Japan and
Korea – around 6-7% of GDP in 2009 – than in the Nordic countries – above 14% of
GDP in 2009 (Figure 1.19). Likewise, the wage bill in the OECD area decreased from
11.4% of GDP in 2009 to 10.8% of GDP in 2011 due to wage cuts and staff reductions
across OECD countries. Not surprisingly, the fluctuations of the compensation level
during that period were much higher in the countries with an IMF/EU programme
(category A) such as Greece and Portugal than most of the other member countries.

1. FISCAL CONSOLIDATION TARGETS, PLANS AND MEASURES IN OECD COUNTRIES – 29
RESTORING PUBLIC FINANCES, 2012 UPDATE © OECD 2012
Moreover, Estonia, Hungary and some Nordic countries such as Denmark, Finland and
Sweden also reduced the compensation level by more than the OECD average
(Figure 1.19).
Figure 1.19. General government compensation of employees (2007-11)
StatLink 2 http://dx.doi.org/10.1787/888932696970
Notes: Data for Australia are not available. The 2011 data for Chile and New Zealand are not available and
these countries are not included in the OECD average. Data for 2010 instead of 2011 were used for Canada,
Israel, Japan, Korea, Mexico, Switzerland, Turkey and the United States. The statistical data for Israel are
supplied by and under the responsibility of the relevant Israeli authorities. The use of such data by the OECD is
without prejudice to the status of the Golan Heights, East Jerusalem and Israeli settlements in the West Bank
under the terms of international law.
Source: OECD National Accounts Statistics.
Major expenditure reduction measures
In this report as in last year’s report, consolidation on the expenditure side is
presented according to three categories:
operational measures;
programme measures;
other measures.
The first category, operational measures, can be broadly defined as expenditure
reductions of governments’ running costs. These measures include wage or staff
reductions, government reorganisation, and across-the-board efficiency reductions in the
administration.
The second category, programme measures, reflects expenditures by functional
classification in the OECD National Accounts. This classification includes health care,
social benefit systems, old-age pensions, capital infrastructure, official development
assistance, and transfers to sub-national government.

30 – 1. FISCAL CONSOLIDATION TARGETS, PLANS AND MEASURES IN OECD COUNTRIES
RESTORING PUBLIC FINANCES, 2012 UPDATE © OECD 2012
In the OECD National Accounts, the classification of expenditure by function also
includes personnel costs – for example, doctors’ and teachers’ salaries are included in
health and education. Therefore, to avoid double accounting in the “operational” and
“programme” categories, this report separates wage and staff measures from programme
measures.
The third category, other measures, includes mainly overall spending cuts or freezes
on public consumption.
In this section, the expenditure reduction measures cover the whole period of the
countries’ consolidation plans, from 2009 to 2015 (2016 for Austria) depending on the
announced plan in each country.
The impact of quantified expenditure reductions reflects external pressure
and the extent of debt
A total of 26 countries provided quantified data on their expenditure reduction
measures. When it comes to the impact of quantified expenditure reductions as a per cent
of GDP in the consolidations plans, countries with an IMF/EU programme are reducing
expenditure the most, as is to be expected. On average, the countries in category A have
reported quantified expenditure reduction measures amounting to 6.5% of GDP. The
average of quantified expenditure reduction measures in categories B and C is 4.2% and
2.4% of GDP respectively.
Hungary (category B) and Ireland and Portugal (category A) topped the list with a
reduction of more than 6.7% of GDP, followed by Greece (category A) and countries
observed closely by the market (category B: Italy, the Slovak Republic, Slovenia and
Spain) as well as Iceland, which successfully completed its IMF programme last year, and
New Zealand (category C), all with a reduction of more than 3% of GDP. Some countries
with a substantial deficit – Austria, Czech Republic, France, the Netherlands (category C)
and Belgium and Poland (category B) – plan quantified spending cuts of more than 2% of
GDP (Figure 1.20).
Most countries focus on quantified expenditure reductions in programmes
for 2009-15
In most countries, programme expenditure measures contribute more to consolidation
than operational measures, as was the case in last year’s report. In particular, countries
with an IMF/EU programme (category A) such as Greece and Ireland depend more than
70% on programme measures to reach the fiscal deficit reduction target effectively.
However, Portugal (category A) dedicates around 40% of its expenditure reduction
measures to operational measures, including wage cuts, to show the strong commitment
of the government to stabilise public finance. Only one country assigns a large portion of
its expenditure reduction measures to operational expenditure: in Denmark, operational
expenditure reduction amounts to 87% of the total expenditure reduction measures (out of
a small total) (Figure 1.21).
Only three countries have grouped a substantial part of their consolidation as “other
expenditure measures”. In the Czech Republic, this relates to across-the-board decreases
in expenditures of 1.9% of GDP. In Italy, all new measures adopted in 2011 are grouped
as “other expenditure measures” due to missing detailed data. In Switzerland, the impact
of these measures is only 0.1% of GDP, relating to budget adjustments regarding changes
in inflation and in interest rates.

1. FISCAL CONSOLIDATION TARGETS, PLANS AND MEASURES IN OECD COUNTRIES – 31
RESTORING PUBLIC FINANCES, 2012 UPDATE © OECD 2012
Figure 1.20. Quantified expenditure reductions (2009-15)
StatLink 2 http://dx.doi.org/10.1787/888932696989
Notes: Data are not available for Korea, Turkey and the United States. The data on operational measures for the
United Kingdom are not available. The data on programme measures for Switzerland are not available. Austria
has reported measures up to 2016. Estonia, Japan and Mexico did not apply any expenditure reduction
measures.
Source: OECD Fiscal Consolidation Survey 2012.
Figure 1.21. Quantified expenditure reduction measures – composition (2009-15)
StatLink 2 http://dx.doi.org/10.1787/888932697008
Notes: Data are not available for Korea, Turkey and the United States. Data on operational measures for the
United Kingdom are not available. The data on programme measures for Switzerland are not available. Estonia,
Japan and Mexico did not apply any expenditure measures.
Source: OECD Fiscal Consolidation Survey 2012.

32 – 1. FISCAL CONSOLIDATION TARGETS, PLANS AND MEASURES IN OECD COUNTRIES
RESTORING PUBLIC FINANCES, 2012 UPDATE © OECD 2012
Box 1.9. Fiscal policy in Norway
Fiscal policy in Norway is guided by the fiscal rule, stipulating a gradual phasing-in of oil
revenues in the Norwegian economy in line with the expected real return on the Government
Pension Fund Global (formerly the Petroleum Fund), estimated at 4%. The fiscal rule permits
spending more than the expected return on the Fund in a cyclical downturn, while the use of oil
revenues should be below the expected return when capacity utilisation in the economy is high.
This room for manoeuvre was used in 2009 to mitigate the effects of the financial crisis on
production and employment. In 2011, the use of oil revenues will again be below the 4% path.
Due to the oil revenues, the central government in Norway has run a fiscal surplus for
several years: 10.7% in 2009 increasing to 13.6% in 2011. The 2012 fiscal surplus is estimated
at 11.5% of GDP, and central government net assets are estimated at 155.8% of GDP in 2012.
Due to this favourable financial condition, Norway does not have a consolidation plan.
Notwithstanding, the government included some expenditure cuts in the 2012 budget of 0.1% of
GDP (NOK 1.7 billion). The largest part of the cuts involved a reversal of some unemployment
benefits that were granted during the financial crisis (NOK 240 million), followed by reduced
transfers to the regions (NOK 220 million) and several smaller cuts.
Major operational measures
Among the OECD countries participating in the fiscal consolidation survey, 81%
have still marked operational expenditures for savings, although this percentage is a bit
lower than in last year’s report. Wage cuts and staff reductions are on the reform agenda
less frequently than was the case last year, which implies that some countries have
changed their use of these measures. Among the participating countries, 59% include
wage cuts and 28% include staff reductions (Figure 1.22). However, a number of
countries have unspecified operational savings, i.e. no details are provided concerning the
distribution of reductions in wages, staffing or general operational expenses. Examples
include the temporary expenditure rule and ceiling on new spending in Poland
(category B) and rationalisation of services and control of operational expenditure in
general government in Portugal (category A).
The countries with an IMF/EU programme (category A) and the countries under
market scrutiny (category B) have announced far-reaching and very substantial
operational cutbacks. In Hungary (category B), the cuts in operational measures amount
to as much as 3.3% of GDP, including a freeze of the gross wage bill and a freeze of
operational budgets. Portugal (category A) also plans to cut overall operational
expenditures by around 2.7% of GDP. Greece (category A), the Slovak Republic,
Slovenia and Spain (category B) and Iceland and New Zealand (category C) also
increased the amount of operational expenditure cuts by more than 1.4% of GDP
compared with last year, reflecting the external pressure for the normalisation of public
finance (Figure 1.23A).

1. FISCAL CONSOLIDATION TARGETS, PLANS AND MEASURES IN OECD COUNTRIES – 33
RESTORING PUBLIC FINANCES, 2012 UPDATE © OECD 2012
Figure 1.22. Operational expenditure reduction measures – frequency (2009-15)
StatLink 2 http://dx.doi.org/10.1787/888932697027
Sources: OECD Fiscal Consolidation Survey 2012, and OECD (2011), “Restoring Public Finances: Fiscal
Consolidation in OECD Countries”, Special issue of the OECD Journal on Budgeting, Volume 2011/2,
doi:10.1787/budget-v11-2-en.
Slovenia (category B) topped the list in terms of the wage cuts, at 1.1% of GDP.
Likewise, wage cuts are commonly an important source for consolidation in operational
expenditure among countries with an IMF/EU programme. Greece (category A) increased
the amount of reduction to 0.95% from 0.22% of GDP described in last year’s report.
Ireland and Portugal (category A) still assigned around 0.7% of GDP in wage cuts. Also,
Hungary, the Slovak Republic and Spain (category B) assign wage cuts of around
0.7%-0.9% of GDP (Figure 1.23B). For example, EUR 1.2 billion is to be cut from the
public service wage bill during 2011-14 in Ireland, and in Portugal government wages
were cut 5% in 2011 and will be frozen during 2012-13 (Table 1.2). This indicates that
wage cuts are still being used as an important signal to markets and the public regarding
the government’s determination to improve fiscal balances by taking politically tough
decisions.
Table 1.2. Wage reduction targets
Country Reductions
France Freeze of general increases of the civil servant salaries.
Greece Rationalisation of special wage regimes (police, military personnel, firemen, diplomats, etc.).
Hungary Freezing the gross wage bill and reducing earning compensation in the public sector.
Poland Freezing the nominal wage bill in the public sector.
Portugal Average cut of 5% in government wages in 2011, and freeze during 2012-13.
Slovak Republic 10% cut in the state wage bill.
Slovenia Limited to 1.2% annually and (from mid-2012) wage cuts by 8% across the entire public sector.
StatLink 2 http://dx.doi.org/10.1787/888932698547
Source: OECD Fiscal Consolidation Survey 2012.

34 – 1. FISCAL CONSOLIDATION TARGETS, PLANS AND MEASURES IN OECD COUNTRIES
RESTORING PUBLIC FINANCES, 2012 UPDATE © OECD 2012
Figure 1.23. Operational expenditure reduction measures – impact (2009-15)
StatLink 2 http://dx.doi.org/10.1787/888932697046
Notes: Operational measures announced by Turkey, the United Kingdom and the United States are not
available in this survey. Wage cuts announced by Germany, Iceland, Italy, Turkey, the United Kingdom and
the United States are not available in this survey.
Sources: OECD Fiscal Consolidation Survey 2012; and OECD (2011), “Restoring Public Finances: Fiscal
Consolidation in OECD Countries”, Special issue of the OECD Journal on Budgeting, Volume 2011/2,
doi:10.1787/budget-v11-2-en.
Together with the wage cuts, public sector employment is still being scaled back
considerably. Germany plans to abolish up to 10 000 staffing positions permanently, and
general government employment is projected to fall by 710 000 by 2016-17 in the
United Kingdom (Table 1.3).

1. FISCAL CONSOLIDATION TARGETS, PLANS AND MEASURES IN OECD COUNTRIES – 35
RESTORING PUBLIC FINANCES, 2012 UPDATE © OECD 2012
Table 1.3. Staff reduction targets
Country Reductions
Austria Reduce recruitment.
France Non-replacement of one out of two retiring civil servants will cut 150 000 posts by 2013.
Germany Up to 10 000 staffing positions to be permanently abolished by 2014.
Ireland EUR 1.2 billion is to be cut from the public service wage bill during 2011-14 (24 750 job cuts over peak 2008 levels).
Portugal Reduce the number hired in central, regional and local governments.
Spain Implementation of a 10% replacement rate for all staff in the public sector in 2011-13 (7% staff reduction by 2013).
United Kingdom General government employment will fall by 710 000 by 2016-17 (projection of the Office for Budget Responsibility).
StatLink 2 http://dx.doi.org/10.1787/888932698566
Source: OECD Fiscal Consolidation Survey 2012.
Major programme measures
The largest expenditure reductions involve programme measures, as was the case in
last year’s report. The most frequently targeted areas for savings are welfare, health care,
pensions, and infrastructure. However, some countries did not report any consolidation
plan in welfare (Estonia, Switzerland), health (Estonia, Italy), pensions (Czech Republic,
Estonia) or infrastructure (Czech Republic, Estonia, Hungary and Switzerland), as was
the case last year. In a few OECD countries, transfers to lower levels of government
(Hungary, Slovak Republic, Sweden), education (Netherlands, Spain, Sweden), and
subsidies to state-owned enterprises (SOEs) (Greece, Portugal) also contribute to
consolidation (Figure 1.24). Likewise, a number of countries have reduction plans in
research, social integration and transfers to business which were not categorised in last
year’s report. At the same time, the consolidation plan of many countries includes
unspecified savings from the programme measures, i.e. no details are provided
concerning savings from general spending cuts across overall departments. Examples
from Ireland include general departmental spending cuts of EUR 3 billion during
2011-14.
Welfare is the most frequently targeted area for savings, and more than 70% of
member countries have consolidation plans in welfare in 2012. This is not surprising
given the largest share of public expenditures devoted to social protection (see
Figure 1.17 above). Greece (category A) is reducing welfare expenditures by 1.9% of
GDP with reductions in social security funds and social spending (see Figure 1.25A); this
percentage is the highest among OECD countries, and far higher than the 0.1% of GDP
reported last year. Ireland (category A), Hungary and Poland (category B), and Germany
and the United Kingdom (category C) plan reductions in the area of welfare in excess of
1% of GDP. For instance, the United Kingdom increased the expenditure cuts in welfare
from 0.4% to 1.14% of GDP with the cuts on child and disability benefits. France, Iceland
and the Netherlands (category C) have expenditure reduction measures in welfare
amounting to more than 0.6% of GDP. Likewise, a number of countries have quantified
reductions in magnitudes of close to 0.3-0.4% of GDP or more (Figure 1.25A).

36 – 1. FISCAL CONSOLIDATION TARGETS, PLANS AND MEASURES IN OECD COUNTRIES
RESTORING PUBLIC FINANCES, 2012 UPDATE © OECD 2012
Figure 1.24. Major programme measures – frequency (2009-15)
StatLink 2 http://dx.doi.org/10.1787/888932697065
Sources: OECD Fiscal Consolidation Survey 2012; and OECD (2011), “Restoring Public Finances: Fiscal
Consolidation in OECD Countries”, Special issue of the OECD Journal on Budgeting, Volume 2011/2,
doi:10.1787/budget-v11-2-en.
About 50% of participating countries identified health savings as one of the main
consolidation sources, as reported last year. These measures constitute a major share of
expenditure savings in all countries with an IMF/EU programme (category A): Greece,
Ireland and Portugal. For example, Portugal plans to reduce expenditure in the health
system, especially in the areas of pharmaceuticals, user fees, public health systems and
through hospital restructuring. The savings on health expenditures will amount to as
much as 1% of GDP in Ireland and Portugal. Belgium and Spain (category B) also
substantially increased their savings target in the health area, up to 1% and 0.7% of GDP
respectively (Figure 1.25B).
The reduction of infrastructure expenditure is also on the agenda in many countries.
Ireland (category A) and Slovenia and Spain (category B) plan to cut infrastructure
investment by more than 1.3% of GDP. Portugal (category A) indicated the commitments
to no new road construction, thus reducing infrastructure spending by 0.7% of GDP rather
than the 1.2% of GDP reported last year (Figure 1.26A).
Pension reform is also on the agenda for many OECD member countries even if its
impact on consolidation is somewhat reduced across the countries. Hungary (category B)
plans savings in pensions of 1.6% of GDP through a change in the indexation system for
pensions. In Portugal, savings of 0.9% of GDP are expected through special contributions
for pensions (Figure 1.26B). Austria, France and New Zealand (category C) also expect
savings amounting to more than 0.5% of GDP due to the increase of the retirement age
and changes in pension schemes.

1. FISCAL CONSOLIDATION TARGETS, PLANS AND MEASURES IN OECD COUNTRIES – 37
RESTORING PUBLIC FINANCES, 2012 UPDATE © OECD 2012
Figure 1.25. Welfare and health – impact of reductions (2009-15)
StatLink 2 http://dx.doi.org/10.1787/888932697084
Note: For Figure 1.25A: Welfare programme measures announced by Italy and Korea are not available in this
survey. For Figure 1.25B: Programme measures on health announced by France, Iceland, Turkey and the
United States are not available in this survey.
Sources: OECD Fiscal Consolidation Survey 2012, and OECD (2011), “Restoring Public Finances: Fiscal
Consolidation in OECD Countries”, Special issue of the OECD Journal on Budgeting, Volume 2011/2,
doi:10.1787/budget-v11-2-en.
Only two OECD countries have consolidation plans in agricultural expenditure
(Hungary, Slovak Republic), only three countries in development aid (Canada,
Netherlands, Spain), and only three countries in energy subsidies (Australia, Hungary,
United Kingdom), which is more limited than reported in last year’s report (see
Figure 1.24). This indicates that these areas are still the least prioritised ones for savings
among OECD countries, since there is continued sizeable support for agriculture and
levels of subsidies in many countries.

38 – 1. FISCAL CONSOLIDATION TARGETS, PLANS AND MEASURES IN OECD COUNTRIES
RESTORING PUBLIC FINANCES, 2012 UPDATE © OECD 2012
Figure 1.26. Infrastructure and pensions – impact (2009-15)
StatLink 2 http://dx.doi.org/10.1787/888932697103
Note: For Figure 1.26A: Programme measures on infrastructure announced by Turkey are not available. For
Figure 1.26B: Pension programme measures announced by Greece and Italy are not available.
Sources: OECD Fiscal Consolidation Survey 2012; and OECD (2011), “Restoring Public Finances: Fiscal
Consolidation in OECD Countries”, Special issue of the OECD Journal on Budgeting, Volume 2011/2,
doi:10.1787/budget-v11-2-en.

1. FISCAL CONSOLIDATION TARGETS, PLANS AND MEASURES IN OECD COUNTRIES – 39
RESTORING PUBLIC FINANCES, 2012 UPDATE © OECD 2012
Box 1.10. Pension reforms in Belgium, France and Hungary
Belgium: The government has introduced structural reforms of the pension system which
will come into force as of 2013. First, the early retirement age will be increased from 60 to 62, in
both the private and the public sector (six months per year from 2013 to 2016). Second,
measures will be introduced to authorise and encourage people to work longer than age 65.
Third, the pension bonus and fiscal incentives for long-term savings will be improved, to
encourage longer careers.
France: On 7 November 2011, the government decided to bring forward the transitional
phase of the pension reform by one year, thereby rescheduling the target age of 62 years for
2017 instead of 2018. In view of the current sovereign debt crisis, this measure will reduce the
pension scheme deficit more quickly and speed up the shielding of pensions from financial
market tensions.
Hungary: The government started reshaping the pension system in 2011, and subsequent
steps will follow in 2012 in order to reinforce the insurance and solidarity character of the
pension system and to improve its long-term sustainability and transparency. The 2012 budget
includes a balanced budget for the Pension Insurance Fund. From 31 December 2011, the whole
social security pension contribution flows to the Pension Insurance Fund.
Revenue in OECD member countries
Most of the surveyed countries have strategies for enhancing revenue in their fiscal
consolidation plans. Various factors, including size of government revenue relative to
GDP, composition of revenues, and the size of needed fiscal adjustments, play an
important role in determining which strategies to implement to increase revenues.
In the OECD area as a whole, government revenue as a share of GDP was stable at
around 37% during 2007-11. However, government revenues show significant differences
between countries, ranging from 31% of GDP in Australia to 58% in Norway
(Figure 1.27). Nordic countries collect on average ten percentage points of GDP more
revenue than other countries. In contrast, revenue-to-GDP ratios for some countries such
as Japan, Korea and the United States are well below the OECD average.

40 – 1. FISCAL CONSOLIDATION TARGETS, PLANS AND MEASURES IN OECD COUNTRIES
RESTORING PUBLIC FINANCES, 2012 UPDATE © OECD 2012
Figure 1.27. General government revenues (2007-11)
StatLink 2 http://dx.doi.org/10.1787/888932697122
Note: The OECD average does not include Turkey.
Source: OECD (2012), OECD Economic Outlook, Vol. 2012/1, No. 91, OECD Publishing,
doi:10.1787/eco_outlook-v2012-1-en (OECD Economic Outlook No. 90 for Turkey).
The revenue-to-GDP ratios decreased during 2007-11 in several countries such as
Iceland, Israel, New Zealand and Spain due to revenue contraction following the
economic downturn and reductions of the income tax rates. In contrast, the ratios
increased significantly in Hungary (category B) primarily due to asset transfers from
private pension funds to the state pension pillar. Also Portugal (category A) has
experienced an increase in the revenue-to-GDP ratio in the period.
Of total general government tax revenues, the largest share (33% of total tax revenue)
is made up of personal income taxes and corporate income taxes, followed by social
security contributions. Taxes on general consumption and on specific goods and services
also represent a significant amount of total tax revenue (Figure 1.28).

1. FISCAL CONSOLIDATION TARGETS, PLANS AND MEASURES IN OECD COUNTRIES – 41
RESTORING PUBLIC FINANCES, 2012 UPDATE © OECD 2012
Figure 1.28. Tax structures (2007-09)
StatLink 2 http://dx.doi.org/10.1787/888932697141
Source: OECD Revenue Statistics, November 2011.
There is considerable variance between OECD member countries in terms of relative
reliance on tax sources, especially consumption taxes (Figure 1.29). These differences
suggest that for some countries the scope for increasing consumption taxes might be
greater compared to other countries.
Figure 1.29. Relative reliance on tax revenue sources
StatLink 2 http://dx.doi.org/10.1787/888932697160
Source: OECD Revenue Statistics, November 2011.

42 – 1. FISCAL CONSOLIDATION TARGETS, PLANS AND MEASURES IN OECD COUNTRIES
RESTORING PUBLIC FINANCES, 2012 UPDATE © OECD 2012
The size of fiscal adjustments is also an important factor in explaining diverse
revenue enhancement measures. The majority of fiscal adjustment programmes include
some revenue measures in order to complement expenditure-based fiscal adjustment. But
countries with an IMF/EU programme like Greece, Hungary, Ireland, and Portugal, which
have large fiscal adjustment needs, have supplemented expenditure-based plans with
substantial revenue enhancement measures, since spending cuts alone might be not
enough to stabilise their public finances.
Major revenue enhancement measures
In this section, the revenue enhancement measures cover the whole period of the
countries’ consolidation plans, from 2009 to 2015 (2016 for Austria) depending on the
announced plan in each country.
The most frequently announced tax measure is still to raise consumption taxes, and
75% of OECD countries plan to raise consumption tax revenue – more than was the case
in last year’s report (Figure 1.30). This frequent use of consumption taxes implies that
policy makers believe that such taxes are likely to bring in significant revenue in the short
term with less of a negative impact on economic growth.
About 65% of OECD countries plan to raise income taxes, a higher number than last
year. Property taxes, tax expenditure, social security tax and non-tax revenue including
user fees and privatisation of state-owned enterprises also play a significant role in
enhancing revenues in some countries. However, for revenue enhancement purposes only
6-9 countries use special taxes on the financial sector and improving tax compliance
(Figure 1.30). Likewise, newly established tax items such as the tax levies on nuclear
power industry in Germany and a tax on non-renewable resources in Australia are
included in the other tax category in this report.
The impact of revenue enhancement measures varies widely. Not surprisingly,
countries with an IMF/EU programme (category A) announced larger quantified revenue
enhancement measures. Greece, Ireland and Portugal, together with Iceland, aspire to
increase their revenues by more than 5% of GDP (Figure 1.31). Hungary plans to enhance
revenue by 1.1% of GDP, combining a reduction of income taxes by 3.1% of GDP –
aimed at boosting economic activity – and an increase of other revenue enhancement
measures by 4.2% of GDP. On average, the countries in category A have reported
quantified revenue enhancement measures amounting to 5.3% of GDP. The average of
quantified revenue enhancement measures in categories B and C is 1.4% and 1.9% of
GDP respectively.
Increases in consumption taxes account for the largest share of revenue enhancement
measures in many countries (Figure 1.31). Income tax measures are used by a number of
countries, but their share of the total revenue increase is much smaller than consumption
taxes. Only Iceland, Ireland and Portugal expect a revenue increase from income taxes in
excess of 1% of GDP. In Greece, revenue enhancements mainly derive from increases of
social security fund contributions and improvements in tax compliance.

1. FISCAL CONSOLIDATION TARGETS, PLANS AND MEASURES IN OECD COUNTRIES – 43
RESTORING PUBLIC FINANCES, 2012 UPDATE © OECD 2012
Figure 1.30. Revenue enhancement measures – frequency (2009-15)
StatLink 2 http://dx.doi.org/10.1787/888932697179
Notes: Consumption taxes include value-added taxes, general sales tax, and taxes on specific goods and
services (excise duties). Income taxes include personal income taxes and taxes on corporate profits. Non-tax
revenue includes raising or introducing user fees (such as tolls for motorways), privatising state-owned
enterprises, selling state-owned real estate, etc. Improving tax compliance includes reforms to make tax
administration systems effective and transparent, efforts to reduce tax evasion and fraud.
Sources: OECD Fiscal Consolidation Survey 2012; and OECD (2011), “Restoring Public Finances: Fiscal
Consolidation in OECD Countries”, Special issue of the OECD Journal on Budgeting, Volume 2011/2,
doi:10.1787/budget-v11-2-en.
Figure 1.31. Quantified revenue enhancement measures (2009-15)
StatLink 2 http://dx.doi.org/10.1787/888932697198
Notes: Data on the breakdown of revenue enhancement measures announced by Italy, Korea, Mexico, the
Netherlands, New Zealand, Turkey and the United States are not available. Consumption tax measures
announced by Spain are not available. Austria has reported measures up to 2016. Norway and Sweden did not
apply any revenue enhancement measures.
Source: OECD Fiscal Consolidation Survey 2012.

44 – 1. FISCAL CONSOLIDATION TARGETS, PLANS AND MEASURES IN OECD COUNTRIES
RESTORING PUBLIC FINANCES, 2012 UPDATE © OECD 2012
Consumption taxes
Most countries announced consumption tax measures including hiking the rate of
value-added taxes (VAT), extra excise duties on tobacco and alcohol, and environmental
taxes as in last year’s report. Taxes on tobacco and alcohol are the most frequently
adopted consumption taxes followed by VAT (Figure 1.32A). Other specific new
consumption taxes include levies on telecom services, and lotteries were also reported as
well as many other unspecified excise duties.
Figure 1.32. Consumption taxes
StatLink 2 http://dx.doi.org/10.1787/888932697217
Note: Consumption tax measures announced by Italy, Mexico, Spain, Turkey and the United States are not
available in this survey.
Sources: OECD Fiscal Consolidation Survey 2012; and OECD (2011), “Restoring Public Finances: Fiscal
Consolidation in OECD Countries”, Special issue of the OECD Journal on Budgeting, Volume 2011/2,
doi:10.1787/budget-v11-2-en.
The impact of consumption tax measures is more than 1% of GDP in Ireland
(category A), Hungary (category B) and the Czech Republic, Finland, Iceland and Japan
(category C). Estonia also relies on increases of more than 1% of GDP (Figure 1.32B).
Japan plans a two-staged consumption tax increase to 10% by 2015 from the current tax
rate of 5%. Estonia, Finland, Ireland, Italy, Portugal, Spain and United Kingdom plan an

1. FISCAL CONSOLIDATION TARGETS, PLANS AND MEASURES IN OECD COUNTRIES – 45
RESTORING PUBLIC FINANCES, 2012 UPDATE © OECD 2012
increase of two percentage points or more in the rate of VAT (Figure 1.33). In contrast,
for example Greece (category A) and Poland (category B) shifted their focus from
consumption taxes to income tax and other tax measures including bank levies, as a
source of new revenue (Figure 1.32B). Some countries such as Greece, New Zealand and
Spain did not report consumption tax measures in this survey (Figure 1.32B).
Figure 1.33. VAT rate hikes (2009-15)
StatLink 2 http://dx.doi.org/10.1787/888932697236
1. New Zealand applies a general consumption tax.
Notes: VAT rate hikes in Belgium are not included (e.g. the VAT rate on TV emission is to be raised by
9 percentage points from 2012 onwards). France, Hungary and Mexico have also adopted measures on VAT,
but did not provide detailed data.
Sources: OECD Fiscal Consolidation Survey 2012, and OECD (2011), “Restoring Public Finances: Fiscal
Consolidation in OECD Countries”, Special issue of the OECD Journal on Budgeting, Volume 2011/2,
doi:10.1787/budget-v11-2-en.
Box 1.11. Consumption tax increase in Japan
The Japanese Cabinet officially adopted the “Comprehensive Reform of Social Security and
Tax” in February 2012 and specified its detailed plan for revenue enhancement and social
security stabilisation. To address rising social security spending, Japan is planning to double the
consumption tax rate to 10%. This change will occur in two key stages: from the current 5% to
8% in April 2014 and to 10% in October 2015. The enhanced revenue will be spent in part to
resolve the problem of children on waiting lists for day care and to improve the medical and
long-term care services as well as measures for low-income earners (JPY 2.7 trillion, equivalent
to 1% of the consumption tax rate increase). The rest of the enhanced revenue will increase the
national government’s contribution to the basic pension and will reduce the shifting of burdens
to future generations (JPY 10.8 trillion, equivalent to 4% of the consumption tax rate increase).
Income taxes, social security taxes, property taxes, and taxes on the financial
sector
To strengthen revenue, many countries have envisaged measures to enhance revenue
from personal income taxes (PIT), corporate income taxes, social security contributions,
property taxes and taxes on the financial sector. PIT is the most frequently used measure,

46 – 1. FISCAL CONSOLIDATION TARGETS, PLANS AND MEASURES IN OECD COUNTRIES
RESTORING PUBLIC FINANCES, 2012 UPDATE © OECD 2012
and in 2012 more countries reported their plans to enhance revenue through PIT as well
as through corporate income tax and social security contributions than described in last
year’s report. Some countries such as Belgium, France, Iceland and Ireland are also
expecting revenue increases from property tax, whereas the tax on the financial sector is
somewhat less frequently used (Figure 1.34A).
Figure 1.34. Income-related taxes
StatLink 2 http://dx.doi.org/10.1787/888932697255
Notes: For Figure 1.34A: Property taxes were not presented in last year’s report. For Figure 1.34B: The figure
adds the impact of income taxes, social security contributions, property taxes, and taxes on the financial sector.
The comparison with last year’s report is not described as property tax was not included in last year’s
components. Income-related tax measures announced by Italy, Mexico and the United States are not available.
Sources: OECD Fiscal Consolidation Survey 2012; and OECD (2011), “Restoring Public Finances: Fiscal
Consolidation in OECD Countries”, Special issue of the OECD Journal on Budgeting, Volume 2011/2,
doi:10.1787/budget-v11-2-en.
The Czech Republic, France and Iceland (category C), Poland and Spain (category B)
and all three countries with an IMF/EU programme (category A) expect to gain extra
revenues of more than 1% of GDP from these measures (Figure 1.34B). Ireland tops the
list with its PIT revenue increase from 1.2% to 4% of GDP, whereas Hungary plans to

1. FISCAL CONSOLIDATION TARGETS, PLANS AND MEASURES IN OECD COUNTRIES – 47
RESTORING PUBLIC FINANCES, 2012 UPDATE © OECD 2012
reduce PIT revenue by 3.1% of GDP to provide effective incentive to workforce. Social
security contributions are a significant source of revenue increases – by more than 1% of
GDP – in the Czech Republic, Greece, Hungary and Poland. An example is the
cancellation of a reduction in employers’ contributions in the Czech Republic.
Property taxes contribute to revenue enhancement by more than 0.1% of GDP in
Belgium, France, Iceland, Ireland, Poland and Slovenia. An example is a charge of
EUR 200 on second homes in Ireland. Taxes on the financial sector play a significant role
in raising tax revenue by more than 0.1% of GDP in Austria, Germany, Hungary and the
Slovak Republic. An example is a bank levy in Germany whose proceeds will go to
restructuring the fund for banking. The levy will bring an additional EUR 6 billion
(0.21% of GDP) by 2014.
Other revenue enhancement measures
Tightening tax deductions and other tax benefits (tax expenditures) is also used by
countries to increase revenues (Figure 1.35A). Portugal announced that it would revise
and limit tax allowances and other tax benefits in income tax, which will increase revenue
by 1.05% of GDP, a higher impact than the 0.46% of GDP in last year’s report
(Figure 1.35A). Belgium also plans to reduce the deduction for energy-saving
investments, and the Slovak Republic plans to phase out exemptions for bio-fuels. In
contrast, Denmark and Ireland did not report tax expenditure measures in this survey as
they did last year.
Several countries will implement measures to make their tax administrations more
effective and to reduce tax evasion (Figure 1.35B). Greece expects to collect extra
revenue amounting to 1.3% of GDP, which is higher than the 0.7% of GDP reported last
year. Austria, Belgium, Canada, Finland and Portugal also expect significant revenue
increases by closing loopholes and improving the fairness of the tax system. In contrast,
Slovenia did not report tax compliance measures as they did last year.
In addition to increasing tax measures, some countries are implementing non-tax
measures to increase revenues. These measures amount to more than 0.2% of GDP in
Iceland, Poland, Portugal, the Slovak Republic and Spain (Figure 1.35C). For instance,
the Slovak Republic plans to sell the CO2 emission permit and increase the fees on
highways, on electricity and on fuels. In Belgium, revenue stemming from the
monopolised lottery and fines are expected. Portugal expects a revenue increase from the
introduction of tolls in motorways.

48 – 1. FISCAL CONSOLIDATION TARGETS, PLANS AND MEASURES IN OECD COUNTRIES
RESTORING PUBLIC FINANCES, 2012 UPDATE © OECD 2012
Figure 1.35. Impact of other revenue enhancement measures
StatLink 2 http://dx.doi.org/10.1787/888932697274
Notes: For Figure 1.35A: Tax expenditure measures announced by Germany, Greece, Italy, Korea, Spain and
the United States are not available. For Figure 1.35C: Non-tax revenue measures announced by Italy,
New Zealand and the United States are not available. Estonia did not report non-tax revenues although they
accounted for 2.1% of GDP in last year’s report, which is not included in Figure 1.35C.
Sources: OECD Fiscal Consolidation Survey 2012; and OECD (2011), “Restoring Public Finances: Fiscal
Consolidation in OECD Countries”, Special issue of the OECD Journal on Budgeting, Volume 2011/2,
doi:10.1787/budget-v11-2-en.

1. FISCAL CONSOLIDATION TARGETS, PLANS AND MEASURES IN OECD COUNTRIES – 49
RESTORING PUBLIC FINANCES, 2012 UPDATE © OECD 2012
Do the consolidation measures contribute structurally?
As in last year’s report, the country consolidation plans may be seen as combining
long-term structural measures, the rolling back of stimulus measures and short-term
additional adjustments.
By now, most stimulus packages are being or have been rolled back. Still some
countries with small consolidation needs include the withdrawal of such stimulus
measures in the consolidation plans (Finland, Sweden, Switzerland).
Some consolidation measures are not considered to have a structural impact because
they are either one-off or temporary measures, or because they rely primarily on
accounting changes that do not improve the underlying primary balance. Such measures
may appeal to countries under market pressure to consolidate (category B) either to help
relieve liquidity pressures, or because they are seeking to front-load deficit improvements
in order to reassure capital markets. For example, Poland has introduced changes in the
funded pension scheme by reducing the rate that provides funds to the second pension
pillar, leading to an increase in government revenue (0.8% of GDP by 2015). Also,
Hungary has made changes to the pension scheme; for example, from 31 December 2011
the whole social security pension contribution flows to the government Pension Insurance
Fund, following an asset transfer from private pension funds to the state pension pillar in
2011. Hungary has also introduced other one-off measures in 2012 amounting to 0.7% of
GDP. Luxembourg has introduced a crisis levy (0.2% of GDP by 2013), and New
Zealand will partially privatise state-owned assets (worth NZD 5-7 billion by 2017).
Some operational and administrative efficiency measures may not realise the
expected fiscal impacts, either because their effects may fade over time, as in the case of
wage reductions or limiting wage increases, or because they are based on assumptions of
user behaviour, as in the case of improving tax compliance.
Instead of adopting a specific consolidation plan, some countries rely on general
strategies for cap on expenditures, like Australia, Japan, Korea and Turkey. These
strategies includes rules that an increase in expenditure will be kept below the increase in
revenue (Korea and Turkey), an annual cap on real spending growth (Australia), and limit
spending to the level of a previous budget (Japan).
Finally, economic assumptions that are systematically “optimistic” understate fiscal
consolidation needs, undermining countries’ ability to meet their deficit reduction targets
over time. Due to the headwinds on economic recovery from late 2011, several OECD
countries have slightly more optimistic assumptions of economic growth in the 2012
budget and in the consolidation plan than the reality now suggests. Over-optimistic
growth assumptions imply that increased expenditures on social welfare like
unemployment benefit and reduced tax revenue will add to the planned deficit in 2012.
Therefore several countries may adopt additional measures in 2012, or may accept a
larger deficit than planned. For some countries this increased deficit may be countered by
the better than planned results in 2011.
So, while the majority of the plans – on both the expenditure and revenue sides –
appear to include long-term structural measures that improve long-term fiscal
sustainability, there is still room for further efforts to adopt lasting, sustainable
consolidation measures. Additional structural efforts, however, may still need to solve
political economy barriers.
50 – 1. FISCAL CONSOLIDATION TARGETS, PLANS AND MEASURES IN OECD COUNTRIES
RESTORING PUBLIC FINANCES, 2012 UPDATE © OECD 2012
Structural reforms on pensions are being implemented
Some structural reforms may not be appropriately captured by short- or medium-term
consolidation estimates. This is particularly true for pension reforms, as they are usually
set up in a long-term framework. In addition to the consolidation measures presented in
this chapter and in Chapter 2, over the last five years many OECD countries have adopted
changes in pension schemes aiming at strengthening long-term sustainability. Such
changes were already under way before the crisis, as several OECD countries had
recognised a long-term sustainability problem due to an ageing population. During the
last five crisis years, OECD countries have intensified their work on pension reforms.
During the period 2007-11, nearly all OECD countries introduced changes in the
provision of retirement income (OECD, 2012c). The only exception is Luxembourg
which has seen no changes so far but has issued guidelines for a pension reform (see the
country note in Chapter 2), although Iceland, the Netherlands, New Zealand, Slovenia
and the United States have seen only relatively minor adjustments compared with most
other OECD countries.
Changes in pension schemes include, among other elements, increases in pensionable
ages, the introduction of automatic adjustment mechanisms, and the strengthening of
work incentives. Some countries have also better focused public pension expenditure on
lower income groups.
Some countries have cut pension benefits “across the board” with equal impact on
low and high earners, namely Austria, Germany, Italy, Japan, Korea, Portugal and
Turkey. The OECD has estimated that in these countries the benefits for today’s workers
on average will be 23% lower than they would have been according to the old rules.
Other OECD countries have protected low earners from some or all of the benefit
reductions. Average earners in Finland, France and Sweden, for example, will receive
pensions 15-20% less than under the old rules, while lower earners are less affected.
Some central and eastern European countries have pulled back earlier reforms that
replaced part of their pay-as-you-go benefits with a mandatory funded component of
defined-contribution pension plans managed by the private sector. The OECD estimates
that these reversals will cause lower pension benefits of about 20% for a full-career
worker in Hungary and around 15% with Poland’s partial reversal.
Table 1.4 shows major elements of the pension reforms undertaken in OECD
countries from the start of the crisis in September 2007, as per February 2012.6 The
overview shown in the table covers both the private and the public sector. The elements
of reform are organised into six different categories reflecting different objectives of the
pension system, along with a residual grouping for other changes:
coverage of the pension system, by both mandatory (public and private) and
voluntary (private) schemes;
adequacy of retirement benefits to maintain a decent standard of living in old age,
including both public and private pensions;
financial sustainability and affordability of pensions for taxpayers and
contributors;
work incentives: minimising the distortions of the retirement-income system on
individuals’ labour-supply decisions and encouraging people to work longer as
populations age;

1. FISCAL CONSOLIDATION TARGETS, PLANS AND MEASURES IN OECD COUNTRIES – 51
RESTORING PUBLIC FINANCES, 2012 UPDATE © OECD 2012
Table 1.4. Overview of pension reform measures (September 2007 to February 2012)
Country Coverage Adequacy Sustainability Work
incentives Administrative
efficiency Diversification
/ scrutiny Other
Australia X X X X X X
Austria X X X X
Belgium X X
Canada X X
Chile X X X X X
Czech Republic X X X X X
Denmark X X
Estonia X X X X
Finland X X X X X
France X X X
Germany X X X
Greece X X X X X
Hungary X X X
Iceland X X
Ireland X X X X X
Israel1 X X
Italy X X X X
Japan X X X
Korea X X X
Luxembourg
Mexico X X
Netherlands X
New Zealand X X
Norway X X
Poland X X X X X
Portugal X X
Slovak Republic X X X
Slovenia X
Spain X X X
Sweden X X X
Switzerland X X
Turkey X X X
United Kingdom X X X X X X X
United States X
StatLink 2 http://dx.doi.org/10.1787/888932698585
1. The statistical data for Israel are supplied by and under the responsibility of the relevant Israeli authorities.
The use of such data by the OECD is without prejudice to the status of the Golan Heights, East Jerusalem and
Israeli settlements in the West Bank under the terms of international law.
Source: OECD (2012), OECD Pensions Outlook 2012, OECD Publishing, doi:10.1787/9789264169401-en.

52 – 1. FISCAL CONSOLIDATION TARGETS, PLANS AND MEASURES IN OECD COUNTRIES
RESTORING PUBLIC FINANCES, 2012 UPDATE © OECD 2012
administrative efficiency: keeping the cost of collecting contributions, paying
benefits and (where necessary) managing investments as low as possible; and
diversification of retirement savings, between different providers (public and
private) and between different types of financing (pay-as-you-go and
pre-funding), and measures to ensure security of benefits in the face of different
risks and uncertainties.
About a third of OECD countries have taken significant steps to improve the coverage
of pension schemes in the period since September 2007. Four countries have introduced
relatively modest measures to expand the numbers in the public pension arrangements:
Austria (people providing care for family members), France (recipients of maternity
benefits), Ireland (low earners) and Japan (the self-employed). However, most efforts
have been made to expand the reach of private pension plans.
About 40% of OECD countries have addressed issues of adequacy in the changes to
pension schemes during the last four and a half years. Among the measures in this
category are means-tested benefits, new targeted programmes, additional tax reliefs for
older people, and increased value of the basic pension.
Approximately 50% of OECD countries have changed sustainability and work
incentives in this period. Most OECD countries already have increased pensionable ages,
or have planned an increase in the coming years, leaving only Chile, Finland,
Luxembourg and Mexico with no change.
Most OECD countries have established a pension age of 65, and 13 OECD countries
are increasing the pension age to 67 or higher (12 countries for women) or have already
established this pension age. There is only a handful of countries with pension ages
below 65 (for men: France, Luxembourg, the Slovak Republic and Slovenia). Only Chile,
Israel, Poland, Slovenia and Switzerland have a lower pension age for women than for
men. Nevertheless, even with these increases in pension ages, the expected duration of
retirement will expand on average across OECD countries. According to OECD
estimates, only in a few OECD countries will the pension age increases keep pace with
forecast improvements in life expectancy: the Czech Republic, Greece, Hungary, Italy,
Korea and Turkey. In Austria, Estonia, the Slovak Republic and the United Kingdom,
pension age increases exceed the projected growth in life expectancy for women, but not
for men.
Nearly all OECD countries are taking action to ensure that people “live longer, work
longer”. In addition to work incentives in the pension schemes, indexation of pension
benefits, higher pension ages and tighter rules for early retirement, some countries have
also adopted other measures to bolster long-term pension system sustainability. These
measures include reducing the pension replacement rate (Korea), extending the number of
years of earning used to calculate pension benefits (Greece), abolishing additional,
seasonal pension benefits (Greece and Hungary), introducing notional accounts that entail
an automatic reduction in the level of pension benefits as life expectancy increases (Italy,
Norway, Poland and Sweden), and changing taxes (Australia, Ireland, New Zealand and
the United Kingdom).
Improving administrative efficiency was the least common area of reform even
though administrative costs and charges have remained a significant policy concern for
the OECD countries where there are substantial private pension providers. For public
pension provisions there are a few examples of improvements in administrative

1. FISCAL CONSOLIDATION TARGETS, PLANS AND MEASURES IN OECD COUNTRIES – 53
RESTORING PUBLIC FINANCES, 2012 UPDATE © OECD 2012
efficiency – in particular Greece, which is reducing its 133 public pension institutions
into just three. Japan has established an entirely new agency to manage public pensions,
and Italy merged two other major agencies into its main agency for pension provision
(INPS). Sweden has merged its clearing-house for private pensions with the management
of public pensions, aiming to reduce costs further.
Half of OECD countries have made changes in diversification/security. This relates to
giving greater choice to individuals to influence the way their retirement savings are
invested in private plans, allowing for greater diversification of pension fund portfolios,
and changes related to pension fund solvency.
The category of other reform measures covers a diverse range of significant
developments in pension policy. First, some central and eastern European countries have
reversed earlier reforms that had introduced mandatory private pensions into the
provision of retirement income (Estonia, Hungary, Poland and the Slovak Republic).
Second, other countries have retreated partly or fully from earlier commitments to
pre-fund future public pension liabilities (France, Ireland and New Zealand).
Notes
1. Ireland (March 2011), Finland (June 2011), Portugal (June 2011), Greece
(November 2011 and May 2012), Italy (November 2011), Spain (December 2011),
Belgium (December 2011), Slovenia (February 2012), Slovak Republic
(March 2012), Netherlands (April 2012), France (May 2012).
2. No consolidation is planned in Chile; Israel did not provide complete data in time for
this report.
3. On 30 May 2012, the European Commission concluded that the correction of the
excessive deficit for Germany has been ensured and adopted a proposal for a Council
decision to abrogate the excessive deficit procedure, which the European finance
ministers agreed on 21-22 June.
4. There are some caveats on the comparability of the countries. Some countries did not
provide data for the implemented consolidation (2009/10-11). For the most striking
examples (like Greece), the OECD Secretariat has included the consolidation
described in last year’s report as if it had been implemented as planned. Some
countries did not provide cumulative data. Wherever possible, the data have been
recalculated into cumulative consolidation.
5. Iceland and Luxembourg were not included in last year’s OECD average.
6. See OECD (2012c), OECD Pensions Outlook 2012, OECD Publishing, page 21-22
and Table 1.1. More details are available in Annex 1.A1 to the OECD Pensions
Outlook 2012.


3. INVOLVING SUB-NATIONAL GOVERNMENTS IN FISCAL CONSOLIDATION – 55
RESTORING PUBLIC FINANCES, 2012 UPDATE © OECD 2012

56 – 3. INVOLVING SUB-NATIONAL GOVERNMENTS IN FISCAL CONSOLIDATION
RESTORING PUBLIC FINANCES, 2012 UPDATE © OECD 2012
References
OECD (2009), Government at a Glance 2009, OECD Publishing, Paris,
doi:10.1787/97896405061-en.
OECD (2010), “Restoring Fiscal Sustainability: Lessons for the Public Sector”, OECD,
Paris, www.oecd.org/dataoecd/1/60/44473800.pdf.
OECD (2011a), “Restoring Public Finances: Fiscal Consolidation in OECD Countries”,
Special issue of the OECD Journal on Budgeting, Volume 2011/2,
doi:10.1787/budget-v11-2-en.
OECD (2011b), OECD Economic Outlook, Vol. 2011/2 (No. 90), OECD Publishing,
Paris, doi:10.1787/eco_outlook-v2011-2-en.
OECD (2012a), OECD Economic Outlook, Vol. 2012/1 (No. 91), OECD Publishing,
Paris, doi:10.1787/eco_outlook-v2012-1-en.
OECD (2012b), “OECD Economic Outlook No. 91”, OECD Economic Outlook:
Statistics and Projections (database), doi:10.1787/data-00606-en.
OECD (2012c), OECD Pensions Outlook 2012, OECD Publishing, Paris,
doi:10.1787/9789264169401-en.
Schick, Allen (2012), “Lessons from the crisis: will the crisis change budgeting?”,
GOV/PGC/SBO(2012)2, OECD, Paris.


![[Phy] Chapter 6 Waves 2012](https://img.pdfslide.net/doc/110x75/552dd7125503468e7a8b47df/phy-chapter-6-waves-2012.jpg)