Embed Size (px)
Citation preview
CHAPTER 12
Probes for Organelles
Molecular Probes™ HandbookA Guide to Fluorescent Probes and Labeling Technologies
11th Edition (2010)
CHAPTER 1
Fluorophores and Their Amine-Reactive Derivatives
The Molecular Probes® HandbookA GUIDE TO FLUORESCENT PROBES AND LABELING TECHNOLOGIES11th Edition (2010)
Molecular Probes® Resources
Molecular Probes® Handbook (online version)Comprehensive guide to �uorescent probes and labeling technologies
lifetechnologies.com/handbook
Fluorescence SpectraViewerIdentify compatible sets of �uorescent dyes and cell structure probes
lifetechnologies.com/spectraviewer
BioProbes® Journal of Cell Biology ApplicationsAward-winning magazine highlighting cell biology products and applications
lifetechnologies.com/bioprobes
Access all Molecular Probes® educational resources at lifetechnologies.com/mpeducate
Molecular Probes ResourcesMolecular Probes Handbook (online version)Comprehensive guide to fl uorescent probes and labeling technologiesthermofi sher.com/handbook
Molecular Probes Fluorescence SpectraViewerIdentify compatible sets of fl uorescent dyes and cell structure probesthermofi sher.com/spectraviewer
BioProbes Journal of Cell Biology ApplicationsAward-winning magazine highlighting cell biology products and applicationsthermofi sher.com/bioprobes
Access all Molecular Probes educational resources at thermofi sher.com/probes
495www.invitrogen.com/probes
The Molecular Probes® Handbook: A Guide to Fluorescent Probes and Labeling TechnologiesIMPORTANT NOTICE: The products described in this manual are covered by one or more Limited Use Label License(s). Please refer to the Appendix on page 971 and Master Product List on page 975. Products are For Research Use Only. Not intended for any animal or human therapeutic or diagnostic use.
TW
ELV
E
CHAPTER 12
Probes for Organelles
12.1 A Diverse Selection of Organelle Probes . . . . . . . . . . . . . . . . . . . . . . . . . . . . . . . . . . . . . . . . 499
12.2 Probes for Mitochondria . . . . . . . . . . . . . . . . . . . . . . . . . . . . . . . . . . . . . . . . . . . . . . . . . . . . 503
MitoTracker® Probes: Fixable Mitochondrion-Selective Probes . . . . . . . . . . . . . . . . . . . . . . . . . . . . . . . . . . . . . . . . . . . . . . . . . . . . . . . . . . . . . 503
Properties of MitoTracker® Probes . . . . . . . . . . . . . . . . . . . . . . . . . . . . . . . . . . . . . . . . . . . . . . . . . . . . . . . . . . . . . . . . . . . . . . . . . . . . . . . . . . 504
Orange-, Red- and Infrared-Fluorescent MitoTracker® Dyes . . . . . . . . . . . . . . . . . . . . . . . . . . . . . . . . . . . . . . . . . . . . . . . . . . . . . . . . . . . . . . 504
MitoTracker® Green FM® Dye . . . . . . . . . . . . . . . . . . . . . . . . . . . . . . . . . . . . . . . . . . . . . . . . . . . . . . . . . . . . . . . . . . . . . . . . . . . . . . . . . . . . . . 506
Image-iT® LIVE Mitochondrial and Nuclear Labeling Kit . . . . . . . . . . . . . . . . . . . . . . . . . . . . . . . . . . . . . . . . . . . . . . . . . . . . . . . . . . . . . . . . . 506
Fluorescent Protein–Based Markers for Mitochondria. . . . . . . . . . . . . . . . . . . . . . . . . . . . . . . . . . . . . . . . . . . . . . . . . . . . . . . . . . . . . . . . . . . . . 507
MitoSOX™ Red Mitochondrial Superoxide Indicator . . . . . . . . . . . . . . . . . . . . . . . . . . . . . . . . . . . . . . . . . . . . . . . . . . . . . . . . . . . . . . . . . . . . . . 507
RedoxSensor™ Red CC-1 Stain . . . . . . . . . . . . . . . . . . . . . . . . . . . . . . . . . . . . . . . . . . . . . . . . . . . . . . . . . . . . . . . . . . . . . . . . . . . . . . . . . . . . . . . . 508
JC-1 and JC-9: Dual-Emission Potential-Sensitive Probes . . . . . . . . . . . . . . . . . . . . . . . . . . . . . . . . . . . . . . . . . . . . . . . . . . . . . . . . . . . . . . . . . . 508
Mitochondrion-Selective Rhodamines and Rosamines. . . . . . . . . . . . . . . . . . . . . . . . . . . . . . . . . . . . . . . . . . . . . . . . . . . . . . . . . . . . . . . . . . . . 510
Rhodamine 123 . . . . . . . . . . . . . . . . . . . . . . . . . . . . . . . . . . . . . . . . . . . . . . . . . . . . . . . . . . . . . . . . . . . . . . . . . . . . . . . . . . . . . . . . . . . . . . . . 510
Rosamines and Other Rhodamine Derivatives, Including TMRM and TMRE . . . . . . . . . . . . . . . . . . . . . . . . . . . . . . . . . . . . . . . . . . . . . . . . . . 510
Reduced Rhodamines and Rosamines. . . . . . . . . . . . . . . . . . . . . . . . . . . . . . . . . . . . . . . . . . . . . . . . . . . . . . . . . . . . . . . . . . . . . . . . . . . . . . . 511
Other Mitochondrion-Selective Probes . . . . . . . . . . . . . . . . . . . . . . . . . . . . . . . . . . . . . . . . . . . . . . . . . . . . . . . . . . . . . . . . . . . . . . . . . . . . . . . . 511
Carbocyanines . . . . . . . . . . . . . . . . . . . . . . . . . . . . . . . . . . . . . . . . . . . . . . . . . . . . . . . . . . . . . . . . . . . . . . . . . . . . . . . . . . . . . . . . . . . . . . . . . 511
Styryl Dyes . . . . . . . . . . . . . . . . . . . . . . . . . . . . . . . . . . . . . . . . . . . . . . . . . . . . . . . . . . . . . . . . . . . . . . . . . . . . . . . . . . . . . . . . . . . . . . . . . . . . 512
Nonyl Acridine Orange. . . . . . . . . . . . . . . . . . . . . . . . . . . . . . . . . . . . . . . . . . . . . . . . . . . . . . . . . . . . . . . . . . . . . . . . . . . . . . . . . . . . . . . . . . . 512
Carboxy SNARF®-1 pH Indicator. . . . . . . . . . . . . . . . . . . . . . . . . . . . . . . . . . . . . . . . . . . . . . . . . . . . . . . . . . . . . . . . . . . . . . . . . . . . . . . . . . . . 512
Lucigenin . . . . . . . . . . . . . . . . . . . . . . . . . . . . . . . . . . . . . . . . . . . . . . . . . . . . . . . . . . . . . . . . . . . . . . . . . . . . . . . . . . . . . . . . . . . . . . . . . . . . . 512
Mitochondrial Transition Pore Assays . . . . . . . . . . . . . . . . . . . . . . . . . . . . . . . . . . . . . . . . . . . . . . . . . . . . . . . . . . . . . . . . . . . . . . . . . . . . . . . . . . 512
Image-iT® LIVE Mitochondrial Transition Pore Assay Kit for Fluorescence Microscopy . . . . . . . . . . . . . . . . . . . . . . . . . . . . . . . . . . . . . . . . . . 512
MitoProbe™ Transition Pore Assay Kit for Flow Cytometry. . . . . . . . . . . . . . . . . . . . . . . . . . . . . . . . . . . . . . . . . . . . . . . . . . . . . . . . . . . . . . . . 513
Yeast Mitochondrial Stain Sampler Kit . . . . . . . . . . . . . . . . . . . . . . . . . . . . . . . . . . . . . . . . . . . . . . . . . . . . . . . . . . . . . . . . . . . . . . . . . . . . . . . . . 513
Avidin Conjugates for Staining Mitochondria . . . . . . . . . . . . . . . . . . . . . . . . . . . . . . . . . . . . . . . . . . . . . . . . . . . . . . . . . . . . . . . . . . . . . . . . . . . 514
Data Table 12.2 Probes for Mitochondria. . . . . . . . . . . . . . . . . . . . . . . . . . . . . . . . . . . . . . . . . . . . . . . . . . . . . . . . . . . . . . . . . . . . . . . . . . . . . . . 515
Product List 12.2 Probes for Mitochondria . . . . . . . . . . . . . . . . . . . . . . . . . . . . . . . . . . . . . . . . . . . . . . . . . . . . . . . . . . . . . . . . . . . . . . . . . . . . . 515
12.3 Probes for Lysosomes, Peroxisomes and Yeast Vacuoles . . . . . . . . . . . . . . . . . . . . . . . . . . . . 516
LysoTracker® Probes: Acidic Organelle–Selective Cell-Permeant Probes . . . . . . . . . . . . . . . . . . . . . . . . . . . . . . . . . . . . . . . . . . . . . . . . . . . . . . 516
LysoTracker® Probes . . . . . . . . . . . . . . . . . . . . . . . . . . . . . . . . . . . . . . . . . . . . . . . . . . . . . . . . . . . . . . . . . . . . . . . . . . . . . . . . . . . . . . . . . . . . . 516
Image-iT® LIVE Lysosomal and Nuclear Labeling Kit . . . . . . . . . . . . . . . . . . . . . . . . . . . . . . . . . . . . . . . . . . . . . . . . . . . . . . . . . . . . . . . . . . . . 518
LysoSensor™ Probes: Acidic Organelle–Selective pH Indicators . . . . . . . . . . . . . . . . . . . . . . . . . . . . . . . . . . . . . . . . . . . . . . . . . . . . . . . . . . . . . 518
LysoSensor™ Probes. . . . . . . . . . . . . . . . . . . . . . . . . . . . . . . . . . . . . . . . . . . . . . . . . . . . . . . . . . . . . . . . . . . . . . . . . . . . . . . . . . . . . . . . . . . . . 518
LysoSensor™ Yellow/Blue Dextran . . . . . . . . . . . . . . . . . . . . . . . . . . . . . . . . . . . . . . . . . . . . . . . . . . . . . . . . . . . . . . . . . . . . . . . . . . . . . . . . . . 519
DAMP and Other Lysosomotropic Probes . . . . . . . . . . . . . . . . . . . . . . . . . . . . . . . . . . . . . . . . . . . . . . . . . . . . . . . . . . . . . . . . . . . . . . . . . . . . . . 519
DAMP . . . . . . . . . . . . . . . . . . . . . . . . . . . . . . . . . . . . . . . . . . . . . . . . . . . . . . . . . . . . . . . . . . . . . . . . . . . . . . . . . . . . . . . . . . . . . . . . . . . . . . . . 519
RedoxSensor™ Red CC-1 Stain . . . . . . . . . . . . . . . . . . . . . . . . . . . . . . . . . . . . . . . . . . . . . . . . . . . . . . . . . . . . . . . . . . . . . . . . . . . . . . . . . . . . . 520
Other Lysosomotropic Probes . . . . . . . . . . . . . . . . . . . . . . . . . . . . . . . . . . . . . . . . . . . . . . . . . . . . . . . . . . . . . . . . . . . . . . . . . . . . . . . . . . . . . 520
The Molecular Probes™ Handbook: A Guide to Fluorescent Probes and Labeling Technologies
IMPORTANT NOTICE : The products described in this manual are covered by one or more Limited Use Label License(s). Please refer to the Appendix on page 971 and Master Product List on page 975. Products are For Research Use Only. Not intended for any animal or human therapeutic or diagnostic use.
thermofi sher.com/probes

496www.invitrogen.com/probes
The Molecular Probes® Handbook: A Guide to Fluorescent Probes and Labeling TechnologiesIMPORTANT NOTICE: The products described in this manual are covered by one or more Limited Use Label License(s). Please refer to the Appendix on page 971 and Master Product List on page 975. Products are For Research Use Only. Not intended for any animal or human therapeutic or diagnostic use.
Chapter 12 — Probes for Organelles
Cell-Permeant Probes for Yeast Vacuoles . . . . . . . . . . . . . . . . . . . . . . . . . . . . . . . . . . . . . . . . . . . . . . . . . . . . . . . . . . . . . . . . . . . . . . . . . . . . . . . 520
FUN® 1 Vital Cell Stain for Yeast . . . . . . . . . . . . . . . . . . . . . . . . . . . . . . . . . . . . . . . . . . . . . . . . . . . . . . . . . . . . . . . . . . . . . . . . . . . . . . . . . . . . 520
FM® 4-64 and FM® 5-95 . . . . . . . . . . . . . . . . . . . . . . . . . . . . . . . . . . . . . . . . . . . . . . . . . . . . . . . . . . . . . . . . . . . . . . . . . . . . . . . . . . . . . . . . . . 521
Yeast Vacuole Marker Sampler Kit . . . . . . . . . . . . . . . . . . . . . . . . . . . . . . . . . . . . . . . . . . . . . . . . . . . . . . . . . . . . . . . . . . . . . . . . . . . . . . . . . . 521
Fluorescent Protein–Based Markers for Lysosomes, Peroxisomes and Endosomes . . . . . . . . . . . . . . . . . . . . . . . . . . . . . . . . . . . . . . . . . . . . . 521
SelectFX® Alexa Fluor® 488 Peroxisome Labeling Kit . . . . . . . . . . . . . . . . . . . . . . . . . . . . . . . . . . . . . . . . . . . . . . . . . . . . . . . . . . . . . . . . . . . . . . 522
Data Table 12.3 Probes for Lysosomes, Peroxisomes and Yeast Vacuoles . . . . . . . . . . . . . . . . . . . . . . . . . . . . . . . . . . . . . . . . . . . . . . . . . . . . . 523
Product List 12.3 Probes for Lysosomes, Peroxisomes and Yeast Vacuoles . . . . . . . . . . . . . . . . . . . . . . . . . . . . . . . . . . . . . . . . . . . . . . . . . . . 524
12.4 Probes for the Endoplasmic Reticulum and Golgi Apparatus. . . . . . . . . . . . . . . . . . . . . . . . . 524
ER-Tracker™ Dyes for Live-Cell Endoplasmic Reticulum Labeling. . . . . . . . . . . . . . . . . . . . . . . . . . . . . . . . . . . . . . . . . . . . . . . . . . . . . . . . . . . . 525
ER-Tracker™ Blue-White DPX Dye. . . . . . . . . . . . . . . . . . . . . . . . . . . . . . . . . . . . . . . . . . . . . . . . . . . . . . . . . . . . . . . . . . . . . . . . . . . . . . . . . . . 525
ER-Tracker™ Green and Red Dyes. . . . . . . . . . . . . . . . . . . . . . . . . . . . . . . . . . . . . . . . . . . . . . . . . . . . . . . . . . . . . . . . . . . . . . . . . . . . . . . . . . . 525
Carbocyanine Dyes. . . . . . . . . . . . . . . . . . . . . . . . . . . . . . . . . . . . . . . . . . . . . . . . . . . . . . . . . . . . . . . . . . . . . . . . . . . . . . . . . . . . . . . . . . . . . . . . . 525
Short-Chain Carbocyanine Dyes . . . . . . . . . . . . . . . . . . . . . . . . . . . . . . . . . . . . . . . . . . . . . . . . . . . . . . . . . . . . . . . . . . . . . . . . . . . . . . . . . . . 525
Long-Chain Carbocyanine Dyes. . . . . . . . . . . . . . . . . . . . . . . . . . . . . . . . . . . . . . . . . . . . . . . . . . . . . . . . . . . . . . . . . . . . . . . . . . . . . . . . . . . . 526
Fluorescent Ceramide Analogs . . . . . . . . . . . . . . . . . . . . . . . . . . . . . . . . . . . . . . . . . . . . . . . . . . . . . . . . . . . . . . . . . . . . . . . . . . . . . . . . . . . . . . . 526
NBD Ceramide and NBD Sphingomyelin . . . . . . . . . . . . . . . . . . . . . . . . . . . . . . . . . . . . . . . . . . . . . . . . . . . . . . . . . . . . . . . . . . . . . . . . . . . . . 526
BODIPY® Ceramides, BODIPY® Sphingomyelin and Related Derivatives . . . . . . . . . . . . . . . . . . . . . . . . . . . . . . . . . . . . . . . . . . . . . . . . . . . . . 526
Fluorescent Protein–Based Markers for the Endoplasmic Reticulum and Golgi Apparatus . . . . . . . . . . . . . . . . . . . . . . . . . . . . . . . . . . . . . . . 527
SelectFX® Alexa Fluor® 488 Endoplasmic Reticulum Labeling Kit. . . . . . . . . . . . . . . . . . . . . . . . . . . . . . . . . . . . . . . . . . . . . . . . . . . . . . . . . . . . 527
Lectins for Staining the Golgi Apparatus . . . . . . . . . . . . . . . . . . . . . . . . . . . . . . . . . . . . . . . . . . . . . . . . . . . . . . . . . . . . . . . . . . . . . . . . . . . . . . . 528
Wheat Germ Agglutinin and Concanavalin A . . . . . . . . . . . . . . . . . . . . . . . . . . . . . . . . . . . . . . . . . . . . . . . . . . . . . . . . . . . . . . . . . . . . . . . . . 528
Gri�onia simplicifolia Lectin GS-II . . . . . . . . . . . . . . . . . . . . . . . . . . . . . . . . . . . . . . . . . . . . . . . . . . . . . . . . . . . . . . . . . . . . . . . . . . . . . . . . . . . 528
Helix pomatia (Edible Snail) Agglutinin . . . . . . . . . . . . . . . . . . . . . . . . . . . . . . . . . . . . . . . . . . . . . . . . . . . . . . . . . . . . . . . . . . . . . . . . . . . . . . 528
Brefeldin A . . . . . . . . . . . . . . . . . . . . . . . . . . . . . . . . . . . . . . . . . . . . . . . . . . . . . . . . . . . . . . . . . . . . . . . . . . . . . . . . . . . . . . . . . . . . . . . . . . . . . . . . 528
Data Table 12.4 Probes for the Endoplasmic Reticulum and Golgi Apparatus . . . . . . . . . . . . . . . . . . . . . . . . . . . . . . . . . . . . . . . . . . . . . . . . . 529
Product List 12.4 Probes for the Endoplasmic Reticulum and Golgi Apparatus . . . . . . . . . . . . . . . . . . . . . . . . . . . . . . . . . . . . . . . . . . . . . . . 530
12.5 Probes for the Nucleus . . . . . . . . . . . . . . . . . . . . . . . . . . . . . . . . . . . . . . . . . . . . . . . . . . . . . 531
Nuclear Counterstains for Live Cells and Un�xed Tissues . . . . . . . . . . . . . . . . . . . . . . . . . . . . . . . . . . . . . . . . . . . . . . . . . . . . . . . . . . . . . . . . . . 531
Cell-Permeant Blue-Fluorescent Counterstains . . . . . . . . . . . . . . . . . . . . . . . . . . . . . . . . . . . . . . . . . . . . . . . . . . . . . . . . . . . . . . . . . . . . . . . . 531
Cell-Permeant Green-Fluorescent Counterstains. . . . . . . . . . . . . . . . . . . . . . . . . . . . . . . . . . . . . . . . . . . . . . . . . . . . . . . . . . . . . . . . . . . . . . . 531
Cell-Permeant Orange- and Red-Fluorescent Counterstains . . . . . . . . . . . . . . . . . . . . . . . . . . . . . . . . . . . . . . . . . . . . . . . . . . . . . . . . . . . . . . 532
HCS NuclearMask™ and HCS CellMask™ Stains . . . . . . . . . . . . . . . . . . . . . . . . . . . . . . . . . . . . . . . . . . . . . . . . . . . . . . . . . . . . . . . . . . . . . . . . 532
Tracking Chromosomes through Mitosis . . . . . . . . . . . . . . . . . . . . . . . . . . . . . . . . . . . . . . . . . . . . . . . . . . . . . . . . . . . . . . . . . . . . . . . . . . . . . 533
Fluorescent Protein–Based Markers for the Nucleus . . . . . . . . . . . . . . . . . . . . . . . . . . . . . . . . . . . . . . . . . . . . . . . . . . . . . . . . . . . . . . . . . . . . . . 533
GFP- and RFP-Labeled Nuclear Markers . . . . . . . . . . . . . . . . . . . . . . . . . . . . . . . . . . . . . . . . . . . . . . . . . . . . . . . . . . . . . . . . . . . . . . . . . . . . . . 533
Alexa Fluor® 488 Histone H1 . . . . . . . . . . . . . . . . . . . . . . . . . . . . . . . . . . . . . . . . . . . . . . . . . . . . . . . . . . . . . . . . . . . . . . . . . . . . . . . . . . . . . . 534
Nuclear Counterstaining of Fixed Cells and Tissues . . . . . . . . . . . . . . . . . . . . . . . . . . . . . . . . . . . . . . . . . . . . . . . . . . . . . . . . . . . . . . . . . . . . . . . 534
Blue-Fluorescent Counterstains . . . . . . . . . . . . . . . . . . . . . . . . . . . . . . . . . . . . . . . . . . . . . . . . . . . . . . . . . . . . . . . . . . . . . . . . . . . . . . . . . . . . 534
Green-Fluorescent Counterstains . . . . . . . . . . . . . . . . . . . . . . . . . . . . . . . . . . . . . . . . . . . . . . . . . . . . . . . . . . . . . . . . . . . . . . . . . . . . . . . . . . 535
Yellow-Fluorescent Counterstain . . . . . . . . . . . . . . . . . . . . . . . . . . . . . . . . . . . . . . . . . . . . . . . . . . . . . . . . . . . . . . . . . . . . . . . . . . . . . . . . . . . 536
Orange-Fluorescent Counterstains . . . . . . . . . . . . . . . . . . . . . . . . . . . . . . . . . . . . . . . . . . . . . . . . . . . . . . . . . . . . . . . . . . . . . . . . . . . . . . . . . 536
Red-Fluorescent Counterstains . . . . . . . . . . . . . . . . . . . . . . . . . . . . . . . . . . . . . . . . . . . . . . . . . . . . . . . . . . . . . . . . . . . . . . . . . . . . . . . . . . . . 536
SYTOX® AADvanced™ Dead Cell Stain . . . . . . . . . . . . . . . . . . . . . . . . . . . . . . . . . . . . . . . . . . . . . . . . . . . . . . . . . . . . . . . . . . . . . . . . . . . . . . . 538
The Molecular Probes™ Handbook: A Guide to Fluorescent Probes and Labeling Technologies
IMPORTANT NOTICE : The products described in this manual are covered by one or more Limited Use Label License(s). Please refer to the Appendix on page 971 and Master Product List on page 975. Products are For Research Use Only. Not intended for any animal or human therapeutic or diagnostic use.thermofisher.com/probes
IMPORTANT NOTICE: The products described in this manual are covered by one or more Limited Use Label License(s). Please refer to the Appendix on page 971 and Master Product List on page 975. Products are For Research Use Only. Not intended for any animal or human therapeutic or diagnostic use. 497
Chapter 12 — Probes for Organelles
www.invitrogen.com/probes
The Molecular Probes® Handbook: A Guide to Fluorescent Probes and Labeling Technologies
Qnuclear™ Deep Red Stain. . . . . . . . . . . . . . . . . . . . . . . . . . . . . . . . . . . . . . . . . . . . . . . . . . . . . . . . . . . . . . . . . . . . . . . . . . . . . . . . . . . . . . . . 538
SelectFX® Nuclear Labeling Kit. . . . . . . . . . . . . . . . . . . . . . . . . . . . . . . . . . . . . . . . . . . . . . . . . . . . . . . . . . . . . . . . . . . . . . . . . . . . . . . . . . . . . 538
Chromosome Counterstaining . . . . . . . . . . . . . . . . . . . . . . . . . . . . . . . . . . . . . . . . . . . . . . . . . . . . . . . . . . . . . . . . . . . . . . . . . . . . . . . . . . . . . . . 539
Blue-Fluorescent Chromosome Counterstains . . . . . . . . . . . . . . . . . . . . . . . . . . . . . . . . . . . . . . . . . . . . . . . . . . . . . . . . . . . . . . . . . . . . . . . . 539
Green-Fluorescent Chromosome Counterstains . . . . . . . . . . . . . . . . . . . . . . . . . . . . . . . . . . . . . . . . . . . . . . . . . . . . . . . . . . . . . . . . . . . . . . . 539
Red-Fluorescent Chromosome Counterstains . . . . . . . . . . . . . . . . . . . . . . . . . . . . . . . . . . . . . . . . . . . . . . . . . . . . . . . . . . . . . . . . . . . . . . . . . 539
Chromosome Banding Dyes . . . . . . . . . . . . . . . . . . . . . . . . . . . . . . . . . . . . . . . . . . . . . . . . . . . . . . . . . . . . . . . . . . . . . . . . . . . . . . . . . . . . . . . . . 540
SYTOX® Green Nucleic Acid Stain. . . . . . . . . . . . . . . . . . . . . . . . . . . . . . . . . . . . . . . . . . . . . . . . . . . . . . . . . . . . . . . . . . . . . . . . . . . . . . . . . . . 540
Acridine Homodimer . . . . . . . . . . . . . . . . . . . . . . . . . . . . . . . . . . . . . . . . . . . . . . . . . . . . . . . . . . . . . . . . . . . . . . . . . . . . . . . . . . . . . . . . . . . . 540
Other Chromosome Banding Dyes . . . . . . . . . . . . . . . . . . . . . . . . . . . . . . . . . . . . . . . . . . . . . . . . . . . . . . . . . . . . . . . . . . . . . . . . . . . . . . . . . 540
NeuroTrace® Fluorescent Nissl Stains . . . . . . . . . . . . . . . . . . . . . . . . . . . . . . . . . . . . . . . . . . . . . . . . . . . . . . . . . . . . . . . . . . . . . . . . . . . . . . . . . . 541
Data Table 12.5 Probes for the Nucleus . . . . . . . . . . . . . . . . . . . . . . . . . . . . . . . . . . . . . . . . . . . . . . . . . . . . . . . . . . . . . . . . . . . . . . . . . . . . . . . . 542
Product List 12.5 Probes for the Nucleus . . . . . . . . . . . . . . . . . . . . . . . . . . . . . . . . . . . . . . . . . . . . . . . . . . . . . . . . . . . . . . . . . . . . . . . . . . . . . . . 543
The Molecular Probes™ Handbook: A Guide to Fluorescent Probes and Labeling Technologies
IMPORTANT NOTICE : The products described in this manual are covered by one or more Limited Use Label License(s). Please refer to the Appendix on page 971 and Master Product List on page 975. Products are For Research Use Only. Not intended for any animal or human therapeutic or diagnostic use.
thermofisher.com/probes
IMPORTANT NOTICE: The products described in this manual are covered by one or more Limited Use Label License(s). Please refer to the Appendix on page 971 and Master Product List on page 975. Products are For Research Use Only. Not intended for any animal or human therapeutic or diagnostic use.498
Chapter 12 — Probes for Organelles
www.invitrogen.com/probes
The Molecular Probes® Handbook: A Guide to Fluorescent Probes and Labeling Technologies
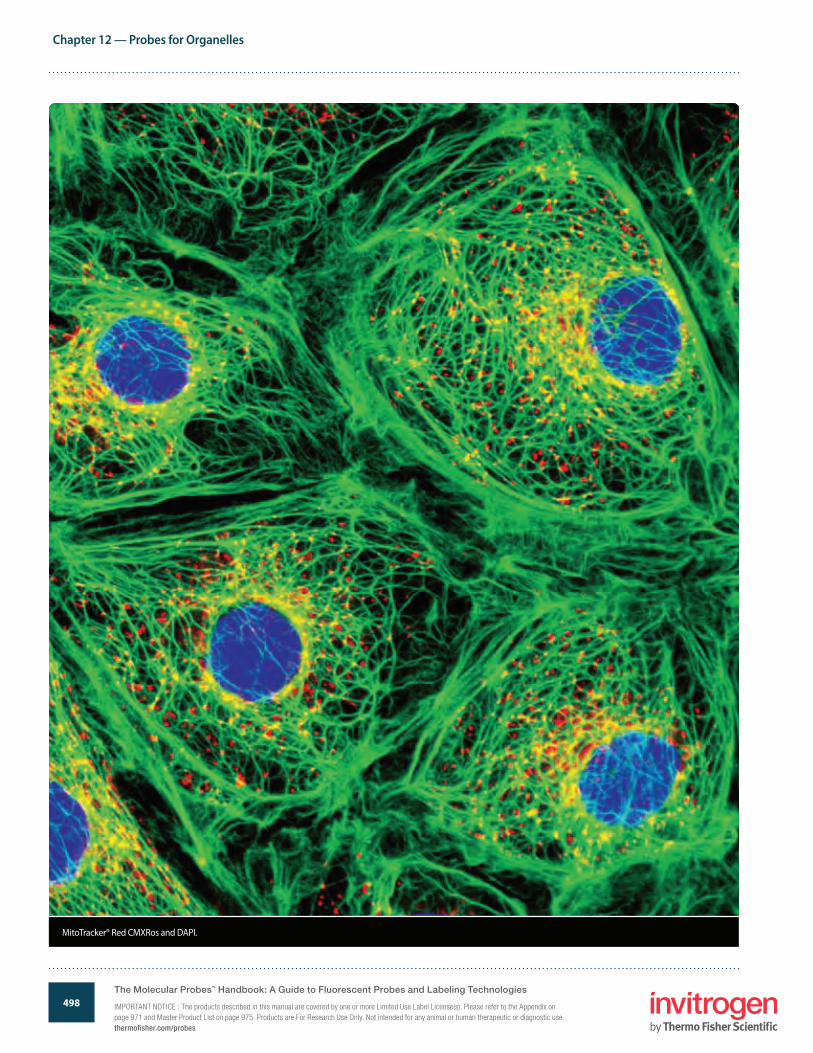
MitoTracker® Red CMXRos and DAPI.
The Molecular Probes™ Handbook: A Guide to Fluorescent Probes and Labeling Technologies
IMPORTANT NOTICE : The products described in this manual are covered by one or more Limited Use Label License(s). Please refer to the Appendix on page 971 and Master Product List on page 975. Products are For Research Use Only. Not intended for any animal or human therapeutic or diagnostic use.thermofisher.com/probes
499
Chapter 12 — Probes for Organelles
www.invitrogen.com/probes
The Molecular Probes® Handbook: A Guide to Fluorescent Probes and Labeling TechnologiesIMPORTANT NOTICE: The products described in this manual are covered by one or more Limited Use Label License(s). Please refer to the Appendix on page 971 and Master Product List on page 975. Products are For Research Use Only. Not intended for any animal or human therapeutic or diagnostic use.
Section 12.1 A Diverse Selection of Organelle Probes
12.1 A Diverse Selection of Organelle Probes
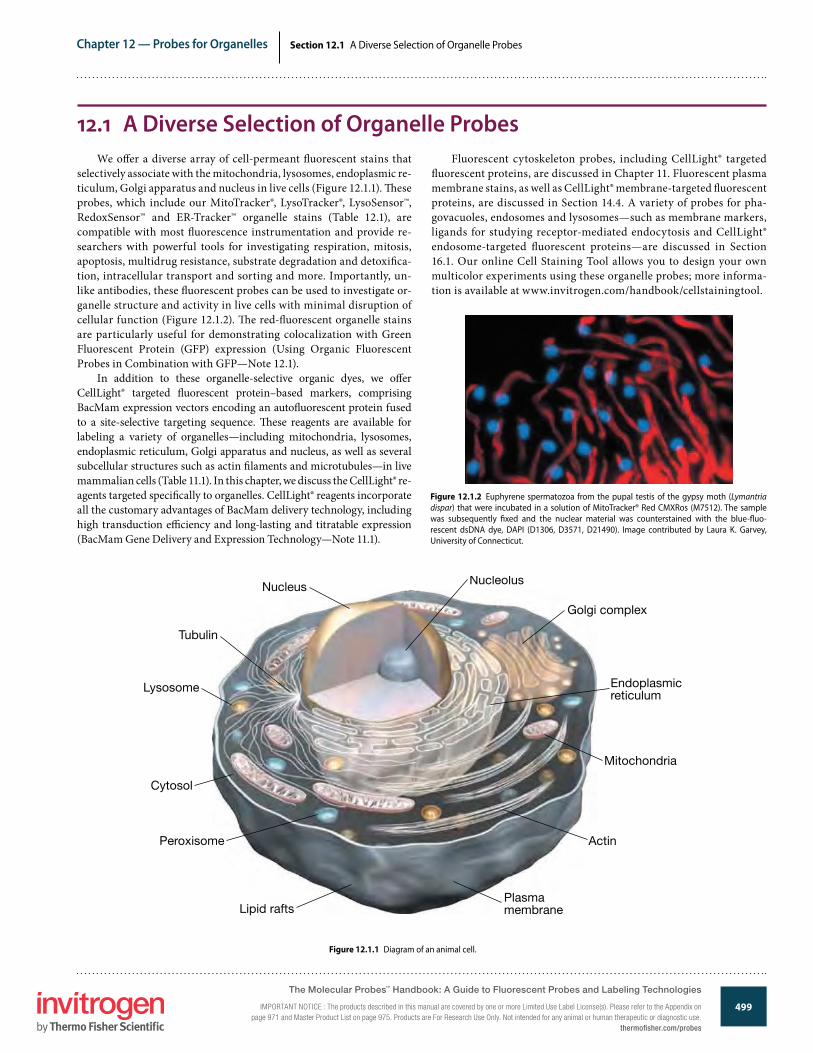
Figure 12.1.2 Euphyrene spermatozoa from the pupal testis of the gypsy moth (Lymantria dispar) that were incubated in a solution of MitoTracker® Red CMXRos (M7512). The sample was subsequently �xed and the nuclear material was counterstained with the blue-�uo-rescent dsDNA dye, DAPI (D1306, D3571, D21490). Image contributed by Laura K. Garvey, University of Connecticut.
Figure 12.1.1 Diagram of an animal cell.
Actin
Mitochondria
Lysosome
Cytosol
Endoplasmicreticulum
Peroxisome
Nucleus
Golgi complex
Lipid rafts
Tubulin
Plasmamembrane
Nucleolus
We o�er a diverse array of cell-permeant �uorescent stains that selectively associate with the mitochondria, lysosomes, endoplasmic re-ticulum, Golgi apparatus and nucleus in live cells (Figure 12.1.1). �ese probes, which include our MitoTracker®, LysoTracker®, LysoSensor™, RedoxSensor™ and ER-Tracker™ organelle stains (Table 12.1), are compatible with most �uorescence instrumentation and provide re-searchers with powerful tools for investigating respiration, mitosis, apoptosis, multidrug resistance, substrate degradation and detoxi�ca-tion, intracellular transport and sorting and more. Importantly, un-like antibodies, these �uorescent probes can be used to investigate or-ganelle structure and activity in live cells with minimal disruption of cellular function (Figure 12.1.2). �e red-�uorescent organelle stains are particularly useful for demonstrating colocalization with Green Fluorescent Protein (GFP) expression (Using Organic Fluorescent Probes in Combination with GFP—Note 12.1).
In addition to these organelle-selective organic dyes, we o�er CellLight® targeted �uorescent protein–based markers, comprising BacMam expression vectors encoding an auto�uorescent protein fused to a site-selective targeting sequence. �ese reagents are available for labeling a variety of organelles—including mitochondria, lysosomes, endoplasmic reticulum, Golgi apparatus and nucleus, as well as several subcellular structures such as actin �laments and microtubules—in live mammalian cells (Table 11.1). In this chapter, we discuss the CellLight® re-agents targeted speci�cally to organelles. CellLight® reagents incorporate all the customary advantages of BacMam delivery technology, including high transduction e�ciency and long-lasting and titratable expression (BacMam Gene Delivery and Expression Technology—Note 11.1).
Fluorescent cytoskeleton probes, including CellLight® targeted �uorescent proteins, are discussed in Chapter 11. Fluorescent plasma membrane stains, as well as CellLight® membrane-targeted �uorescent proteins, are discussed in Section 14.4. A variety of probes for pha-govacuoles, endosomes and lysosomes—such as membrane markers, ligands for studying receptor-mediated endocytosis and CellLight® endosome-targeted �uorescent proteins—are discussed in Section 16.1. Our online Cell Staining Tool allows you to design your own multicolor experiments using these organelle probes; more informa-tion is available at www.invitrogen.com/handbook/cellstainingtool.
The Molecular Probes™ Handbook: A Guide to Fluorescent Probes and Labeling Technologies
IMPORTANT NOTICE : The products described in this manual are covered by one or more Limited Use Label License(s). Please refer to the Appendix on page 971 and Master Product List on page 975. Products are For Research Use Only. Not intended for any animal or human therapeutic or diagnostic use.
thermofi sher.com/probes
500
Chapter 12 — Probes for Organelles
www.invitrogen.com/probes
The Molecular Probes® Handbook: A Guide to Fluorescent Probes and Labeling TechnologiesIMPORTANT NOTICE: The products described in this manual are covered by one or more Limited Use Label License(s). Please refer to the Appendix on page 971 and Master Product List on page 975. Products are For Research Use Only. Not intended for any animal or human therapeutic or diagnostic use.
Section 12.1 A Diverse Selection of Organelle Probes
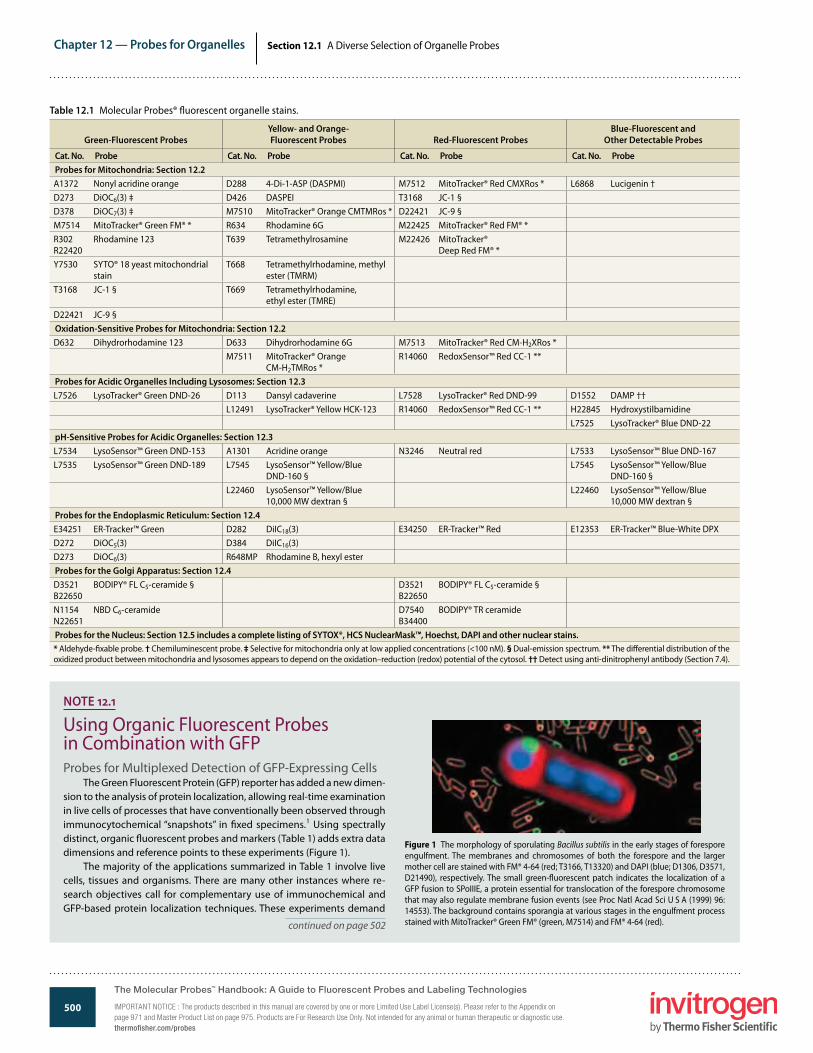
Table 12.1 Molecular Probes® �uorescent organelle stains.
Green-Fluorescent ProbesYellow- and Orange-Fluorescent Probes Red-Fluorescent Probes
Blue-Fluorescent andOther Detectable Probes
Cat. No. Probe Cat. No. Probe Cat. No. Probe Cat. No. ProbeProbes for Mitochondria: Section 12.2A1372 Nonyl acridine orange D288 4-Di-1-ASP (DASPMI) M7512 MitoTracker® Red CMXRos * L6868 Lucigenin †D273 DiOC6(3) ‡ D426 DASPEI T3168 JC-1 §D378 DiOC7(3) ‡ M7510 MitoTracker® Orange CMTMRos * D22421 JC-9 §M7514 MitoTracker® Green FM® * R634 Rhodamine 6G M22425 MitoTracker® Red FM® *R302R22420
Rhodamine 123 T639 Tetramethylrosamine M22426 MitoTracker®Deep Red FM® *
Y7530 SYTO® 18 yeast mitochondrial stain
T668 Tetramethylrhodamine, methyl ester (TMRM)
T3168 JC-1 § T669 Tetramethylrhodamine,ethyl ester (TMRE)
D22421 JC-9 §Oxidation-Sensitive Probes for Mitochondria: Section 12.2D632 Dihydrorhodamine 123 D633 Dihydrorhodamine 6G M7513 MitoTracker® Red CM-H2XRos *
M7511 MitoTracker® Orange CM-H2TMRos *
R14060 RedoxSensor™ Red CC-1 **
Probes for Acidic Organelles Including Lysosomes: Section 12.3L7526 LysoTracker® Green DND-26 D113 Dansyl cadaverine L7528 LysoTracker® Red DND-99 D1552 DAMP ††
L12491 LysoTracker® Yellow HCK-123 R14060 RedoxSensor™ Red CC-1 ** H22845 HydroxystilbamidineL7525 LysoTracker® Blue DND-22
pH-Sensitive Probes for Acidic Organelles: Section 12.3L7534 LysoSensor™ Green DND-153 A1301 Acridine orange N3246 Neutral red L7533 LysoSensor™ Blue DND-167L7535 LysoSensor™ Green DND-189 L7545 LysoSensor™ Yellow/Blue
DND-160 §L7545 LysoSensor™ Yellow/Blue
DND-160 §L22460 LysoSensor™ Yellow/Blue
10,000 MW dextran §L22460 LysoSensor™ Yellow/Blue
10,000 MW dextran §Probes for the Endoplasmic Reticulum: Section 12.4E34251 ER-Tracker™ Green D282 DiIC18(3) E34250 ER-Tracker™ Red E12353 ER-Tracker™ Blue-White DPXD272 DiOC5(3) D384 DiIC16(3)D273 DiOC6(3) R648MP Rhodamine B, hexyl esterProbes for the Golgi Apparatus: Section 12.4D3521B22650
BODIPY® FL C5-ceramide § D3521B22650
BODIPY® FL C5-ceramide §
N1154N22651
NBD C6-ceramide D7540B34400
BODIPY® TR ceramide
Probes for the Nucleus: Section 12.5 includes a complete listing of SYTOX®, HCS NuclearMask™, Hoechst, DAPI and other nuclear stains.* Aldehyde-�xable probe. † Chemiluminescent probe. ‡ Selective for mitochondria only at low applied concentrations (<100 nM). § Dual-emission spectrum. ** The di�erential distribution of the oxidized product between mitochondria and lysosomes appears to depend on the oxidation–reduction (redox) potential of the cytosol. †† Detect using anti-dinitrophenyl antibody (Section 7.4).
NOTE 12.1
Using Organic Fluorescent Probes in Combination with GFPProbes for Multiplexed Detection of GFP-Expressing Cells
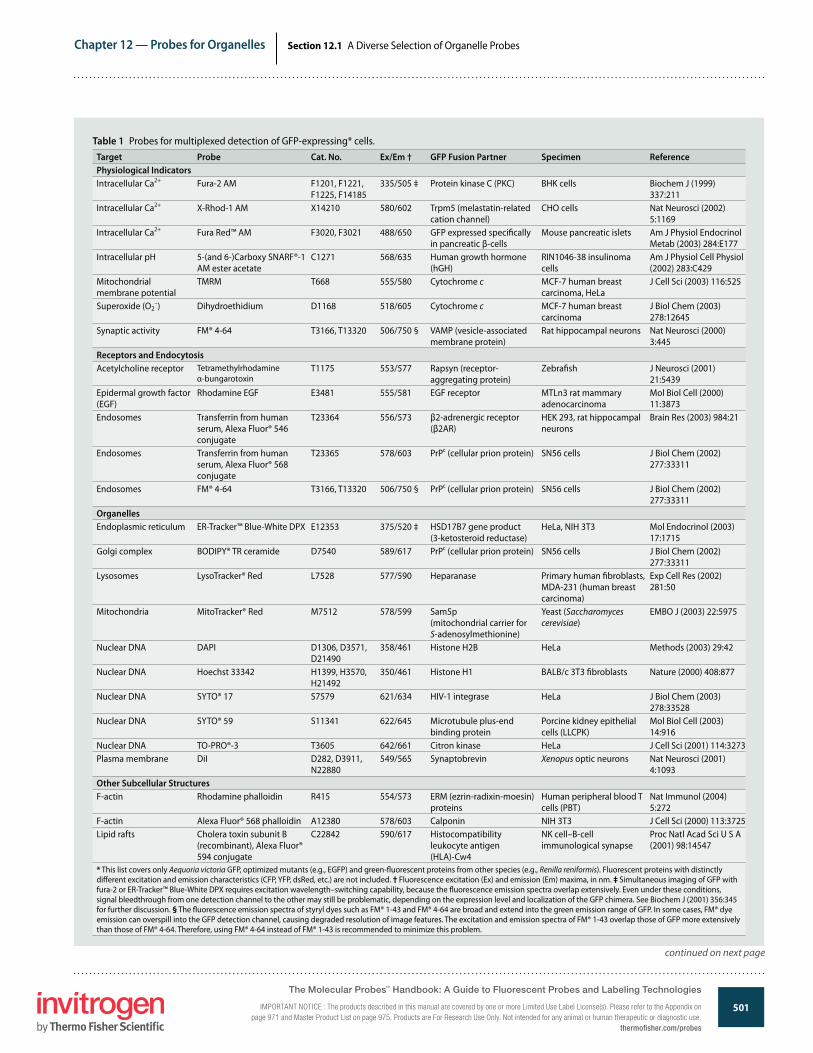
The Green Fluorescent Protein (GFP) reporter has added a new dimen-sion to the analysis of protein localization, allowing real-time examination in live cells of processes that have conventionally been observed through immunocytochemical “snapshots” in �xed specimens.1 Using spectrally distinct, organic �uorescent probes and markers (Table 1) adds extra data dimensions and reference points to these experiments (Figure 1).
The majority of the applications summarized in Table 1 involve live cells, tissues and organisms. There are many other instances where re-search objectives call for complementary use of immunochemical and GFP-based protein localization techniques. These experiments demand
Figure 1 The morphology of sporulating Bacillus subtilis in the early stages of forespore engulfment. The membranes and chromosomes of both the forespore and the larger mother cell are stained with FM® 4-64 (red; T3166, T13320) and DAPI (blue; D1306, D3571, D21490), respectively. The small green-�uorescent patch indicates the localization of a GFP fusion to SPoIIIE, a protein essential for translocation of the forespore chromosome that may also regulate membrane fusion events (see Proc Natl Acad Sci U S A (1999) 96: 14553). The background contains sporangia at various stages in the engulfment process stained with MitoTracker® Green FM® (green, M7514) and FM® 4-64 (red).continued on page 502
The Molecular Probes™ Handbook: A Guide to Fluorescent Probes and Labeling Technologies
IMPORTANT NOTICE : The products described in this manual are covered by one or more Limited Use Label License(s). Please refer to the Appendix on page 971 and Master Product List on page 975. Products are For Research Use Only. Not intended for any animal or human therapeutic or diagnostic use.thermofisher.com/probes
501
Chapter 12 — Probes for Organelles
www.invitrogen.com/probes
The Molecular Probes® Handbook: A Guide to Fluorescent Probes and Labeling TechnologiesIMPORTANT NOTICE: The products described in this manual are covered by one or more Limited Use Label License(s). Please refer to the Appendix on page 971 and Master Product List on page 975. Products are For Research Use Only. Not intended for any animal or human therapeutic or diagnostic use.
Section 12.1 A Diverse Selection of Organelle Probes
Table 1 Probes for multiplexed detection of GFP-expressing* cells.Target Probe Cat. No. Ex/Em † GFP Fusion Partner Specimen ReferencePhysiological IndicatorsIntracellular Ca2+ Fura-2 AM F1201, F1221,
F1225, F14185335/505 ‡ Protein kinase C (PKC) BHK cells Biochem J (1999)
337:211Intracellular Ca2+ X-Rhod-1 AM X14210 580/602 Trpm5 (melastatin-related
cation channel)CHO cells Nat Neurosci (2002)
5:1169Intracellular Ca2+ Fura Red™ AM F3020, F3021 488/650 GFP expressed speci�cally
in pancreatic β-cellsMouse pancreatic islets Am J Physiol Endocrinol
Metab (2003) 284:E177Intracellular pH 5-(and 6-)Carboxy SNARF®-1
AM ester acetate C1271 568/635 Human growth hormone
(hGH)RIN1046-38 insulinoma cells
Am J Physiol Cell Physiol (2002) 283:C429
Mitochondrial membrane potential
TMRM T668 555/580 Cytochrome c MCF-7 human breast carcinoma, HeLa
J Cell Sci (2003) 116:525
Superoxide (O2–) Dihydroethidium D1168 518/605 Cytochrome c MCF-7 human breast
carcinomaJ Biol Chem (2003) 278:12645
Synaptic activity FM® 4-64 T3166, T13320 506/750 § VAMP (vesicle-associated membrane protein)
Rat hippocampal neurons Nat Neurosci (2000) 3:445
Receptors and EndocytosisAcetylcholine receptor Tetramethylrhodamine
α-bungarotoxinT1175 553/577 Rapsyn (receptor-
aggregating protein)Zebra�sh J Neurosci (2001)
21:5439Epidermal growth factor (EGF)
Rhodamine EGF E3481 555/581 EGF receptor MTLn3 rat mammary adenocarcinoma
Mol Biol Cell (2000) 11:3873
Endosomes Transferrin from human serum, Alexa Fluor® 546 conjugate
T23364 556/573 β2-adrenergic receptor (β2AR)
HEK 293, rat hippocampal neurons
Brain Res (2003) 984:21
Endosomes Transferrin from human serum, Alexa Fluor® 568 conjugate
T23365 578/603 PrPc (cellular prion protein) SN56 cells J Biol Chem (2002) 277:33311
Endosomes FM® 4-64 T3166, T13320 506/750 § PrPc (cellular prion protein) SN56 cells J Biol Chem (2002) 277:33311
OrganellesEndoplasmic reticulum ER-Tracker™ Blue-White DPX E12353 375/520 ‡ HSD17B7 gene product
(3-ketosteroid reductase)HeLa, NIH 3T3 Mol Endocrinol (2003)
17:1715Golgi complex BODIPY® TR ceramide D7540 589/617 PrPc (cellular prion protein) SN56 cells J Biol Chem (2002)
277:33311Lysosomes LysoTracker® Red L7528 577/590 Heparanase Primary human �broblasts,
MDA-231 (human breast carcinoma)
Exp Cell Res (2002) 281:50
Mitochondria MitoTracker® Red M7512 578/599 Sam5p (mitochondrial carrier for S-adenosylmethionine)
Yeast (Saccharomyces cerevisiae)
EMBO J (2003) 22:5975
Nuclear DNA DAPI D1306, D3571, D21490
358/461 Histone H2B HeLa Methods (2003) 29:42
Nuclear DNA Hoechst 33342 H1399, H3570, H21492
350/461 Histone H1 BALB/c 3T3 �broblasts Nature (2000) 408:877
Nuclear DNA SYTO® 17 S7579 621/634 HIV-1 integrase HeLa J Biol Chem (2003) 278:33528
Nuclear DNA SYTO® 59 S11341 622/645 Microtubule plus-end binding protein
Porcine kidney epithelial cells (LLCPK)
Mol Biol Cell (2003) 14:916
Nuclear DNA TO-PRO®-3 T3605 642/661 Citron kinase HeLa J Cell Sci (2001) 114:3273Plasma membrane DiI D282, D3911,
N22880549/565 Synaptobrevin Xenopus optic neurons Nat Neurosci (2001)
4:1093Other Subcellular StructuresF-actin Rhodamine phalloidin R415 554/573 ERM (ezrin-radixin-moesin)
proteinsHuman peripheral blood T cells (PBT)
Nat Immunol (2004) 5:272
F-actin Alexa Fluor® 568 phalloidin A12380 578/603 Calponin NIH 3T3 J Cell Sci (2000) 113:3725Lipid rafts Cholera toxin subunit B
(recombinant), Alexa Fluor® 594 conjugate
C22842 590/617 Histocompatibility leukocyte antigen (HLA)-Cw4
NK cell–B-cell immunological synapse
Proc Natl Acad Sci U S A (2001) 98:14547
* This list covers only Aequoria victoria GFP, optimized mutants (e.g., EGFP) and green-�uorescent proteins from other species (e.g., Renilla reniformis). Fluorescent proteins with distinctly di�erent excitation and emission characteristics (CFP, YFP, dsRed, etc.) are not included. † Fluorescence excitation (Ex) and emission (Em) maxima, in nm. ‡ Simultaneous imaging of GFP with fura-2 or ER-Tracker™ Blue-White DPX requires excitation wavelength–switching capability, because the �uorescence emission spectra overlap extensively. Even under these conditions, signal bleedthrough from one detection channel to the other may still be problematic, depending on the expression level and localization of the GFP chimera. See Biochem J (2001) 356:345 for further discussion. § The �uorescence emission spectra of styryl dyes such as FM® 1-43 and FM® 4-64 are broad and extend into the green emission range of GFP. In some cases, FM® dye emission can overspill into the GFP detection channel, causing degraded resolution of image features. The excitation and emission spectra of FM® 1-43 overlap those of GFP more extensively than those of FM® 4-64. Therefore, using FM® 4-64 instead of FM® 1-43 is recommended to minimize this problem.
continued on next page
The Molecular Probes™ Handbook: A Guide to Fluorescent Probes and Labeling Technologies
IMPORTANT NOTICE : The products described in this manual are covered by one or more Limited Use Label License(s). Please refer to the Appendix on page 971 and Master Product List on page 975. Products are For Research Use Only. Not intended for any animal or human therapeutic or diagnostic use.
thermofisher.com/probes
502
Chapter 12 — Probes for Organelles
www.invitrogen.com/probes
The Molecular Probes® Handbook: A Guide to Fluorescent Probes and Labeling TechnologiesIMPORTANT NOTICE: The products described in this manual are covered by one or more Limited Use Label License(s). Please refer to the Appendix on page 971 and Master Product List on page 975. Products are For Research Use Only. Not intended for any animal or human therapeutic or diagnostic use.
Section 12.1 A Diverse Selection of Organelle Probes
Target Probe Cat. No. Ex/Em † GFP Fusion Partner Specimen ReferenceCell Classi�cation MarkersApoptotic cells Annexin V, Alexa Fluor® 594
conjugateA13203 590/617 GRASP65 (Golgi stacking
protein)HeLa J Cell Biol (2002) 156:495
Transformed B lymphocytes (Raji cells)
CellTracker™ Orange CMTMR C2927 550/575 ICAM-3 (intercellular adhesion molecule-3)
T-lymphocytes and antigen-presenting B cells
Nat Immunol (2002) 3:159
Cell-surface antigens R-Phycoerythrin (streptavidin conjugate)
S866, S21388 565/575 GFP gene expression NIH 3T3 Cytometry (1996) 25:211
Neurons NeuroTrace® 530/615 red-�uorescent Nissl stain
N21482 530/620 Tau microtubule-binding protein (Purkinje cell marker)
Mouse brain slice J Neurosci (2003) 23:6392
Neurons Alexa Fluor® 594 hydrazide A10438, A10442 588/613 Synaptophysin Aplysia californica sensory neurons
Neuron (2003) 40:151
* This list covers only Aequoria victoria GFP, optimized mutants (e.g., EGFP) and green-�uorescent proteins from other species (e.g., Renilla reniformis). Fluorescent proteins with distinctly di�erent excitation and emission characteristics (CFP, YFP, dsRed, etc.) are not included. † Fluorescence excitation (Ex) and emission (Em) maxima, in nm. ‡ Simultaneous imaging of GFP with fura-2 or ER-Tracker™ Blue-White DPX requires excitation wavelength–switching capability, because the �uorescence emission spectra overlap extensively. Even under these conditions, signal bleedthrough from one detection channel to the other may still be problematic, depending on the expression level and localization of the GFP chimera. See Biochem J (2001) 356:345 for further discussion. § The �uorescence emission spectra of styryl dyes such as FM® 1-43 and FM® 4-64 are broad and extend into the green emission range of GFP. In some cases, FM® dye emission can overspill into the GFP detection channel, causing degraded resolution of image features. The excitation and emission spectra of FM® 1-43 overlap those of GFP more extensively than those of FM® 4-64. Therefore, using FM® 4-64 instead of FM® 1-43 is recommended to minimize this problem.
Table 2 R0 values for FRET from EGFP to Alexa Fluor® dyes.
Acceptor Dye R0 (Å)*
Alexa Fluor® 546 dye 57
Alexa Fluor® 555 dye 63
Alexa Fluor® 568 dye 54
Alexa Fluor® 594 dye 53* R0 values in angstroms (Å) represent the distance at which �uores-cence resonance energy transfer from the donor dye to the acceptor dye is 50% e�cient. Values were calculated from spectroscopic data as outlined (Fluorescence Resonance Energy Transfer (FRET)—Note 1.2).
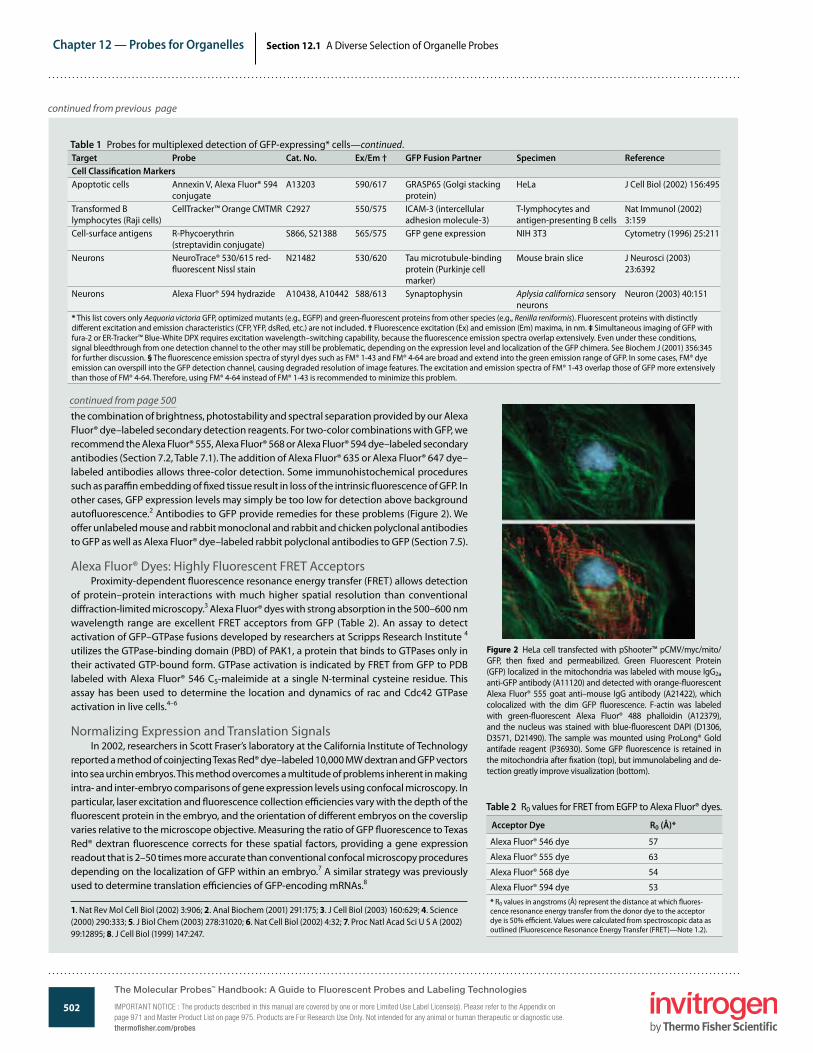
the combination of brightness, photostability and spectral separation provided by our Alexa Fluor® dye–labeled secondary detection reagents. For two-color combinations with GFP, we recommend the Alexa Fluor® 555, Alexa Fluor® 568 or Alexa Fluor® 594 dye–labeled secondary antibodies (Section 7.2, Table 7.1). The addition of Alexa Fluor® 635 or Alexa Fluor® 647 dye–labeled antibodies allows three-color detection. Some immunohistochemical procedures such as para�n embedding of �xed tissue result in loss of the intrinsic �uorescence of GFP. In other cases, GFP expression levels may simply be too low for detection above background auto�uorescence.2 Antibodies to GFP provide remedies for these problems (Figure 2). We o�er unlabeled mouse and rabbit monoclonal and rabbit and chicken polyclonal antibodies to GFP as well as Alexa Fluor® dye–labeled rabbit polyclonal antibodies to GFP (Section 7.5).
Alexa Fluor® Dyes: Highly Fluorescent FRET AcceptorsProximity-dependent �uorescence resonance energy transfer (FRET) allows detection
of protein–protein interactions with much higher spatial resolution than conventional di�raction-limited microscopy.3 Alexa Fluor® dyes with strong absorption in the 500–600 nm wavelength range are excellent FRET acceptors from GFP (Table 2). An assay to detect activation of GFP–GTPase fusions developed by researchers at Scripps Research Institute 4 utilizes the GTPase-binding domain (PBD) of PAK1, a protein that binds to GTPases only in their activated GTP-bound form. GTPase activation is indicated by FRET from GFP to PDB labeled with Alexa Fluor® 546 C5-maleimide at a single N-terminal cysteine residue. This assay has been used to determine the location and dynamics of rac and Cdc42 GTPase activation in live cells.4–6
Normalizing Expression and Translation SignalsIn 2002, researchers in Scott Fraser’s laboratory at the California Institute of Technology
reported a method of coinjecting Texas Red® dye–labeled 10,000 MW dextran and GFP vectors into sea urchin embryos. This method overcomes a multitude of problems inherent in making intra- and inter-embryo comparisons of gene expression levels using confocal microscopy. In particular, laser excitation and �uorescence collection e�ciencies vary with the depth of the �uorescent protein in the embryo, and the orientation of di�erent embryos on the coverslip varies relative to the microscope objective. Measuring the ratio of GFP �uorescence to Texas Red® dextran �uorescence corrects for these spatial factors, providing a gene expression readout that is 2–50 times more accurate than conventional confocal microscopy procedures depending on the localization of GFP within an embryo.7 A similar strategy was previously used to determine translation e�ciencies of GFP-encoding mRNAs.8
1. Nat Rev Mol Cell Biol (2002) 3:906; 2. Anal Biochem (2001) 291:175; 3. J Cell Biol (2003) 160:629; 4. Science (2000) 290:333; 5. J Biol Chem (2003) 278:31020; 6. Nat Cell Biol (2002) 4:32; 7. Proc Natl Acad Sci U S A (2002) 99:12895; 8. J Cell Biol (1999) 147:247.
Figure 2 HeLa cell transfected with pShooter™ pCMV/myc/mito/GFP, then �xed and permeabilized. Green Fluorescent Protein (GFP) localized in the mitochondria was labeled with mouse IgG2a anti-GFP antibody (A11120) and detected with orange-�uorescent Alexa Fluor® 555 goat anti–mouse IgG antibody (A21422), which colocalized with the dim GFP �uorescence. F-actin was labeled with green-�uorescent Alexa Fluor® 488 phalloidin (A12379), and the nucleus was stained with blue-�uorescent DAPI (D1306, D3571, D21490). The sample was mounted using ProLong® Gold antifade reagent (P36930). Some GFP �uorescence is retained in the mitochondria after �xation (top), but immunolabeling and de-tection greatly improve visualization (bottom).
continued from previous page
continued from page 500
Table 1 Probes for multiplexed detection of GFP-expressing* cells—continued.
The Molecular Probes™ Handbook: A Guide to Fluorescent Probes and Labeling Technologies
IMPORTANT NOTICE : The products described in this manual are covered by one or more Limited Use Label License(s). Please refer to the Appendix on page 971 and Master Product List on page 975. Products are For Research Use Only. Not intended for any animal or human therapeutic or diagnostic use.thermofi sher.com/probes
503
Chapter 12 — Probes for Organelles
www.invitrogen.com/probes
The Molecular Probes® Handbook: A Guide to Fluorescent Probes and Labeling TechnologiesIMPORTANT NOTICE: The products described in this manual are covered by one or more Limited Use Label License(s). Please refer to the Appendix on page 971 and Master Product List on page 975. Products are For Research Use Only. Not intended for any animal or human therapeutic or diagnostic use.
Section 12.2 Probes for Mitochondria
12.2 Probes for Mitochondria
NOTE 12.2
Mitochondria in DiseasesGiven the multiple functions and numerous proteins present in
the mitochondria, it is not surprising that genetically inherited defects of mitochondrial function are a major cause of morbidity and mortality in humans.1 In particular, there are several human diseases that have known defects in the proteins responsible for oxidative phosphoryla-tion (OxPhos) in cells. Typically, such defects produce lactic acidemia, exercise intolerance or neurological disorders.
Diseases of OxPhos are notoriously di�cult to diagnose, and it is even more di�cult to correlate their phenotype–genotype rela-tionships. A subset of OxPhos defects is maternally inherited. These defects result from mutations in mitochondrial DNA (mtDNA), a small, 16-kb genome present in hundreds to thousands of copies per cell.2,3 mtDNA, which encodes 13 polypeptides of the OxPhos machinery, di�ers from the nuclear genome in its absence of histones, poor repair mechanisms and very limited recombination frequencies. As a result, mtDNA in somatic cells builds up mutations over time due to errors in replication that are not repaired and physical insult from a variety of toxins.4 Such accumulated mutations are implicated in a number of neurodegenerative diseases 5—notably Parkinson disease and Alzheimer disease—where the mutation load triggers premature apoptotic or necrotic cell death. For example, a strong link has been established between exposure to the pesticide rotenone, a well-de�ned and speci�c inhibitor of OxPhos, and Parkinson disease. mtDNA muta-tions function by reducing energy production within the cell and are thought to contribute to cancer and aging. Likewise, mutations in the nuclear-encoded subunits of OxPhos have been found to regulate the life span in �ies and worms. Many of the products listed in this section are useful tools for studying degenerative conditions.6–9
1. Annu Rev Physiol (2010) 72:61; 2. Anal Chem (2007) 79:7691; 3. Exp Cell Res (2005) 303:432; 4. Biochem Biophys Res Commun (2009) 378:450; 5. Brain (2010) 133:797; 6. J Neurosci (2009) 29:9090; 7. J Biol Chem (2009) 284:18754; 8. Mol Cell (2009) 33:627; 9. Methods Enzymol (2009) 453:217.
Mitochondria are found in eukaryotic cells, where they make up as much as 10% of the cell volume. �ey are pleomorphic organelles with structural variations depending on cell type, cell-cycle stage and in-tracellular metabolic state. �e key function of mitochondria is energy production through oxidative phosphorylation (OxPhos) and lipid oxi-dation.1 Several other metabolic functions are performed by mitochon-dria, including urea production and heme, non-heme iron and steroid biogenesis, as well as intracellular Ca2+ homeostasis. Mitochondria also play a pivotal role in apoptosis—the genetically controlled ablation of cells during normal development 2–4 (Section 15.5). For many of these mitochondrial functions, there is only a partial understanding of the components involved, with even less information on mechanism and regulation.
�e morphology of mitochondria is highly variable. In dividing cells, the organelle can switch between a fragmented morphology with many ovoid-shaped mitochondria, as is o�en shown in textbooks, and a reticulum in which the organelle is a single, many-branched struc-ture. �e cell cycle– and metabolic state–dependent changes in mito-chondrial morphology are controlled by a set of proteins that cause �ssion and fusion of the organelle mass. Mutations in these proteins are the cause of several human diseases, indicating the importance of overall morphology for cell functioning (Mitochondria in Diseases—Note 12.2). Organelle morphology is also controlled by cytoskeletal elements, including actin �laments and microtubules. In nondividing tissue, overall mitochondrial morphology is very cell-type dependent, with mitochondria spiraling around the axoneme in spermatozoa, and ovoid bands of mitochondria intercalating between actomyosin �la-ments. �ere is evidence of functionally signi�cant heterogeneity of mi-tochondrial forms within individual cells.
�e abundance of mitochondria varies with cellular energy level and is a function of cell type, cell-cycle stage and proliferative state. For example, brown adipose tissue cells,5 hepatocytes 6 and certain renal epithelial cells 7 tend to be rich in active mitochondria, whereas qui-escent immune-system progenitor or precursor cells show little stain-ing with mitochondrion-selective dyes.8 �e number of mitochondria is reduced in Alzheimer disease and their proteins and nucleic acids are susceptible to damage by reactive oxygen species, including nitric oxide 9–11 (Chapter 18).
We have a range of mitochondrion-selective dyes with which to monitor mitochondrial morphology and organelle functioning. �e uptake of most mitochondrion-selective dyes is dependent on the mi-tochondrial membrane potential. �ese dyes thereby enable researchers to probe mitochondrial activity, localization and abundance,9,12,13 as well as to monitor the e�ects of some pharmacological agents that alter mitochondrial function.14
MitoTracker® Probes: Fixable Mitochondrion-Selective Probes
Although conventional �uorescent stains for mitochondria, such as rhodamine 123 and tetramethylrosamine, are readily sequestered by functioning mitochondria, they are subsequently washed out of
the cells once the mitochondrion’s membrane potential is lost. �is characteristic limits their use in experiments in which cells must be treated with aldehyde-based �xatives or other agents that a�ect the energetic state of the mitochondria. To overcome this limitation, we have developed MitoTracker® probes—a series of mitochondrion-se-lective stains that are concentrated by active mitochondria and well retained during cell �xation.15 Because the MitoTracker® Orange, MitoTracker® Red and MitoTracker® Deep Red probes are also re-tained following permeabilization, the sample retains the �uorescent staining pattern characteristic of live cells during subsequent process-ing steps for immunocytochemistry, in situ hybridization or electron microscopy. In addition, MitoTracker® reagents eliminate some of the di�culties of working with pathogenic cells because, once the mito-chondria are stained, the cells can be treated with �xatives before the sample is analyzed.
The Molecular Probes™ Handbook: A Guide to Fluorescent Probes and Labeling Technologies
IMPORTANT NOTICE : The products described in this manual are covered by one or more Limited Use Label License(s). Please refer to the Appendix on page 971 and Master Product List on page 975. Products are For Research Use Only. Not intended for any animal or human therapeutic or diagnostic use.
thermofisher.com/probes

504
Chapter 12 — Probes for Organelles
www.invitrogen.com/probes
The Molecular Probes® Handbook: A Guide to Fluorescent Probes and Labeling TechnologiesIMPORTANT NOTICE: The products described in this manual are covered by one or more Limited Use Label License(s). Please refer to the Appendix on page 971 and Master Product List on page 975. Products are For Research Use Only. Not intended for any animal or human therapeutic or diagnostic use.
Section 12.2 Probes for Mitochondria
Properties of MitoTracker® ProbesMitoTracker® probes are cell-permeant mitochondrion-selective dyes that contain a mild-
ly thiol-reactive chloromethyl moiety. �e chloromethyl group appears to be responsible for keeping the dye associated with the mitochondria a�er �xation.16 To label mitochondria, cells are simply incubated in submicromolar concentrations of the MitoTracker® probe, which pas-sively di�uses across the plasma membrane and accumulates in active mitochondria. Once their mitochondria are labeled, the cells can be treated with aldehyde-based �xatives to allow further processing of the sample; with the exception of MitoTracker® Green FM®, subsequent permeabilization with cold acetone does not appear to disturb the staining pattern of the MitoTracker® dyes.
We o�er seven MitoTracker® reagents that di�er in spectral characteristics, oxidation state and �xability (Table 12.2). MitoTracker® probes are provided in specially packaged sets of 20 vi-als, each containing 50 µg for reconstitution as required.
Orange-, Red- and Infrared-Fluorescent MitoTracker® DyesWe o�er MitoTracker® derivatives of the orange-�uorescent tetramethylrosamine
(MitoTracker® Orange CMTMRos, M7510; Figure 12.2.1) and the red-�uorescent X-rosamine (MitoTracker® Red CMXRos, M7512; Figure 12.2.2), as well as MitoTracker® Red FM® and MitoTracker® Deep Red FM® probes (M22425, M22426; Figure 12.2.3, Figure 12.2.4). Because the MitoTracker® Red CMXRos, MitoTracker® Red FM® and MitoTracker® Deep Red FM® probes produce longer-wavelength �uorescence that is well resolved from the �uorescence of green-�uorescent dyes, they are suitable for multicolor labeling experiments 17,18 (Figure 12.2.5, Figure 12.2.6, Figure 12.2.7). Also available are chemically reduced forms of the tetramethylrosamine (MitoTracker® Orange CM-H2TMRos, M7511; Figure 12.2.8) and X-rosamine (MitoTracker® Red CM-H2XRos, M7513; Figure 12.2.9) MitoTracker® probes. Unlike MitoTracker® Orange CMTMRos and MitoTracker® Red CMXRos, the reduced versions of these probes do not �uo-resce until they enter an actively respiring cell, where they are oxidized to the �uorescent mito-chondrion-selective probe and then sequestered in the mitochondria 19 (Figure 12.2.10, Figure 12.2.11, Figure 12.2.12).
Figure 12.2.4 Mitochondria of live bovine pulmonary ar-tery endothelial cells stained with the MitoTracker® Deep Red FM® dye (M22426).
Figure 12.2.5 Bovine pulmonary artery endothelial cells (BPAEC) incubated with the �xable, mitochondrion-selective MitoTracker® Red CMXRos (M7512). After staining, the cells were formaldehyde-�xed, acetone-permeabilized, treated with DNase-free RNase and counterstained using SYTOX® Green nucleic acid stain (S7020). Microtubules were labeled with a mouse monoclonal anti–ß-tubulin antibody, biotin-XX goat anti–mouse IgG antibody (B2763) and Cascade Blue® NeutrAvidin™ biotin-binding protein (A2663). This photograph was taken using multiple exposures through bandpass optical �lters appropriate for Texas Red® dye, �uo-rescein and DAPI using a Nikon® Labophot 2 microscope equipped with a Quad�uor epi-illumination system.
Figure 12.2.6 A bovine pulmonary artery endothelial cell (BPAEC) stained with mouse monoclonal anti–ß-tubulin in conjunction with Oregon Green® 514 goat anti–mouse IgG antibody (O6383), MitoTracker® Red CMXRos (M7512) and DAPI (D1306, D3571, D21490).
Figure 12.2.1 MitoTracker® Orange CMTMRos (M7510).
Figure 12.2.2 MitoTracker® Red CMXRos (M7512).
Figure 12.2.3 Live NIH 3T3 cells labeled with probes for mitochondria, Golgi and the nucleus. Mitochondria were labeled with MitoTracker® Red FM® (M22425), Golgi with BODIPY® FL ceramide (D3521, B22650), and the nucleus with Hoechst 33342 (H1399, H3570, H21492).
The Molecular Probes™ Handbook: A Guide to Fluorescent Probes and Labeling Technologies
IMPORTANT NOTICE : The products described in this manual are covered by one or more Limited Use Label License(s). Please refer to the Appendix on page 971 and Master Product List on page 975. Products are For Research Use Only. Not intended for any animal or human therapeutic or diagnostic use.thermofisher.com/probes
505
Chapter 12 — Probes for Organelles
www.invitrogen.com/probes
The Molecular Probes® Handbook: A Guide to Fluorescent Probes and Labeling TechnologiesIMPORTANT NOTICE: The products described in this manual are covered by one or more Limited Use Label License(s). Please refer to the Appendix on page 971 and Master Product List on page 975. Products are For Research Use Only. Not intended for any animal or human therapeutic or diagnostic use.
Section 12.2 Probes for Mitochondria
Table 12.2 Spectral characteristics of the MitoTracker® probes.
Cat. No. MitoTracker® Probe Abs * (nm) Em * (nm) Oxidation State
M7514 MitoTracker® Green FM® † 490 516 NA
M7510 MitoTracker® Orange CMTMRos 551 576 Oxidized
M7511 MitoTracker® Orange CM-H2TMRos 551 ‡ 576 ‡ Reduced
M7512 MitoTracker® Red CMXRos 578 599 Oxidized
M7513 MitoTracker® Red CM-H2XRos 578 ‡ 599 ‡ Reduced
M22425 MitoTracker® Red FM® 581 644 NA
M22426 MitoTracker® Deep Red FM® 644 665 NA
* Absorption (Abs) and �uorescence emission (Em) maxima, determined in methanol; values may vary somewhat in cellular environments. † MitoTracker® Green FM® is non�uorescent in aqueous environments. ‡ These reduced MitoTracker® probes are not �uorescent until oxidized. NA = Not applicable.
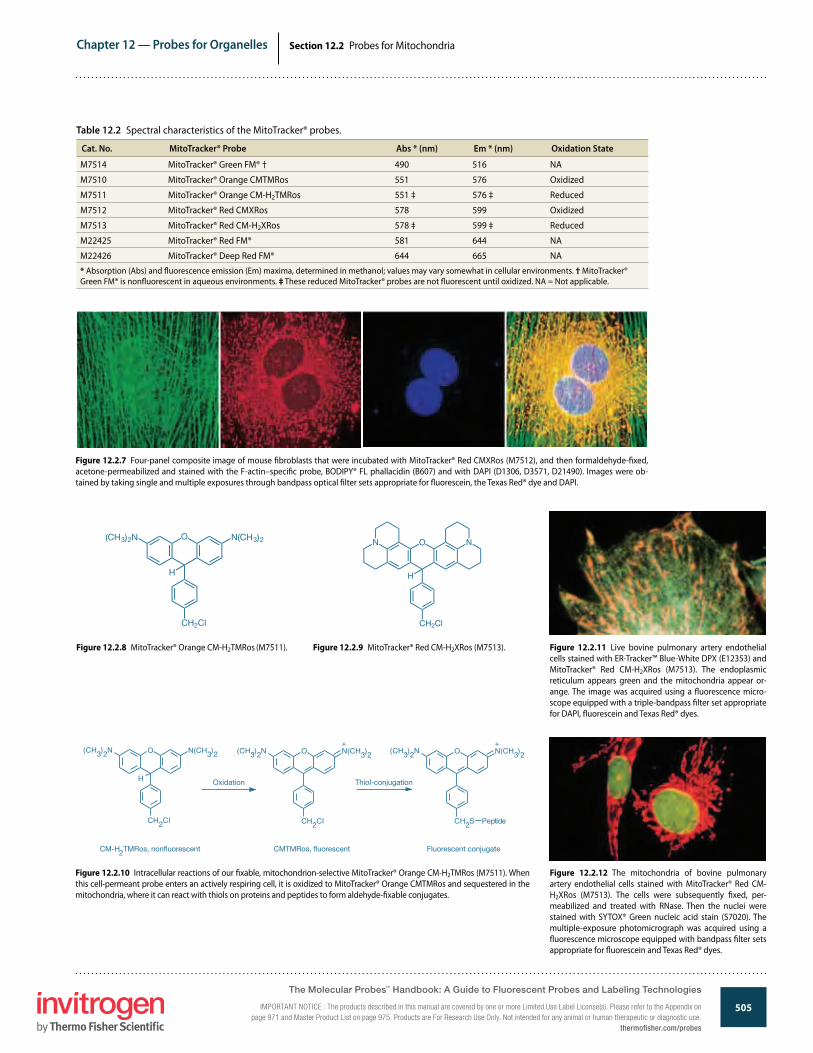
Figure 12.2.7 Four-panel composite image of mouse �broblasts that were incubated with MitoTracker® Red CMXRos (M7512), and then formaldehyde-�xed, acetone-permeabilized and stained with the F-actin–speci�c probe, BODIPY® FL phallacidin (B607) and with DAPI (D1306, D3571, D21490). Images were ob-tained by taking single and multiple exposures through bandpass optical �lter sets appropriate for �uorescein, the Texas Red® dye and DAPI.
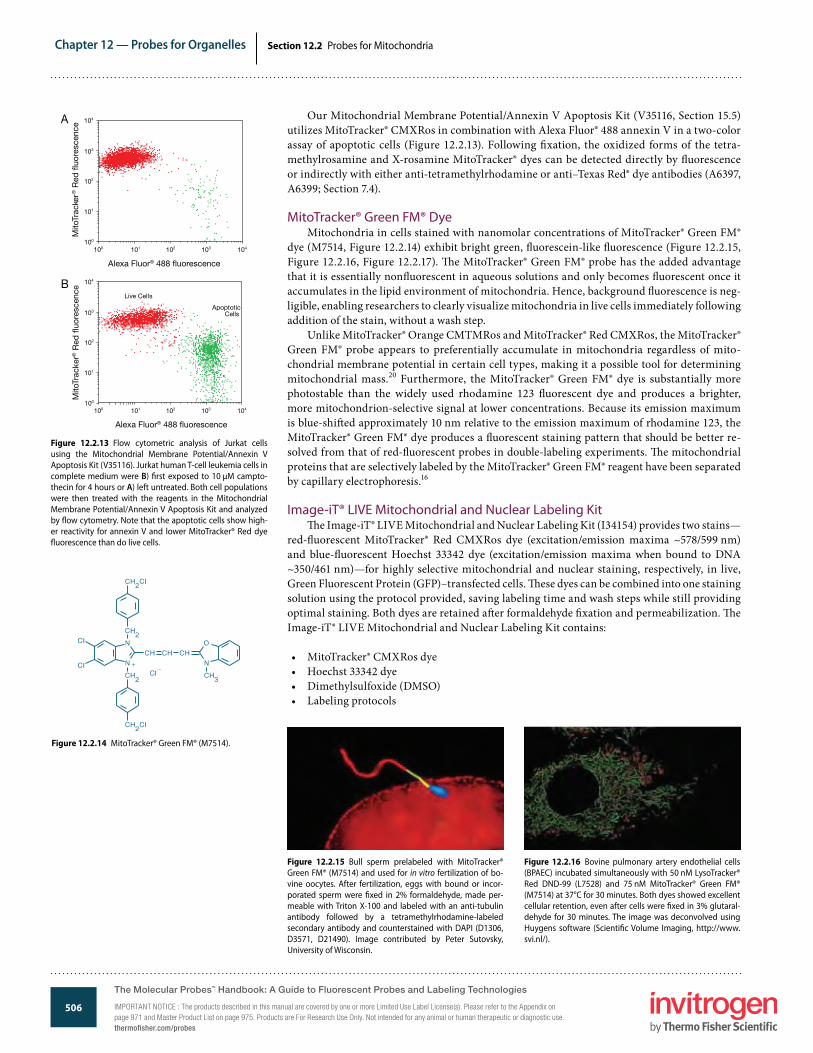
Figure 12.2.8 MitoTracker® Orange CM-H2TMRos (M7511).
(CH3)2N O N(CH3)2
CH2Cl
H
Figure 12.2.9 MitoTracker® Red CM-H2XRos (M7513).
N O N
CH2Cl
H
Figure 12.2.10 Intracellular reactions of our �xable, mitochondrion-selective MitoTracker® Orange CM-H2TMRos (M7511). When this cell-permeant probe enters an actively respiring cell, it is oxidized to MitoTracker® Orange CMTMRos and sequestered in the mitochondria, where it can react with thiols on proteins and peptides to form aldehyde-�xable conjugates.
Thiol-conjugation
Fluorescent conjugateCMTMRos, �uorescentCM-H2TMRos, non�uorescent
O
CH2CI
(CH3)2N N(CH3)2
+O
CH2CI
(CH3)2N N(CH3)2
H Oxidation
+O
CH2S
(CH3)2N N(CH3)2
Peptide
Figure 12.2.11 Live bovine pulmonary artery endothelial cells stained with ER-Tracker™ Blue-White DPX (E12353) and MitoTracker® Red CM-H2XRos (M7513). The endoplasmic reticulum appears green and the mitochondria appear or-ange. The image was acquired using a �uorescence micro-scope equipped with a triple-bandpass �lter set appropriate for DAPI, �uorescein and Texas Red® dyes.
Figure 12.2.12 The mitochondria of bovine pulmonary artery endothelial cells stained with MitoTracker® Red CM-H2XRos (M7513). The cells were subsequently �xed, per-meabilized and treated with RNase. Then the nuclei were stained with SYTOX® Green nucleic acid stain (S7020). The multiple-exposure photomicrograph was acquired using a �uorescence microscope equipped with bandpass �lter sets appropriate for �uorescein and Texas Red® dyes.
The Molecular Probes™ Handbook: A Guide to Fluorescent Probes and Labeling Technologies
IMPORTANT NOTICE : The products described in this manual are covered by one or more Limited Use Label License(s). Please refer to the Appendix on page 971 and Master Product List on page 975. Products are For Research Use Only. Not intended for any animal or human therapeutic or diagnostic use.
thermofisher.com/probes
506
Chapter 12 — Probes for Organelles
www.invitrogen.com/probes
The Molecular Probes® Handbook: A Guide to Fluorescent Probes and Labeling TechnologiesIMPORTANT NOTICE: The products described in this manual are covered by one or more Limited Use Label License(s). Please refer to the Appendix on page 971 and Master Product List on page 975. Products are For Research Use Only. Not intended for any animal or human therapeutic or diagnostic use.
Section 12.2 Probes for Mitochondria
Our Mitochondrial Membrane Potential/Annexin V Apoptosis Kit (V35116, Section 15.5) utilizes MitoTracker® CMXRos in combination with Alexa Fluor® 488 annexin V in a two-color assay of apoptotic cells (Figure 12.2.13). Following �xation, the oxidized forms of the tetra-methylrosamine and X-rosamine MitoTracker® dyes can be detected directly by �uorescence or indirectly with either anti-tetramethylrhodamine or anti–Texas Red® dye antibodies (A6397, A6399; Section 7.4).
MitoTracker® Green FM® DyeMitochondria in cells stained with nanomolar concentrations of MitoTracker® Green FM®
dye (M7514, Figure 12.2.14) exhibit bright green, �uorescein-like �uorescence (Figure 12.2.15, Figure 12.2.16, Figure 12.2.17). �e MitoTracker® Green FM® probe has the added advantage that it is essentially non�uorescent in aqueous solutions and only becomes �uorescent once it accumulates in the lipid environment of mitochondria. Hence, background �uorescence is neg-ligible, enabling researchers to clearly visualize mitochondria in live cells immediately following addition of the stain, without a wash step.
Unlike MitoTracker® Orange CMTMRos and MitoTracker® Red CMXRos, the MitoTracker® Green FM® probe appears to preferentially accumulate in mitochondria regardless of mito-chondrial membrane potential in certain cell types, making it a possible tool for determining mitochondrial mass.20 Furthermore, the MitoTracker® Green FM® dye is substantially more photostable than the widely used rhodamine 123 �uorescent dye and produces a brighter, more mitochondrion-selective signal at lower concentrations. Because its emission maximum is blue-shi�ed approximately 10 nm relative to the emission maximum of rhodamine 123, the MitoTracker® Green FM® dye produces a �uorescent staining pattern that should be better re-solved from that of red-�uorescent probes in double-labeling experiments. �e mitochondrial proteins that are selectively labeled by the MitoTracker® Green FM® reagent have been separated by capillary electrophoresis.16
Image-iT® LIVE Mitochondrial and Nuclear Labeling Kit�e Image-iT® LIVE Mitochondrial and Nuclear Labeling Kit (I34154) provides two stains—
red-�uorescent MitoTracker® Red CMXRos dye (excitation/emission maxima ~578/599 nm) and blue-�uorescent Hoechst 33342 dye (excitation/emission maxima when bound to DNA ~350/461 nm)—for highly selective mitochondrial and nuclear staining, respectively, in live, Green Fluorescent Protein (GFP)–transfected cells. �ese dyes can be combined into one staining solution using the protocol provided, saving labeling time and wash steps while still providing optimal staining. Both dyes are retained a�er formaldehyde �xation and permeabilization. �e Image-iT® LIVE Mitochondrial and Nuclear Labeling Kit contains:
• MitoTracker® CMXRos dye• Hoechst 33342 dye• Dimethylsulfoxide (DMSO)• Labeling protocols
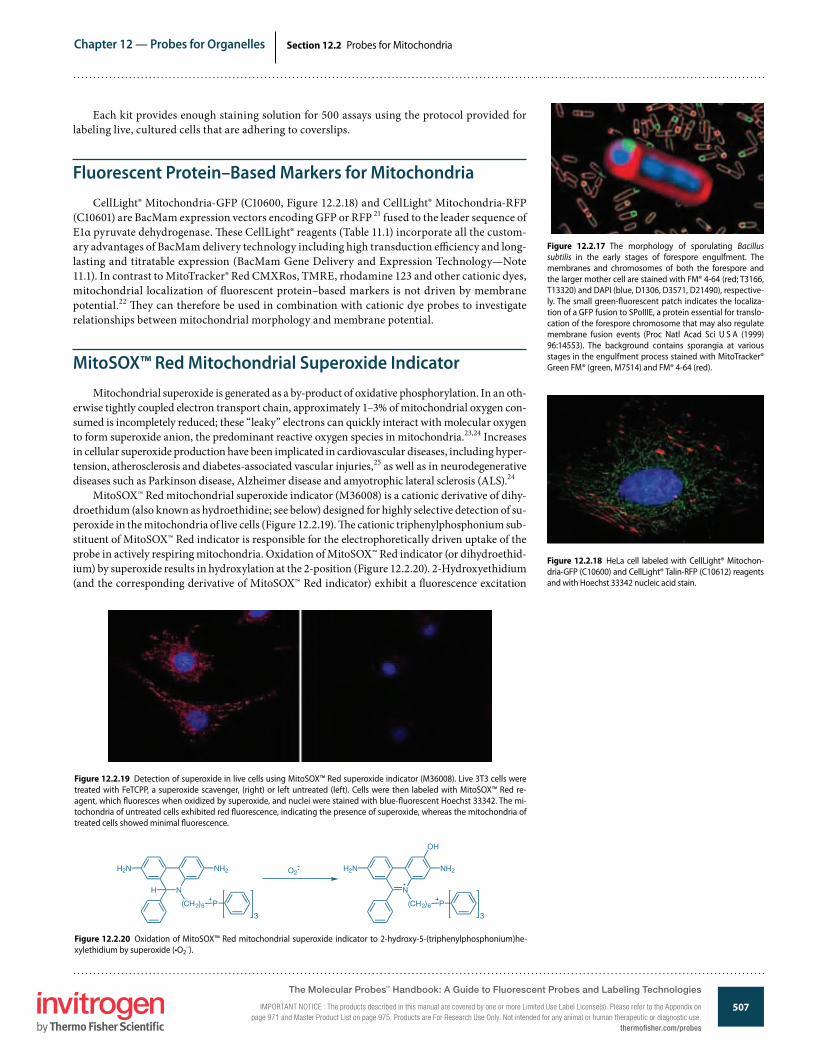
Figure 12.2.16 Bovine pulmonary artery endothelial cells (BPAEC) incubated simultaneously with 50 nM LysoTracker® Red DND-99 (L7528) and 75 nM MitoTracker® Green FM® (M7514) at 37°C for 30 minutes. Both dyes showed excellent cellular retention, even after cells were �xed in 3% glutaral-dehyde for 30 minutes. The image was deconvolved using Huygens software (Scienti�c Volume Imaging, http://www.svi.nl/).
Figure 12.2.15 Bull sperm prelabeled with MitoTracker® Green FM® (M7514) and used for in vitro fertilization of bo-vine oocytes. After fertilization, eggs with bound or incor-porated sperm were �xed in 2% formaldehyde, made per-meable with Triton X-100 and labeled with an anti-tubulin antibody followed by a tetramethylrhodamine-labeled secondary antibody and counterstained with DAPI (D1306, D3571, D21490). Image contributed by Peter Sutovsky, University of Wisconsin.
Figure 12.2.14 MitoTracker® Green FM® (M7514).
Figure 12.2.13 Flow cytometric analysis of Jurkat cells using the Mitochondrial Membrane Potential/Annexin V Apoptosis Kit (V35116). Jurkat human T-cell leukemia cells in complete medium were B) �rst exposed to 10 µM campto-thecin for 4 hours or A) left untreated. Both cell populations were then treated with the reagents in the Mitochondrial Membrane Potential/Annexin V Apoptosis Kit and analyzed by �ow cytometry. Note that the apoptotic cells show high-er reactivity for annexin V and lower MitoTracker® Red dye �uorescence than do live cells.
100 101 102 103 104100
101
102
103
104
Alexa Fluor® 488 �uorescence
Mito
Trac
ker®
Red
�uo
resc
ence
100 101 102 103 104100
101
102
103
104
Alexa Fluor® 488 �uorescence
Mito
Trac
ker®
Red
�uo
resc
ence
ApoptoticCells
Live Cells
A
B
The Molecular Probes™ Handbook: A Guide to Fluorescent Probes and Labeling Technologies
IMPORTANT NOTICE : The products described in this manual are covered by one or more Limited Use Label License(s). Please refer to the Appendix on page 971 and Master Product List on page 975. Products are For Research Use Only. Not intended for any animal or human therapeutic or diagnostic use.thermofisher.com/probes
507
Chapter 12 — Probes for Organelles
www.invitrogen.com/probes
The Molecular Probes® Handbook: A Guide to Fluorescent Probes and Labeling TechnologiesIMPORTANT NOTICE: The products described in this manual are covered by one or more Limited Use Label License(s). Please refer to the Appendix on page 971 and Master Product List on page 975. Products are For Research Use Only. Not intended for any animal or human therapeutic or diagnostic use.
Section 12.2 Probes for Mitochondria
Each kit provides enough staining solution for 500 assays using the protocol provided for labeling live, cultured cells that are adhering to coverslips.
Fluorescent Protein–Based Markers for MitochondriaCellLight® Mitochondria-GFP (C10600, Figure 12.2.18) and CellLight® Mitochondria-RFP
(C10601) are BacMam expression vectors encoding GFP or RFP 21 fused to the leader sequence of E1α pyruvate dehydrogenase. �ese CellLight® reagents (Table 11.1) incorporate all the custom-ary advantages of BacMam delivery technology including high transduction e�ciency and long-lasting and titratable expression (BacMam Gene Delivery and Expression Technology—Note 11.1). In contrast to MitoTracker® Red CMXRos, TMRE, rhodamine 123 and other cationic dyes, mitochondrial localization of �uorescent protein–based markers is not driven by membrane potential.22 �ey can therefore be used in combination with cationic dye probes to investigate relationships between mitochondrial morphology and membrane potential.
MitoSOX™ Red Mitochondrial Superoxide IndicatorMitochondrial superoxide is generated as a by-product of oxidative phosphorylation. In an oth-
erwise tightly coupled electron transport chain, approximately 1–3% of mitochondrial oxygen con-sumed is incompletely reduced; these “leaky” electrons can quickly interact with molecular oxygen to form superoxide anion, the predominant reactive oxygen species in mitochondria.23,24 Increases in cellular superoxide production have been implicated in cardiovascular diseases, including hyper-tension, atherosclerosis and diabetes-associated vascular injuries,25 as well as in neurodegenerative diseases such as Parkinson disease, Alzheimer disease and amyotrophic lateral sclerosis (ALS).24
MitoSOX™ Red mitochondrial superoxide indicator (M36008) is a cationic derivative of dihy-droethidum (also known as hydroethidine; see below) designed for highly selective detection of su-peroxide in the mitochondria of live cells (Figure 12.2.19). �e cationic triphenylphosphonium sub-stituent of MitoSOX™ Red indicator is responsible for the electrophoretically driven uptake of the probe in actively respiring mitochondria. Oxidation of MitoSOX™ Red indicator (or dihydroethid-ium) by superoxide results in hydroxylation at the 2-position (Figure 12.2.20). 2-Hydroxyethidium (and the corresponding derivative of MitoSOX™ Red indicator) exhibit a �uorescence excitation
Figure 12.2.17 The morphology of sporulating Bacillus subtilis in the early stages of forespore engulfment. The membranes and chromosomes of both the forespore and the larger mother cell are stained with FM® 4-64 (red; T3166, T13320) and DAPI (blue, D1306, D3571, D21490), respective-ly. The small green-�uorescent patch indicates the localiza-tion of a GFP fusion to SPoIIIE, a protein essential for translo-cation of the forespore chromosome that may also regulate membrane fusion events (Proc Natl Acad Sci U S A (1999) 96:14553). The background contains sporangia at various stages in the engulfment process stained with MitoTracker® Green FM® (green, M7514) and FM® 4-64 (red).
Figure 12.2.18 HeLa cell labeled with CellLight® Mitochon-dria-GFP (C10600) and CellLight® Talin-RFP (C10612) reagents and with Hoechst 33342 nucleic acid stain.
Figure 12.2.19 Detection of superoxide in live cells using MitoSOX™ Red superoxide indicator (M36008). Live 3T3 cells were treated with FeTCPP, a superoxide scavenger, (right) or left untreated (left). Cells were then labeled with MitoSOX™ Red re-agent, which �uoresces when oxidized by superoxide, and nuclei were stained with blue-�uorescent Hoechst 33342. The mi-tochondria of untreated cells exhibited red �uorescence, indicating the presence of superoxide, whereas the mitochondria of treated cells showed minimal �uorescence.
Figure 12.2.20 Oxidation of MitoSOX™ Red mitochondrial superoxide indicator to 2-hydroxy-5-(triphenylphosphonium)he-xylethidium by superoxide (•O2
–).
N
(CH2)6 P
H2N NH2
H
3
N
(CH2)6 P
H2N NH2
3
OH
O2
The Molecular Probes™ Handbook: A Guide to Fluorescent Probes and Labeling Technologies
IMPORTANT NOTICE : The products described in this manual are covered by one or more Limited Use Label License(s). Please refer to the Appendix on page 971 and Master Product List on page 975. Products are For Research Use Only. Not intended for any animal or human therapeutic or diagnostic use.
thermofisher.com/probes

508
Chapter 12 — Probes for Organelles
www.invitrogen.com/probes
The Molecular Probes® Handbook: A Guide to Fluorescent Probes and Labeling TechnologiesIMPORTANT NOTICE: The products described in this manual are covered by one or more Limited Use Label License(s). Please refer to the Appendix on page 971 and Master Product List on page 975. Products are For Research Use Only. Not intended for any animal or human therapeutic or diagnostic use.
Section 12.2 Probes for Mitochondria
peak at ~400 nm 26 that is absent in the excitation spectrum of the ethid-ium oxidation product generated by reactive oxygen species other than superoxide. �us, �uorescence excitation at 400 nm with emission detec-tion at ~590 nm provides optimum discrimination of superoxide from other reactive oxygen species 26–28 (Figure 12.2.21).
Measurements of mitochondrial superoxide generation using MitoSOX™ Red indicator in mouse cortical neurons expressing caspase-cleaved tau microtubule-associated protein have been correlated with read-outs from �uorescent indicators of cytosolic and mitochondrial calcium and mitochondrial membrane potential.29 �e relationship of mitochon-drial superoxide generation to dopamine transporter activity, measured using the aminostyryl dye substrate 4-Di-1-ASP (D288, see below), has been investigated in mouse brain astrocytes.30 MitoSOX™ Red indicator has been used for confocal microscopy analysis of reactive oxygen species (ROS) production by mitochondrial NO synthase (mtNOS) in permeabi-lized cat ventricular myocytes 31 and, in combination with Amplex® Red reagent, for measurement of mitochondrial superoxide and hydrogen per-oxide production in rat vascular endothelial cells.32 In addition to imaging and microscope photometry measurements, several �ow cytometry appli-cations of MitoSOX™ Red have also been reported. Detailed protocols for simultaneous measurements of mitochondrial superoxide generation and apoptotic markers APC annexin V (A35110, Section 15.5) and SYTOX® Green (S7020, Section 8.1) in human coronary artery endothelial cells by �ow cytometry have been published by Mukhopadhyay and co-workers.33
RedoxSensor™ Red CC-1 StainRedoxSensor™ Red CC-1 stain (2,3,4,5,6-penta�uorotetrameth-
yldihydrorosamine, R14060; Figure 12.2.22) passively enters live cells and is subsequently oxidized in the cytosol to a red-�uorescent product (excitation/emission maxima ~540/600 nm), which then accumulates in the mitochondria. Alternatively, this non�uores-cent probe may be transported to the lysosomes where it is oxidized.
Figure 12.2.22 RedoxSensor™ Red CC-1 (R14060).
��H��2N O N��H��2
�
H�
�
�
�
Figure 12.2.21 Selectivity of the MitoSOX™ Red mitochondrial superoxide indicator (M36008). Cell-free systems were used to generate a variety of reactive oxygen species (ROS) and reactive nitrogen species (RNS); each oxidant was then added to a separate 10 µM solu-tion of MitoSOX™ Red reagent and incubated at 37°C for 10 minutes. Excess DNA was add-ed (unless otherwise noted) and the samples were incubated for an additional 15 minutes at 37°C before �uorescence was measured. The Griess Reagent Kit (G7921) (for nitric oxide, peroxynitrite, and nitrite standards only; blue bars) and dihydrorhodamine 123 (DHR 123, (D632); green bars) were employed as positive controls for oxidant generation. Superoxide dismutase (SOD), a superoxide scavenger, was used as a negative control for superoxide. The results show that the MitoSOX™ Red probe (red bars) is readily oxidized by superoxide but not by the other oxidants.
1
10
100
1,000
10,000
Super
oxide
Super
oxide +
SOD
No ad
ditionH 2
O 2
H 2O 2
+ H
RP
Singlet
oxy
gen
Perox
ynitr
ite
Super
oxide
Super
oxide +
SOD
Super
oxide (
no D
NA)
No ad
dition
H 2O 2
H 2O 2
+ H
RP
Nitric
oxide
Singlet
oxy
gen
Perox
ynitr
ite
Rel
ativ
e �u
ores
cenc
e
0
0.2
0.4
0.6
0.8
1.0
1.2
1.4
1.6
Sodiumnitrite
Nitricoxide
Peroxy-nitrite
Ab
sorb
ance
(548
nm
)
Figure 12.2.23 Cellular proliferation state determines the distribution of the oxidized product of RedoxSensor™ Red CC-1 (R14060). Normal rat kidney (NRK) cells in di�erent growth states were stained with RedoxSensor™ Red CC-1. In proliferating cells (left), the oxidized dye accumu-lates in mitochondria. In quiescent cells (right), the oxidized product localizes in the lysosomes.
�e di�erential distribution of the oxidized product between mito-chondria and lysosomes appears to depend on the redox potential of the cytosol.34–36 In proliferating cells, mitochondrial staining predomi-nates; whereas in contact-inhibited cells, the staining is primarily lyso-somal (Figure 12.2.23).
JC-1 and JC-9: Dual-Emission Potential-Sensitive Probes
�e green-�uorescent JC-1 probe (5,5’,6,6’-tetrachloro-1,1’,3,3’-tetraethylbenzimidazolylcarbocyanine iodide, T3168; Figure 12.2.24) exists as a monomer at low concentrations or at low membrane po-tential. However, at higher concentrations (aqueous solutions above 0.1 µM) or higher potentials, JC-1 forms red-�uorescent “J-aggregates” that exhibit a broad excitation spectrum and an emission maximum at ~590 nm (Figure 12.2.25, Figure 12.2.26, Figure 12.2.27). �us, the emission of this cyanine dye can be used as a sensitive measure of mi-tochondrial membrane potential. Various types of ratio measurements are possible by combining signals from the green-�uorescent JC-1 monomer (absorption/emission maxima ~514/529 nm in water) and the J-aggregate (emission maximum 590 nm), which can be e�ective-ly excited anywhere between 485 nm and its absorption maximum at 585 nm (Figure 12.2.28). �e ratio of red-to-green JC-1 �uorescence is dependent only on the membrane potential and not on other factors that may in�uence single-component �uorescence signals, such as mitochon-drial size, shape and density. Optical �lters designed for �uorescein and
The Molecular Probes™ Handbook: A Guide to Fluorescent Probes and Labeling Technologies
IMPORTANT NOTICE : The products described in this manual are covered by one or more Limited Use Label License(s). Please refer to the Appendix on page 971 and Master Product List on page 975. Products are For Research Use Only. Not intended for any animal or human therapeutic or diagnostic use.thermofisher.com/probes
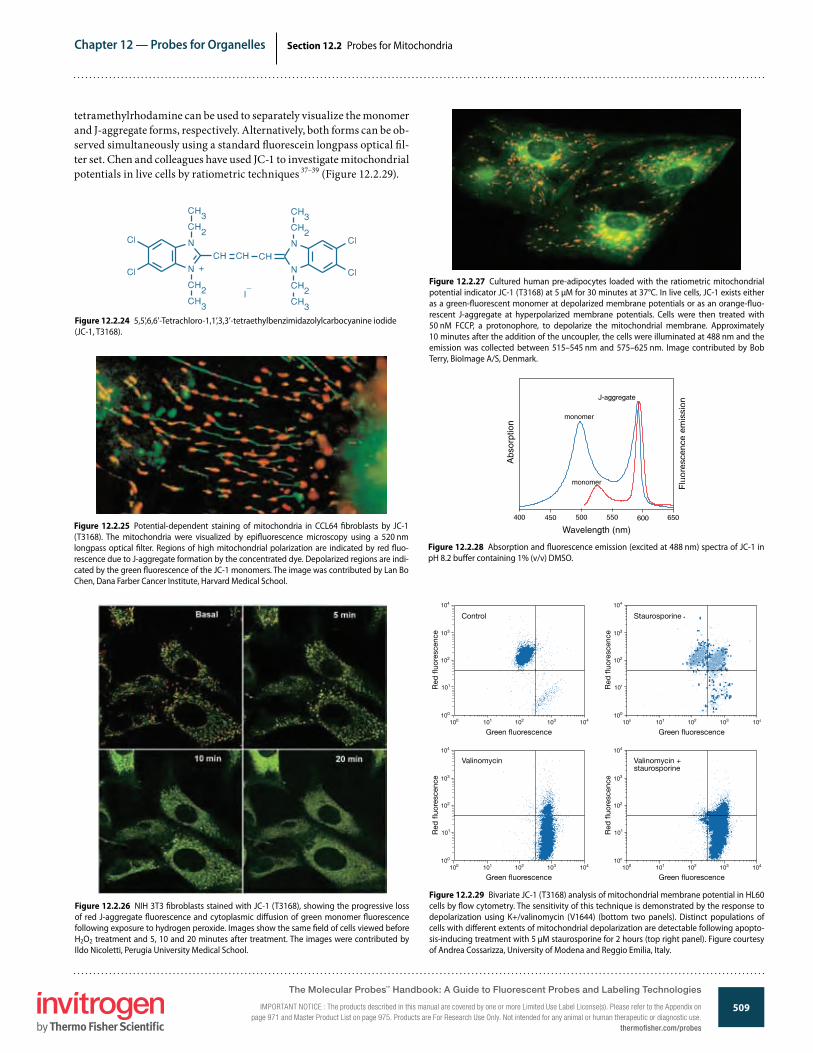
509
Chapter 12 — Probes for Organelles
www.invitrogen.com/probes
The Molecular Probes® Handbook: A Guide to Fluorescent Probes and Labeling TechnologiesIMPORTANT NOTICE: The products described in this manual are covered by one or more Limited Use Label License(s). Please refer to the Appendix on page 971 and Master Product List on page 975. Products are For Research Use Only. Not intended for any animal or human therapeutic or diagnostic use.
Section 12.2 Probes for Mitochondria
tetramethylrhodamine can be used to separately visualize the monomer and J-aggregate forms, respectively. Alternatively, both forms can be ob-served simultaneously using a standard �uorescein longpass optical �l-ter set. Chen and colleagues have used JC-1 to investigate mitochondrial potentials in live cells by ratiometric techniques 37–39 (Figure 12.2.29).
Figure 12.2.26 NIH 3T3 �broblasts stained with JC-1 (T3168), showing the progressive loss of red J-aggregate �uorescence and cytoplasmic di�usion of green monomer �uorescence following exposure to hydrogen peroxide. Images show the same �eld of cells viewed before H2O2 treatment and 5, 10 and 20 minutes after treatment. The images were contributed by Ildo Nicoletti, Perugia University Medical School.
Figure 12.2.27 Cultured human pre-adipocytes loaded with the ratiometric mitochondrial potential indicator JC-1 (T3168) at 5 µM for 30 minutes at 37°C. In live cells, JC-1 exists either as a green-�uorescent monomer at depolarized membrane potentials or as an orange-�uo-rescent J-aggregate at hyperpolarized membrane potentials. Cells were then treated with 50 nM FCCP, a protonophore, to depolarize the mitochondrial membrane. Approximately 10 minutes after the addition of the uncoupler, the cells were illuminated at 488 nm and the emission was collected between 515–545 nm and 575–625 nm. Image contributed by Bob Terry, BioImage A/S, Denmark.
Figure 12.2.25 Potential-dependent staining of mitochondria in CCL64 �broblasts by JC-1 (T3168). The mitochondria were visualized by epi�uorescence microscopy using a 520 nm longpass optical �lter. Regions of high mitochondrial polarization are indicated by red �uo-rescence due to J-aggregate formation by the concentrated dye. Depolarized regions are indi-cated by the green �uorescence of the JC-1 monomers. The image was contributed by Lan Bo Chen, Dana Farber Cancer Institute, Harvard Medical School.
Figure 12.2.24 5,5’,6,6’-Tetrachloro-1,1’,3,3’-tetraethylbenzimidazolylcarbocyanine iodide (JC-1, T3168).
Figure 12.2.28 Absorption and �uorescence emission (excited at 488 nm) spectra of JC-1 in pH 8.2 bu�er containing 1% (v/v) DMSO.
Figure 12.2.29 Bivariate JC-1 (T3168) analysis of mitochondrial membrane potential in HL60 cells by �ow cytometry. The sensitivity of this technique is demonstrated by the response to depolarization using K+/valinomycin (V1644) (bottom two panels). Distinct populations of cells with di�erent extents of mitochondrial depolarization are detectable following apopto-sis-inducing treatment with 5 µM staurosporine for 2 hours (top right panel). Figure courtesy of Andrea Cossarizza, University of Modena and Reggio Emilia, Italy.
100 101 102 103 104
Red
�uo
resc
ence
Green �uorescence
100
101
102
103
104
100 101 102 103 104
Red
�uo
resc
ence
Green �uorescence
100
101
102
103
104
100 101 102 103 104
Red
�uo
resc
ence
Green �uorescence
100
101
102
103
104
100 101 102 103 104
Red
�uo
resc
ence
Green �uorescence
100
101
102
103
104
Control Staurosporine
Valinomycin Valinomycin +staurosporine
The Molecular Probes™ Handbook: A Guide to Fluorescent Probes and Labeling Technologies
IMPORTANT NOTICE : The products described in this manual are covered by one or more Limited Use Label License(s). Please refer to the Appendix on page 971 and Master Product List on page 975. Products are For Research Use Only. Not intended for any animal or human therapeutic or diagnostic use.
thermofisher.com/probes
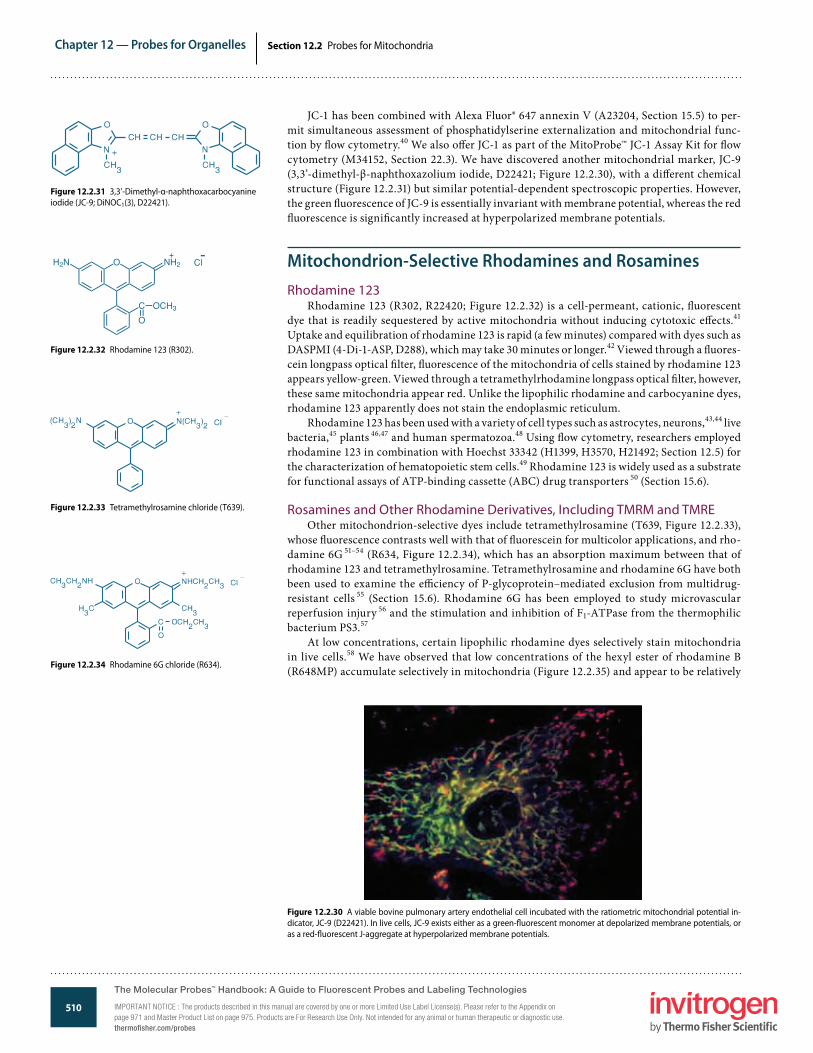
510
Chapter 12 — Probes for Organelles
www.invitrogen.com/probes
The Molecular Probes® Handbook: A Guide to Fluorescent Probes and Labeling TechnologiesIMPORTANT NOTICE: The products described in this manual are covered by one or more Limited Use Label License(s). Please refer to the Appendix on page 971 and Master Product List on page 975. Products are For Research Use Only. Not intended for any animal or human therapeutic or diagnostic use.
Section 12.2 Probes for Mitochondria
JC-1 has been combined with Alexa Fluor® 647 annexin V (A23204, Section 15.5) to per-mit simultaneous assessment of phosphatidylserine externalization and mitochondrial func-tion by �ow cytometry.40 We also o�er JC-1 as part of the MitoProbe™ JC-1 Assay Kit for �ow cytometry (M34152, Section 22.3). We have discovered another mitochondrial marker, JC-9 (3,3’-dimethyl-β-naphthoxazolium iodide, D22421; Figure 12.2.30), with a di�erent chemical structure (Figure 12.2.31) but similar potential-dependent spectroscopic properties. However, the green �uorescence of JC-9 is essentially invariant with membrane potential, whereas the red �uorescence is signi�cantly increased at hyperpolarized membrane potentials.
Mitochondrion-Selective Rhodamines and RosaminesRhodamine 123
Rhodamine 123 (R302, R22420; Figure 12.2.32) is a cell-permeant, cationic, �uorescent dye that is readily sequestered by active mitochondria without inducing cytotoxic e�ects.41 Uptake and equilibration of rhodamine 123 is rapid (a few minutes) compared with dyes such as DASPMI (4-Di-1-ASP, D288), which may take 30 minutes or longer.42 Viewed through a �uores-cein longpass optical �lter, �uorescence of the mitochondria of cells stained by rhodamine 123 appears yellow-green. Viewed through a tetramethylrhodamine longpass optical �lter, however, these same mitochondria appear red. Unlike the lipophilic rhodamine and carbocyanine dyes, rhodamine 123 apparently does not stain the endoplasmic reticulum.
Rhodamine 123 has been used with a variety of cell types such as astrocytes, neurons,43,44 live bacteria,45 plants 46,47 and human spermatozoa.48 Using �ow cytometry, researchers employed rhodamine 123 in combination with Hoechst 33342 (H1399, H3570, H21492; Section 12.5) for the characterization of hematopoietic stem cells.49 Rhodamine 123 is widely used as a substrate for functional assays of ATP-binding cassette (ABC) drug transporters 50 (Section 15.6).
Rosamines and Other Rhodamine Derivatives, Including TMRM and TMREOther mitochondrion-selective dyes include tetramethylrosamine (T639, Figure 12.2.33),
whose �uorescence contrasts well with that of �uorescein for multicolor applications, and rho-damine 6G 51–54 (R634, Figure 12.2.34), which has an absorption maximum between that of rhodamine 123 and tetramethylrosamine. Tetramethylrosamine and rhodamine 6G have both been used to examine the e�ciency of P-glycoprotein–mediated exclusion from multidrug-resistant cells 55 (Section 15.6). Rhodamine 6G has been employed to study microvascular reperfusion injury 56 and the stimulation and inhibition of F1-ATPase from the thermophilic bacterium PS3.57
At low concentrations, certain lipophilic rhodamine dyes selectively stain mitochondria in live cells.58 We have observed that low concentrations of the hexyl ester of rhodamine B (R648MP) accumulate selectively in mitochondria (Figure 12.2.35) and appear to be relatively
Figure 12.2.30 A viable bovine pulmonary artery endothelial cell incubated with the ratiometric mitochondrial potential in-dicator, JC-9 (D22421). In live cells, JC-9 exists either as a green-�uorescent monomer at depolarized membrane potentials, or as a red-�uorescent J-aggregate at hyperpolarized membrane potentials.
Figure 12.2.34 Rhodamine 6G chloride (R634).
Figure 12.2.31 3,3’-Dimethyl-α-naphthoxacarbocyanine iodide (JC-9; DiNOC1(3), D22421).
Figure 12.2.32 Rhodamine 123 (R302).
H2N O NH2
CO
OCH�
Cl
Figure 12.2.33 Tetramethylrosamine chloride (T639).
The Molecular Probes™ Handbook: A Guide to Fluorescent Probes and Labeling Technologies
IMPORTANT NOTICE : The products described in this manual are covered by one or more Limited Use Label License(s). Please refer to the Appendix on page 971 and Master Product List on page 975. Products are For Research Use Only. Not intended for any animal or human therapeutic or diagnostic use.thermofisher.com/probes
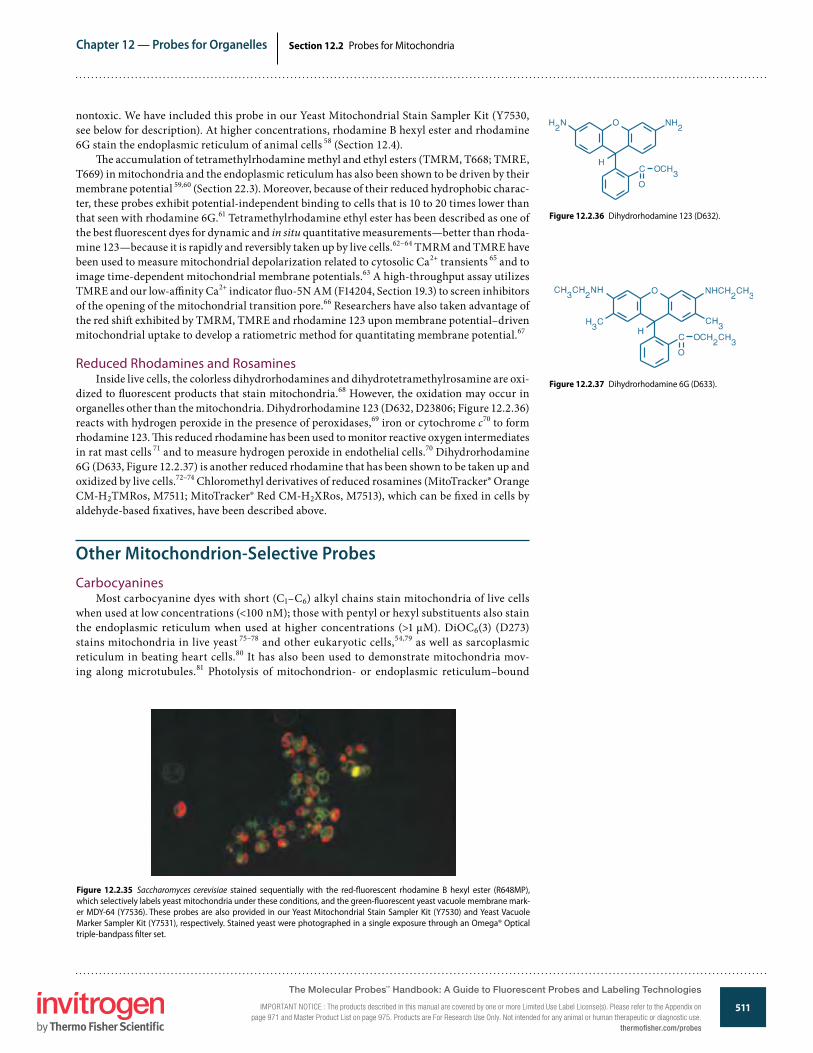
511
Chapter 12 — Probes for Organelles
www.invitrogen.com/probes
The Molecular Probes® Handbook: A Guide to Fluorescent Probes and Labeling TechnologiesIMPORTANT NOTICE: The products described in this manual are covered by one or more Limited Use Label License(s). Please refer to the Appendix on page 971 and Master Product List on page 975. Products are For Research Use Only. Not intended for any animal or human therapeutic or diagnostic use.
Section 12.2 Probes for Mitochondria
nontoxic. We have included this probe in our Yeast Mitochondrial Stain Sampler Kit (Y7530, see below for description). At higher concentrations, rhodamine B hexyl ester and rhodamine 6G stain the endoplasmic reticulum of animal cells 58 (Section 12.4).
�e accumulation of tetramethylrhodamine methyl and ethyl esters (TMRM, T668; TMRE, T669) in mitochondria and the endoplasmic reticulum has also been shown to be driven by their membrane potential 59,60 (Section 22.3). Moreover, because of their reduced hydrophobic charac-ter, these probes exhibit potential-independent binding to cells that is 10 to 20 times lower than that seen with rhodamine 6G.61 Tetramethylrhodamine ethyl ester has been described as one of the best �uorescent dyes for dynamic and in situ quantitative measurements—better than rhoda-mine 123—because it is rapidly and reversibly taken up by live cells.62–64 TMRM and TMRE have been used to measure mitochondrial depolarization related to cytosolic Ca2+ transients 65 and to image time-dependent mitochondrial membrane potentials.63 A high-throughput assay utilizes TMRE and our low-a�nity Ca2+ indicator �uo-5N AM (F14204, Section 19.3) to screen inhibitors of the opening of the mitochondrial transition pore.66 Researchers have also taken advantage of the red shi� exhibited by TMRM, TMRE and rhodamine 123 upon membrane potential–driven mitochondrial uptake to develop a ratiometric method for quantitating membrane potential.67
Reduced Rhodamines and RosaminesInside live cells, the colorless dihydrorhodamines and dihydrotetramethylrosamine are oxi-
dized to �uorescent products that stain mitochondria.68 However, the oxidation may occur in organelles other than the mitochondria. Dihydrorhodamine 123 (D632, D23806; Figure 12.2.36) reacts with hydrogen peroxide in the presence of peroxidases,69 iron or cytochrome c70 to form rhodamine 123. �is reduced rhodamine has been used to monitor reactive oxygen intermediates in rat mast cells 71 and to measure hydrogen peroxide in endothelial cells.70 Dihydrorhodamine 6G (D633, Figure 12.2.37) is another reduced rhodamine that has been shown to be taken up and oxidized by live cells.72–74 Chloromethyl derivatives of reduced rosamines (MitoTracker® Orange CM-H2TMRos, M7511; MitoTracker® Red CM-H2XRos, M7513), which can be �xed in cells by aldehyde-based �xatives, have been described above.
Other Mitochondrion-Selective ProbesCarbocyanines
Most carbocyanine dyes with short (C1–C6) alkyl chains stain mitochondria of live cells when used at low concentrations (<100 nM); those with pentyl or hexyl substituents also stain the endoplasmic reticulum when used at higher concentrations (>1 µM). DiOC6(3) (D273) stains mitochondria in live yeast 75–78 and other eukaryotic cells,54,79 as well as sarcoplasmic reticulum in beating heart cells.80 It has also been used to demonstrate mitochondria mov-ing along microtubules.81 Photolysis of mitochondrion- or endoplasmic reticulum–bound
Figure 12.2.36 Dihydrorhodamine 123 (D632).
Figure 12.2.35 Saccharomyces cerevisiae stained sequentially with the red-�uorescent rhodamine B hexyl ester (R648MP), which selectively labels yeast mitochondria under these conditions, and the green-�uorescent yeast vacuole membrane mark-er MDY-64 (Y7536). These probes are also provided in our Yeast Mitochondrial Stain Sampler Kit (Y7530) and Yeast Vacuole Marker Sampler Kit (Y7531), respectively. Stained yeast were photographed in a single exposure through an Omega® Optical triple-bandpass �lter set.
Figure 12.2.37 Dihydrorhodamine 6G (D633).
The Molecular Probes™ Handbook: A Guide to Fluorescent Probes and Labeling Technologies
IMPORTANT NOTICE : The products described in this manual are covered by one or more Limited Use Label License(s). Please refer to the Appendix on page 971 and Master Product List on page 975. Products are For Research Use Only. Not intended for any animal or human therapeutic or diagnostic use.
thermofisher.com/probes
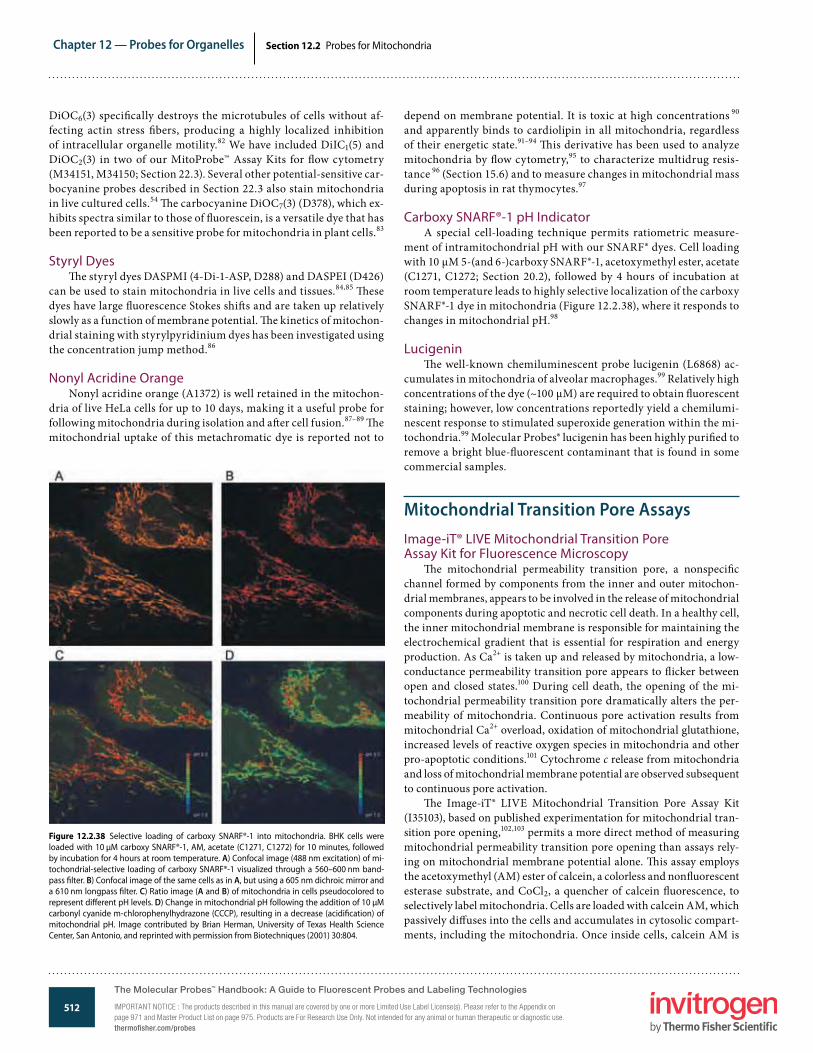
512
Chapter 12 — Probes for Organelles
www.invitrogen.com/probes
The Molecular Probes® Handbook: A Guide to Fluorescent Probes and Labeling TechnologiesIMPORTANT NOTICE: The products described in this manual are covered by one or more Limited Use Label License(s). Please refer to the Appendix on page 971 and Master Product List on page 975. Products are For Research Use Only. Not intended for any animal or human therapeutic or diagnostic use.
Section 12.2 Probes for Mitochondria
depend on membrane potential. It is toxic at high concentrations 90 and apparently binds to cardiolipin in all mitochondria, regardless of their energetic state.91–94 �is derivative has been used to analyze mitochondria by �ow cytometry,95 to characterize multidrug resis-tance 96 (Section 15.6) and to measure changes in mitochondrial mass during apoptosis in rat thymocytes.97
Carboxy SNARF®-1 pH IndicatorA special cell-loading technique permits ratiometric measure-
ment of intramitochondrial pH with our SNARF® dyes. Cell loading with 10 µM 5-(and 6-)carboxy SNARF®-1, acetoxymethyl ester, acetate (C1271, C1272; Section 20.2), followed by 4 hours of incubation at room temperature leads to highly selective localization of the carboxy SNARF®-1 dye in mitochondria (Figure 12.2.38), where it responds to changes in mitochondrial pH.98
Lucigenin�e well-known chemiluminescent probe lucigenin (L6868) ac-
cumulates in mitochondria of alveolar macrophages.99 Relatively high concentrations of the dye (~100 µM) are required to obtain �uorescent staining; however, low concentrations reportedly yield a chemilumi-nescent response to stimulated superoxide generation within the mi-tochondria.99 Molecular Probes® lucigenin has been highly puri�ed to remove a bright blue-�uorescent contaminant that is found in some commercial samples.
Mitochondrial Transition Pore AssaysImage-iT® LIVE Mitochondrial Transition Pore Assay Kit for Fluorescence Microscopy
�e mitochondrial permeability transition pore, a nonspeci�c channel formed by components from the inner and outer mitochon-drial membranes, appears to be involved in the release of mitochondrial components during apoptotic and necrotic cell death. In a healthy cell, the inner mitochondrial membrane is responsible for maintaining the electrochemical gradient that is essential for respiration and energy production. As Ca2+ is taken up and released by mitochondria, a low-conductance permeability transition pore appears to �icker between open and closed states.100 During cell death, the opening of the mi-tochondrial permeability transition pore dramatically alters the per-meability of mitochondria. Continuous pore activation results from mitochondrial Ca2+ overload, oxidation of mitochondrial glutathione, increased levels of reactive oxygen species in mitochondria and other pro-apoptotic conditions.101 Cytochrome c release from mitochondria and loss of mitochondrial membrane potential are observed subsequent to continuous pore activation.
�e Image-iT® LIVE Mitochondrial Transition Pore Assay Kit (I35103), based on published experimentation for mitochondrial tran-sition pore opening,102,103 permits a more direct method of measuring mitochondrial permeability transition pore opening than assays rely-ing on mitochondrial membrane potential alone. �is assay employs the acetoxymethyl (AM) ester of calcein, a colorless and non�uorescent esterase substrate, and CoCl2, a quencher of calcein �uorescence, to selectively label mitochondria. Cells are loaded with calcein AM, which passively di�uses into the cells and accumulates in cytosolic compart-ments, including the mitochondria. Once inside cells, calcein AM is
DiOC6(3) speci�cally destroys the microtubules of cells without af-fecting actin stress �bers, producing a highly localized inhibition of intracellular organelle motility.82 We have included DiIC1(5) and DiOC2(3) in two of our MitoProbe™ Assay Kits for �ow cytometry (M34151, M34150; Section 22.3). Several other potential-sensitive car-bocyanine probes described in Section 22.3 also stain mitochondria in live cultured cells.54 �e carbocyanine DiOC7(3) (D378), which ex-hibits spectra similar to those of �uorescein, is a versatile dye that has been reported to be a sensitive probe for mitochondria in plant cells.83
Styryl Dyes�e styryl dyes DASPMI (4-Di-1-ASP, D288) and DASPEI (D426)
can be used to stain mitochondria in live cells and tissues.84,85 �ese dyes have large �uorescence Stokes shi�s and are taken up relatively slowly as a function of membrane potential. �e kinetics of mitochon-drial staining with styrylpyridinium dyes has been investigated using the concentration jump method.86
Nonyl Acridine OrangeNonyl acridine orange (A1372) is well retained in the mitochon-
dria of live HeLa cells for up to 10 days, making it a useful probe for following mitochondria during isolation and a�er cell fusion.87–89 �e mitochondrial uptake of this metachromatic dye is reported not to
Figure 12.2.38 Selective loading of carboxy SNARF®-1 into mitochondria. BHK cells were loaded with 10 µM carboxy SNARF®-1, AM, acetate (C1271, C1272) for 10 minutes, followed by incubation for 4 hours at room temperature. A) Confocal image (488 nm excitation) of mi-tochondrial-selective loading of carboxy SNARF®-1 visualized through a 560–600 nm band-pass �lter. B) Confocal image of the same cells as in A, but using a 605 nm dichroic mirror and a 610 nm longpass �lter. C) Ratio image (A and B) of mitochondria in cells pseudocolored to represent di�erent pH levels. D) Change in mitochondrial pH following the addition of 10 µM carbonyl cyanide m-chlorophenylhydrazone (CCCP), resulting in a decrease (acidi�cation) of mitochondrial pH. Image contributed by Brian Herman, University of Texas Health Science Center, San Antonio, and reprinted with permission from Biotechniques (2001) 30:804.
The Molecular Probes™ Handbook: A Guide to Fluorescent Probes and Labeling Technologies
IMPORTANT NOTICE : The products described in this manual are covered by one or more Limited Use Label License(s). Please refer to the Appendix on page 971 and Master Product List on page 975. Products are For Research Use Only. Not intended for any animal or human therapeutic or diagnostic use.thermofisher.com/probes
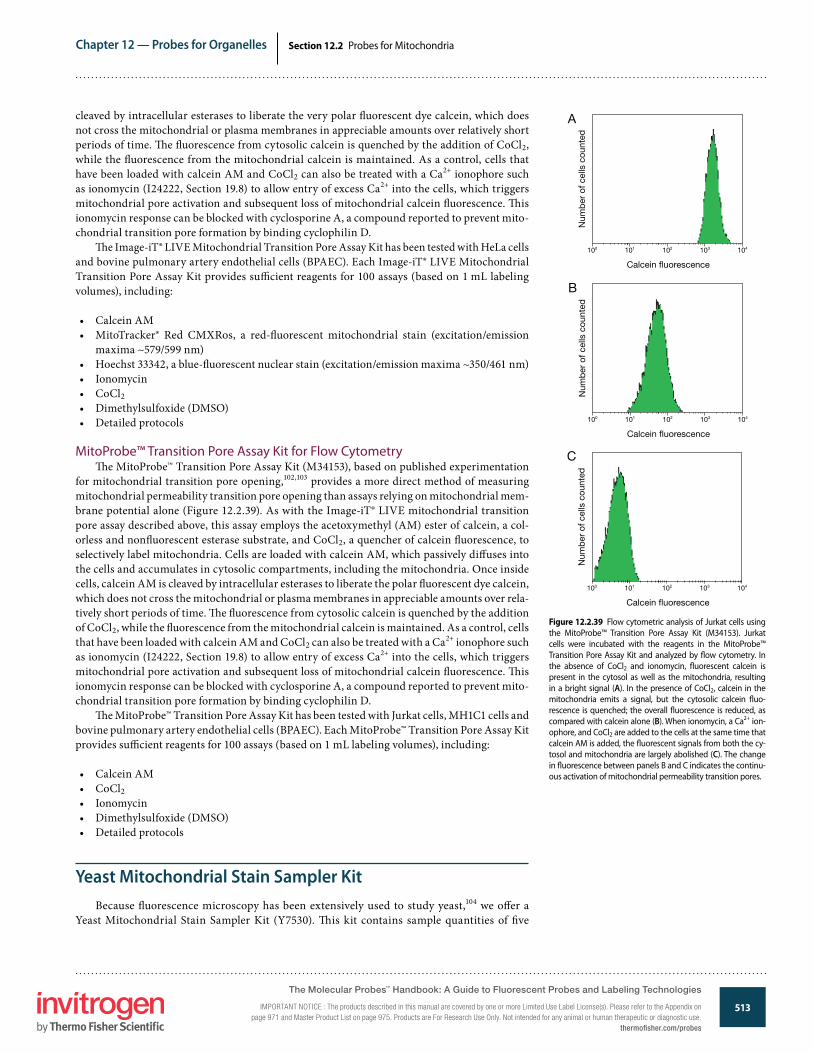
513
Chapter 12 — Probes for Organelles
www.invitrogen.com/probes
The Molecular Probes® Handbook: A Guide to Fluorescent Probes and Labeling TechnologiesIMPORTANT NOTICE: The products described in this manual are covered by one or more Limited Use Label License(s). Please refer to the Appendix on page 971 and Master Product List on page 975. Products are For Research Use Only. Not intended for any animal or human therapeutic or diagnostic use.
Section 12.2 Probes for Mitochondria
cleaved by intracellular esterases to liberate the very polar �uorescent dye calcein, which does not cross the mitochondrial or plasma membranes in appreciable amounts over relatively short periods of time. �e �uorescence from cytosolic calcein is quenched by the addition of CoCl2, while the �uorescence from the mitochondrial calcein is maintained. As a control, cells that have been loaded with calcein AM and CoCl2 can also be treated with a Ca2+ ionophore such as ionomycin (I24222, Section 19.8) to allow entry of excess Ca2+ into the cells, which triggers mitochondrial pore activation and subsequent loss of mitochondrial calcein �uorescence. �is ionomycin response can be blocked with cyclosporine A, a compound reported to prevent mito-chondrial transition pore formation by binding cyclophilin D.
�e Image-iT® LIVE Mitochondrial Transition Pore Assay Kit has been tested with HeLa cells and bovine pulmonary artery endothelial cells (BPAEC). Each Image-iT® LIVE Mitochondrial Transition Pore Assay Kit provides su�cient reagents for 100 assays (based on 1 mL labeling volumes), including:
• Calcein AM• MitoTracker® Red CMXRos, a red-�uorescent mitochondrial stain (excitation/emission
maxima ~579/599 nm)• Hoechst 33342, a blue-�uorescent nuclear stain (excitation/emission maxima ~350/461 nm)• Ionomycin• CoCl2• Dimethylsulfoxide (DMSO)• Detailed protocols
MitoProbe™ Transition Pore Assay Kit for Flow Cytometry�e MitoProbe™ Transition Pore Assay Kit (M34153), based on published experimentation
for mitochondrial transition pore opening,102,103 provides a more direct method of measuring mitochondrial permeability transition pore opening than assays relying on mitochondrial mem-brane potential alone (Figure 12.2.39). As with the Image-iT® LIVE mitochondrial transition pore assay described above, this assay employs the acetoxymethyl (AM) ester of calcein, a col-orless and non�uorescent esterase substrate, and CoCl2, a quencher of calcein �uorescence, to selectively label mitochondria. Cells are loaded with calcein AM, which passively di�uses into the cells and accumulates in cytosolic compartments, including the mitochondria. Once inside cells, calcein AM is cleaved by intracellular esterases to liberate the polar �uorescent dye calcein, which does not cross the mitochondrial or plasma membranes in appreciable amounts over rela-tively short periods of time. �e �uorescence from cytosolic calcein is quenched by the addition of CoCl2, while the �uorescence from the mitochondrial calcein is maintained. As a control, cells that have been loaded with calcein AM and CoCl2 can also be treated with a Ca2+ ionophore such as ionomycin (I24222, Section 19.8) to allow entry of excess Ca2+ into the cells, which triggers mitochondrial pore activation and subsequent loss of mitochondrial calcein �uorescence. �is ionomycin response can be blocked with cyclosporine A, a compound reported to prevent mito-chondrial transition pore formation by binding cyclophilin D.
�e MitoProbe™ Transition Pore Assay Kit has been tested with Jurkat cells, MH1C1 cells and bovine pulmonary artery endothelial cells (BPAEC). Each MitoProbe™ Transition Pore Assay Kit provides su�cient reagents for 100 assays (based on 1 mL labeling volumes), including:
• Calcein AM• CoCl2• Ionomycin• Dimethylsulfoxide (DMSO)• Detailed protocols
Yeast Mitochondrial Stain Sampler KitBecause �uorescence microscopy has been extensively used to study yeast,104 we o�er a
Yeast Mitochondrial Stain Sampler Kit (Y7530). �is kit contains sample quantities of �ve
Figure 12.2.39 Flow cytometric analysis of Jurkat cells using the MitoProbe™ Transition Pore Assay Kit (M34153). Jurkat cells were incubated with the reagents in the MitoProbe™ Transition Pore Assay Kit and analyzed by �ow cytometry. In the absence of CoCl2 and ionomycin, �uorescent calcein is present in the cytosol as well as the mitochondria, resulting in a bright signal (A). In the presence of CoCl2, calcein in the mitochondria emits a signal, but the cytosolic calcein �uo-rescence is quenched; the overall �uorescence is reduced, as compared with calcein alone (B). When ionomycin, a Ca2+ ion-ophore, and CoCl2 are added to the cells at the same time that calcein AM is added, the �uorescent signals from both the cy-tosol and mitochondria are largely abolished (C). The change in �uorescence between panels B and C indicates the continu-ous activation of mitochondrial permeability transition pores.
A
Calcein �uorescence
Num
ber
of c
ells
cou
nted
100 101 102 103 104
B
Calcein �uorescence
Num
ber
of c
ells
cou
nted
100 101 102 103 104
C
Calcein �uorescence
Num
ber
of c
ells
cou
nted
100 101 102 103 104
The Molecular Probes™ Handbook: A Guide to Fluorescent Probes and Labeling Technologies
IMPORTANT NOTICE : The products described in this manual are covered by one or more Limited Use Label License(s). Please refer to the Appendix on page 971 and Master Product List on page 975. Products are For Research Use Only. Not intended for any animal or human therapeutic or diagnostic use.
thermofisher.com/probes
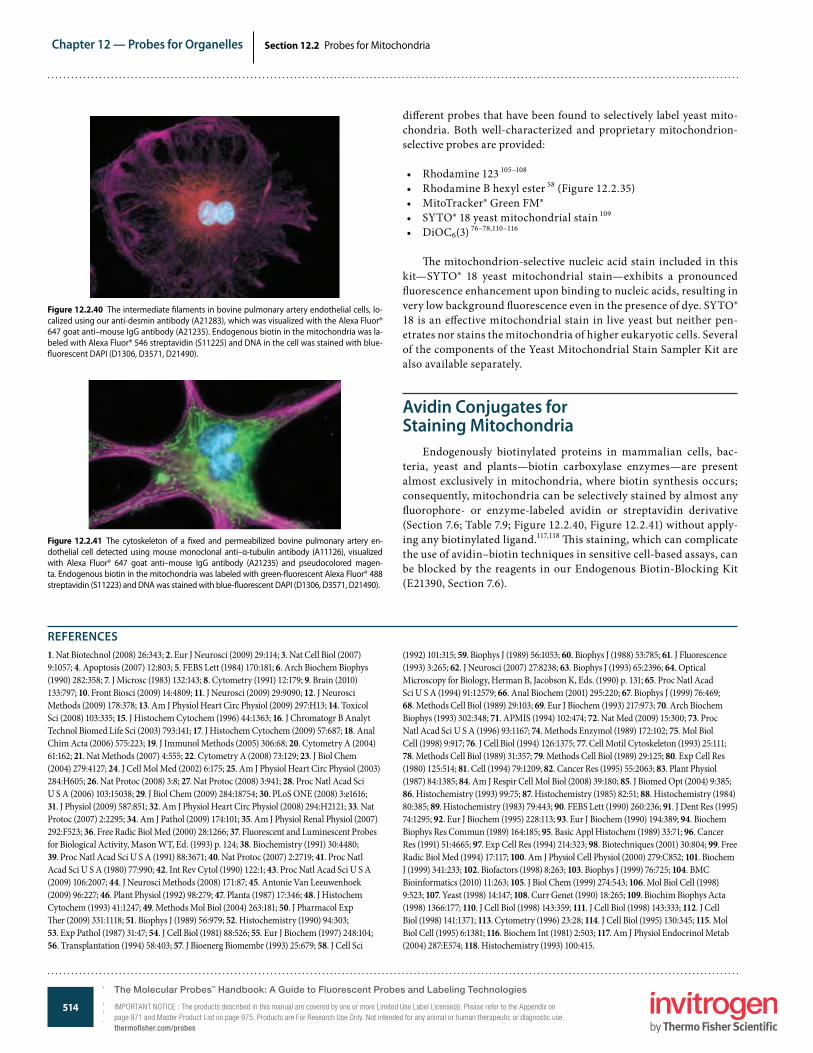
514
Chapter 12 — Probes for Organelles
www.invitrogen.com/probes
The Molecular Probes® Handbook: A Guide to Fluorescent Probes and Labeling TechnologiesIMPORTANT NOTICE: The products described in this manual are covered by one or more Limited Use Label License(s). Please refer to the Appendix on page 971 and Master Product List on page 975. Products are For Research Use Only. Not intended for any animal or human therapeutic or diagnostic use.
Section 12.2 Probes for Mitochondria
di�erent probes that have been found to selectively label yeast mito-chondria. Both well-characterized and proprietary mitochondrion-selective probes are provided:
• Rhodamine 123 105–108
• Rhodamine B hexyl ester 58 (Figure 12.2.35)• MitoTracker® Green FM®• SYTO® 18 yeast mitochondrial stain 109
• DiOC6(3) 76–78,110–116
�e mitochondrion-selective nucleic acid stain included in this kit—SYTO® 18 yeast mitochondrial stain—exhibits a pronounced �uorescence enhancement upon binding to nucleic acids, resulting in very low background �uorescence even in the presence of dye. SYTO® 18 is an e�ective mitochondrial stain in live yeast but neither pen-etrates nor stains the mitochondria of higher eukaryotic cells. Several of the components of the Yeast Mitochondrial Stain Sampler Kit are also available separately.
Avidin Conjugates for Staining Mitochondria
Endogenously biotinylated proteins in mammalian cells, bac-teria, yeast and plants—biotin carboxylase enzymes—are present almost exclusively in mitochondria, where biotin synthesis occurs; consequently, mitochondria can be selectively stained by almost any �uorophore- or enzyme-labeled avidin or streptavidin derivative (Section 7.6; Table 7.9; Figure 12.2.40, Figure 12.2.41) without apply-ing any biotinylated ligand.117,118 �is staining, which can complicate the use of avidin–biotin techniques in sensitive cell-based assays, can be blocked by the reagents in our Endogenous Biotin-Blocking Kit (E21390, Section 7.6).
Figure 12.2.41 The cytoskeleton of a �xed and permeabilized bovine pulmonary artery en-dothelial cell detected using mouse monoclonal anti–α-tubulin antibody (A11126), visualized with Alexa Fluor® 647 goat anti–mouse IgG antibody (A21235) and pseudocolored magen-ta. Endogenous biotin in the mitochondria was labeled with green-�uorescent Alexa Fluor® 488 streptavidin (S11223) and DNA was stained with blue-�uorescent DAPI (D1306, D3571, D21490).
Figure 12.2.40 The intermediate �laments in bovine pulmonary artery endothelial cells, lo-calized using our anti-desmin antibody (A21283), which was visualized with the Alexa Fluor® 647 goat anti–mouse IgG antibody (A21235). Endogenous biotin in the mitochondria was la-beled with Alexa Fluor® 546 streptavidin (S11225) and DNA in the cell was stained with blue-�uorescent DAPI (D1306, D3571, D21490).
1. Nat Biotechnol (2008) 26:343; 2. Eur J Neurosci (2009) 29:114; 3. Nat Cell Biol (2007) 9:1057; 4. Apoptosis (2007) 12:803; 5. FEBS Lett (1984) 170:181; 6. Arch Biochem Biophys (1990) 282:358; 7. J Microsc (1983) 132:143; 8. Cytometry (1991) 12:179; 9. Brain (2010) 133:797; 10. Front Biosci (2009) 14:4809; 11. J Neurosci (2009) 29:9090; 12. J Neurosci Methods (2009) 178:378; 13. Am J Physiol Heart Circ Physiol (2009) 297:H13; 14. Toxicol Sci (2008) 103:335; 15. J Histochem Cytochem (1996) 44:1363; 16. J Chromatogr B Analyt Technol Biomed Life Sci (2003) 793:141; 17. J Histochem Cytochem (2009) 57:687; 18. Anal Chim Acta (2006) 575:223; 19. J Immunol Methods (2005) 306:68; 20. Cytometry A (2004) 61:162; 21. Nat Methods (2007) 4:555; 22. Cytometry A (2008) 73:129; 23. J Biol Chem (2004) 279:4127; 24. J Cell Mol Med (2002) 6:175; 25. Am J Physiol Heart Circ Physiol (2003) 284:H605; 26. Nat Protoc (2008) 3:8; 27. Nat Protoc (2008) 3:941; 28. Proc Natl Acad Sci U S A (2006) 103:15038; 29. J Biol Chem (2009) 284:18754; 30. PLoS ONE (2008) 3:e1616; 31. J Physiol (2009) 587:851; 32. Am J Physiol Heart Circ Physiol (2008) 294:H2121; 33. Nat Protoc (2007) 2:2295; 34. Am J Pathol (2009) 174:101; 35. Am J Physiol Renal Physiol (2007) 292:F523; 36. Free Radic Biol Med (2000) 28:1266; 37. Fluorescent and Luminescent Probes for Biological Activity, Mason WT, Ed. (1993) p. 124; 38. Biochemistry (1991) 30:4480; 39. Proc Natl Acad Sci U S A (1991) 88:3671; 40. Nat Protoc (2007) 2:2719; 41. Proc Natl Acad Sci U S A (1980) 77:990; 42. Int Rev Cytol (1990) 122:1; 43. Proc Natl Acad Sci U S A (2009) 106:2007; 44. J Neurosci Methods (2008) 171:87; 45. Antonie Van Leeuwenhoek (2009) 96:227; 46. Plant Physiol (1992) 98:279; 47. Planta (1987) 17:346; 48. J Histochem Cytochem (1993) 41:1247; 49. Methods Mol Biol (2004) 263:181; 50. J Pharmacol Exp �er (2009) 331:1118; 51. Biophys J (1989) 56:979; 52. Histochemistry (1990) 94:303; 53. Exp Pathol (1987) 31:47; 54. J Cell Biol (1981) 88:526; 55. Eur J Biochem (1997) 248:104; 56. Transplantation (1994) 58:403; 57. J Bioenerg Biomembr (1993) 25:679; 58. J Cell Sci
(1992) 101:315; 59. Biophys J (1989) 56:1053; 60. Biophys J (1988) 53:785; 61. J Fluorescence (1993) 3:265; 62. J Neurosci (2007) 27:8238; 63. Biophys J (1993) 65:2396; 64. Optical Microscopy for Biology, Herman B, Jacobson K, Eds. (1990) p. 131; 65. Proc Natl Acad Sci U S A (1994) 91:12579; 66. Anal Biochem (2001) 295:220; 67. Biophys J (1999) 76:469; 68. Methods Cell Biol (1989) 29:103; 69. Eur J Biochem (1993) 217:973; 70. Arch Biochem Biophys (1993) 302:348; 71. APMIS (1994) 102:474; 72. Nat Med (2009) 15:300; 73. Proc Natl Acad Sci U S A (1996) 93:1167; 74. Methods Enzymol (1989) 172:102; 75. Mol Biol Cell (1998) 9:917; 76. J Cell Biol (1994) 126:1375; 77. Cell Motil Cytoskeleton (1993) 25:111; 78. Methods Cell Biol (1989) 31:357; 79. Methods Cell Biol (1989) 29:125; 80. Exp Cell Res (1980) 125:514; 81. Cell (1994) 79:1209; 82. Cancer Res (1995) 55:2063; 83. Plant Physiol (1987) 84:1385; 84. Am J Respir Cell Mol Biol (2008) 39:180; 85. J Biomed Opt (2004) 9:385; 86. Histochemistry (1993) 99:75; 87. Histochemistry (1985) 82:51; 88. Histochemistry (1984) 80:385; 89. Histochemistry (1983) 79:443; 90. FEBS Lett (1990) 260:236; 91. J Dent Res (1995) 74:1295; 92. Eur J Biochem (1995) 228:113; 93. Eur J Biochem (1990) 194:389; 94. Biochem Biophys Res Commun (1989) 164:185; 95. Basic Appl Histochem (1989) 33:71; 96. Cancer Res (1991) 51:4665; 97. Exp Cell Res (1994) 214:323; 98. Biotechniques (2001) 30:804; 99. Free Radic Biol Med (1994) 17:117; 100. Am J Physiol Cell Physiol (2000) 279:C852; 101. Biochem J (1999) 341:233; 102. Biofactors (1998) 8:263; 103. Biophys J (1999) 76:725; 104. BMC Bioinformatics (2010) 11:263; 105. J Biol Chem (1999) 274:543; 106. Mol Biol Cell (1998) 9:523; 107. Yeast (1998) 14:147; 108. Curr Genet (1990) 18:265; 109. Biochim Biophys Acta (1998) 1366:177; 110. J Cell Biol (1998) 143:359; 111. J Cell Biol (1998) 143:333; 112. J Cell Biol (1998) 141:1371; 113. Cytometry (1996) 23:28; 114. J Cell Biol (1995) 130:345; 115. Mol Biol Cell (1995) 6:1381; 116. Biochem Int (1981) 2:503; 117. Am J Physiol Endocrinol Metab (2004) 287:E574; 118. Histochemistry (1993) 100:415.
REFERENCES
The Molecular Probes™ Handbook: A Guide to Fluorescent Probes and Labeling Technologies
IMPORTANT NOTICE : The products described in this manual are covered by one or more Limited Use Label License(s). Please refer to the Appendix on page 971 and Master Product List on page 975. Products are For Research Use Only. Not intended for any animal or human therapeutic or diagnostic use.thermofisher.com/probes
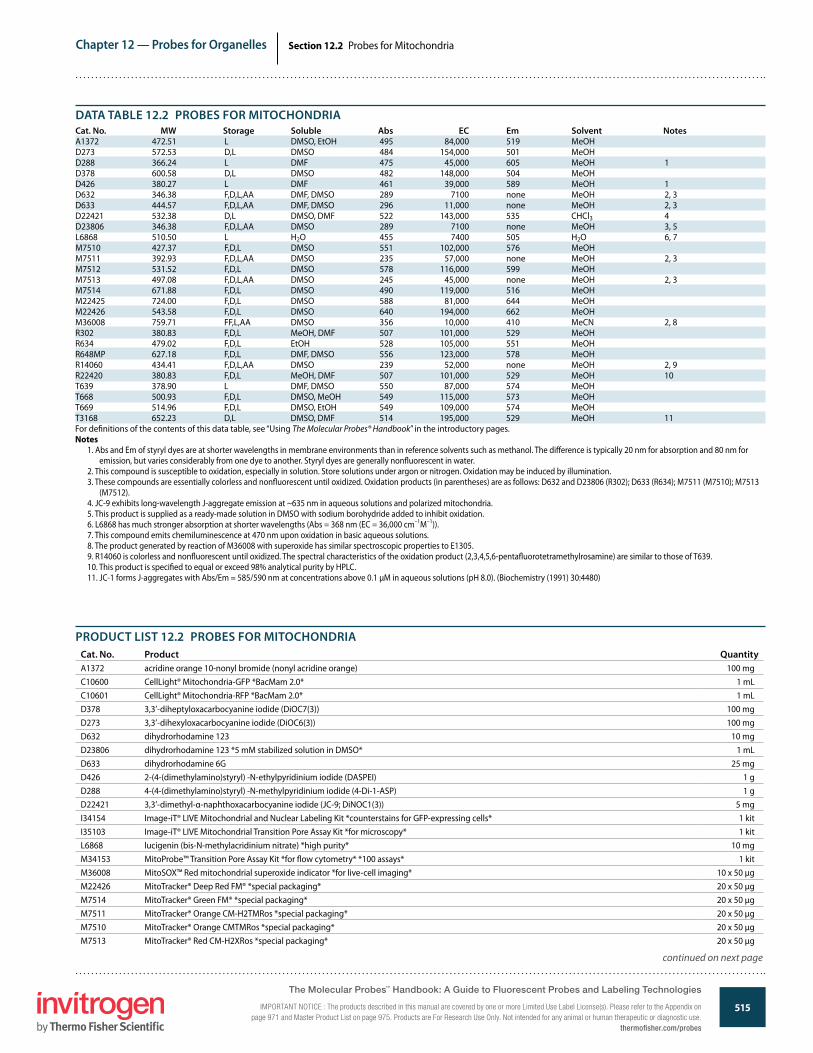
515
Chapter 12 — Probes for Organelles
www.invitrogen.com/probes
The Molecular Probes® Handbook: A Guide to Fluorescent Probes and Labeling TechnologiesIMPORTANT NOTICE: The products described in this manual are covered by one or more Limited Use Label License(s). Please refer to the Appendix on page 971 and Master Product List on page 975. Products are For Research Use Only. Not intended for any animal or human therapeutic or diagnostic use.
Section 12.2 Probes for Mitochondria
DATA TABLE 12.2 PROBES FOR MITOCHONDRIACat. No. MW Storage Soluble Abs EC Em Solvent NotesA1372 472.51 L DMSO, EtOH 495 84,000 519 MeOHD273 572.53 D,L DMSO 484 154,000 501 MeOHD288 366.24 L DMF 475 45,000 605 MeOH 1D378 600.58 D,L DMSO 482 148,000 504 MeOHD426 380.27 L DMF 461 39,000 589 MeOH 1D632 346.38 F,D,L,AA DMF, DMSO 289 7100 none MeOH 2, 3D633 444.57 F,D,L,AA DMF, DMSO 296 11,000 none MeOH 2, 3D22421 532.38 D,L DMSO, DMF 522 143,000 535 CHCl3 4D23806 346.38 F,D,L,AA DMSO 289 7100 none MeOH 3, 5L6868 510.50 L H2O 455 7400 505 H2O 6, 7M7510 427.37 F,D,L DMSO 551 102,000 576 MeOHM7511 392.93 F,D,L,AA DMSO 235 57,000 none MeOH 2, 3M7512 531.52 F,D,L DMSO 578 116,000 599 MeOHM7513 497.08 F,D,L,AA DMSO 245 45,000 none MeOH 2, 3M7514 671.88 F,D,L DMSO 490 119,000 516 MeOHM22425 724.00 F,D,L DMSO 588 81,000 644 MeOHM22426 543.58 F,D,L DMSO 640 194,000 662 MeOHM36008 759.71 FF,L,AA DMSO 356 10,000 410 MeCN 2, 8R302 380.83 F,D,L MeOH, DMF 507 101,000 529 MeOHR634 479.02 F,D,L EtOH 528 105,000 551 MeOHR648MP 627.18 F,D,L DMF, DMSO 556 123,000 578 MeOHR14060 434.41 F,D,L,AA DMSO 239 52,000 none MeOH 2, 9R22420 380.83 F,D,L MeOH, DMF 507 101,000 529 MeOH 10T639 378.90 L DMF, DMSO 550 87,000 574 MeOHT668 500.93 F,D,L DMSO, MeOH 549 115,000 573 MeOHT669 514.96 F,D,L DMSO, EtOH 549 109,000 574 MeOHT3168 652.23 D,L DMSO, DMF 514 195,000 529 MeOH 11For de�nitions of the contents of this data table, see “Using The Molecular Probes® Handbook” in the introductory pages.Notes
1. Abs and Em of styryl dyes are at shorter wavelengths in membrane environments than in reference solvents such as methanol. The di�erence is typically 20 nm for absorption and 80 nm for emission, but varies considerably from one dye to another. Styryl dyes are generally non�uorescent in water.
2. This compound is susceptible to oxidation, especially in solution. Store solutions under argon or nitrogen. Oxidation may be induced by illumination.3. These compounds are essentially colorless and non�uorescent until oxidized. Oxidation products (in parentheses) are as follows: D632 and D23806 (R302); D633 (R634); M7511 (M7510); M7513
(M7512).4. JC-9 exhibits long-wavelength J-aggregate emission at ~635 nm in aqueous solutions and polarized mitochondria.5. This product is supplied as a ready-made solution in DMSO with sodium borohydride added to inhibit oxidation.6. L6868 has much stronger absorption at shorter wavelengths (Abs = 368 nm (EC = 36,000 cm–1M–1)).7. This compound emits chemiluminescence at 470 nm upon oxidation in basic aqueous solutions.8. The product generated by reaction of M36008 with superoxide has similar spectroscopic properties to E1305.9. R14060 is colorless and non�uorescent until oxidized. The spectral characteristics of the oxidation product (2,3,4,5,6-penta�uorotetramethylrosamine) are similar to those of T639.10. This product is speci�ed to equal or exceed 98% analytical purity by HPLC.11. JC-1 forms J-aggregates with Abs/Em = 585/590 nm at concentrations above 0.1 µM in aqueous solutions (pH 8.0). (Biochemistry (1991) 30:4480)
PRODUCT LIST 12.2 PROBES FOR MITOCHONDRIACat. No. Product QuantityA1372 acridine orange 10-nonyl bromide (nonyl acridine orange) 100 mgC10600 CellLight® Mitochondria-GFP *BacMam 2.0* 1 mLC10601 CellLight® Mitochondria-RFP *BacMam 2.0* 1 mLD378 3,3’-diheptyloxacarbocyanine iodide (DiOC7(3)) 100 mgD273 3,3’-dihexyloxacarbocyanine iodide (DiOC6(3)) 100 mgD632 dihydrorhodamine 123 10 mgD23806 dihydrorhodamine 123 *5 mM stabilized solution in DMSO* 1 mLD633 dihydrorhodamine 6G 25 mgD426 2-(4-(dimethylamino)styryl) -N-ethylpyridinium iodide (DASPEI) 1 gD288 4-(4-(dimethylamino)styryl) -N-methylpyridinium iodide (4-Di-1-ASP) 1 gD22421 3,3’-dimethyl-α-naphthoxacarbocyanine iodide (JC-9; DiNOC1(3)) 5 mgI34154 Image-iT® LIVE Mitochondrial and Nuclear Labeling Kit *counterstains for GFP-expressing cells* 1 kitI35103 Image-iT® LIVE Mitochondrial Transition Pore Assay Kit *for microscopy* 1 kitL6868 lucigenin (bis-N-methylacridinium nitrate) *high purity* 10 mgM34153 MitoProbe™ Transition Pore Assay Kit *for �ow cytometry* *100 assays* 1 kitM36008 MitoSOX™ Red mitochondrial superoxide indicator *for live-cell imaging* 10 x 50 µgM22426 MitoTracker® Deep Red FM® *special packaging* 20 x 50 µgM7514 MitoTracker® Green FM® *special packaging* 20 x 50 µgM7511 MitoTracker® Orange CM-H2TMRos *special packaging* 20 x 50 µgM7510 MitoTracker® Orange CMTMRos *special packaging* 20 x 50 µgM7513 MitoTracker® Red CM-H2XRos *special packaging* 20 x 50 µg
continued on next page
The Molecular Probes™ Handbook: A Guide to Fluorescent Probes and Labeling Technologies
IMPORTANT NOTICE : The products described in this manual are covered by one or more Limited Use Label License(s). Please refer to the Appendix on page 971 and Master Product List on page 975. Products are For Research Use Only. Not intended for any animal or human therapeutic or diagnostic use.
thermofisher.com/probes
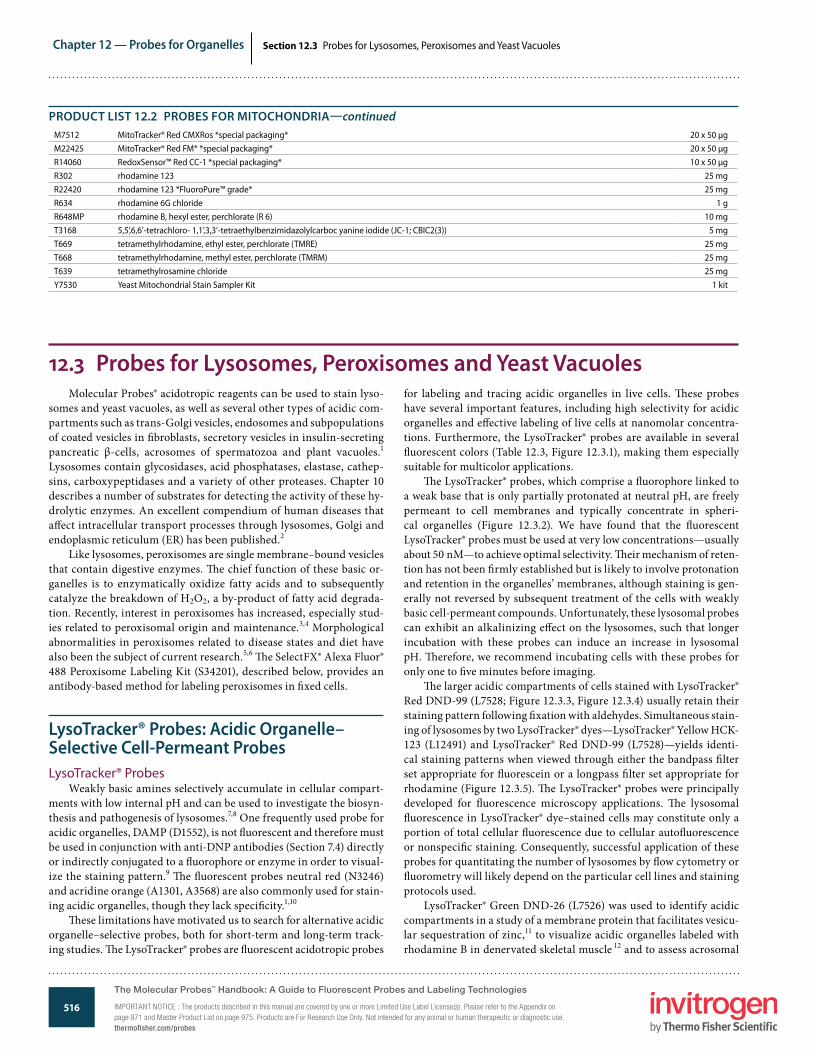
516
Chapter 12 — Probes for Organelles
www.invitrogen.com/probes
The Molecular Probes® Handbook: A Guide to Fluorescent Probes and Labeling TechnologiesIMPORTANT NOTICE: The products described in this manual are covered by one or more Limited Use Label License(s). Please refer to the Appendix on page 971 and Master Product List on page 975. Products are For Research Use Only. Not intended for any animal or human therapeutic or diagnostic use.
Section 12.3 Probes for Lysosomes, Peroxisomes and Yeast Vacuoles
PRODUCT LIST 12.2 PROBES FOR MITOCHONDRIA—continuedM7512 MitoTracker® Red CMXRos *special packaging* 20 x 50 µgM22425 MitoTracker® Red FM® *special packaging* 20 x 50 µgR14060 RedoxSensor™ Red CC-1 *special packaging* 10 x 50 µgR302 rhodamine 123 25 mgR22420 rhodamine 123 *FluoroPure™ grade* 25 mgR634 rhodamine 6G chloride 1 gR648MP rhodamine B, hexyl ester, perchlorate (R 6) 10 mgT3168 5,5’,6,6’-tetrachloro- 1,1’,3,3’-tetraethylbenzimidazolylcarboc yanine iodide (JC-1; CBIC2(3)) 5 mgT669 tetramethylrhodamine, ethyl ester, perchlorate (TMRE) 25 mgT668 tetramethylrhodamine, methyl ester, perchlorate (TMRM) 25 mgT639 tetramethylrosamine chloride 25 mgY7530 Yeast Mitochondrial Stain Sampler Kit 1 kit
Molecular Probes® acidotropic reagents can be used to stain lyso-somes and yeast vacuoles, as well as several other types of acidic com-partments such as trans-Golgi vesicles, endosomes and subpopulations of coated vesicles in �broblasts, secretory vesicles in insulin-secreting pancreatic β-cells, acrosomes of spermatozoa and plant vacuoles.1 Lysosomes contain glycosidases, acid phosphatases, elastase, cathep-sins, carboxypeptidases and a variety of other proteases. Chapter 10 describes a number of substrates for detecting the activity of these hy-drolytic enzymes. An excellent compendium of human diseases that a�ect intracellular transport processes through lysosomes, Golgi and endoplasmic reticulum (ER) has been published.2
Like lysosomes, peroxisomes are single membrane–bound vesicles that contain digestive enzymes. �e chief function of these basic or-ganelles is to enzymatically oxidize fatty acids and to subsequently catalyze the breakdown of H2O2, a by-product of fatty acid degrada-tion. Recently, interest in peroxisomes has increased, especially stud-ies related to peroxisomal origin and maintenance.3,4 Morphological abnormalities in peroxisomes related to disease states and diet have also been the subject of current research.5,6 �e SelectFX® Alexa Fluor® 488 Peroxisome Labeling Kit (S34201), described below, provides an antibody-based method for labeling peroxisomes in �xed cells.
LysoTracker® Probes: Acidic Organelle–Selective Cell-Permeant ProbesLysoTracker® Probes
Weakly basic amines selectively accumulate in cellular compart-ments with low internal pH and can be used to investigate the biosyn-thesis and pathogenesis of lysosomes.7,8 One frequently used probe for acidic organelles, DAMP (D1552), is not �uorescent and therefore must be used in conjunction with anti-DNP antibodies (Section 7.4) directly or indirectly conjugated to a �uorophore or enzyme in order to visual-ize the staining pattern.9 �e �uorescent probes neutral red (N3246) and acridine orange (A1301, A3568) are also commonly used for stain-ing acidic organelles, though they lack speci�city.1,10
�ese limitations have motivated us to search for alternative acidic organelle–selective probes, both for short-term and long-term track-ing studies. �e LysoTracker® probes are �uorescent acidotropic probes
12.3 Probes for Lysosomes, Peroxisomes and Yeast Vacuolesfor labeling and tracing acidic organelles in live cells. �ese probes have several important features, including high selectivity for acidic organelles and e�ective labeling of live cells at nanomolar concentra-tions. Furthermore, the LysoTracker® probes are available in several �uorescent colors (Table 12.3, Figure 12.3.1), making them especially suitable for multicolor applications.
�e LysoTracker® probes, which comprise a �uorophore linked to a weak base that is only partially protonated at neutral pH, are freely permeant to cell membranes and typically concentrate in spheri-cal organelles (Figure 12.3.2). We have found that the �uorescent LysoTracker® probes must be used at very low concentrations—usually about 50 nM—to achieve optimal selectivity. �eir mechanism of reten-tion has not been �rmly established but is likely to involve protonation and retention in the organelles’ membranes, although staining is gen-erally not reversed by subsequent treatment of the cells with weakly basic cell-permeant compounds. Unfortunately, these lysosomal probes can exhibit an alkalinizing e�ect on the lysosomes, such that longer incubation with these probes can induce an increase in lysosomal pH. �erefore, we recommend incubating cells with these probes for only one to �ve minutes before imaging.
�e larger acidic compartments of cells stained with LysoTracker® Red DND-99 (L7528; Figure 12.3.3, Figure 12.3.4) usually retain their staining pattern following �xation with aldehydes. Simultaneous stain-ing of lysosomes by two LysoTracker® dyes—LysoTracker® Yellow HCK-123 (L12491) and LysoTracker® Red DND-99 (L7528)—yields identi-cal staining patterns when viewed through either the bandpass �lter set appropriate for �uorescein or a longpass �lter set appropriate for rhodamine (Figure 12.3.5). �e LysoTracker® probes were principally developed for �uorescence microscopy applications. �e lysosomal �uorescence in LysoTracker® dye–stained cells may constitute only a portion of total cellular �uorescence due to cellular auto�uorescence or nonspeci�c staining. Consequently, successful application of these probes for quantitating the number of lysosomes by �ow cytometry or �uorometry will likely depend on the particular cell lines and staining protocols used.
LysoTracker® Green DND-26 (L7526) was used to identify acidic compartments in a study of a membrane protein that facilitates vesicu-lar sequestration of zinc,11 to visualize acidic organelles labeled with rhodamine B in denervated skeletal muscle 12 and to assess acrosomal
The Molecular Probes™ Handbook: A Guide to Fluorescent Probes and Labeling Technologies
IMPORTANT NOTICE : The products described in this manual are covered by one or more Limited Use Label License(s). Please refer to the Appendix on page 971 and Master Product List on page 975. Products are For Research Use Only. Not intended for any animal or human therapeutic or diagnostic use.thermofisher.com/probes
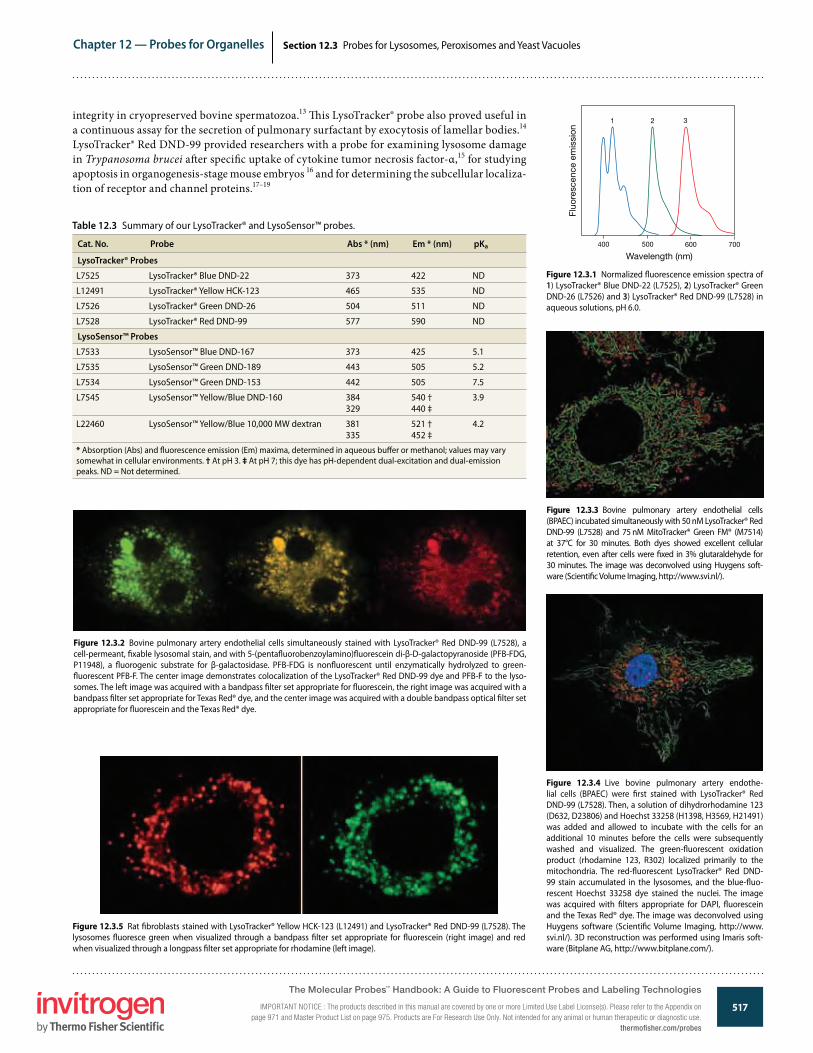
517
Chapter 12 — Probes for Organelles
www.invitrogen.com/probes
The Molecular Probes® Handbook: A Guide to Fluorescent Probes and Labeling TechnologiesIMPORTANT NOTICE: The products described in this manual are covered by one or more Limited Use Label License(s). Please refer to the Appendix on page 971 and Master Product List on page 975. Products are For Research Use Only. Not intended for any animal or human therapeutic or diagnostic use.
Section 12.3 Probes for Lysosomes, Peroxisomes and Yeast Vacuoles
Table 12.3 Summary of our LysoTracker® and LysoSensor™ probes.
Cat. No. Probe Abs * (nm) Em * (nm) pKa
LysoTracker® Probes
L7525 LysoTracker® Blue DND-22 373 422 ND
L12491 LysoTracker® Yellow HCK-123 465 535 ND
L7526 LysoTracker® Green DND-26 504 511 ND
L7528 LysoTracker® Red DND-99 577 590 ND
LysoSensor™ Probes
L7533 LysoSensor™ Blue DND-167 373 425 5.1
L7535 LysoSensor™ Green DND-189 443 505 5.2
L7534 LysoSensor™ Green DND-153 442 505 7.5
L7545 LysoSensor™ Yellow/Blue DND-160 384329
540 †440 ‡
3.9
L22460 LysoSensor™ Yellow/Blue 10,000 MW dextran 381335
521 †452 ‡
4.2
* Absorption (Abs) and �uorescence emission (Em) maxima, determined in aqueous bu�er or methanol; values may vary somewhat in cellular environments. † At pH 3. ‡ At pH 7; this dye has pH-dependent dual-excitation and dual-emission peaks. ND = Not determined.
Figure 12.3.2 Bovine pulmonary artery endothelial cells simultaneously stained with LysoTracker® Red DND-99 (L7528), a cell-permeant, �xable lysosomal stain, and with 5-(penta�uorobenzoylamino)�uorescein di-β-D-galactopyranoside (PFB-FDG, P11948), a �uorogenic substrate for β-galactosidase. PFB-FDG is non�uorescent until enzymatically hydrolyzed to green-�uorescent PFB-F. The center image demonstrates colocalization of the LysoTracker® Red DND-99 dye and PFB-F to the lyso-somes. The left image was acquired with a bandpass �lter set appropriate for �uorescein, the right image was acquired with a bandpass �lter set appropriate for Texas Red® dye, and the center image was acquired with a double bandpass optical �lter set appropriate for �uorescein and the Texas Red® dye.
Figure 12.3.1 Normalized �uorescence emission spectra of 1) LysoTracker® Blue DND-22 (L7525), 2) LysoTracker® Green DND-26 (L7526) and 3) LysoTracker® Red DND-99 (L7528) in aqueous solutions, pH 6.0.
321
Fluo
resc
ence
em
issi
on
Wavelength (nm)400 500 600 700
Figure 12.3.3 Bovine pulmonary artery endothelial cells (BPAEC) incubated simultaneously with 50 nM LysoTracker® Red DND-99 (L7528) and 75 nM MitoTracker® Green FM® (M7514) at 37°C for 30 minutes. Both dyes showed excellent cellular retention, even after cells were �xed in 3% glutaraldehyde for 30 minutes. The image was deconvolved using Huygens soft-ware (Scienti�c Volume Imaging, http://www.svi.nl/).
Figure 12.3.4 Live bovine pulmonary artery endothe-lial cells (BPAEC) were �rst stained with LysoTracker® Red DND-99 (L7528). Then, a solution of dihydrorhodamine 123 (D632, D23806) and Hoechst 33258 (H1398, H3569, H21491) was added and allowed to incubate with the cells for an additional 10 minutes before the cells were subsequently washed and visualized. The green-�uorescent oxidation product (rhodamine 123, R302) localized primarily to the mitochondria. The red-�uorescent LysoTracker® Red DND-99 stain accumulated in the lysosomes, and the blue-�uo-rescent Hoechst 33258 dye stained the nuclei. The image was acquired with �lters appropriate for DAPI, �uorescein and the Texas Red® dye. The image was deconvolved using Huygens software (Scienti�c Volume Imaging, http://www.svi.nl/). 3D reconstruction was performed using Imaris soft-ware (Bitplane AG, http://www.bitplane.com/).
Figure 12.3.5 Rat �broblasts stained with LysoTracker® Yellow HCK-123 (L12491) and LysoTracker® Red DND-99 (L7528). The lysosomes �uoresce green when visualized through a bandpass �lter set appropriate for �uorescein (right image) and red when visualized through a longpass �lter set appropriate for rhodamine (left image).
integrity in cryopreserved bovine spermatozoa.13 �is LysoTracker® probe also proved useful in a continuous assay for the secretion of pulmonary surfactant by exocytosis of lamellar bodies.14 LysoTracker® Red DND-99 provided researchers with a probe for examining lysosome damage in Trypanosoma brucei a�er speci�c uptake of cytokine tumor necrosis factor-α,15 for studying apoptosis in organogenesis-stage mouse embryos 16 and for determining the subcellular localiza-tion of receptor and channel proteins.17–19
The Molecular Probes™ Handbook: A Guide to Fluorescent Probes and Labeling Technologies
IMPORTANT NOTICE : The products described in this manual are covered by one or more Limited Use Label License(s). Please refer to the Appendix on page 971 and Master Product List on page 975. Products are For Research Use Only. Not intended for any animal or human therapeutic or diagnostic use.
thermofisher.com/probes
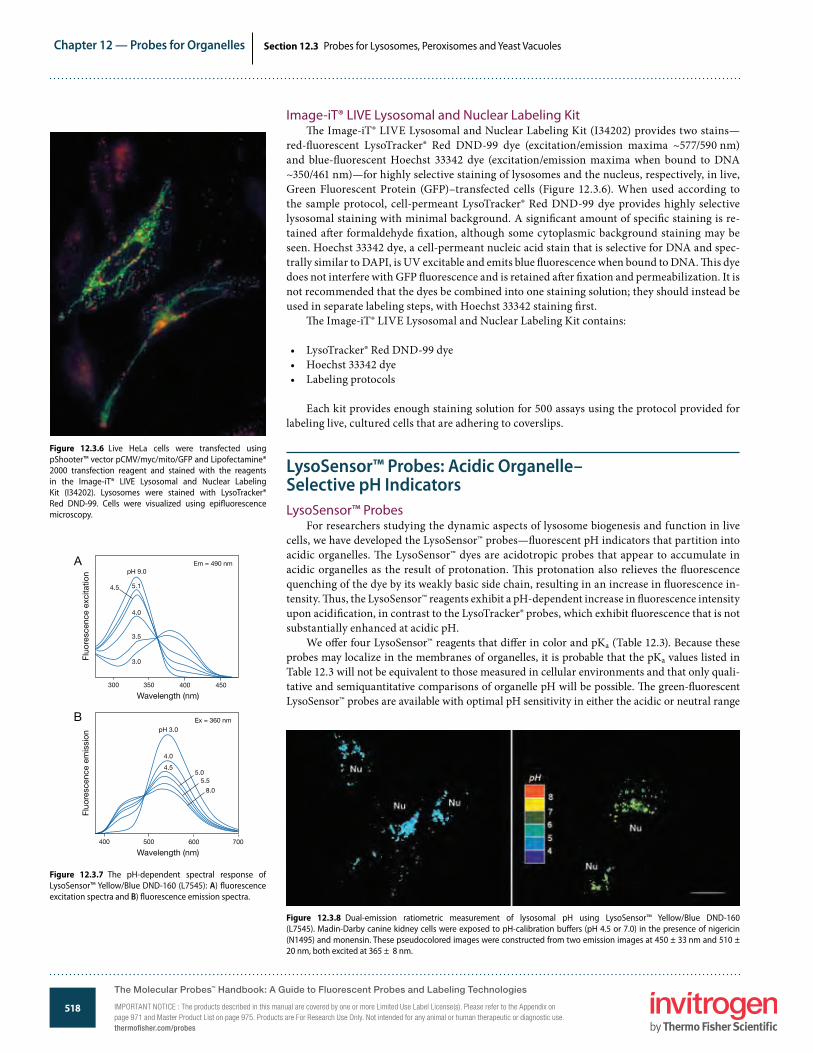
518
Chapter 12 — Probes for Organelles
www.invitrogen.com/probes
The Molecular Probes® Handbook: A Guide to Fluorescent Probes and Labeling TechnologiesIMPORTANT NOTICE: The products described in this manual are covered by one or more Limited Use Label License(s). Please refer to the Appendix on page 971 and Master Product List on page 975. Products are For Research Use Only. Not intended for any animal or human therapeutic or diagnostic use.
Section 12.3 Probes for Lysosomes, Peroxisomes and Yeast Vacuoles
Image-iT® LIVE Lysosomal and Nuclear Labeling Kit�e Image-iT® LIVE Lysosomal and Nuclear Labeling Kit (I34202) provides two stains—
red-�uorescent LysoTracker® Red DND-99 dye (excitation/emission maxima ~577/590 nm) and blue-�uorescent Hoechst 33342 dye (excitation/emission maxima when bound to DNA ~350/461 nm)—for highly selective staining of lysosomes and the nucleus, respectively, in live, Green Fluorescent Protein (GFP)–transfected cells (Figure 12.3.6). When used according to the sample protocol, cell-permeant LysoTracker® Red DND-99 dye provides highly selective lysosomal staining with minimal background. A signi�cant amount of speci�c staining is re-tained a�er formaldehyde �xation, although some cytoplasmic background staining may be seen. Hoechst 33342 dye, a cell-permeant nucleic acid stain that is selective for DNA and spec-trally similar to DAPI, is UV excitable and emits blue �uorescence when bound to DNA. �is dye does not interfere with GFP �uorescence and is retained a�er �xation and permeabilization. It is not recommended that the dyes be combined into one staining solution; they should instead be used in separate labeling steps, with Hoechst 33342 staining �rst.
�e Image-iT® LIVE Lysosomal and Nuclear Labeling Kit contains:
• LysoTracker® Red DND-99 dye• Hoechst 33342 dye• Labeling protocols
Each kit provides enough staining solution for 500 assays using the protocol provided for labeling live, cultured cells that are adhering to coverslips.
LysoSensor™ Probes: Acidic Organelle–Selective pH IndicatorsLysoSensor™ Probes
For researchers studying the dynamic aspects of lysosome biogenesis and function in live cells, we have developed the LysoSensor™ probes—�uorescent pH indicators that partition into acidic organelles. �e LysoSensor™ dyes are acidotropic probes that appear to accumulate in acidic organelles as the result of protonation. �is protonation also relieves the �uorescence quenching of the dye by its weakly basic side chain, resulting in an increase in �uorescence in-tensity. �us, the LysoSensor™ reagents exhibit a pH-dependent increase in �uorescence intensity upon acidi�cation, in contrast to the LysoTracker® probes, which exhibit �uorescence that is not substantially enhanced at acidic pH.
We o�er four LysoSensor™ reagents that di�er in color and pKa (Table 12.3). Because these probes may localize in the membranes of organelles, it is probable that the pKa values listed in Table 12.3 will not be equivalent to those measured in cellular environments and that only quali-tative and semiquantitative comparisons of organelle pH will be possible. �e green-�uorescent LysoSensor™ probes are available with optimal pH sensitivity in either the acidic or neutral range
Figure 12.3.6 Live HeLa cells were transfected using pShooter™ vector pCMV/myc/mito/GFP and Lipofectamine® 2000 transfection reagent and stained with the reagents in the Image-iT® LIVE Lysosomal and Nuclear Labeling Kit (I34202). Lysosomes were stained with LysoTracker® Red DND-99. Cells were visualized using epi�uorescence microscopy.
Figure 12.3.7 The pH-dependent spectral response of LysoSensor™ Yellow/Blue DND-160 (L7545): A) �uorescence excitation spectra and B) �uorescence emission spectra.
Ex = 360 nm
Fluo
resc
ence
em
issi
on
Wavelength (nm)400 500 600 700
pH 3.0
4.0
4.55.0
5.5
8.0
Em = 490 nm
Fluo
resc
ence
exc
itatio
n
Wavelength (nm)300 350 400 450
pH 9.0
5.14.5
4.0
3.5
3.0
A
B
Figure 12.3.8 Dual-emission ratiometric measurement of lysosomal pH using LysoSensor™ Yellow/Blue DND-160 (L7545). Madin-Darby canine kidney cells were exposed to pH-calibration bu�ers (pH 4.5 or 7.0) in the presence of nigericin (N1495) and monensin. These pseudocolored images were constructed from two emission images at 450 ± 33 nm and 510 ± 20 nm, both excited at 365 ± 8 nm.
The Molecular Probes™ Handbook: A Guide to Fluorescent Probes and Labeling Technologies
IMPORTANT NOTICE : The products described in this manual are covered by one or more Limited Use Label License(s). Please refer to the Appendix on page 971 and Master Product List on page 975. Products are For Research Use Only. Not intended for any animal or human therapeutic or diagnostic use.thermofisher.com/probes
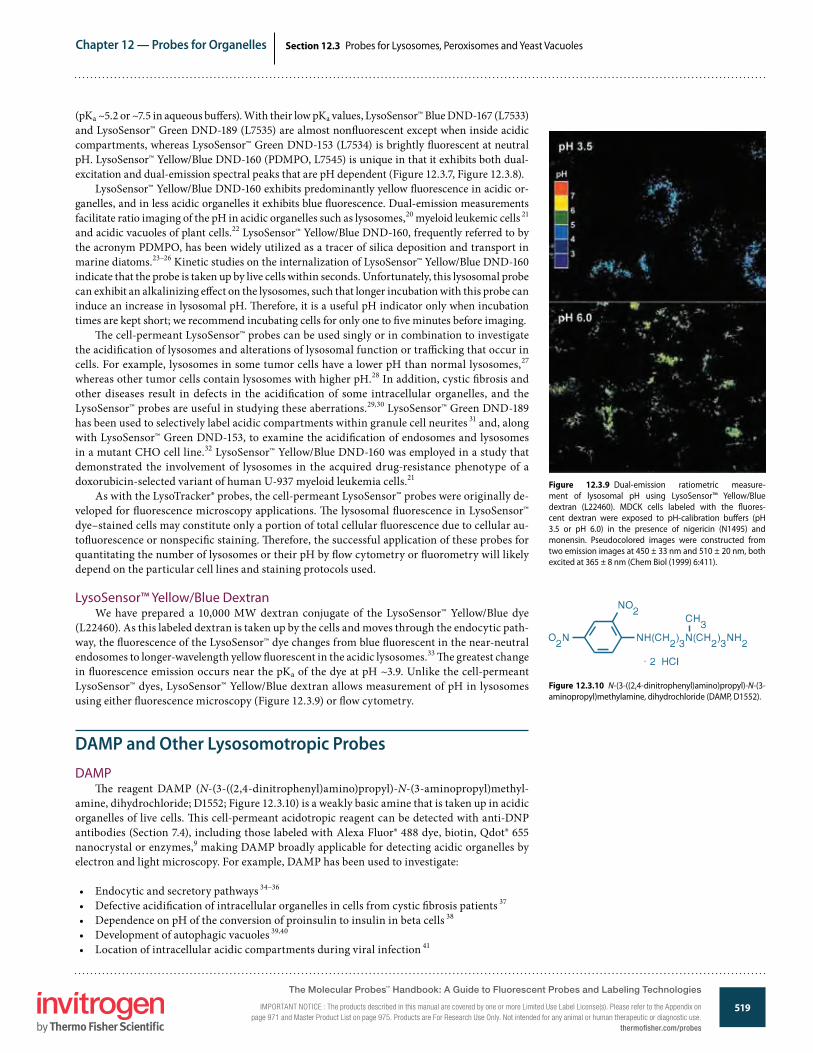
519
Chapter 12 — Probes for Organelles
www.invitrogen.com/probes
The Molecular Probes® Handbook: A Guide to Fluorescent Probes and Labeling TechnologiesIMPORTANT NOTICE: The products described in this manual are covered by one or more Limited Use Label License(s). Please refer to the Appendix on page 971 and Master Product List on page 975. Products are For Research Use Only. Not intended for any animal or human therapeutic or diagnostic use.
Section 12.3 Probes for Lysosomes, Peroxisomes and Yeast Vacuoles
(pKa ~5.2 or ~7.5 in aqueous bu�ers). With their low pKa values, LysoSensor™ Blue DND-167 (L7533) and LysoSensor™ Green DND-189 (L7535) are almost non�uorescent except when inside acidic compartments, whereas LysoSensor™ Green DND-153 (L7534) is brightly �uorescent at neutral pH. LysoSensor™ Yellow/Blue DND-160 (PDMPO, L7545) is unique in that it exhibits both dual-excitation and dual-emission spectral peaks that are pH dependent (Figure 12.3.7, Figure 12.3.8).
LysoSensor™ Yellow/Blue DND-160 exhibits predominantly yellow �uorescence in acidic or-ganelles, and in less acidic organelles it exhibits blue �uorescence. Dual-emission measurements facilitate ratio imaging of the pH in acidic organelles such as lysosomes,20 myeloid leukemic cells 21 and acidic vacuoles of plant cells.22 LysoSensor™ Yellow/Blue DND-160, frequently referred to by the acronym PDMPO, has been widely utilized as a tracer of silica deposition and transport in marine diatoms.23–26 Kinetic studies on the internalization of LysoSensor™ Yellow/Blue DND-160 indicate that the probe is taken up by live cells within seconds. Unfortunately, this lysosomal probe can exhibit an alkalinizing e�ect on the lysosomes, such that longer incubation with this probe can induce an increase in lysosomal pH. �erefore, it is a useful pH indicator only when incubation times are kept short; we recommend incubating cells for only one to �ve minutes before imaging.
�e cell-permeant LysoSensor™ probes can be used singly or in combination to investigate the acidi�cation of lysosomes and alterations of lysosomal function or tra�cking that occur in cells. For example, lysosomes in some tumor cells have a lower pH than normal lysosomes,27 whereas other tumor cells contain lysosomes with higher pH.28 In addition, cystic �brosis and other diseases result in defects in the acidi�cation of some intracellular organelles, and the LysoSensor™ probes are useful in studying these aberrations.29,30 LysoSensor™ Green DND-189 has been used to selectively label acidic compartments within granule cell neurites 31 and, along with LysoSensor™ Green DND-153, to examine the acidi�cation of endosomes and lysosomes in a mutant CHO cell line.32 LysoSensor™ Yellow/Blue DND-160 was employed in a study that demonstrated the involvement of lysosomes in the acquired drug-resistance phenotype of a doxorubicin-selected variant of human U-937 myeloid leukemia cells.21
As with the LysoTracker® probes, the cell-permeant LysoSensor™ probes were originally de-veloped for �uorescence microscopy applications. �e lysosomal �uorescence in LysoSensor™ dye–stained cells may constitute only a portion of total cellular �uorescence due to cellular au-to�uorescence or nonspeci�c staining. �erefore, the successful application of these probes for quantitating the number of lysosomes or their pH by �ow cytometry or �uorometry will likely depend on the particular cell lines and staining protocols used.
LysoSensor™ Yellow/Blue DextranWe have prepared a 10,000 MW dextran conjugate of the LysoSensor™ Yellow/Blue dye
(L22460). As this labeled dextran is taken up by the cells and moves through the endocytic path-way, the �uorescence of the LysoSensor™ dye changes from blue �uorescent in the near-neutral endosomes to longer-wavelength yellow �uorescent in the acidic lysosomes.33 �e greatest change in �uorescence emission occurs near the pKa of the dye at pH ~3.9. Unlike the cell-permeant LysoSensor™ dyes, LysoSensor™ Yellow/Blue dextran allows measurement of pH in lysosomes using either �uorescence microscopy (Figure 12.3.9) or �ow cytometry.
DAMP and Other Lysosomotropic ProbesDAMP
�e reagent DAMP (N-(3-((2,4-dinitrophenyl)amino)propyl)-N-(3-aminopropyl)methyl-amine, dihydrochloride; D1552; Figure 12.3.10) is a weakly basic amine that is taken up in acidic organelles of live cells. �is cell-permeant acidotropic reagent can be detected with anti-DNP antibodies (Section 7.4), including those labeled with Alexa Fluor® 488 dye, biotin, Qdot® 655 nanocrystal or enzymes,9 making DAMP broadly applicable for detecting acidic organelles by electron and light microscopy. For example, DAMP has been used to investigate:
• Endocytic and secretory pathways 34–36
• Defective acidi�cation of intracellular organelles in cells from cystic �brosis patients 37
• Dependence on pH of the conversion of proinsulin to insulin in beta cells 38
• Development of autophagic vacuoles 39,40
• Location of intracellular acidic compartments during viral infection 41
Figure 12.3.9 Dual-emission ratiometric measure-ment of lysosomal pH using LysoSensor™ Yellow/Blue dextran (L22460). MDCK cells labeled with the �uores-cent dextran were exposed to pH-calibration bu�ers (pH 3.5 or pH 6.0) in the presence of nigericin (N1495) and monensin. Pseudocolored images were constructed from two emission images at 450 ± 33 nm and 510 ± 20 nm, both excited at 365 ± 8 nm (Chem Biol (1999) 6:411).
Figure 12.3.10 N-(3-((2,4-dinitrophenyl)amino)propyl)-N-(3-aminopropyl)methylamine, dihydrochloride (DAMP, D1552).
The Molecular Probes™ Handbook: A Guide to Fluorescent Probes and Labeling Technologies
IMPORTANT NOTICE : The products described in this manual are covered by one or more Limited Use Label License(s). Please refer to the Appendix on page 971 and Master Product List on page 975. Products are For Research Use Only. Not intended for any animal or human therapeutic or diagnostic use.
thermofisher.com/probes
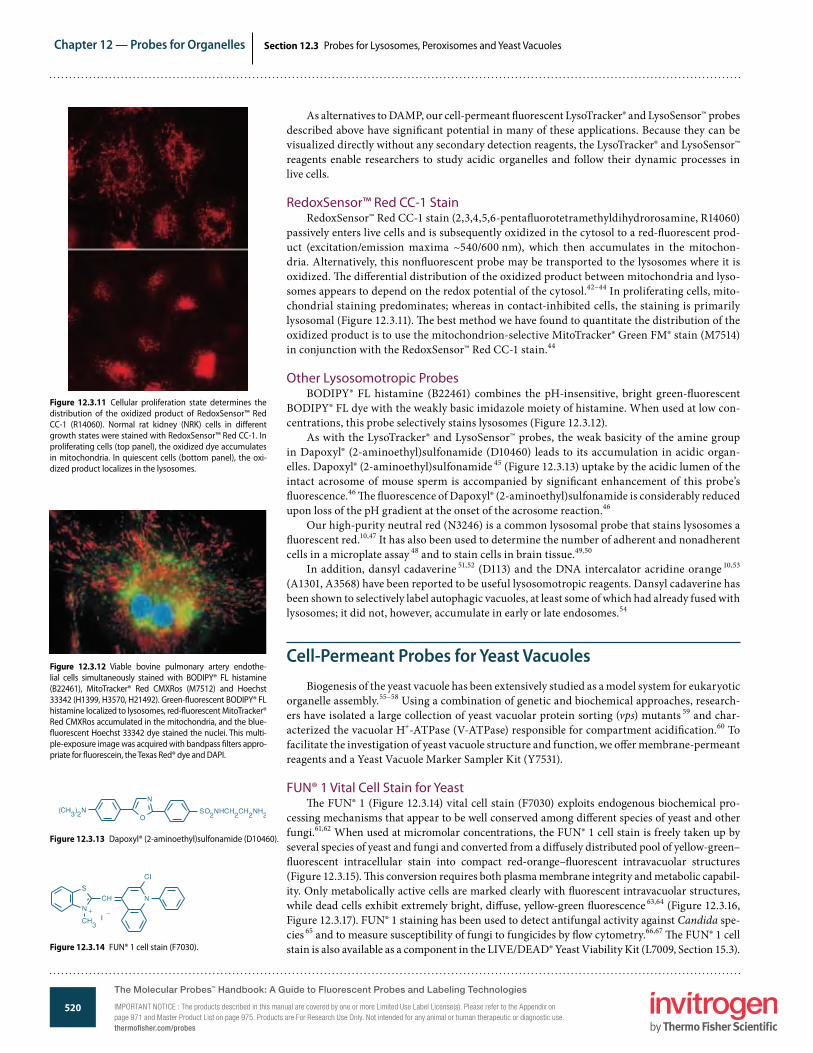
520
Chapter 12 — Probes for Organelles
www.invitrogen.com/probes
The Molecular Probes® Handbook: A Guide to Fluorescent Probes and Labeling TechnologiesIMPORTANT NOTICE: The products described in this manual are covered by one or more Limited Use Label License(s). Please refer to the Appendix on page 971 and Master Product List on page 975. Products are For Research Use Only. Not intended for any animal or human therapeutic or diagnostic use.
Section 12.3 Probes for Lysosomes, Peroxisomes and Yeast Vacuoles
As alternatives to DAMP, our cell-permeant �uorescent LysoTracker® and LysoSensor™ probes described above have signi�cant potential in many of these applications. Because they can be visualized directly without any secondary detection reagents, the LysoTracker® and LysoSensor™ reagents enable researchers to study acidic organelles and follow their dynamic processes in live cells.
RedoxSensor™ Red CC-1 StainRedoxSensor™ Red CC-1 stain (2,3,4,5,6-penta�uorotetramethyldihydrorosamine, R14060)
passively enters live cells and is subsequently oxidized in the cytosol to a red-�uorescent prod-uct (excitation/emission maxima ~540/600 nm), which then accumulates in the mitochon-dria. Alternatively, this non�uorescent probe may be transported to the lysosomes where it is oxidized. �e di�erential distribution of the oxidized product between mitochondria and lyso-somes appears to depend on the redox potential of the cytosol.42–44 In proliferating cells, mito-chondrial staining predominates; whereas in contact-inhibited cells, the staining is primarily lysosomal (Figure 12.3.11). �e best method we have found to quantitate the distribution of the oxidized product is to use the mitochondrion-selective MitoTracker® Green FM® stain (M7514) in conjunction with the RedoxSensor™ Red CC-1 stain.44
Other Lysosomotropic ProbesBODIPY® FL histamine (B22461) combines the pH-insensitive, bright green-�uorescent
BODIPY® FL dye with the weakly basic imidazole moiety of histamine. When used at low con-centrations, this probe selectively stains lysosomes (Figure 12.3.12).
As with the LysoTracker® and LysoSensor™ probes, the weak basicity of the amine group in Dapoxyl® (2-aminoethyl)sulfonamide (D10460) leads to its accumulation in acidic organ-elles. Dapoxyl® (2-aminoethyl)sulfonamide 45 (Figure 12.3.13) uptake by the acidic lumen of the intact acrosome of mouse sperm is accompanied by signi�cant enhancement of this probe’s �uorescence.46 �e �uorescence of Dapoxyl® (2-aminoethyl)sulfonamide is considerably reduced upon loss of the pH gradient at the onset of the acrosome reaction.46
Our high-purity neutral red (N3246) is a common lysosomal probe that stains lysosomes a �uorescent red.10,47 It has also been used to determine the number of adherent and nonadherent cells in a microplate assay 48 and to stain cells in brain tissue.49,50
In addition, dansyl cadaverine 51,52 (D113) and the DNA intercalator acridine orange 10,53 (A1301, A3568) have been reported to be useful lysosomotropic reagents. Dansyl cadaverine has been shown to selectively label autophagic vacuoles, at least some of which had already fused with lysosomes; it did not, however, accumulate in early or late endosomes.54
Cell-Permeant Probes for Yeast VacuolesBiogenesis of the yeast vacuole has been extensively studied as a model system for eukaryotic
organelle assembly.55–58 Using a combination of genetic and biochemical approaches, research-ers have isolated a large collection of yeast vacuolar protein sorting (vps) mutants 59 and char-acterized the vacuolar H+-ATPase (V-ATPase) responsible for compartment acidi�cation.60 To facilitate the investigation of yeast vacuole structure and function, we o�er membrane-permeant reagents and a Yeast Vacuole Marker Sampler Kit (Y7531).
FUN® 1 Vital Cell Stain for Yeast�e FUN® 1 (Figure 12.3.14) vital cell stain (F7030) exploits endogenous biochemical pro-
cessing mechanisms that appear to be well conserved among di�erent species of yeast and other fungi.61,62 When used at micromolar concentrations, the FUN® 1 cell stain is freely taken up by several species of yeast and fungi and converted from a di�usely distributed pool of yellow-green–�uorescent intracellular stain into compact red-orange–�uorescent intravacuolar structures (Figure 12.3.15). �is conversion requires both plasma membrane integrity and metabolic capabil-ity. Only metabolically active cells are marked clearly with �uorescent intravacuolar structures, while dead cells exhibit extremely bright, di�use, yellow-green �uorescence 63,64 (Figure 12.3.16, Figure 12.3.17). FUN® 1 staining has been used to detect antifungal activity against Candida spe-cies 65 and to measure susceptibility of fungi to fungicides by �ow cytometry.66,67 �e FUN® 1 cell stain is also available as a component in the LIVE/DEAD® Yeast Viability Kit (L7009, Section 15.3).
Figure 12.3.13 Dapoxyl® (2-aminoethyl)sulfonamide (D10460).
Figure 12.3.12 Viable bovine pulmonary artery endothe-lial cells simultaneously stained with BODIPY® FL histamine (B22461), MitoTracker® Red CMXRos (M7512) and Hoechst 33342 (H1399, H3570, H21492). Green-�uorescent BODIPY® FL histamine localized to lysosomes, red-�uorescent MitoTracker® Red CMXRos accumulated in the mitochondria, and the blue-�uorescent Hoechst 33342 dye stained the nuclei. This multi-ple-exposure image was acquired with bandpass �lters appro-priate for �uorescein, the Texas Red® dye and DAPI.
Figure 12.3.11 Cellular proliferation state determines the distribution of the oxidized product of RedoxSensor™ Red CC-1 (R14060). Normal rat kidney (NRK) cells in di�erent growth states were stained with RedoxSensor™ Red CC-1. In proliferating cells (top panel), the oxidized dye accumulates in mitochondria. In quiescent cells (bottom panel), the oxi-dized product localizes in the lysosomes.
Figure 12.3.14 FUN® 1 cell stain (F7030).
The Molecular Probes™ Handbook: A Guide to Fluorescent Probes and Labeling Technologies
IMPORTANT NOTICE : The products described in this manual are covered by one or more Limited Use Label License(s). Please refer to the Appendix on page 971 and Master Product List on page 975. Products are For Research Use Only. Not intended for any animal or human therapeutic or diagnostic use.thermofisher.com/probes
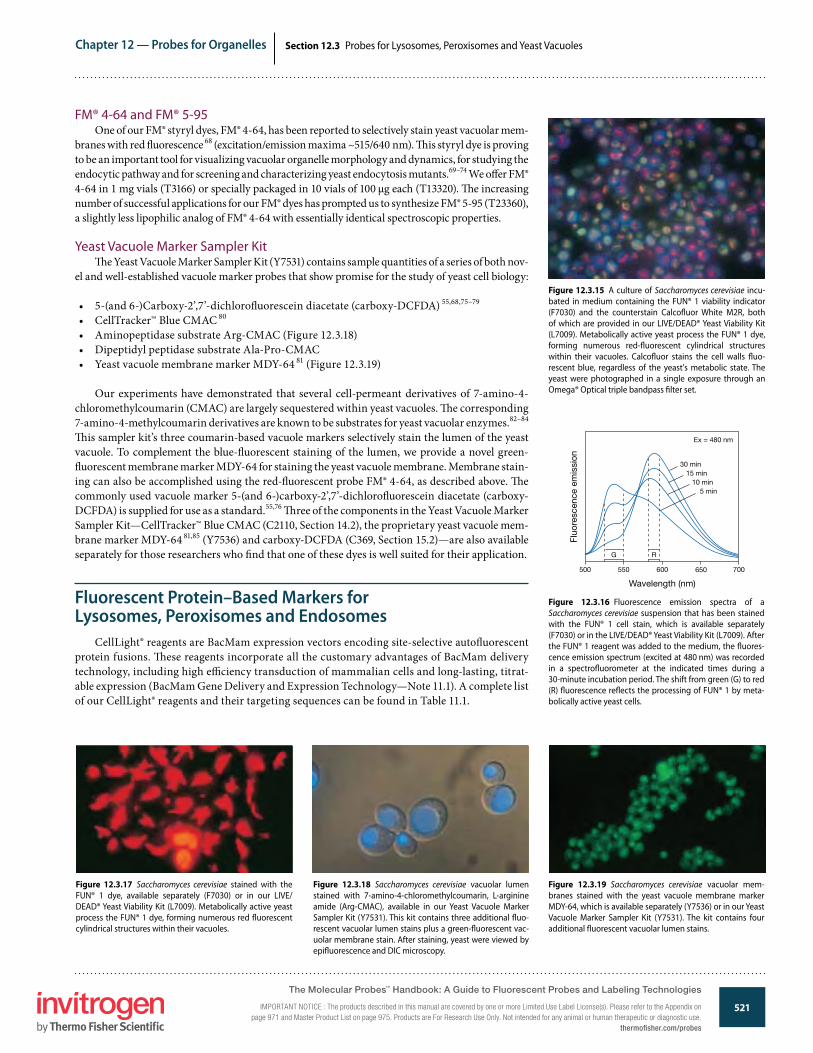
521
Chapter 12 — Probes for Organelles
www.invitrogen.com/probes
The Molecular Probes® Handbook: A Guide to Fluorescent Probes and Labeling TechnologiesIMPORTANT NOTICE: The products described in this manual are covered by one or more Limited Use Label License(s). Please refer to the Appendix on page 971 and Master Product List on page 975. Products are For Research Use Only. Not intended for any animal or human therapeutic or diagnostic use.
Section 12.3 Probes for Lysosomes, Peroxisomes and Yeast Vacuoles
FM® 4-64 and FM® 5-95One of our FM® styryl dyes, FM® 4-64, has been reported to selectively stain yeast vacuolar mem-
branes with red �uorescence 68 (excitation/emission maxima ~515/640 nm). �is styryl dye is proving to be an important tool for visualizing vacuolar organelle morphology and dynamics, for studying the endocytic pathway and for screening and characterizing yeast endocytosis mutants.69–74 We o�er FM® 4-64 in 1 mg vials (T3166) or specially packaged in 10 vials of 100 µg each (T13320). �e increasing number of successful applications for our FM® dyes has prompted us to synthesize FM® 5-95 (T23360), a slightly less lipophilic analog of FM® 4-64 with essentially identical spectroscopic properties.
Yeast Vacuole Marker Sampler Kit�e Yeast Vacuole Marker Sampler Kit (Y7531) contains sample quantities of a series of both nov-
el and well-established vacuole marker probes that show promise for the study of yeast cell biology:
• 5-(and 6-)Carboxy-2’,7’-dichloro�uorescein diacetate (carboxy-DCFDA) 55,68,75–79
• CellTracker™ Blue CMAC 80
• Aminopeptidase substrate Arg-CMAC (Figure 12.3.18)• Dipeptidyl peptidase substrate Ala-Pro-CMAC• Yeast vacuole membrane marker MDY-64 81 (Figure 12.3.19)
Our experiments have demonstrated that several cell-permeant derivatives of 7-amino-4-chloromethylcoumarin (CMAC) are largely sequestered within yeast vacuoles. �e corresponding 7-amino-4-methylcoumarin derivatives are known to be substrates for yeast vacuolar enzymes.82–84 �is sampler kit’s three coumarin-based vacuole markers selectively stain the lumen of the yeast vacuole. To complement the blue-�uorescent staining of the lumen, we provide a novel green-�uorescent membrane marker MDY-64 for staining the yeast vacuole membrane. Membrane stain-ing can also be accomplished using the red-�uorescent probe FM® 4-64, as described above. �e commonly used vacuole marker 5-(and 6-)carboxy-2’,7’-dichloro�uorescein diacetate (carboxy-DCFDA) is supplied for use as a standard.55,76 �ree of the components in the Yeast Vacuole Marker Sampler Kit—CellTracker™ Blue CMAC (C2110, Section 14.2), the proprietary yeast vacuole mem-brane marker MDY-64 81,85 (Y7536) and carboxy-DCFDA (C369, Section 15.2)—are also available separately for those researchers who �nd that one of these dyes is well suited for their application.
Fluorescent Protein–Based Markers for Lysosomes, Peroxisomes and Endosomes
CellLight® reagents are BacMam expression vectors encoding site-selective auto�uorescent protein fusions. �ese reagents incorporate all the customary advantages of BacMam delivery technology, including high e�ciency transduction of mammalian cells and long-lasting, titrat-able expression (BacMam Gene Delivery and Expression Technology—Note 11.1). A complete list of our CellLight® reagents and their targeting sequences can be found in Table 11.1.
Figure 12.3.15 A culture of Saccharomyces cerevisiae incu-bated in medium containing the FUN® 1 viability indicator (F7030) and the counterstain Calco�uor White M2R, both of which are provided in our LIVE/DEAD® Yeast Viability Kit (L7009). Metabolically active yeast process the FUN® 1 dye, forming numerous red-�uorescent cylindrical structures within their vacuoles. Calco�uor stains the cell walls �uo-rescent blue, regardless of the yeast's metabolic state. The yeast were photographed in a single exposure through an Omega® Optical triple bandpass �lter set.
Figure 12.3.16 Fluorescence emission spectra of a Saccharomyces cerevisiae suspension that has been stained with the FUN® 1 cell stain, which is available separately (F7030) or in the LIVE/DEAD® Yeast Viability Kit (L7009). After the FUN® 1 reagent was added to the medium, the �uores-cence emission spectrum (excited at 480 nm) was recorded in a spectro�uorometer at the indicated times during a 30-minute incubation period. The shift from green (G) to red (R) �uorescence re�ects the processing of FUN® 1 by meta-bolically active yeast cells.
500 550 600 650 700
Ex = 480 nm
Wavelength (nm)Fl
uore
scen
ce e
mis
sion
30 min15 min
10 min5 min
G R
Figure 12.3.19 Saccharomyces cerevisiae vacuolar mem-branes stained with the yeast vacuole membrane marker MDY-64, which is available separately (Y7536) or in our Yeast Vacuole Marker Sampler Kit (Y7531). The kit contains four additional �uorescent vacuolar lumen stains.
Figure 12.3.18 Saccharomyces cerevisiae vacuolar lumen stained with 7-amino-4-chloromethylcoumarin, L-arginine amide (Arg-CMAC), available in our Yeast Vacuole Marker Sampler Kit (Y7531). This kit contains three additional �uo-rescent vacuolar lumen stains plus a green-�uorescent vac-uolar membrane stain. After staining, yeast were viewed by epi�uorescence and DIC microscopy.
Figure 12.3.17 Saccharomyces cerevisiae stained with the FUN® 1 dye, available separately (F7030) or in our LIVE/DEAD® Yeast Viability Kit (L7009). Metabolically active yeast process the FUN® 1 dye, forming numerous red �uorescent cylindrical structures within their vacuoles.
The Molecular Probes™ Handbook: A Guide to Fluorescent Probes and Labeling Technologies
IMPORTANT NOTICE : The products described in this manual are covered by one or more Limited Use Label License(s). Please refer to the Appendix on page 971 and Master Product List on page 975. Products are For Research Use Only. Not intended for any animal or human therapeutic or diagnostic use.
thermofisher.com/probes
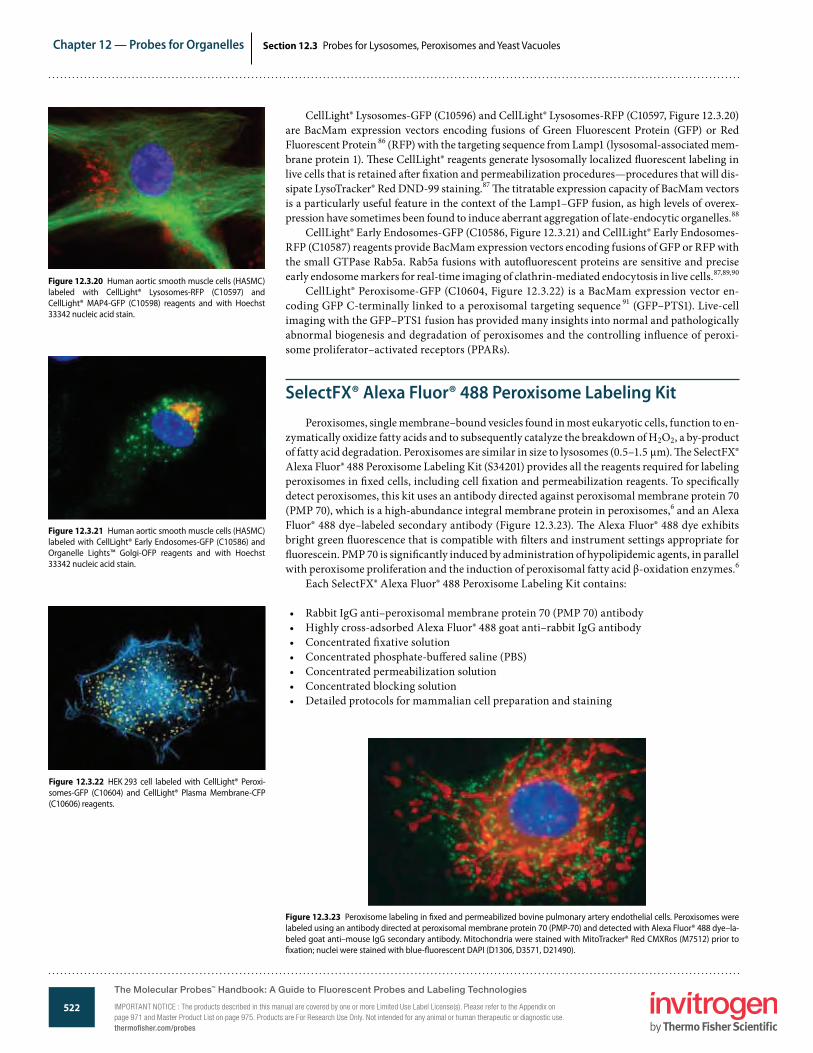
522
Chapter 12 — Probes for Organelles
www.invitrogen.com/probes
The Molecular Probes® Handbook: A Guide to Fluorescent Probes and Labeling TechnologiesIMPORTANT NOTICE: The products described in this manual are covered by one or more Limited Use Label License(s). Please refer to the Appendix on page 971 and Master Product List on page 975. Products are For Research Use Only. Not intended for any animal or human therapeutic or diagnostic use.
Section 12.3 Probes for Lysosomes, Peroxisomes and Yeast Vacuoles
CellLight® Lysosomes-GFP (C10596) and CellLight® Lysosomes-RFP (C10597, Figure 12.3.20) are BacMam expression vectors encoding fusions of Green Fluorescent Protein (GFP) or Red Fluorescent Protein 86 (RFP) with the targeting sequence from Lamp1 (lysosomal-associated mem-brane protein 1). �ese CellLight® reagents generate lysosomally localized �uorescent labeling in live cells that is retained a�er �xation and permeabilization procedures—procedures that will dis-sipate LysoTracker® Red DND-99 staining.87 �e titratable expression capacity of BacMam vectors is a particularly useful feature in the context of the Lamp1–GFP fusion, as high levels of overex-pression have sometimes been found to induce aberrant aggregation of late-endocytic organelles.88
CellLight® Early Endosomes-GFP (C10586, Figure 12.3.21) and CellLight® Early Endosomes-RFP (C10587) reagents provide BacMam expression vectors encoding fusions of GFP or RFP with the small GTPase Rab5a. Rab5a fusions with auto�uorescent proteins are sensitive and precise early endosome markers for real-time imaging of clathrin-mediated endocytosis in live cells.87,89,90
CellLight® Peroxisome-GFP (C10604, Figure 12.3.22) is a BacMam expression vector en-coding GFP C-terminally linked to a peroxisomal targeting sequence 91 (GFP–PTS1). Live-cell imaging with the GFP–PTS1 fusion has provided many insights into normal and pathologically abnormal biogenesis and degradation of peroxisomes and the controlling in�uence of peroxi-some proliferator–activated receptors (PPARs).
SelectFX® Alexa Fluor® 488 Peroxisome Labeling KitPeroxisomes, single membrane–bound vesicles found in most eukaryotic cells, function to en-
zymatically oxidize fatty acids and to subsequently catalyze the breakdown of H2O2, a by-product of fatty acid degradation. Peroxisomes are similar in size to lysosomes (0.5–1.5 µm). �e SelectFX® Alexa Fluor® 488 Peroxisome Labeling Kit (S34201) provides all the reagents required for labeling peroxisomes in �xed cells, including cell �xation and permeabilization reagents. To speci�cally detect peroxisomes, this kit uses an antibody directed against peroxisomal membrane protein 70 (PMP 70), which is a high-abundance integral membrane protein in peroxisomes,6 and an Alexa Fluor® 488 dye–labeled secondary antibody (Figure 12.3.23). �e Alexa Fluor® 488 dye exhibits bright green �uorescence that is compatible with �lters and instrument settings appropriate for �uorescein. PMP 70 is signi�cantly induced by administration of hypolipidemic agents, in parallel with peroxisome proliferation and the induction of peroxisomal fatty acid β-oxidation enzymes.6
Each SelectFX® Alexa Fluor® 488 Peroxisome Labeling Kit contains:
• Rabbit IgG anti–peroxisomal membrane protein 70 (PMP 70) antibody• Highly cross-adsorbed Alexa Fluor® 488 goat anti–rabbit IgG antibody• Concentrated �xative solution• Concentrated phosphate-bu�ered saline (PBS)• Concentrated permeabilization solution• Concentrated blocking solution• Detailed protocols for mammalian cell preparation and staining
Figure 12.3.21 Human aortic smooth muscle cells (HASMC) labeled with CellLight® Early Endosomes-GFP (C10586) and Organelle Lights™ Golgi-OFP reagents and with Hoechst 33342 nucleic acid stain.
Figure 12.3.22 HEK 293 cell labeled with CellLight® Peroxi-somes-GFP (C10604) and CellLight® Plasma Membrane-CFP (C10606) reagents.
Figure 12.3.20 Human aortic smooth muscle cells (HASMC) labeled with CellLight® Lysosomes-RFP (C10597) and CellLight® MAP4-GFP (C10598) reagents and with Hoechst 33342 nucleic acid stain.
Figure 12.3.23 Peroxisome labeling in �xed and permeabilized bovine pulmonary artery endothelial cells. Peroxisomes were labeled using an antibody directed at peroxisomal membrane protein 70 (PMP-70) and detected with Alexa Fluor® 488 dye–la-beled goat anti–mouse IgG secondary antibody. Mitochondria were stained with MitoTracker® Red CMXRos (M7512) prior to �xation; nuclei were stained with blue-�uorescent DAPI (D1306, D3571, D21490).
The Molecular Probes™ Handbook: A Guide to Fluorescent Probes and Labeling Technologies
IMPORTANT NOTICE : The products described in this manual are covered by one or more Limited Use Label License(s). Please refer to the Appendix on page 971 and Master Product List on page 975. Products are For Research Use Only. Not intended for any animal or human therapeutic or diagnostic use.thermofisher.com/probes
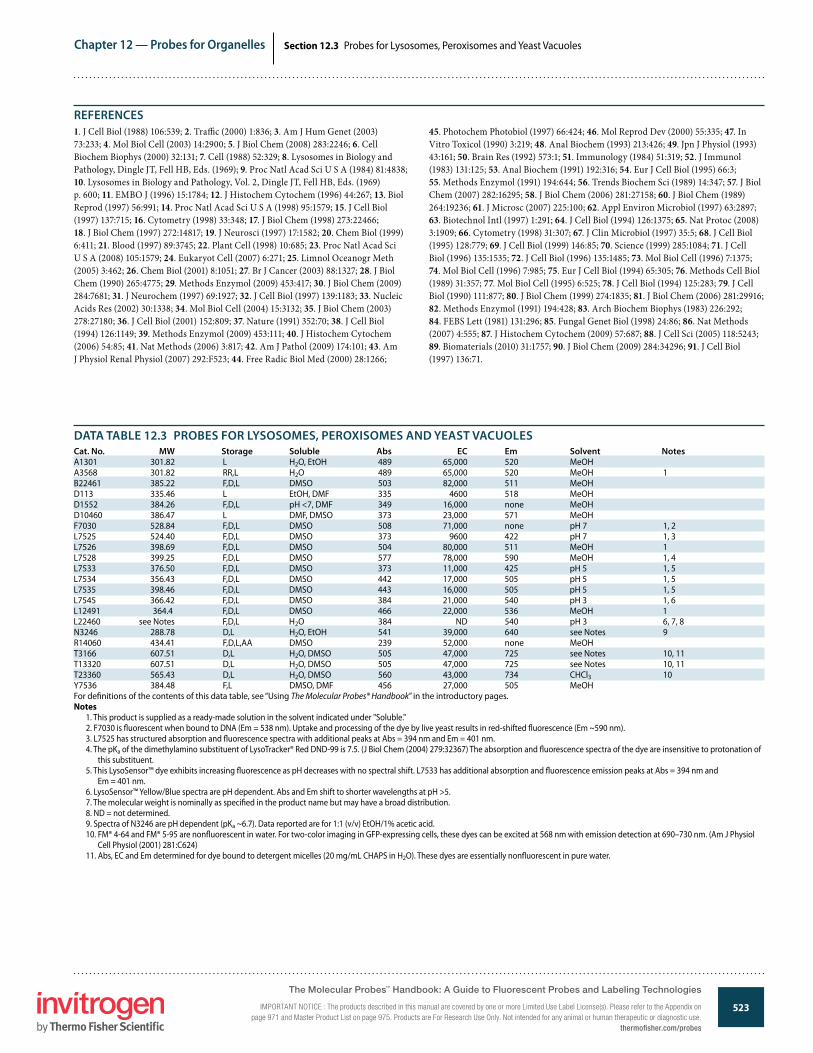
523
Chapter 12 — Probes for Organelles
www.invitrogen.com/probes
The Molecular Probes® Handbook: A Guide to Fluorescent Probes and Labeling TechnologiesIMPORTANT NOTICE: The products described in this manual are covered by one or more Limited Use Label License(s). Please refer to the Appendix on page 971 and Master Product List on page 975. Products are For Research Use Only. Not intended for any animal or human therapeutic or diagnostic use.
Section 12.3 Probes for Lysosomes, Peroxisomes and Yeast Vacuoles
DATA TABLE 12.3 PROBES FOR LYSOSOMES, PEROXISOMES AND YEAST VACUOLESCat. No. MW Storage Soluble Abs EC Em Solvent NotesA1301 301.82 L H2O, EtOH 489 65,000 520 MeOHA3568 301.82 RR,L H2O 489 65,000 520 MeOH 1B22461 385.22 F,D,L DMSO 503 82,000 511 MeOHD113 335.46 L EtOH, DMF 335 4600 518 MeOHD1552 384.26 F,D,L pH <7, DMF 349 16,000 none MeOHD10460 386.47 L DMF, DMSO 373 23,000 571 MeOHF7030 528.84 F,D,L DMSO 508 71,000 none pH 7 1, 2L7525 524.40 F,D,L DMSO 373 9600 422 pH 7 1, 3L7526 398.69 F,D,L DMSO 504 80,000 511 MeOH 1L7528 399.25 F,D,L DMSO 577 78,000 590 MeOH 1, 4L7533 376.50 F,D,L DMSO 373 11,000 425 pH 5 1, 5L7534 356.43 F,D,L DMSO 442 17,000 505 pH 5 1, 5L7535 398.46 F,D,L DMSO 443 16,000 505 pH 5 1, 5L7545 366.42 F,D,L DMSO 384 21,000 540 pH 3 1, 6L12491 364.4 F,D,L DMSO 466 22,000 536 MeOH 1L22460 see Notes F,D,L H2O 384 ND 540 pH 3 6, 7, 8N3246 288.78 D,L H2O, EtOH 541 39,000 640 see Notes 9R14060 434.41 F,D,L,AA DMSO 239 52,000 none MeOHT3166 607.51 D,L H2O, DMSO 505 47,000 725 see Notes 10, 11T13320 607.51 D,L H2O, DMSO 505 47,000 725 see Notes 10, 11T23360 565.43 D,L H2O, DMSO 560 43,000 734 CHCl3 10Y7536 384.48 F,L DMSO, DMF 456 27,000 505 MeOHFor de�nitions of the contents of this data table, see “Using The Molecular Probes® Handbook” in the introductory pages.Notes
1. This product is supplied as a ready-made solution in the solvent indicated under "Soluble."2. F7030 is �uorescent when bound to DNA (Em = 538 nm). Uptake and processing of the dye by live yeast results in red-shifted �uorescence (Em ~590 nm).3. L7525 has structured absorption and �uorescence spectra with additional peaks at Abs = 394 nm and Em = 401 nm.4. The pKa of the dimethylamino substituent of LysoTracker® Red DND-99 is 7.5. (J Biol Chem (2004) 279:32367) The absorption and �uorescence spectra of the dye are insensitive to protonation of
this substituent.5. This LysoSensor™ dye exhibits increasing �uorescence as pH decreases with no spectral shift. L7533 has additional absorption and �uorescence emission peaks at Abs = 394 nm and
Em = 401 nm.6. LysoSensor™ Yellow/Blue spectra are pH dependent. Abs and Em shift to shorter wavelengths at pH >5.7. The molecular weight is nominally as speci�ed in the product name but may have a broad distribution.8. ND = not determined.9. Spectra of N3246 are pH dependent (pKa ~6.7). Data reported are for 1:1 (v/v) EtOH/1% acetic acid.10. FM® 4-64 and FM® 5-95 are non�uorescent in water. For two-color imaging in GFP-expressing cells, these dyes can be excited at 568 nm with emission detection at 690–730 nm. (Am J Physiol
Cell Physiol (2001) 281:C624)11. Abs, EC and Em determined for dye bound to detergent micelles (20 mg/mL CHAPS in H2O). These dyes are essentially non�uorescent in pure water.
REFERENCES1. J Cell Biol (1988) 106:539; 2. Tra�c (2000) 1:836; 3. Am J Hum Genet (2003) 73:233; 4. Mol Biol Cell (2003) 14:2900; 5. J Biol Chem (2008) 283:2246; 6. Cell Biochem Biophys (2000) 32:131; 7. Cell (1988) 52:329; 8. Lysosomes in Biology and Pathology, Dingle JT, Fell HB, Eds. (1969); 9. Proc Natl Acad Sci U S A (1984) 81:4838; 10. Lysosomes in Biology and Pathology, Vol. 2, Dingle JT, Fell HB, Eds. (1969) p. 600; 11. EMBO J (1996) 15:1784; 12. J Histochem Cytochem (1996) 44:267; 13. Biol Reprod (1997) 56:991; 14. Proc Natl Acad Sci U S A (1998) 95:1579; 15. J Cell Biol (1997) 137:715; 16. Cytometry (1998) 33:348; 17. J Biol Chem (1998) 273:22466; 18. J Biol Chem (1997) 272:14817; 19. J Neurosci (1997) 17:1582; 20. Chem Biol (1999) 6:411; 21. Blood (1997) 89:3745; 22. Plant Cell (1998) 10:685; 23. Proc Natl Acad Sci U S A (2008) 105:1579; 24. Eukaryot Cell (2007) 6:271; 25. Limnol Oceanogr Meth (2005) 3:462; 26. Chem Biol (2001) 8:1051; 27. Br J Cancer (2003) 88:1327; 28. J Biol Chem (1990) 265:4775; 29. Methods Enzymol (2009) 453:417; 30. J Biol Chem (2009) 284:7681; 31. J Neurochem (1997) 69:1927; 32. J Cell Biol (1997) 139:1183; 33. Nucleic Acids Res (2002) 30:1338; 34. Mol Biol Cell (2004) 15:3132; 35. J Biol Chem (2003) 278:27180; 36. J Cell Biol (2001) 152:809; 37. Nature (1991) 352:70; 38. J Cell Biol (1994) 126:1149; 39. Methods Enzymol (2009) 453:111; 40. J Histochem Cytochem (2006) 54:85; 41. Nat Methods (2006) 3:817; 42. Am J Pathol (2009) 174:101; 43. Am J Physiol Renal Physiol (2007) 292:F523; 44. Free Radic Biol Med (2000) 28:1266;
45. Photochem Photobiol (1997) 66:424; 46. Mol Reprod Dev (2000) 55:335; 47. In Vitro Toxicol (1990) 3:219; 48. Anal Biochem (1993) 213:426; 49. Jpn J Physiol (1993) 43:161; 50. Brain Res (1992) 573:1; 51. Immunology (1984) 51:319; 52. J Immunol (1983) 131:125; 53. Anal Biochem (1991) 192:316; 54. Eur J Cell Biol (1995) 66:3; 55. Methods Enzymol (1991) 194:644; 56. Trends Biochem Sci (1989) 14:347; 57. J Biol Chem (2007) 282:16295; 58. J Biol Chem (2006) 281:27158; 60. J Biol Chem (1989) 264:19236; 61. J Microsc (2007) 225:100; 62. Appl Environ Microbiol (1997) 63:2897; 63. Biotechnol Intl (1997) 1:291; 64. J Cell Biol (1994) 126:1375; 65. Nat Protoc (2008) 3:1909; 66. Cytometry (1998) 31:307; 67. J Clin Microbiol (1997) 35:5; 68. J Cell Biol (1995) 128:779; 69. J Cell Biol (1999) 146:85; 70. Science (1999) 285:1084; 71. J Cell Biol (1996) 135:1535; 72. J Cell Biol (1996) 135:1485; 73. Mol Biol Cell (1996) 7:1375; 74. Mol Biol Cell (1996) 7:985; 75. Eur J Cell Biol (1994) 65:305; 76. Methods Cell Biol (1989) 31:357; 77. Mol Biol Cell (1995) 6:525; 78. J Cell Biol (1994) 125:283; 79. J Cell Biol (1990) 111:877; 80. J Biol Chem (1999) 274:1835; 81. J Biol Chem (2006) 281:29916; 82. Methods Enzymol (1991) 194:428; 83. Arch Biochem Biophys (1983) 226:292; 84. FEBS Lett (1981) 131:296; 85. Fungal Genet Biol (1998) 24:86; 86. Nat Methods (2007) 4:555; 87. J Histochem Cytochem (2009) 57:687; 88. J Cell Sci (2005) 118:5243; 89. Biomaterials (2010) 31:1757; 90. J Biol Chem (2009) 284:34296; 91. J Cell Biol (1997) 136:71.
The Molecular Probes™ Handbook: A Guide to Fluorescent Probes and Labeling Technologies
IMPORTANT NOTICE : The products described in this manual are covered by one or more Limited Use Label License(s). Please refer to the Appendix on page 971 and Master Product List on page 975. Products are For Research Use Only. Not intended for any animal or human therapeutic or diagnostic use.
thermofisher.com/probes
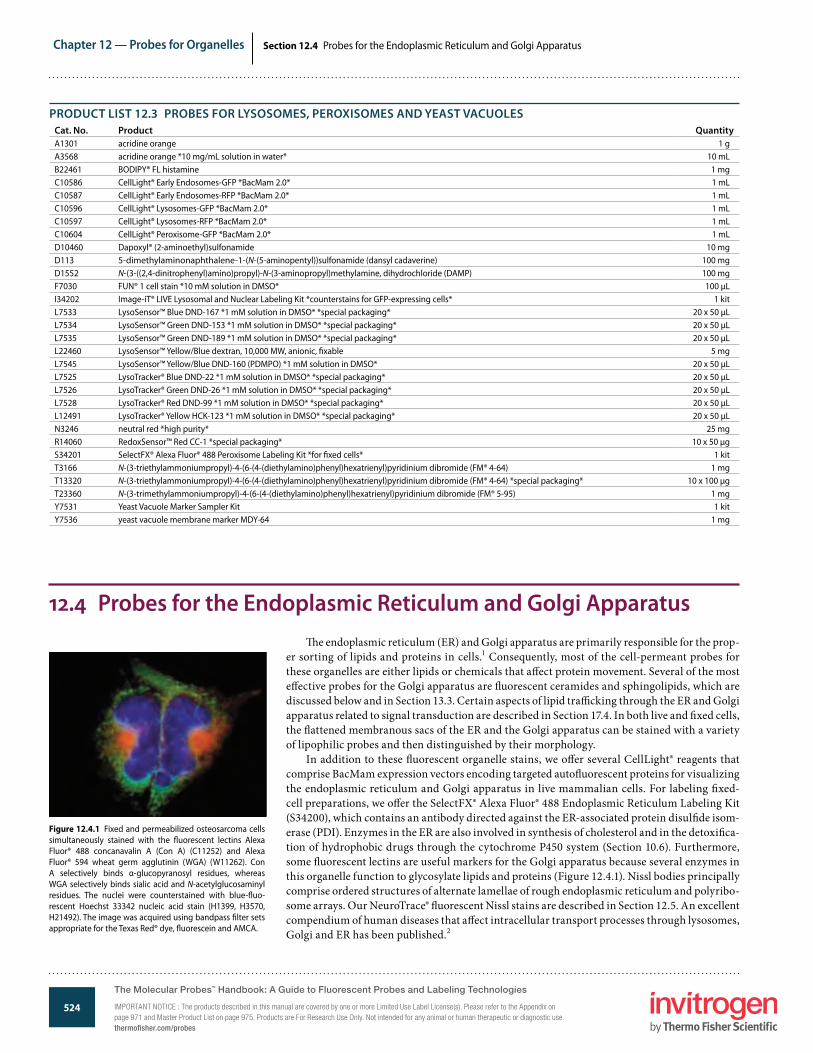
524
Chapter 12 — Probes for Organelles
www.invitrogen.com/probes
The Molecular Probes® Handbook: A Guide to Fluorescent Probes and Labeling TechnologiesIMPORTANT NOTICE: The products described in this manual are covered by one or more Limited Use Label License(s). Please refer to the Appendix on page 971 and Master Product List on page 975. Products are For Research Use Only. Not intended for any animal or human therapeutic or diagnostic use.
Section 12.4 Probes for the Endoplasmic Reticulum and Golgi Apparatus
PRODUCT LIST 12.3 PROBES FOR LYSOSOMES, PEROXISOMES AND YEAST VACUOLES Cat. No. Product QuantityA1301 acridine orange 1 gA3568 acridine orange *10 mg/mL solution in water* 10 mLB22461 BODIPY® FL histamine 1 mgC10586 CellLight® Early Endosomes-GFP *BacMam 2.0* 1 mLC10587 CellLight® Early Endosomes-RFP *BacMam 2.0* 1 mLC10596 CellLight® Lysosomes-GFP *BacMam 2.0* 1 mLC10597 CellLight® Lysosomes-RFP *BacMam 2.0* 1 mLC10604 CellLight® Peroxisome-GFP *BacMam 2.0* 1 mLD10460 Dapoxyl® (2-aminoethyl)sulfonamide 10 mgD113 5-dimethylaminonaphthalene-1-(N-(5-aminopentyl))sulfonamide (dansyl cadaverine) 100 mgD1552 N-(3-((2,4-dinitrophenyl)amino)propyl)-N-(3-aminopropyl)methylamine, dihydrochloride (DAMP) 100 mgF7030 FUN® 1 cell stain *10 mM solution in DMSO* 100 µLI34202 Image-iT® LIVE Lysosomal and Nuclear Labeling Kit *counterstains for GFP-expressing cells* 1 kitL7533 LysoSensor™ Blue DND-167 *1 mM solution in DMSO* *special packaging* 20 x 50 µLL7534 LysoSensor™ Green DND-153 *1 mM solution in DMSO* *special packaging* 20 x 50 µLL7535 LysoSensor™ Green DND-189 *1 mM solution in DMSO* *special packaging* 20 x 50 µLL22460 LysoSensor™ Yellow/Blue dextran, 10,000 MW, anionic, �xable 5 mgL7545 LysoSensor™ Yellow/Blue DND-160 (PDMPO) *1 mM solution in DMSO* 20 x 50 µLL7525 LysoTracker® Blue DND-22 *1 mM solution in DMSO* *special packaging* 20 x 50 µLL7526 LysoTracker® Green DND-26 *1 mM solution in DMSO* *special packaging* 20 x 50 µLL7528 LysoTracker® Red DND-99 *1 mM solution in DMSO* *special packaging* 20 x 50 µLL12491 LysoTracker® Yellow HCK-123 *1 mM solution in DMSO* *special packaging* 20 x 50 µLN3246 neutral red *high purity* 25 mgR14060 RedoxSensor™ Red CC-1 *special packaging* 10 x 50 µgS34201 SelectFX® Alexa Fluor® 488 Peroxisome Labeling Kit *for �xed cells* 1 kitT3166 N-(3-triethylammoniumpropyl)-4-(6-(4-(diethylamino)phenyl)hexatrienyl)pyridinium dibromide (FM® 4-64) 1 mgT13320 N-(3-triethylammoniumpropyl)-4-(6-(4-(diethylamino)phenyl)hexatrienyl)pyridinium dibromide (FM® 4-64) *special packaging* 10 x 100 µgT23360 N-(3-trimethylammoniumpropyl)-4-(6-(4-(diethylamino)phenyl)hexatrienyl)pyridinium dibromide (FM® 5-95) 1 mgY7531 Yeast Vacuole Marker Sampler Kit 1 kitY7536 yeast vacuole membrane marker MDY-64 1 mg
12.4 Probes for the Endoplasmic Reticulum and Golgi Apparatus�e endoplasmic reticulum (ER) and Golgi apparatus are primarily responsible for the prop-
er sorting of lipids and proteins in cells.1 Consequently, most of the cell-permeant probes for these organelles are either lipids or chemicals that a�ect protein movement. Several of the most e�ective probes for the Golgi apparatus are �uorescent ceramides and sphingolipids, which are discussed below and in Section 13.3. Certain aspects of lipid tra�cking through the ER and Golgi apparatus related to signal transduction are described in Section 17.4. In both live and �xed cells, the �attened membranous sacs of the ER and the Golgi apparatus can be stained with a variety of lipophilic probes and then distinguished by their morphology.
In addition to these �uorescent organelle stains, we o�er several CellLight® reagents that comprise BacMam expression vectors encoding targeted auto�uorescent proteins for visualizing the endoplasmic reticulum and Golgi apparatus in live mammalian cells. For labeling �xed-cell preparations, we o�er the SelectFX® Alexa Fluor® 488 Endoplasmic Reticulum Labeling Kit (S34200), which contains an antibody directed against the ER-associated protein disul�de isom-erase (PDI). Enzymes in the ER are also involved in synthesis of cholesterol and in the detoxi�ca-tion of hydrophobic drugs through the cytochrome P450 system (Section 10.6). Furthermore, some �uorescent lectins are useful markers for the Golgi apparatus because several enzymes in this organelle function to glycosylate lipids and proteins (Figure 12.4.1). Nissl bodies principally comprise ordered structures of alternate lamellae of rough endoplasmic reticulum and polyribo-some arrays. Our NeuroTrace® �uorescent Nissl stains are described in Section 12.5. An excellent compendium of human diseases that a�ect intracellular transport processes through lysosomes, Golgi and ER has been published.2
Figure 12.4.1 Fixed and permeabilized osteosarcoma cells simultaneously stained with the �uorescent lectins Alexa Fluor® 488 concanavalin A (Con A) (C11252) and Alexa Fluor® 594 wheat germ agglutinin (WGA) (W11262). Con A selectively binds α-glucopyranosyl residues, whereas WGA selectively binds sialic acid and N-acetylglucosaminyl residues. The nuclei were counterstained with blue-�uo-rescent Hoechst 33342 nucleic acid stain (H1399, H3570, H21492). The image was acquired using bandpass �lter sets appropriate for the Texas Red® dye, �uorescein and AMCA.
The Molecular Probes™ Handbook: A Guide to Fluorescent Probes and Labeling Technologies
IMPORTANT NOTICE : The products described in this manual are covered by one or more Limited Use Label License(s). Please refer to the Appendix on page 971 and Master Product List on page 975. Products are For Research Use Only. Not intended for any animal or human therapeutic or diagnostic use.thermofisher.com/probes
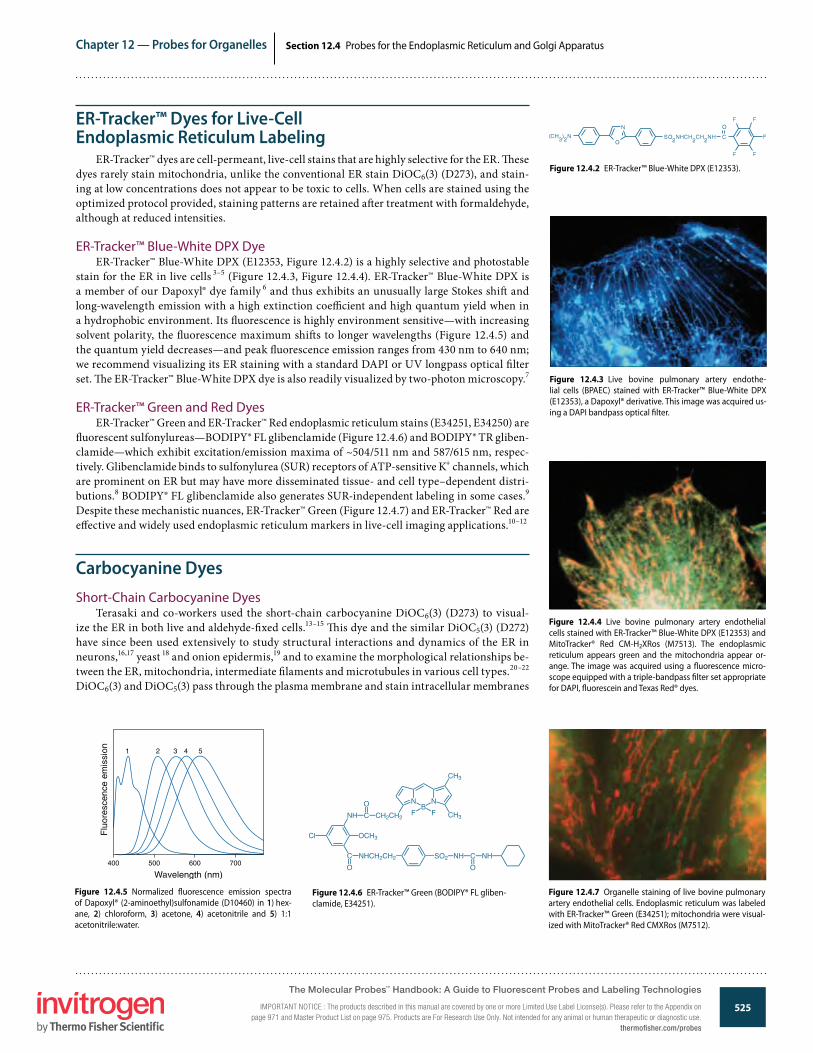
525
Chapter 12 — Probes for Organelles
www.invitrogen.com/probes
The Molecular Probes® Handbook: A Guide to Fluorescent Probes and Labeling TechnologiesIMPORTANT NOTICE: The products described in this manual are covered by one or more Limited Use Label License(s). Please refer to the Appendix on page 971 and Master Product List on page 975. Products are For Research Use Only. Not intended for any animal or human therapeutic or diagnostic use.
Section 12.4 Probes for the Endoplasmic Reticulum and Golgi Apparatus
ER-Tracker™ Dyes for Live-Cell Endoplasmic Reticulum Labeling
ER-Tracker™ dyes are cell-permeant, live-cell stains that are highly selective for the ER. �ese dyes rarely stain mitochondria, unlike the conventional ER stain DiOC6(3) (D273), and stain-ing at low concentrations does not appear to be toxic to cells. When cells are stained using the optimized protocol provided, staining patterns are retained a�er treatment with formaldehyde, although at reduced intensities.
ER-Tracker™ Blue-White DPX DyeER-Tracker™ Blue-White DPX (E12353, Figure 12.4.2) is a highly selective and photostable
stain for the ER in live cells 3–5 (Figure 12.4.3, Figure 12.4.4). ER-Tracker™ Blue-White DPX is a member of our Dapoxyl® dye family 6 and thus exhibits an unusually large Stokes shi� and long-wavelength emission with a high extinction coe�cient and high quantum yield when in a hydrophobic environment. Its �uorescence is highly environment sensitive—with increasing solvent polarity, the �uorescence maximum shi�s to longer wavelengths (Figure 12.4.5) and the quantum yield decreases—and peak �uorescence emission ranges from 430 nm to 640 nm; we recommend visualizing its ER staining with a standard DAPI or UV longpass optical �lter set. �e ER-Tracker™ Blue-White DPX dye is also readily visualized by two-photon microscopy.7
ER-Tracker™ Green and Red DyesER-Tracker™ Green and ER-Tracker™ Red endoplasmic reticulum stains (E34251, E34250) are
�uorescent sulfonylureas—BODIPY® FL glibenclamide (Figure 12.4.6) and BODIPY® TR gliben-clamide—which exhibit excitation/emission maxima of ~504/511 nm and 587/615 nm, respec-tively. Glibenclamide binds to sulfonylurea (SUR) receptors of ATP-sensitive K+ channels, which are prominent on ER but may have more disseminated tissue- and cell type–dependent distri-butions.8 BODIPY® FL glibenclamide also generates SUR-independent labeling in some cases.9 Despite these mechanistic nuances, ER-Tracker™ Green (Figure 12.4.7) and ER-Tracker™ Red are e�ective and widely used endoplasmic reticulum markers in live-cell imaging applications.10–12
Carbocyanine DyesShort-Chain Carbocyanine Dyes
Terasaki and co-workers used the short-chain carbocyanine DiOC6(3) (D273) to visual-ize the ER in both live and aldehyde-�xed cells.13–15 �is dye and the similar DiOC5(3) (D272) have since been used extensively to study structural interactions and dynamics of the ER in neurons,16,17 yeast 18 and onion epidermis,19 and to examine the morphological relationships be-tween the ER, mitochondria, intermediate �laments and microtubules in various cell types.20–22 DiOC6(3) and DiOC5(3) pass through the plasma membrane and stain intracellular membranes
Figure 12.4.2 ER-Tracker™ Blue-White DPX (E12353).
Figure 12.4.3 Live bovine pulmonary artery endothe-lial cells (BPAEC) stained with ER-Tracker™ Blue-White DPX (E12353), a Dapoxyl® derivative. This image was acquired us-ing a DAPI bandpass optical �lter.
Figure 12.4.4 Live bovine pulmonary artery endothelial cells stained with ER-Tracker™ Blue-White DPX (E12353) and MitoTracker® Red CM-H2XRos (M7513). The endoplasmic reticulum appears green and the mitochondria appear or-ange. The image was acquired using a �uorescence micro-scope equipped with a triple-bandpass �lter set appropriate for DAPI, �uorescein and Texas Red® dyes.
Figure 12.4.5 Normalized �uorescence emission spectra of Dapoxyl® (2-aminoethyl)sulfonamide (D10460) in 1) hex-ane, 2) chloroform, 3) acetone, 4) acetonitrile and 5) 1:1 acetonitrile:water.
Figure 12.4.6 ER-Tracker™ Green (BODIPY® FL gliben-clamide, E34251).
N�
N�� CH�CH2CH2C
O
CH�
NH
C NHCH2CH2
OCH�Cl
O�O2 NH C NH
O
Figure 12.4.7 Organelle staining of live bovine pulmonary artery endothelial cells. Endoplasmic reticulum was labeled with ER-Tracker™ Green (E34251); mitochondria were visual-ized with MitoTracker® Red CMXRos (M7512).
The Molecular Probes™ Handbook: A Guide to Fluorescent Probes and Labeling Technologies
IMPORTANT NOTICE : The products described in this manual are covered by one or more Limited Use Label License(s). Please refer to the Appendix on page 971 and Master Product List on page 975. Products are For Research Use Only. Not intended for any animal or human therapeutic or diagnostic use.
thermofi sher.com/probes
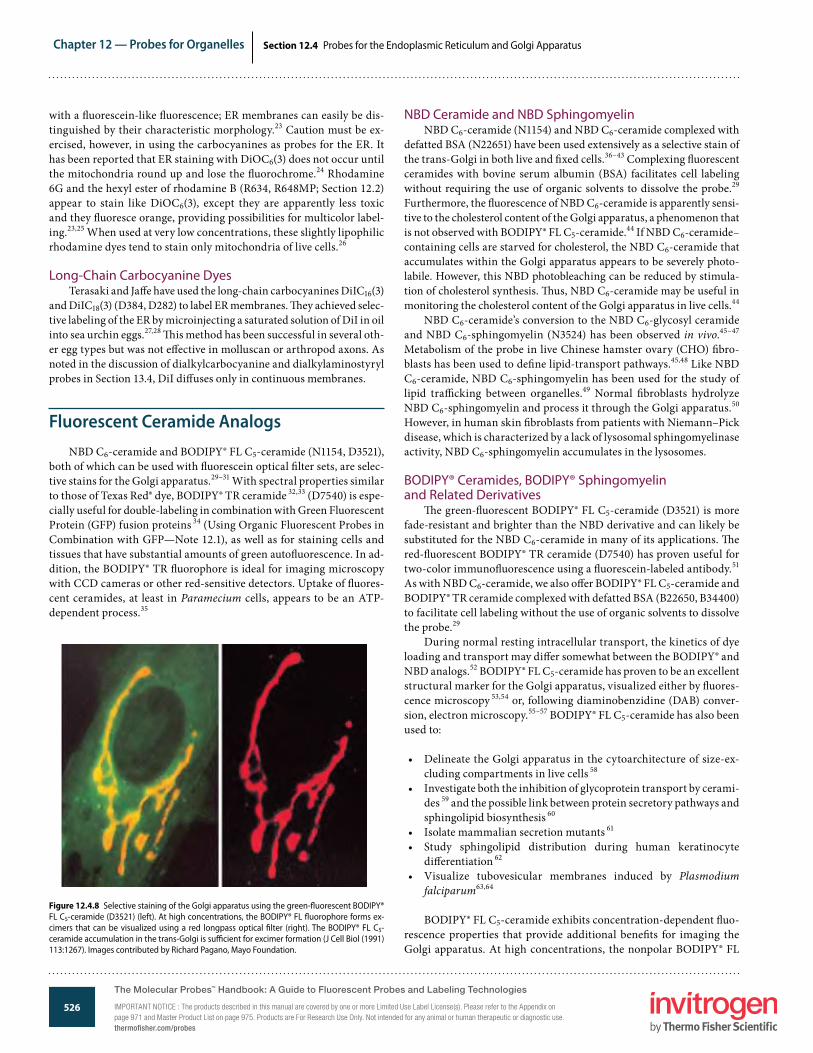
526
Chapter 12 — Probes for Organelles
www.invitrogen.com/probes
The Molecular Probes® Handbook: A Guide to Fluorescent Probes and Labeling TechnologiesIMPORTANT NOTICE: The products described in this manual are covered by one or more Limited Use Label License(s). Please refer to the Appendix on page 971 and Master Product List on page 975. Products are For Research Use Only. Not intended for any animal or human therapeutic or diagnostic use.
Section 12.4 Probes for the Endoplasmic Reticulum and Golgi Apparatus
with a �uorescein-like �uorescence; ER membranes can easily be dis-tinguished by their characteristic morphology.23 Caution must be ex-ercised, however, in using the carbocyanines as probes for the ER. It has been reported that ER staining with DiOC6(3) does not occur until the mitochondria round up and lose the �uorochrome.24 Rhodamine 6G and the hexyl ester of rhodamine B (R634, R648MP; Section 12.2) appear to stain like DiOC6(3), except they are apparently less toxic and they �uoresce orange, providing possibilities for multicolor label-ing.23,25 When used at very low concentrations, these slightly lipophilic rhodamine dyes tend to stain only mitochondria of live cells.26
Long-Chain Carbocyanine DyesTerasaki and Ja�e have used the long-chain carbocyanines DiIC16(3)
and DiIC18(3) (D384, D282) to label ER membranes. �ey achieved selec-tive labeling of the ER by microinjecting a saturated solution of DiI in oil into sea urchin eggs.27,28 �is method has been successful in several oth-er egg types but was not e�ective in molluscan or arthropod axons. As noted in the discussion of dialkylcarbocyanine and dialkylaminostyryl probes in Section 13.4, DiI di�uses only in continuous membranes.
Fluorescent Ceramide AnalogsNBD C6-ceramide and BODIPY® FL C5-ceramide (N1154, D3521),
both of which can be used with �uorescein optical �lter sets, are selec-tive stains for the Golgi apparatus.29–31 With spectral properties similar to those of Texas Red® dye, BODIPY® TR ceramide 32,33 (D7540) is espe-cially useful for double-labeling in combination with Green Fluorescent Protein (GFP) fusion proteins 34 (Using Organic Fluorescent Probes in Combination with GFP—Note 12.1), as well as for staining cells and tissues that have substantial amounts of green auto�uorescence. In ad-dition, the BODIPY® TR �uorophore is ideal for imaging microscopy with CCD cameras or other red-sensitive detectors. Uptake of �uores-cent ceramides, at least in Paramecium cells, appears to be an ATP-dependent process.35
Figure 12.4.8 Selective staining of the Golgi apparatus using the green-�uorescent BODIPY® FL C5-ceramide (D3521) (left). At high concentrations, the BODIPY® FL �uorophore forms ex-cimers that can be visualized using a red longpass optical �lter (right). The BODIPY® FL C5-ceramide accumulation in the trans-Golgi is su�cient for excimer formation (J Cell Biol (1991) 113:1267). Images contributed by Richard Pagano, Mayo Foundation.
NBD Ceramide and NBD SphingomyelinNBD C6-ceramide (N1154) and NBD C6-ceramide complexed with
defatted BSA (N22651) have been used extensively as a selective stain of the trans-Golgi in both live and �xed cells.36–43 Complexing �uorescent ceramides with bovine serum albumin (BSA) facilitates cell labeling without requiring the use of organic solvents to dissolve the probe.29 Furthermore, the �uorescence of NBD C6-ceramide is apparently sensi-tive to the cholesterol content of the Golgi apparatus, a phenomenon that is not observed with BODIPY® FL C5-ceramide.44 If NBD C6-ceramide–containing cells are starved for cholesterol, the NBD C6-ceramide that accumulates within the Golgi apparatus appears to be severely photo-labile. However, this NBD photobleaching can be reduced by stimula-tion of cholesterol synthesis. �us, NBD C6-ceramide may be useful in monitoring the cholesterol content of the Golgi apparatus in live cells.44
NBD C6-ceramide’s conversion to the NBD C6-glycosyl ceramide and NBD C6-sphingomyelin (N3524) has been observed in vivo.45–47 Metabolism of the probe in live Chinese hamster ovary (CHO) �bro-blasts has been used to de�ne lipid-transport pathways.45,48 Like NBD C6-ceramide, NBD C6-sphingomyelin has been used for the study of lipid tra�cking between organelles.49 Normal �broblasts hydrolyze NBD C6-sphingomyelin and process it through the Golgi apparatus.50 However, in human skin �broblasts from patients with Niemann–Pick disease, which is characterized by a lack of lysosomal sphingomyelinase activity, NBD C6-sphingomyelin accumulates in the lysosomes.
BODIPY® Ceramides, BODIPY® Sphingomyelin and Related Derivatives
�e green-�uorescent BODIPY® FL C5-ceramide (D3521) is more fade-resistant and brighter than the NBD derivative and can likely be substituted for the NBD C6-ceramide in many of its applications. �e red-�uorescent BODIPY® TR ceramide (D7540) has proven useful for two-color immuno�uorescence using a �uorescein-labeled antibody.51 As with NBD C6-ceramide, we also o�er BODIPY® FL C5-ceramide and BODIPY® TR ceramide complexed with defatted BSA (B22650, B34400) to facilitate cell labeling without the use of organic solvents to dissolve the probe.29
During normal resting intracellular transport, the kinetics of dye loading and transport may di�er somewhat between the BODIPY® and NBD analogs.52 BODIPY® FL C5-ceramide has proven to be an excellent structural marker for the Golgi apparatus, visualized either by �uores-cence microscopy 53,54 or, following diaminobenzidine (DAB) conver-sion, electron microscopy.55–57 BODIPY® FL C5-ceramide has also been used to:
• Delineate the Golgi apparatus in the cytoarchitecture of size-ex-cluding compartments in live cells 58
• Investigate both the inhibition of glycoprotein transport by cerami-des 59 and the possible link between protein secretory pathways and sphingolipid biosynthesis 60
• Isolate mammalian secretion mutants 61
• Study sphingolipid distribution during human keratinocyte di�erentiation 62
• Visualize tubovesicular membranes induced by Plasmodium falciparum63,64
BODIPY® FL C5-ceramide exhibits concentration-dependent �uo-rescence properties that provide additional bene�ts for imaging the Golgi apparatus. At high concentrations, the nonpolar BODIPY® FL
The Molecular Probes™ Handbook: A Guide to Fluorescent Probes and Labeling Technologies
IMPORTANT NOTICE : The products described in this manual are covered by one or more Limited Use Label License(s). Please refer to the Appendix on page 971 and Master Product List on page 975. Products are For Research Use Only. Not intended for any animal or human therapeutic or diagnostic use.thermofisher.com/probes
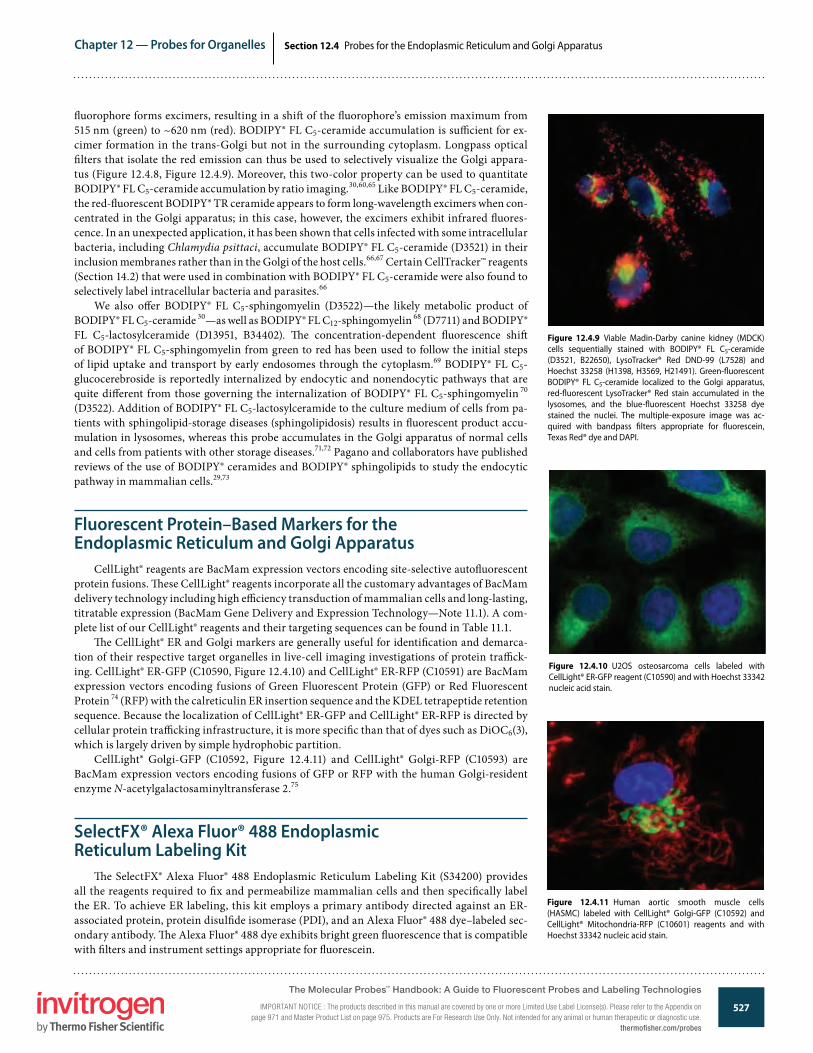
527
Chapter 12 — Probes for Organelles
www.invitrogen.com/probes
The Molecular Probes® Handbook: A Guide to Fluorescent Probes and Labeling TechnologiesIMPORTANT NOTICE: The products described in this manual are covered by one or more Limited Use Label License(s). Please refer to the Appendix on page 971 and Master Product List on page 975. Products are For Research Use Only. Not intended for any animal or human therapeutic or diagnostic use.
Section 12.4 Probes for the Endoplasmic Reticulum and Golgi Apparatus
Figure 12.4.9 Viable Madin-Darby canine kidney (MDCK) cells sequentially stained with BODIPY® FL C5-ceramide (D3521, B22650), LysoTracker® Red DND-99 (L7528) and Hoechst 33258 (H1398, H3569, H21491). Green-�uorescent BODIPY® FL C5-ceramide localized to the Golgi apparatus, red-�uorescent LysoTracker® Red stain accumulated in the lysosomes, and the blue-�uorescent Hoechst 33258 dye stained the nuclei. The multiple-exposure image was ac-quired with bandpass �lters appropriate for �uorescein, Texas Red® dye and DAPI.
Figure 12.4.10 U2OS osteosarcoma cells labeled with CellLight® ER-GFP reagent (C10590) and with Hoechst 33342 nucleic acid stain.
Figure 12.4.11 Human aortic smooth muscle cells (HASMC) labeled with CellLight® Golgi-GFP (C10592) and CellLight® Mitochondria-RFP (C10601) reagents and with Hoechst 33342 nucleic acid stain.
�uorophore forms excimers, resulting in a shi� of the �uorophore’s emission maximum from 515 nm (green) to ~620 nm (red). BODIPY® FL C5-ceramide accumulation is su�cient for ex-cimer formation in the trans-Golgi but not in the surrounding cytoplasm. Longpass optical �lters that isolate the red emission can thus be used to selectively visualize the Golgi appara-tus (Figure 12.4.8, Figure 12.4.9). Moreover, this two-color property can be used to quantitate BODIPY® FL C5-ceramide accumulation by ratio imaging.30,60,65 Like BODIPY® FL C5-ceramide, the red-�uorescent BODIPY® TR ceramide appears to form long-wavelength excimers when con-centrated in the Golgi apparatus; in this case, however, the excimers exhibit infrared �uores-cence. In an unexpected application, it has been shown that cells infected with some intracellular bacteria, including Chlamydia psittaci, accumulate BODIPY® FL C5-ceramide (D3521) in their inclusion membranes rather than in the Golgi of the host cells.66,67 Certain CellTracker™ reagents (Section 14.2) that were used in combination with BODIPY® FL C5-ceramide were also found to selectively label intracellular bacteria and parasites.66
We also o�er BODIPY® FL C5-sphingomyelin (D3522)—the likely metabolic product of BODIPY® FL C5-ceramide 30—as well as BODIPY® FL C12-sphingomyelin 68 (D7711) and BODIPY® FL C5-lactosylceramide (D13951, B34402). �e concentration-dependent �uorescence shi� of BODIPY® FL C5-sphingomyelin from green to red has been used to follow the initial steps of lipid uptake and transport by early endosomes through the cytoplasm.69 BODIPY® FL C5-glucocerebroside is reportedly internalized by endocytic and nonendocytic pathways that are quite di�erent from those governing the internalization of BODIPY® FL C5-sphingomyelin 70 (D3522). Addition of BODIPY® FL C5-lactosylceramide to the culture medium of cells from pa-tients with sphingolipid-storage diseases (sphingolipidosis) results in �uorescent product accu-mulation in lysosomes, whereas this probe accumulates in the Golgi apparatus of normal cells and cells from patients with other storage diseases.71,72 Pagano and collaborators have published reviews of the use of BODIPY® ceramides and BODIPY® sphingolipids to study the endocytic pathway in mammalian cells.29,73
Fluorescent Protein–Based Markers for the Endoplasmic Reticulum and Golgi Apparatus
CellLight® reagents are BacMam expression vectors encoding site-selective auto�uorescent protein fusions. �ese CellLight® reagents incorporate all the customary advantages of BacMam delivery technology including high e�ciency transduction of mammalian cells and long-lasting, titratable expression (BacMam Gene Delivery and Expression Technology—Note 11.1). A com-plete list of our CellLight® reagents and their targeting sequences can be found in Table 11.1.
�e CellLight® ER and Golgi markers are generally useful for identi�cation and demarca-tion of their respective target organelles in live-cell imaging investigations of protein tra�ck-ing. CellLight® ER-GFP (C10590, Figure 12.4.10) and CellLight® ER-RFP (C10591) are BacMam expression vectors encoding fusions of Green Fluorescent Protein (GFP) or Red Fluorescent Protein 74 (RFP) with the calreticulin ER insertion sequence and the KDEL tetrapeptide retention sequence. Because the localization of CellLight® ER-GFP and CellLight® ER-RFP is directed by cellular protein tra�cking infrastructure, it is more speci�c than that of dyes such as DiOC6(3), which is largely driven by simple hydrophobic partition.
CellLight® Golgi-GFP (C10592, Figure 12.4.11) and CellLight® Golgi-RFP (C10593) are BacMam expression vectors encoding fusions of GFP or RFP with the human Golgi-resident enzyme N-acetylgalactosaminyltransferase 2.75
SelectFX® Alexa Fluor® 488 Endoplasmic Reticulum Labeling Kit
�e SelectFX® Alexa Fluor® 488 Endoplasmic Reticulum Labeling Kit (S34200) provides all the reagents required to �x and permeabilize mammalian cells and then speci�cally label the ER. To achieve ER labeling, this kit employs a primary antibody directed against an ER-associated protein, protein disul�de isomerase (PDI), and an Alexa Fluor® 488 dye–labeled sec-ondary antibody. �e Alexa Fluor® 488 dye exhibits bright green �uorescence that is compatible with �lters and instrument settings appropriate for �uorescein.
The Molecular Probes™ Handbook: A Guide to Fluorescent Probes and Labeling Technologies
IMPORTANT NOTICE : The products described in this manual are covered by one or more Limited Use Label License(s). Please refer to the Appendix on page 971 and Master Product List on page 975. Products are For Research Use Only. Not intended for any animal or human therapeutic or diagnostic use.
thermofisher.com/probes
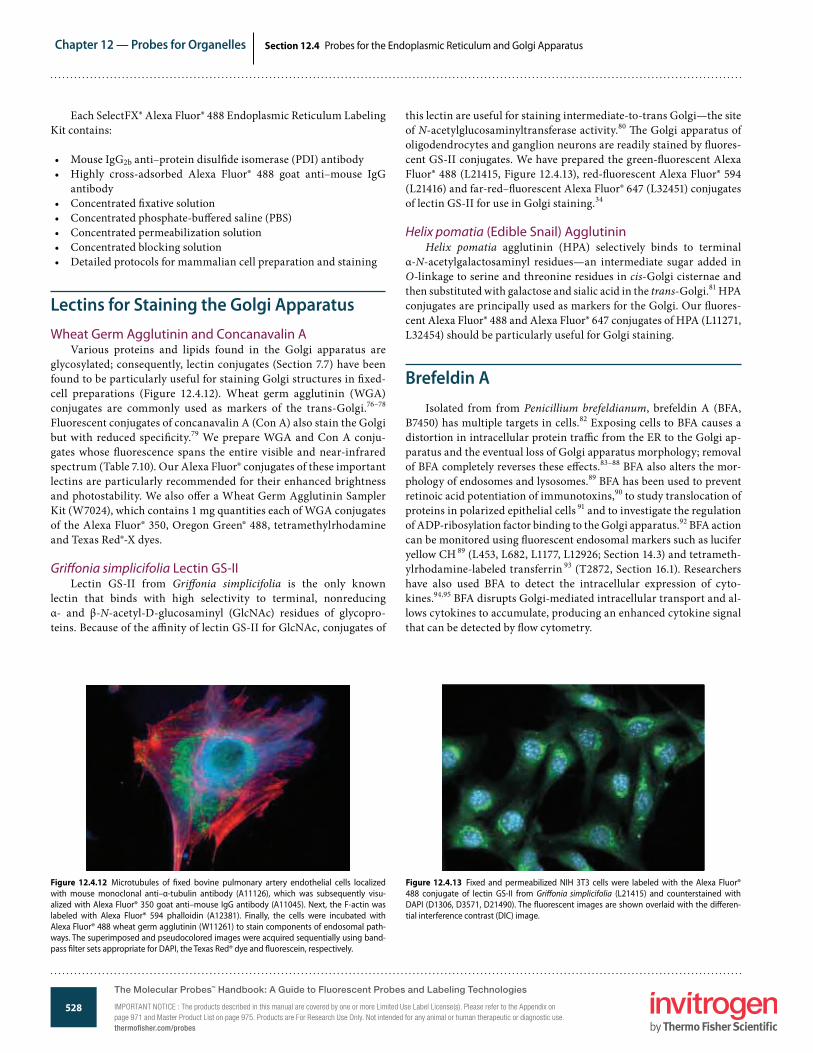
528
Chapter 12 — Probes for Organelles
www.invitrogen.com/probes
The Molecular Probes® Handbook: A Guide to Fluorescent Probes and Labeling TechnologiesIMPORTANT NOTICE: The products described in this manual are covered by one or more Limited Use Label License(s). Please refer to the Appendix on page 971 and Master Product List on page 975. Products are For Research Use Only. Not intended for any animal or human therapeutic or diagnostic use.
Section 12.4 Probes for the Endoplasmic Reticulum and Golgi Apparatus
Each SelectFX® Alexa Fluor® 488 Endoplasmic Reticulum Labeling Kit contains:
• Mouse IgG2b anti–protein disul�de isomerase (PDI) antibody• Highly cross-adsorbed Alexa Fluor® 488 goat anti–mouse IgG
antibody• Concentrated �xative solution• Concentrated phosphate-bu�ered saline (PBS)• Concentrated permeabilization solution• Concentrated blocking solution• Detailed protocols for mammalian cell preparation and staining
Lectins for Staining the Golgi ApparatusWheat Germ Agglutinin and Concanavalin A
Various proteins and lipids found in the Golgi apparatus are glycosylated; consequently, lectin conjugates (Section 7.7) have been found to be particularly useful for staining Golgi structures in �xed-cell preparations (Figure 12.4.12). Wheat germ agglutinin (WGA) conjugates are commonly used as markers of the trans-Golgi.76–78 Fluorescent conjugates of concanavalin A (Con A) also stain the Golgi but with reduced speci�city.79 We prepare WGA and Con A conju-gates whose �uorescence spans the entire visible and near-infrared spectrum (Table 7.10). Our Alexa Fluor® conjugates of these important lectins are particularly recommended for their enhanced brightness and photostability. We also o�er a Wheat Germ Agglutinin Sampler Kit (W7024), which contains 1 mg quantities each of WGA conjugates of the Alexa Fluor® 350, Oregon Green® 488, tetramethylrhodamine and Texas Red®-X dyes.
Gri�onia simplicifolia Lectin GS-IILectin GS-II from Gri�onia simplicifolia is the only known
lectin that binds with high selectivity to terminal, nonreducing α- and β-N-acetyl-D-glucosaminyl (GlcNAc) residues of glycopro-teins. Because of the a�nity of lectin GS-II for GlcNAc, conjugates of
this lectin are useful for staining intermediate-to-trans Golgi—the site of N-acetylglucosaminyltransferase activity.80 �e Golgi apparatus of oligodendrocytes and ganglion neurons are readily stained by �uores-cent GS-II conjugates. We have prepared the green-�uorescent Alexa Fluor® 488 (L21415, Figure 12.4.13), red-�uorescent Alexa Fluor® 594 (L21416) and far-red–�uorescent Alexa Fluor® 647 (L32451) conjugates of lectin GS-II for use in Golgi staining.34
Helix pomatia (Edible Snail) AgglutininHelix pomatia agglutinin (HPA) selectively binds to terminal
α-N-acetylgalactosaminyl residues—an intermediate sugar added in O-linkage to serine and threonine residues in cis-Golgi cisternae and then substituted with galactose and sialic acid in the trans-Golgi.81 HPA conjugates are principally used as markers for the Golgi. Our �uores-cent Alexa Fluor® 488 and Alexa Fluor® 647 conjugates of HPA (L11271, L32454) should be particularly useful for Golgi staining.
Brefeldin AIsolated from from Penicillium brefeldianum, brefeldin A (BFA,
B7450) has multiple targets in cells.82 Exposing cells to BFA causes a distortion in intracellular protein tra�c from the ER to the Golgi ap-paratus and the eventual loss of Golgi apparatus morphology; removal of BFA completely reverses these e�ects.83–88 BFA also alters the mor-phology of endosomes and lysosomes.89 BFA has been used to prevent retinoic acid potentiation of immunotoxins,90 to study translocation of proteins in polarized epithelial cells 91 and to investigate the regulation of ADP-ribosylation factor binding to the Golgi apparatus.92 BFA action can be monitored using �uorescent endosomal markers such as lucifer yellow CH 89 (L453, L682, L1177, L12926; Section 14.3) and tetrameth-ylrhodamine-labeled transferrin 93 (T2872, Section 16.1). Researchers have also used BFA to detect the intracellular expression of cyto-kines.94,95 BFA disrupts Golgi-mediated intracellular transport and al-lows cytokines to accumulate, producing an enhanced cytokine signal that can be detected by �ow cytometry.
Figure 12.4.12 Microtubules of �xed bovine pulmonary artery endothelial cells localized with mouse monoclonal anti–α-tubulin antibody (A11126), which was subsequently visu-alized with Alexa Fluor® 350 goat anti–mouse IgG antibody (A11045). Next, the F-actin was labeled with Alexa Fluor® 594 phalloidin (A12381). Finally, the cells were incubated with Alexa Fluor® 488 wheat germ agglutinin (W11261) to stain components of endosomal path-ways. The superimposed and pseudocolored images were acquired sequentially using band-pass �lter sets appropriate for DAPI, the Texas Red® dye and �uorescein, respectively.
Figure 12.4.13 Fixed and permeabilized NIH 3T3 cells were labeled with the Alexa Fluor® 488 conjugate of lectin GS-II from Gri�onia simplicifolia (L21415) and counterstained with DAPI (D1306, D3571, D21490). The �uorescent images are shown overlaid with the di�eren-tial interference contrast (DIC) image.
The Molecular Probes™ Handbook: A Guide to Fluorescent Probes and Labeling Technologies
IMPORTANT NOTICE : The products described in this manual are covered by one or more Limited Use Label License(s). Please refer to the Appendix on page 971 and Master Product List on page 975. Products are For Research Use Only. Not intended for any animal or human therapeutic or diagnostic use.thermofisher.com/probes
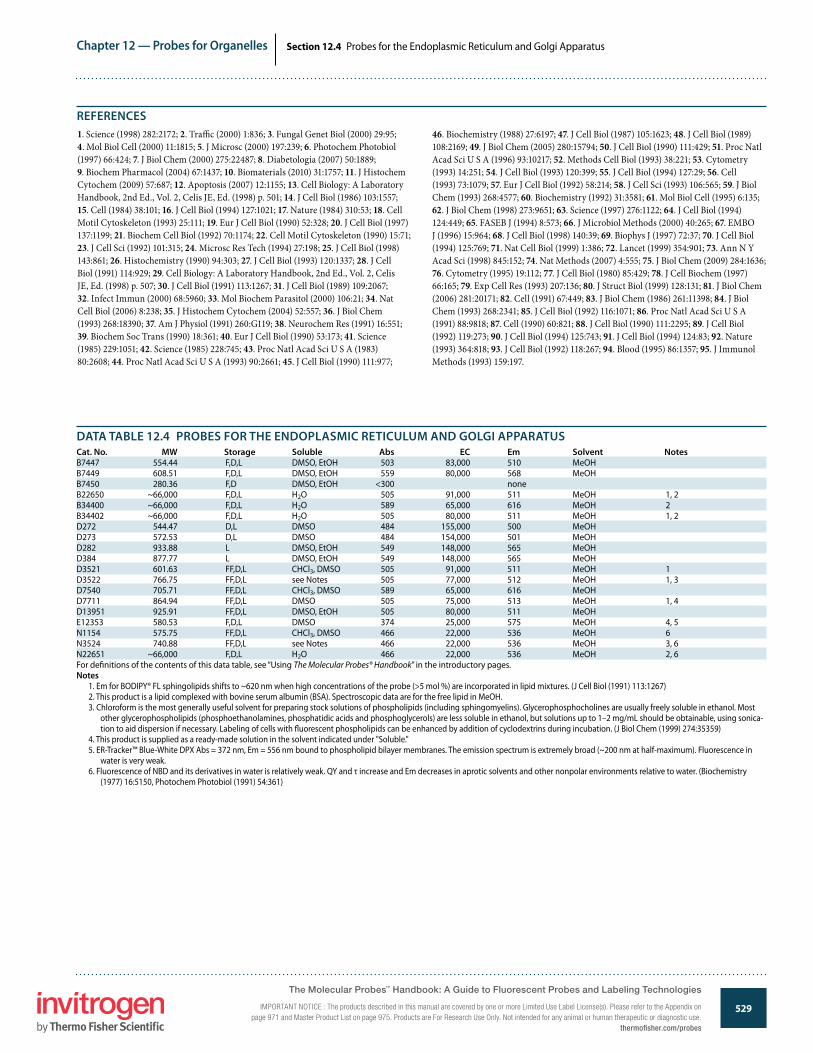
529
Chapter 12 — Probes for Organelles
www.invitrogen.com/probes
The Molecular Probes® Handbook: A Guide to Fluorescent Probes and Labeling TechnologiesIMPORTANT NOTICE: The products described in this manual are covered by one or more Limited Use Label License(s). Please refer to the Appendix on page 971 and Master Product List on page 975. Products are For Research Use Only. Not intended for any animal or human therapeutic or diagnostic use.
Section 12.4 Probes for the Endoplasmic Reticulum and Golgi Apparatus
1. Science (1998) 282:2172; 2. Tra�c (2000) 1:836; 3. Fungal Genet Biol (2000) 29:95; 4. Mol Biol Cell (2000) 11:1815; 5. J Microsc (2000) 197:239; 6. Photochem Photobiol (1997) 66:424; 7. J Biol Chem (2000) 275:22487; 8. Diabetologia (2007) 50:1889; 9. Biochem Pharmacol (2004) 67:1437; 10. Biomaterials (2010) 31:1757; 11. J Histochem Cytochem (2009) 57:687; 12. Apoptosis (2007) 12:1155; 13. Cell Biology: A Laboratory Handbook, 2nd Ed., Vol. 2, Celis JE, Ed. (1998) p. 501; 14. J Cell Biol (1986) 103:1557; 15. Cell (1984) 38:101; 16. J Cell Biol (1994) 127:1021; 17. Nature (1984) 310:53; 18. Cell Motil Cytoskeleton (1993) 25:111; 19. Eur J Cell Biol (1990) 52:328; 20. J Cell Biol (1997) 137:1199; 21. Biochem Cell Biol (1992) 70:1174; 22. Cell Motil Cytoskeleton (1990) 15:71; 23. J Cell Sci (1992) 101:315; 24. Microsc Res Tech (1994) 27:198; 25. J Cell Biol (1998) 143:861; 26. Histochemistry (1990) 94:303; 27. J Cell Biol (1993) 120:1337; 28. J Cell Biol (1991) 114:929; 29. Cell Biology: A Laboratory Handbook, 2nd Ed., Vol. 2, Celis JE, Ed. (1998) p. 507; 30. J Cell Biol (1991) 113:1267; 31. J Cell Biol (1989) 109:2067; 32. Infect Immun (2000) 68:5960; 33. Mol Biochem Parasitol (2000) 106:21; 34. Nat Cell Biol (2006) 8:238; 35. J Histochem Cytochem (2004) 52:557; 36. J Biol Chem (1993) 268:18390; 37. Am J Physiol (1991) 260:G119; 38. Neurochem Res (1991) 16:551; 39. Biochem Soc Trans (1990) 18:361; 40. Eur J Cell Biol (1990) 53:173; 41. Science (1985) 229:1051; 42. Science (1985) 228:745; 43. Proc Natl Acad Sci U S A (1983) 80:2608; 44. Proc Natl Acad Sci U S A (1993) 90:2661; 45. J Cell Biol (1990) 111:977;
46. Biochemistry (1988) 27:6197; 47. J Cell Biol (1987) 105:1623; 48. J Cell Biol (1989) 108:2169; 49. J Biol Chem (2005) 280:15794; 50. J Cell Biol (1990) 111:429; 51. Proc Natl Acad Sci U S A (1996) 93:10217; 52. Methods Cell Biol (1993) 38:221; 53. Cytometry (1993) 14:251; 54. J Cell Biol (1993) 120:399; 55. J Cell Biol (1994) 127:29; 56. Cell (1993) 73:1079; 57. Eur J Cell Biol (1992) 58:214; 58. J Cell Sci (1993) 106:565; 59. J Biol Chem (1993) 268:4577; 60. Biochemistry (1992) 31:3581; 61. Mol Biol Cell (1995) 6:135; 62. J Biol Chem (1998) 273:9651; 63. Science (1997) 276:1122; 64. J Cell Biol (1994) 124:449; 65. FASEB J (1994) 8:573; 66. J Microbiol Methods (2000) 40:265; 67. EMBO J (1996) 15:964; 68. J Cell Biol (1998) 140:39; 69. Biophys J (1997) 72:37; 70. J Cell Biol (1994) 125:769; 71. Nat Cell Biol (1999) 1:386; 72. Lancet (1999) 354:901; 73. Ann N Y Acad Sci (1998) 845:152; 74. Nat Methods (2007) 4:555; 75. J Biol Chem (2009) 284:1636; 76. Cytometry (1995) 19:112; 77. J Cell Biol (1980) 85:429; 78. J Cell Biochem (1997) 66:165; 79. Exp Cell Res (1993) 207:136; 80. J Struct Biol (1999) 128:131; 81. J Biol Chem (2006) 281:20171; 82. Cell (1991) 67:449; 83. J Biol Chem (1986) 261:11398; 84. J Biol Chem (1993) 268:2341; 85. J Cell Biol (1992) 116:1071; 86. Proc Natl Acad Sci U S A (1991) 88:9818; 87. Cell (1990) 60:821; 88. J Cell Biol (1990) 111:2295; 89. J Cell Biol (1992) 119:273; 90. J Cell Biol (1994) 125:743; 91. J Cell Biol (1994) 124:83; 92. Nature (1993) 364:818; 93. J Cell Biol (1992) 118:267; 94. Blood (1995) 86:1357; 95. J Immunol Methods (1993) 159:197.
REFERENCES
DATA TABLE 12.4 PROBES FOR THE ENDOPLASMIC RETICULUM AND GOLGI APPARATUSCat. No. MW Storage Soluble Abs EC Em Solvent NotesB7447 554.44 F,D,L DMSO, EtOH 503 83,000 510 MeOHB7449 608.51 F,D,L DMSO, EtOH 559 80,000 568 MeOHB7450 280.36 F,D DMSO, EtOH <300 noneB22650 ~66,000 F,D,L H2O 505 91,000 511 MeOH 1, 2B34400 ~66,000 F,D,L H2O 589 65,000 616 MeOH 2B34402 ~66,000 F,D,L H2O 505 80,000 511 MeOH 1, 2D272 544.47 D,L DMSO 484 155,000 500 MeOHD273 572.53 D,L DMSO 484 154,000 501 MeOHD282 933.88 L DMSO, EtOH 549 148,000 565 MeOHD384 877.77 L DMSO, EtOH 549 148,000 565 MeOHD3521 601.63 FF,D,L CHCl3, DMSO 505 91,000 511 MeOH 1D3522 766.75 FF,D,L see Notes 505 77,000 512 MeOH 1, 3D7540 705.71 FF,D,L CHCl3, DMSO 589 65,000 616 MeOHD7711 864.94 FF,D,L DMSO 505 75,000 513 MeOH 1, 4D13951 925.91 FF,D,L DMSO, EtOH 505 80,000 511 MeOHE12353 580.53 F,D,L DMSO 374 25,000 575 MeOH 4, 5N1154 575.75 FF,D,L CHCl3, DMSO 466 22,000 536 MeOH 6N3524 740.88 FF,D,L see Notes 466 22,000 536 MeOH 3, 6N22651 ~66,000 F,D,L H2O 466 22,000 536 MeOH 2, 6For de�nitions of the contents of this data table, see “Using The Molecular Probes® Handbook” in the introductory pages.Notes
1. Em for BODIPY® FL sphingolipids shifts to ~620 nm when high concentrations of the probe (>5 mol %) are incorporated in lipid mixtures. (J Cell Biol (1991) 113:1267)2. This product is a lipid complexed with bovine serum albumin (BSA). Spectroscopic data are for the free lipid in MeOH.3. Chloroform is the most generally useful solvent for preparing stock solutions of phospholipids (including sphingomyelins). Glycerophosphocholines are usually freely soluble in ethanol. Most
other glycerophospholipids (phosphoethanolamines, phosphatidic acids and phosphoglycerols) are less soluble in ethanol, but solutions up to 1–2 mg/mL should be obtainable, using sonica-tion to aid dispersion if necessary. Labeling of cells with �uorescent phospholipids can be enhanced by addition of cyclodextrins during incubation. (J Biol Chem (1999) 274:35359)
4. This product is supplied as a ready-made solution in the solvent indicated under "Soluble."5. ER-Tracker™ Blue-White DPX Abs = 372 nm, Em = 556 nm bound to phospholipid bilayer membranes. The emission spectrum is extremely broad (~200 nm at half-maximum). Fluorescence in
water is very weak.6. Fluorescence of NBD and its derivatives in water is relatively weak. QY and τ increase and Em decreases in aprotic solvents and other nonpolar environments relative to water. (Biochemistry
(1977) 16:5150, Photochem Photobiol (1991) 54:361)
The Molecular Probes™ Handbook: A Guide to Fluorescent Probes and Labeling Technologies
IMPORTANT NOTICE : The products described in this manual are covered by one or more Limited Use Label License(s). Please refer to the Appendix on page 971 and Master Product List on page 975. Products are For Research Use Only. Not intended for any animal or human therapeutic or diagnostic use.
thermofisher.com/probes
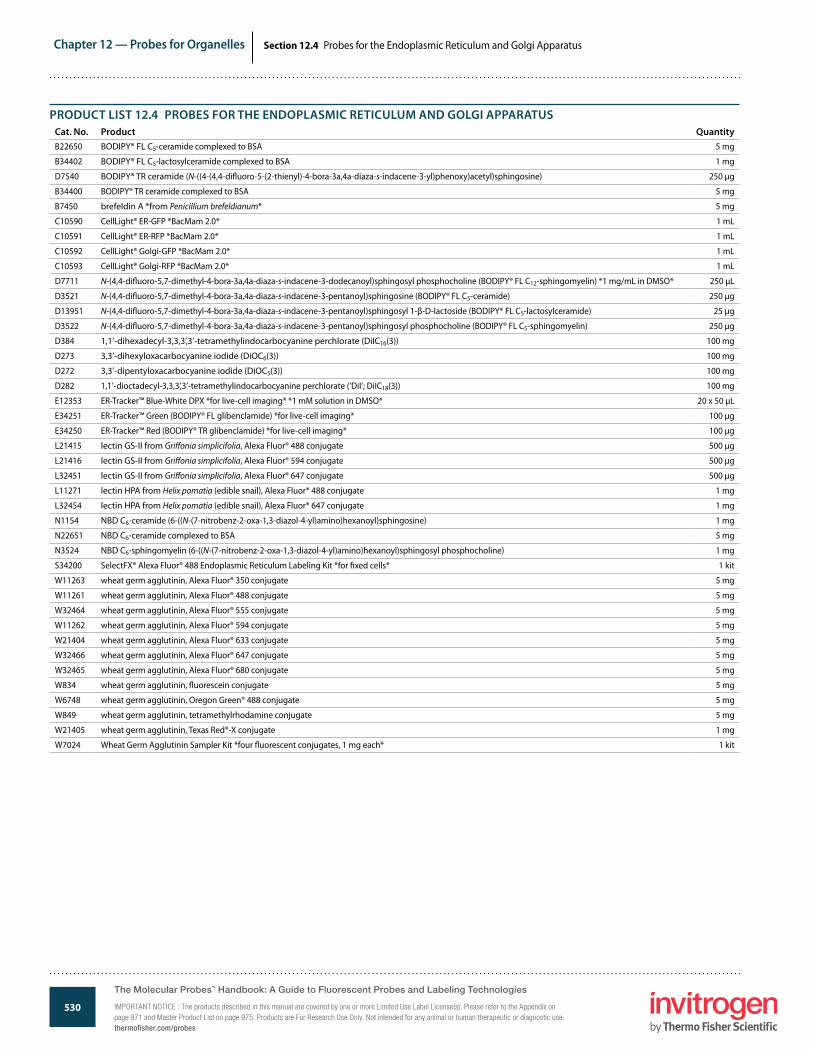
530
Chapter 12 — Probes for Organelles
www.invitrogen.com/probes
The Molecular Probes® Handbook: A Guide to Fluorescent Probes and Labeling TechnologiesIMPORTANT NOTICE: The products described in this manual are covered by one or more Limited Use Label License(s). Please refer to the Appendix on page 971 and Master Product List on page 975. Products are For Research Use Only. Not intended for any animal or human therapeutic or diagnostic use.
Section 12.4 Probes for the Endoplasmic Reticulum and Golgi Apparatus
PRODUCT LIST 12.4 PROBES FOR THE ENDOPLASMIC RETICULUM AND GOLGI APPARATUS Cat. No. Product QuantityB22650 BODIPY® FL C5-ceramide complexed to BSA 5 mg
B34402 BODIPY® FL C5-lactosylceramide complexed to BSA 1 mg
D7540 BODIPY® TR ceramide (N-((4-(4,4-di�uoro-5-(2-thienyl)-4-bora-3a,4a-diaza-s-indacene-3-yl)phenoxy)acetyl)sphingosine) 250 µg
B34400 BODIPY® TR ceramide complexed to BSA 5 mg
B7450 brefeldin A *from Penicillium brefeldianum* 5 mg
C10590 CellLight® ER-GFP *BacMam 2.0* 1 mL
C10591 CellLight® ER-RFP *BacMam 2.0* 1 mL
C10592 CellLight® Golgi-GFP *BacMam 2.0* 1 mL
C10593 CellLight® Golgi-RFP *BacMam 2.0* 1 mL
D7711 N-(4,4-di�uoro-5,7-dimethyl-4-bora-3a,4a-diaza-s-indacene-3-dodecanoyl)sphingosyl phosphocholine (BODIPY® FL C12-sphingomyelin) *1 mg/mL in DMSO* 250 µL
D3521 N-(4,4-di�uoro-5,7-dimethyl-4-bora-3a,4a-diaza-s-indacene-3-pentanoyl)sphingosine (BODIPY® FL C5-ceramide) 250 µg
D13951 N-(4,4-di�uoro-5,7-dimethyl-4-bora-3a,4a-diaza-s-indacene-3-pentanoyl)sphingosyl 1-β-D-lactoside (BODIPY® FL C5-lactosylceramide) 25 µg
D3522 N-(4,4-di�uoro-5,7-dimethyl-4-bora-3a,4a-diaza-s-indacene-3-pentanoyl)sphingosyl phosphocholine (BODIPY® FL C5-sphingomyelin) 250 µg
D384 1,1’-dihexadecyl-3,3,3’,3’-tetramethylindocarbocyanine perchlorate (DiIC16(3)) 100 mg
D273 3,3’-dihexyloxacarbocyanine iodide (DiOC6(3)) 100 mg
D272 3,3’-dipentyloxacarbocyanine iodide (DiOC5(3)) 100 mg
D282 1,1’-dioctadecyl-3,3,3’,3’-tetramethylindocarbocyanine perchlorate (‘DiI’; DiIC18(3)) 100 mg
E12353 ER-Tracker™ Blue-White DPX *for live-cell imaging* *1 mM solution in DMSO* 20 x 50 µL
E34251 ER-Tracker™ Green (BODIPY® FL glibenclamide) *for live-cell imaging* 100 µg
E34250 ER-Tracker™ Red (BODIPY® TR glibenclamide) *for live-cell imaging* 100 µg
L21415 lectin GS-II from Gri�onia simplicifolia, Alexa Fluor® 488 conjugate 500 µg
L21416 lectin GS-II from Gri�onia simplicifolia, Alexa Fluor® 594 conjugate 500 µg
L32451 lectin GS-II from Gri�onia simplicifolia, Alexa Fluor® 647 conjugate 500 µg
L11271 lectin HPA from Helix pomatia (edible snail), Alexa Fluor® 488 conjugate 1 mg
L32454 lectin HPA from Helix pomatia (edible snail), Alexa Fluor® 647 conjugate 1 mg
N1154 NBD C6-ceramide (6-((N-(7-nitrobenz-2-oxa-1,3-diazol-4-yl)amino)hexanoyl)sphingosine) 1 mg
N22651 NBD C6-ceramide complexed to BSA 5 mg
N3524 NBD C6-sphingomyelin (6-((N-(7-nitrobenz-2-oxa-1,3-diazol-4-yl)amino)hexanoyl)sphingosyl phosphocholine) 1 mg
S34200 SelectFX® Alexa Fluor® 488 Endoplasmic Reticulum Labeling Kit *for �xed cells* 1 kit
W11263 wheat germ agglutinin, Alexa Fluor® 350 conjugate 5 mg
W11261 wheat germ agglutinin, Alexa Fluor® 488 conjugate 5 mg
W32464 wheat germ agglutinin, Alexa Fluor® 555 conjugate 5 mg
W11262 wheat germ agglutinin, Alexa Fluor® 594 conjugate 5 mg
W21404 wheat germ agglutinin, Alexa Fluor® 633 conjugate 5 mg
W32466 wheat germ agglutinin, Alexa Fluor® 647 conjugate 5 mg
W32465 wheat germ agglutinin, Alexa Fluor® 680 conjugate 5 mg
W834 wheat germ agglutinin, �uorescein conjugate 5 mg
W6748 wheat germ agglutinin, Oregon Green® 488 conjugate 5 mg
W849 wheat germ agglutinin, tetramethylrhodamine conjugate 5 mg
W21405 wheat germ agglutinin, Texas Red®-X conjugate 1 mg
W7024 Wheat Germ Agglutinin Sampler Kit *four �uorescent conjugates, 1 mg each* 1 kit
The Molecular Probes™ Handbook: A Guide to Fluorescent Probes and Labeling Technologies
IMPORTANT NOTICE : The products described in this manual are covered by one or more Limited Use Label License(s). Please refer to the Appendix on page 971 and Master Product List on page 975. Products are For Research Use Only. Not intended for any animal or human therapeutic or diagnostic use.thermofisher.com/probes
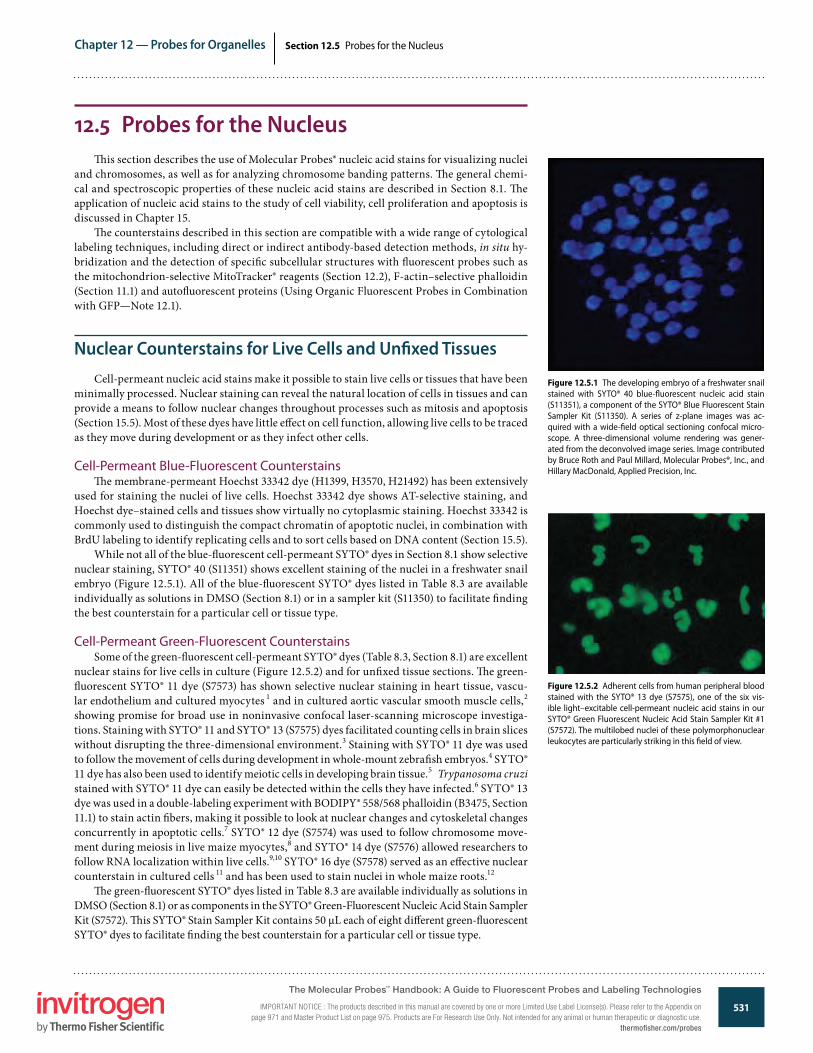
531
Chapter 12 — Probes for Organelles
www.invitrogen.com/probes
The Molecular Probes® Handbook: A Guide to Fluorescent Probes and Labeling TechnologiesIMPORTANT NOTICE: The products described in this manual are covered by one or more Limited Use Label License(s). Please refer to the Appendix on page 971 and Master Product List on page 975. Products are For Research Use Only. Not intended for any animal or human therapeutic or diagnostic use.
Section 12.5 Probes for the Nucleus
12.5 Probes for the Nucleus�is section describes the use of Molecular Probes® nucleic acid stains for visualizing nuclei
and chromosomes, as well as for analyzing chromosome banding patterns. �e general chemi-cal and spectroscopic properties of these nucleic acid stains are described in Section 8.1. �e application of nucleic acid stains to the study of cell viability, cell proliferation and apoptosis is discussed in Chapter 15.
�e counterstains described in this section are compatible with a wide range of cytological labeling techniques, including direct or indirect antibody-based detection methods, in situ hy-bridization and the detection of speci�c subcellular structures with �uorescent probes such as the mitochondrion-selective MitoTracker® reagents (Section 12.2), F-actin–selective phalloidin (Section 11.1) and auto�uorescent proteins (Using Organic Fluorescent Probes in Combination with GFP—Note 12.1).
Nuclear Counterstains for Live Cells and Un�xed TissuesCell-permeant nucleic acid stains make it possible to stain live cells or tissues that have been
minimally processed. Nuclear staining can reveal the natural location of cells in tissues and can provide a means to follow nuclear changes throughout processes such as mitosis and apoptosis (Section 15.5). Most of these dyes have little e�ect on cell function, allowing live cells to be traced as they move during development or as they infect other cells.
Cell-Permeant Blue-Fluorescent Counterstains�e membrane-permeant Hoechst 33342 dye (H1399, H3570, H21492) has been extensively
used for staining the nuclei of live cells. Hoechst 33342 dye shows AT-selective staining, and Hoechst dye–stained cells and tissues show virtually no cytoplasmic staining. Hoechst 33342 is commonly used to distinguish the compact chromatin of apoptotic nuclei, in combination with BrdU labeling to identify replicating cells and to sort cells based on DNA content (Section 15.5).
While not all of the blue-�uorescent cell-permeant SYTO® dyes in Section 8.1 show selective nuclear staining, SYTO® 40 (S11351) shows excellent staining of the nuclei in a freshwater snail embryo (Figure 12.5.1). All of the blue-�uorescent SYTO® dyes listed in Table 8.3 are available individually as solutions in DMSO (Section 8.1) or in a sampler kit (S11350) to facilitate �nding the best counterstain for a particular cell or tissue type.
Cell-Permeant Green-Fluorescent CounterstainsSome of the green-�uorescent cell-permeant SYTO® dyes (Table 8.3, Section 8.1) are excellent
nuclear stains for live cells in culture (Figure 12.5.2) and for un�xed tissue sections. �e green-�uorescent SYTO® 11 dye (S7573) has shown selective nuclear staining in heart tissue, vascu-lar endothelium and cultured myocytes 1 and in cultured aortic vascular smooth muscle cells,2 showing promise for broad use in noninvasive confocal laser-scanning microscope investiga-tions. Staining with SYTO® 11 and SYTO® 13 (S7575) dyes facilitated counting cells in brain slices without disrupting the three-dimensional environment.3 Staining with SYTO® 11 dye was used to follow the movement of cells during development in whole-mount zebra�sh embryos.4 SYTO® 11 dye has also been used to identify meiotic cells in developing brain tissue.5 Trypanosoma cruzi stained with SYTO® 11 dye can easily be detected within the cells they have infected.6 SYTO® 13 dye was used in a double-labeling experiment with BODIPY® 558/568 phalloidin (B3475, Section 11.1) to stain actin �bers, making it possible to look at nuclear changes and cytoskeletal changes concurrently in apoptotic cells.7 SYTO® 12 dye (S7574) was used to follow chromosome move-ment during meiosis in live maize myocytes,8 and SYTO® 14 dye (S7576) allowed researchers to follow RNA localization within live cells.9,10 SYTO® 16 dye (S7578) served as an e�ective nuclear counterstain in cultured cells 11 and has been used to stain nuclei in whole maize roots.12
�e green-�uorescent SYTO® dyes listed in Table 8.3 are available individually as solutions in DMSO (Section 8.1) or as components in the SYTO® Green-Fluorescent Nucleic Acid Stain Sampler Kit (S7572). �is SYTO® Stain Sampler Kit contains 50 µL each of eight di�erent green-�uorescent SYTO® dyes to facilitate �nding the best counterstain for a particular cell or tissue type.
Figure 12.5.2 Adherent cells from human peripheral blood stained with the SYTO® 13 dye (S7575), one of the six vis-ible light–excitable cell-permeant nucleic acid stains in our SYTO® Green Fluorescent Nucleic Acid Stain Sampler Kit #1 (S7572). The multilobed nuclei of these polymorphonuclear leukocytes are particularly striking in this �eld of view.
Figure 12.5.1 The developing embryo of a freshwater snail stained with SYTO® 40 blue-�uorescent nucleic acid stain (S11351), a component of the SYTO® Blue Fluorescent Stain Sampler Kit (S11350). A series of z-plane images was ac-quired with a wide-�eld optical sectioning confocal micro-scope. A three-dimensional volume rendering was gener-ated from the deconvolved image series. Image contributed by Bruce Roth and Paul Millard, Molecular Probes®, Inc., and Hillary MacDonald, Applied Precision, Inc.
The Molecular Probes™ Handbook: A Guide to Fluorescent Probes and Labeling Technologies
IMPORTANT NOTICE : The products described in this manual are covered by one or more Limited Use Label License(s). Please refer to the Appendix on page 971 and Master Product List on page 975. Products are For Research Use Only. Not intended for any animal or human therapeutic or diagnostic use.
thermofisher.com/probes
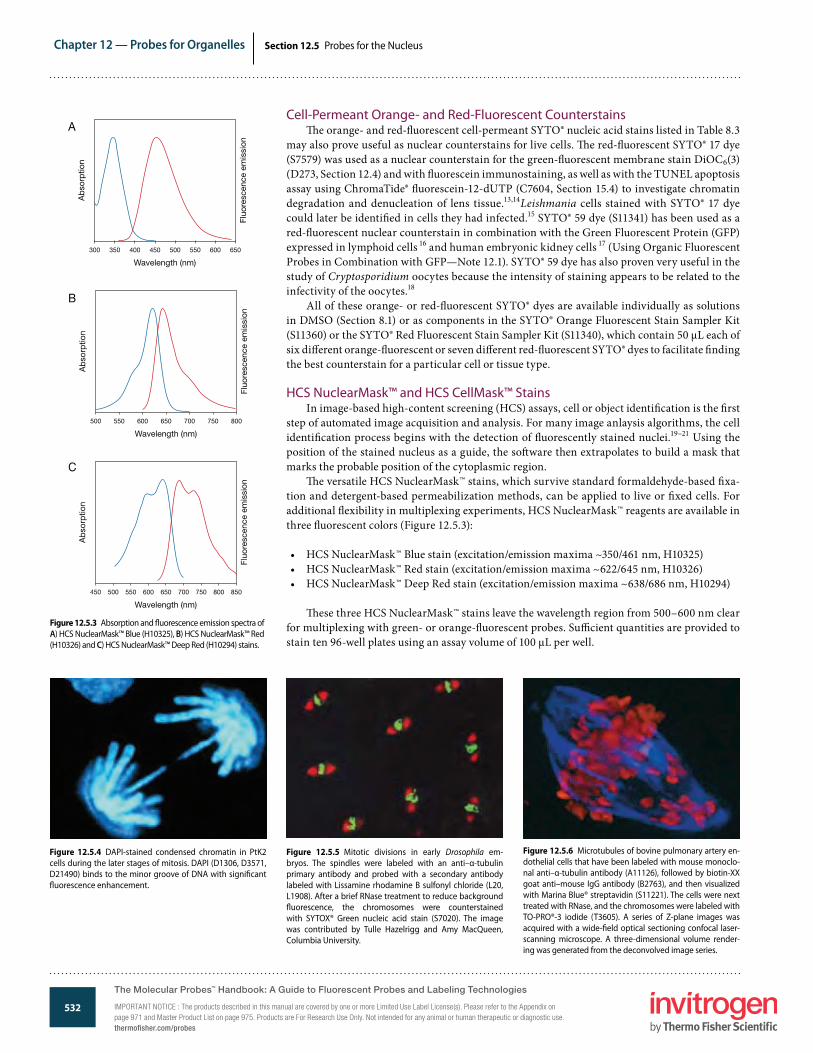
532
Chapter 12 — Probes for Organelles
www.invitrogen.com/probes
The Molecular Probes® Handbook: A Guide to Fluorescent Probes and Labeling TechnologiesIMPORTANT NOTICE: The products described in this manual are covered by one or more Limited Use Label License(s). Please refer to the Appendix on page 971 and Master Product List on page 975. Products are For Research Use Only. Not intended for any animal or human therapeutic or diagnostic use.
Section 12.5 Probes for the Nucleus
Cell-Permeant Orange- and Red-Fluorescent Counterstains�e orange- and red-�uorescent cell-permeant SYTO® nucleic acid stains listed in Table 8.3
may also prove useful as nuclear counterstains for live cells. �e red-�uorescent SYTO® 17 dye (S7579) was used as a nuclear counterstain for the green-�uorescent membrane stain DiOC6(3) (D273, Section 12.4) and with �uorescein immunostaining, as well as with the TUNEL apoptosis assay using ChromaTide® �uorescein-12-dUTP (C7604, Section 15.4) to investigate chromatin degradation and denucleation of lens tissue.13,14Leishmania cells stained with SYTO® 17 dye could later be identi�ed in cells they had infected.15 SYTO® 59 dye (S11341) has been used as a red-�uorescent nuclear counterstain in combination with the Green Fluorescent Protein (GFP) expressed in lymphoid cells 16 and human embryonic kidney cells 17 (Using Organic Fluorescent Probes in Combination with GFP—Note 12.1). SYTO® 59 dye has also proven very useful in the study of Cryptosporidium oocytes because the intensity of staining appears to be related to the infectivity of the oocytes.18
All of these orange- or red-�uorescent SYTO® dyes are available individually as solutions in DMSO (Section 8.1) or as components in the SYTO® Orange Fluorescent Stain Sampler Kit (S11360) or the SYTO® Red Fluorescent Stain Sampler Kit (S11340), which contain 50 µL each of six di�erent orange-�uorescent or seven di�erent red-�uorescent SYTO® dyes to facilitate �nding the best counterstain for a particular cell or tissue type.
HCS NuclearMask™ and HCS CellMask™ StainsIn image-based high-content screening (HCS) assays, cell or object identi�cation is the �rst
step of automated image acquisition and analysis. For many image anlaysis algorithms, the cell identi�cation process begins with the detection of �uorescently stained nuclei.19–21 Using the position of the stained nucleus as a guide, the so�ware then extrapolates to build a mask that marks the probable position of the cytoplasmic region.
�e versatile HCS NuclearMask™ stains, which survive standard formaldehyde-based �xa-tion and detergent-based permeabilization methods, can be applied to live or �xed cells. For additional �exibility in multiplexing experiments, HCS NuclearMask™ reagents are available in three �uorescent colors (Figure 12.5.3):
• HCS NuclearMask™ Blue stain (excitation/emission maxima ~350/461 nm, H10325)• HCS NuclearMask™ Red stain (excitation/emission maxima ~622/645 nm, H10326)• HCS NuclearMask™ Deep Red stain (excitation/emission maxima ~638/686 nm, H10294)
�ese three HCS NuclearMask™ stains leave the wavelength region from 500–600 nm clear for multiplexing with green- or orange-�uorescent probes. Su�cient quantities are provided to stain ten 96-well plates using an assay volume of 100 µL per well.
Figure 12.5.5 Mitotic divisions in early Drosophila em-bryos. The spindles were labeled with an anti–α-tubulin primary antibody and probed with a secondary antibody labeled with Lissamine rhodamine B sulfonyl chloride (L20, L1908). After a brief RNase treatment to reduce background �uorescence, the chromosomes were counterstained with SYTOX® Green nucleic acid stain (S7020). The image was contributed by Tulle Hazelrigg and Amy MacQueen, Columbia University.
Figure 12.5.4 DAPI-stained condensed chromatin in PtK2 cells during the later stages of mitosis. DAPI (D1306, D3571, D21490) binds to the minor groove of DNA with signi�cant �uorescence enhancement.
Figure 12.5.3 Absorption and �uorescence emission spectra of A) HCS NuclearMask™ Blue (H10325), B) HCS NuclearMask™ Red (H10326) and C) HCS NuclearMask™ Deep Red (H10294) stains.
Wavelength (nm)
Ab
sorp
tion
Fluo
resc
ence
em
issi
on300 350 600550400 450 500 650
Wavelength (nm)
Ab
sorp
tion
Fluo
resc
ence
em
issi
on
500 750700550 600 650 800
Wavelength (nm)
Ab
sorp
tion
Fluo
resc
ence
em
issi
on
450 500 750700550 600 650 850800
Figure 12.5.6 Microtubules of bovine pulmonary artery en-dothelial cells that have been labeled with mouse monoclo-nal anti–α-tubulin antibody (A11126), followed by biotin-XX goat anti–mouse IgG antibody (B2763), and then visualized with Marina Blue® streptavidin (S11221). The cells were next treated with RNase, and the chromosomes were labeled with TO-PRO®-3 iodide (T3605). A series of Z-plane images was acquired with a wide-�eld optical sectioning confocal laser-scanning microscope. A three-dimensional volume render-ing was generated from the deconvolved image series.
A
B
C
The Molecular Probes™ Handbook: A Guide to Fluorescent Probes and Labeling Technologies
IMPORTANT NOTICE : The products described in this manual are covered by one or more Limited Use Label License(s). Please refer to the Appendix on page 971 and Master Product List on page 975. Products are For Research Use Only. Not intended for any animal or human therapeutic or diagnostic use.thermofisher.com/probes
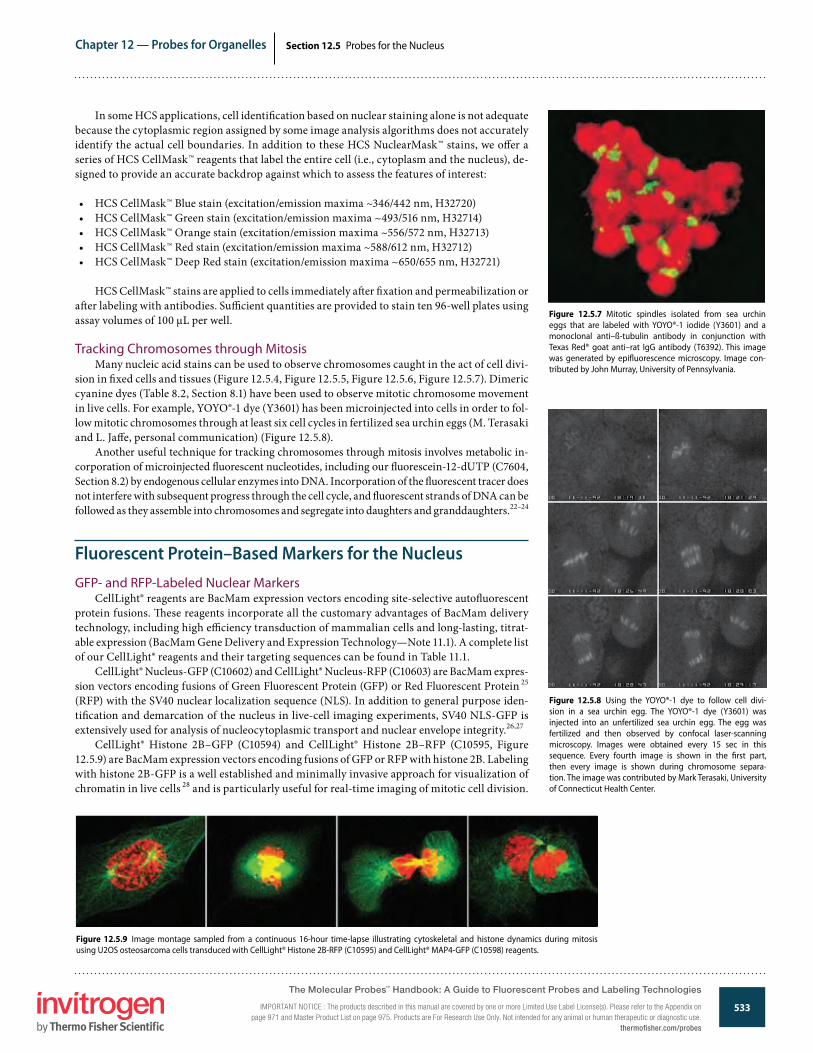
533
Chapter 12 — Probes for Organelles
www.invitrogen.com/probes
The Molecular Probes® Handbook: A Guide to Fluorescent Probes and Labeling TechnologiesIMPORTANT NOTICE: The products described in this manual are covered by one or more Limited Use Label License(s). Please refer to the Appendix on page 971 and Master Product List on page 975. Products are For Research Use Only. Not intended for any animal or human therapeutic or diagnostic use.
Section 12.5 Probes for the Nucleus
Figure 12.5.8 Using the YOYO®-1 dye to follow cell divi-sion in a sea urchin egg. The YOYO®-1 dye (Y3601) was injected into an unfertilized sea urchin egg. The egg was fertilized and then observed by confocal laser-scanning microscopy. Images were obtained every 15 sec in this sequence. Every fourth image is shown in the �rst part, then every image is shown during chromosome separa-tion. The image was contributed by Mark Terasaki, University of Connecticut Health Center.
In some HCS applications, cell identi�cation based on nuclear staining alone is not adequate because the cytoplasmic region assigned by some image analysis algorithms does not accurately identify the actual cell boundaries. In addition to these HCS NuclearMask™ stains, we o�er a series of HCS CellMask™ reagents that label the entire cell (i.e., cytoplasm and the nucleus), de-signed to provide an accurate backdrop against which to assess the features of interest:
• HCS CellMask™ Blue stain (excitation/emission maxima ~346/442 nm, H32720)• HCS CellMask™ Green stain (excitation/emission maxima ~493/516 nm, H32714)• HCS CellMask™ Orange stain (excitation/emission maxima ~556/572 nm, H32713)• HCS CellMask™ Red stain (excitation/emission maxima ~588/612 nm, H32712)• HCS CellMask™ Deep Red stain (excitation/emission maxima ~650/655 nm, H32721)
HCS CellMask™ stains are applied to cells immediately a�er �xation and permeabilization or a�er labeling with antibodies. Su�cient quantities are provided to stain ten 96-well plates using assay volumes of 100 µL per well.
Tracking Chromosomes through MitosisMany nucleic acid stains can be used to observe chromosomes caught in the act of cell divi-
sion in �xed cells and tissues (Figure 12.5.4, Figure 12.5.5, Figure 12.5.6, Figure 12.5.7). Dimeric cyanine dyes (Table 8.2, Section 8.1) have been used to observe mitotic chromosome movement in live cells. For example, YOYO®-1 dye (Y3601) has been microinjected into cells in order to fol-low mitotic chromosomes through at least six cell cycles in fertilized sea urchin eggs (M. Terasaki and L. Ja�e, personal communication) (Figure 12.5.8).
Another useful technique for tracking chromosomes through mitosis involves metabolic in-corporation of microinjected �uorescent nucleotides, including our �uorescein-12-dUTP (C7604, Section 8.2) by endogenous cellular enzymes into DNA. Incorporation of the �uorescent tracer does not interfere with subsequent progress through the cell cycle, and �uorescent strands of DNA can be followed as they assemble into chromosomes and segregate into daughters and granddaughters.22–24
Fluorescent Protein–Based Markers for the NucleusGFP- and RFP-Labeled Nuclear Markers
CellLight® reagents are BacMam expression vectors encoding site-selective auto�uorescent protein fusions. �ese reagents incorporate all the customary advantages of BacMam delivery technology, including high e�ciency transduction of mammalian cells and long-lasting, titrat-able expression (BacMam Gene Delivery and Expression Technology—Note 11.1). A complete list of our CellLight® reagents and their targeting sequences can be found in Table 11.1.
CellLight® Nucleus-GFP (C10602) and CellLight® Nucleus-RFP (C10603) are BacMam expres-sion vectors encoding fusions of Green Fluorescent Protein (GFP) or Red Fluorescent Protein 25 (RFP) with the SV40 nuclear localization sequence (NLS). In addition to general purpose iden-ti�cation and demarcation of the nucleus in live-cell imaging experiments, SV40 NLS-GFP is extensively used for analysis of nucleocytoplasmic transport and nuclear envelope integrity.26,27
CellLight® Histone 2B–GFP (C10594) and CellLight® Histone 2B–RFP (C10595, Figure 12.5.9) are BacMam expression vectors encoding fusions of GFP or RFP with histone 2B. Labeling with histone 2B-GFP is a well established and minimally invasive approach for visualization of chromatin in live cells 28 and is particularly useful for real-time imaging of mitotic cell division.
Figure 12.5.7 Mitotic spindles isolated from sea urchin eggs that are labeled with YOYO®-1 iodide (Y3601) and a monoclonal anti–ß-tubulin antibody in conjunction with Texas Red® goat anti–rat IgG antibody (T6392). This image was generated by epi�uorescence microscopy. Image con-tributed by John Murray, University of Pennsylvania.
Figure 12.5.9 Image montage sampled from a continuous 16-hour time-lapse illustrating cytoskeletal and histone dynamics during mitosis using U2OS osteosarcoma cells transduced with CellLight® Histone 2B-RFP (C10595) and CellLight® MAP4-GFP (C10598) reagents.
The Molecular Probes™ Handbook: A Guide to Fluorescent Probes and Labeling Technologies
IMPORTANT NOTICE : The products described in this manual are covered by one or more Limited Use Label License(s). Please refer to the Appendix on page 971 and Master Product List on page 975. Products are For Research Use Only. Not intended for any animal or human therapeutic or diagnostic use.
thermofi sher.com/probes
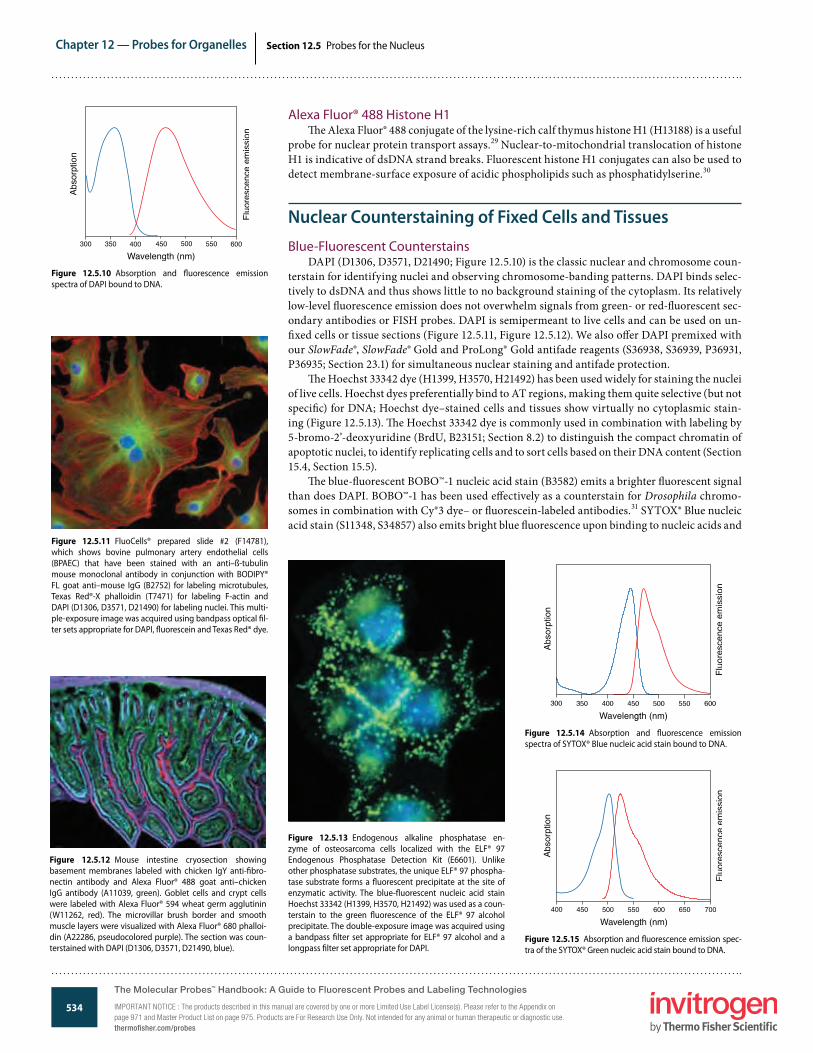
534
Chapter 12 — Probes for Organelles
www.invitrogen.com/probes
The Molecular Probes® Handbook: A Guide to Fluorescent Probes and Labeling TechnologiesIMPORTANT NOTICE: The products described in this manual are covered by one or more Limited Use Label License(s). Please refer to the Appendix on page 971 and Master Product List on page 975. Products are For Research Use Only. Not intended for any animal or human therapeutic or diagnostic use.
Section 12.5 Probes for the Nucleus
Figure 12.5.10 Absorption and �uorescence emission spectra of DAPI bound to DNA.
Figure 12.5.12 Mouse intestine cryosection showing basement membranes labeled with chicken IgY anti-�bro-nectin antibody and Alexa Fluor® 488 goat anti–chicken IgG antibody (A11039, green). Goblet cells and crypt cells were labeled with Alexa Fluor® 594 wheat germ agglutinin (W11262, red). The microvillar brush border and smooth muscle layers were visualized with Alexa Fluor® 680 phalloi-din (A22286, pseudocolored purple). The section was coun-terstained with DAPI (D1306, D3571, D21490, blue).
Figure 12.5.13 Endogenous alkaline phosphatase en-zyme of osteosarcoma cells localized with the ELF® 97 Endogenous Phosphatase Detection Kit (E6601). Unlike other phosphatase substrates, the unique ELF® 97 phospha-tase substrate forms a �uorescent precipitate at the site of enzymatic activity. The blue-�uorescent nucleic acid stain Hoechst 33342 (H1399, H3570, H21492) was used as a coun-terstain to the green �uorescence of the ELF® 97 alcohol precipitate. The double-exposure image was acquired using a bandpass �lter set appropriate for ELF® 97 alcohol and a longpass �lter set appropriate for DAPI.
Figure 12.5.11 FluoCells® prepared slide #2 (F14781), which shows bovine pulmonary artery endothelial cells (BPAEC) that have been stained with an anti–ß-tubulin mouse monoclonal antibody in conjunction with BODIPY® FL goat anti–mouse IgG (B2752) for labeling microtubules, Texas Red®-X phalloidin (T7471) for labeling F-actin and DAPI (D1306, D3571, D21490) for labeling nuclei. This multi-ple-exposure image was acquired using bandpass optical �l-ter sets appropriate for DAPI, �uorescein and Texas Red® dye.
Figure 12.5.15 Absorption and �uorescence emission spec-tra of the SYTOX® Green nucleic acid stain bound to DNA.
Figure 12.5.14 Absorption and �uorescence emission spectra of SYTOX® Blue nucleic acid stain bound to DNA.
Alexa Fluor® 488 Histone H1�e Alexa Fluor® 488 conjugate of the lysine-rich calf thymus histone H1 (H13188) is a useful
probe for nuclear protein transport assays.29 Nuclear-to-mitochondrial translocation of histone H1 is indicative of dsDNA strand breaks. Fluorescent histone H1 conjugates can also be used to detect membrane-surface exposure of acidic phospholipids such as phosphatidylserine.30
Nuclear Counterstaining of Fixed Cells and TissuesBlue-Fluorescent Counterstains
DAPI (D1306, D3571, D21490; Figure 12.5.10) is the classic nuclear and chromosome coun-terstain for identifying nuclei and observing chromosome-banding patterns. DAPI binds selec-tively to dsDNA and thus shows little to no background staining of the cytoplasm. Its relatively low-level �uorescence emission does not overwhelm signals from green- or red-�uorescent sec-ondary antibodies or FISH probes. DAPI is semipermeant to live cells and can be used on un-�xed cells or tissue sections (Figure 12.5.11, Figure 12.5.12). We also o�er DAPI premixed with our SlowFade®, SlowFade® Gold and ProLong® Gold antifade reagents (S36938, S36939, P36931, P36935; Section 23.1) for simultaneous nuclear staining and antifade protection.
�e Hoechst 33342 dye (H1399, H3570, H21492) has been used widely for staining the nuclei of live cells. Hoechst dyes preferentially bind to AT regions, making them quite selective (but not speci�c) for DNA; Hoechst dye–stained cells and tissues show virtually no cytoplasmic stain-ing (Figure 12.5.13). �e Hoechst 33342 dye is commonly used in combination with labeling by 5-bromo-2’-deoxyuridine (BrdU, B23151; Section 8.2) to distinguish the compact chromatin of apoptotic nuclei, to identify replicating cells and to sort cells based on their DNA content (Section 15.4, Section 15.5).
�e blue-�uorescent BOBO™-1 nucleic acid stain (B3582) emits a brighter �uorescent signal than does DAPI. BOBO™-1 has been used e�ectively as a counterstain for Drosophila chromo-somes in combination with Cy®3 dye– or �uorescein-labeled antibodies.31 SYTOX® Blue nucleic acid stain (S11348, S34857) also emits bright blue �uorescence upon binding to nucleic acids and
The Molecular Probes™ Handbook: A Guide to Fluorescent Probes and Labeling Technologies
IMPORTANT NOTICE : The products described in this manual are covered by one or more Limited Use Label License(s). Please refer to the Appendix on page 971 and Master Product List on page 975. Products are For Research Use Only. Not intended for any animal or human therapeutic or diagnostic use.thermofisher.com/probes
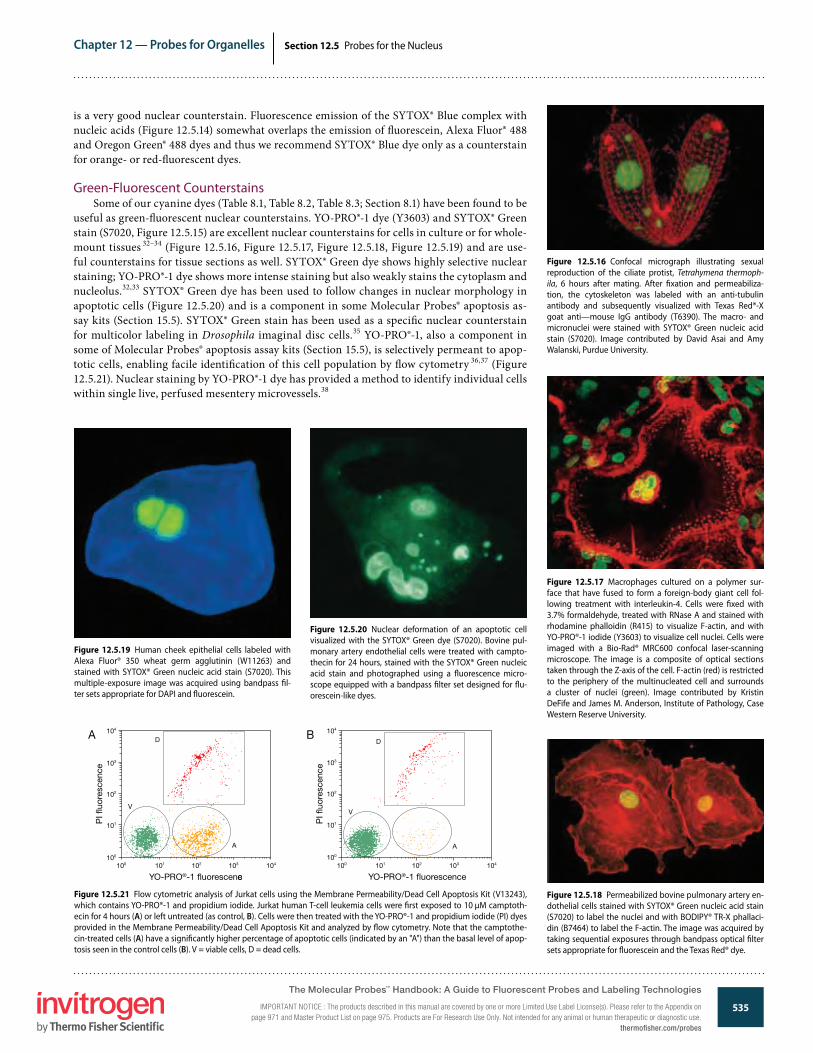
535
Chapter 12 — Probes for Organelles
www.invitrogen.com/probes
The Molecular Probes® Handbook: A Guide to Fluorescent Probes and Labeling TechnologiesIMPORTANT NOTICE: The products described in this manual are covered by one or more Limited Use Label License(s). Please refer to the Appendix on page 971 and Master Product List on page 975. Products are For Research Use Only. Not intended for any animal or human therapeutic or diagnostic use.
Section 12.5 Probes for the Nucleus
Figure 12.5.16 Confocal micrograph illustrating sexual reproduction of the ciliate protist, Tetrahymena thermoph-ila, 6 hours after mating. After �xation and permeabiliza-tion, the cytoskeleton was labeled with an anti-tubulin antibody and subsequently visualized with Texas Red®-X goat anti—mouse IgG antibody (T6390). The macro- and micronuclei were stained with SYTOX® Green nucleic acid stain (S7020). Image contributed by David Asai and Amy Walanski, Purdue University.
Figure 12.5.18 Permeabilized bovine pulmonary artery en-dothelial cells stained with SYTOX® Green nucleic acid stain (S7020) to label the nuclei and with BODIPY® TR-X phallaci-din (B7464) to label the F-actin. The image was acquired by taking sequential exposures through bandpass optical �lter sets appropriate for �uorescein and the Texas Red® dye.
Figure 12.5.19 Human cheek epithelial cells labeled with Alexa Fluor® 350 wheat germ agglutinin (W11263) and stained with SYTOX® Green nucleic acid stain (S7020). This multiple-exposure image was acquired using bandpass �l-ter sets appropriate for DAPI and �uorescein.
Figure 12.5.17 Macrophages cultured on a polymer sur-face that have fused to form a foreign-body giant cell fol-lowing treatment with interleukin-4. Cells were �xed with 3.7% formaldehyde, treated with RNase A and stained with rhodamine phalloidin (R415) to visualize F-actin, and with YO-PRO®-1 iodide (Y3603) to visualize cell nuclei. Cells were imaged with a Bio-Rad® MRC600 confocal laser-scanning microscope. The image is a composite of optical sections taken through the Z-axis of the cell. F-actin (red) is restricted to the periphery of the multinucleated cell and surrounds a cluster of nuclei (green). Image contributed by Kristin DeFife and James M. Anderson, Institute of Pathology, Case Western Reserve University.
Figure 12.5.20 Nuclear deformation of an apoptotic cell visualized with the SYTOX® Green dye (S7020). Bovine pul-monary artery endothelial cells were treated with campto-thecin for 24 hours, stained with the SYTOX® Green nucleic acid stain and photographed using a �uorescence micro-scope equipped with a bandpass �lter set designed for �u-orescein-like dyes.
is a very good nuclear counterstain. Fluorescence emission of the SYTOX® Blue complex with nucleic acids (Figure 12.5.14) somewhat overlaps the emission of �uorescein, Alexa Fluor® 488 and Oregon Green® 488 dyes and thus we recommend SYTOX® Blue dye only as a counterstain for orange- or red-�uorescent dyes.
Green-Fluorescent CounterstainsSome of our cyanine dyes (Table 8.1, Table 8.2, Table 8.3; Section 8.1) have been found to be
useful as green-�uorescent nuclear counterstains. YO-PRO®-1 dye (Y3603) and SYTOX® Green stain (S7020, Figure 12.5.15) are excellent nuclear counterstains for cells in culture or for whole-mount tissues 32–34 (Figure 12.5.16, Figure 12.5.17, Figure 12.5.18, Figure 12.5.19) and are use-ful counterstains for tissue sections as well. SYTOX® Green dye shows highly selective nuclear staining; YO-PRO®-1 dye shows more intense staining but also weakly stains the cytoplasm and nucleolus.32,33 SYTOX® Green dye has been used to follow changes in nuclear morphology in apoptotic cells (Figure 12.5.20) and is a component in some Molecular Probes® apoptosis as-say kits (Section 15.5). SYTOX® Green stain has been used as a speci�c nuclear counterstain for multicolor labeling in Drosophila imaginal disc cells.35 YO-PRO®-1, also a component in some of Molecular Probes® apoptosis assay kits (Section 15.5), is selectively permeant to apop-totic cells, enabling facile identi�cation of this cell population by �ow cytometry 36,37 (Figure 12.5.21). Nuclear staining by YO-PRO®-1 dye has provided a method to identify individual cells within single live, perfused mesentery microvessels.38
Figure 12.5.21 Flow cytometric analysis of Jurkat cells using the Membrane Permeability/Dead Cell Apoptosis Kit (V13243), which contains YO-PRO®-1 and propidium iodide. Jurkat human T-cell leukemia cells were �rst exposed to 10 µM camptoth-ecin for 4 hours (A) or left untreated (as control, B). Cells were then treated with the YO-PRO®-1 and propidium iodide (PI) dyes provided in the Membrane Permeability/Dead Cell Apoptosis Kit and analyzed by �ow cytometry. Note that the camptothe-cin-treated cells (A) have a signi�cantly higher percentage of apoptotic cells (indicated by an "A") than the basal level of apop-tosis seen in the control cells (B). V = viable cells, D = dead cells.
100 101 102 103 104
PI �
uore
scen
ce
YO-PRO®-1 �uorescence
100
101
102
103
104
V
D
A
100 101 102 103 104
PI �
uore
scen
ce
YO-PRO®-1 �uorescence
100
101
102
103
104
V
A
D
100 101 102 103 104
PI �
uore
scen
ce
YO-PRO®-1 �uorescence
100
101
102
103
104
V
D
A
100 101 102 103 104
PI �
uore
scen
ce
YO-PRO®-1 �uorescence
100
101
102
103
104
V
A
DA B
The Molecular Probes™ Handbook: A Guide to Fluorescent Probes and Labeling Technologies
IMPORTANT NOTICE : The products described in this manual are covered by one or more Limited Use Label License(s). Please refer to the Appendix on page 971 and Master Product List on page 975. Products are For Research Use Only. Not intended for any animal or human therapeutic or diagnostic use.
thermofisher.com/probes
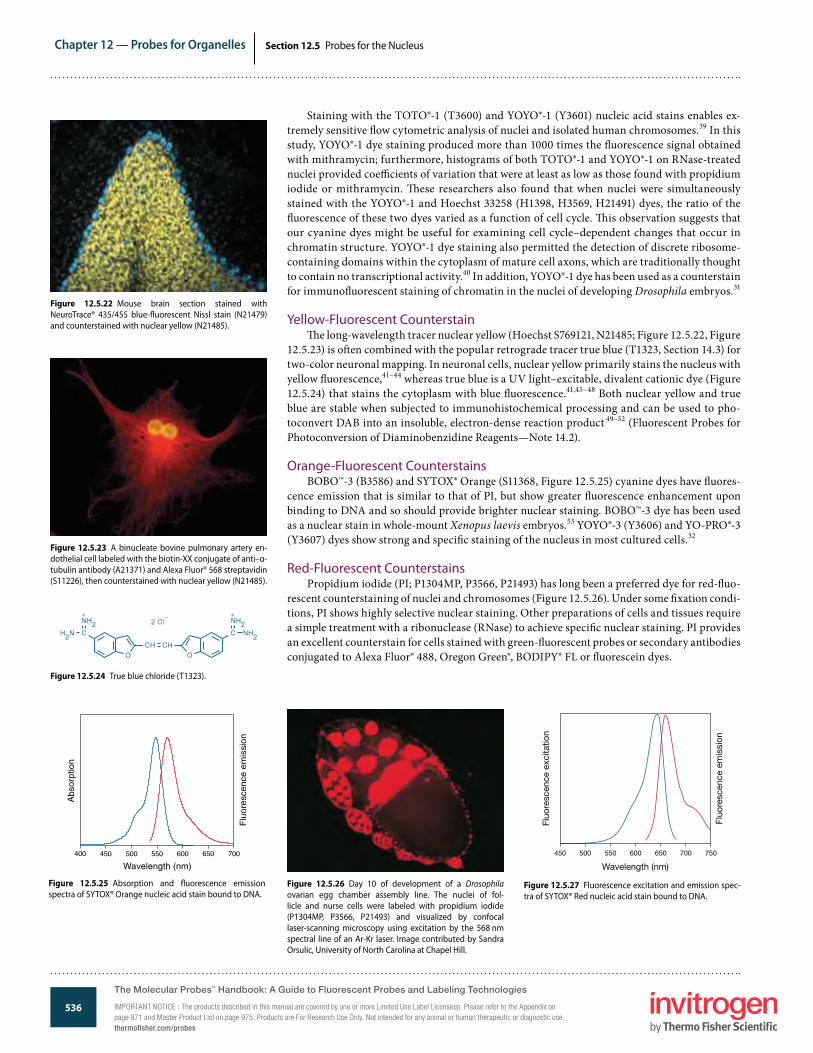
536
Chapter 12 — Probes for Organelles
www.invitrogen.com/probes
The Molecular Probes® Handbook: A Guide to Fluorescent Probes and Labeling TechnologiesIMPORTANT NOTICE: The products described in this manual are covered by one or more Limited Use Label License(s). Please refer to the Appendix on page 971 and Master Product List on page 975. Products are For Research Use Only. Not intended for any animal or human therapeutic or diagnostic use.
Section 12.5 Probes for the Nucleus
Figure 12.5.22 Mouse brain section stained with NeuroTrace® 435/455 blue-�uorescent Nissl stain (N21479) and counterstained with nuclear yellow (N21485).
Figure 12.5.23 A binucleate bovine pulmonary artery en-dothelial cell labeled with the biotin-XX conjugate of anti–α-tubulin antibody (A21371) and Alexa Fluor® 568 streptavidin (S11226), then counterstained with nuclear yellow (N21485).
Staining with the TOTO®-1 (T3600) and YOYO®-1 (Y3601) nucleic acid stains enables ex-tremely sensitive �ow cytometric analysis of nuclei and isolated human chromosomes.39 In this study, YOYO®-1 dye staining produced more than 1000 times the �uorescence signal obtained with mithramycin; furthermore, histograms of both TOTO®-1 and YOYO®-1 on RNase-treated nuclei provided coe�cients of variation that were at least as low as those found with propidium iodide or mithramycin. �ese researchers also found that when nuclei were simultaneously stained with the YOYO®-1 and Hoechst 33258 (H1398, H3569, H21491) dyes, the ratio of the �uorescence of these two dyes varied as a function of cell cycle. �is observation suggests that our cyanine dyes might be useful for examining cell cycle–dependent changes that occur in chromatin structure. YOYO®-1 dye staining also permitted the detection of discrete ribosome-containing domains within the cytoplasm of mature cell axons, which are traditionally thought to contain no transcriptional activity.40 In addition, YOYO®-1 dye has been used as a counterstain for immuno�uorescent staining of chromatin in the nuclei of developing Drosophila embryos.31
Yellow-Fluorescent Counterstain�e long-wavelength tracer nuclear yellow (Hoechst S769121, N21485; Figure 12.5.22, Figure
12.5.23) is o�en combined with the popular retrograde tracer true blue (T1323, Section 14.3) for two-color neuronal mapping. In neuronal cells, nuclear yellow primarily stains the nucleus with yellow �uorescence,41–44 whereas true blue is a UV light–excitable, divalent cationic dye (Figure 12.5.24) that stains the cytoplasm with blue �uorescence.41,45–48 Both nuclear yellow and true blue are stable when subjected to immunohistochemical processing and can be used to pho-toconvert DAB into an insoluble, electron-dense reaction product 49–52 (Fluorescent Probes for Photoconversion of Diaminobenzidine Reagents—Note 14.2).
Orange-Fluorescent CounterstainsBOBO™-3 (B3586) and SYTOX® Orange (S11368, Figure 12.5.25) cyanine dyes have �uores-
cence emission that is similar to that of PI, but show greater �uorescence enhancement upon binding to DNA and so should provide brighter nuclear staining. BOBO™-3 dye has been used as a nuclear stain in whole-mount Xenopus laevis embryos.53 YOYO®-3 (Y3606) and YO-PRO®-3 (Y3607) dyes show strong and speci�c staining of the nucleus in most cultured cells.32
Red-Fluorescent CounterstainsPropidium iodide (PI; P1304MP, P3566, P21493) has long been a preferred dye for red-�uo-
rescent counterstaining of nuclei and chromosomes (Figure 12.5.26). Under some �xation condi-tions, PI shows highly selective nuclear staining. Other preparations of cells and tissues require a simple treatment with a ribonuclease (RNase) to achieve speci�c nuclear staining. PI provides an excellent counterstain for cells stained with green-�uorescent probes or secondary antibodies conjugated to Alexa Fluor® 488, Oregon Green®, BODIPY® FL or �uorescein dyes.
Figure 12.5.27 Fluorescence excitation and emission spec-tra of SYTOX® Red nucleic acid stain bound to DNA.
Wavelength (nm)
Fluo
resc
ence
exc
itatio
n
Fluo
resc
ence
em
issi
on
450 700650500 550 600 750
Figure 12.5.26 Day 10 of development of a Drosophila ovarian egg chamber assembly line. The nuclei of fol-licle and nurse cells were labeled with propidium iodide (P1304MP, P3566, P21493) and visualized by confocal laser-scanning microscopy using excitation by the 568 nm spectral line of an Ar-Kr laser. Image contributed by Sandra Orsulic, University of North Carolina at Chapel Hill.
Figure 12.5.25 Absorption and �uorescence emission spectra of SYTOX® Orange nucleic acid stain bound to DNA.
Figure 12.5.24 True blue chloride (T1323).
The Molecular Probes™ Handbook: A Guide to Fluorescent Probes and Labeling Technologies
IMPORTANT NOTICE : The products described in this manual are covered by one or more Limited Use Label License(s). Please refer to the Appendix on page 971 and Master Product List on page 975. Products are For Research Use Only. Not intended for any animal or human therapeutic or diagnostic use.thermofisher.com/probes
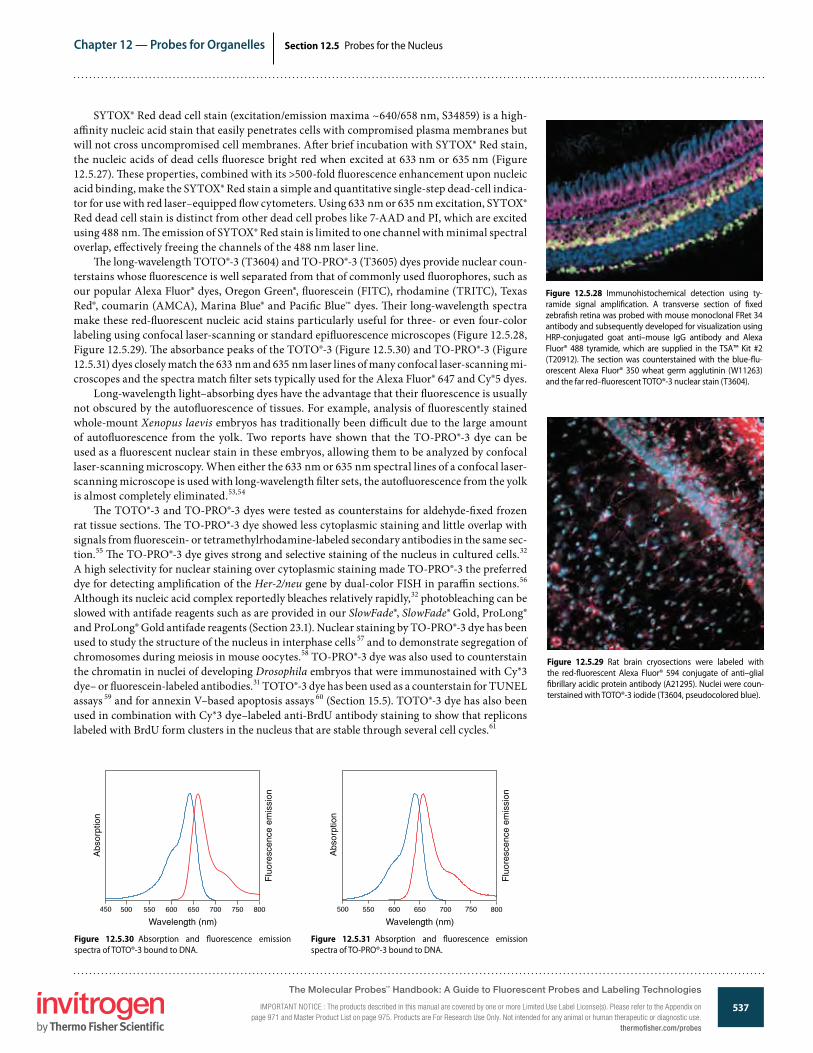
537
Chapter 12 — Probes for Organelles
www.invitrogen.com/probes
The Molecular Probes® Handbook: A Guide to Fluorescent Probes and Labeling TechnologiesIMPORTANT NOTICE: The products described in this manual are covered by one or more Limited Use Label License(s). Please refer to the Appendix on page 971 and Master Product List on page 975. Products are For Research Use Only. Not intended for any animal or human therapeutic or diagnostic use.
Section 12.5 Probes for the Nucleus
SYTOX® Red dead cell stain (excitation/emission maxima ~640/658 nm, S34859) is a high-a�nity nucleic acid stain that easily penetrates cells with compromised plasma membranes but will not cross uncompromised cell membranes. A�er brief incubation with SYTOX® Red stain, the nucleic acids of dead cells �uoresce bright red when excited at 633 nm or 635 nm (Figure 12.5.27). �ese properties, combined with its >500-fold �uorescence enhancement upon nucleic acid binding, make the SYTOX® Red stain a simple and quantitative single-step dead-cell indica-tor for use with red laser–equipped �ow cytometers. Using 633 nm or 635 nm excitation, SYTOX® Red dead cell stain is distinct from other dead cell probes like 7-AAD and PI, which are excited using 488 nm. �e emission of SYTOX® Red stain is limited to one channel with minimal spectral overlap, e�ectively freeing the channels of the 488 nm laser line.
�e long-wavelength TOTO®-3 (T3604) and TO-PRO®-3 (T3605) dyes provide nuclear coun-terstains whose �uorescence is well separated from that of commonly used �uorophores, such as our popular Alexa Fluor® dyes, Oregon Green®, �uorescein (FITC), rhodamine (TRITC), Texas Red®, coumarin (AMCA), Marina Blue® and Paci�c Blue™ dyes. �eir long-wavelength spectra make these red-�uorescent nucleic acid stains particularly useful for three- or even four-color labeling using confocal laser-scanning or standard epi�uorescence microscopes (Figure 12.5.28, Figure 12.5.29). �e absorbance peaks of the TOTO®-3 (Figure 12.5.30) and TO-PRO®-3 (Figure 12.5.31) dyes closely match the 633 nm and 635 nm laser lines of many confocal laser-scanning mi-croscopes and the spectra match �lter sets typically used for the Alexa Fluor® 647 and Cy®5 dyes.
Long-wavelength light–absorbing dyes have the advantage that their �uorescence is usually not obscured by the auto�uorescence of tissues. For example, analysis of �uorescently stained whole-mount Xenopus laevis embryos has traditionally been di�cult due to the large amount of auto�uorescence from the yolk. Two reports have shown that the TO-PRO®-3 dye can be used as a �uorescent nuclear stain in these embryos, allowing them to be analyzed by confocal laser-scanning microscopy. When either the 633 nm or 635 nm spectral lines of a confocal laser-scanning microscope is used with long-wavelength �lter sets, the auto�uorescence from the yolk is almost completely eliminated.53,54
�e TOTO®-3 and TO-PRO®-3 dyes were tested as counterstains for aldehyde-�xed frozen rat tissue sections. �e TO-PRO®-3 dye showed less cytoplasmic staining and little overlap with signals from �uorescein- or tetramethylrhodamine-labeled secondary antibodies in the same sec-tion.55 �e TO-PRO®-3 dye gives strong and selective staining of the nucleus in cultured cells.32 A high selectivity for nuclear staining over cytoplasmic staining made TO-PRO®-3 the preferred dye for detecting ampli�cation of the Her-2/neu gene by dual-color FISH in para�n sections.56 Although its nucleic acid complex reportedly bleaches relatively rapidly,32 photobleaching can be slowed with antifade reagents such as are provided in our SlowFade®, SlowFade® Gold, ProLong® and ProLong® Gold antifade reagents (Section 23.1). Nuclear staining by TO-PRO®-3 dye has been used to study the structure of the nucleus in interphase cells 57 and to demonstrate segregation of chromosomes during meiosis in mouse oocytes.58 TO-PRO®-3 dye was also used to counterstain the chromatin in nuclei of developing Drosophila embryos that were immunostained with Cy®3 dye– or �uorescein-labeled antibodies.31 TOTO®-3 dye has been used as a counterstain for TUNEL assays 59 and for annexin V–based apoptosis assays 60 (Section 15.5). TOTO®-3 dye has also been used in combination with Cy®3 dye–labeled anti-BrdU antibody staining to show that replicons labeled with BrdU form clusters in the nucleus that are stable through several cell cycles.61
Figure 12.5.28 Immunohistochemical detection using ty-ramide signal ampli�cation. A transverse section of �xed zebra �sh retina was probed with mouse monoclonal FRet 34 antibody and subsequently developed for visualization using HRP-conjugated goat anti–mouse IgG antibody and Alexa Fluor® 488 tyramide, which are supplied in the TSA™ Kit #2 (T20912). The section was counterstained with the blue-�u-orescent Alexa Fluor® 350 wheat germ agglutinin (W11263) and the far red–�uorescent TOTO®-3 nuclear stain (T3604).
Figure 12.5.31 Absorption and �uorescence emission spectra of TO-PRO®-3 bound to DNA.
Figure 12.5.30 Absorption and �uorescence emission spectra of TOTO®-3 bound to DNA.
Figure 12.5.29 Rat brain cryosections were labeled with the red-�uorescent Alexa Fluor® 594 conjugate of anti–glial �brillary acidic protein antibody (A21295). Nuclei were coun-terstained with TOTO®-3 iodide (T3604, pseudocolored blue).
The Molecular Probes™ Handbook: A Guide to Fluorescent Probes and Labeling Technologies
IMPORTANT NOTICE : The products described in this manual are covered by one or more Limited Use Label License(s). Please refer to the Appendix on page 971 and Master Product List on page 975. Products are For Research Use Only. Not intended for any animal or human therapeutic or diagnostic use.
thermofisher.com/probes
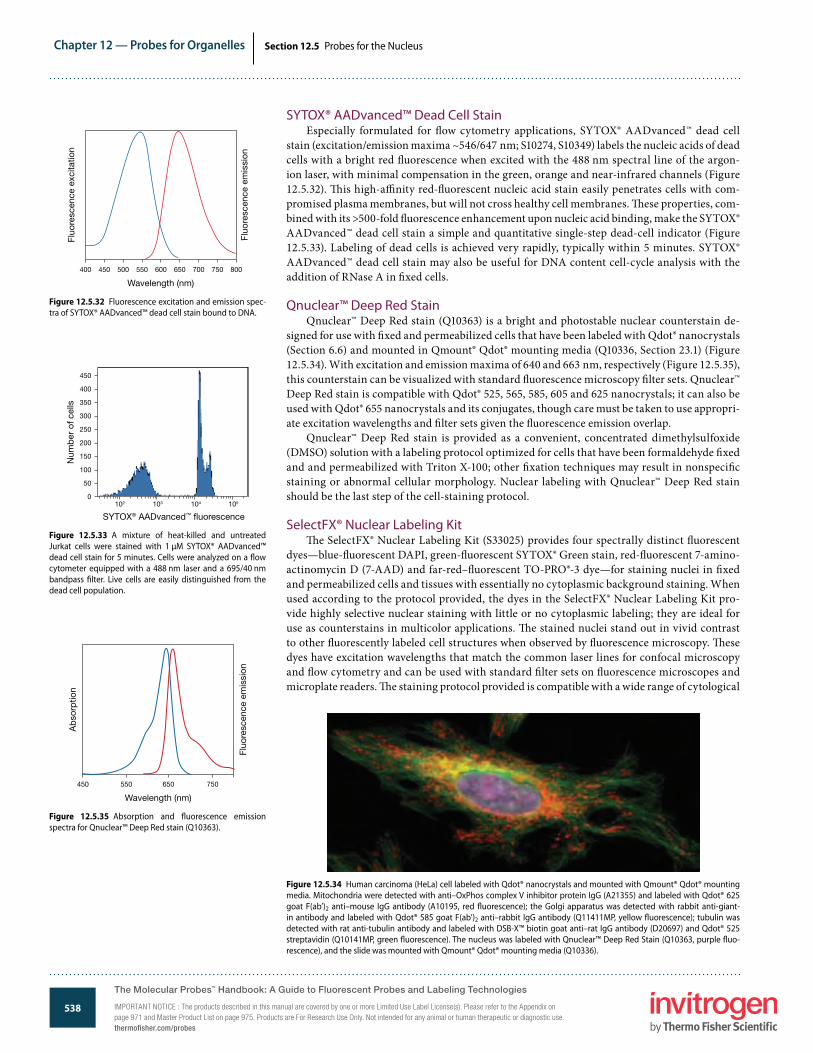
538
Chapter 12 — Probes for Organelles
www.invitrogen.com/probes
The Molecular Probes® Handbook: A Guide to Fluorescent Probes and Labeling TechnologiesIMPORTANT NOTICE: The products described in this manual are covered by one or more Limited Use Label License(s). Please refer to the Appendix on page 971 and Master Product List on page 975. Products are For Research Use Only. Not intended for any animal or human therapeutic or diagnostic use.
Section 12.5 Probes for the Nucleus
SYTOX® AADvanced™ Dead Cell StainEspecially formulated for �ow cytometry applications, SYTOX® AADvanced™ dead cell
stain (excitation/emission maxima ~546/647 nm; S10274, S10349) labels the nucleic acids of dead cells with a bright red �uorescence when excited with the 488 nm spectral line of the argon-ion laser, with minimal compensation in the green, orange and near-infrared channels (Figure 12.5.32). �is high-a�nity red-�uorescent nucleic acid stain easily penetrates cells with com-promised plasma membranes, but will not cross healthy cell membranes. �ese properties, com-bined with its >500-fold �uorescence enhancement upon nucleic acid binding, make the SYTOX® AADvanced™ dead cell stain a simple and quantitative single-step dead-cell indicator (Figure 12.5.33). Labeling of dead cells is achieved very rapidly, typically within 5 minutes. SYTOX® AADvanced™ dead cell stain may also be useful for DNA content cell-cycle analysis with the addition of RNase A in �xed cells.
Qnuclear™ Deep Red StainQnuclear™ Deep Red stain (Q10363) is a bright and photostable nuclear counterstain de-
signed for use with �xed and permeabilized cells that have been labeled with Qdot® nanocrystals (Section 6.6) and mounted in Qmount® Qdot® mounting media (Q10336, Section 23.1) (Figure 12.5.34). With excitation and emission maxima of 640 and 663 nm, respectively (Figure 12.5.35), this counterstain can be visualized with standard �uorescence microscopy �lter sets. Qnuclear™ Deep Red stain is compatible with Qdot® 525, 565, 585, 605 and 625 nanocrystals; it can also be used with Qdot® 655 nanocrystals and its conjugates, though care must be taken to use appropri-ate excitation wavelengths and �lter sets given the �uorescence emission overlap.
Qnuclear™ Deep Red stain is provided as a convenient, concentrated dimethylsulfoxide (DMSO) solution with a labeling protocol optimized for cells that have been formaldehyde �xed and and permeabilized with Triton X-100; other �xation techniques may result in nonspeci�c staining or abnormal cellular morphology. Nuclear labeling with Qnuclear™ Deep Red stain should be the last step of the cell-staining protocol.
SelectFX® Nuclear Labeling Kit�e SelectFX® Nuclear Labeling Kit (S33025) provides four spectrally distinct �uorescent
dyes—blue-�uorescent DAPI, green-�uorescent SYTOX® Green stain, red-�uorescent 7-amino-actinomycin D (7-AAD) and far-red–�uorescent TO-PRO®-3 dye—for staining nuclei in �xed and permeabilized cells and tissues with essentially no cytoplasmic background staining. When used according to the protocol provided, the dyes in the SelectFX® Nuclear Labeling Kit pro-vide highly selective nuclear staining with little or no cytoplasmic labeling; they are ideal for use as counterstains in multicolor applications. �e stained nuclei stand out in vivid contrast to other �uorescently labeled cell structures when observed by �uorescence microscopy. �ese dyes have excitation wavelengths that match the common laser lines for confocal microscopy and �ow cytometry and can be used with standard �lter sets on �uorescence microscopes and microplate readers. �e staining protocol provided is compatible with a wide range of cytological
Figure 12.5.34 Human carcinoma (HeLa) cell labeled with Qdot® nanocrystals and mounted with Qmount® Qdot® mounting media. Mitochondria were detected with anti–OxPhos complex V inhibitor protein IgG (A21355) and labeled with Qdot® 625 goat F(ab’)2 anti–mouse IgG antibody (A10195, red �uorescence); the Golgi apparatus was detected with rabbit anti-giant-in antibody and labeled with Qdot® 585 goat F(ab’)2 anti–rabbit IgG antibody (Q11411MP, yellow �uorescence); tubulin was detected with rat anti-tubulin antibody and labeled with DSB-X™ biotin goat anti–rat IgG antibody (D20697) and Qdot® 525 streptavidin (Q10141MP, green �uorescence). The nucleus was labeled with Qnuclear™ Deep Red Stain (Q10363, purple �uo-rescence), and the slide was mounted with Qmount® Qdot® mounting media (Q10336).
Figure 12.5.35 Absorption and �uorescence emission spectra for Qnuclear™ Deep Red stain (Q10363).
Wavelength (nm)
Ab
sorp
tion
Fluo
resc
ence
em
issi
on
450 750550 650
Figure 12.5.33 A mixture of heat-killed and untreated Jurkat cells were stained with 1 µM SYTOX® AADvanced™ dead cell stain for 5 minutes. Cells were analyzed on a �ow cytometer equipped with a 488 nm laser and a 695/40 nm bandpass �lter. Live cells are easily distinguished from the dead cell population.
SYTOX® AADvanced™ �uorescence
Num
ber
of c
ells
1020
50
100
150
200
250
300
350
400
450
103 104 105
Figure 12.5.32 Fluorescence excitation and emission spec-tra of SYTOX® AADvanced™ dead cell stain bound to DNA.
Wavelength (nm)
Fluo
resc
ence
exc
itatio
n
Fluo
resc
ence
em
issi
on
400 750650 700600450 500 550 800
The Molecular Probes™ Handbook: A Guide to Fluorescent Probes and Labeling Technologies
IMPORTANT NOTICE : The products described in this manual are covered by one or more Limited Use Label License(s). Please refer to the Appendix on page 971 and Master Product List on page 975. Products are For Research Use Only. Not intended for any animal or human therapeutic or diagnostic use.thermofisher.com/probes
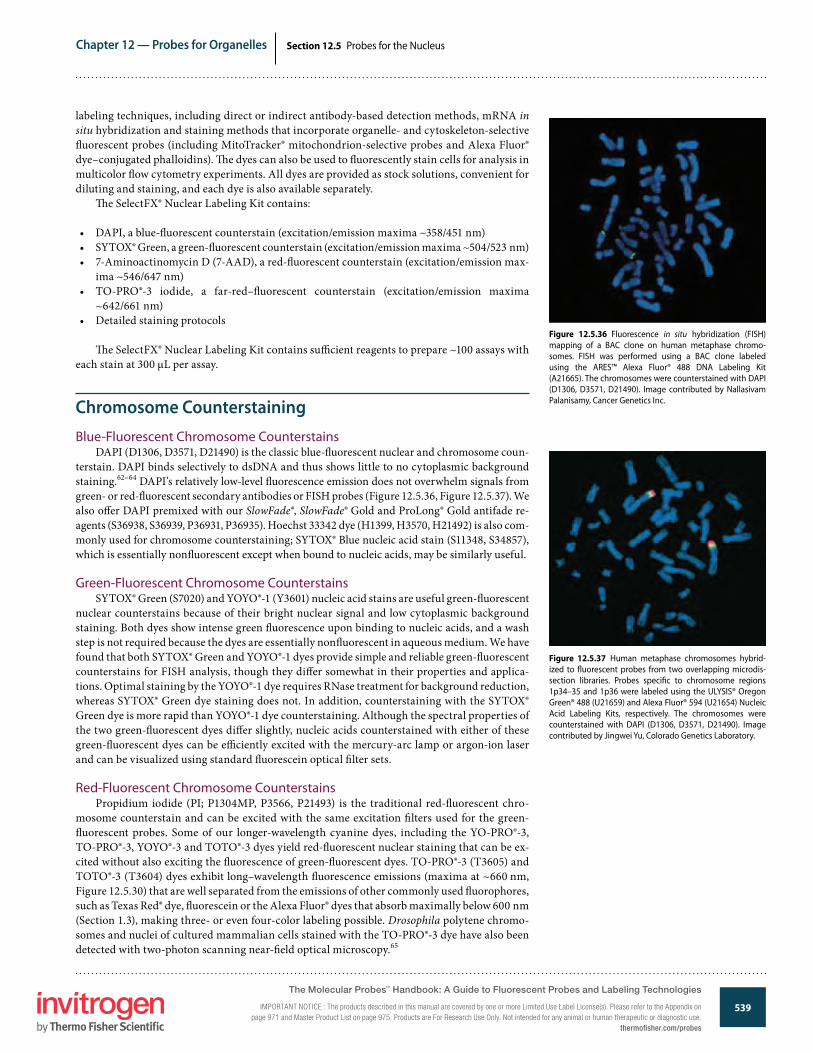
539
Chapter 12 — Probes for Organelles
www.invitrogen.com/probes
The Molecular Probes® Handbook: A Guide to Fluorescent Probes and Labeling TechnologiesIMPORTANT NOTICE: The products described in this manual are covered by one or more Limited Use Label License(s). Please refer to the Appendix on page 971 and Master Product List on page 975. Products are For Research Use Only. Not intended for any animal or human therapeutic or diagnostic use.
Section 12.5 Probes for the Nucleus
Figure 12.5.36 Fluorescence in situ hybridization (FISH) mapping of a BAC clone on human metaphase chromo-somes. FISH was performed using a BAC clone labeled using the ARES™ Alexa Fluor® 488 DNA Labeling Kit (A21665). The chromosomes were counterstained with DAPI (D1306, D3571, D21490). Image contributed by Nallasivam Palanisamy, Cancer Genetics Inc.
labeling techniques, including direct or indirect antibody-based detection methods, mRNA in situ hybridization and staining methods that incorporate organelle- and cytoskeleton-selective �uorescent probes (including MitoTracker® mitochondrion-selective probes and Alexa Fluor® dye–conjugated phalloidins). �e dyes can also be used to �uorescently stain cells for analysis in multicolor �ow cytometry experiments. All dyes are provided as stock solutions, convenient for diluting and staining, and each dye is also available separately.
�e SelectFX® Nuclear Labeling Kit contains:
• DAPI, a blue-�uorescent counterstain (excitation/emission maxima ~358/451 nm)• SYTOX® Green, a green-�uorescent counterstain (excitation/emission maxima ~504/523 nm)• 7-Aminoactinomycin D (7-AAD), a red-�uorescent counterstain (excitation/emission max-
ima ~546/647 nm)• TO-PRO®-3 iodide, a far-red–�uorescent counterstain (excitation/emission maxima
~642/661 nm)• Detailed staining protocols
�e SelectFX® Nuclear Labeling Kit contains su�cient reagents to prepare ~100 assays with each stain at 300 µL per assay.
Chromosome CounterstainingBlue-Fluorescent Chromosome Counterstains
DAPI (D1306, D3571, D21490) is the classic blue-�uorescent nuclear and chromosome coun-terstain. DAPI binds selectively to dsDNA and thus shows little to no cytoplasmic background staining.62–64 DAPI’s relatively low-level �uorescence emission does not overwhelm signals from green- or red-�uorescent secondary antibodies or FISH probes (Figure 12.5.36, Figure 12.5.37). We also o�er DAPI premixed with our SlowFade®, SlowFade® Gold and ProLong® Gold antifade re-agents (S36938, S36939, P36931, P36935). Hoechst 33342 dye (H1399, H3570, H21492) is also com-monly used for chromosome counterstaining; SYTOX® Blue nucleic acid stain (S11348, S34857), which is essentially non�uorescent except when bound to nucleic acids, may be similarly useful.
Green-Fluorescent Chromosome CounterstainsSYTOX® Green (S7020) and YOYO®-1 (Y3601) nucleic acid stains are useful green-�uorescent
nuclear counterstains because of their bright nuclear signal and low cytoplasmic background staining. Both dyes show intense green �uorescence upon binding to nucleic acids, and a wash step is not required because the dyes are essentially non�uorescent in aqueous medium. We have found that both SYTOX® Green and YOYO®-1 dyes provide simple and reliable green-�uorescent counterstains for FISH analysis, though they di�er somewhat in their properties and applica-tions. Optimal staining by the YOYO®-1 dye requires RNase treatment for background reduction, whereas SYTOX® Green dye staining does not. In addition, counterstaining with the SYTOX® Green dye is more rapid than YOYO®-1 dye counterstaining. Although the spectral properties of the two green-�uorescent dyes di�er slightly, nucleic acids counterstained with either of these green-�uorescent dyes can be e�ciently excited with the mercury-arc lamp or argon-ion laser and can be visualized using standard �uorescein optical �lter sets.
Red-Fluorescent Chromosome CounterstainsPropidium iodide (PI; P1304MP, P3566, P21493) is the traditional red-�uorescent chro-
mosome counterstain and can be excited with the same excitation �lters used for the green-�uorescent probes. Some of our longer-wavelength cyanine dyes, including the YO-PRO®-3, TO-PRO®-3, YOYO®-3 and TOTO®-3 dyes yield red-�uorescent nuclear staining that can be ex-cited without also exciting the �uorescence of green-�uorescent dyes. TO-PRO®-3 (T3605) and TOTO®-3 (T3604) dyes exhibit long–wavelength �uorescence emissions (maxima at ~660 nm, Figure 12.5.30) that are well separated from the emissions of other commonly used �uorophores, such as Texas Red® dye, �uorescein or the Alexa Fluor® dyes that absorb maximally below 600 nm (Section 1.3), making three- or even four-color labeling possible. Drosophila polytene chromo-somes and nuclei of cultured mammalian cells stained with the TO-PRO®-3 dye have also been detected with two-photon scanning near-�eld optical microscopy.65
Figure 12.5.37 Human metaphase chromosomes hybrid-ized to �uorescent probes from two overlapping microdis-section libraries. Probes speci�c to chromosome regions 1p34–35 and 1p36 were labeled using the ULYSIS® Oregon Green® 488 (U21659) and Alexa Fluor® 594 (U21654) Nucleic Acid Labeling Kits, respectively. The chromosomes were counterstained with DAPI (D1306, D3571, D21490). Image contributed by Jingwei Yu, Colorado Genetics Laboratory.
The Molecular Probes™ Handbook: A Guide to Fluorescent Probes and Labeling Technologies
IMPORTANT NOTICE : The products described in this manual are covered by one or more Limited Use Label License(s). Please refer to the Appendix on page 971 and Master Product List on page 975. Products are For Research Use Only. Not intended for any animal or human therapeutic or diagnostic use.
thermofisher.com/probes
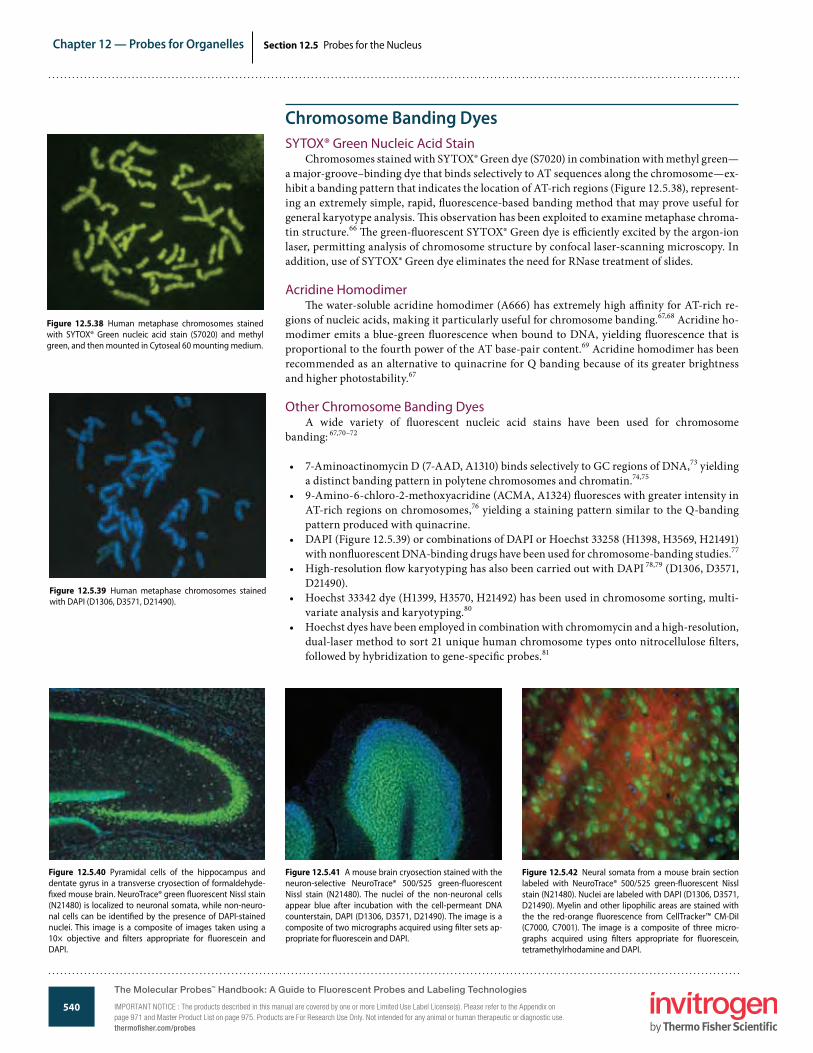
540
Chapter 12 — Probes for Organelles
www.invitrogen.com/probes
The Molecular Probes® Handbook: A Guide to Fluorescent Probes and Labeling TechnologiesIMPORTANT NOTICE: The products described in this manual are covered by one or more Limited Use Label License(s). Please refer to the Appendix on page 971 and Master Product List on page 975. Products are For Research Use Only. Not intended for any animal or human therapeutic or diagnostic use.
Section 12.5 Probes for the Nucleus
Chromosome Banding DyesSYTOX® Green Nucleic Acid Stain
Chromosomes stained with SYTOX® Green dye (S7020) in combination with methyl green—a major-groove–binding dye that binds selectively to AT sequences along the chromosome—ex-hibit a banding pattern that indicates the location of AT-rich regions (Figure 12.5.38), represent-ing an extremely simple, rapid, �uorescence-based banding method that may prove useful for general karyotype analysis. �is observation has been exploited to examine metaphase chroma-tin structure.66 �e green-�uorescent SYTOX® Green dye is e�ciently excited by the argon-ion laser, permitting analysis of chromosome structure by confocal laser-scanning microscopy. In addition, use of SYTOX® Green dye eliminates the need for RNase treatment of slides.
Acridine Homodimer�e water-soluble acridine homodimer (A666) has extremely high a�nity for AT-rich re-
gions of nucleic acids, making it particularly useful for chromosome banding.67,68 Acridine ho-modimer emits a blue-green �uorescence when bound to DNA, yielding �uorescence that is proportional to the fourth power of the AT base-pair content.69 Acridine homodimer has been recommended as an alternative to quinacrine for Q banding because of its greater brightness and higher photostability.67
Other Chromosome Banding DyesA wide variety of �uorescent nucleic acid stains have been used for chromosome
banding: 67,70–72
• 7-Aminoactinomycin D (7-AAD, A1310) binds selectively to GC regions of DNA,73 yielding a distinct banding pattern in polytene chromosomes and chromatin.74,75
• 9-Amino-6-chloro-2-methoxyacridine (ACMA, A1324) �uoresces with greater intensity in AT-rich regions on chromosomes,76 yielding a staining pattern similar to the Q-banding pattern produced with quinacrine.
• DAPI (Figure 12.5.39) or combinations of DAPI or Hoechst 33258 (H1398, H3569, H21491) with non�uorescent DNA-binding drugs have been used for chromosome-banding studies.77
• High-resolution �ow karyotyping has also been carried out with DAPI 78,79 (D1306, D3571, D21490).
• Hoechst 33342 dye (H1399, H3570, H21492) has been used in chromosome sorting, multi-variate analysis and karyotyping.80
• Hoechst dyes have been employed in combination with chromomycin and a high-resolution, dual-laser method to sort 21 unique human chromosome types onto nitrocellulose �lters, followed by hybridization to gene-speci�c probes.81
Figure 12.5.42 Neural somata from a mouse brain section labeled with NeuroTrace® 500/525 green-�uorescent Nissl stain (N21480). Nuclei are labeled with DAPI (D1306, D3571, D21490). Myelin and other lipophilic areas are stained with the the red-orange �uorescence from CellTracker™ CM-DiI (C7000, C7001). The image is a composite of three micro-graphs acquired using �lters appropriate for �uorescein, tetra methylrhodamine and DAPI.
Figure 12.5.41 A mouse brain cryosection stained with the neuron-selective NeuroTrace® 500/525 green-�uorescent Nissl stain (N21480). The nuclei of the non-neuronal cells appear blue after incubation with the cell-permeant DNA counterstain, DAPI (D1306, D3571, D21490). The image is a composite of two micrographs acquired using �lter sets ap-propriate for �uorescein and DAPI.
Figure 12.5.40 Pyramidal cells of the hippocampus and dentate gyrus in a transverse cryosection of formaldehyde-�xed mouse brain. NeuroTrace® green �uorescent Nissl stain (N21480) is localized to neuronal somata, while non-neuro-nal cells can be identi�ed by the presence of DAPI-stained nuclei. This image is a composite of images taken using a 10× objective and �lters appropriate for �uorescein and DAPI.
Figure 12.5.38 Human metaphase chromosomes stained with SYTOX® Green nucleic acid stain (S7020) and methyl green, and then mounted in Cytoseal 60 mounting medium.
Figure 12.5.39 Human metaphase chromosomes stained with DAPI (D1306, D3571, D21490).
The Molecular Probes™ Handbook: A Guide to Fluorescent Probes and Labeling Technologies
IMPORTANT NOTICE : The products described in this manual are covered by one or more Limited Use Label License(s). Please refer to the Appendix on page 971 and Master Product List on page 975. Products are For Research Use Only. Not intended for any animal or human therapeutic or diagnostic use.thermofisher.com/probes
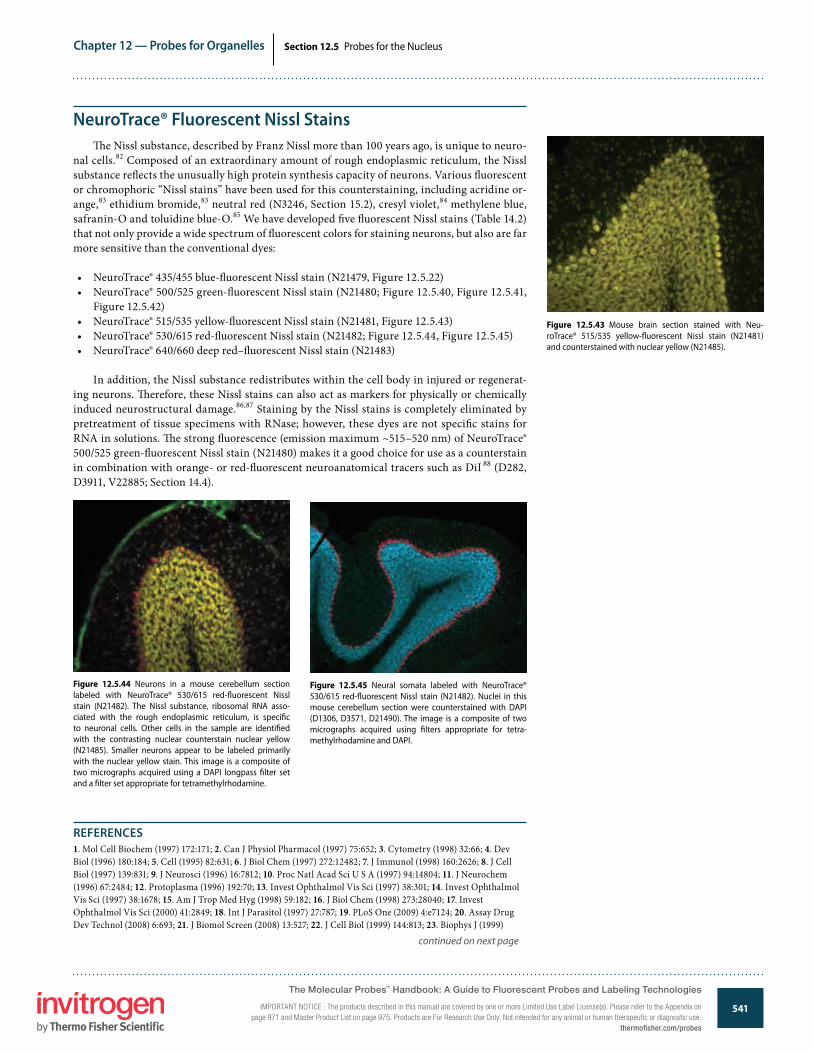
541
Chapter 12 — Probes for Organelles
www.invitrogen.com/probes
The Molecular Probes® Handbook: A Guide to Fluorescent Probes and Labeling TechnologiesIMPORTANT NOTICE: The products described in this manual are covered by one or more Limited Use Label License(s). Please refer to the Appendix on page 971 and Master Product List on page 975. Products are For Research Use Only. Not intended for any animal or human therapeutic or diagnostic use.
Section 12.5 Probes for the Nucleus
NeuroTrace® Fluorescent Nissl Stains�e Nissl substance, described by Franz Nissl more than 100 years ago, is unique to neuro-
nal cells.82 Composed of an extraordinary amount of rough endoplasmic reticulum, the Nissl substance re�ects the unusually high protein synthesis capacity of neurons. Various �uorescent or chromophoric “Nissl stains” have been used for this counterstaining, including acridine or-ange,83 ethidium bromide,83 neutral red (N3246, Section 15.2), cresyl violet,84 methylene blue, safranin-O and toluidine blue-O.85 We have developed �ve �uorescent Nissl stains (Table 14.2) that not only provide a wide spectrum of �uorescent colors for staining neurons, but also are far more sensitive than the conventional dyes:
• NeuroTrace® 435/455 blue-�uorescent Nissl stain (N21479, Figure 12.5.22)• NeuroTrace® 500/525 green-�uorescent Nissl stain (N21480; Figure 12.5.40, Figure 12.5.41,
Figure 12.5.42)• NeuroTrace® 515/535 yellow-�uorescent Nissl stain (N21481, Figure 12.5.43)• NeuroTrace® 530/615 red-�uorescent Nissl stain (N21482; Figure 12.5.44, Figure 12.5.45)• NeuroTrace® 640/660 deep red–�uorescent Nissl stain (N21483)
In addition, the Nissl substance redistributes within the cell body in injured or regenerat-ing neurons. �erefore, these Nissl stains can also act as markers for physically or chemically induced neurostructural damage.86,87 Staining by the Nissl stains is completely eliminated by pretreatment of tissue specimens with RNase; however, these dyes are not speci�c stains for RNA in solutions. �e strong �uorescence (emission maximum ~515–520 nm) of NeuroTrace® 500/525 green-�uorescent Nissl stain (N21480) makes it a good choice for use as a counterstain in combination with orange- or red-�uorescent neuroanatomical tracers such as DiI 88 (D282, D3911, V22885; Section 14.4).
Figure 12.5.44 Neurons in a mouse cerebellum section labeled with NeuroTrace® 530/615 red-�uorescent Nissl stain (N21482). The Nissl substance, ribosomal RNA asso-ciated with the rough endoplasmic reticulum, is speci�c to neuronal cells. Other cells in the sample are identi�ed with the contrasting nuclear counterstain nuclear yellow (N21485). Smaller neurons appear to be labeled primarily with the nuclear yellow stain. This image is a composite of two micrographs acquired using a DAPI longpass �lter set and a �lter set appropriate for tetramethylrhodamine.
Figure 12.5.45 Neural somata labeled with NeuroTrace® 530/615 red-�uorescent Nissl stain (N21482). Nuclei in this mouse cerebellum section were counterstained with DAPI (D1306, D3571, D21490). The image is a composite of two micrographs acquired using �lters appropriate for tetra-methylrhodamine and DAPI.
Figure 12.5.43 Mouse brain section stained with Neu-roTrace® 515/535 yellow-�uorescent Nissl stain (N21481) and counterstained with nuclear yellow (N21485).
REFERENCES1. Mol Cell Biochem (1997) 172:171; 2. Can J Physiol Pharmacol (1997) 75:652; 3. Cytometry (1998) 32:66; 4. Dev Biol (1996) 180:184; 5. Cell (1995) 82:631; 6. J Biol Chem (1997) 272:12482; 7. J Immunol (1998) 160:2626; 8. J Cell Biol (1997) 139:831; 9. J Neurosci (1996) 16:7812; 10. Proc Natl Acad Sci U S A (1997) 94:14804; 11. J Neurochem (1996) 67:2484; 12. Protoplasma (1996) 192:70; 13. Invest Ophthalmol Vis Sci (1997) 38:301; 14. Invest Ophthalmol Vis Sci (1997) 38:1678; 15. Am J Trop Med Hyg (1998) 59:182; 16. J Biol Chem (1998) 273:28040; 17. Invest Ophthalmol Vis Sci (2000) 41:2849; 18. Int J Parasitol (1997) 27:787; 19. PLoS One (2009) 4:e7124; 20. Assay Drug Dev Technol (2008) 6:693; 21. J Biomol Screen (2008) 13:527; 22. J Cell Biol (1999) 144:813; 23. Biophys J (1999)
continued on next page
The Molecular Probes™ Handbook: A Guide to Fluorescent Probes and Labeling Technologies
IMPORTANT NOTICE : The products described in this manual are covered by one or more Limited Use Label License(s). Please refer to the Appendix on page 971 and Master Product List on page 975. Products are For Research Use Only. Not intended for any animal or human therapeutic or diagnostic use.
thermofisher.com/probes
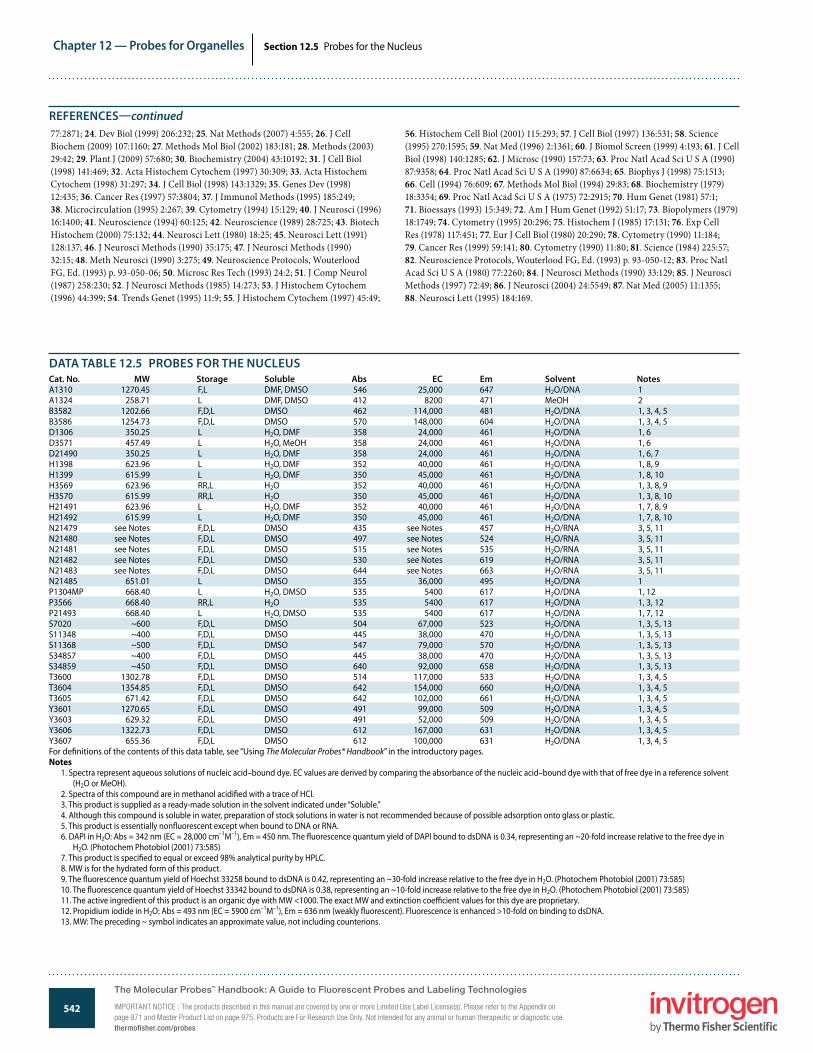
542
Chapter 12 — Probes for Organelles
www.invitrogen.com/probes
The Molecular Probes® Handbook: A Guide to Fluorescent Probes and Labeling TechnologiesIMPORTANT NOTICE: The products described in this manual are covered by one or more Limited Use Label License(s). Please refer to the Appendix on page 971 and Master Product List on page 975. Products are For Research Use Only. Not intended for any animal or human therapeutic or diagnostic use.
Section 12.5 Probes for the Nucleus
DATA TABLE 12.5 PROBES FOR THE NUCLEUSCat. No. MW Storage Soluble Abs EC Em Solvent NotesA1310 1270.45 F,L DMF, DMSO 546 25,000 647 H2O/DNA 1A1324 258.71 L DMF, DMSO 412 8200 471 MeOH 2B3582 1202.66 F,D,L DMSO 462 114,000 481 H2O/DNA 1, 3, 4, 5B3586 1254.73 F,D,L DMSO 570 148,000 604 H2O/DNA 1, 3, 4, 5D1306 350.25 L H2O, DMF 358 24,000 461 H2O/DNA 1, 6D3571 457.49 L H2O, MeOH 358 24,000 461 H2O/DNA 1, 6D21490 350.25 L H2O, DMF 358 24,000 461 H2O/DNA 1, 6, 7H1398 623.96 L H2O, DMF 352 40,000 461 H2O/DNA 1, 8, 9H1399 615.99 L H2O, DMF 350 45,000 461 H2O/DNA 1, 8, 10H3569 623.96 RR,L H2O 352 40,000 461 H2O/DNA 1, 3, 8, 9H3570 615.99 RR,L H2O 350 45,000 461 H2O/DNA 1, 3, 8, 10H21491 623.96 L H2O, DMF 352 40,000 461 H2O/DNA 1, 7, 8, 9H21492 615.99 L H2O, DMF 350 45,000 461 H2O/DNA 1, 7, 8, 10N21479 see Notes F,D,L DMSO 435 see Notes 457 H2O/RNA 3, 5, 11N21480 see Notes F,D,L DMSO 497 see Notes 524 H2O/RNA 3, 5, 11N21481 see Notes F,D,L DMSO 515 see Notes 535 H2O/RNA 3, 5, 11N21482 see Notes F,D,L DMSO 530 see Notes 619 H2O/RNA 3, 5, 11N21483 see Notes F,D,L DMSO 644 see Notes 663 H2O/RNA 3, 5, 11N21485 651.01 L DMSO 355 36,000 495 H2O/DNA 1P1304MP 668.40 L H2O, DMSO 535 5400 617 H2O/DNA 1, 12P3566 668.40 RR,L H2O 535 5400 617 H2O/DNA 1, 3, 12P21493 668.40 L H2O, DMSO 535 5400 617 H2O/DNA 1, 7, 12S7020 ~600 F,D,L DMSO 504 67,000 523 H2O/DNA 1, 3, 5, 13S11348 ~400 F,D,L DMSO 445 38,000 470 H2O/DNA 1, 3, 5, 13S11368 ~500 F,D,L DMSO 547 79,000 570 H2O/DNA 1, 3, 5, 13S34857 ~400 F,D,L DMSO 445 38,000 470 H2O/DNA 1, 3, 5, 13S34859 ~450 F,D,L DMSO 640 92,000 658 H2O/DNA 1, 3, 5, 13T3600 1302.78 F,D,L DMSO 514 117,000 533 H2O/DNA 1, 3, 4, 5T3604 1354.85 F,D,L DMSO 642 154,000 660 H2O/DNA 1, 3, 4, 5T3605 671.42 F,D,L DMSO 642 102,000 661 H2O/DNA 1, 3, 4, 5Y3601 1270.65 F,D,L DMSO 491 99,000 509 H2O/DNA 1, 3, 4, 5Y3603 629.32 F,D,L DMSO 491 52,000 509 H2O/DNA 1, 3, 4, 5Y3606 1322.73 F,D,L DMSO 612 167,000 631 H2O/DNA 1, 3, 4, 5Y3607 655.36 F,D,L DMSO 612 100,000 631 H2O/DNA 1, 3, 4, 5For de�nitions of the contents of this data table, see “Using The Molecular Probes® Handbook” in the introductory pages.Notes
1. Spectra represent aqueous solutions of nucleic acid–bound dye. EC values are derived by comparing the absorbance of the nucleic acid–bound dye with that of free dye in a reference solvent (H2O or MeOH).
2. Spectra of this compound are in methanol acidi�ed with a trace of HCl.3. This product is supplied as a ready-made solution in the solvent indicated under “Soluble.”4. Although this compound is soluble in water, preparation of stock solutions in water is not recommended because of possible adsorption onto glass or plastic.5. This product is essentially non�uorescent except when bound to DNA or RNA.6. DAPI in H2O: Abs = 342 nm (EC = 28,000 cm–1M–1), Em = 450 nm. The �uorescence quantum yield of DAPI bound to dsDNA is 0.34, representing an ~20-fold increase relative to the free dye in
H2O. (Photochem Photobiol (2001) 73:585)7. This product is speci�ed to equal or exceed 98% analytical purity by HPLC.8. MW is for the hydrated form of this product.9. The �uorescence quantum yield of Hoechst 33258 bound to dsDNA is 0.42, representing an ~30-fold increase relative to the free dye in H2O. (Photochem Photobiol (2001) 73:585)10. The �uorescence quantum yield of Hoechst 33342 bound to dsDNA is 0.38, representing an ~10-fold increase relative to the free dye in H2O. (Photochem Photobiol (2001) 73:585)11. The active ingredient of this product is an organic dye with MW <1000. The exact MW and extinction coe�cient values for this dye are proprietary.12. Propidium iodide in H2O: Abs = 493 nm (EC = 5900 cm–1M–1), Em = 636 nm (weakly �uorescent). Fluorescence is enhanced >10-fold on binding to dsDNA.13. MW: The preceding ~ symbol indicates an approximate value, not including counterions.
77:2871; 24. Dev Biol (1999) 206:232; 25. Nat Methods (2007) 4:555; 26. J Cell Biochem (2009) 107:1160; 27. Methods Mol Biol (2002) 183:181; 28. Methods (2003) 29:42; 29. Plant J (2009) 57:680; 30. Biochemistry (2004) 43:10192; 31. J Cell Biol (1998) 141:469; 32. Acta Histochem Cytochem (1997) 30:309; 33. Acta Histochem Cytochem (1998) 31:297; 34. J Cell Biol (1998) 143:1329; 35. Genes Dev (1998) 12:435; 36. Cancer Res (1997) 57:3804; 37. J Immunol Methods (1995) 185:249; 38. Microcirculation (1995) 2:267; 39. Cytometry (1994) 15:129; 40. J Neurosci (1996) 16:1400; 41. Neuroscience (1994) 60:125; 42. Neuroscience (1989) 28:725; 43. Biotech Histochem (2000) 75:132; 44. Neurosci Lett (1980) 18:25; 45. Neurosci Lett (1991) 128:137; 46. J Neurosci Methods (1990) 35:175; 47. J Neurosci Methods (1990) 32:15; 48. Meth Neurosci (1990) 3:275; 49. Neuroscience Protocols, Wouterlood FG, Ed. (1993) p. 93-050-06; 50. Microsc Res Tech (1993) 24:2; 51. J Comp Neurol (1987) 258:230; 52. J Neurosci Methods (1985) 14:273; 53. J Histochem Cytochem (1996) 44:399; 54. Trends Genet (1995) 11:9; 55. J Histochem Cytochem (1997) 45:49;
56. Histochem Cell Biol (2001) 115:293; 57. J Cell Biol (1997) 136:531; 58. Science (1995) 270:1595; 59. Nat Med (1996) 2:1361; 60. J Biomol Screen (1999) 4:193; 61. J Cell Biol (1998) 140:1285; 62. J Microsc (1990) 157:73; 63. Proc Natl Acad Sci U S A (1990) 87:9358; 64. Proc Natl Acad Sci U S A (1990) 87:6634; 65. Biophys J (1998) 75:1513; 66. Cell (1994) 76:609; 67. Methods Mol Biol (1994) 29:83; 68. Biochemistry (1979) 18:3354; 69. Proc Natl Acad Sci U S A (1975) 72:2915; 70. Hum Genet (1981) 57:1; 71. Bioessays (1993) 15:349; 72. Am J Hum Genet (1992) 51:17; 73. Biopolymers (1979) 18:1749; 74. Cytometry (1995) 20:296; 75. Histochem J (1985) 17:131; 76. Exp Cell Res (1978) 117:451; 77. Eur J Cell Biol (1980) 20:290; 78. Cytometry (1990) 11:184; 79. Cancer Res (1999) 59:141; 80. Cytometry (1990) 11:80; 81. Science (1984) 225:57; 82. Neuroscience Protocols, Wouterlood FG, Ed. (1993) p. 93-050-12; 83. Proc Natl Acad Sci U S A (1980) 77:2260; 84. J Neurosci Methods (1990) 33:129; 85. J Neurosci Methods (1997) 72:49; 86. J Neurosci (2004) 24:5549; 87. Nat Med (2005) 11:1355; 88. Neurosci Lett (1995) 184:169.
REFERENCES—continued
The Molecular Probes™ Handbook: A Guide to Fluorescent Probes and Labeling Technologies
IMPORTANT NOTICE : The products described in this manual are covered by one or more Limited Use Label License(s). Please refer to the Appendix on page 971 and Master Product List on page 975. Products are For Research Use Only. Not intended for any animal or human therapeutic or diagnostic use.thermofisher.com/probes
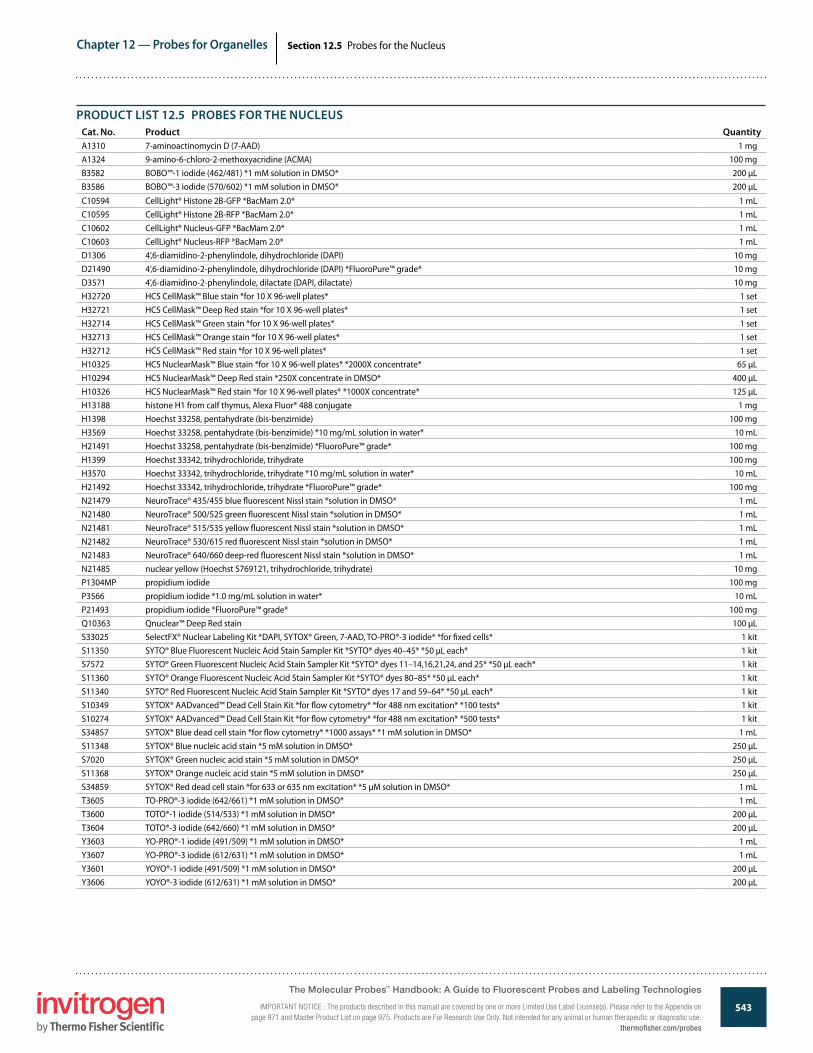
543
Chapter 12 — Probes for Organelles
www.invitrogen.com/probes
The Molecular Probes® Handbook: A Guide to Fluorescent Probes and Labeling TechnologiesIMPORTANT NOTICE: The products described in this manual are covered by one or more Limited Use Label License(s). Please refer to the Appendix on page 971 and Master Product List on page 975. Products are For Research Use Only. Not intended for any animal or human therapeutic or diagnostic use.
Section 12.5 Probes for the Nucleus
PRODUCT LIST 12.5 PROBES FOR THE NUCLEUSCat. No. Product QuantityA1310 7-aminoactinomycin D (7-AAD) 1 mgA1324 9-amino-6-chloro-2-methoxyacridine (ACMA) 100 mgB3582 BOBO™-1 iodide (462/481) *1 mM solution in DMSO* 200 µLB3586 BOBO™-3 iodide (570/602) *1 mM solution in DMSO* 200 µL
C10594 CellLight® Histone 2B-GFP *BacMam 2.0* 1 mLC10595 CellLight® Histone 2B-RFP *BacMam 2.0* 1 mLC10602 CellLight® Nucleus-GFP *BacMam 2.0* 1 mLC10603 CellLight® Nucleus-RFP *BacMam 2.0* 1 mLD1306 4’,6-diamidino-2-phenylindole, dihydrochloride (DAPI) 10 mgD21490 4’,6-diamidino-2-phenylindole, dihydrochloride (DAPI) *FluoroPure™ grade* 10 mgD3571 4’,6-diamidino-2-phenylindole, dilactate (DAPI, dilactate) 10 mgH32720 HCS CellMask™ Blue stain *for 10 X 96-well plates* 1 setH32721 HCS CellMask™ Deep Red stain *for 10 X 96-well plates* 1 setH32714 HCS CellMask™ Green stain *for 10 X 96-well plates* 1 setH32713 HCS CellMask™ Orange stain *for 10 X 96-well plates* 1 setH32712 HCS CellMask™ Red stain *for 10 X 96-well plates* 1 setH10325 HCS NuclearMask™ Blue stain *for 10 X 96-well plates* *2000X concentrate* 65 µLH10294 HCS NuclearMask™ Deep Red stain *250X concentrate in DMSO* 400 µLH10326 HCS NuclearMask™ Red stain *for 10 X 96-well plates* *1000X concentrate* 125 µLH13188 histone H1 from calf thymus, Alexa Fluor® 488 conjugate 1 mgH1398 Hoechst 33258, pentahydrate (bis-benzimide) 100 mgH3569 Hoechst 33258, pentahydrate (bis-benzimide) *10 mg/mL solution in water* 10 mLH21491 Hoechst 33258, pentahydrate (bis-benzimide) *FluoroPure™ grade* 100 mgH1399 Hoechst 33342, trihydrochloride, trihydrate 100 mgH3570 Hoechst 33342, trihydrochloride, trihydrate *10 mg/mL solution in water* 10 mLH21492 Hoechst 33342, trihydrochloride, trihydrate *FluoroPure™ grade* 100 mgN21479 NeuroTrace® 435/455 blue �uorescent Nissl stain *solution in DMSO* 1 mLN21480 NeuroTrace® 500/525 green �uorescent Nissl stain *solution in DMSO* 1 mLN21481 NeuroTrace® 515/535 yellow �uorescent Nissl stain *solution in DMSO* 1 mLN21482 NeuroTrace® 530/615 red �uorescent Nissl stain *solution in DMSO* 1 mLN21483 NeuroTrace® 640/660 deep-red �uorescent Nissl stain *solution in DMSO* 1 mLN21485 nuclear yellow (Hoechst S769121, trihydrochloride, trihydrate) 10 mgP1304MP propidium iodide 100 mgP3566 propidium iodide *1.0 mg/mL solution in water* 10 mLP21493 propidium iodide *FluoroPure™ grade* 100 mgQ10363 Qnuclear™ Deep Red stain 100 µLS33025 SelectFX® Nuclear Labeling Kit *DAPI, SYTOX® Green, 7-AAD, TO-PRO®-3 iodide* *for �xed cells* 1 kitS11350 SYTO® Blue Fluorescent Nucleic Acid Stain Sampler Kit *SYTO® dyes 40–45* *50 µL each* 1 kitS7572 SYTO® Green Fluorescent Nucleic Acid Stain Sampler Kit *SYTO® dyes 11–14,16,21,24, and 25* *50 µL each* 1 kitS11360 SYTO® Orange Fluorescent Nucleic Acid Stain Sampler Kit *SYTO® dyes 80–85* *50 µL each* 1 kitS11340 SYTO® Red Fluorescent Nucleic Acid Stain Sampler Kit *SYTO® dyes 17 and 59–64* *50 µL each* 1 kitS10349 SYTOX® AADvanced™ Dead Cell Stain Kit *for �ow cytometry* *for 488 nm excitation* *100 tests* 1 kitS10274 SYTOX® AADvanced™ Dead Cell Stain Kit *for �ow cytometry* *for 488 nm excitation* *500 tests* 1 kitS34857 SYTOX® Blue dead cell stain *for �ow cytometry* *1000 assays* *1 mM solution in DMSO* 1 mLS11348 SYTOX® Blue nucleic acid stain *5 mM solution in DMSO* 250 µLS7020 SYTOX® Green nucleic acid stain *5 mM solution in DMSO* 250 µLS11368 SYTOX® Orange nucleic acid stain *5 mM solution in DMSO* 250 µLS34859 SYTOX® Red dead cell stain *for 633 or 635 nm excitation* *5 µM solution in DMSO* 1 mLT3605 TO-PRO®-3 iodide (642/661) *1 mM solution in DMSO* 1 mLT3600 TOTO®-1 iodide (514/533) *1 mM solution in DMSO* 200 µLT3604 TOTO®-3 iodide (642/660) *1 mM solution in DMSO* 200 µLY3603 YO-PRO®-1 iodide (491/509) *1 mM solution in DMSO* 1 mLY3607 YO-PRO®-3 iodide (612/631) *1 mM solution in DMSO* 1 mLY3601 YOYO®-1 iodide (491/509) *1 mM solution in DMSO* 200 µLY3606 YOYO®-3 iodide (612/631) *1 mM solution in DMSO* 200 µL
The Molecular Probes™ Handbook: A Guide to Fluorescent Probes and Labeling Technologies
IMPORTANT NOTICE : The products described in this manual are covered by one or more Limited Use Label License(s). Please refer to the Appendix on page 971 and Master Product List on page 975. Products are For Research Use Only. Not intended for any animal or human therapeutic or diagnostic use.
thermofisher.com/probes