Embed Size (px)
Citation preview
CHAPTER 1
Environment BureauEnvironmental Protection Department
Government’s efforts inmanaging municipal solid waste
Audit CommissionHong Kong27 October 2015
This audit review was carried out under a set of guidelines tabled inthe Provisional Legislative Council by the Chairman of the PublicAccounts Committee on 11 February 1998. The guidelines wereagreed between the Public Accounts Committee and the Director ofAudit and accepted by the Government of the Hong Kong SpecialAdministrative Region.
Report No. 65 of the Director of Audit contains 10 Chapters whichare available on our website at http://www.aud.gov.hk
Audit Commission26th floor, Immigration Tower7 Gloucester RoadWan ChaiHong Kong
Tel : (852) 2829 4210Fax : (852) 2824 2087E-mail : [email protected]
— i —
GOVERNMENT’S EFFORTS INMANAGING MUNICIPAL SOLID WASTE
Contents
Paragraph
EXECUTIVE SUMMARY
PART 1: INTRODUCTION
Audit review
Acknowledgement
PART 2: REDUCTION IN MUNICIPAL SOLID WASTE
Achievement of MSW-reduction targets
Areas for improvement
Audit recommendations
Response from the Government
Implementation of producer responsibility schemeon plastic shopping bags
Areas for improvement
Audit recommendations
Response from the Government
1.1 – 1.10
1.11 – 1.14
1.15
2.1
2.2 – 2.4
2.5 – 2.33
2.34
2.35 – 2.37
2.38 – 2.43
2.44 – 2.51
2.52
2.53
— ii —
Paragraph
PART 3: RECOVERY OF MUNICIPAL SOLID WASTE
Achievement of MSW-recovery targets
Areas for improvement
Audit recommendations
Response from the Government
Implementation of source-separation programme
Areas for improvement
Audit recommendations
Response from the Government
PART 4: RECYCLING OF MUNICIPAL SOLID WASTE
Operation of EcoPark
Areas for improvement
Audit recommendations
Response from the Government
PART 5: TREATMENT AND DISPOSALOF MUNICIPAL SOLID WASTE
MSW-disposal targets
Means of treating and disposing of MSW
Development of waste treatment and disposal facilities
Areas for improvement
3.1
3.2 – 3.6
3.7 – 3.19
3.20
3.21
3.22 – 3.31
3.32 – 3.38
3.39
3.40
4.1
4.2 – 4.5
4.6 – 4.29
4.30
4.31 – 4.33
5.1
5.2 – 5.3
5.4 – 5.5
5.6 – 5.10
5.11 – 5.20
— iii —
Paragraph
Audit recommendations
Response from the Government
PART 6: WAY FORWARD
Achievement of MSW targets
MSW disposal at landfills
Implementation of major measuresfor MSW reduction and recovery
Way forward
Audit recommendations
Response from the Government
5.21
5.22
6.1
6.2
6.3
6.4 – 6.6
6.7 – 6.14
6.15
6.16
Appendices Page
A : Environmental Protection Department:Organisation chart (extract) (30 June 2015)
B : Chronology of key events of the IWMF development(1998 to 2015)
C : Acronyms and abbreviations
84
85 – 86
87

— iv —
— v —
GOVERNMENT’S EFFORTS INMANAGING MUNICIPAL SOLID WASTE
Executive Summary
1. In 2013, Hong Kong generated 5.49 million tonnes of municipal solid
waste (MSW), of which 3.48 million tonnes (63%) were disposed of at landfills and
the remaining 2.01 million tonnes (37%) were recovered for recycling. Compared
to the published statistics five years ago, the MSW quantity disposed of at landfills
had increased by 6.4% from 3.27 million tonnes in 2009 to 3.48 million tonnes in
2013, and MSW recovery rate had decreased from 49% in 2009 to 37% in 2013. In
terms of weight, the quantity of the MSW disposed of at landfills every day in 2013
was equivalent to that of about 650 double-decker buses. However, the
MSW-generation quantities and the MSW-recovery rates estimated by the
Environmental Protection Department (EPD) had subsumed unknown quantities of
import recyclables being processed for export (see paras. 3 and 8 below).
2. As the executive arm of the Environment Bureau (ENB), the EPD is
responsible for implementing waste management policies and strategies. In
December 2005, the EPD published the “Policy Framework for the Management of
Municipal Solid Waste (2005-2014)” (2005 Policy Framework) which set out
strategies, targets and action plans on avoidance and minimisation; reuse, recovery
and recycling; and bulk reduction and disposal of MSW. In May 2013, the ENB
published the “Hong Kong Blueprint for Sustainable Use of Resources (2013-2022)”
(2013 Blueprint) which set out targets to reduce the per-capita-per-day MSW
disposal rate. The Audit Commission (Audit) has recently conducted a review to
examine the Government’s efforts in managing MSW with a view to identifying
areas for improvement.
Reduction in municipal solid waste
3. MSW-generation quantities and MSW-recovery rates having incorrectly
subsumed unknown quantities of import recyclables. MSW-generation quantity
and MSW-recovery rate are two key performance indicators on Government’s
actions in managing MSW. The former is the sum of the quantity of MSW disposed
Executive Summary
— vi —
of at landfills and the quantity of locally-generated MSW recovered for recycling.
The latter is a function of the quantity of MSW recovered and the quantity of MSW
generated. The 2005 Policy Framework set a target to reduce the MSW-generation
quantity by 1% per annum up to 2014, using 2003 as the base year. Accordingly,
the MSW-generation quantities were expected to decrease by 5% from 5.77 million
tonnes in 2005 to 5.48 million tonnes in 2010. However, due to the inclusion of
unknown quantities of import recyclables in the estimation, these two indicators had
been over-estimated by the EPD. Mainly due to increases in the quantities of
import recyclables from 2005 to 2010, the over-estimation had become more
apparent during the period where the former had increased by 15% from
6.01 million tonnes to 6.93 million tonnes, and the latter from 43% to 52%. These
two indicators had dropped to 5.49 million tonnes and 37% respectively in 2013. In
estimating the quantities of locally-generated recyclables recovered for export, the
EPD had made use of statistics on domestic-export recyclables compiled by the
Census and Statistics Department (C&SD) which were based on the information
contained in trade declaration forms submitted by exporters to the Customs and
Excise Department (C&ED). In this connection, import recyclables that had been
processed in Hong Kong for export had been classified as “domestic exports” for
trade declaration purposes. Therefore, the quantities of domestic-export recyclables
comprised both locally-generated and import quantities. The over-estimation of the
quantities of MSW recovered (and MSW generated) had distorted the effectiveness
of the Government’s efforts to increase MSW recovery and recycling (see para. 8
below and paras. 2.2, 2.5 to 2.11 and 2.15).
4. Since April 2014, in order to facilitate the collection of reliable data on
the quantities of locally-generated recyclables recovered for export, the C&SD and
the C&ED have taken actions to collect additional information from exporters in
order to differentiate between export recyclables that are generated locally and those
imported from overseas (paras. 2.20 to 2.22).
5. Time targets for implementing producer responsibility schemes (PR
schemes) and MSW charging scheme not met. The 2005 Policy Framework set
time targets for implementing PR schemes on six products, namely plastic shopping
bags (PSBs) in 2007, waste electrical and electronic equipment in 2007, vehicle
tyres in 2007, glass beverage bottles in 2008, packaging materials in 2008 and
rechargeable batteries in 2009, and for introducing an MSW charging bill to the
Legislative Council (LegCo) in 2007. However, Audit noted that Phase 1 and
Phase 2 of the PR scheme on PSBs were only implemented in July 2009 and
April 2015 respectively, and up to August 2015, six to eight years later than the
Executive Summary
— vii —
time targets, PR schemes on the other five products had not been implemented.
Moreover, the MSW charging bill would only be submitted to LegCo in the 2016-17
legislative session, nine years later than the time target (paras. 2.23, 2.26, 2.31,
2.32, 2.40 and 2.43).
6. Need to be more comprehensive in reporting the impact of the PR
scheme on PSBs. In 2007 and 2008, the EPD informed LegCo of the introduction
of the PR scheme on PSBs, with the objective of inculcating behavioural changes to
reduce the excessive use of PSBs. In July 2009, the EPD launched Phase 1 of the
PR scheme on PSBs (PSB Phase 1) under which prescribed retailers (mainly
supermarkets, convenience stores and personal-item stores) meeting specified
requirements were required to charge customers not less than 50 cents for each PSB
distributed. Audit noted that, based on the EPD’s landfill-survey results, the
number of PSBs bearing the features of supermarkets, convenience stores or
personal-item stores (pertinent PSBs) being disposed of at landfills had decreased
from 657 million weighing 13,493 tonnes in 2009 to 116 million (82% decrease)
weighing 1,949 tonnes (86% decrease) in 2013. However, the number of other
PSBs had increased from 4,021 million weighing 64,942 tonnes in 2009 to
4,506 million (12% increase) weighing 65,222 tonnes (0.4% increase) in 2013.
Although the reduction of 11,544 tonnes (13,493 less 1,949 tonnes) of pertinent
PSBs being disposed of at landfills from 2009 to 2013 was notable, its impact in
reducing the total quantity of MSW being disposed of at landfills (3.48 million
tonnes in 2013) was quite small. However, in informing LegCo that PSB Phase 1
had been implemented successfully, the EPD only informed LegCo of the reduction
in the number of pertinent PSBs but not the reduction in their weight. The
additional information would provide a more comprehensive account of the effects
on landfills by the implementation of PSB Phase 1 (paras. 2.39 to 2.48).
7. Audit also noted that the number of pertinent PSBs (see para. 6) being
disposed of at landfills based on the EPD’s landfill-survey results was significantly
greater than that of PSBs distributed by registered retailers at registered outlets
based on their returns. For example, in 2012, landfill surveys found 156 million of
pertinent PSBs whereas registered retailers reported that their registered outlets had
only distributed 59.5 million of PSBs (para. 2.49).
Executive Summary
— viii —
Recovery of municipal solid waste
8. Over-estimation of MSW-recovery rates. Waste recovery comprises
processes of waste recycling, composting and energy generation, aiming to extract
the maximum benefits from products, postpone the consumption of virgin resources,
and reduce the quantity of waste disposed of at landfills so as to minimise landfill
use. MSW-recovery rate is a key performance indicator of Government’s efforts
made in MSW recovery. The 2005 Policy Framework set a target of achieving an
MSW-recovery rate of 50% by 2014 and the 2013 Blueprint stated that 55% of
MSW would be recycled by 2022. While the published MSW-recovery rates had
increased from 43% in 2005 to 52% in 2010, the rate had dropped to 37% in 2013.
As elaborated in paragraph 3, Audit found that the inclusion of import recyclables
processed for export in the estimation of the MSW generation and recovery
quantities had led to distortion of the MSW-recovery rates and thereby the MSW
recycling performance in the past years (paras. 3.2, 3.4 and 3.6 to 3.13).
9. Need to take action to increase recovery of waste plastics. Audit noted
that, in 2013, only 26% of waste plastics were recovered (which included unknown
quantities of import recyclable plastics — see para. 3), comparing with 90% of
waste metals and 61% of waste paper. According to the EPD, recovery of waste
plastics produced a lower profit margin because of the high labour cost involved in
sorting recyclable plastics and high transportation cost. Hence, the waste-plastics
recovery rate was lower than those of the other recyclables (paras. 3.11 and 3.14
to 3.19).
10. Lack of statistics on collected recyclables being disposed of at landfills.
In order to facilitate the collection of recyclables, the Government provided
waste-separation bins at public places. The Food and Environmental Hygiene
Department incurred about $9,000 for engaging contractors to collect a tonne of
recyclables from waste-separation bins for delivery to approved recyclers.
Moreover, government contractors would separate recyclables collected from
waste-separation bins into contaminated ones and non-contaminated ones.
According to the EPD, for hygiene reasons, only non-contaminated recyclables can
be recovered for recycling. Hence, the contaminated recyclables would be disposed
of at landfills and the non-contaminated ones transported to approved recyclers.
Executive Summary
— ix —
However, due to the lack of reporting requirements in the contracts for collecting
recyclables, the Government did not have statistics on the quantities of recyclables
collected from waste-separation bins which were disposed of at landfills due to
contamination or other reasons (paras. 3.24 and 3.36 to 3.38).
Recycling of municipal solid waste
11. In order to support local recycling industries, the Government spent
$308 million to develop a 20-hectare EcoPark in Tuen Mun to provide long-term
land at affordable cost for use by recyclers. EcoPark was developed under two
phases, comprising six land lots under Phase 1 (Lots 1 to 6) which had been made
available for leasing since December 2006, and ten lots under Phase 2 (Lots 7 to 16)
which had been made available for leasing from October 2009 to July 2012
(paras. 4.2 to 4.4).
12. Some tenancy requirements not being complied with. Audit examination
revealed that: (a) from 2011 to 2014, the reported recyclables throughput of the
tenant of Lot 1 only attained 16% to 85% of throughput requirements stated in the
tenancy agreement; (b) the tenant of Lot 3 only commenced recycling operation in
May 2010, 24 months later than the time specified in the tenancy agreement. The
operation was later suspended for 20 months from November 2011 to June 2013 and
again for 8 months from January to September 2015; (c) up to August 2015, five
years later than the operation-commencement time of August 2010 specified in the
tenancy agreement, recycling operation at Lot 4 had not commenced; and (d) up to
August 2015, 29 months later than the operation-commencement time of April 2013
specified in the tenancy agreements of Lots 9, 10 and 14, recycling operation at
these three land lots had not commenced (paras. 4.6 to 4.21).
13. Some tenants being permitted to use vacant land lots free of charge.
Audit examination revealed that, from July 2012 to August 2015, the EPD had
permitted five EcoPark tenants (tenants of Lots 3, 8, 11, 13 and 14 ) to use certain
areas in vacant Lots 15 and 16 for storage purposes free of charge for periods
ranging from three to six months for each period of permission (para. 4.23).
Executive Summary
— x —
Treatment and disposal of municipal solid waste
14. Target for reducing MSW disposal at landfills not met. The 2005 Policy
Framework set a target of reducing the percentage of MSW disposed of at landfills
from 60% in 2004 to 25% in 2014, with the remaining 50% of MSW being
recovered and 25% being treated by an integrated waste management facility.
However, Audit noted that, in 2013, more than 63% of MSW were disposed of at
landfills (paras. 5.2 and 5.12).
15. Rising MSW disposal at landfills in recent years. The 2013 Blueprint
set a target of reducing the per-capita-per-day MSW disposal quantities from
1.27 kilogram (kg) in 2011 to 1 kg or less by 2017, and further to 0.8 kg or less by
2022. However, Audit noted that the per-capita-per-day MSW disposal quantities
had increased from 1.27 kg in 2011 to 1.35 kg in 2014, representing a 6.3%
increase (paras. 5.13, 5.14 and 6.3).
16. LegCo not provided with quantifiable information and assumptions
relating to serviceable lives of landfills. Hong Kong has three landfills that occupy
271 (100 + 61 + 110) hectares of land and have an aggregate design capacity of
139 million cubic metres (m3). In March 2012, the EPD informed LegCo that,
given that 79 million m3 of the total landfill capacity had been used up as of end
2011, the three landfills would reach their capacities commencing from 2014 to
2018. Based on the total quantity of waste disposed of at the three landfills from
1993 to 2011 and the landfill capacity being used up during the period, Audit
estimated that the remaining serviceable lives of the three landfills could last for
some years after 2018. According to the EPD, its estimated years of the remaining
serviceable lives of the three landfills were based on the assumptions that some
landfill capacities would be reserved for other uses and there would be growth in the
quantities of MSW, construction waste and special waste being disposed of at
landfills in the forthcoming years. However, the EPD had not provided LegCo with
the related quantifiable information and the underlying assumptions (paras. 5.16
to 5.20).
Executive Summary
— xi —
Way forward
17. Owing to the disposal of large quantities of MSW at landfills in the past
years, Hong Kong’s limited landfill space (after implementing extension works) will
be progressively used up in the coming two decades. In December 2014, in
applying for LegCo funding approval of $9.6 billion for the extension works for two
of the three landfills, the EPD estimated that their useful lives would extend to 2023
and 2028. The EPD also commissioned a detailed study with a view to extending
the serviceable life of the remaining landfill to 2033-34. Subject to the FC funding
approval for extension works of a landfill and after completing the approved and
proposed extension works, the three landfills would occupy a total of 554 hectares
of land, which is approximately the size of 550 standard football pitches. In view of
the scarcity of land in Hong Kong, both the Government and the community need to
make utmost efforts on minimising MSW disposal at landfills, which will help
preserve the precious landfill space for use by this generation and future generations
(paras. 1.7, 6.8 and 6.9).
Audit recommendations
18. Audit recommendations are made in the respective sections of this
Audit Report. Only the key ones are highlighted in this Executive Summary.
Audit has recommended that the Government should:
Reduction in municipal solid waste
(a) take measures to obtain accurate statistics on the quantities of
locally-generated recyclables recovered for export for estimating the
MSW-generation quantities and recovery rates (para. 2.34(a)(i));
(b) expedite actions to implement the PR schemes and the MSW charging
scheme (para. 2.34(c) and (d));
(c) strengthen actions with a view to improving the accuracy of statistics
collected for evaluating the effectiveness of PR schemes in future
(para. 2.52(b));
Executive Summary
— xii —
Recovery of municipal solid waste
(d) vigilantly monitor significant fluctuations in the MSW-recovery rates
and ascertain the causes as soon as possible in future (para. 3.20(a));
(e) consider providing appropriate assistance through the Recycling Fund
to promote the sustainable development of the waste-plastics recycling
industry (para. 3.20(c));
Recycling of municipal solid waste
(f) explore ways and means to effectively enforce tenants’ compliance
with requirements stated in EcoPark tenancies (para. 4.30(a));
(g) charge reasonable rental for temporary use of vacant land lots by
profit-making organisations (para. 4.30(d));
Treatment and disposal of municipal solid waste
(h) strengthen efforts with a view to reducing MSW generation and
increasing MSW recovery (para. 5.21(a));
(i) in seeking funding approval for landfill extension works in future,
provide LegCo with quantifiable information and the underlying
assumptions in estimating the remaining serviceable lives of landfills
(para. 5.21(b)); and
Way forward
(j) strengthen efforts to clearly publicise the significant landfill problem
(para. 6.15(a)).
Response from the Government
19. The Government agrees with the audit recommendations.
— 1 —
PART 1: INTRODUCTION
1.1 This PART describes the background to the audit and outlines the audit
objectives and scope.
Background
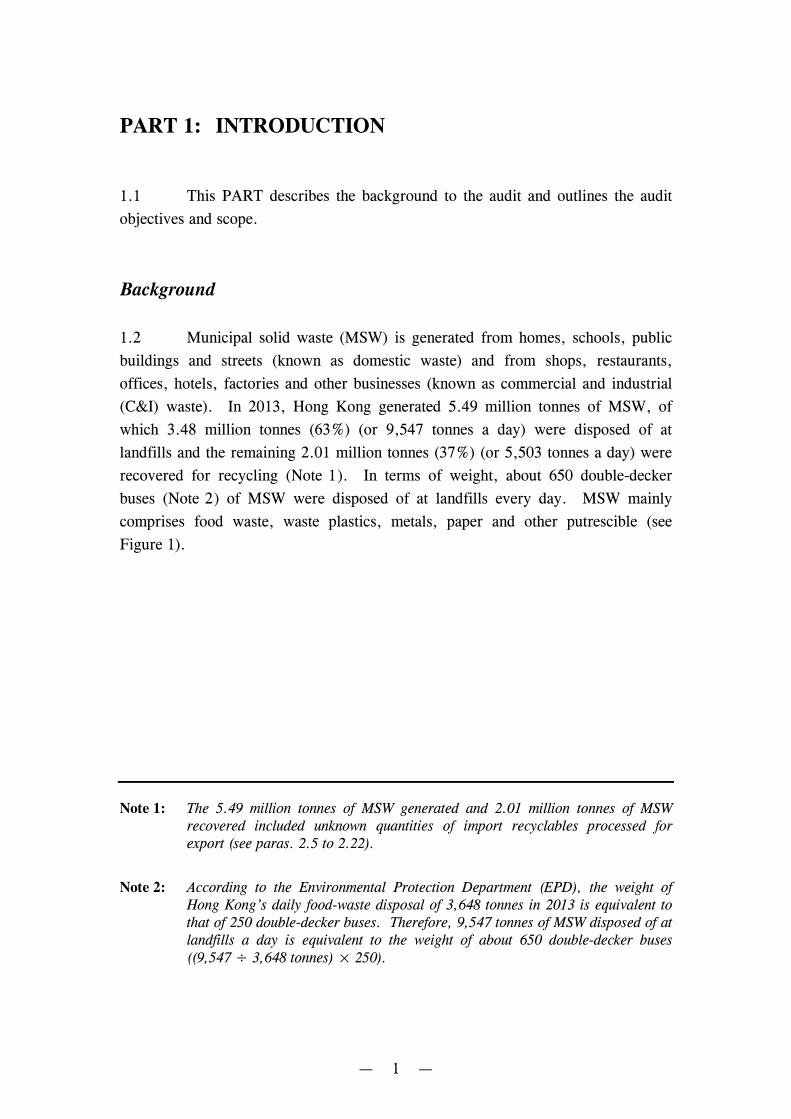
1.2 Municipal solid waste (MSW) is generated from homes, schools, public
buildings and streets (known as domestic waste) and from shops, restaurants,
offices, hotels, factories and other businesses (known as commercial and industrial
(C&I) waste). In 2013, Hong Kong generated 5.49 million tonnes of MSW, of
which 3.48 million tonnes (63%) (or 9,547 tonnes a day) were disposed of at
landfills and the remaining 2.01 million tonnes (37%) (or 5,503 tonnes a day) were
recovered for recycling (Note 1). In terms of weight, about 650 double-decker
buses (Note 2) of MSW were disposed of at landfills every day. MSW mainly
comprises food waste, waste plastics, metals, paper and other putrescible (see
Figure 1).
Note 1: The 5.49 million tonnes of MSW generated and 2.01 million tonnes of MSWrecovered included unknown quantities of import recyclables processed forexport (see paras. 2.5 to 2.22).
Note 2: According to the Environmental Protection Department (EPD), the weight ofHong Kong’s daily food-waste disposal of 3,648 tonnes in 2013 is equivalent tothat of 250 double-decker buses. Therefore, 9,547 tonnes of MSW disposed of atlandfills a day is equivalent to the weight of about 650 double-decker buses((9,547 ÷ 3,648 tonnes) × 250).
Introduction
— 2 —
Figure 1
MSW generation(in million tonnes)
(2013)
Source: Audit analysis of EPD records
Note 1: Other MSW mainly included waste glass, textiles, wood, rattan andmiscellaneous household waste.
Note 2: Other putrescible mainly included yard waste and other organic waste.
Remarks: The MSW recovery quantities included unknown quantities of importrecyclables processed for export (see paras. 2.5 to 2.22). As ofSeptember 2015, most of the related statistics for 2014 were notavailable.
Paper: 1.69(31%)
Others: 0.65(12%) (Note 1)
Landfill: 0.68 (74%)Recovered: 0.24 (26%)
Landfill: 0.66 (39%)Recovered: 1.03 (61%)
Landfill: 0.54 (83%)Recovered: 0.11 (17%)
Landfill: 1.33 (98%)Recovered: 0.03 (2%)
Plastics: 0.92(17%)
Metals: 0.67(12%)
Landfill: 0.07 (10%)Recovered: 0.60 (90%)
Landfill: 0.2 (100%)Recovered: 0 (0%)
Food waste: 1.36(25%)
Otherputrescible: 0.2(3%) (Note 2)
Landfill: 3.48 (63%)Recovered: 2.01 (37%)Total: 5.49 (100%)
Introduction
— 3 —
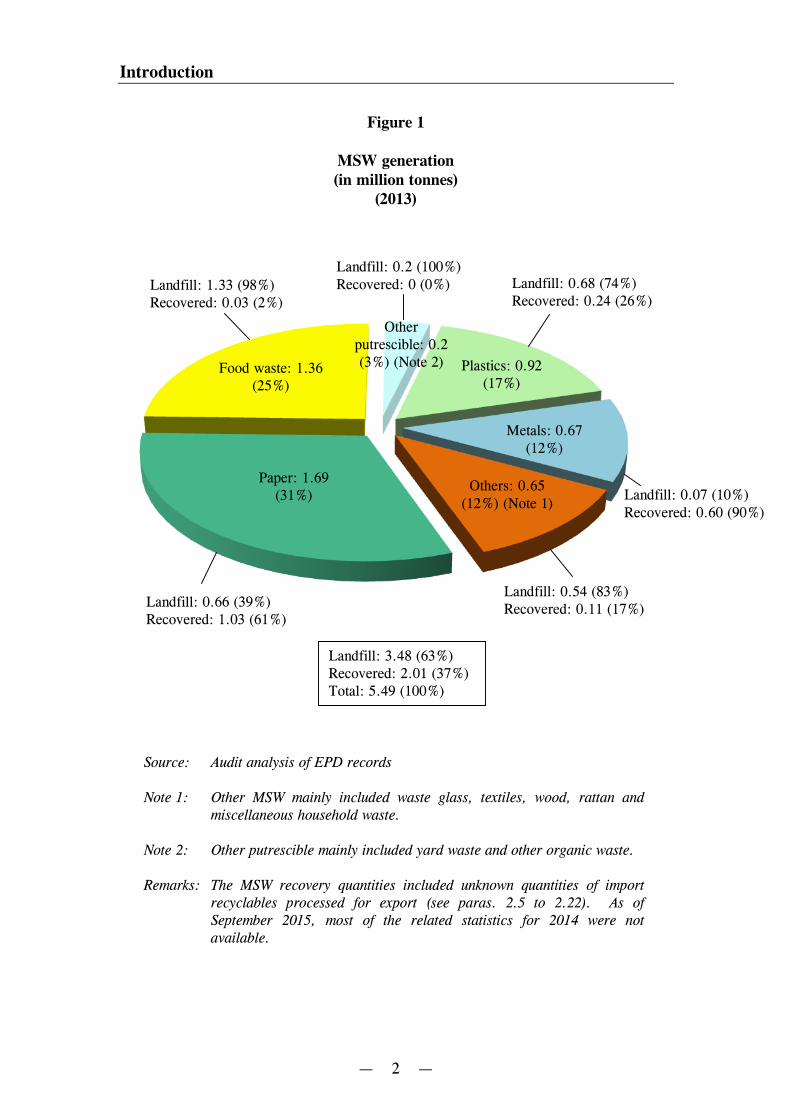
1.3 In addition to MSW, landfills also accept construction waste and special
waste for disposal. In 2013, a total of 5.22 million tonnes of waste were disposed
of at landfills (see Figure 2).
Figure 2
Waste disposal at landfills(2013)
Source: EPD records
Note: Of the 3.48 million tonnes of MSW disposed of at landfills, 2.32 milliontonnes (67%) were from domestic sources and 1.16 million tonnes(33%) were from C&I sources.
1.4 At times, construction and demolition materials (including debris, rubble,
earth and concrete) are abandoned from construction, renovation and demolition
activities as well as land excavation and road works. Over 90% of construction
waste is inert and known as public fill, which is suitable for land reclamation and
site formation. In 2013, of the 23.9 million tonnes of abandoned construction and
demolition materials, 12.9 million tonnes (54%) were public fill which were
stockpiled for reuse, 9.7 million tonnes (41%) were exported to the Mainland for
gainful use such as reclamation, and the remaining 1.3 million tonnes (5%) were
disposed of at landfills.
Construction waste(see para. 1.4):
1.31 million tonnes(25%)
MSW:3.48 million tonnes (67%)
(Note)
Special waste (see para. 1.5):0.43 million tonnes (8%)
Total: 5.22 million tonnes
Introduction
— 4 —
1.5 Special waste comprises dredged mud and excavated materials (which are
not suitable for reuse as fill materials), dewatered sludge from sewage treatment
plants, livestock waste, clinical waste and chemical waste. In 2013, Hong Kong
generated 31 million tonnes of special waste, of which 29.8 million tonnes (96.1%)
were disposed of by marine dumping, 0.77 million tonnes (2.5%) were recovered as
useful materials or treated for other uses, and 0.43 million tonnes (1.4%) were
disposed of at landfills. Since April 2015, dewatered sludge from sewage treatment
plants has been disposed of by incineration at a newly commissioned sludge
treatment facility in Tuen Mun. The residue of incineration is disposed of at
landfills.
Three landfills
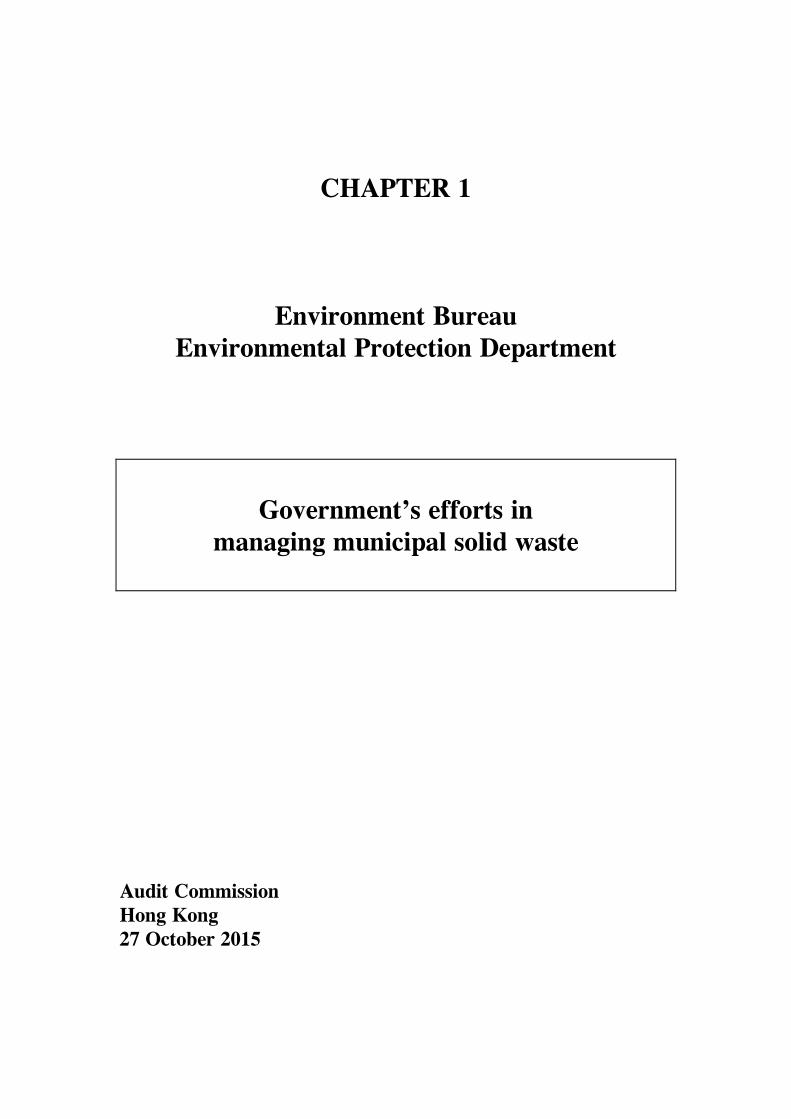
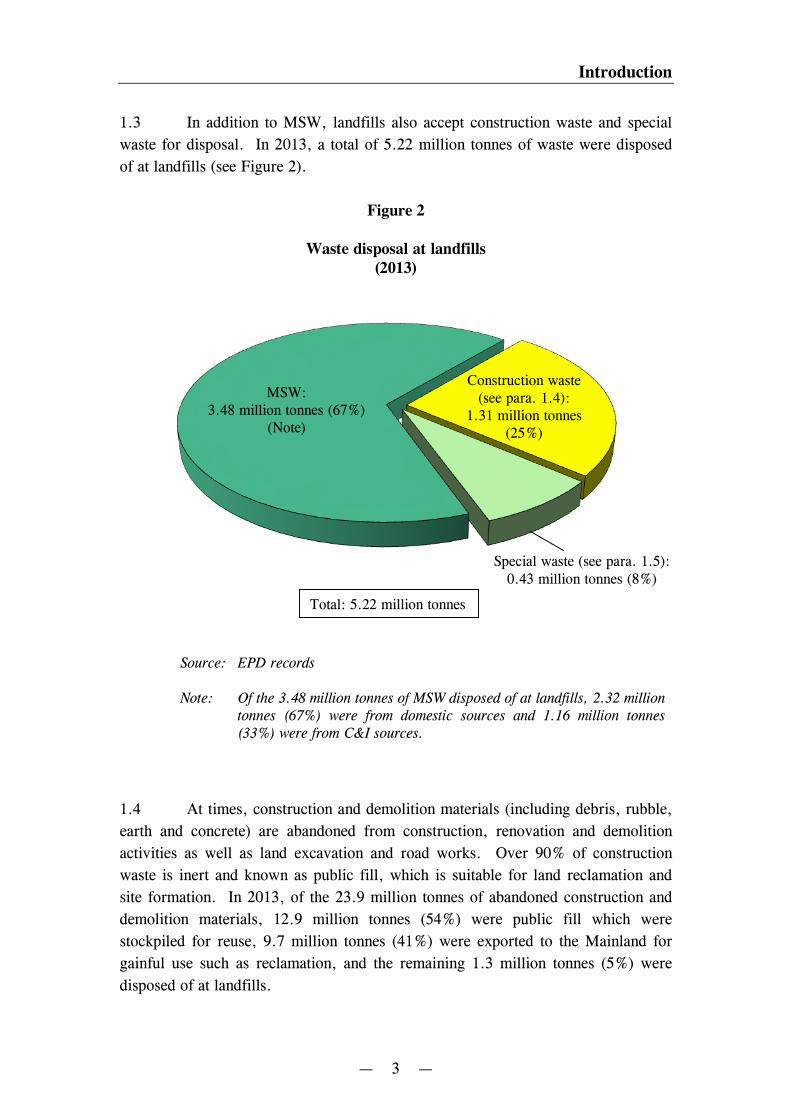
1.6 There are three landfills in Hong Kong for the disposal of MSW,
construction waste and special waste, namely Southeast New Territories (SENT)
Landfill occupying an area of 100 hectares (ha — Note 3) in Tseung Kwan O,
Northeast New Territories (NENT) Landfill occupying an area of 61 ha in Ta Kwu
Ling and West New Territories (WENT) Landfill occupying an area of 110 ha in
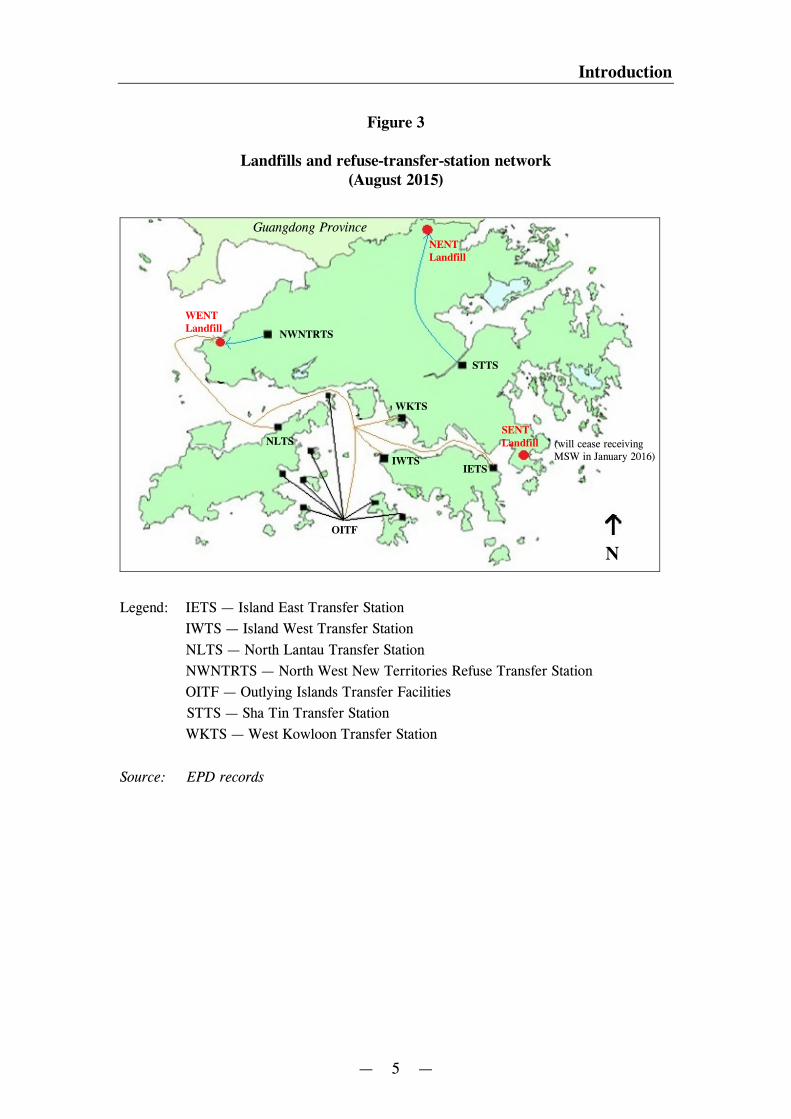
Nim Wan (Note 4). In 2013, 0.72 million tonnes (21%), 0.78 million tonnes (22%)
and 1.98 million tonnes (57%) of MSW were respectively disposed of at SENT,
NENT and WENT Landfills (totalled 3.48 million tonnes). From January 2016,
SENT Landfill will cease receiving MSW and will only receive construction waste.
About 65% of the MSW was delivered to the three landfills through a network of
refuse-transfer stations (Note 5), with the remaining 35% being directly transported
to the landfills. Waste delivered to refuse transfer stations is compacted into
purpose-built containers for transportation to landfills, which help reduce the
transportation cost and minimise environmental nuisance during transportation.
Figure 3 shows the locations of the landfills and the refuse-transfer-station network.
Note 3: A hectare (or 10,000 square metres (m2)) of land is approximately the size of astandard football pitch. Of the 100 ha of land of SENT Landfill, 50 ha isreclaimed land.
Note 4: Of the 110 ha of land of WENT Landfill, 43 ha is reclaimed land.
Note 5: As of August 2015, there were six refuse-transfer stations serving the urbanareas and new towns, namely Island East Transfer Station, Island West TransferStation, West Kowloon Transfer Station, Sha Tin Transfer Station, North LantauTransfer Station, North West New Territories Refuse Transfer Station and sevensmaller facilities serving the outlying islands (collectively referred to as OutlyingIslands Transfer Facilities).
Introduction
— 5 —
Figure 3
Landfills and refuse-transfer-station network(August 2015)
Legend: IETS — Island East Transfer Station
IWTS — Island West Transfer Station
NLTS — North Lantau Transfer Station
NWNTRTS — North West New Territories Refuse Transfer Station
OITF — Outlying Islands Transfer Facilities
STTS — Sha Tin Transfer Station
WKTS — West Kowloon Transfer Station
Source: EPD records
N
Guangdong Province
NWNTRTS
WENTLandfill
SENTLandfill
IETS
WKTS
NLTS
STTS
NENTLandfill
OITF
IWTS
(will cease receivingMSW in January 2016)
Introduction
— 6 —
1.7 In December 2014, the EPD estimated that SENT, NENT and WENT
Landfills would reach their original design capacities by 2015, 2016-17 and 2018-19
respectively. In the same month, the Finance Committee (FC) of the Legislative
Council (LegCo) approved funding of $2,101.6 million and $7,510 million (totalling
$9,611.6 million or $9.6 billion) for extension works for SENT and NENT
Landfills respectively, which would extend the serviceable lives of the two landfills
to 2023 and 2028 respectively. Upon completion of extension works, the areas of
SENT Landfill will increase from 100 ha to 113 ha (Note 6) and NENT Landfill
from 61 ha to 131 ha. Furthermore, the FC also approved in December 2014
funding of $38 million for carrying out the detailed study, site investigation and
tender preparation work for WENT Landfill extension works. Subject to
FC funding approval, the proposed works would extend WENT Landfill area from
110 ha to 310 ha.
Government strategies and action plans
1.8 As the executive arm of the Environment Bureau (ENB), the EPD is
responsible for, inter alia, implementing waste management policies and strategies.
The EPD is headed by the Permanent Secretary for the Environment who also
assumes the office of the Director of Environmental Protection. Appendix A shows
an extract of the organisation chart of the EPD.
1.9 In December 2005, the EPD published the “Policy Framework for the
Management of Municipal Solid Waste (2005-2014)” (hereinafter referred to as the
2005 Policy Framework), which set out strategies, targets and action plans on
avoidance and minimisation; reuse, recovery and recycling; and bulk reduction and
disposal of MSW. The waste reduction and recycling targets and related action
plans were updated in January 2011. In May 2013, the ENB published the “Hong
Kong Blueprint for Sustainable Use of Resources (2013-2022)” (hereinafter referred
to as the 2013 Blueprint), which set out targets to reduce the per-capita-per-day
MSW disposal rate from 1.27 kilogram (kg) in 2011 to 1 kg or less by 2017, and
further to 0.8 kg or less by 2022.
Note 6: According to the EPD, the landfill extension would occupy 13 ha of additionalland in Tseung Kwan O Area 137.
Introduction
— 7 —
1.10 As of March 2014, the capital costs of providing the three landfills and
the refuse-transfer-station network were $4,129 million and $2,724 million
respectively. In 2014-15, the estimated recurrent expenditure of the EPD’s waste
management programme was $2,049 million, of which $705 million (34%) and
$419 million (20%) were for meeting the operation costs of the three landfills and
the refuse-transfer-station network respectively. The estimated operation cost
(including collection and transfer cost) of disposing of a tonne of MSW was $520.
Audit review
1.11 From 2001 to 2010, the Audit Commission (Audit) completed four
reviews to examine Government actions on management of MSW. The review
results were included in the following reports:
(a) Chapter 8 of the Director of Audit’s Report No. 36 of March 2001
entitled Provision of refuse transfer stations;
(b) Chapter 7 of the Director of Audit’s Report No. 39 of October 2002
entitled Management of municipal solid waste;
(c) Chapter 11 of the Director of Audit’s Report No. 51 of October 2008
entitled Reduction and recovery of municipal solid waste; and
(d) Chapter 5 of the Director of Audit’s Report No. 54 of March 2010
entitled Development of EcoPark.
1.12 The reviews found areas for improvement in the implementation of
various strategies and action plans on reduction, recycling and disposal of MSW.
The Public Accounts Committee (PAC) of LegCo conducted public hearings in 2008
and 2010 to examine the findings included in two audit reports (see para. 1.11(c)
and (d)).
Introduction
— 8 —
1.13 In January 2015, Audit commenced a review to examine the
Government’s efforts in managing MSW (the subject matter of this review).
In May 2015, Audit commenced a review of the reduction and recycling of food
waste by the Government (see Chapter 2 of the Director of Audit’s Report No. 65).
This review examines the overall recovery of MSW and reduction of MSW disposal
at landfills, and ENB/EPD efforts to reduce and recycle MSW.
1.14 This review focuses on the following areas:
(a) reduction in municipal solid waste (PART 2);
(b) recovery of municipal solid waste (PART 3);
(c) recycling of municipal solid waste (PART 4);
(d) treatment and disposal of municipal solid waste (PART 5); and
(e) way forward (PART 6).
Audit has identified areas where improvement can be made by the Government in
the above areas and has made recommendations to address the issues.
Acknowledgement
1.15 Audit would like to acknowledge with gratitude the full cooperation of the
staff of the ENB, the EPD and the Food and Environmental Hygiene Department
(FEHD) during the course of the audit review.
— 9 —
PART 2: REDUCTION IN MUNICIPAL SOLID WASTE
2.1 This PART examines actions taken by the ENB and the EPD in reducing
MSW, focusing on:
(a) achievement of MSW-reduction targets (see paras. 2.2 to 2.37); and
(b) implementation of producer responsibility scheme (PR scheme — Note 7)
on plastic shopping bags (PSBs) (see paras. 2.38 to 2.53).
Achievement of MSW-reduction targets
2.2 In relation to avoidance and minimisation of MSW, the 2005 Policy
Framework set the following target:
Reducing the quantity of MSW generation by 1% per annum up to
2014, using 2003 as the base year.
2.3 Furthermore, the 2011 Action Plan laid down the following action plans:
(a) expediting legislative proposals to introduce PR schemes; and
(b) engaging the public in continued discussions on possible options to
introduce MSW charging as a direct economic measure to reduce waste at
source.
Note 7: A PR scheme enshrines the polluter-pays principle under which manufacturers,importers, wholesalers, retailers and consumers are required to share the cost ofcollection, recycling, treatment and disposal of end-of-life products. Forexample, under the first phase of the PR scheme on PSBs, prescribed retailersare required to charge customers not less than 50 cents for each PSB distributed(see para. 2.41(a)).
Reduction in municipal solid waste
— 10 —
2.4 Moreover, with a view to reducing the per-capita-per-day MSW disposal
from 1.27 kg (using 2011 as the base year) to 1 kg or less by 2017, and to 0.8 kg or
less by 2022, the 2013 Blueprint laid down the following action plans:
Between 2013 and 2015
(a) stakeholder engagement and law drafting for MSW charging;
(b) finalising a bill on extension of the PR scheme on PSBs;
(c) finalising a bill on the PR scheme on waste electrical and electronic
equipment (WEEE);
(d) conducting public consultation and law drafting for the PR scheme on
glass beverage bottles; and
Between 2016 and 2018
(e) studying PR schemes on other waste types (e.g. rubber tyres, wood,
packaging materials and rechargeable batteries).
Areas for improvement
MSW-generation quantities having incorrectly subsumedunknown quantities of import recyclables
2.5 The 2005 Policy Framework set a target of reducing the MSW-generation
quantity by 1% per annum up to the year 2014, using 2003 as the base year.
Figure 4 shows the MSW-generation quantities (according to published disposal and
recovery quantities) and the targets for 2005 to 2013.
Reduction in municipal solid waste
— 11 —
Figure 4
Targets and MSW-generation quantities(2005 to 2013)
Source: Audit analysis of EPD records
2.6 As shown in Figure 4, according to government targets, the
MSW-generation quantities were expected to decrease from 5.77 million tonnes
in 2005 to 5.48 million tonnes in 2010 (a 5% decrease). However, the
MSW-generation quantities during the period had increased from 6.01 million
tonnes to 6.93 million tonnes (a 15% increase). Thereafter, the MSW-generation
quantities had significantly decreased from 6.93 million tonnes in 2010 to
5.49 million tonnes in 2013 (a 21% decrease), which still slightly exceeded the
target of 5.31 million tonnes by 3%.
MSW-generation target
MSW-generation basedon published disposaland recovery quantities
Quanti
ty(m
illion
tonnes
)
Year
2005 201120102009200820072006 20132012
0
6.01
5.77
6.23 6.166.44 6.45
6.93
6.30
5.56 5.49
5.71 5.66 5.605.425.54 5.48 5.315.36
Reduction in municipal solid waste
— 12 —
2.7 The EPD estimated the quantity of locally-generated MSW (mainly waste
plastics, metals and paper) by aggregating the quantities of the following:
(a) MSW disposed of at landfills;
(b) recyclables recovered and processed for local use (hereinafter referred to
as locally-generated recyclables recovered for local use); and
(c) recyclables recovered for export outside Hong Kong (hereinafter referred
to as locally-generated recyclables recovered for export).
2.8 The following methods were used by the EPD to measure and estimate the
quantities of MSW disposed of at landfills and recovered:
(a) for MSW disposed of at landfills, EPD landfill contractors conducted
weighing of each truckload of MSW before its disposal at landfills for
compiling the total quantity of MSW disposed of there;
(b) for locally-generated recyclables recovered for local use, the EPD
conducted annual waste-recovery surveys to obtain the related statistics.
The EPD maintained a directory of major recyclers, and requested the
relevant recyclers to complete and return questionnaires on the quantities
of recyclables recovered for local use and for export outside Hong Kong
periodically; and
(c) for locally-generated recyclables recovered for export, the EPD
periodically made estimates of the quantities with reference to the
“domestic export” statistics compiled by the Census and Statistics
Department (C&SD), which were based on information contained in trade
declarations submitted by exporters to the Customs and Excise
Department (C&ED — see paras. 2.11 to 2.15). Although the survey
mentioned in (b) above also provided statistics on the quantities of
locally-generated recyclables recovered for export, the EPD relied on the
trade-declaration information for the purpose because it was a statutory
requirement for exporters to make export declarations, whereas
waste-recovery surveys could not cover all recyclers in the trade and
could only gather information provided voluntarily by recyclers through
completing and returning questionnaires in EPD surveys.
Reduction in municipal solid waste
— 13 —
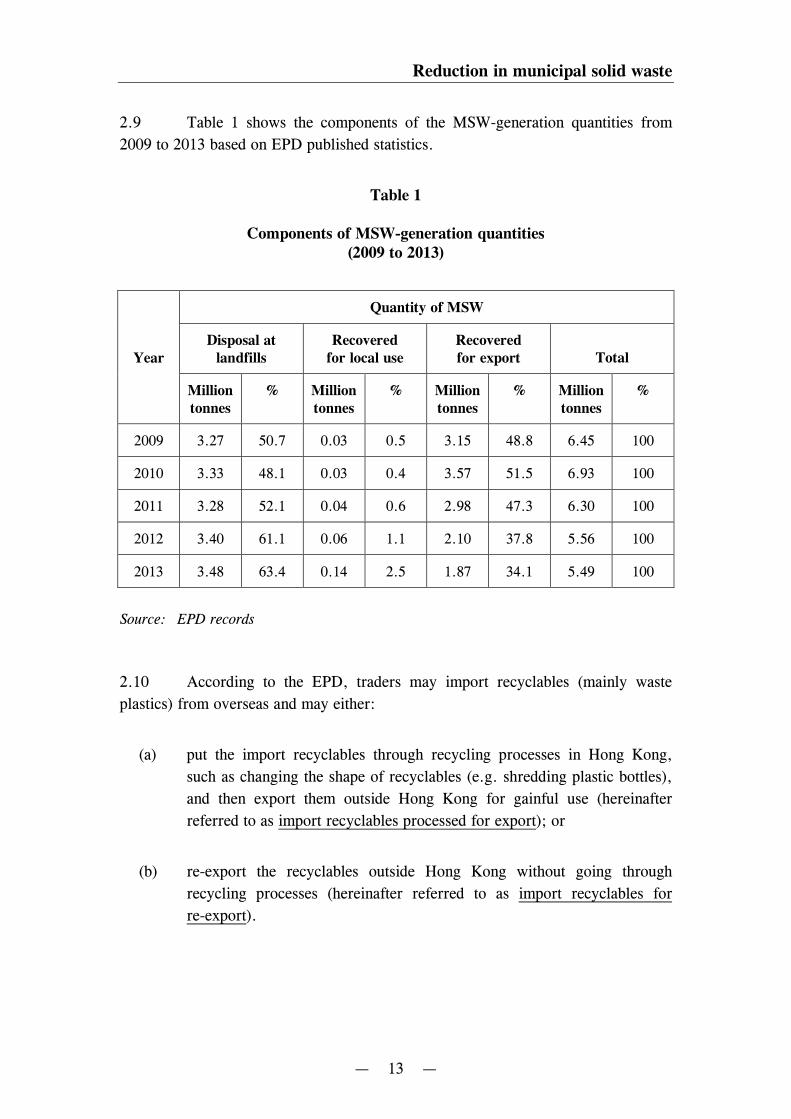
2.9 Table 1 shows the components of the MSW-generation quantities from
2009 to 2013 based on EPD published statistics.
Table 1
Components of MSW-generation quantities(2009 to 2013)
Quantity of MSW
YearDisposal at
landfillsRecovered
for local useRecoveredfor export Total
Milliontonnes
% Milliontonnes
% Milliontonnes
% Milliontonnes
%
2009 3.27 50.7 0.03 0.5 3.15 48.8 6.45 100
2010 3.33 48.1 0.03 0.4 3.57 51.5 6.93 100
2011 3.28 52.1 0.04 0.6 2.98 47.3 6.30 100
2012 3.40 61.1 0.06 1.1 2.10 37.8 5.56 100
2013 3.48 63.4 0.14 2.5 1.87 34.1 5.49 100
Source: EPD records
2.10 According to the EPD, traders may import recyclables (mainly waste
plastics) from overseas and may either:
(a) put the import recyclables through recycling processes in Hong Kong,
such as changing the shape of recyclables (e.g. shredding plastic bottles),
and then export them outside Hong Kong for gainful use (hereinafter
referred to as import recyclables processed for export); or
(b) re-export the recyclables outside Hong Kong without going through
recycling processes (hereinafter referred to as import recyclables for
re-export).
Reduction in municipal solid waste
— 14 —
2.11 Under the existing trade declaration system administered by the C&ED,
import recyclables having been processed locally and thereafter exported could be
reported in the trade declaration form (Note 8) as “domestic exports”. The C&ED
trade declaration form did not require exporters to differentiate between export
recyclables that were generated locally and those imported from overseas.
Consequently, the EPD was not able to differentiate between these two types of
recyclables. An unknown quantity of import recyclables having been processed
locally and exported was counted by the EPD as locally-generated recyclables. As a
result, the locally-generated MSW quantities had been over-estimated in the past
years.
2.12 In March 2014, the EPD informed the LegCo Panel on Environmental
Affairs (EA Panel) of the quantities of import and export recyclables from 2009 to
2013. Given that Hong Kong does not have factories carrying out large-scale
recycling processes to transform recyclables into consumer products, most of the
import recyclables will be exported. Therefore, the total quantities of import
recyclables plus locally-generated recyclables should be roughly equal to those of
export recyclables. Accordingly, based on the data provided to the EA Panel in
March 2014, Audit made a comparison of the related data. Details are shown in
Table 2.
Note 8: Under the trade declaration system, exporters were required to state in the formthe origin country/territory of each type of export, and for goods subjected to amanufacturing process in Hong Kong which had changed permanently the shape,form and utility of the basic materials of the goods, they were Hong Kong originfor trade declaration purposes.
Reduction in municipal solid waste
— 15 —
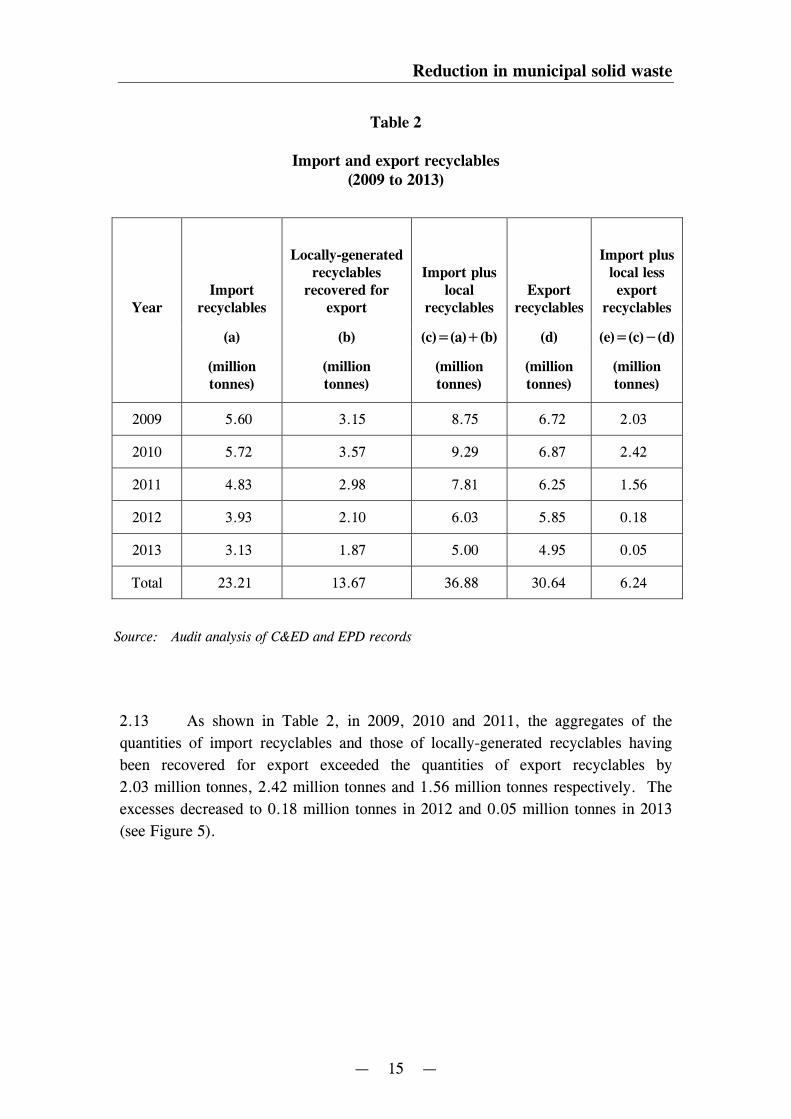
Table 2
Import and export recyclables(2009 to 2013)
YearImport
recyclables
Locally-generatedrecyclables
recovered forexport
Import pluslocal
recyclablesExport
recyclables
Import pluslocal lessexport
recyclables
(a) (b) (c)=(a)+(b) (d) (e)=(c)−(d)
(milliontonnes)
(milliontonnes)
(milliontonnes)
(milliontonnes)
(milliontonnes)
2009 5.60 3.15 8.75 6.72 2.03
2010 5.72 3.57 9.29 6.87 2.42
2011 4.83 2.98 7.81 6.25 1.56
2012 3.93 2.10 6.03 5.85 0.18
2013 3.13 1.87 5.00 4.95 0.05
Total 23.21 13.67 36.88 30.64 6.24
Source: Audit analysis of C&ED and EPD records
2.13 As shown in Table 2, in 2009, 2010 and 2011, the aggregates of the
quantities of import recyclables and those of locally-generated recyclables having
been recovered for export exceeded the quantities of export recyclables by
2.03 million tonnes, 2.42 million tonnes and 1.56 million tonnes respectively. The
excesses decreased to 0.18 million tonnes in 2012 and 0.05 million tonnes in 2013
(see Figure 5).
Reduction in municipal solid waste
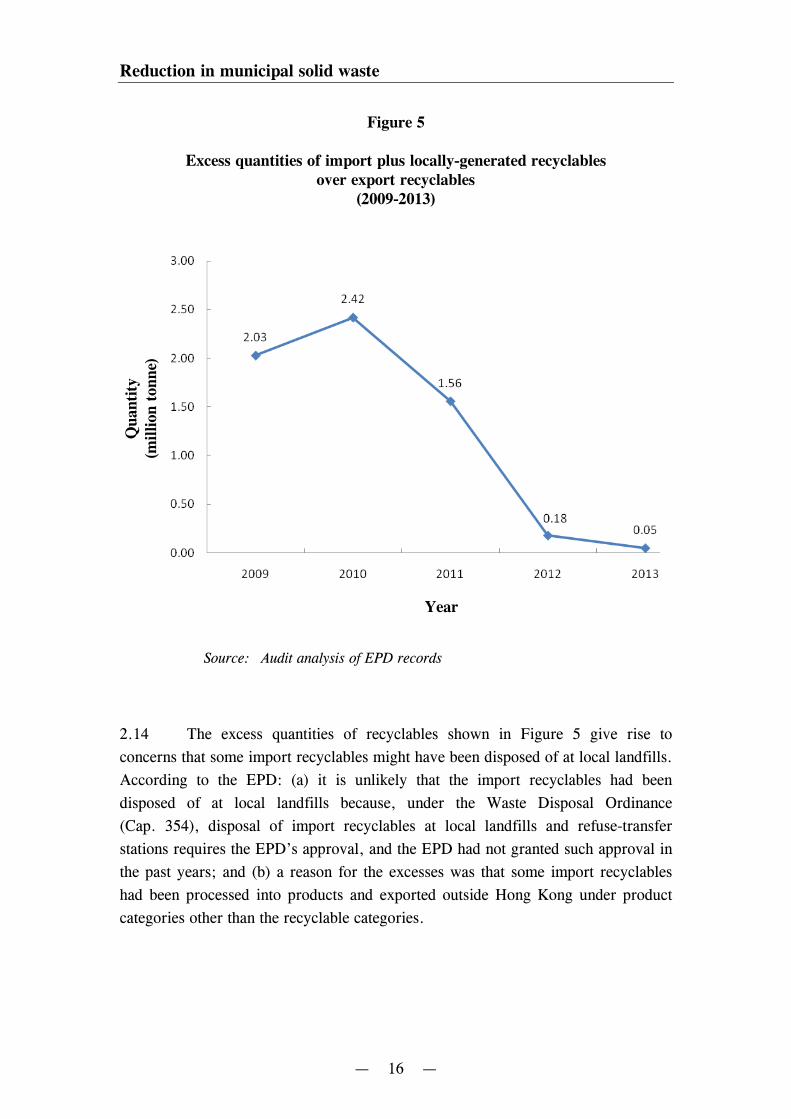
— 16 —
Figure 5
Excess quantities of import plus locally-generated recyclablesover export recyclables
(2009-2013)
Source: Audit analysis of EPD records
2.14 The excess quantities of recyclables shown in Figure 5 give rise to
concerns that some import recyclables might have been disposed of at local landfills.
According to the EPD: (a) it is unlikely that the import recyclables had been
disposed of at local landfills because, under the Waste Disposal Ordinance
(Cap. 354), disposal of import recyclables at local landfills and refuse-transfer
stations requires the EPD’s approval, and the EPD had not granted such approval in
the past years; and (b) a reason for the excesses was that some import recyclables
had been processed into products and exported outside Hong Kong under product
categories other than the recyclable categories.
Quan
tity
(million
tonne)
Year
Reduction in municipal solid waste
— 17 —
2.15 The significant quantities of 2.03, 2.42 and 1.56 million tonnes of import
and locally-generated recyclables recovered for export in excess of those of export
recyclables in 2009, 2010 and 2011 respectively might be attributed to some
quantities of import recyclables processed for export having been incorrectly
subsumed into the quantities of locally-generated recyclables recovered for export,
resulting in over-estimating the quantities of the latter (see para. 2.11). In Audit’s
view, the EPD, in collaboration with the C&ED and C&SD, needs to strengthen
actions with a view to enhancing the accuracy of the import and export recyclable
statistics and take remedial actions where warranted.
2.16 In view of the significant fluctuations in the MSW-recovery rates (see
PART 3 for details), in 2012, the EPD commissioned a consultant (Consultant A) at
a cost of $1.5 million to review the abnormal fluctuations of MSW-recovery rates
(see Figure 8 in para. 3.8) and the methodologies for compiling the related statistics.
In his report of February 2014, Consultant A found that:
(a) there were anomalies in the fluctuations in the quantities of recyclable
plastics in the past years whereas those of waste paper and waste metals
had remained relatively stable;
(b) the likely inclusion of import recyclable plastics processed for export in
the estimation of the quantity of locally-generated waste plastics recovered
for export would result in an over-estimation of the overall
MSW-recovery rate;
(c) in trade declarations, traders could not clearly differentiate between
locally-generated recyclables recovered for export and import recyclables
processed for export. Owing to the nature of the import and export
declaration system, which was not designed for estimating MSW-recovery
quantities, it was practically not possible to determine the quantities of
non-locally generated waste plastics from the statistics of “domestic
exports”. In the circumstances, it was not possible to adjust the quantities
of locally-generated waste plastics recovered for export to exclude
non-locally generated ones; and
(d) the current methodology used for estimating MSW-recovery rates was the
most appropriate approach, subject to a number of improvement measures
(see para. 2.20).
Reduction in municipal solid waste
— 18 —
2.17 In October 2015, the EPD informed Audit that:
(a) under the trade declaration system of Hong Kong, import recyclable
plastics for export which had not undergone any processing in Hong Kong
should be declared as re-exports. However, some traders and exporters
might have erroneously declared such recyclable plastics as domestic
exports in the past;
(b) traders and exporters had no problem in correctly declaring import waste
metals and paper as either re-exports or domestic exports; and
(c) it had put in place stringent control at landfills to prevent illegal disposal
of import waste, and it had not found loads of import recyclable plastics
being disposed of at landfills.
In order to remove the distortion in compiling the MSW-recovery rates and better
evaluate the effectiveness of government actions to reduce local MSW generation,
the EPD needs to explore ways and means to obtain accurate statistics on the
quantities of locally-generated recyclables recovered for export as far as practicable.
High domestic per-capita MSW generation
2.18 The domestic per-capita-per-day MSW generation is high in comparison
with other similar Asian cities in terms of economic development (see Figure 6).
Reduction in municipal solid waste
— 19 —
Figure 6
Per-capita-per-day domestic MSW generation(2011)
Source: EPD records
2.19 As elaborated in paragraphs 2.5 to 2.17, similar to the MSW-generation
quantities, the domestic per-capita-per-day MSW-generation quantity had also been
over-estimated. According to the EPD, Hong Kong population produced and
disposed of more MSW than other Asian cities in 2013. Details are as follows:
City Hong Kong Metro Tokyo Seoul City Taipei City
Kg/person/day 0.88 0.56 0.30 0.27
Audit considers it unsatisfactory that the over-estimated per-capita MSW-generation
quantity had been used to compare with those of some Asian cities.
Kg/
per
son/d
ay
City
Hong Kong Taipei City Metro TokyoSeoul City
1.36
1.000.95
0.77
Reduction in municipal solid waste
— 20 —
Recent developments
2.20 In March 2014, given that some traders might have incorrectly treated
direct re-export recyclables as import recyclables processed for export in trade
declarations, the EPD informed the EA Panel that it would, in collaboration with the
C&ED and the C&SD, adopt appropriate measures in the collection of data so
as to ensure that the data could better reflect the quantities of locally-generated
recyclables. Such measures included:
(a) the C&ED would issue additional guidelines on trade declarations in
April 2014, and would work together with the EPD and the C&SD to
organise regular thematic workshops for recyclable-plastics recyclers and
exporters to keep them well informed of the requirements and relevant
definitions in lodging accurate and complete trade declarations. The
C&SD would strengthen the checking of export declarations on recyclable
plastics; and
(b) the C&SD would collect additional data (by making telephone calls to
related exporters on a sample basis) on the sources (recovered locally or
import recyclables) of recyclable plastics which have been declared as
domestic exports and the recycling processes, if any, carried out in
Hong Kong.
2.21 In September and October 2015, the EPD, the C&SD and the C&ED
informed Audit that:
EPD
(a) the compilation of the MSW-recovery rate for 2014 would adopt the
enhanced measures mentioned in paragraph 2.20(b);
(b) despite the fluctuations in MSW recovery quantities and recovery rates in
the past years, the MSW-disposal quantities at landfills had remained
stable, reflecting that the effectiveness of the EPD’s various waste
reduction and recovery measures had not been compromised, and that the
import recyclables processed locally had largely been exported outside
Hong Kong;
Reduction in municipal solid waste
— 21 —
C&SD
(c) the enhanced quality check procedures (see para. 2.20(b)) had been
implemented for recyclable plastics since April 2014. The C&SD would
strengthen checking to detect traders’ incorrect reporting of re-export
recyclable plastics as domestic-export ones. The information obtained
from the additional quality check had also been used to compile additional
data on the sources of domestic-export recyclable plastics (either
recovered locally or imported from overseas) for the EPD’s reference
when compiling MSW-recovery rates;
C&ED
(d) the C&ED would clarify with the declarants if they had doubts on the
information stated in the declaration form. The C&ED would collect
additional information from traders in order to differentiate between
export recyclables which had been generated locally and those imported
from overseas; and
(e) in order to enhance the accuracy of the import and export recyclable
statistics, from 2014 to April 2015, the EPD, the C&ED and the C&SD
jointly conducted four thematic workshops for waste-plastic recyclers and
exporters. A total of 52 representatives from 41 companies attended the
workshops.
2.22 In Audit’s view, the EPD, in collaboration with the C&SD and the
C&ED, needs to strengthen efforts to implement the proposed new measures in
paragraph 2.20 with a view to obtaining accurate statistics on the quantities of
locally-generated recyclables recovered for export. These statistics would help
improve the accuracy of the quantity of locally-generated MSW and MSW-recovery
rates.
Time targets for implementing PR schemes on six products not met
2.23 According to the 2005 Policy Framework, the Government proposed to
establish a framework for introducing PR schemes on specific products, with
priority given to those that had significant impacts on waste disposal. Table 3
shows the time targets set for implementing PR schemes on six products.
Reduction in municipal solid waste
— 22 —
Table 3
Time targets for implementing PR schemes on six productspromulgated in 2005 Policy Framework
Product Time target
PSBs 2007
WEEE 2007
Vehicle tyres 2007
Glass beverage bottles 2008
Packaging materials 2008
Rechargeable batteries 2009
Source: EPD records
2.24 As stated in the 2013 Blueprint:
(a) the bill for Phase 2 of the PR scheme on PSBs would be finalised between
2013 and 2015;
(b) the bill for the PR scheme on WEEE would be finalised between 2013
and 2015;
(c) public consultation and law drafting for the PR scheme on glass beverage
bottles would be carried out between 2013 and 2015; and
(d) for other products (i.e. vehicle tyres, packaging materials and
rechargeable batteries), studies would be launched between 2016 and
2018 to assess the need and consider whether they could be part of
PR schemes.
2.25 According to the EPD, the PR schemes aimed to:
(a) minimise the environmental impact of various types of products; and
Reduction in municipal solid waste
— 23 —
(b) based on the “polluter pays” principle, require manufacturers, importers,
wholesalers, retailers, consumers and relevant stakeholders to share the
responsibility for the reduction in the use, recovery, recycling or proper
disposal of related products.
2.26 Audit examination revealed that, with the exception of the PR scheme on
PSBs (Phase 2 of which was implemented on 1 April 2015 — see para. 2.43),
notwithstanding that time targets of 2007 to 2009 had been set in the 2005 Policy
Framework for implementing the PR schemes on WEEE, glass beverage bottles,
vehicle tyres, packaging materials and rechargeable batteries, up to August 2015
(six to eight years later than the time targets), the related PR schemes had not been
implemented.
2.27 In September and October 2015, the EPD informed Audit that the original
time targets of implementing the PR schemes promulgated under the 2005 Policy
Framework were based on the following considerations:
(a) the originally intended legislative approach was that the Product
Eco-responsibility Ordinance (Cap. 603) would provide the framework
for PR schemes whereas product-specific measures would be subsequently
introduced through subsidiary legislation. In the event, LegCo did not
support this approach and required that each PR scheme must be
implemented through legislative amendment to the Ordinance and subject
to the three-reading scrutiny of LegCo; and
(b) overseas experience suggested that the original intended legislation
approach would prompt the relevant trade to introduce voluntary
waste-reduction-and-recycling programmes which, if implemented
successfully, might obviate the need (or at least relieve the immediate
pressure) for implementing mandatory PR schemes. In practice, the trade
had implemented voluntary PR schemes to promote recycling of computer
and electronic equipment, fluorescent lamps, rechargeable batteries and
glass beverage bottles.
2.28 Audit noted that, other than the PR schemes on PSBs, WEEE and glass
beverage bottles, the EPD had not set revised time targets for implementing PR
schemes on vehicle tyres, packaging materials and rechargeable batteries.
Reduction in municipal solid waste
— 24 —
In Audit’s view, the EPD needs to set revised time targets for implementing
PR schemes on the three types of product and expedite actions to implement the
PR schemes on WEEE and glass beverage bottles, taking into consideration the
experience gained.
Time target for implementing MSW charging scheme not met
2.29 According to the EPD, MSW charging provides an effective incentive that
changes behaviour and leads people to cut down on waste generation. Overseas
experience shows that MSW charging could contribute to significant reductions in
waste generation (Note 9).
2.30 In December 2005, the EPD informed the Advisory Council on the
Environment (Note 10) that the main objectives of MSW charging were to:
(a) create an economic incentive for waste producers to avoid and reduce, or
to recover and recycle waste; and
(b) prevent indiscriminate use of landfills and other waste treatment facilities.
2.31 According to the 2005 Policy Framework, the Government envisaged that
the MSW charging bill could be introduced by 2007. In the 2013 Blueprint, the
EPD stated that it would engage stakeholders for law drafting relating to MSW
charging from 2013 to 2015. Table 4 shows the chronology of key events relating
to implementation of MSW charging.
Note 9: According to the EPD, since implementing the MSW charging scheme, SouthKorea’s per-capita disposal rate had dropped by 40% in a few years’ time whileTaipei City’s per-capita disposal rate of household garbage had dropped by 65%in about 11 years.
Note 10: The Advisory Council on the Environment is the Government’s principal advisorybody on matters relating to pollution control, environmental protection andnature conservation. It is chaired by an academic with members comprisingacademics, businessmen, professionals and representatives from majorenvironmental groups, and trade and industrial associations.
Reduction in municipal solid waste
— 25 —
Table 4
Chronology of key events of implementing MSW charging scheme(2006 to 2015)
Month Event
November 2006to February 2007
Trial runs carried out in 20 housing estates (involvingprivate and public housing estates and government quarters)to test the logistical arrangement on the use of designatedgarbage bags.
August 2007 toJuly 2008
The EPD engaged a consultant to review overseasexperience on MSW charging and conduct surveys on localwaste management practices.
November 2008to March 2010
The EPD engaged another consultant to collect keyinformation on waste generation and management practicesof different C&I establishments.
January 2012 toApril 2012
The EPD carried out public consultation to collect publicviews on the different MSW charging approaches.
December 2012 The EPD affirmed the direction of introducingquantity-based MSW charging in Hong Kong and invited theCouncil for Sustainable Development (Note) to conductpublic engagement on the implementation framework.
September 2013to January 2014
The Council for Sustainable Development carried out publicengagement on the implementation framework of the MSWcharging.
April 2014 toFebruary 2015
The EPD carried out trial schemes in seven private housingestates and two rural villages.
December 2014 The Council for Sustainable Development published thepublic engagement results, and recommended that:
(a) MSW charging should be implemented across theboard for all sectors in one go;
(b) MSW charging should be built upon the existing MSWcollection and disposal system so as to minimiseadverse impacts on environmental hygiene; and
(c) the level of MSW charges should be directly related tothe quantity of waste disposed of by MSW producers.
Reduction in municipal solid waste
— 26 —
Table 4 (Cont’d)
Month Event
February 2015 The EPD confirmed at an EA Panel meeting that theCouncil of Sustainable Development’s recommendations hadbeen accepted by the Government.
May 2015 The Advisory Council on the Environment urged theGovernment to implement the MSW charging scheme assoon as practicable.
Source: EPD records
Note: The Council comprises representatives from government departments and membersfrom the environment, social and business sectors. It advises the Government onkey issues relating to Hong Kong’s long-term sustainability.
2.32 The Government set a time target in the 2005 Policy Framework that the
MSW charging bill would be submitted to LegCo in 2007. However, up to
August 2015 (eight years after the original time target), the MSW charging bill had
not been submitted to LegCo. According to the EPD, the MSW charging bill would
be submitted to LegCo as soon as practicable within the 2016-17 legislative session,
and the implementation of MSW charging would contribute to 20% reduction in
MSW generation which would significantly help reduce the quantity of MSW
disposal at landfills. Therefore, the EPD needs to strengthen efforts with a view to
implementing the MSW charging scheme as soon as possible.
Need to conduct a post-implementation reviewof the 2005 Policy Framework
2.33 In Chapter 4 of Part 8 of the PAC Report No. 51 of February 2009, the
PAC recommended that the ENB and the EPD should keep the Committee informed
of the progress made in achieving the MSW reduction target laid down in the 2005
Policy Framework and the measures taken to achieve the target. In May 2010, the
ENB informed the PAC that it would regularly report to the EA Panel on the
implementation progress of the 2005 Policy Framework. Given that the 10-year
2005 Policy Framework was completed in 2014, for public accountability and
transparency, the EPD needs to conduct a post-implementation review of the
achievement of 2005 Policy Framework and inform the EA Panel of the review
results.
Reduction in municipal solid waste
— 27 —
Audit recommendations
2.34 Audit has recommended that the Secretary for the Environment and
the Director of Environmental Protection should:
Over-estimation of MSW-generation quantities
(a) in collaboration with the Commissioner for Census and Statistics and
the Commissioner of Customs and Excise:
(i) take measures to obtain accurate statistics on the quantities of
locally-generated recyclables recovered for export for
estimating the MSW-generation quantities and recovery rates;
and
(ii) strengthen actions to enhance the accuracy of import and
export recyclable statistics and take remedial actions where
warranted;
Time targets for implementing PR schemes
(b) set revised time targets for implementing the PR schemes on
vehicle tyres, packaging materials and rechargeable batteries;
(c) expedite actions to implement the PR schemes on WEEE and glass
beverage bottles;
Implementation of MSW charging scheme
(d) strengthen efforts with a view to implementing the MSW charging
scheme as soon as possible; and
Implementation of 2005 Policy Framework
(e) conduct a post-implementation review of the implementation of the
2005 Policy Framework and inform the EA Panel of the review
results.
Reduction in municipal solid waste
— 28 —
Response from the Government
2.35 The Secretary for the Environment and the Director of Environmental
Protection agree with the audit recommendations. They have said that the ENB and
the EPD will:
(a) in collaboration with the C&SD and the C&ED, continue to implement
measures to enable trade declarants to understand and comply with export
declaration requirements for recyclables, and collect additional
information from the recyclable-plastics exporters to enhance the
MSW-recovery-rate estimation. They will also continue to exercise
stringent control over EPD waste-disposal facilities to guard against any
disposal of import waste;
(b) study the PR schemes on other products such as rubber tyres, wood,
packaging materials and rechargeable batteries from 2016 to 2018;
(c) expedite action on the PR schemes on WEEE and glass beverage bottles.
The WEEE Bill is being examined by LegCo, and the bill on glass
beverage bottles was introduced to LegCo in July 2015; and
(d) bring forward the preparatory work on formulating implementation plans
of the MSW charging scheme, developing complementary systems,
stepping up public education and community involvement, and drafting of
the related legislation.
2.36 The Commissioner for Census and Statistics agrees with the audit
recommendations in paragraph 2.34(a). He has said that:
(a) the C&SD and the C&ED will continue to implement measures to
facilitate trade declarants to understand and comply with the export
declaration requirements for waste items to facilitate the EPD’s
compilation of recyclable statistics; and
(b) the C&SD will continue to monitor the effectiveness of the new
procedures for checking the domestic export declarations of waste plastics.
Reduction in municipal solid waste
— 29 —
2.37 The Commissioner of Customs and Excise agrees with the audit
recommendations in paragraph 2.34(a). He has said that:
(a) the C&ED will strengthen actions to educate traders to provide accurate
import and export recyclable statistics; and
(b) the C&ED may initiate prosecution against any person who knowingly or
recklessly lodges any declaration that is inaccurate in any material
particular.
Implementation of producer responsibility schemeon plastic shopping bags
2.38 According to the 2005 Policy Framework:
(a) plastic bags are non-biodegradable and their excessive consumption
burdens the landfills; and
(b) through implementing a PR scheme on PSBs, the Government aimed to
cut back the number of bags used.
2.39 In May 2007, the ENB informed the EA Panel that the main objective of
the PR scheme on PSBs was to inculcate behavioural changes to reduce excessive
use of PSBs and to cultivate a bring-your-own-bag culture. In January 2008, the
EPD informed LegCo that the PR scheme on PSBs could address the problem of a
large number of PSBs being disposed of at landfills.
2.40 In July 2008, the Product Eco-responsibility Ordinance (Cap. 603) was
enacted, which provided a legal framework for implementing PR schemes. In
April 2009, the Product Eco-responsibility (Plastic Shopping Bags) Regulation
(Cap. 603A — hereinafter referred to as the PSB Regulation) for implementing the
first phase of the PR scheme on PSBs (hereinafter referred to as PSB Phase 1) was
enacted, which came into effect in July 2009.
Reduction in municipal solid waste
— 30 —
2.41 Under the PSB Phase 1:
(a) prescribed retailers (Note 11 ) providing PSBs (Note 12 ) to customers
were required to register with the EPD and to charge customers not less
than 50 cents for each PSB distributed;
(b) registered retailers were required to submit to the EPD quarterly returns
on the number of PSBs distributed by the registered retail outlets and
make payment to the EPD for the levy collected at 50 cents each;
(c) as of end of 2014, registered retailers comprised 48 chain-stores (mainly
supermarkets, convenience stores and personal-item stores which met the
criteria set out in the legislation — see Note 11 to (a) above) with a total
of 3,534 registered retail outlets; and
(d) in 2014, registered retailers reported that their registered outlets had
distributed 70.7 million PSBs and paid $35.4 million of levy to the EPD.
In 2014-15, the EPD incurred about $10 million in implementing PSB Phase 1.
Note 11: A prescribed retailer under PSB Phase 1 was defined as one which carried out aretail business at five or more qualified retail outlets or at one or more qualifiedretail outlet with a retail floor area of not less than 200 m2. A qualified retailoutlet was one offering for sale at the same time all the three specified types ofgoods, i.e. food or drink, medicine or first aid items, and personal hygiene orbeauty products. The prescribed retailer had to register the qualified retailoutlets (registered outlets) and submit quarterly returns to the EPD.
Note 12: PSBs covered under PSB Phase 1 included:
(a) PSBs that were wholly or partly made of plastic including non-woven bags;and
(b) PSBs with a handle, handle hole, perforated line for tearing out a handlehole, carrying string or strap, or any other carrying device on, or attachedto, the bags.
Reduction in municipal solid waste
— 31 —
2.42 In May 2011, the EPD informed LegCo that PSB Phase 1 had been
implemented successfully, and that:
(a) based on two landfill surveys (Note 13) conducted in mid-2009 (before
PSB Phase 1) and mid-2010 (after PSB Phase 1), the number of pertinent
PSBs (which bore the features of supermarkets, convenience stores or
personal-item stores) disposed of at landfills had decreased from
657 million in 2009 to 153 million in 2010 (77% reduction); and
(b) according to a government telephone survey, over 75% of the respondents
did not ask for PSBs when shopping at registered retail outlets.
2.43 In March 2014, after conducting a three-month public consultation in
2011 and subsequent law drafting by the Government and scrutiny by LegCo, a bill
was passed to amend the Product Eco-responsibility Ordinance which extended the
PR scheme on PSBs to cover the entire retail sector with over 100,000 retail outlets
(hereinafter referred to as PSB Phase 2), which came into effect on 1 April 2015.
Different from PSB Phase 1, under PSB Phase 2:
(a) all retailers would be covered under the extended scheme. However,
retailers could retain the PSB charges and they are not required to keep
records of distribution of PSBs nor submit related returns to the EPD;
(b) flat-top bags would be subject to charge; and
(c) notwithstanding (b), PSBs used to carry food containing in non-airtight
packaging and frozen or chilled food would be exempted from the charge.
In 2014-15, the EPD incurred about $14.8 million in preparing for the
implementation of PSB Phase 2.
Note 13: EPD landfill contractors conducted sample counting of PSBs disposed of atlandfills on randomly selected loads of MSW in 40 days (for the 2010 landfillsurvey) and 53 days (for the 2009 landfill survey) to estimate the annual disposalquantities. During landfill surveys, according to the displayed features found onthe bags, PSBs were classified into: (a) those bearing the features ofsupermarkets, convenience stores or personal-item stores; and (b) those notbearing such features.
Reduction in municipal solid waste
— 32 —
Areas for improvement
Need to be more comprehensive inreporting the impact of the PR scheme on PSBs
2.44 Audit noted that, from 2009 to 2013, based on the EPD’s landfill surveys,
whilst the number of PSBs disposed of at landfills bearing the features of
supermarkets, convenience stores or personal-item stores (pertinent PSBs) had
decreased from 657 million to 116 million (82% decrease), the number of other
PSBs had increased by 12% from 4,021 million to 4,506 million during the period
(see Table 5).
Table 5
Number and weight of PSBs disposed of at landfills(2009 and 2013)
2009 2013 Increase/(decrease)
Number
(a)
(million)
Weight
(b)
(tonnes)
Number
(c)
(million)
Weight
(d)
(tonnes)
Number
(e)=(c)−(a)
(million)
Weight
(f)=(d)−(b)
(tonnes)
PertinentPSBs(Note)
657 13,493 116 1,949 (541) (11,544)
OtherPSBs
4,021 64,942 4,506 65,222 485 280
Total 4,678 78,435 4,622 67,171 (56) (11,264)
Source: Audit analysis of EPD records
Note: These refer to PSBs bearing the features of supermarkets, convenience stores orpersonal-item stores of both registered and non-registered retailers.
Remarks: The annual numbers and weight of PSBs were projected from the average dailynumbers and weight of PSBs found in landfill surveys.
Reduction in municipal solid waste
— 33 —
2.45 As shown in Table 5, implementation of PSB Phase 1 resulted in
reduction of 541 million pertinent PSBs weighing 11,544 tonnes from 2009 to 2013.
Although the reduction was notable, its impact in reducing the total MSW disposed
of at landfills (3.48 million tonnes in 2013) was quite small.
2.46 According to the EPD, the objectives of implementing the PR scheme on
PSBs included:
(a) inculcating behavioural changes to avoid excessive use of PSBs and
cultivating a bring-your-own-bag culture; and
(b) addressing the problem of a large number of PSBs being disposed of at
landfills (see para. 2.39).
Based on the 82% reduction in the number of pertinent PSBs being disposed of at
landfills after implementing PSB Phase 1, the objective stated in (a) above was
achieved.
2.47 Audit noted that, in proposing to implement the PR scheme on PSBs, the
EPD did not inform LegCo of the weight of PSBs and their proportion to that of the
total MSW disposed of at landfills, and the estimated weight reductions after
implementation of the PR scheme. In October 2015, the ENB and the EPD
informed Audit that:
(a) it was the ENB/EPD’s conscious decision to illustrate the waste problem
associated with PSBs with reference to the number of PSBs being
distributed or disposed of because the core objective of the PR scheme
was to reduce the use of PSBs, which would lead to a reduction in weight
of plastic used assuming that the thickness of PSBs remained largely
consistent;
(b) it was not uncommon that reference was made to the number of PSBs
being distributed or disposed of in the deliberation on similar initiatives in
other places in the world, such as Ireland and Taiwan; and
(c) the general public would understand the PSB problem easier by using the
“number of PSBs” as the “quantifier” to describe the problem.
Reduction in municipal solid waste
— 34 —
2.48 For public accountability and to enhance evaluation of the effectiveness of
the PR scheme on PSBs, Audit considers that, in addition to the reduction in number
of PSBs, the EPD should also provide LegCo with and publish information on the
reduction in weight of PSBs disposal at landfills after implementation of the
PR scheme on PSBs. This information will show the extent of relieving the
pressure on landfills by the implementation of the PR scheme on PSBs.
Numbers of PSBs disposed of at landfillssignificantly greater than those distributed
2.49 Under the PSB Regulation, registered retailers under PSB Phase 1 were
required to submit to the EPD quarterly returns on the number of PSBs distributed
and remit the levy collected. On the other hand, EPD contractors conducted landfill
surveys to estimate the number of pertinent PSBs of both registered and
non-registered retailers having been disposed of at landfills. Table 6 shows the
numbers of such PSBs obtained from the two sources.
Table 6
Number of PSBs distributed anddisposed of at landfills under PSB Phase 1
(2010 to 2014)
Year 2010 2011 2012 2013 2014
Number of PSBs distributedby registered retailers atregistered outlets based ontheir returns (million)
49.8 53.6 59.5 66.0 70.7
Number of pertinent PSBsdisposed of at landfills basedon landfill surveys (million)
153 147 156 116 (Note)
Source: EPD records
Note: As of August 2015, the 2014 landfill survey statistics were not available.
Reduction in municipal solid waste
— 35 —
2.50 In October 2015, the EPD informed Audit that:
(a) some pertinent PSBs found in landfill surveys belonged to supermarkets,
convenience stores or personal-item stores of non-registered retailers; and
(b) pertinent PSBs found in landfill surveys might not be distributed by
registered retail outlets because an outlet of a registered retailer, although
carrying out related business, might not meet the requirements of a
registered outlet (see Note 11 to para. 2.41(a)).
2.51 The EPD did not have statistics on the number of PSBs belonging to
registered retail outlets being disposed of at landfills from 2010 to 2014.
Accordingly, the reduction in the number of pertinent PSBs found in landfill surveys
might not accurately reflect the effectiveness of the PR scheme on PSBs. Audit
considers that the EPD needs to consider conducting consumer surveys to assess the
effectiveness of PR schemes in future. The large variances between the numbers of
PSBs distributed and disposed of at landfills would raise concerns over the accuracy
of the data. The EPD therefore needs to strengthen actions with a view to
improving the accuracy of statistics collected for evaluating the effectiveness of
PR schemes in future.
Audit recommendations
2.52 Audit has recommended that the Secretary for the Environment and
the Director of Environmental Protection should:
(a) consider conducting consumer surveys to assess the effectiveness of
PR schemes in future; and
(b) strengthen actions with a view to improving the accuracy of statistics
collected for evaluating the effectiveness of PR schemes in future.
Reduction in municipal solid waste
— 36 —
Response from the Government
2.53 The Secretary for the Environment and the Director of Environmental
Protection agree with the audit recommendations. They have said that the ENB and
the EPD will:
(a) in addition to conducting landfill surveys, consider tracking behavioural
changes of consumers through dedicated surveys to assess the disposal of
PSBs under PSB Phase 2; and
(b) strengthen actions to collect reliable statistics in assessing effectiveness of
PR schemes in future.
— 37 —
PART 3: RECOVERY OF MUNICIPAL SOLID WASTE
3.1 This PART examines the actions taken by the ENB and the EPD in
recovery of MSW, focusing on:
(a) achievement of MSW-recovery targets (paras. 3.2 to 3.21); and
(b) implementation of the source-separation programme (SS Programme —
paras. 3.22 to 3.40).
Achievement of MSW-recovery targets
3.2 Waste recovery comprises processes of waste recycling, composting and
energy generation, aiming to extract the maximum benefits from products, postpone
the consumption of virgin resources, and reduce the quantity of waste disposed of at
landfills so as to minimise landfill use. MSW-recovery rate is a key performance
indicator of the recovery efforts made.
3.3 According to the EPD, an MSW-recovery rate is calculated by:
Quantity of MSW recovered× 100%
Quantity of MSW generated
3.4 The 2005 Policy Framework set the following two targets for increasing
the MSW-recovery rate to:
(a) 45% by 2009; and
(b) 50% by 2014.
Recovery of municipal solid waste
— 38 —
3.5 As stated in the 2005 Policy Framework, in order to increase MSW
recovery, the EPD would roll out an SS Programme under which waste-separation
bins (WS bins) would be provided at appropriate locations for separation and
collection of recyclables (mainly recyclable plastics, metals and paper).
3.6 In the 2013 Blueprint, the Government stated that it would continue the
on-going efforts to step up the SS Programme. As shown in the 2013 Blueprint,
in 2022, 55% of MSW would be recycled, 23% treated by incineration and
22% disposed of at landfills.
Areas for improvement
Over-estimation of MSW-recovery rates
3.7 In March 2012, the EPD informed the EA Panel that:
(a) as at 2010, the MSW-recovery rate of Hong Kong stood at 52%, which
exceeded the Government’s original target of attaining an MSW-recovery
rate of 50% by 2014; and
(b) the Government aimed to raise the MSW-recovery rate to 55% by 2015
through a range of enhanced or new initiatives.
3.8 The 2013 Blueprint showed the MSW-recovery rates of nearby countries
and territories at a similar level of economic development of Hong Kong
(see Figure 7). Figure 8 shows the targets and published MSW-recovery rates from
2005 to 2013.
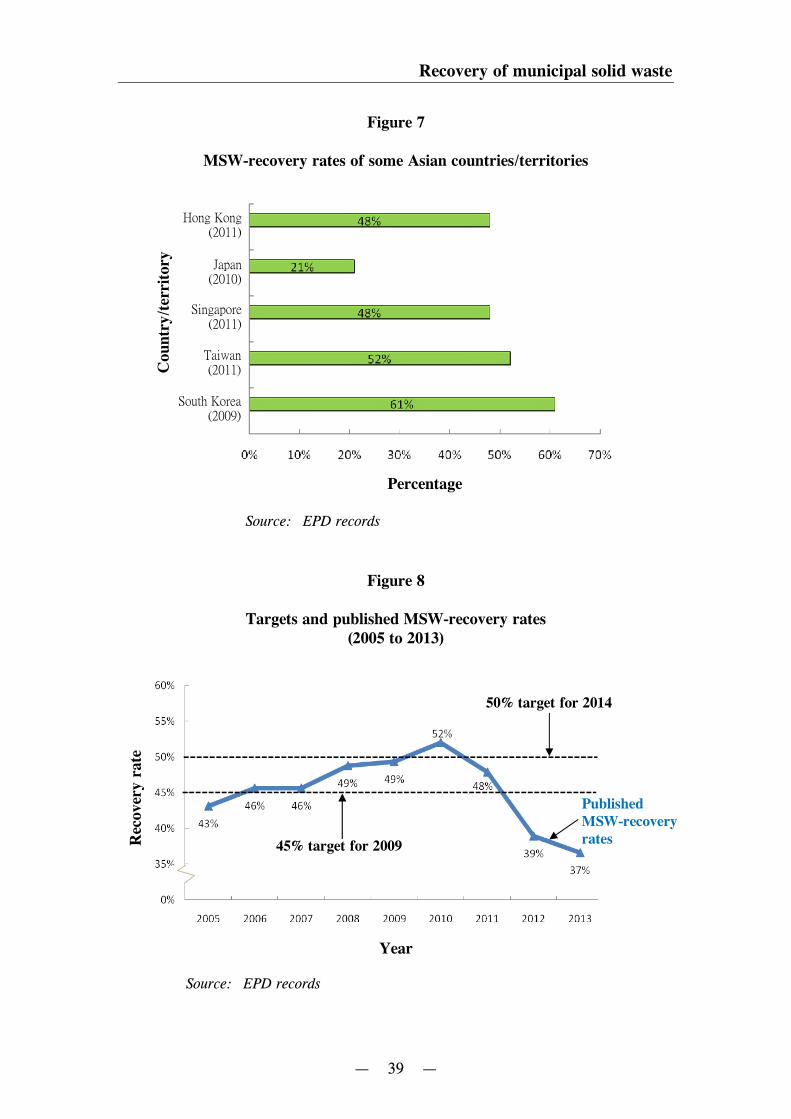
Recovery of municipal solid waste
— 39 —
Figure 7
MSW-recovery rates of some Asian countries/territories
Source: EPD records
Figure 8
Targets and published MSW-recovery rates(2005 to 2013)
Source: EPD records
Cou
ntr
y/te
rrit
ory
Hong Kong(2011)
Japan(2010)
Singapore(2011)
Taiwan(2011)
South Korea(2009)
Percentage
Rec
over
yra
te
Year
50% target for 2014
45% target for 2009
PublishedMSW-recoveryrates
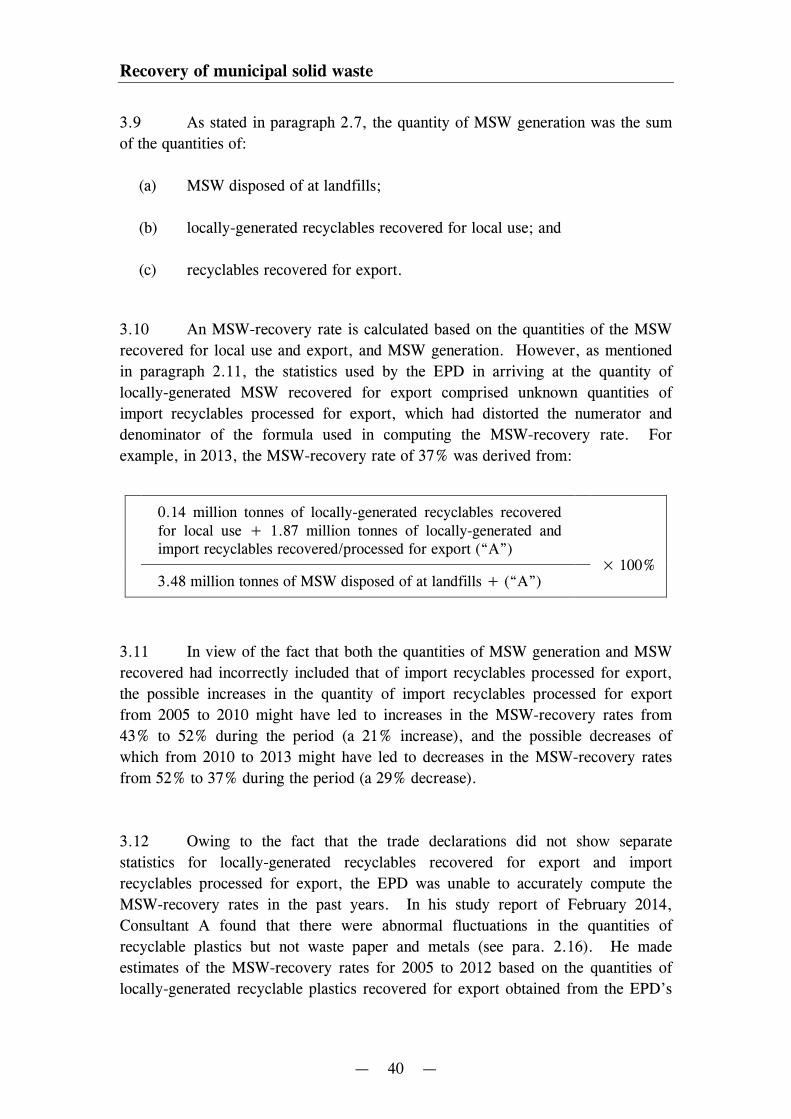
Recovery of municipal solid waste
— 40 —
3.9 As stated in paragraph 2.7, the quantity of MSW generation was the sum
of the quantities of:
(a) MSW disposed of at landfills;
(b) locally-generated recyclables recovered for local use; and
(c) recyclables recovered for export.
3.10 An MSW-recovery rate is calculated based on the quantities of the MSW
recovered for local use and export, and MSW generation. However, as mentioned
in paragraph 2.11, the statistics used by the EPD in arriving at the quantity of
locally-generated MSW recovered for export comprised unknown quantities of
import recyclables processed for export, which had distorted the numerator and
denominator of the formula used in computing the MSW-recovery rate. For
example, in 2013, the MSW-recovery rate of 37% was derived from:
0.14 million tonnes of locally-generated recyclables recoveredfor local use + 1.87 million tonnes of locally-generated andimport recyclables recovered/processed for export (“A”)
× 100%3.48 million tonnes of MSW disposed of at landfills + (“A”)
3.11 In view of the fact that both the quantities of MSW generation and MSW
recovered had incorrectly included that of import recyclables processed for export,
the possible increases in the quantity of import recyclables processed for export
from 2005 to 2010 might have led to increases in the MSW-recovery rates from
43% to 52% during the period (a 21% increase), and the possible decreases of
which from 2010 to 2013 might have led to decreases in the MSW-recovery rates
from 52% to 37% during the period (a 29% decrease).
3.12 Owing to the fact that the trade declarations did not show separate
statistics for locally-generated recyclables recovered for export and import
recyclables processed for export, the EPD was unable to accurately compute the
MSW-recovery rates in the past years. In his study report of February 2014,
Consultant A found that there were abnormal fluctuations in the quantities of
recyclable plastics but not waste paper and metals (see para. 2.16). He made
estimates of the MSW-recovery rates for 2005 to 2012 based on the quantities of
locally-generated recyclable plastics recovered for export obtained from the EPD’s
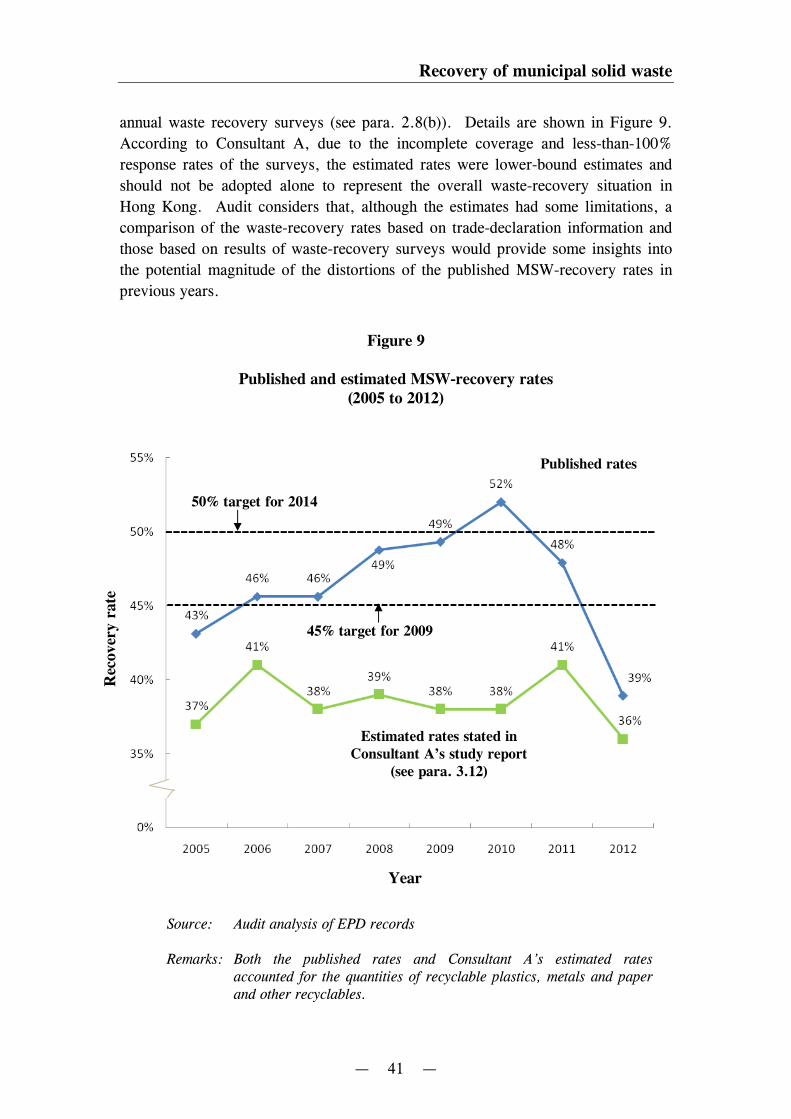
Recovery of municipal solid waste
— 41 —
annual waste recovery surveys (see para. 2.8(b)). Details are shown in Figure 9.
According to Consultant A, due to the incomplete coverage and less-than-100%
response rates of the surveys, the estimated rates were lower-bound estimates and
should not be adopted alone to represent the overall waste-recovery situation in
Hong Kong. Audit considers that, although the estimates had some limitations, a
comparison of the waste-recovery rates based on trade-declaration information and
those based on results of waste-recovery surveys would provide some insights into
the potential magnitude of the distortions of the published MSW-recovery rates in
previous years.
Figure 9
Published and estimated MSW-recovery rates(2005 to 2012)
Source: Audit analysis of EPD records
Remarks: Both the published rates and Consultant A’s estimated ratesaccounted for the quantities of recyclable plastics, metals and paperand other recyclables.
Year
Rec
over
yra
te
Published rates
Estimated rates stated inConsultant A’s study report
(see para. 3.12)
50% target for 2014
45% target for 2009
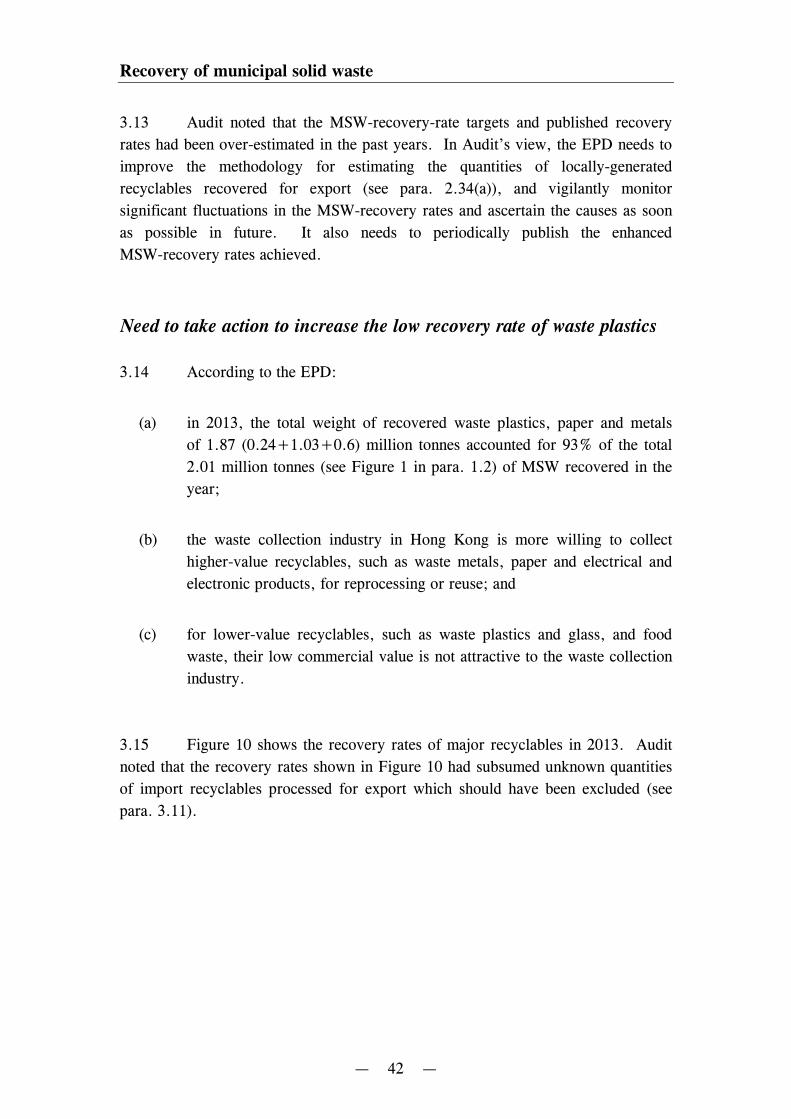
Recovery of municipal solid waste
— 42 —
3.13 Audit noted that the MSW-recovery-rate targets and published recovery
rates had been over-estimated in the past years. In Audit’s view, the EPD needs to
improve the methodology for estimating the quantities of locally-generated
recyclables recovered for export (see para. 2.34(a)), and vigilantly monitor
significant fluctuations in the MSW-recovery rates and ascertain the causes as soon
as possible in future. It also needs to periodically publish the enhanced
MSW-recovery rates achieved.
Need to take action to increase the low recovery rate of waste plastics
3.14 According to the EPD:
(a) in 2013, the total weight of recovered waste plastics, paper and metals
of 1.87 (0.24+1.03+0.6) million tonnes accounted for 93% of the total
2.01 million tonnes (see Figure 1 in para. 1.2) of MSW recovered in the
year;
(b) the waste collection industry in Hong Kong is more willing to collect
higher-value recyclables, such as waste metals, paper and electrical and
electronic products, for reprocessing or reuse; and
(c) for lower-value recyclables, such as waste plastics and glass, and food
waste, their low commercial value is not attractive to the waste collection
industry.
3.15 Figure 10 shows the recovery rates of major recyclables in 2013. Audit
noted that the recovery rates shown in Figure 10 had subsumed unknown quantities
of import recyclables processed for export which should have been excluded (see
para. 3.11).
Recovery of municipal solid waste
— 43 —
Figure 10
Recovery rates of major recyclables(2013)
Source: Audit analysis of EPD records
Note: Other recyclables mainly included waste glass,rubber tyres, textiles, wood, and electrical andelectronic equipment.
3.16 In December 2014, the EPD published a report on “A Study to Promote
Recycling of Plastics, Paper and Cooking Oil in Hong Kong”. As stated in the
report:
(a) the scarcity of land, high labour cost involved in intensive sorting and
high transportation costs were major factors adversely affecting the
waste-plastics recovery; and
(b) the plastic-recycling trade was highly vulnerable to the changes in supply
of and demand for waste plastics, as well as the Mainland’s related
national policies. In view of the lower profit margin of waste plastics
than other recyclables, it was commercially less attractive for the trade to
(0.6 million tonnes)
(1.03 million tonnes)
(0.24 million tonnes)
(0.11 million tonnes)
(0.03 million tonnes)
Typ
eof
recy
clab
les
Metal
Paper
Plastics
Others(Note)
Putrescibles
Recovery of municipal solid waste
— 44 —
invest in recycling this type of recyclables. In order to increase the
commercial value of recyclable plastics, the Government needed direct
measures to:
(i) promote separation of different types of waste plastics at source
with a view to reducing mixing of different types of waste plastics,
and raising public awareness of preventing contamination of
recyclable plastics in order to maximise recycling opportunities;
and
(ii) provide financial assistance to promote waste-plastics recycling,
taking into account that the low density and bulky nature of waste
plastics would increase the cost of collection and require large
storage areas.
3.17 In July 2015, LegCo approved the setting up of the Recycling Fund with a
financial injection of $1 billion to facilitate local recycling industries to upgrade
their operational capabilities and efficiency to enhance sustainable development.
The EPD would set up a committee to oversee the operation of the Fund and
process funding applications from recyclers for facilitating the upgrading of related
recycling operations. According to the EPD, one of the guiding principles for
assessing a funding application would be the capability of a project in raising the
quantity and quality of recycled products. The Recycling Fund was launched in
early October 2015.
3.18 Audit considers that, in view of the low recovery rate and low profit
margin of waste plastics, the EPD needs to review its strategy on separation and
recycling of waste plastics, and consider providing appropriate assistance through
the Recycling Fund (see paras. 3.16(b)(ii) and 3.17) to promote the sustainable
development of the recycling industry with a view to enhancing the recovery and
recycling of waste plastics.
3.19 Furthermore, the EPD also needs to closely monitor the quantity of
recovery of locally-generated waste plastics reused locally or exported outside
Hong Kong, and periodically publish the recovery quantities.
Recovery of municipal solid waste
— 45 —
Audit recommendations
3.20 Audit has recommended that the Secretary for the Environment and
the Director of Environmental Protection should:
Over-estimation of MSW-recovery rates
(a) vigilantly monitor significant fluctuations in the MSW-recovery rates
and ascertain the causes as soon as possible in future;
(b) periodically publish the enhanced MSW-recovery rates achieved;
Low recovery of waste plastics
(c) consider providing appropriate assistance through the Recycling Fund
to promote the sustainable development of the waste-plastics recycling
industry with a view to enhancing the recovery and recycling of waste
plastics; and
(d) closely monitor and periodically publish the quantity of recovery of
locally-generated waste plastics.
Response from the Government
3.21 The Secretary for the Environment and the Director of Environmental
Protection agree with the audit recommendations.
Implementation of source-separation programme
3.22 Locally-generated recyclables being recovered for local use or export is
sourced mainly from recyclable plastics, metals and paper which are:
(a) deposited in WS bins, and collected and transported to recyclers mainly
by government contractors; or
(b) directly transported to recyclers by individual waste collectors and waste
producers.
Recovery of municipal solid waste
— 46 —
3.23 Recyclers usually carry out processes on recyclables collected (such as
sorting, shredding and cleaning of waste plastics, and compression and baling of
waste paper) before exporting them outside Hong Kong.
3.24 As laid down in the 2005 Policy Framework, the SS Programme aimed
to:
(a) improve the recyclables-collection network by providing WS bins at both
public places (such as roadside, government buildings, public housing
estates, schools, public recreational venues and country parks) and private
places (such as C&I buildings and private housing estates) throughout the
territory; and
(b) foster public participation in waste separation and recovery at source,
which would help improve waste recovery and recycling.
3.25 The related targets set under the 2005 Policy Framework included:
(a) domestic MSW recovery would increase from 14% in 2004 to 26% by
2012; and
(b) 80% of Hong Kong’s population would join the SS Programme on
domestic waste by 2010.
3.26 In September 2015, the EPD informed Audit that:
(a) the key objectives of the SS Programme were to disseminate information
on waste reduction and recycling, and to encourage public participation in
waste reduction and source separation of waste; and
(b) as reflected by the increasing participation rates in the related schemes,
the implementation of the SS Programme since 2005 had contributed to
raising the public awareness about waste reduction and recycling.
3.27 As of August 2015, under the SS Programme, the following government
departments were responsible for providing WS bins and collecting recyclables at
specific locations:
Recovery of municipal solid waste
— 47 —
(a) the FEHD would provide WS bins at public places at roadside and
villages, as well as refuse-collection points under its management. The
FEHD also collected recyclables from WS bins provided at 848 schools,
20 clinics under the management of the Department of Health, and one
collection point each at a venue of the EPD and the Water Supplies
Department;
(b) the Housing Department would provide WS bins at public housing estates;
(c) the Leisure and Cultural Services Department (LCSD) would provide
WS bins at parks, sports venues, and leisure and cultural facilities; and
(d) the Agriculture, Fisheries and Conservation Department (AFCD) would
provide WS bins at country parks.
3.28 The related government departments engaged contractors to collect the
recyclables deposited into WS bins at specific time intervals or when being notified
of the bins reaching full capacity. The contractors were required to transport the
recyclables to recyclers for processing. These government departments provided
the EPD with statistics on the quantities of recyclables collected from WS bins. For
waste-plastics recyclers nominated under recyclable-collection-service contracts of
the FEHD, the LCSD and the AFCD, the EPD conducted checking and evaluation
of the facilities of nominated recyclers before designating the satisfactory ones as
approved recyclers for receiving waste plastics under the contracts.
3.29 The SS Programme for the domestic sector was implemented in 2005. As
published on EPD website, as of end 2010, 1,637 housing estates (comprising public
rental housing estates, government quarters and private estates) and over 700 rural
villages had joined the SS Programme, with residents representing 80.5% of Hong
Kong’s population, exceeding the target of 80% (see para. 3.25(b)).
3.30 In 2013, the EPD commissioned a consultant (Consultant B) to carry out a
survey on the public awareness and participation rate of the SS Programme. The
survey results found that over 80% of the respondents had heard of the
SS Programme and the majority of the respondents practised waste separation and
recycling, though they might selectively recycle part of their waste or only practise
recycling when convenient to them.
Recovery of municipal solid waste
— 48 —
3.31 The SS Programme for the C&I sector was implemented in 2007.
According to the EPD:
(a) the number of participating C&I buildings increased from 442 in 2008 to
860 in 2013; and
(b) the average quantity of recyclables recovered by the participating
buildings increased from 22.7 tonnes per-building-per-year in 2008 to
29.7 tonnes per-building-per-year in 2013 (a 31% increase).
Areas for improvement
Insufficient statistics for assessing effectiveness of SS Programme
3.32 Under the SS Programme, the EPD would send invitations to both public
and private estates, villages and C&I buildings inviting them to participate in the
Programme. For estates, villages and C&I buildings indicating agreement to join
the SS Programme, they could apply for funding from the Environment and
Conservation Fund (Note 14) for procuring WS bins. The participating estates and
C&I buildings needed to arrange for the collection and transportation of recyclables
to recyclers. The EPD requested the participating estates and C&I buildings to
provide it with statistics on the quantities of recyclables collected from WS bins.
The FEHD also provided the EPD with statistics on the quantities of recyclables
collected from WS bins at public places at rural villages and roadside, as well as
refuse-collection points under its management.
3.33 Audit examination revealed that:
(a) as of end 2013, 1,979 housing estates (comprising public rental housing
estates, government quarters and private estates) and 700 rural villages
had joined the SS Programme, with residents representing 82.5% of Hong
Kong’s population. Moreover, 860 C&I buildings had also joined the
SS Programme;
Note 14: The Environment and Conservation Fund was established in 1994 under theEnvironment and Conservation Fund Ordinance (Cap. 450). The Fund providesfunding support for educational, research, technology demonstration and otherprojects and activities in relation to environmental and conservation matters, aswell as community waste recovery projects. The Secretary for the Environmentis the trustee of the Fund and the EPD acts as its administrative arm.
Recovery of municipal solid waste
— 49 —
(b) in 2013, 971 (49%) of the 1,979 housing estates provided the EPD with
statistics of the quantities of recyclables (85,870 tonnes) collected from
WS bins;
(c) in 2013, the FEHD collected 707 tonnes of recyclables from WS bins
provided at public places at roadside and villages, refuse-collection points
under its management, 879 schools, 485 collection points at LCSD venues
and 17 collection points at country parks, and 4 tonnes from WS bins
provided at 20 clinics under the management of the Department of Health
and one collection point each at one venue of the EPD and the Water
Supplies Department (Note 15);
(d) in 2013, 582 (68%) of the 860 C&I buildings, including government
offices, provided the EPD with statistics of the quantities of recyclables
(25,575 tonnes) collected from WS bins; and
(e) in 2013, 86,577 tonnes (85,870 tonnes plus 707 tonnes) and
25,575 tonnes of recyclables were collected from WS bins provided at the
domestic and C&I sector respectively (totalled 112,152 tonnes).
3.34 Audit noted that, in 2013, 1,008 (51%) of the 1,979 participating housing
estates and 278 (32%) of the 860 participating C&I buildings did not provide the
EPD with the related statistics, which had adversely affected the assessment of the
effectiveness of the SS Programme. In Audit’s view, the EPD needs to strengthen
promotion efforts to encourage participating estates and C&I buildings to provide
related statistics by completing and returning standard forms. The EPD also needs
to consider publishing the number of participating housing estates and the
corresponding population which have provided the EPD with related statistics and
those not providing the statistics.
Note 15: Since 1 August 2014, the FEHD has ceased providing collection of recyclablesfrom WS bins provided at LCSD venues and country parks, as the LCSD and theAFCD have made their own collection arrangements.
Recovery of municipal solid waste
— 50 —
3.35 In October 2015, the EPD informed Audit that:
(a) there was no mechanism to account for the quantity of recyclables taken
by the public for recycling through other channels;
(b) upon joining the SS Programme, the management agent of a housing
estate/building might provide monthly reports of the quantities of
recyclable waste recovered through a designated account on the
Hong Kong Waste Reduction website or providing the information to the
EPD by fax. It would strengthen promotion efforts through enhanced
communications with the housing estates and C&I buildings with a view
to achieving a better response rate;
(c) it had published on the Hong Kong Waste Reduction website a list of
participating housing estates/buildings and a list of award-winning
housing estates and residential buildings in the annual competitions under
the SS Programme. It had also included in the published lists of
award-winning housing estates and residential buildings the average
per-household-per-day quantities of recyclables collected by the
estates/buildings with reference to the awards they obtained. For
example, a housing estate or building would be extended a Diamond
Award if their average recyclables collected were equal to or greater than
30 kg per household per month; and
(d) it would continue to solicit support from participating estates/buildings for
publishing more information relating to the per-household-per-day
quantities of recyclables collected by them.
With a view to enhancing the evaluation of effectiveness of the SS Programme and
to encourage participating estates to increase collection of recyclables, the EPD
needs to compute and publish the per-household-per-day quantities of recyclables
collected from the participating estates which have provided the EPD with related
statistics.
3.36 The related government departments (the FEHD, the LCSD, the Housing
Department and the AFCD — see para. 3.27) and the C&I sector provided the EPD
with statistics of the annual quantities of recyclables collected from WS bins by their
contractors. The total quantity of such recyclables collected in 2013 was
112,152 tonnes (see para. 3.33(e)). In the year, the FEHD incurred $6.35 million
Recovery of municipal solid waste
— 51 —
for collecting recyclables weighing 711 tonnes (707 plus 4 tonnes) from WS bins
(see para. 3.33(c)), representing an average cost of $8,931 per tonne of recyclables
collected. The Housing Department, the LCSD and the AFCD did not have related
cost information because recyclables collection was part of the cleansing work under
their cleansing contracts.
3.37 Audit noted that government contractors would separate recyclables
collected into contaminated ones and non-contaminated ones. According to the
EPD, for hygiene reasons, the former would be disposed of at landfills and the latter
transported to approved recyclers. In September and October 2015, the EPD
informed Audit that:
(a) in early 2015, the EPD launched a Clean Recycling Campaign to arouse
public awareness on the contamination problem of recyclables and
encourage them to practise clean recycling. The Campaign aimed to
promote source separation and cleaning of recyclables at the community
level, so as to increase the recovery rate and recycling value of
recyclables;
(b) there were practical difficulties and inherent limitation in obtaining the
quantities of recyclables collected which were disposed of at landfills due
to contamination or other reasons, or those which were actually recovered
and used locally or exported outside Hong Kong;
(c) in the recyclable collection service contracts, the FEHD, the
AFCD, the LCSD, the Housing Department and other
government-office-management agents did not have contractual authority
to require their contractors to obtain and provide statistics on the
quantities of recyclables collected which were disposed of at landfills due
to contamination or other reasons. Bringing in contractual requirements
for contractors to compile additional statistics would take considerable
time and would substantially increase the operation costs; and
(d) the collection of recyclables at a private housing estate/C&I building was
coordinated by the property management company. While the EPD
would continue to liaise with property management companies to obtain
statistics on quantities of contaminated recyclables discarded, many of
them might have reservations to provide the information because
additional resources would be required to weigh and report the quantities
of contaminated recyclables discarded.
Recovery of municipal solid waste
— 52 —
3.38 Audit noted that members of the public had made efforts to clean and
deliver recyclable plastics to WS bins and the FEHD had incurred about $9,000 for
collecting a tonne of recyclables from WS bins (see para. 3.36). With a view to
enhancing public accountability and transparency, ascertaining the magnitude of the
recyclables contamination problem and better evaluating the effectiveness of the
SS Programme, Audit considers that there are merits for the EPD to take actions to
ascertain and publish the quantities of recyclables collected which are disposed of at
landfills due to contamination or other reasons, and those actually recovered and
used locally or exported outside Hong Kong.
Audit recommendations
3.39 Audit has recommended that the Secretary for the Environment and
the Director of Environmental Protection should, in implementing the
SS Programme:
(a) strengthen promotion efforts to encourage participating housing
estates and C&I buildings to provide the EPD with statistics on
recyclables collected from WS bins by completing and returning
standard forms;
(b) consider publishing the number of housing estates and the
corresponding population which have provided the EPD with statistics
on recyclables collected and those not providing the statistics; and
(c) compute and publish the per-household-per-day quantities of
recyclables collected by the participating estates which have provided
the EPD with statistics on recyclables collected.
Response from the Government
3.40 The Secretary for the Environment and the Director of Environmental
Protection agree with the audit recommendations.
— 53 —
PART 4: RECYCLING OF MUNICIPAL SOLID WASTE
4.1 This PART examines the actions taken by the ENB and the EPD in
facilitating MSW recycling.
Operation of EcoPark
4.2 According to the 2005 Policy Framework, the objectives of the EcoPark
project were to:
(a) provide long-term land at affordable cost for the recycling industry; and
(b) encourage investment in value-added and higher-end environmental and
recycling technologies that help minimise waste generation.
4.3 According to a paper seeking funding for constructing EcoPark submitted
to LegCo in February 2006, the EcoPark would:
(a) provide an outlet for locally recovered materials and alleviate the heavy
reliance on exporting recyclables; and
(b) achieve a target throughput of 58,600 tonnes a year.
In March 2006, the FC approved funding of $319 million for the development of
EcoPark occupying an area of 20 ha in Tuen Mun Area 38. In July 2006,
construction works commenced. The construction works were completed at a cost
of $308 million.
Recycling of municipal solid waste
— 54 —
4.4 In November 2006, the EPD awarded a contract to a management
company to manage, maintain and market EcoPark for 7 years from April 2007 at a
total cost of $98.5 million. With the approval of the Financial Services and the
Treasury Bureau, the management contract was extended from April 2014 to
October 2014. In September 2014, after conducting open tendering, the EPD
awarded a contract to another company to manage and maintain EcoPark for 4 years
from October 2014 at a total cost of $59 million. EcoPark comprises the following
three parts:
(a) an administration building, roads and marine frontage occupying an area
of 6.6 ha which were completed between May 2007 and October 2010;
(b) Phase 1 comprising six land lots (Lots 1 to 6) occupying a total area of
3.6 ha which were made available for leasing from December 2006; and
(c) Phase 2 comprising 10 land lots (Lots 7 to 16) occupying a total area of
9.8 ha which were made available for leasing in three stages, namely
Lots 7 and 8 in October 2009, Lots 9 to 14 in January 2011 and Lots 15
and 16 in July 2012.
4.5 According to the EPD, as of August 2015:
(a) except Lots 4 and 15 (see Tables 7 and 8), the remaining 14 land lots
occupying a total area of 12.5 ha had been leased/allocated for recycling
operation;
(b) the quantity of recyclable materials recovered by tenants had increased
from about 9,000 tonnes in 2010 to more than 150,000 tonnes in 2014;
and
(c) EcoPark had created about 200 new jobs for labourers, and management
and technical personnel.
Tables 7 and 8 respectively show the use of land lots under Phases 1 and 2 of
EcoPark as of August 2015.
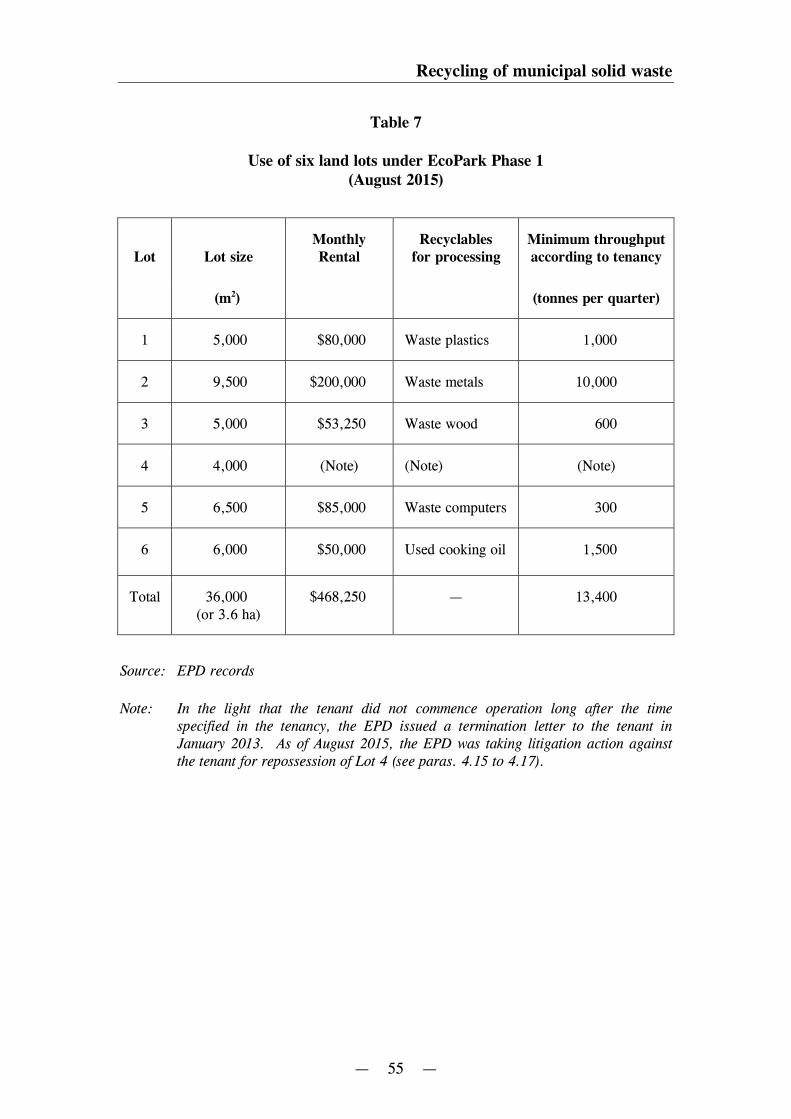
Recycling of municipal solid waste
— 55 —
Table 7
Use of six land lots under EcoPark Phase 1(August 2015)
Lot Lot sizeMonthlyRental
Recyclablesfor processing
Minimum throughputaccording to tenancy
(m2) (tonnes per quarter)
1 5,000 $80,000 Waste plastics 1,000
2 9,500 $200,000 Waste metals 10,000
3 5,000 $53,250 Waste wood 600
4 4,000 (Note) (Note) (Note)
5 6,500 $85,000 Waste computers 300
6 6,000 $50,000 Used cooking oil 1,500
Total 36,000(or 3.6 ha)
$468,250 — 13,400
Source: EPD records
Note: In the light that the tenant did not commence operation long after the timespecified in the tenancy, the EPD issued a termination letter to the tenant inJanuary 2013. As of August 2015, the EPD was taking litigation action againstthe tenant for repossession of Lot 4 (see paras. 4.15 to 4.17).
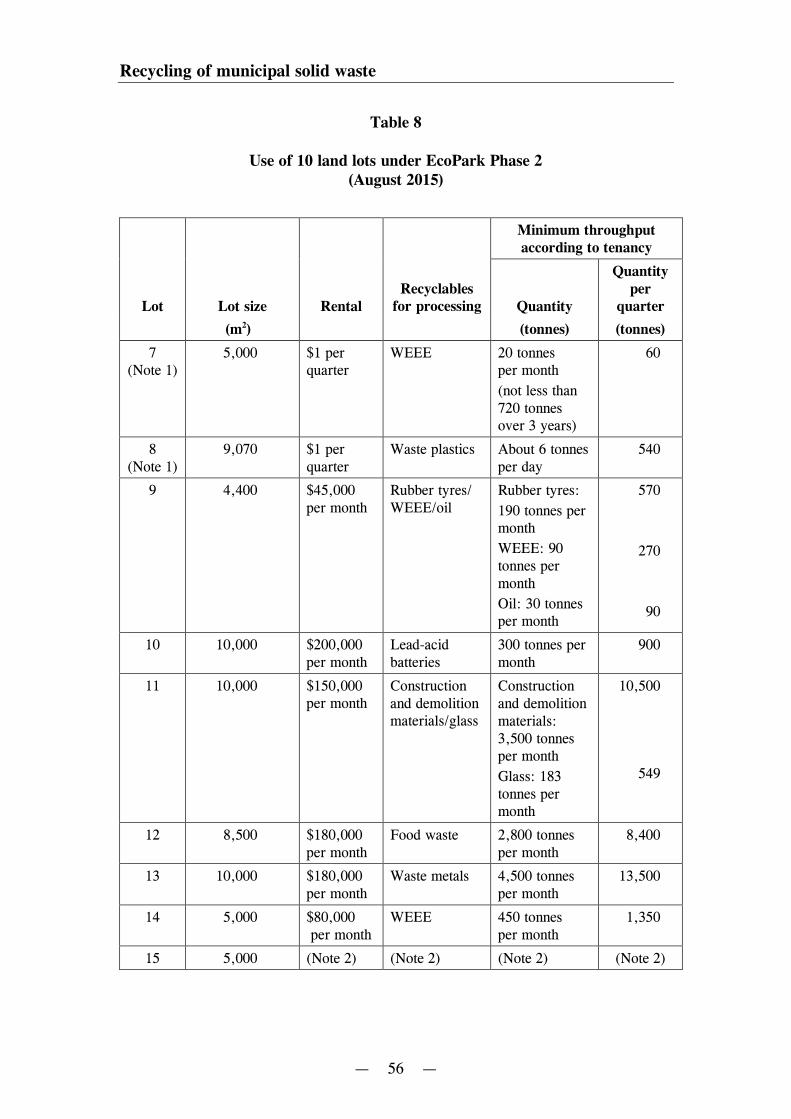
Recycling of municipal solid waste
— 56 —
Table 8
Use of 10 land lots under EcoPark Phase 2(August 2015)
Minimum throughputaccording to tenancy
Lot Lot size RentalRecyclables
for processing Quantity
Quantityper
quarter
(m2) (tonnes) (tonnes)
7(Note 1)
5,000 $1 perquarter
WEEE 20 tonnesper month
(not less than720 tonnesover 3 years)
60
8(Note 1)
9,070 $1 perquarter
Waste plastics About 6 tonnesper day
540
9 4,400 $45,000per month
Rubber tyres/WEEE/oil
Rubber tyres:
190 tonnes permonth
WEEE: 90tonnes permonth
Oil: 30 tonnesper month
570
270
90
10 10,000 $200,000per month
Lead-acidbatteries
300 tonnes permonth
900
11 10,000 $150,000per month
Constructionand demolitionmaterials/glass
Constructionand demolitionmaterials:3,500 tonnesper month
Glass: 183tonnes permonth
10,500
549
12 8,500 $180,000per month
Food waste 2,800 tonnesper month
8,400
13 10,000 $180,000per month
Waste metals 4,500 tonnesper month
13,500
14 5,000 $80,000per month
WEEE 450 tonnesper month
1,350
15 5,000 (Note 2) (Note 2) (Note 2) (Note 2)
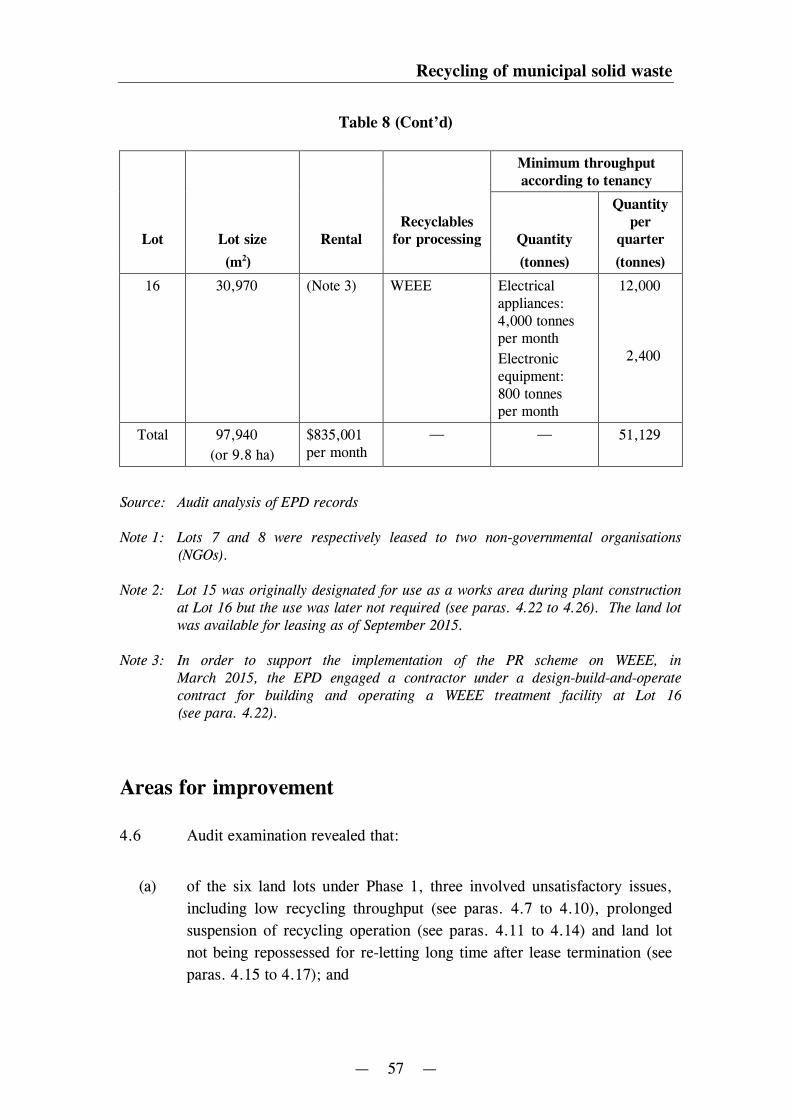
Recycling of municipal solid waste
— 57 —
Table 8 (Cont’d)
Minimum throughputaccording to tenancy
Lot Lot size RentalRecyclables
for processing Quantity
Quantityper
quarter
(m2) (tonnes) (tonnes)
16 30,970 (Note 3) WEEE Electricalappliances:4,000 tonnesper month
Electronicequipment:800 tonnesper month
12,000
2,400
Total 97,940
(or 9.8 ha)
$835,001per month
— — 51,129
Source: Audit analysis of EPD records
Note 1: Lots 7 and 8 were respectively leased to two non-governmental organisations(NGOs).
Note 2: Lot 15 was originally designated for use as a works area during plant constructionat Lot 16 but the use was later not required (see paras. 4.22 to 4.26). The land lotwas available for leasing as of September 2015.
Note 3: In order to support the implementation of the PR scheme on WEEE, inMarch 2015, the EPD engaged a contractor under a design-build-and-operatecontract for building and operating a WEEE treatment facility at Lot 16(see para. 4.22).
Areas for improvement
4.6 Audit examination revealed that:
(a) of the six land lots under Phase 1, three involved unsatisfactory issues,
including low recycling throughput (see paras. 4.7 to 4.10), prolonged
suspension of recycling operation (see paras. 4.11 to 4.14) and land lot
not being repossessed for re-letting long time after lease termination (see
paras. 4.15 to 4.17); and
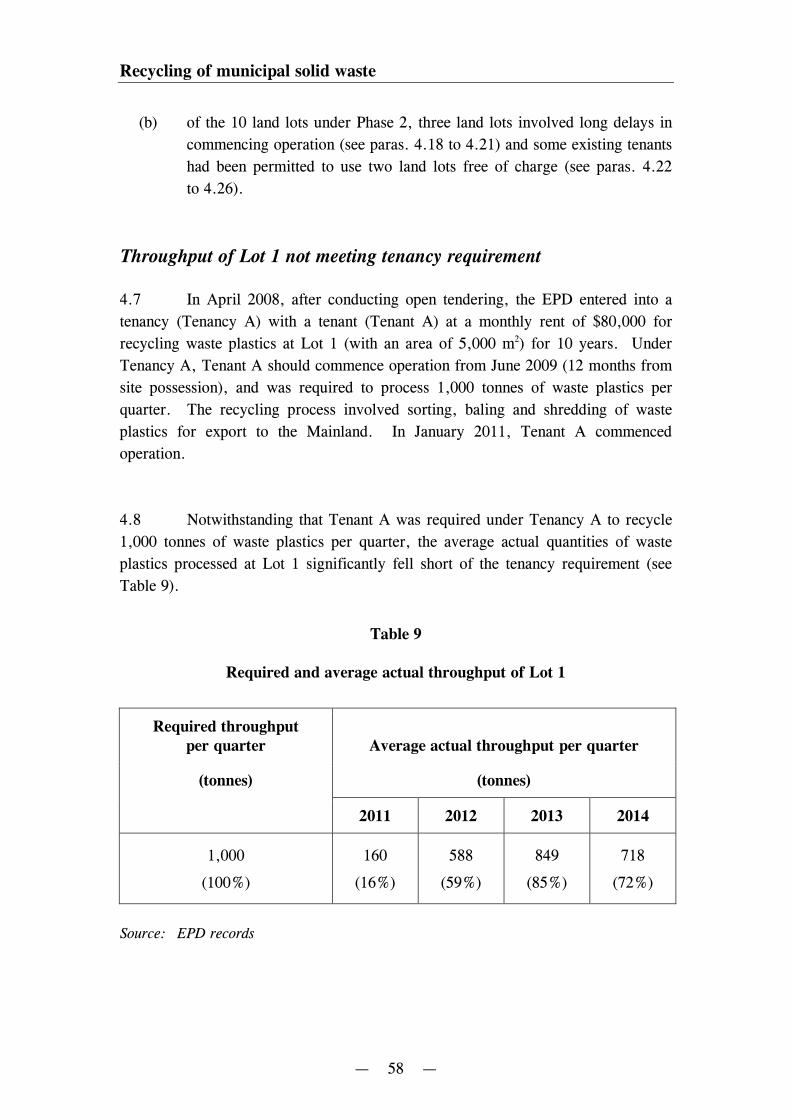
Recycling of municipal solid waste
— 58 —
(b) of the 10 land lots under Phase 2, three land lots involved long delays in
commencing operation (see paras. 4.18 to 4.21) and some existing tenants
had been permitted to use two land lots free of charge (see paras. 4.22
to 4.26).
Throughput of Lot 1 not meeting tenancy requirement
4.7 In April 2008, after conducting open tendering, the EPD entered into a
tenancy (Tenancy A) with a tenant (Tenant A) at a monthly rent of $80,000 for
recycling waste plastics at Lot 1 (with an area of 5,000 m2) for 10 years. Under
Tenancy A, Tenant A should commence operation from June 2009 (12 months from
site possession), and was required to process 1,000 tonnes of waste plastics per
quarter. The recycling process involved sorting, baling and shredding of waste
plastics for export to the Mainland. In January 2011, Tenant A commenced
operation.
4.8 Notwithstanding that Tenant A was required under Tenancy A to recycle
1,000 tonnes of waste plastics per quarter, the average actual quantities of waste
plastics processed at Lot 1 significantly fell short of the tenancy requirement (see
Table 9).
Table 9
Required and average actual throughput of Lot 1
Required throughputper quarter Average actual throughput per quarter
(tonnes) (tonnes)
2011 2012 2013 2014
1,000
(100%)
160
(16%)
588
(59%)
849
(85%)
718
(72%)
Source: EPD records
Recycling of municipal solid waste
— 59 —
4.9 In October 2015, the EPD informed Audit that:
(a) the significant fluctuations in the market prices of recyclable plastics had
affected the business of Tenant A. The EPD had assisted Tenant A to
expand its business networks and explore partnership arrangements with
relevant organisations such as trade associations, NGOs and government
departments; and
(b) it had issued warning letters on Tenant A’s failure to comply with the
minimum throughput requirement. Tenant A had achieved the required
throughput since January 2015.
4.10 Audit considers it unsatisfactory that, from 2011 to 2014, the actual
throughput of Lot 1 only accounted for 16% to 85% of the throughput as specified
in Tenancy A. Audit considers that, with a view to attaining the required
throughput set for each land lot as far as possible, the EPD needs to monitor the
throughput of the tenants closely, provide necessary assistance to the related tenants,
and explore ways and means to effectively enforce tenants’ compliance with the
minimum-throughput requirement stated in EcoPark tenancies in future.
Prolonged suspension of recycling operation at Lot 3
4.11 In April 2007, after conducting open tendering, the EPD entered into a
tenancy (Tenancy B) with a tenant (Tenant B) at a monthly rent of $53,250 for
recycling waste wood at Lot 3 (with an area of 5,000 m2) for 10 years. Under
Tenancy B, Tenant B should commence operation from May 2008 (12 months from
site possession), and was required to process 600 tonnes of waste wood per quarter.
The recycling process involved shredding of waste wood into wood chips for export
to the Mainland for manufacturing flakeboards. In February 2010, Tenant B
commenced construction works for related buildings. In May 2010, Tenant B
commenced operation.
4.12 In November 2011, Tenant B suspended business. According to
Tenant B, owing to the low selling price of wood chips and high transportation cost,
the business had become financially not viable. In mid-2012, Tenant B commenced
modification works to upgrade the production line for manufacturing wood-fuel
pellets which had a higher value. In July 2013, Tenant B changed the operation to
Recycling of municipal solid waste
— 60 —
recycling waste wood into wood-fuel pellets. In January 2015, Tenant B again
suspended operation. Tenant B informed the EPD that he was planning to adjust his
operation mode to producing both wood chips and wood-fuel pellets for export to
the Mainland. On 8 September 2015, the EPD issued a warning letter to Tenant B,
requiring him to resume operation by October 2015. Subsequently, Tenant B
resumed operation on 17 September 2015.
4.13 Audit considers it unsatisfactory that:
(a) Tenant B only commenced recycling operation in May 2010, 24 months
after the time specified in Tenancy B;
(b) waste-wood recycling operation at Lot 3 was suspended for 20 months
from November 2011 to June 2013; and
(c) the recycling operation was again suspended for 8 months from January to
September 2015.
4.14 In Audit’s view, the EPD needs to closely liaise with Tenant B with a
view to facilitating continued operation of the waste-wood recycling business at
Lot 3. Furthermore, with a view to minimising prolonged suspension of recycling
operation by tenants, the EPD also needs to explore ways and means to effectively
enforce tenants’ compliance with the operation requirement stated in EcoPark
tenancies in future. These actions would help better achieve the objectives of
EcoPark.
Lot 4 not repossessed for re-letting long time after lease termination
4.15 In February 2009, after conducting open tendering, the EPD entered into
a tenancy (Tenancy C) with a tenant (Tenant C) at a monthly rent of $41,000 for
recycling used batteries at Lot 4 (with an area of 4,000 m2) for 10 years. Under
Tenancy C, Tenant C should commence operation from August 2010 (12 months
from site possession), and he was required to process 30 tonnes of used batteries per
quarter. In December 2010, Tenant C commenced construction works for related
buildings.
Recycling of municipal solid waste
— 61 —
4.16 In August 2012, under section 58 of the Conveyancing and Property
Ordinance (Cap. 219) (Note 16), the EPD issued a final notice requiring Tenant C
to commence operation by November 2012. In October 2012, Tenant C proposed
to commence operation in January 2013. In January 2013, noting Tenant C’s failure
to commence operation, the EPD issued a termination letter demanding Tenant C to
deliver vacant possession of Lot 4 within three months. In April 2013, the EPD
issued another letter to demand Tenant C to deliver vacant possession of Lot 4 and
stated the EPD’s right to commence legal proceedings. In May 2013, the EPD
referred the case to the Department of Justice. In November 2014, Tenant C
proposed to settle the issue by mediation. In December 2014, the EPD agreed to
resolve the dispute by mediation. In August 2015, Tenant C had not responded to
the proposed mediation arrangement. After consulting the Department of Justice,
the EPD decided to proceed to take litigation actions.
4.17 Under Tenancy C, Tenant C should commence operation from August
2010. However, up to August 2015, five years after the commencement date
specified in Tenancy C, the used-battery recycling operation at the land lot had not
commenced. In Audit’s view, the long delay in commencing the used-battery
recycling operation at EcoPark is unsatisfactory which has adversely affected
achievement of the objectives of EcoPark. Therefore, the EPD needs to expedite
necessary actions with a view to repossessing Lot 4 and re-letting the site as early as
possible. Furthermore, the EPD also needs to explore ways and means for the EPD
to repossess a leased site earlier in future if the related tenant fails to comply with
significant tenancy requirements, such as the operation commencement date.
Long delays in commencing operationat Lots 9, 10 and 14 of Phase 2
4.18 After completion of site construction works, Lots 7 to 16 under Phase 2
were available for leasing to tenants in three stages from October 2009 to July 2012
(see para. 4.4(c)). Audit noted that, as of August 2015, tenants of three land lots
under Phase 2 had not commenced operations 29 months after the time specified in
the tenancies (see Table 10).
Note 16: Section 58 of the Ordinance states that a right of re-entry in a lease shall not beenforceable unless the lessor serves on the lessee a notice specifying the breachand the lessee fails to remedy the breach within a reasonable time.
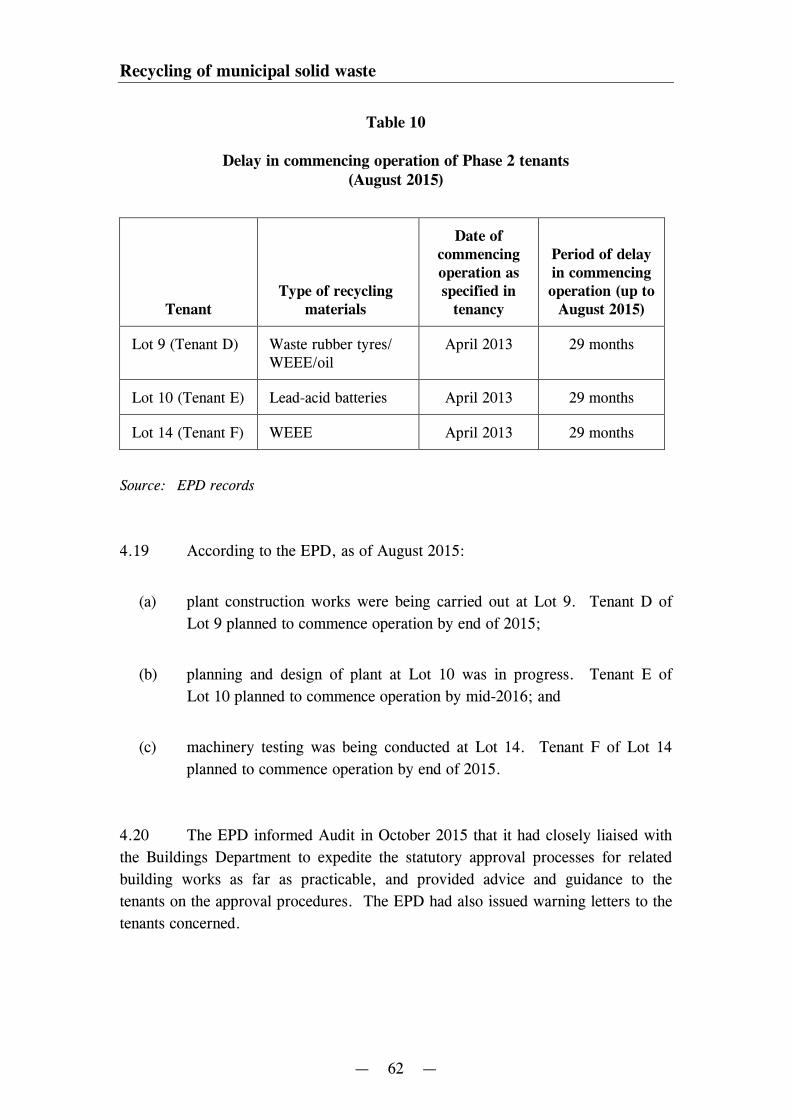
Recycling of municipal solid waste
— 62 —
Table 10
Delay in commencing operation of Phase 2 tenants(August 2015)
TenantType of recycling
materials
Date ofcommencingoperation asspecified in
tenancy
Period of delayin commencingoperation (up to
August 2015)
Lot 9 (Tenant D) Waste rubber tyres/WEEE/oil
April 2013 29 months
Lot 10 (Tenant E) Lead-acid batteries April 2013 29 months
Lot 14 (Tenant F) WEEE April 2013 29 months
Source: EPD records
4.19 According to the EPD, as of August 2015:
(a) plant construction works were being carried out at Lot 9. Tenant D of
Lot 9 planned to commence operation by end of 2015;
(b) planning and design of plant at Lot 10 was in progress. Tenant E of
Lot 10 planned to commence operation by mid-2016; and
(c) machinery testing was being conducted at Lot 14. Tenant F of Lot 14
planned to commence operation by end of 2015.
4.20 The EPD informed Audit in October 2015 that it had closely liaised with
the Buildings Department to expedite the statutory approval processes for related
building works as far as practicable, and provided advice and guidance to the
tenants on the approval procedures. The EPD had also issued warning letters to the
tenants concerned.
Recycling of municipal solid waste
— 63 —
4.21 Audit considers that, with a view to ensuring that EcoPark tenants would
commence operation according to the time specified in tenancies, the EPD needs to
provide necessary assistance and explore ways and means to effectively enforce
tenants’ compliance with the operation-commencement requirement stated in
EcoPark tenancies in future.
Some tenants being permitted to use vacant land lots free of charge
4.22 In order to support the implementation of PR scheme on WEEE, in
March 2015, after conducting open tendering, the EPD awarded a
design-build-and-operate contract at a sum of $1,728 million to Contractor A for
building a WEEE treatment facility at Lot 16 (occupying an area of 30,970 m2) and
operating the facility for 10 years. Lot 15 (occupying an area of 5,000 m2) was
originally intended for use by Contractor A as a works area during plant
construction but the use was later not required.
4.23 From completion of site works of Lots 15 and 16 in July 2012 to
awarding the design-build-and-operate contract for Lot 16 in March 2015 (2 years
and 9 months), for the purpose of providing assistance to resolve the operation
difficulties of EcoPark tenants, the EPD permitted five tenants (tenants of Lots 3, 8,
11, 13 and 14) to use areas in Lots 15 and 16 for storage purposes free of charge for
periods ranging from three to six months for each period of permission. In this
connection, the related tenants were required to sign an undertaking on not
subletting the areas and indemnifying the EPD for any loss and damage incurred.
Table 11 shows the areas under Lots 15 and 16 and the durations of occupation by
the five existing tenants.
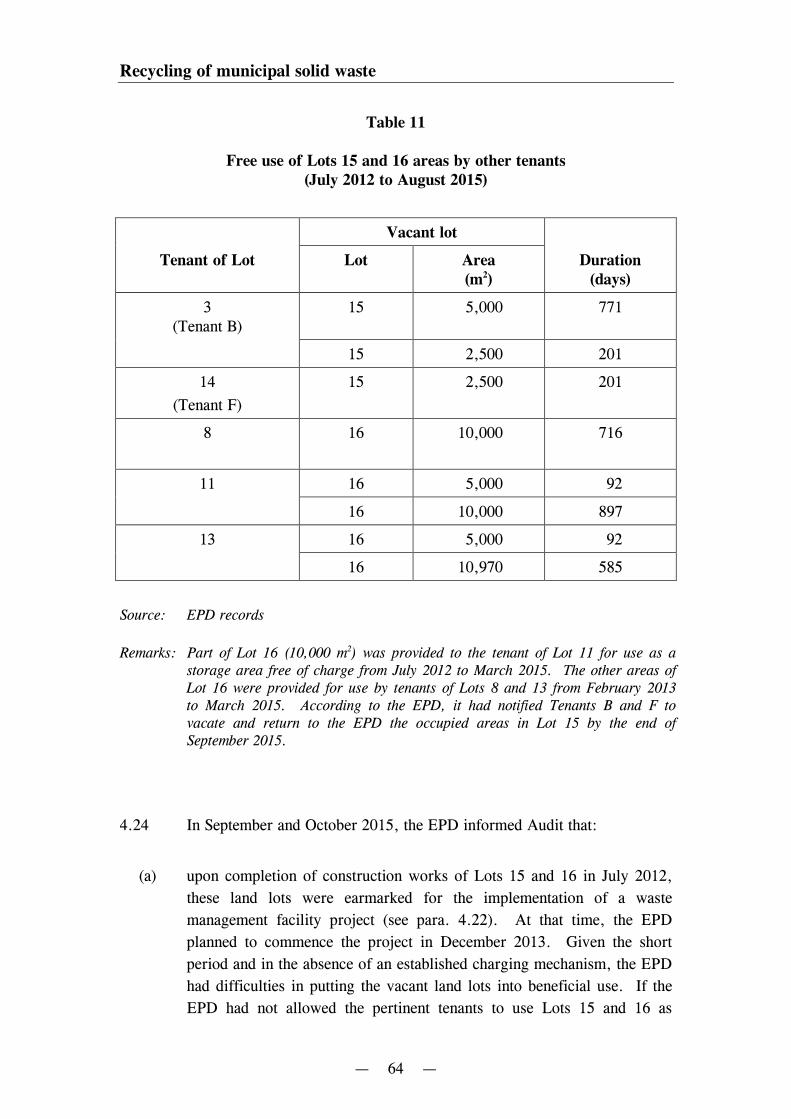
Recycling of municipal solid waste
— 64 —
Table 11
Free use of Lots 15 and 16 areas by other tenants(July 2012 to August 2015)
Vacant lot
Tenant of Lot Lot Area Duration(m2) (days)
3(Tenant B)
15 5,000 771
15 2,500 201
14
(Tenant F)
15 2,500 201
8 16 10,000 716
11 16 5,000 92
16 10,000 897
13 16 5,000 92
16 10,970 585
Source: EPD records
Remarks: Part of Lot 16 (10,000 m2) was provided to the tenant of Lot 11 for use as astorage area free of charge from July 2012 to March 2015. The other areas ofLot 16 were provided for use by tenants of Lots 8 and 13 from February 2013to March 2015. According to the EPD, it had notified Tenants B and F tovacate and return to the EPD the occupied areas in Lot 15 by the end ofSeptember 2015.
4.24 In September and October 2015, the EPD informed Audit that:
(a) upon completion of construction works of Lots 15 and 16 in July 2012,
these land lots were earmarked for the implementation of a waste
management facility project (see para. 4.22). At that time, the EPD
planned to commence the project in December 2013. Given the short
period and in the absence of an established charging mechanism, the EPD
had difficulties in putting the vacant land lots into beneficial use. If the
EPD had not allowed the pertinent tenants to use Lots 15 and 16 as
Recycling of municipal solid waste
— 65 —
temporary storage areas, the land lots would have been left vacant
pending the development of the WEEE treatment facility and no rental
revenue would have been generated;
(b) the provision of temporary storage areas to existing tenants was one of the
EPD’s supporting measures to address the temporary commissioning and
operational difficulties of existing tenants and achieve better site
utilisation; and
(c) without providing the storage space for use by the existing tenants, some
of the recyclable materials might need to be disposed of at landfills and
some tenants might not be able to conduct operation commissioning tests
smoothly.
4.25 In May 2009, in relation to charging a nominal rent for letting Lots 7
and 8 to two NGOs (see Table 8 in para. 4.5), the Financial Services and the
Treasury Bureau informed the EPD that:
(a) the Government should not use public money to subsidise a commercial or
profit-making business when it was commercially viable to run the
business; and
(b) the Government should not be seen to provide funding to enhance the
profit of private businesses or compete with the private sector.
4.26 While vacant land lots should be put into gainful use, Audit considers that
reasonable rental should be charged for temporary use of vacant land lots at
EcoPark by profit-making organisations. Apart from the tenant of Lot 8 who is an
NGO, the tenancies of Lots 3, 11, 13 and 14 were awarded to commercial operators
after conducting open tendering. Under the tenancies of Lots 3, 11, 13 and 14, the
tenants could operate their businesses within the areas (5,000 m2 for Lot 3,
10,000 m2 for Lot 11, 10,000 m2 for Lot 13 and 5,000 m2 for Lot 14) allocated at
specific monthly rentals ($53,250 for Lot 3, $150,000 for Lot 11, $180,000 for
Lot 13 and $80,000 for Lot 14). Given that the temporary use of additional areas
was not made known in the open tendering, free allocation of the areas after the
tendering is not satisfactory. In Audit’s view, the EPD needs to take measures to
prevent recurrence of similar anomalies in future.
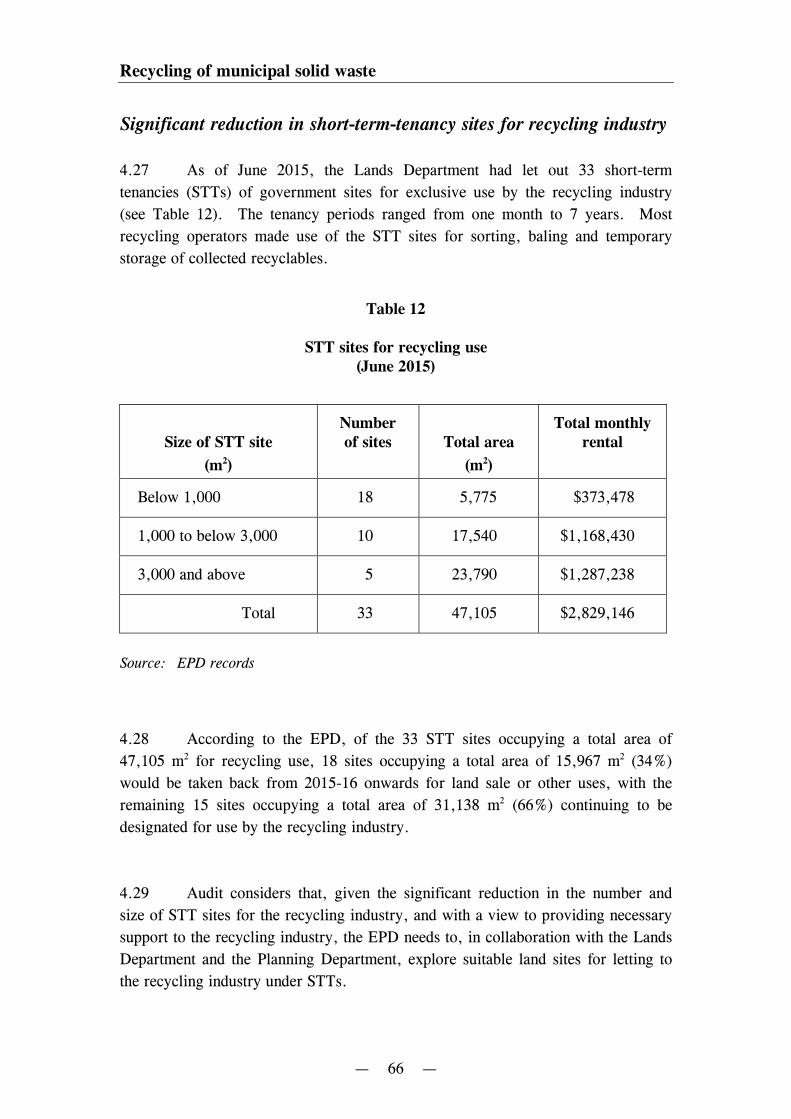
Recycling of municipal solid waste
— 66 —
Significant reduction in short-term-tenancy sites for recycling industry
4.27 As of June 2015, the Lands Department had let out 33 short-term
tenancies (STTs) of government sites for exclusive use by the recycling industry
(see Table 12). The tenancy periods ranged from one month to 7 years. Most
recycling operators made use of the STT sites for sorting, baling and temporary
storage of collected recyclables.
Table 12
STT sites for recycling use(June 2015)
Size of STT siteNumberof sites Total area
Total monthlyrental
(m2) (m2)
Below 1,000 18 5,775 $373,478
1,000 to below 3,000 10 17,540 $1,168,430
3,000 and above 5 23,790 $1,287,238
Total 33 47,105 $2,829,146
Source: EPD records
4.28 According to the EPD, of the 33 STT sites occupying a total area of
47,105 m2 for recycling use, 18 sites occupying a total area of 15,967 m2 (34%)
would be taken back from 2015-16 onwards for land sale or other uses, with the
remaining 15 sites occupying a total area of 31,138 m2 (66%) continuing to be
designated for use by the recycling industry.
4.29 Audit considers that, given the significant reduction in the number and
size of STT sites for the recycling industry, and with a view to providing necessary
support to the recycling industry, the EPD needs to, in collaboration with the Lands
Department and the Planning Department, explore suitable land sites for letting to
the recycling industry under STTs.
Recycling of municipal solid waste
— 67 —
Audit recommendations
4.30 Audit has recommended that the Secretary for the Environment and
the Director of Environmental Protection should, in managing EcoPark
tenancies:
(a) provide necessary assistance to related tenants and explore ways and
means to effectively enforce tenants’ compliance with related
requirements stated in EcoPark tenancies with a view to minimising:
(i) actual recycling throughput being significantly lower than that
specified in tenancies;
(ii) prolonged suspension of recycling operation; and
(iii) significant delays in commencing recycling operation;
(b) expedite necessary actions with a view to repossessing Lot 4 and
re-letting the site as early as possible;
(c) explore ways and means to repossess a leased site earlier in future if
the related tenant fails to comply with significant tenancy
requirements;
(d) charge reasonable rental for temporary use of vacant land lots by
profit-making organisations; and
(e) in collaboration with the Director of Lands and the Director of
Planning, explore suitable land sites for letting to the recycling
industry under STTs.
Recycling of municipal solid waste
— 68 —
Response from the Government
4.31 The Secretary for the Environment and the Director of Environmental
Protection agree with the audit recommendations. They have said that the ENB and
the EPD:
(a) will continue to provide feasible assistance to tenants and step up lease
enforcement actions to ensure that the tenants can commence operation as
planned, meet their recycling throughput and operate without disruptions;
(b) will continue to liaise with the Department of Justice with a view to
repossessing Lot 4 and re-letting the site as early as possible;
(c) will explore with the Department of Justice ways to expedite legal actions
to repossess a leased site in the event the tenant concerned fails to comply
with significant tenancy requirements;
(d) will explore setting up a suitable charging scheme for temporary use of
vacant land lots by commercial tenants in future; and
(e) has been working with the government departments concerned to step up
efforts in identifying suitable STT sites to address the needs of the
recycling industry and will continue to do so.
4.32 The Secretary for Financial Services and the Treasury has said that, as
regards the audit recommendation in paragraph 4.30(d), vacant lots should be
awarded to commercial operators through open tendering, and the rental to be
charged should reflect the open market rentals.
4.33 The Director of Planning agrees with the audit recommendation in
paragraph 4.30(e). He has said that the Planning Department will work with the
government departments concerned to search for suitable temporary sites for letting
to the recycling industry under STTs.
— 69 —
PART 5: TREATMENT AND DISPOSALOF MUNICIPAL SOLID WASTE
5.1 This PART examines actions taken by the ENB and the EPD in reducing
the quantity of MSW disposal.
MSW-disposal targets
5.2 In Hong Kong, MSW generated would either be recovered (mainly for
export) or disposed of at landfills. The 2005 Policy Framework set the following
target on reduction of the quantity of MSW disposed of at landfills:
Reducing the percentage of MSW disposed of at landfills from
60% in 2004 to 25% in 2014, with the remaining 50% of MSW
being recovered and 25% being treated by an integrated waste
management facility (IWMF).
5.3 Furthermore, the 2013 Blueprint set the following target:
Reducing the per-capita-per-day MSW disposal from 1.27 kg in
2011 to 1 kg or less by 2017, and further to 0.8 kg or less by
2022.
Means of treating and disposing of MSW
5.4 According to the 2005 Policy Framework:
(a) solely relying on landfills for waste disposal was not sustainable for
Hong Kong; and
(b) the existing landfills were running out of capacity, and the Government
faced increasing difficulty in identifying suitable sites for new landfills.
The landfill capacity should be conserved only for the disposal of
unavoidable and treatment waste.
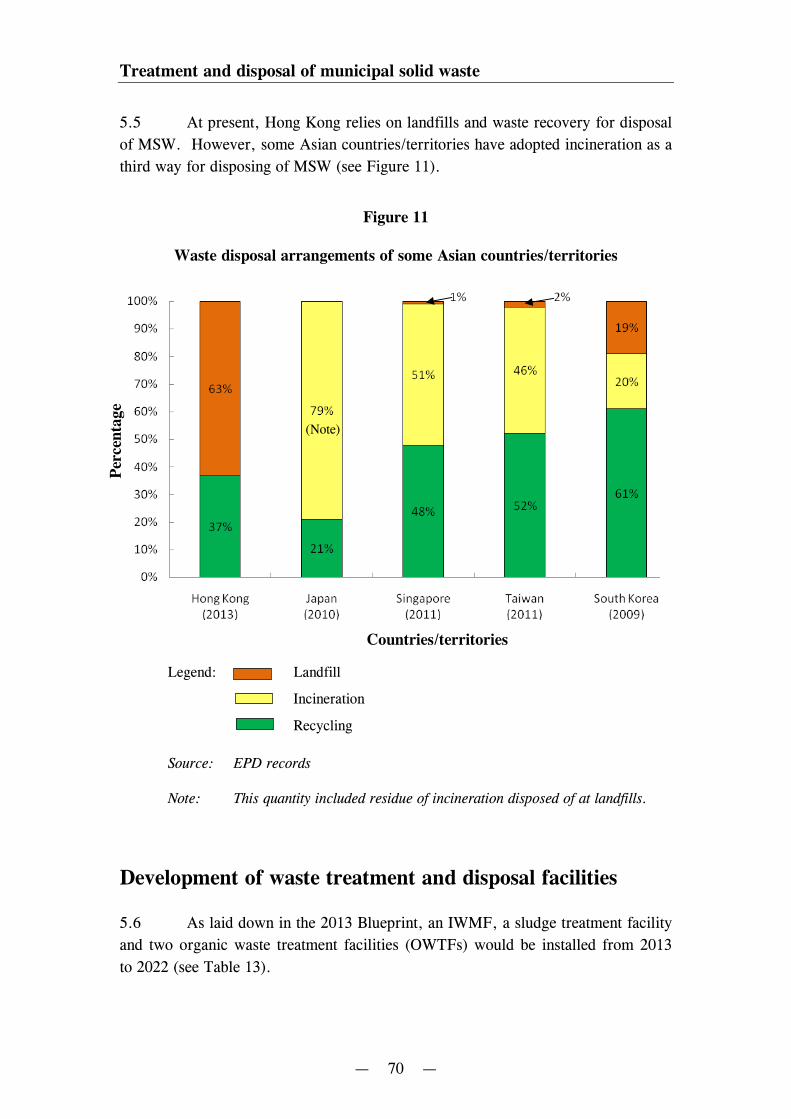
Treatment and disposal of municipal solid waste
— 70 —
5.5 At present, Hong Kong relies on landfills and waste recovery for disposal
of MSW. However, some Asian countries/territories have adopted incineration as a
third way for disposing of MSW (see Figure 11).
Figure 11
Waste disposal arrangements of some Asian countries/territories
Legend: Landfill
Incineration
Recycling
Source: EPD records
Note: This quantity included residue of incineration disposed of at landfills.
Development of waste treatment and disposal facilities
5.6 As laid down in the 2013 Blueprint, an IWMF, a sludge treatment facility
and two organic waste treatment facilities (OWTFs) would be installed from 2013
to 2022 (see Table 13).
Per
centa
ge
Countries/territories
(Note)
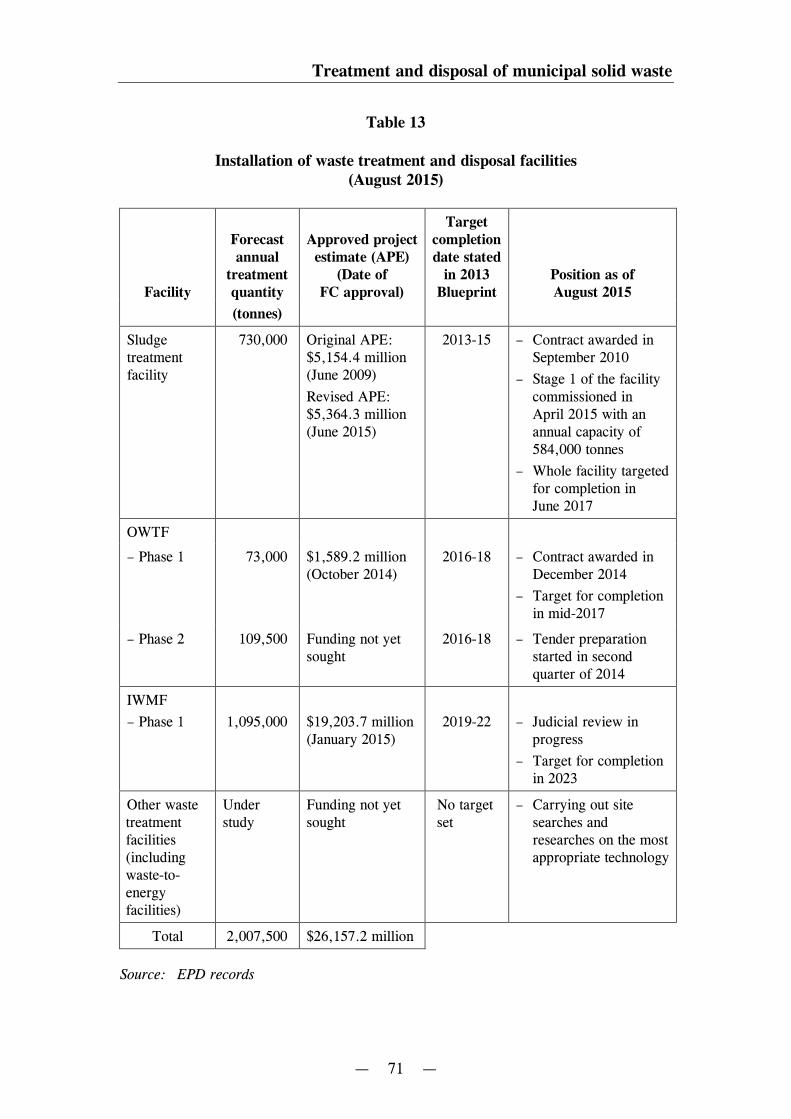
Treatment and disposal of municipal solid waste
— 71 —
Table 13
Installation of waste treatment and disposal facilities(August 2015)
Facility
Forecastannual
treatmentquantity
Approved projectestimate (APE)
(Date ofFC approval)
Targetcompletiondate stated
in 2013Blueprint
Position as ofAugust 2015
(tonnes)
Sludgetreatmentfacility
730,000 Original APE:$5,154.4 million(June 2009)
Revised APE:$5,364.3 million(June 2015)
2013-15 – Contract awarded inSeptember 2010
– Stage 1 of the facilitycommissioned inApril 2015 with anannual capacity of584,000 tonnes
– Whole facility targetedfor completion inJune 2017
OWTF
– Phase 1 73,000 $1,589.2 million(October 2014)
2016-18 – Contract awarded inDecember 2014
– Target for completionin mid-2017
– Phase 2 109,500 Funding not yetsought
2016-18 – Tender preparationstarted in secondquarter of 2014
IWMF
– Phase 1 1,095,000 $19,203.7 million(January 2015)
2019-22 – Judicial review inprogress
– Target for completionin 2023
Other wastetreatmentfacilities(includingwaste-to-energyfacilities)
Understudy
Funding not yetsought
No targetset
– Carrying out sitesearches andresearches on the mostappropriate technology
Total 2,007,500 $26,157.2 million
Source: EPD records
Treatment and disposal of municipal solid waste
— 72 —
5.7 In 2013, 299,538 tonnes of dewatered sewage sludge generated from the
sewage treatment plants of the Drainage Services Department were disposed of at
landfills. After commissioning of the sludge treatment facility located in Tuen Mun
in April 2015, dewatered sewage sludge has been treated by incineration at the
facility, with residuals being disposed of at landfills.
5.8 An OWTF is designed for recycling and treating food waste using
biological treatment technologies, which would produce biogas (a source of
renewable energy similar to natural gas) as well as a residue that can be processed
for use as compost or fertilizer. Details of OWTF Phases 1 and 2 are elaborated in
Chapter 2 of the Director of Audit’s Report No. 65.
Implementation of the IWMF
5.9 In 1998, the EPD announced a plan to commission a waste-to-energy
facility (later renamed IWMF) by 2006. The 2005 Policy Framework set a target of
commissioning a waste-to-energy plant by mid-2010s. The 2013 Blueprint revised
the commissioning time to “2019 to 2022”. In January 2015, the FC approved
funding of $19,203.7 million for the development of IWMF Phase 1 on an artificial
island near Shek Kwu Chau, south of Lantau Island. As stated in the funding paper,
the annual recurrent expenditure of IWMF Phase 1 would be $402 million and the
plant would be commissioned in 2022-23. The facility would adopt advanced
incineration technologies for disposing of MSW which would generate electricity for
gainful use. The residual of treatment (about 10% in volume of the MSW) would
be disposed of at landfills.
5.10 In 2012, a member of the public filed an application for judicial review of
the EPD’s approval of the environmental impact assessment report for development
of IWMF Phase 1. After being dismissed by the Court of Appeal, the applicant
appealed to the Court of Final Appeal and an appeal hearing was scheduled for
November 2015. A chronology of key events of the issue is shown in Appendix B.
Treatment and disposal of municipal solid waste
— 73 —
Areas for improvement
Target for reducing MSW disposal at landfills not met
5.11 The 2005 Policy Framework set a target of reducing the percentage of
MSW disposed of at landfills from 60% in 2004 to 25% in 2014, with the remaining
50% of MSW being recovered and 25% being treated by an IWMF. Owing to the
postponement in commissioning the IWMF from mid-2010s to 2023 (see paras. 5.6
and 5.9), MSW which was originally targeted for treatment by the IWMF would
have to be disposed of at landfills during the period of postponement. Therefore, in
2014, 50% of MSW was expected to be disposed of at landfills and the remaining
50% to be recovered (mainly for export outside Hong Kong).
5.12 As shown in Figure 8 in paragraph 3.8, the published MSW-recovery rate
had decreased from 52% in 2010 to 37% in 2013. As elaborated in PART 2, due to
inclusion of import recyclables in the estimation, the 5.49 million tonnes of
MSW generation and the 2.01 million tonnes of MSW recovery in 2013 had been
over-estimated, and hence the MSW-recovery rate of 37% had also been
over-estimated. Accordingly, in 2013, more than 63% (100% less 37%) of
locally-generated MSW should have been disposed of at landfills. The
Government’s target stated in the 2005 Policy Framework of disposing of 50% of
MSW either at landfills or treated by the IWMF was not achieved.
Rising MSW disposal at landfills in recent years
5.13 The 2013 Blueprint set a target of reducing the quantity of
per-capita-per-day MSW disposal from 1.27 kg in 2011 to 1 kg or less by 2017, and
further to 0.8 kg or less by 2022.
5.14 Audit noted that the total quantities and per-capita-per-day quantities of
MSW disposed of at landfills had increased in recent years (see Table 14).
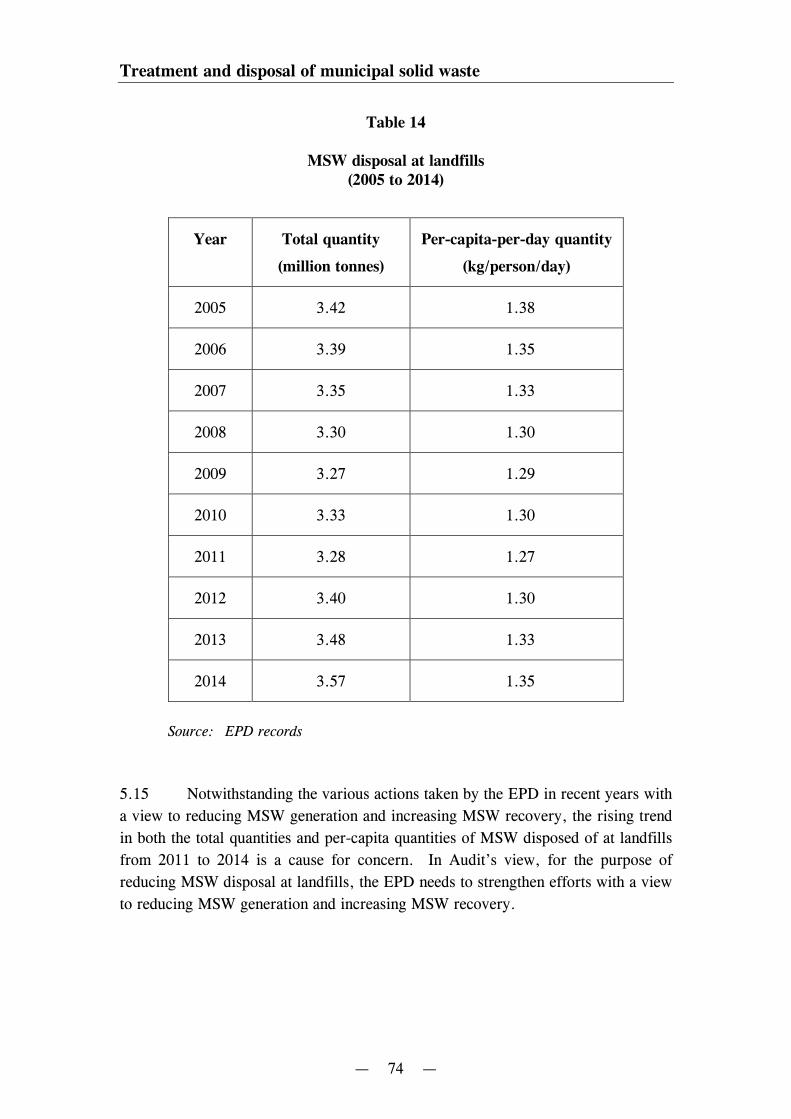
Treatment and disposal of municipal solid waste
— 74 —
Table 14
MSW disposal at landfills(2005 to 2014)
Year Total quantity
(million tonnes)
Per-capita-per-day quantity
(kg/person/day)
2005 3.42 1.38
2006 3.39 1.35
2007 3.35 1.33
2008 3.30 1.30
2009 3.27 1.29
2010 3.33 1.30
2011 3.28 1.27
2012 3.40 1.30
2013 3.48 1.33
2014 3.57 1.35
Source: EPD records
5.15 Notwithstanding the various actions taken by the EPD in recent years with
a view to reducing MSW generation and increasing MSW recovery, the rising trend
in both the total quantities and per-capita quantities of MSW disposed of at landfills
from 2011 to 2014 is a cause for concern. In Audit’s view, for the purpose of
reducing MSW disposal at landfills, the EPD needs to strengthen efforts with a view
to reducing MSW generation and increasing MSW recovery.
Treatment and disposal of municipal solid waste
— 75 —
LegCo not provided with quantifiable informationrelating to serviceable lives of landfills
5.16 In March 2012, the EPD informed the EA Panel that, as of end 2011, the
three landfills had used up 79 million cubic metres (m3) of the total capacity of
139 million m3, and that they would reach their capacity commencing from 2014 to
2018, based on the following considerations:
(a) since landfills were the last resort for waste disposal, prudent and realistic
planning assumptions had been adopted; and
(b) such assumptions included a moderate growth in waste due to population
growth, increases in economic activities and major development projects,
having regard to historical trends and economic forecasts.
5.17 In May 2013, the EPD informed the EA Panel that, in estimating the
serviceable lives of the three landfills, it was assumed that the quantities of
construction waste being disposed of at landfills would remain constant. In
December 2014, the FC approved funding of $2,101.6 million and $7,510 million
for extension works for SENT Landfill and NENT Landfill respectively, and
$38 million for carrying out the detailed study, site investigation and tender
preparation work for WENT Landfill extension works. In seeking funding approval
for extending the three landfills, the EPD informed the FC that the three landfills
were estimated to reach their capacity from 2015 to 2018-19, and the proposed
works would extend the estimated serviceable lives of WENT Landfill by 15 years
from 2018-19, SENT Landfill by 6 years from 2017 and NENT Landfill by
10 years from 2018. Table 15 shows the capacities of the three landfills and their
estimated serviceable lives at different times.
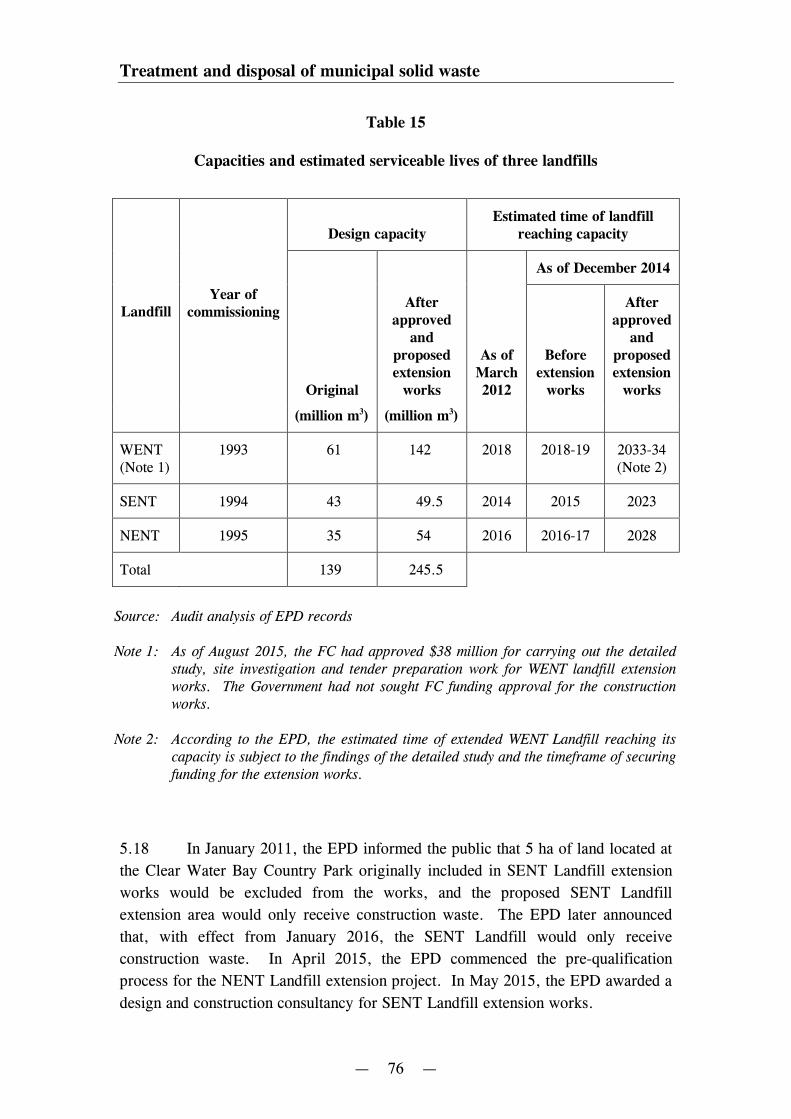
Treatment and disposal of municipal solid waste
— 76 —
Table 15
Capacities and estimated serviceable lives of three landfills
LandfillYear of
commissioning
Design capacityEstimated time of landfill
reaching capacity
Original
Afterapproved
andproposedextension
works
As ofMarch2012
As of December 2014
Beforeextension
works
Afterapproved
andproposedextension
works
(million m3) (million m3)
WENT(Note 1)
1993 61 142 2018 2018-19 2033-34(Note 2)
SENT 1994 43 49.5 2014 2015 2023
NENT 1995 35 54 2016 2016-17 2028
Total 139 245.5
Source: Audit analysis of EPD records
Note 1: As of August 2015, the FC had approved $38 million for carrying out the detailedstudy, site investigation and tender preparation work for WENT landfill extensionworks. The Government had not sought FC funding approval for the constructionworks.
Note 2: According to the EPD, the estimated time of extended WENT Landfill reaching itscapacity is subject to the findings of the detailed study and the timeframe of securingfunding for the extension works.
5.18 In January 2011, the EPD informed the public that 5 ha of land located at
the Clear Water Bay Country Park originally included in SENT Landfill extension
works would be excluded from the works, and the proposed SENT Landfill
extension area would only receive construction waste. The EPD later announced
that, with effect from January 2016, the SENT Landfill would only receive
construction waste. In April 2015, the EPD commenced the pre-qualification
process for the NENT Landfill extension project. In May 2015, the EPD awarded a
design and construction consultancy for SENT Landfill extension works.
Treatment and disposal of municipal solid waste
— 77 —
5.19 From 1993 to 2011, the three landfills received waste with a total weight
of 98.3 million tonnes, which had used up 79 million m3 of the total capacity of
139 million m3 of the three landfills. Accordingly, the weight-to-volume
ratio during the period was 1.24 tonnes of waste : 1 m3 of landfill space
(98.3 million tonnes ÷ 79 million m3), compared to the EPD’s estimated ratio of
1 tonne : 1 m3 (Note 17). With the total remaining capacity of the three landfills of
60 million m3 as of end 2011, they would be able to receive 60 million tonnes
(based on the EPD’s estimated ratio of 1 tonne : 1 m3) to 74 million tonnes (based
on the historical ratio of 1.24 tonnes : 1 m3) of waste in future. In the event that a
constant annual quantity of 5.22 million tonnes of waste (see Figure 2 in para. 1.3)
is disposed of at the three landfills in the forthcoming years, the remaining
serviceable lives of the three landfills could last for some years after 2018, contrary
to the EPD’s estimates made in 2012 that the three landfills would reach their
capacities from 2014 to 2018. In September 2015, in response to Audit’s
above-mentioned observations, the EPD informed Audit that the estimated time of
the three landfills reaching their capacity of 2014 to 2018 (as of March 2012 — see
Table 15 in para. 5.17) were based on the following assumptions:
(a) an area of 15 ha in WENT Landfill had to be reserved for providing
freshwater ponds as required under the environmental permit for the
WENT Landfill extension project, resulting in a loss in the landfill
capacity of about 8 million m3;
(b) enhanced daily soil cover, liner and drainage layers, leachate and landfill
gas-collection-pipeline networks were required to be implemented at the
landfills to address the nearby community’s concerns, resulting in a loss
in the landfill capacity of about 6 million m3;
(c) by end 2011, the remaining usable capacity of the three landfills had been
reduced to 46 (60 less 8 less 6) million m3, which would be able to
receive 46 million tonnes of waste in future (i.e. at a weight-to-volume
ratio of 1 tonne of waste : 1 m3 of landfill space); and
Note 17: According to the EPD: (a) it had adopted a conservative weight-to-volume ratioof 1 tonne : 1 m3 in estimating the remaining serviceable lives of the threelandfills (see para. 5.16); and (b) the ratio of 1.24 tonnes : 1 m3 according towaste disposal in the past years was due to a higher proportion of constructionwaste being disposed of at landfills before 2006. Since 2006, with theimplementation of the Construction Waste Disposal Charging Scheme, thequantity of inert construction waste disposed of at landfills had decreased.
Treatment and disposal of municipal solid waste
— 78 —
(d) instead of using a constant disposal quantity, the EPD assumed that there
would be a 2.5% annual growth of MSW, a 10% annual growth of
construction waste and a 5% annual growth of special waste disposed of
at the landfills.
5.20 Audit noted that, in informing the EA Panel in March 2012 of the
remaining serviceable lives of the three landfills, the EPD did not provide
quantifiable information on the basis of estimation and the underlying assumptions
as outlined in paragraph 5.19. Audit considers that, in seeking funding approval for
landfill extension works in future, the EPD needs to provide LegCo with
quantifiable information and the assumptions made in estimating the remaining
serviceable lives of landfills.
Audit recommendations
5.21 Audit has recommended that the Secretary for the Environment and
the Director of Environmental Protection should:
(a) strengthen efforts with a view to reducing MSW generation and
increasing MSW recovery; and
(b) in seeking funding approval for landfill extension works in future,
provide LegCo with quantifiable information and the underlying
assumptions in estimating the remaining serviceable lives of landfills.
Response from the Government
5.22 The Secretary for the Environment and the Director of Environmental
Protection agree with the audit recommendations. They have said that the ENB and
the EPD will:
(a) continue to vigorously pursue the various MSW reduction and recycling
measures set out in the 2013 Blueprint; and
(b) endeavour to provide LegCo with quantifiable information, including the
underlying assumptions, for estimating the remaining serviceable lives of
landfills, in funding applications for landfill extension works in future.
— 79 —
PART 6: WAY FORWARD
6.1 This PART outlines the major audit observations and examines the way
forward.
Achievement of MSW targets
6.2 The 2005 Policy Framework set a target of achieving an MSW-recovery
rate of 50% by 2014 (see para. 3.4(b)) and the 2013 Blueprint stated that about 55%
of MSW would be recycled by 2022 (see para. 3.6). This audit reveals that, owing
to the fact that both locally-generated and import recyclables processed for export
were classified as “domestic export” in trade declarations, the quantities of
locally-generated MSW and recovered MSW had been over-estimated. As a result,
the MSW-recovery rates had also been over-estimated. As the targets for MSW
generation and MSW-recovery rates had been based on historical statistics, the
targets had also been overstated. Had the correct statistics been used, more realistic
MSW-recovery-rate targets would have been set, and recovery rates better reflecting
the local recycling situation would have been compiled and published. Audit has
recommended that the EPD should take remedial measures to prevent recurrence of
similar anomalies in future.
MSW disposal at landfills
6.3 This audit also reveals that, notwithstanding the various actions taken by
the EPD in recent years with a view to reducing MSW disposal at landfills, the
rising trend in both the total quantity (from 3.28 million tonnes in 2011 to
3.57 million tonnes in 2014, or a 8.8% increase) and per-capita-per-day quantity of
MSW (from 1.27 kg in 2011 to 1.35 kg in 2014, or a 6.3% increase) disposed of at
landfills is a cause for concern. Audit has recommended that the EPD should make
improvements in these areas.
Way forward
— 80 —
Implementation of major measuresfor MSW reduction and recovery
6.4 In comparison with the time targets set in the 2005 Policy Framework,
there were delays in implementing the MSW charging scheme and the PR schemes
on WEEE, glass beverage bottles, vehicle tyres, packaging materials and
rechargeable batteries. Audit has recommended that the EPD should expedite
actions on implementing the MSW charging scheme and the various PR schemes.
6.5 Regarding implementation of the PSB Phase 1 and the SS Programme,
Audit examination reveals that there is room for improvement in assessing the
effectiveness of the two programmes. Audit has recommended that the EPD should
make improvement in implementing similar programmes in future.
6.6 In relation to the management of EcoPark, Audit examination reveals that
the tenants of some land lots had not complied with the tenancy requirements on
time of commencing operation and meeting the minimum quantities of recycling
throughput. Audit has recommended that the EPD should make improvements in
these areas.
Way forward
6.7 In 2013, Hong Kong’s population of 7.19 million and the recyclable
import/export industries together generated 5.49 million tonnes of MSW, of which
3.48 million tonnes (63%) were disposed of at landfills and the remaining
2.01 million tonnes (37%) were recovered and mainly exported outside Hong Kong
for recycling. In terms of weight, the quantity of MSW disposed of at landfills
every day is equivalent to that of about 650 double-decker buses. As of
March 2014, the capital costs of providing the three landfills and the
refuse-transfer-station network were $4,129 million and $2,724 million respectively.
The estimated recurrent cost of disposing of a tonne of MSW at landfills was $520.
For recovery of MSW, as of March 2014, the Government had spent $308 million
to develop EcoPark to provide land at low cost to assist the recycling industry.
Among the various government departments (such as the FEHD, the LCSD, the
Housing Department and the AFCD) involved in the SS Programme, in 2013, the
FEHD incurred $6.35 million for collecting 711 tonnes of recyclables from WS bins
(or on average spending $8,931 for collecting a tonne of recyclables) for delivery to
approved recyclers.
Way forward
— 81 —
6.8 The Government has made substantial efforts and incurred significant
expenditures in collecting and disposing of large quantities of MSW generated by
Hong Kong’s population. Apart from the high cost of MSW disposal, the large
quantity of MSW generation has given rise to a significant problem in Hong Kong,
namely Hong Kong’s limited landfill space will be progressively used up in the
coming two decades. According to the EPD, recently approved extension works to
SENT and NENT Landfills and proposed extension works to WENT Landfill
(subject to FC funding approval) would extend the serviceable lives of the three
landfills to 2023, 2028 and 2033-34 respectively. In other words, SENT, NENT
and WENT Landfills would reach their capacity in 8, 13 and 19 years from present
respectively.
6.9 Owing to the scarcity of land, further extension of the three landfills or
finding a place for developing a new landfill will be very difficult if not impossible.
It is important to note that, after completing the approved and proposed extension
works, the three landfill sites would occupy a total area of 554 ha of land (Note 18),
which is approximately the size of 550 standard football pitches. According to the
EPD, the existing landfill capacity should be conserved only for the disposal of
unavoidable and treatment waste (see para. 5.4(b)). In Audit’s view, both the
Government and the community need to make utmost efforts on minimising MSW
disposal at landfills, which will help preserve the precious landfill space for use by
this generation and future generations.
6.10 For the purpose of minimising MSW disposal at landfills, Audit considers
that the EPD needs to strengthen efforts to clearly publicise the significant landfill
problem with a view to gaining public consensus and support on the vital need for
Hong Kong to implement a holistic strategy on MSW handling focusing on the three
key areas of reduction in MSW generation, increase in MSW recovery and increase
in MSW treatment by IWMF.
Note 18: After completion of approved and proposed extension works, SENT, NENT andWENT Landfills would respectively occupy areas of 113 ha, 131 ha and 310 ha.
Way forward
— 82 —
Reduction in MSW generation
6.11 As evidenced by overseas experience, the proposed MSW charging
scheme would lead to changes in people’s MSW disposal behaviour and a significant
reduction in MSW generation.
Increase in MSW recovery
6.12 In a free market, recyclables with relatively high market values, such as
waste metals, would normally be recovered by commercial recyclers for gainful use
without the need for government assistance or subsidy. However, commercial
recyclers may not have incentives to recover low-value recyclables, such as food
waste and waste plastics. Therefore, the EPD needs to closely monitor the market
prices of and demand for related recyclables and consider providing appropriate
assistance to support the sustainable recovery and recycling of such recyclables
(see para. 3.18), bearing in mind the high cost of MSW disposal at landfills and the
vital need for preserving the precious landfill space.
Increase in MSW treatment by IWMF
6.13 Asian countries/territories similar to Hong Kong in terms of economic
development, such as Japan, Singapore, Taiwan and South Korea, have adopted
incineration and recycling as the main means for MSW treatment. Notwithstanding
that Hong Kong faces an acute shortage of land for landfill purposes, it has heavily
relied on landfills for MSW disposal. Despite the fact that a proposal for providing
a waste-to-energy facility for MSW was made as early as 1998, such a facility (with
a capacity of treating 1.1 million tonnes of MSW a year) would only be provided in
2023 (according to the EPD’s latest plan). Whilst Audit notes that the long time
taken in providing the facility is due to the need to obtain public consensus on
related issues, the long lapse of time has led to the limited landfill space having been
dwindled by the disposal of large quantities of MSW, some of which could have
been disposed of by the waste-to-energy facility if it had been installed earlier.
6.14 Audit also notes that the 1.1 million tonnes of MSW to be treated
annually by IWMF Phase 1 when it commences operation in 2022-23 would only
account for 32% of the total quantity of 3.48 million tonnes of MSW being disposed
of at landfills in 2013. Therefore, the EPD needs to explore ways and means to
increase the quantity of MSW treatment instead of disposing of it at landfills.
Way forward
— 83 —
Audit recommendations
6.15 Audit has recommended that the Secretary for the Environment and
the Director of Environmental Protection should:
(a) strengthen efforts to clearly publicise the significant landfill problem
with a view to gaining public consensus and support on the vital need
for Hong Kong to implement a holistic strategy on handling MSW,
focusing on reduction in MSW generation, increase in MSW recovery
and increase in MSW treatment by IWMF; and
(b) explore ways and means to increase the quantity of MSW treatment
instead of disposing of large quantities of MSW at landfills.
Response from the Government
6.16 The Secretary for the Environment and the Director of Environmental
Protection agree with the audit recommendations. They have said that the ENB and
the EPD will continue to:
(a) clearly publicise the waste disposal problems and challenges faced by
Hong Kong with a view to gaining public support of the holistic strategy
on waste management as set out in the 2013 Blueprint; and
(b) explore ways to encourage the community to enhance waste prevention,
reuse, recycling and recovery, instead of disposing of waste at landfills.
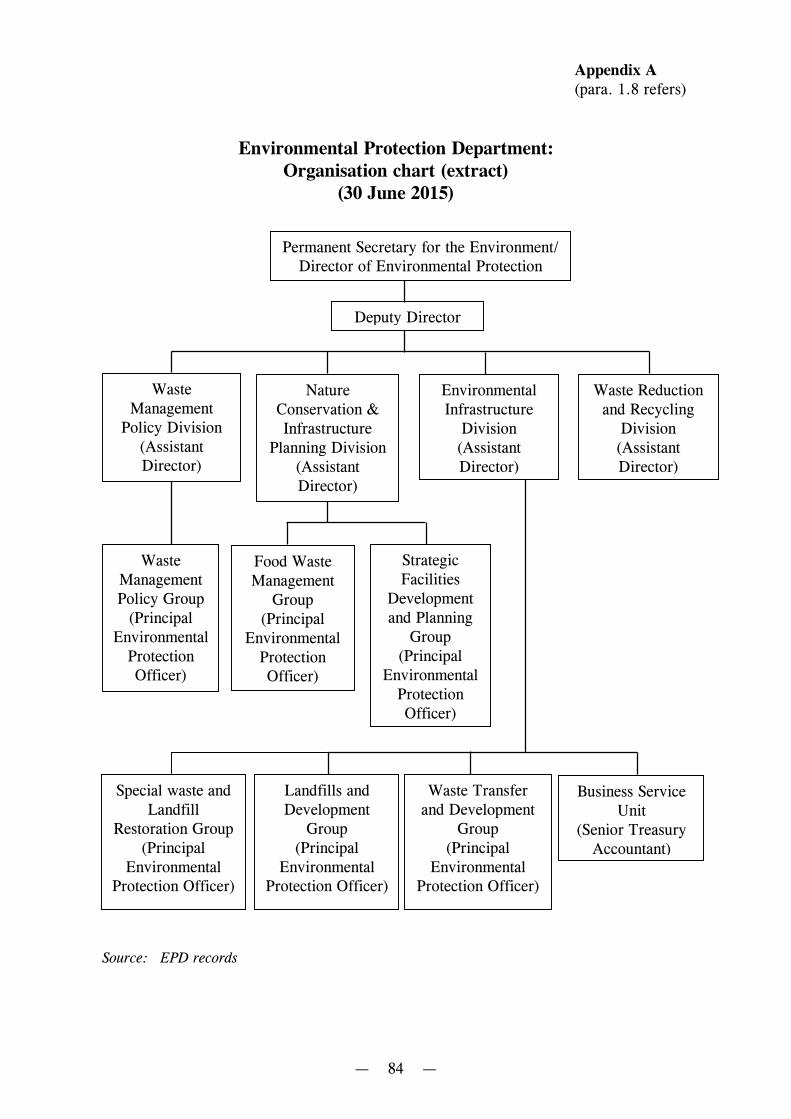
Appendix A(para. 1.8 refers)
— 84 —
Environmental Protection Department:Organisation chart (extract)
(30 June 2015)
Source: EPD records
Permanent Secretary for the Environment/Director of Environmental Protection
Deputy Director
WasteManagement
Policy Division(AssistantDirector)
NatureConservation &Infrastructure
Planning Division(AssistantDirector)
EnvironmentalInfrastructure
Division(AssistantDirector)
Waste Reductionand Recycling
Division(AssistantDirector)
WasteManagementPolicy Group
(PrincipalEnvironmental
ProtectionOfficer)
Food WasteManagement
Group(Principal
EnvironmentalProtectionOfficer)
StrategicFacilities
Developmentand Planning
Group(Principal
EnvironmentalProtectionOfficer)
Landfills andDevelopment
Group(Principal
EnvironmentalProtection Officer)
Waste Transferand Development
Group(Principal
EnvironmentalProtection Officer)
Business ServiceUnit
(Senior TreasuryAccountant)
Special waste andLandfill
Restoration Group(Principal
EnvironmentalProtection Officer)
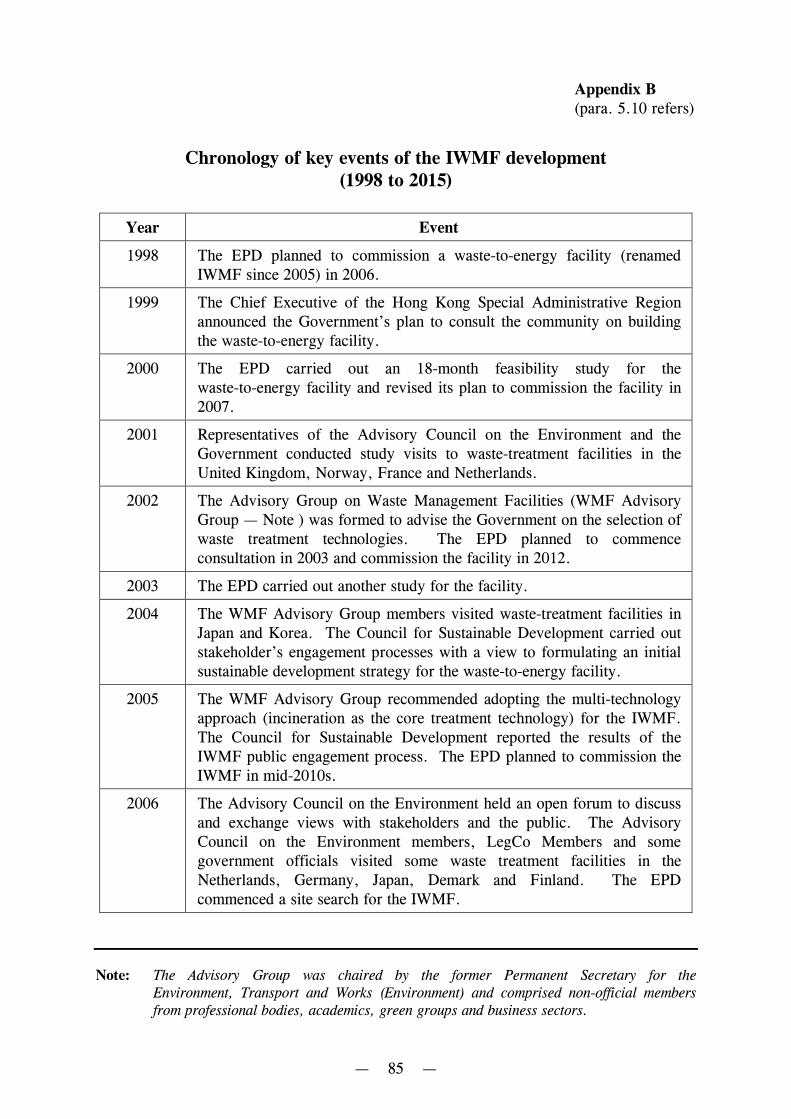
— 85 —
Appendix B(para. 5.10 refers)
Chronology of key events of the IWMF development(1998 to 2015)
Year Event
1998 The EPD planned to commission a waste-to-energy facility (renamedIWMF since 2005) in 2006.
1999 The Chief Executive of the Hong Kong Special Administrative Regionannounced the Government’s plan to consult the community on buildingthe waste-to-energy facility.
2000 The EPD carried out an 18-month feasibility study for thewaste-to-energy facility and revised its plan to commission the facility in2007.
2001 Representatives of the Advisory Council on the Environment and theGovernment conducted study visits to waste-treatment facilities in theUnited Kingdom, Norway, France and Netherlands.
2002 The Advisory Group on Waste Management Facilities (WMF AdvisoryGroup — Note ) was formed to advise the Government on the selection ofwaste treatment technologies. The EPD planned to commenceconsultation in 2003 and commission the facility in 2012.
2003 The EPD carried out another study for the facility.
2004 The WMF Advisory Group members visited waste-treatment facilities inJapan and Korea. The Council for Sustainable Development carried outstakeholder’s engagement processes with a view to formulating an initialsustainable development strategy for the waste-to-energy facility.
2005 The WMF Advisory Group recommended adopting the multi-technologyapproach (incineration as the core treatment technology) for the IWMF.The Council for Sustainable Development reported the results of theIWMF public engagement process. The EPD planned to commission theIWMF in mid-2010s.
2006 The Advisory Council on the Environment held an open forum to discussand exchange views with stakeholders and the public. The AdvisoryCouncil on the Environment members, LegCo Members and somegovernment officials visited some waste treatment facilities in theNetherlands, Germany, Japan, Demark and Finland. The EPDcommenced a site search for the IWMF.
Note: The Advisory Group was chaired by the former Permanent Secretary for theEnvironment, Transport and Works (Environment) and comprised non-official membersfrom professional bodies, academics, green groups and business sectors.
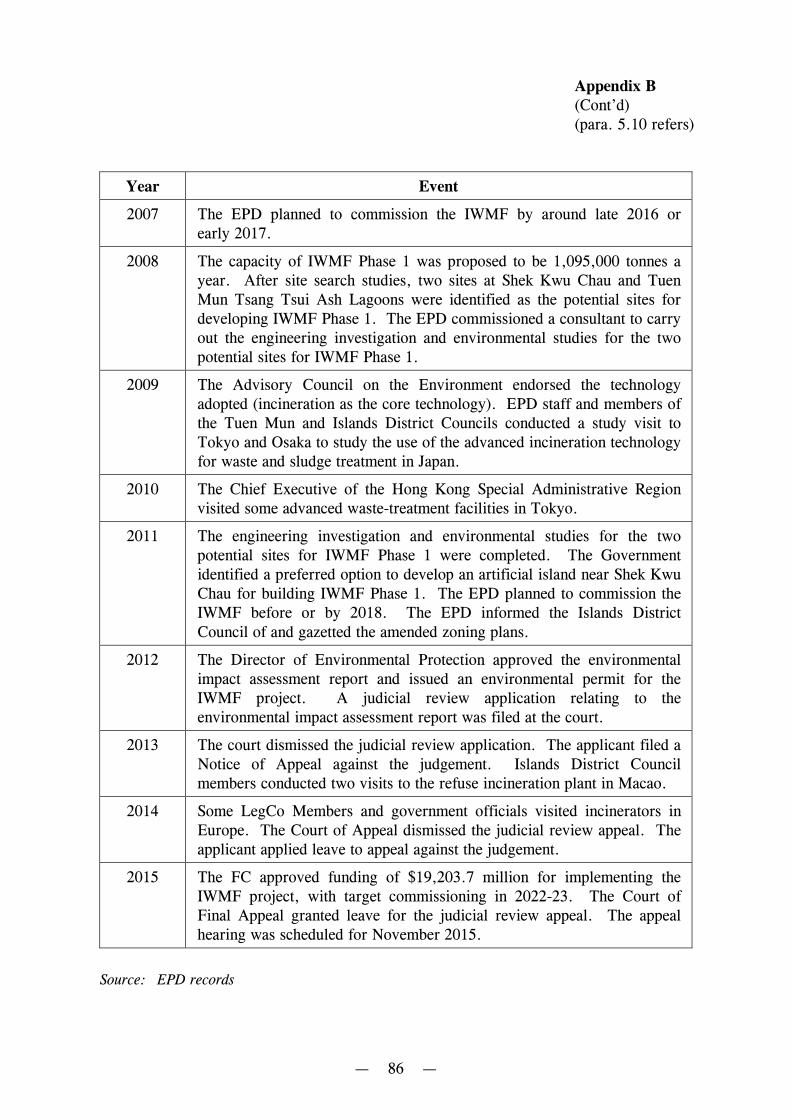
— 86 —
Appendix B(Cont’d)(para. 5.10 refers)
Year Event
2007 The EPD planned to commission the IWMF by around late 2016 orearly 2017.
2008 The capacity of IWMF Phase 1 was proposed to be 1,095,000 tonnes ayear. After site search studies, two sites at Shek Kwu Chau and TuenMun Tsang Tsui Ash Lagoons were identified as the potential sites fordeveloping IWMF Phase 1. The EPD commissioned a consultant to carryout the engineering investigation and environmental studies for the twopotential sites for IWMF Phase 1.
2009 The Advisory Council on the Environment endorsed the technologyadopted (incineration as the core technology). EPD staff and members ofthe Tuen Mun and Islands District Councils conducted a study visit toTokyo and Osaka to study the use of the advanced incineration technologyfor waste and sludge treatment in Japan.
2010 The Chief Executive of the Hong Kong Special Administrative Regionvisited some advanced waste-treatment facilities in Tokyo.
2011 The engineering investigation and environmental studies for the twopotential sites for IWMF Phase 1 were completed. The Governmentidentified a preferred option to develop an artificial island near Shek KwuChau for building IWMF Phase 1. The EPD planned to commission theIWMF before or by 2018. The EPD informed the Islands DistrictCouncil of and gazetted the amended zoning plans.
2012 The Director of Environmental Protection approved the environmentalimpact assessment report and issued an environmental permit for theIWMF project. A judicial review application relating to theenvironmental impact assessment report was filed at the court.
2013 The court dismissed the judicial review application. The applicant filed aNotice of Appeal against the judgement. Islands District Councilmembers conducted two visits to the refuse incineration plant in Macao.
2014 Some LegCo Members and government officials visited incinerators inEurope. The Court of Appeal dismissed the judicial review appeal. Theapplicant applied leave to appeal against the judgement.
2015 The FC approved funding of $19,203.7 million for implementing theIWMF project, with target commissioning in 2022-23. The Court ofFinal Appeal granted leave for the judicial review appeal. The appealhearing was scheduled for November 2015.
Source: EPD records

— 87 —
Appendix C
Acronyms and abbreviations
AFCD Agriculture, Fisheries and Conservation Department
APE Approved project estimate
Audit Audit Commission
C&ED Customs and Excise Department
C&I Commercial and industrial
C&SD Census and Statistics Department
EA Panel Panel on Environmental Affairs
ENB Environment Bureau
EPD Environmental Protection Department
FC Finance Committee
FEHD Food and Environmental Hygiene Department
ha hectare
IWMF Integrated waste management facility
kg kilogram
LCSD Leisure and Cultural Services Department
LegCo Legislative Council
m2 square metre
m3 cubic metre
MSW Municipal solid waste
NENT Northeast New Territories
NGO Non-governmental organisation
OWTF Organic waste treatment facility
PAC Public Accounts Committee
PR scheme Producer responsibility scheme
PSB Plastic shopping bag
SENT Southeast New Territories
SS Programme Source-separation Programme
STT Short-term tenancy
WEEE Waste electrical and electronic equipment
WENT West New Territories
WMF Advisory Group Advisory Group on Waste Management Facilities
WS bin Waste-separation bin