Embed Size (px)
Citation preview
1
Myers’ PSYCHOLOGY(7th Ed)
Chapter 1Thinking Critically with
Psychological Science
James A. McCubbin, PhDClemson University
Worth Publishers
The Need for Psychological Science
Psychologists, like all scientists, use the scientific method to construct
theories that organize observations and imply testable hypotheses
The Need for Psychological Science
Hindsight Biaswe tend to believe, after learning an outcome, that we would have foreseen it the “I-knew-it-all-along” phenomenon
Overconfidencewe tend to think we know more than we do
2
The Need for Psychological Science
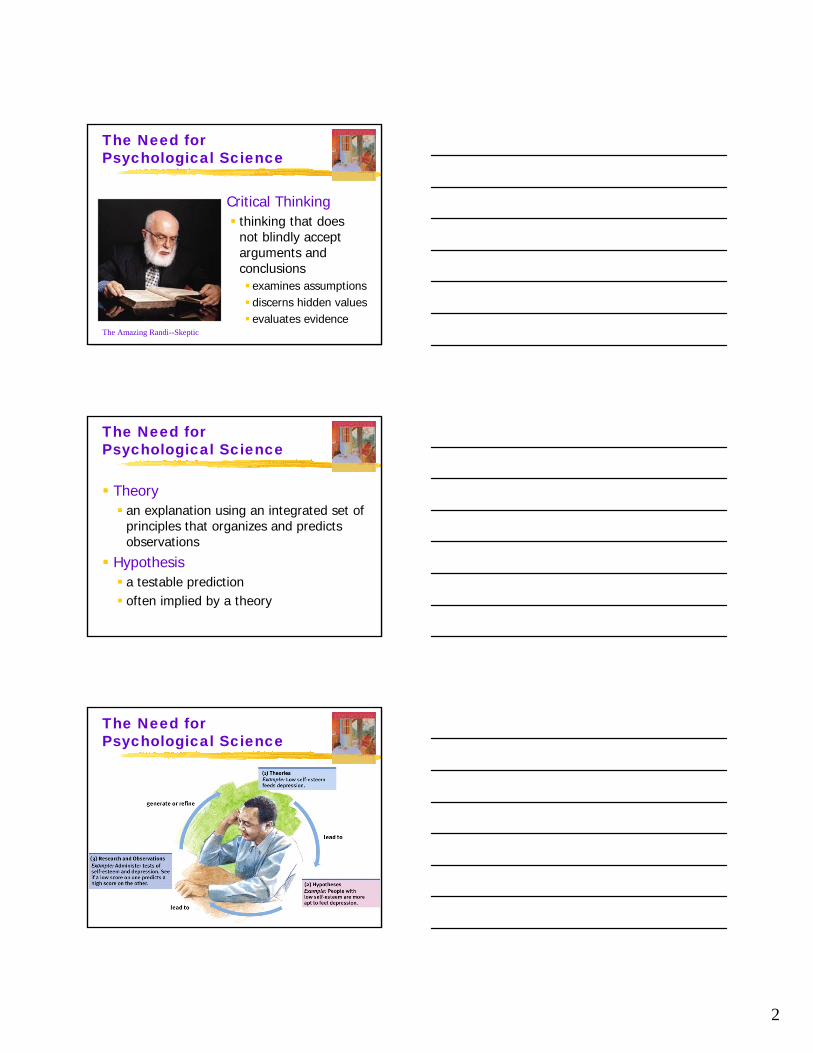
Critical Thinkingthinking that does not blindly accept arguments and conclusions
examines assumptionsdiscerns hidden valuesevaluates evidence
The Amazing Randi--Skeptic
The Need for Psychological Science
Theoryan explanation using an integrated set of principles that organizes and predicts observations
Hypothesisa testable predictionoften implied by a theory
The Need for Psychological Science
3
The Need for Psychological Science
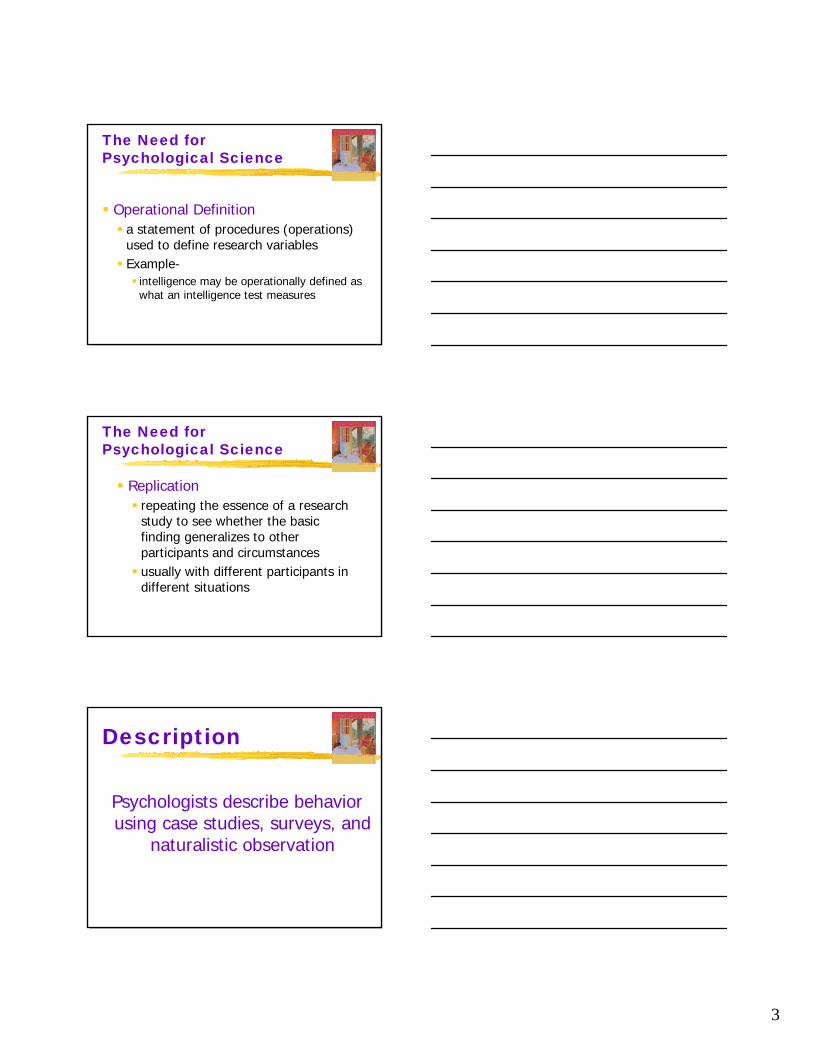
Operational Definitiona statement of procedures (operations) used to define research variablesExample-
intelligence may be operationally defined as what an intelligence test measures
The Need for Psychological Science
Replicationrepeating the essence of a research study to see whether the basic finding generalizes to other participants and circumstancesusually with different participants in different situations
Description
Psychologists describe behavior using case studies, surveys, and
naturalistic observation
4
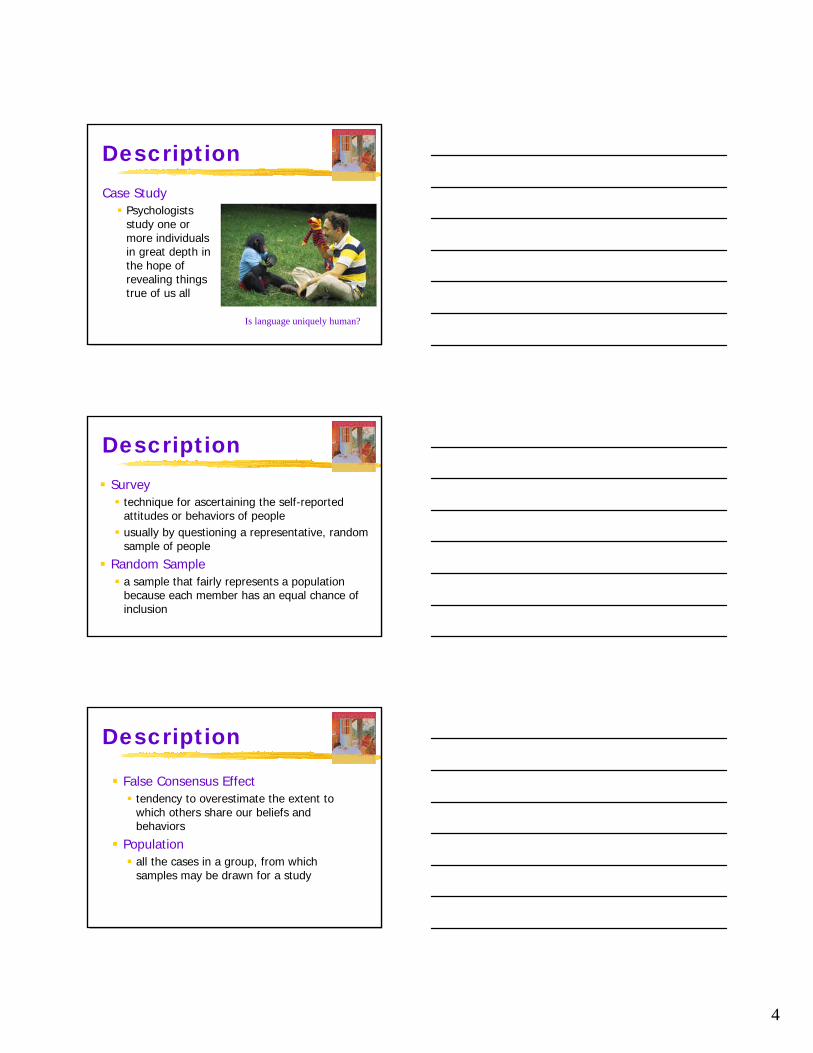
DescriptionCase Study
Psychologists study one or more individuals in great depth in the hope of revealing things true of us all
Is language uniquely human?
DescriptionSurvey
technique for ascertaining the self-reported attitudes or behaviors of peopleusually by questioning a representative, random sample of people
Random Samplea sample that fairly represents a population because each member has an equal chance of inclusion
Description
False Consensus Effecttendency to overestimate the extent to which others share our beliefs and behaviors
Populationall the cases in a group, from which samples may be drawn for a study
5
Description
Description
If marbles of two colors are mixed well in the large jar, the fastest way to know their ratio is to blindly transfer a few into a smaller one and count them
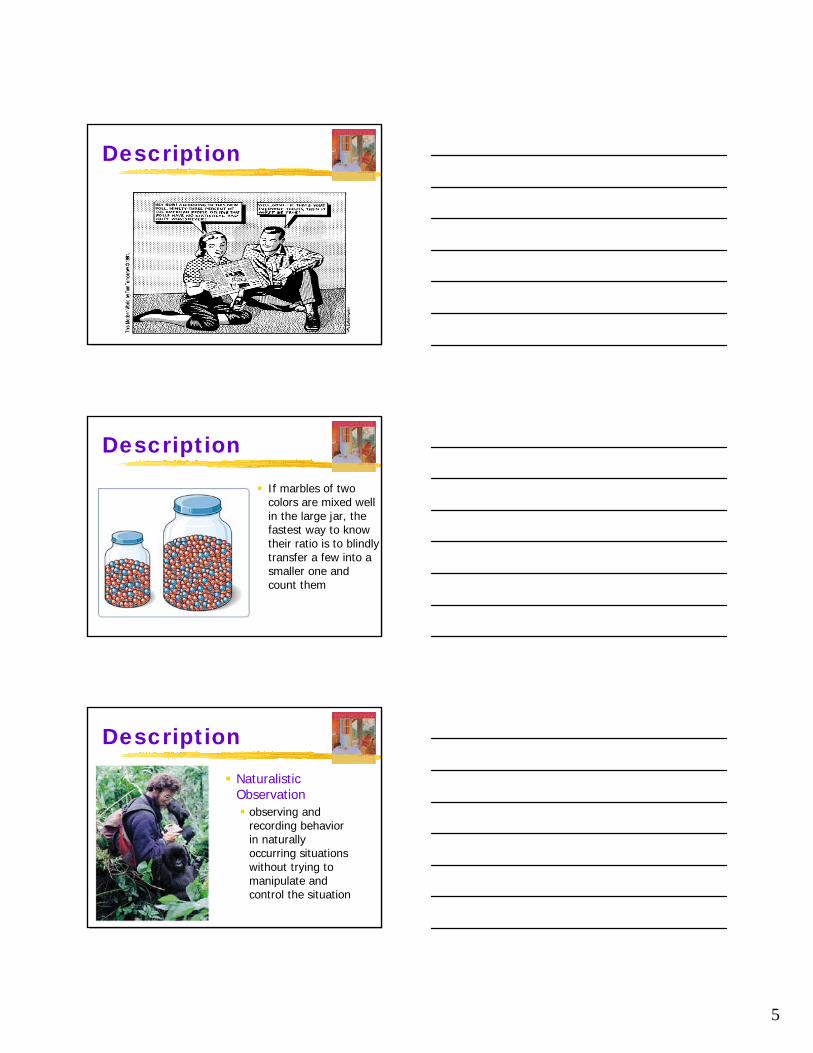
Description
Naturalistic Observation
observing and recording behavior in naturally occurring situations without trying to manipulate and control the situation
6
CorrelationCorrelation Coefficient
a statistical measure of the extent to which two factors vary together, and thus how well either factor predicts the other
Correlation coefficient
Indicates directionof relationship
(positive or negative)
Indicates strengthof relationship(0.00 to 1.00)
r = +.37
Correlation
Scatterplota graphed cluster of dots, each of which represents the values of two variablesthe slope of the points suggests the direction of the relationshipthe amount of scatter suggests the strength of the correlation
little scatter indicates high correlation
also called a scattergram or scatter diagram
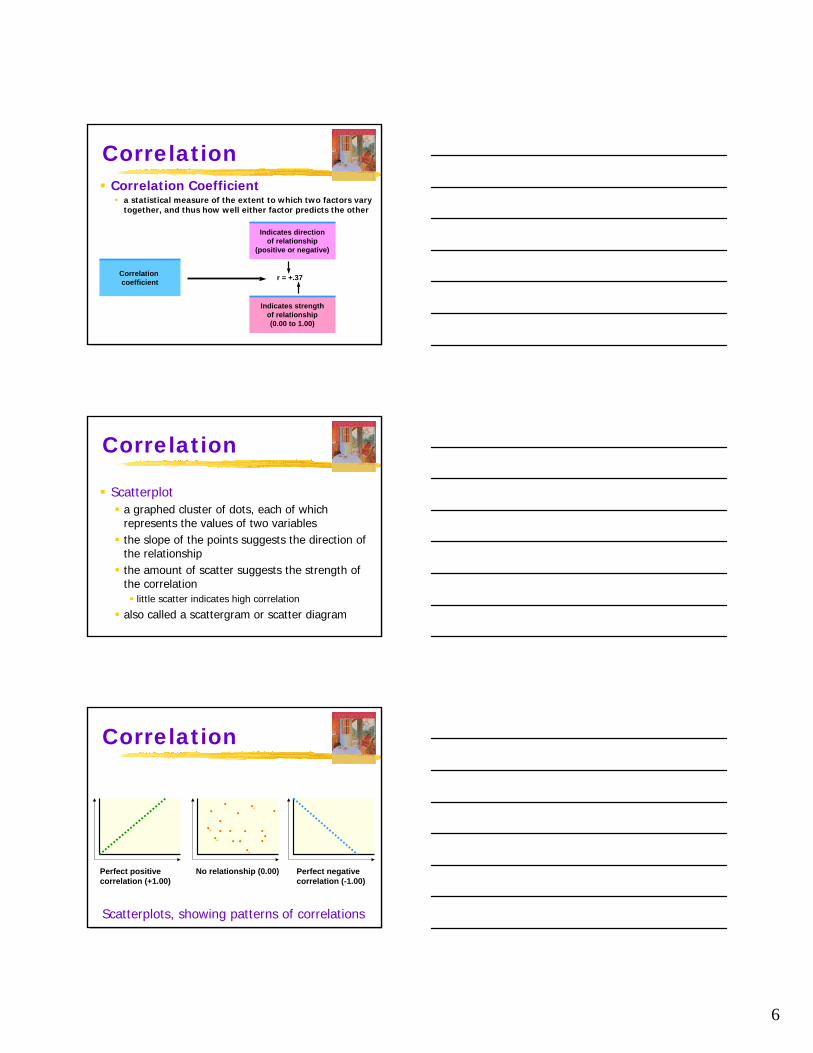
Correlation
Perfect positivecorrelation (+1.00)
No relationship (0.00) Perfect negativecorrelation (-1.00)
Scatterplots, showing patterns of correlations
7
CorrelationHeight and Temperament of 20 Men
12345678910
11121314151617181920
80636179746962757760
64767166737063716870
75666090604242608139
48697257637530578439
SubjectHeight in
Inches Temperament SubjectHeight in
Inches Temperament
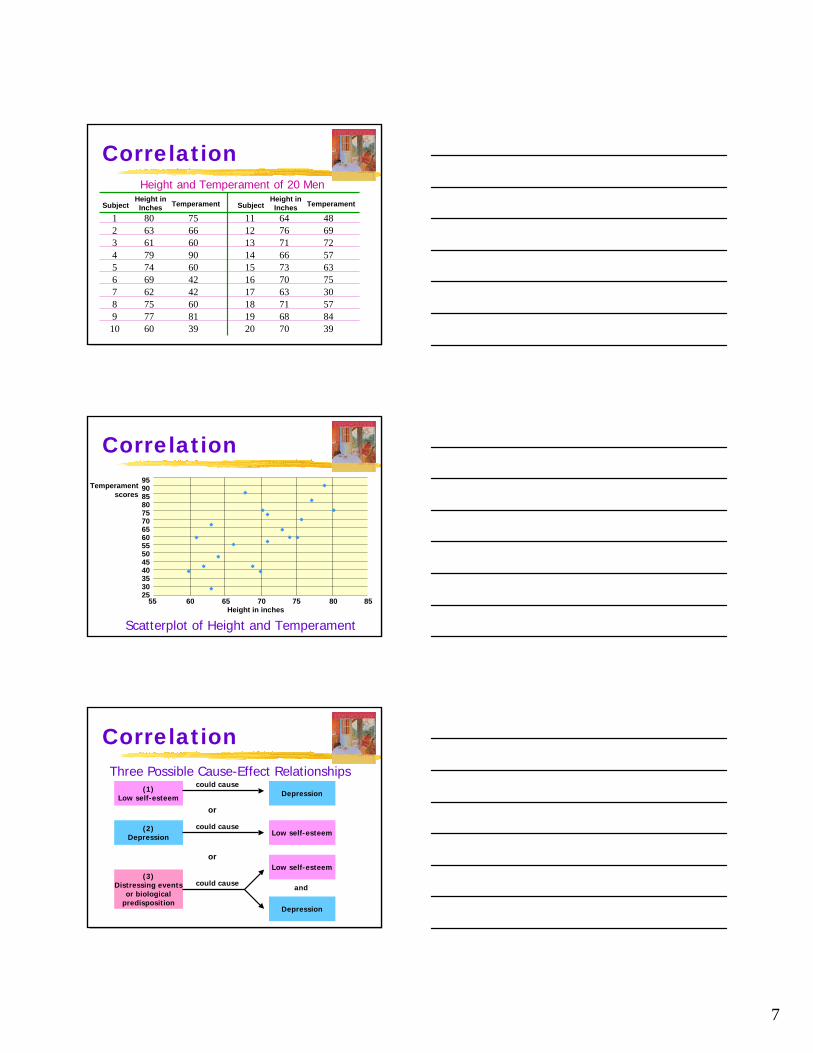
Correlation
Scatterplot of Height and Temperament
55 60 65 70 75 80 85
959085807570656055504540353025
Temperamentscores
Height in inches
CorrelationThree Possible Cause-Effect Relationships
(1)Low self-esteem Depression
(2)Depression Low self-esteem
Low self-esteem
Depression
(3)Distressing events
or biologicalpredisposition
could cause
could cause
could cause
or
or
and
8
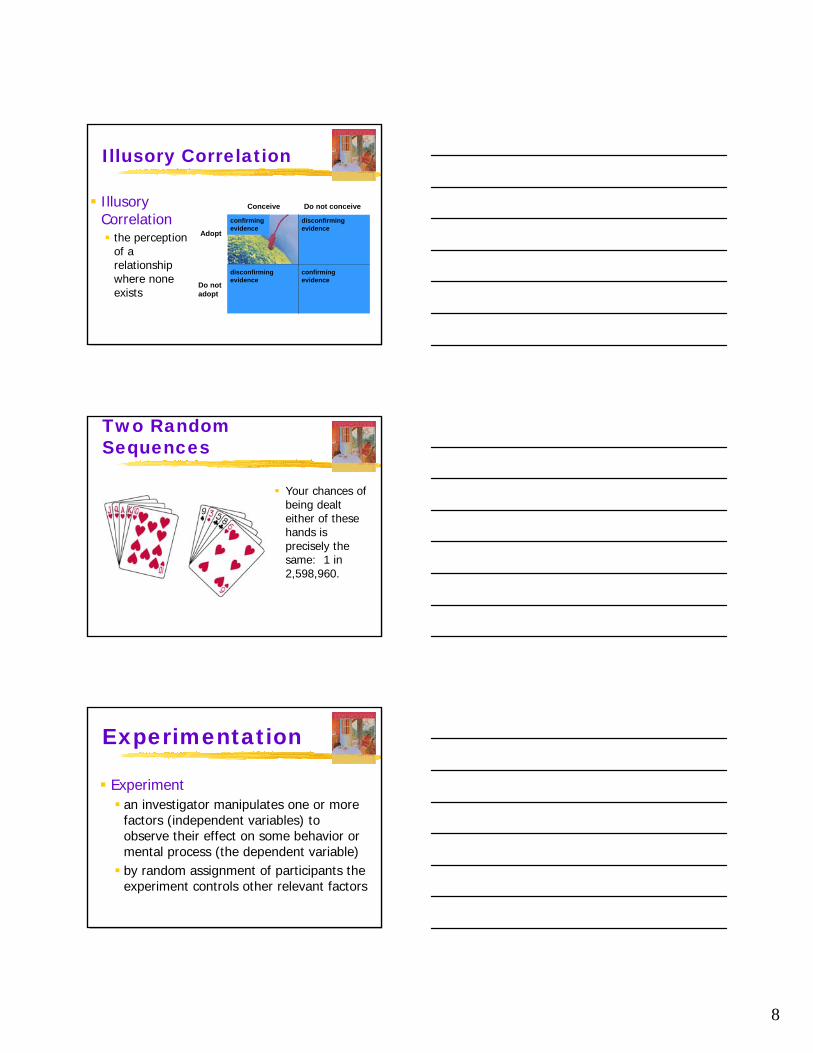
Illusory Correlation
Illusory Correlation
the perception of a relationship where none exists
Conceive Do not conceive
Adopt
Do notadopt
disconfirming evidence
confirming evidence
disconfirming evidence
confirming evidence
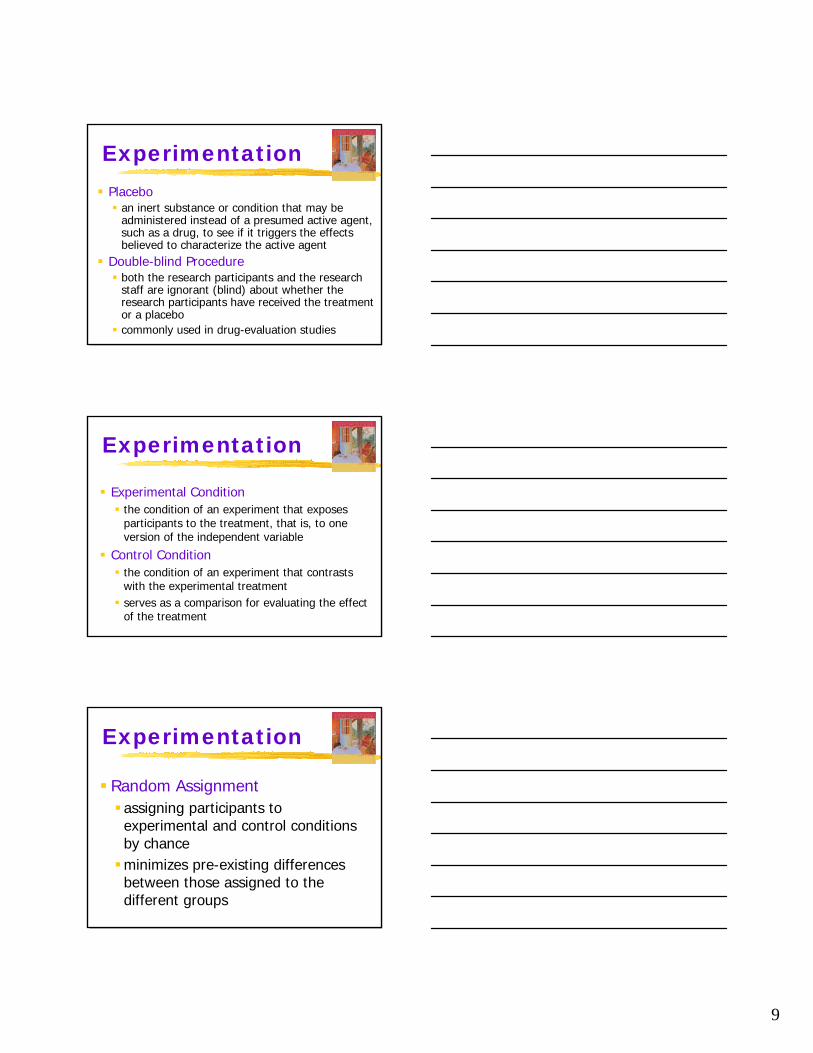
Two Random Sequences
Your chances of being dealt either of these hands is precisely the same: 1 in 2,598,960.
Experimentation
Experiment an investigator manipulates one or more factors (independent variables) to observe their effect on some behavior or mental process (the dependent variable) by random assignment of participants the experiment controls other relevant factors
9
ExperimentationPlacebo
an inert substance or condition that may be administered instead of a presumed active agent, such as a drug, to see if it triggers the effects believed to characterize the active agent
Double-blind Procedureboth the research participants and the research staff are ignorant (blind) about whether the research participants have received the treatment or a placebocommonly used in drug-evaluation studies
Experimentation
Experimental Conditionthe condition of an experiment that exposes participants to the treatment, that is, to one version of the independent variable
Control Conditionthe condition of an experiment that contrasts with the experimental treatment serves as a comparison for evaluating the effect of the treatment
Experimentation
Random Assignmentassigning participants to experimental and control conditions by chanceminimizes pre-existing differences between those assigned to the different groups
10
ExperimentationIndependent Variable
the experimental factor that is manipulatedthe variable whose effect is being studied
Dependent Variablethe experimental factor that may change in response to manipulations of the independent variable in psychology it is usually a behavior or mental process
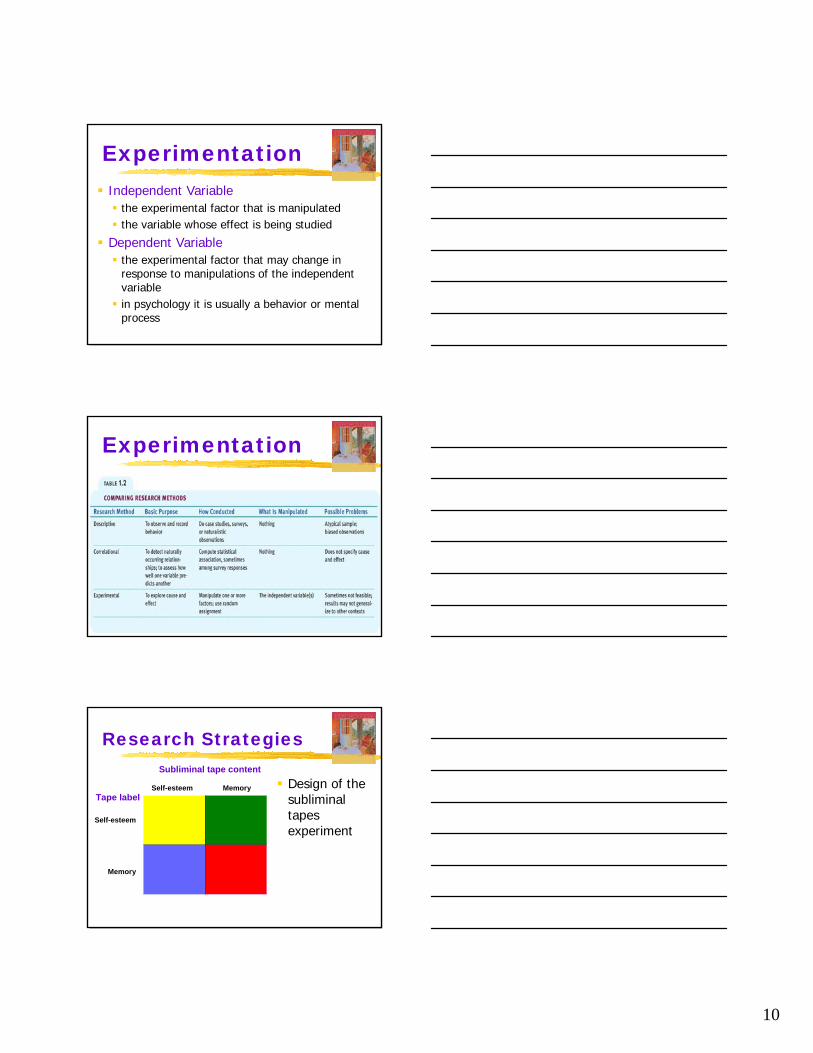
Experimentation
Research Strategies
Design of the subliminal tapes experiment
Subliminal tape content
Self-esteem Memory
Memory
Self-esteem
Tape label
11
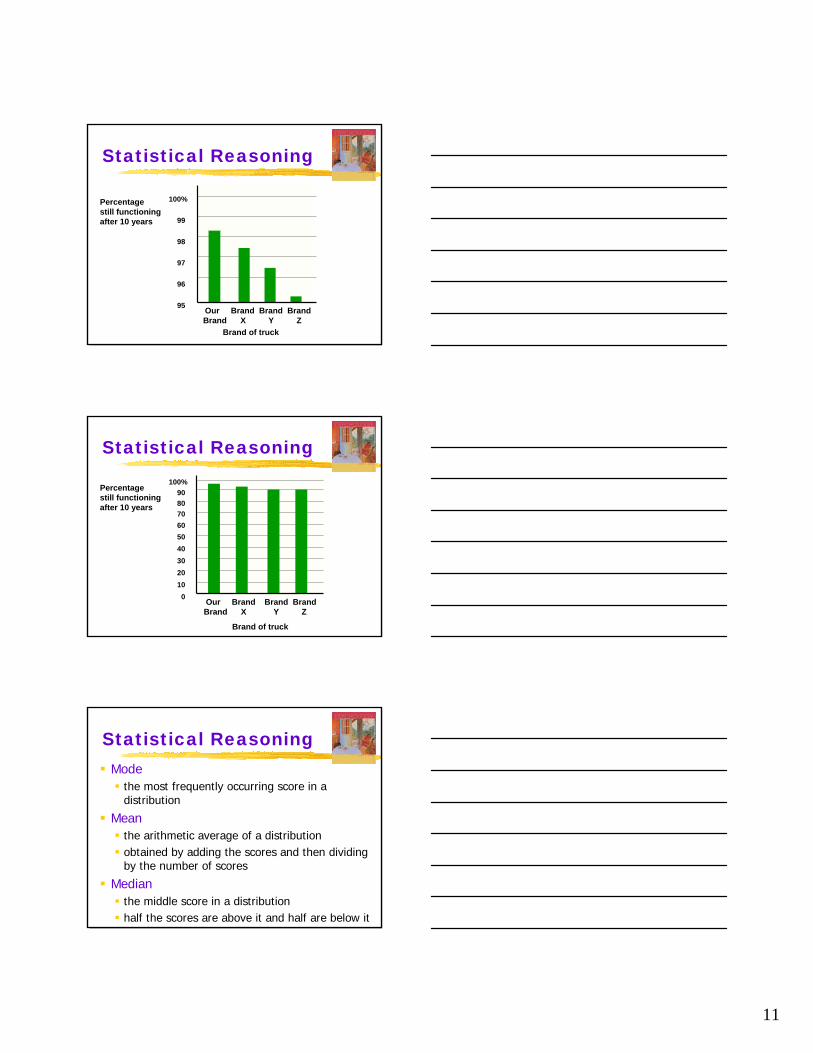
Statistical Reasoning
Our Brand Brand BrandBrand X Y Z
100%
99
98
97
96
95
Percentagestill functioningafter 10 years
Brand of truck
Statistical Reasoning
Our Brand Brand BrandBrand X Y Z
100%9080706050403020100
Percentagestill functioningafter 10 years
Brand of truck
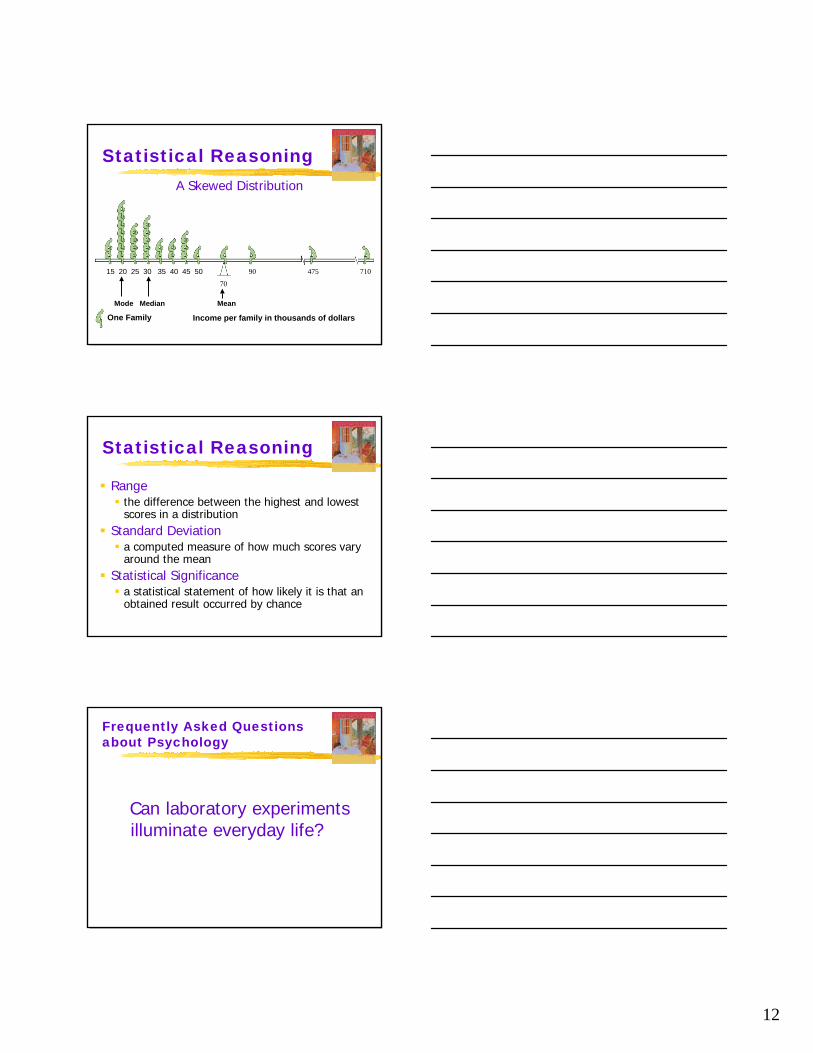
Statistical ReasoningMode
the most frequently occurring score in a distribution
Meanthe arithmetic average of a distributionobtained by adding the scores and then dividing by the number of scores
Medianthe middle score in a distributionhalf the scores are above it and half are below it
12
Statistical ReasoningA Skewed Distribution
15 20 25 30 35 40 45 50 90 475 710
70
Mode Median Mean
One Family Income per family in thousands of dollars
Statistical Reasoning
Rangethe difference between the highest and lowest scores in a distribution
Standard Deviationa computed measure of how much scores vary around the mean
Statistical Significancea statistical statement of how likely it is that an obtained result occurred by chance
Frequently Asked Questions about Psychology
Can laboratory experiments illuminate everyday life?
13
Frequently Asked Questions about Psychology
Does behavior depend on ones culture?
Culture--the enduring behaviors, ideas, attitudes, and traditions shared by a large group of people and transmitted from one generation to the next
Frequently Asked Questions about Psychology
Does behavior vary with gender?
Frequently Asked Questions about Psychology
Why do psychologists study animals?Is it ethical to experiment on animals?Is it ethical to experiment on people?
14
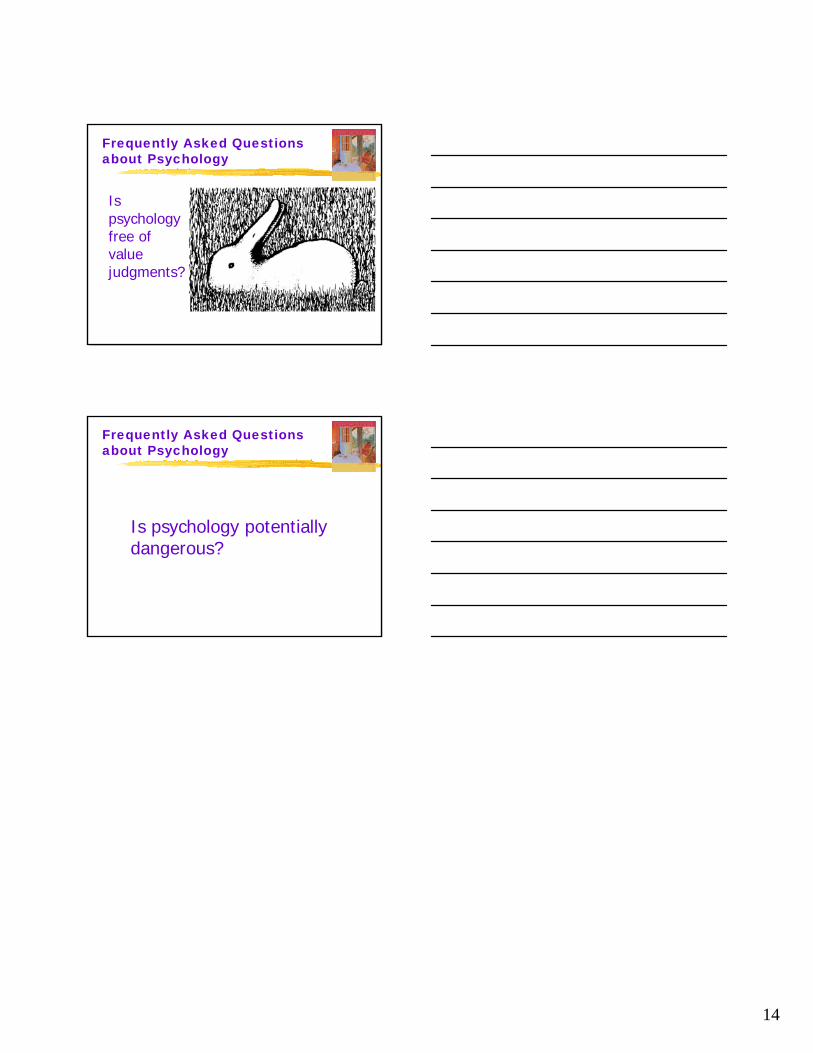
Frequently Asked Questions about Psychology
Is psychology free of value judgments?
Frequently Asked Questions about Psychology
Is psychology potentially dangerous?