Embed Size (px)
Citation preview
TRPA BMP Handbook CHAPTER 1: Urban Hydrology May 2014 Page 1-1
CHAPTER 1: URBAN HYDROLOGY 1.1 PURPOSE AND USE OF CHAPTER
Runoff from urbanized areas is recognized as a major source of nonpoint source pollution and is identified by the Lake Tahoe TMDL Technical Report1 as the largest source of fine sediment particles (FSP) to Lake Tahoe. The quantity and rate of stormwater runoff directly influences the generation and transport of suspended sediment, nutrients, and other pollutants to drainage systems, streams, and Lake Tahoe. Hydrologic processes are highly variable in nature and are extremely complex in urbanized watersheds. Resource managers and engineers use a variety of methods, ranging from simple calculations to complex numerical models, to estimate the volume and rate of runoff to design infrastructure and Best Management Practices (BMPs) for the control of runoff and associated pollutants.
The purpose of this chapter is to provide an overview of hydrologic and associated stormwater quality analysis methods and a simple summary of the analysis methods commonly used for planning and implementing effective stormwater BMPs in the Lake Tahoe Region. Drainage design and flood protection are touched upon briefly in this chapter, but readers engaged in these objectives should refer to appropriate local, state, and federal guidance.
This chapter is organized to allow readers with different levels of experience in hydrologic and water quality analyses to either read background material or skip to quick references on particular methods.
Section 2 provides an overview of hydrologic processes and analysis methods.
Section 3 identifies typical project scales, types of analyses, and levels of complexity as a guide for selecting appropriate methods. A key is presented based on typical project scales and applications in the Lake Tahoe Region that refers readers to Summary Sheets for commonly accepted methods. Summary Sheets follow the key to provide more detail on particular methods.
Section 4 lists additional information that is available to the interested reader or to support analysis using some of the methods summarized.
This chapter is not intended to be a comprehensive resource for hydrologic calculation methods – such a reference would require several hundred pages – but to guide readers in selecting methods based on typical Lake Tahoe Region projects and practice, and to refer readers to more detailed information and guidance.
1 Lahontan Regional Water Quality Control Board and Nevada Division of Environmental Protection, 2009, Lake Tahoe TMDL Technical Report

CHAPTER 1: Urban Hydrology TRPA BMP Handbook Page 1-2 May 2014
1.2 OVERVIEW OF HYDROLOGIC ANALYSIS
1.2.1 HYDROLOGY PROCESSES
The physiographic characteristics of watersheds influence complex hydrologic processes that store and route water in the atmosphere, on the earth’s surface, and underground. Hydrologic analysis for urbanized areas often focuses on the processes that affect the fraction of precipitation that occurs as surface runoff and the rates at which surface runoff occurs.
In the Lake Tahoe Region, precipitation rate and volume varies significantly with location and elevation. Precipitation that falls as snow is stored temporarily in snow pack, and is released as water at varying rates depending on temperature, wind, solar radiation, and other climatic factors. Because 60 to 70 percent of the total precipitation in the Lake Tahoe Region falls as snow, hydrologic processes associated with snowmelt are important in understanding the overall water balance. However, rain and rain-on-snow events typically produce the highest rates of surface runoff, and these events are typically the focus of BMP design for surface runoff. The amount of surface runoff from rain or snowmelt is affected by storage of water on the ground surface and in soils, by infiltration at the surface and from the soil into groundwater, and by losses back to the atmosphere through evaporation and transpiration.
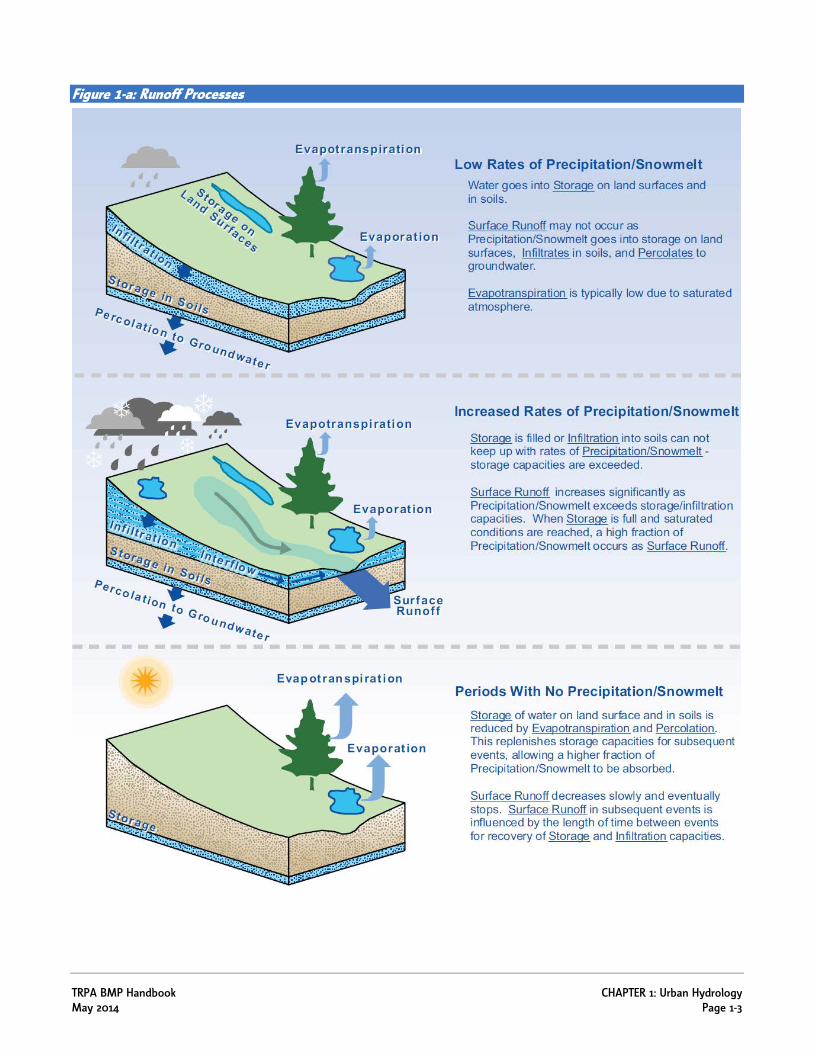
Figure 1-a illustrates the surface runoff process on a segment of undeveloped land. For low rates of precipitation or snowmelt, storage on the land surface and soils, as well as infiltration in soils reduces the amount of water available for surface runoff. For low rates of precipitation or snowmelt no surface runoff may occur. As storage is filled or rates of precipitation and snowmelt increase, surface runoff begins. The point at which surface runoff begins and the rate of surface runoff depend on specific land surface and soil characteristics, which vary substantially with location.
Storage of precipitation occurs on vegetation (e.g., water collected on leaves), on the ground surface (e.g., puddles, filling of depressions, wetting of mulch or duff layer), and in soil (e.g., filling of air voids between particles of soil until soil is saturated). The amount of storage can be a significant fraction of storm precipitation, especially for smaller events. The stored water may later infiltrate deeper into the ground or be carried back into the atmosphere by evaporation or transpiration.
TRPA BMP Handbook CHAPTER 1: Urban Hydrology May 2014 Page 1-3
Figure 1-a: Runoff Processes
CHAPTER 1: Urban Hydrology TRPA BMP Handbook Page 1-4 May 2014
As shown in Figure 1-a, surface runoff to channels is typically a combination of overland flow (the portion of precipitation or snowmelt that does not infiltrate through the surface but flows across it) and interflow (water that initially infiltrates to surface soils but eventually emerges onto the land surface or into channels). Surface runoff can be considered the amount of water that exceeds the storage and infiltration capacities of particular segment of land. Most hydrologic calculations and models of surface runoff focus on calculation of this excess, either for a particular precipitation rate or for time-varying precipitation and snowmelt. Because of the effects of storage and infiltration, the surface runoff response of a land surface is not simply proportional to precipitation and snowmelt inputs. As storage and infiltration capacities are exceeded, a larger fraction of precipitation/snowmelt occurs as runoff. Thus, a land surface may produce little or no surface runoff up to some point in a storm event or season, and then experience rapidly increasing surface runoff as storage is filled on the land surface and saturated conditions are reached in soils.
During periods when precipitation does not occur, storage capacities on the surface and in soils are replenished by evaporation and transpiration to the atmosphere, and by percolation to groundwater. This recovery of storage and infiltration capacities allows a higher fraction of precipitation/snowmelt from subsequent events to be absorbed without surface runoff. Figure 1-a shows a simple cycle illustrating these processes, but actual events occur in complex patterns with highly variable rates and intervening periods without precipitation. Because snow is a form of storage and it is affected by temperature and wind conditions, the Lake Tahoe Region has particularly complex relationships between precipitation, storage, infiltration, and surface runoff.
1.2.2 IMPERVIOUS COVERAGE AND BMP IMPLEMENTATION
Differences in land surface characteristics associated with vegetation types (e.g., forest, turf) and constructed features (e.g., pavement, roofs) are typically referred to as land cover types and impervious coverage. For a given volume or rate of precipitation or snowmelt, the amount of surface runoff that occurs depends on storage and infiltration capacities on the land surface and in the soils. Changes to cover types and impervious coverage increase runoff, and enhancing infiltration and storage to mitigate for these changes is the objective of many stormwater BMPs in the Lake Tahoe Region that focus on hydrologic (runoff) source control.
Rates and volumes of runoff are affected by urbanization through multiple mechanisms, but the most important of these are: 1) the conversion of vegetated or pervious surfaces to impervious surfaces such as roofs and pavement; and 2) the development of efficient drainage systems that connect these impervious surfaces to streams and other water bodies, thus increasing the rate of runoff and eliminating storage and infiltration that occurs along natural drainage paths.
Although many urbanized areas face similar challenges in managing runoff, the Lake Tahoe Region is especially sensitive to changes in land use condition due to the naturally low runoff potential of land surfaces and exceptional natural quality and clarity of surface waters. Since its formation, TRPA has placed a high priority on managing changes in land condition that affect runoff quantity and quality. The Bailey Land Capability System was developed in 1970 as a means to manage impervious coverage, and the Individual Parcel Evaluation System (IPES) was adopted in 1987 to more specifically address development eligibility and allowable land coverage on specific parcels. The TRPA Code of Ordinances contains BMP requirements for development, including BMP retrofits of existing private property.
TRPA BMP Handbook CHAPTER 1: Urban Hydrology May 2014 Page 1-5
The regulation requires that the runoff from impervious surfaces be controlled to infiltrate the volume from a 20-yr/1-hr storm. The regulation provides that a precipitation intensity of 1”/hr be used for calculation of the volume, and refers to this BMP Handbook for design of infiltration facilities.
The TRPA regulations described above have been in place for decades and are probably some of the earliest and most comprehensive regulatory controls to achieve what has more recently been referred to as Low Impact Development (LID)2. The principles of LID are intended to reduce the transport of runoff and pollutants from the site at which they are generated. More information on LID principles is available through the US Environmental Protection Agency (EPA) website3. Additionally, many of the BMPs outlined and discussed in this handbook can be considered LID practices.
1.2.3 POLLUTANT LOADS
As runoff occurs from the land surface, it collects and carries material available from the land surface. If the entrained material has potentially harmful effects on receiving waters downstream (e.g., fine sediment particles (FSP) in Lake Tahoe), the material is defined as a stormwater pollutant. The condition of the land surface directly influences the amount of stormwater pollutants entrained in runoff. Pollutants may be contributed to runoff not just from the land surface but from underlying soils when runoff rates are sufficient to cause land surface erosion. Controlling land surface condition and erosion is the objective of many stormwater BMPs in the Lake Tahoe Region that focus on pollutant source control.
The amount of pollutants carried in runoff may be estimated from the amount of runoff and the amount of a pollutant carried per unit of runoff, represented as a concentration. For example, a concentration of suspended sediment (e.g., 100 milligrams per liter [mg/l]4) may be multiplied by the number of liters of runoff over a period of time to compute the total weight, or load, of the entrained pollutant. In general terms, this relationship can be written:
Pollutant Load = Runoff Volume x Pollutant Concentration
This is an important relationship in estimating the water quality effects of runoff. In the Lake Tahoe Region, a major effort is in progress to define and adopt a Total Maximum Daily Load (TMDL) to improve and protect the clarity of Lake Tahoe5. Loads in the equation above may be computed at different time intervals (e.g. hourly, daily, or annual loads). In planning efforts for the Lake Tahoe TMDL program, loads of pollutants carried by stormwater and other mechanisms have been computed as annual or average annual loads. While conceptually simple, calculations on long time scales for annual or average annual loads are computationally difficult due to concentrations and flow rates that are highly variable with time. The accuracy of load estimates depends on long-term data collection and careful analysis to define the effects of meteorological and land cover conditions. Site specific data may be helpful in developing or validating pollutant load estimates, but short term data may be misleading if it does not reflect long term averages or characteristics.
2 EPA 841-F-07-006, December 2007, Reducing Stormwater Costs Through Low Impact Development (LID) Strategies and Practices 3 EPA websites – www.epa.gov/npdes/greeninfrastructure and www.epa.gov/nps/lid 4 Although runoff is typically computed in English units (e.g., cubic feet per second) water quality concentrations are nearly always represented in metric units. 5 LRWQCB and NDEP, 2009, Lake Tahoe Total Maximum Daily Load
CHAPTER 1: Urban Hydrology TRPA BMP Handbook Page 1-6 May 2014
1.2.4 HYDROLOGIC DATA AND MODELING
The process of designing stormwater facilities and water quality BMPs involves estimation or forecast of runoff, as well as pollutant concentrations or loads, based on known characteristics of the tributary watershed. The flow of water through the storage, infiltration, and runoff pathways shown in Figure 1-a varies significantly in response to changes in key process variables such as precipitation rates and saturation of soils. Thus, measurements at a particular point in time may not represent long term average characteristics. For example, a particular measurement of runoff rate or quality cannot directly be used to estimate average annual runoff volume or annual pollutant load because both rate and quality have naturally high variability through seasons, between storm or runoff events, and even within runoff events. Similarly, a particular measurement cannot be directly used to estimate appropriate design flows or performance standards for BMPs.
A systematic series of measurements or observations can be used to estimate average or other statistical metrics for use in hydrologic design. Where available, runoff or pollutant load data may be analyzed statistically to extrapolate to design events of interest (e.g., the 1 percent annual chance or 100-year peak flow may be estimated from a gaging station record that does not include an event of such magnitude). If sufficient data are available for a specific watershed (or can be collected in anticipation of project needs), this type of analysis is powerful, accurate, and the logical first choice when selecting hydrologic methods. However, sufficient data are seldom available for urban watersheds to make the necessary estimates or predictions for design directly from measurements.
Hydrologic modeling and calculations provide powerful tools to estimate hydrologic variables such as runoff volume and rate when adequate data are not available for direct statistical analysis. The model or calculation method provides a general framework, and input parameters are estimated for the watershed of interest based on local conditions. Hydrologic and water quality modeling typically involves making estimates of known or measurable characteristics for a watershed of interest (e.g., area, impervious area, soils, slope, etc.) in combination with hydrologic or water quality relationships derived from data on a broader geographic scale (e.g., precipitation).
For example, application of the well-known “Rational Method” involves derivation of a runoff coefficient based on measurable land use conditions, estimation of a time of concentration (Refer to Section 1.3.3.3 for definition) based on measurable physical characteristics of the watershed, and application of precipitation depth-duration relationships (Refer to Section 1.4.2) that are derived regionally from precipitation gages that are commonly outside the watershed of interest. In addition to regional data analysis, a hydrologist or licensed professional civil engineer typically relies on coefficients or relationships that are derived from hydrologic research or regional or national standards of practice. In the Rational Method, for example, the hydrologist may refer to a manual of practice (e.g. ASCE and WEF, 19926) or a local drainage design manual (e.g. El Dorado County7) to select runoff coefficients based on land use type, soils, vegetative cover, and other factors.
6 American Society of Civil Engineers, and Water Environment Federation. ASCE Manual of Practice No. 77 and WEF Manual of Practice FD-20. New York, NY. 1992, Design and Construction of Urban Stormwater Management Systems 7 County of El Dorado, March 1995, Drainage Design Manual
Statistical metrics are used in hydrologic design as measures of performance. For example, a BMP may be designed to store or convey a storm event with the probability of occurring, on average, once every twenty years. This event (20-year storm) has a 5 percent annual exceedence probability or a recurrence interval of 20 years.
Hydrologic modeling and calculations are typically founded on systematic measurements, but provide a means to transfer or apply measurements in one location to another by representing key hydrologic processes. For example, measurements of infiltration in a particular soil type might be applied in a model to another location with the same soil type.
TRPA BMP Handbook CHAPTER 1: Urban Hydrology May 2014 Page 1-7
The level of sophistication will vary, but all hydrologic and water quality analyses rely on a process that combines specific watershed characteristics with broader hydrologic relationships or methods derived outside the area of interest. The extent to which broader relationships apply to the area of interest is a source of uncertainty in all estimates. To reduce this uncertainty, standardized relationships are typically applied, and then adjusted based on a comparison of initial results with watershed observations. For example, if an initial estimate for a 10-year event greatly exceeds observed flows or the capacity of a drainage system where no flooding has been observed over a few decades, the hydrologist may adjust the model or calculation parameters to match observations. This process is referred to as calibration, and testing of calibrated parameters with observations from independent events is sometimes referred to as validation.
Calibration and validation of hydrologic estimates is extremely important in larger studies and where public safety or large capital expenditures are involved. The extent to which calibration is possible depends on available data – where data are unavailable, more than one method may be applied and results compared to improve confidence in the estimates. For smaller areas, or where very standardized methods are routinely applied, calibration may not be practical or necessary.
Process-based computation of surface runoff is very complex because several processes are involved that vary in both time and space. Therefore, simplifying assumptions are made to varying degrees in most models – where differences in hydrologic models and modeling capabilities are generally associated with 1) the degree to which processes are “lumped” into a single calculation, and 2) the level of sophistication in a calculation for representing processes and variables.
In addition to varying degrees of sophistication in representing hydrologic processes, models vary in their representation of runoff over time. Some methods compute a specific flow parameter (e.g., peak flow for a design event, average annual flow, etc.), some compute hydrographs for a defined event (e.g., historical rainfall event or design storm), and some compute flow continuously over periods with and without precipitation, thus accounting for changes in water storage on the land surface or in soils between events.
1.3 SUMMARY OF SELECTED METHODS
1.3.1 PROJECT CATEGORIES – DEFINING SCALE AND COMPLEXITY
Guidelines for determining the scale and complexity of a project are provided below using three project categories: 1) Projects Less Than 1 Acre and all Single Family Residential (SFR); 2) Projects 1 to 5 Acres and all Commercial (CICU); and 3) Projects Greater Than 5 Acres. The reader should review the description of each project category and compare typical physical improvements and environmental analysis requirements to determine which method is most appropriate. The project categories have been chosen to illustrate typical choices for analysis methods. However, the characteristics, objectives, and conditions of individual projects will vary and no categorization system can apply to all cases.
1.3.1.1 PROJECTS LESS THAN 1 ACRE AND ALL SINGLE FAMILY RESIDENTIAL (SFR)
A project or land use of interest less than 1 acre in size, or single family residential areas of any size. Projects in this category typically require only minor conveyance
CHAPTER 1: Urban Hydrology TRPA BMP Handbook Page 1-8 May 2014
facilities that are sized by rule of thumb or standard practice. Hydrologic source controls (storage) and water quality requirements are specifically addressed for this project category by Chapter 60.4 of the TRPA Code of Ordinances and the BMP Retrofit Program led by TRPA. Chapter 60.4 of the TRPA Code of Ordinances provides guidelines for site stabilization and simple sizing criteria for storage and infiltration of runoff. Pollutant load estimates are typically not required to meet permitting or environmental analysis requirements at this scale.
1.3.1.2 PROJECTS 1 TO 5 ACRES AND ALL COMMERCIAL (CICU)
A parcel or collection of parcels, greater than 1 acre in total size, or commercial areas of any size.
A project of this size typically includes stormwater collection and conveyance systems that require engineering calculations and design. Due to relatively high amounts of impervious coverage, projects in this category typically involve more complex storage and treatment systems to protect downstream water quality, and are subject to individual permitting review and environmental analysis that may require quantitative analysis of stormwater runoff rates, volumes, and quality. An estimate of water quality improvement achieved by project is typically desired.
Because project conditions and their effect on water quality can be highly variable in this category, simple guidelines that apply to all projects in this category are difficult to provide. The following conditions may warrant a more detailed, or less detailed, level of water quality analysis for this category of projects.
A. MORE DETAILED WATER QUALITY ANALYSIS (SIMILAR TO THAT REQUIRED FOR PROJECTS GREATER THAN 5 ACRES): Constraints inhibit achievement of standard design goals for water quality.
For example, design standards for storage and infiltration of runoff on the
project site cannot be achieved.
An alternative analysis is needed to select a recommended alternative or
site design based on water quality.
The project area is judged to contribute a significant pollutant load, and
therefore a detailed analysis is desired to estimate the load reduction that
will be achieved by the project.
The project has a direct link to the Lake Clarity Crediting Program.
B. LESS DETAILED WATER QUALITY ANALYSIS (SIMILAR TO PROJECTS LESS THAN 1 ACRE OR SFR): Large parcels with minimal, or no, high-density or highly impervious urban
land uses and require only simple sizing criteria for stormwater facilities.
For example, large parcels that can comply with regulatory requirements
as defined in Chapter 60.4 of the TRPA Code of Ordinances.
A pollutant load estimate is not required to meet permitting or
environmental analysis requirements.
1.3.1.3 PROJECTS GREATER THAN 5 ACRES
Typically a large redevelopment or publicly funded water quality improvement project that analyzes, designs, and implements improvements for an urban area on
TRPA BMP Handbook CHAPTER 1: Urban Hydrology May 2014 Page 1-9
the order of 5 to 100 acres, including roadways and other public stormwater systems.
These projects are complex to design and implement compared to the other project categories, and may use the Project Delivery Process developed by the Storm Water Quality Improvement Committee (SWQIC)8. Project areas may be comprised of multiple land uses and land ownership. Significant conveyance facilities are required to serve multiple tributary areas and flow paths, often with differing hydrologic and water quality characteristics. Stormwater design flows depend on routing and storage in the drainage system and typically must be considered in the context of design storm events rather than a single peak flow. Compliance with municipal drainage design standards intended to protect public safety is typically a requirement for the project. Stormwater storage and treatment systems are potentially complex, and sizing may not be standardized due to variable opportunities and constraints in individual project areas. An alternatives analysis process is typically conducted to formulate and explore options for improvements to maximize water quality improvement within site or project constraints. A pollutant load reduction estimate is usually required to evaluate alternatives, obtain permits, evaluate environmental effects, and inform TMDL compliance.
1.3.2 KEY TO HYDROLOGIC AND STORMWATER QUALITY ANALYSIS METHODS
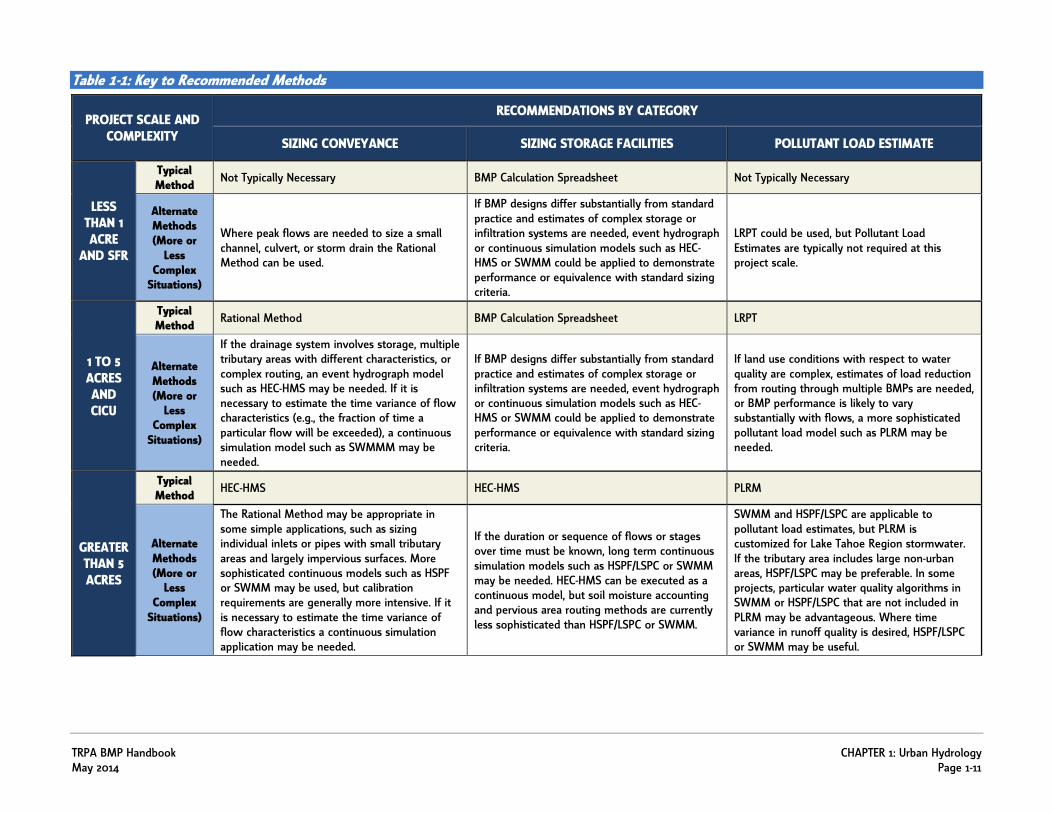
Table 1-1 relates each project category to typical analysis methods for hydrology and water quality for: 1) sizing conveyances; 2) sizing storage facilities; and 3) estimating pollutant loads. Table 1-1 identifies the recommended method for each project category in the typical case, and provides a brief discussion on considerations for using other analysis methods. In general, the simplest methods that provide adequate results under typical circumstances are shown as the recommended method. More complex methods may be suitable, but additional resources and expertise are required to utilize them and they may not be warranted unless specific conditions require their use. Brief descriptions of some cases where more, or less, complex analysis may be suitable are provided in Table 1-1. The table serves as a key for the reader to reference specific Summary Sheets that are most applicable to a particular project. The Summary Sheets include more details about each method and references for additional information. The reader should note that Table 1-1 provides recommendations based on hydrologic and water quality objectives, but individual public works and regulatory agencies may have criteria that differ from the following recommendations, which may control the analysis methods selected.
1.3.3 SUMMARY SHEETS
Based on typical Lake Tahoe Region practice and recent work for SWQIC and the TMDL program, this chapter includes Summary Sheets for the following hydrologic and water quality analysis methods and tools:
NRCS BMP Calculation Spreadsheet
Rational Method
Load Reduction Planning Tool (LRPT) 8 SWQIC, 2004, Collaborative Storm Water Quality Project Delivery for the Lake Tahoe Basin, http://www.trpa.org/wp-content/uploads/swqip.pdf /
CHAPTER 1: Urban Hydrology TRPA BMP Handbook Page 1-10 May 2014
U.S. Army Corps of Engineers, Hydrologic Engineering Center, Hydrologic Modeling System (HEC-HMS)
Pollutant Load Reduction Model (PLRM)
EPA Hydrologic Simulation Program – FORTRAN, and Load Simulation Program in C++ (HSPF and LSPC)
EPA Storm Water Management Model (SWMM)
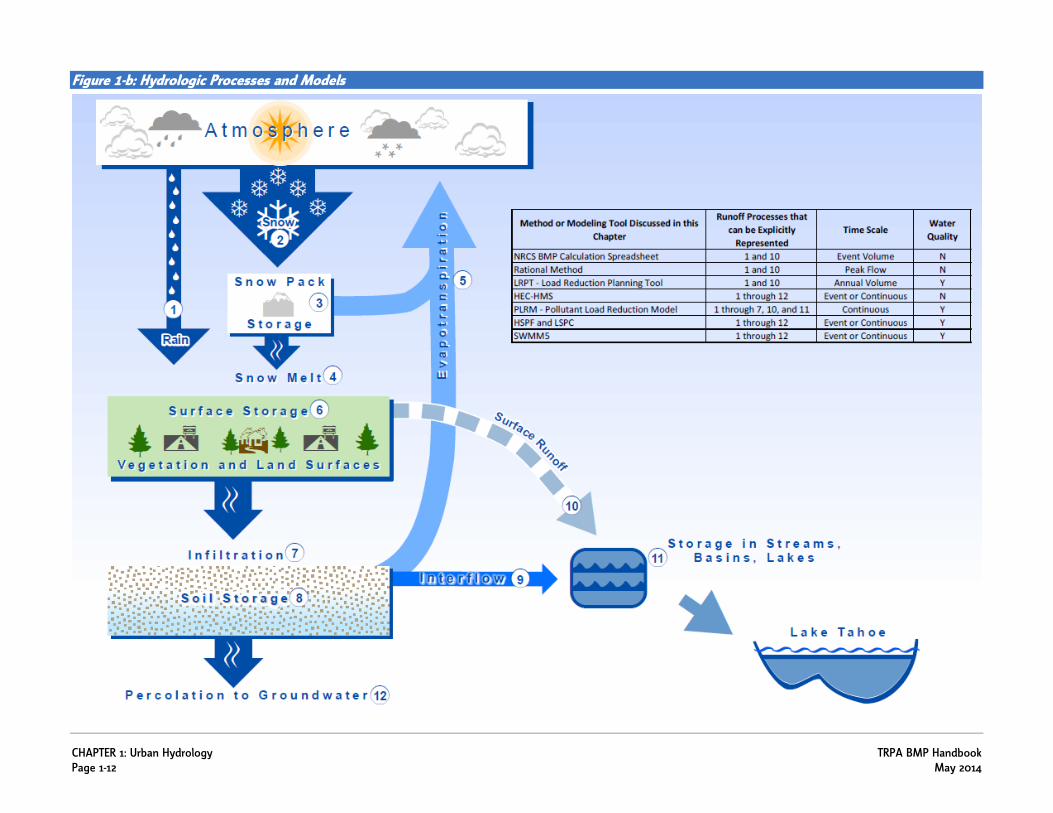
Figure 1-b provides an overview of hydrologic processes and illustrates the processes that may be explicitly represented in the models and methods listed above. For the more complex models discussed, the user typically has the option to select more than one calculation method and to decide whether a particular process should be represented. For example, HEC-HMS includes several methods for computation of “losses” to infiltration and storage and the resulting excess precipitation that is converted to runoff. Where sufficient data are not available to adequately define a particular process or its associated variables, model accuracy may not be improved by explicitly representing the process in the computations.
Various time and spatial relationships are used to define the basic parameters that make actual model computations very complex. Figure 1-b indicates the models described in this section that have capabilities for computation of water quality or pollutant load parameters as well as the time scale for computations.
TRPA BMP Handbook CHAPTER 1: Urban Hydrology May 2014 Page 1-11
Table 1-1: Key to Recommended Methods
PROJECT SCALE AND COMPLEXITY
RECOMMENDATIONS BY CATEGORY
SIZING CONVEYANCE SIZING STORAGE FACILITIES POLLUTANT LOAD ESTIMATE
LESS THAN 1 ACRE
AND SFR
Typical Method
Not Typically Necessary BMP Calculation Spreadsheet Not Typically Necessary
Alternate Methods (More or
Less Complex
Situations)
Where peak flows are needed to size a small channel, culvert, or storm drain the Rational Method can be used.
If BMP designs differ substantially from standard practice and estimates of complex storage or infiltration systems are needed, event hydrograph or continuous simulation models such as HEC-HMS or SWMM could be applied to demonstrate performance or equivalence with standard sizing criteria.
LRPT could be used, but Pollutant Load Estimates are typically not required at this project scale.
1 TO 5 ACRES AND CICU
Typical Method
Rational Method BMP Calculation Spreadsheet LRPT
Alternate Methods (More or
Less Complex
Situations)
If the drainage system involves storage, multiple tributary areas with different characteristics, or complex routing, an event hydrograph model such as HEC-HMS may be needed. If it is necessary to estimate the time variance of flow characteristics (e.g., the fraction of time a particular flow will be exceeded), a continuous simulation model such as SWMMM may be needed.
If BMP designs differ substantially from standard practice and estimates of complex storage or infiltration systems are needed, event hydrograph or continuous simulation models such as HEC-HMS or SWMM could be applied to demonstrate performance or equivalence with standard sizing criteria.
If land use conditions with respect to water quality are complex, estimates of load reduction from routing through multiple BMPs are needed, or BMP performance is likely to vary substantially with flows, a more sophisticated pollutant load model such as PLRM may be needed.
GREATER THAN 5 ACRES
Typical Method
HEC-HMS HEC-HMS PLRM
Alternate Methods (More or
Less Complex
Situations)
The Rational Method may be appropriate in some simple applications, such as sizing individual inlets or pipes with small tributary areas and largely impervious surfaces. More sophisticated continuous models such as HSPF or SWMM may be used, but calibration requirements are generally more intensive. If it is necessary to estimate the time variance of flow characteristics a continuous simulation application may be needed.
If the duration or sequence of flows or stages over time must be known, long term continuous simulation models such as HSPF/LSPC or SWMM may be needed. HEC-HMS can be executed as a continuous model, but soil moisture accounting and pervious area routing methods are currently less sophisticated than HSPF/LSPC or SWMM.
SWMM and HSPF/LSPC are applicable to pollutant load estimates, but PLRM is customized for Lake Tahoe Region stormwater. If the tributary area includes large non-urban areas, HSPF/LSPC may be preferable. In some projects, particular water quality algorithms in SWMM or HSPF/LSPC that are not included in PLRM may be advantageous. Where time variance in runoff quality is desired, HSPF/LSPC or SWMM may be useful.
CHAPTER 1: Urban Hydrology TRPA BMP Handbook Page 1-12 May 2014
Figure 1-b: Hydrologic Processes and Models
TRPA BMP Handbook CHAPTER 1: Urban Hydrology May 2014 Page 1-13
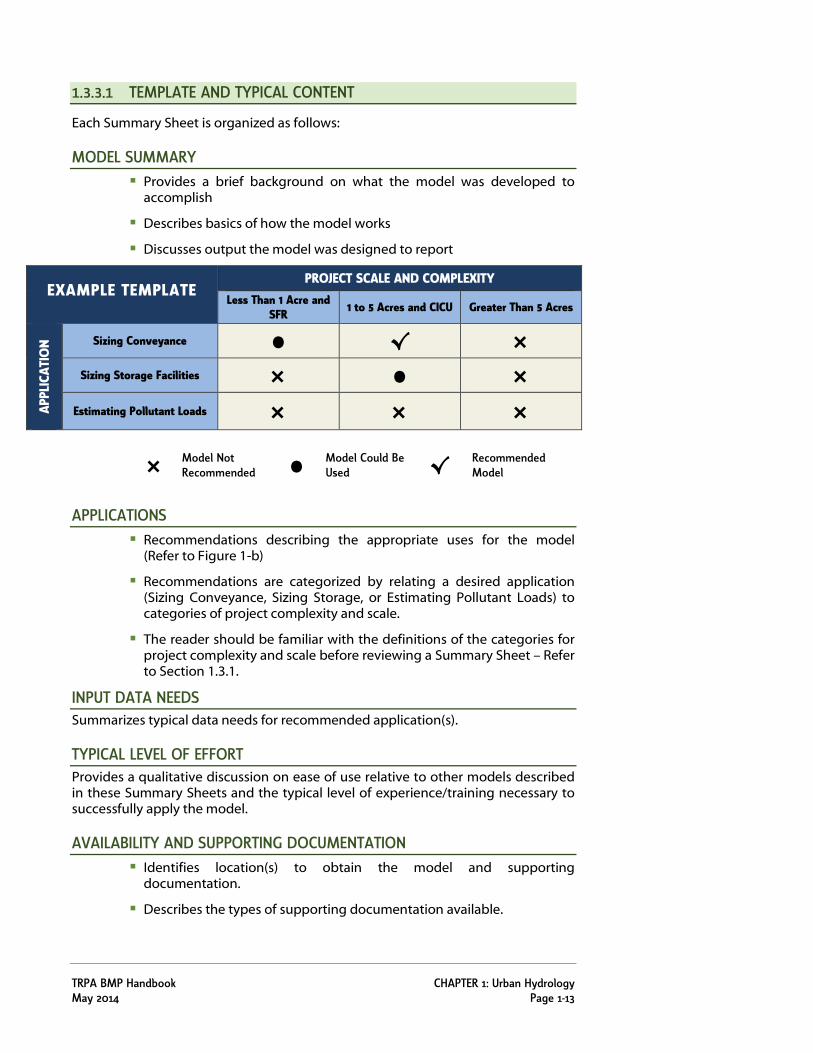
1.3.3.1 TEMPLATE AND TYPICAL CONTENT
Each Summary Sheet is organized as follows:
MODEL SUMMARY Provides a brief background on what the model was developed to
accomplish
Describes basics of how the model works
Discusses output the model was designed to report
EXAMPLE TEMPLATE PROJECT SCALE AND COMPLEXITY
Less Than 1 Acre and SFR 1 to 5 Acres and CICU Greater Than 5 Acres
APPL
ICAT
ION
Sizing Conveyance • √ × Sizing Storage Facilities × • ×
Estimating Pollutant Loads × × ×
× Model Not Recommended • Model Could Be
Used √ Recommended Model
APPLICATIONS
Recommendations describing the appropriate uses for the model (Refer to Figure 1-b)
Recommendations are categorized by relating a desired application (Sizing Conveyance, Sizing Storage, or Estimating Pollutant Loads) to categories of project complexity and scale.
The reader should be familiar with the definitions of the categories for project complexity and scale before reviewing a Summary Sheet – Refer to Section 1.3.1.
INPUT DATA NEEDS Summarizes typical data needs for recommended application(s).
TYPICAL LEVEL OF EFFORT Provides a qualitative discussion on ease of use relative to other models described in these Summary Sheets and the typical level of experience/training necessary to successfully apply the model.
AVAILABILITY AND SUPPORTING DOCUMENTATION Identifies location(s) to obtain the model and supporting
documentation.
Describes the types of supporting documentation available.
CHAPTER 1: Urban Hydrology TRPA BMP Handbook Page 1-14 May 2014
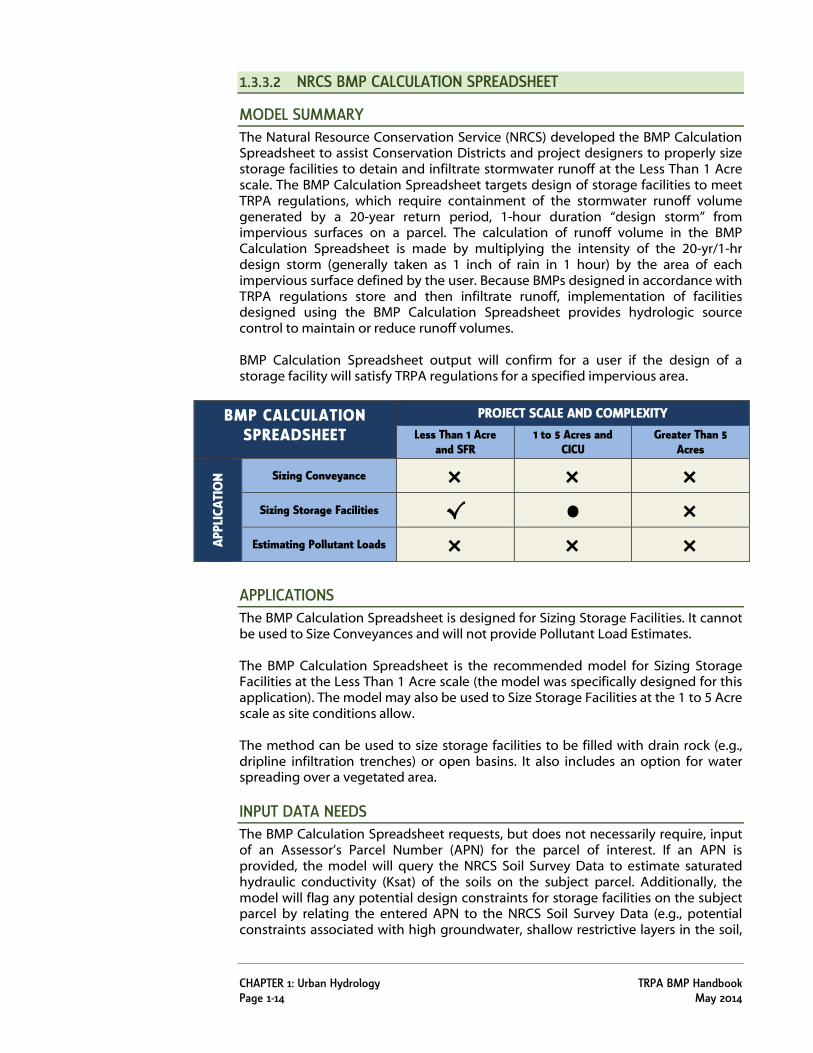
1.3.3.2 NRCS BMP CALCULATION SPREADSHEET
MODEL SUMMARY The Natural Resource Conservation Service (NRCS) developed the BMP Calculation Spreadsheet to assist Conservation Districts and project designers to properly size storage facilities to detain and infiltrate stormwater runoff at the Less Than 1 Acre scale. The BMP Calculation Spreadsheet targets design of storage facilities to meet TRPA regulations, which require containment of the stormwater runoff volume generated by a 20-year return period, 1-hour duration “design storm” from impervious surfaces on a parcel. The calculation of runoff volume in the BMP Calculation Spreadsheet is made by multiplying the intensity of the 20-yr/1-hr design storm (generally taken as 1 inch of rain in 1 hour) by the area of each impervious surface defined by the user. Because BMPs designed in accordance with TRPA regulations store and then infiltrate runoff, implementation of facilities designed using the BMP Calculation Spreadsheet provides hydrologic source control to maintain or reduce runoff volumes.
BMP Calculation Spreadsheet output will confirm for a user if the design of a storage facility will satisfy TRPA regulations for a specified impervious area.
BMP CALCULATION SPREADSHEET
PROJECT SCALE AND COMPLEXITY
Less Than 1 Acre and SFR
1 to 5 Acres and CICU
Greater Than 5 Acres
APPL
ICAT
ION
Sizing Conveyance × × × Sizing Storage Facilities √ • ×
Estimating Pollutant Loads × × × APPLICATIONS The BMP Calculation Spreadsheet is designed for Sizing Storage Facilities. It cannot be used to Size Conveyances and will not provide Pollutant Load Estimates.
The BMP Calculation Spreadsheet is the recommended model for Sizing Storage Facilities at the Less Than 1 Acre scale (the model was specifically designed for this application). The model may also be used to Size Storage Facilities at the 1 to 5 Acre scale as site conditions allow.
The method can be used to size storage facilities to be filled with drain rock (e.g., dripline infiltration trenches) or open basins. It also includes an option for water spreading over a vegetated area.
INPUT DATA NEEDS The BMP Calculation Spreadsheet requests, but does not necessarily require, input of an Assessor’s Parcel Number (APN) for the parcel of interest. If an APN is provided, the model will query the NRCS Soil Survey Data to estimate saturated hydraulic conductivity (Ksat) of the soils on the subject parcel. Additionally, the model will flag any potential design constraints for storage facilities on the subject parcel by relating the entered APN to the NRCS Soil Survey Data (e.g., potential constraints associated with high groundwater, shallow restrictive layers in the soil,
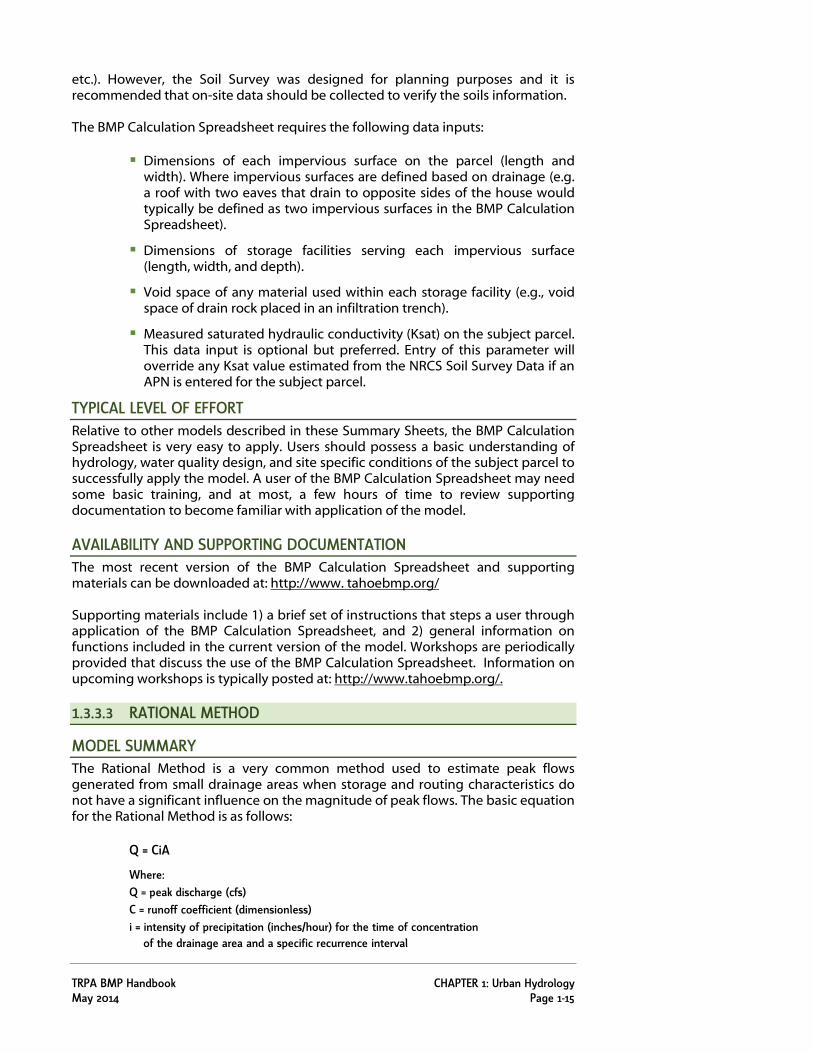
TRPA BMP Handbook CHAPTER 1: Urban Hydrology May 2014 Page 1-15
etc.). However, the Soil Survey was designed for planning purposes and it is recommended that on-site data should be collected to verify the soils information.
The BMP Calculation Spreadsheet requires the following data inputs:
Dimensions of each impervious surface on the parcel (length and width). Where impervious surfaces are defined based on drainage (e.g. a roof with two eaves that drain to opposite sides of the house would typically be defined as two impervious surfaces in the BMP Calculation Spreadsheet).
Dimensions of storage facilities serving each impervious surface (length, width, and depth).
Void space of any material used within each storage facility (e.g., void space of drain rock placed in an infiltration trench).
Measured saturated hydraulic conductivity (Ksat) on the subject parcel. This data input is optional but preferred. Entry of this parameter will override any Ksat value estimated from the NRCS Soil Survey Data if an APN is entered for the subject parcel.
TYPICAL LEVEL OF EFFORT Relative to other models described in these Summary Sheets, the BMP Calculation Spreadsheet is very easy to apply. Users should possess a basic understanding of hydrology, water quality design, and site specific conditions of the subject parcel to successfully apply the model. A user of the BMP Calculation Spreadsheet may need some basic training, and at most, a few hours of time to review supporting documentation to become familiar with application of the model.
AVAILABILITY AND SUPPORTING DOCUMENTATION The most recent version of the BMP Calculation Spreadsheet and supporting materials can be downloaded at: http://www. tahoebmp.org/
Supporting materials include 1) a brief set of instructions that steps a user through application of the BMP Calculation Spreadsheet, and 2) general information on functions included in the current version of the model. Workshops are periodically provided that discuss the use of the BMP Calculation Spreadsheet. Information on upcoming workshops is typically posted at: http://www.tahoebmp.org/.
1.3.3.3 RATIONAL METHOD
MODEL SUMMARY The Rational Method is a very common method used to estimate peak flows generated from small drainage areas when storage and routing characteristics do not have a significant influence on the magnitude of peak flows. The basic equation for the Rational Method is as follows:
Q = CiA
Where: Q = peak discharge (cfs) C = runoff coefficient (dimensionless) i = intensity of precipitation (inches/hour) for the time of concentration of the drainage area and a specific recurrence interval
CHAPTER 1: Urban Hydrology TRPA BMP Handbook Page 1-16 May 2014
A = area of drainage (acres) The Rational Method will estimate peak flow that can be used to size conveyances.
RATIONAL METHOD PROJECT SCALE AND COMPLEXITY
Less Than 1 Acre and SFR
1 to 5 Acres and CICU
Greater Than 5 Acres
APPL
ICAT
ION
Sizing Conveyance • √ • Sizing Storage Facilities × × ×
Estimating Pollutant Loads × × × APPLICATIONS The Rational Method is appropriate for Sizing Conveyances based on estimates of peak flow, including pipes and channels, and collection devices such as drop or slotted drain inlets. The Rational Method cannot be used to Size Storage Facilities and will not provide a Pollutant Load Estimate.
The Rational Method is recommended for use on most projects at the 1 to 5 Acre scale because of its ease of use and the relatively homogenous nature of drainage conditions at this project scale. However, a more sophisticated model may be necessary if site specific drainage conditions are more complex (e.g. more similar to the Greater Than 5 Acre scale).
The Rational Method has been used for Lake Tahoe Region projects at the Greater Than 5 Acre scale. However, at this scale it is relatively common for storage and routing characteristics to influence the magnitude of peak flows, and therefore a more sophisticated model is typically the most appropriate.
At the Less Than 1 Acre scale, it is typically unnecessary for engineering calculations to be performed to Size Conveyances. Therefore, no specific model is recommended for this application as shown in Table 1-1. If needed, the Rational Method could be used, but results may be sensitive to short times of concentration when attempting to estimate peak flows at the Less Than 1 Acre scale.
INPUT DATA NEEDS The following data inputs are necessary to estimate peak flow using the Rational Method.
Runoff Coefficient (C) – this is a dimensionless factor used to convert rainfall intensity to runoff intensity. A number of hydrologic engineering textbooks provide recommended values based on land use type, soil type, and the distribution of impervious coverage.
Precipitation Intensity (i) – commonly estimated using NOAA Atlas 14 depth-duration-frequency curves in the Lake Tahoe Region, where the recurrence interval and duration of the design storm are specified by the applicable drainage design manuals for the project area. NOAA Atlas 14 data for the Lake Tahoe Region are accessible at: http://dipper.nws.noaa.gov/hdsc/pfds/
TRPA BMP Handbook CHAPTER 1: Urban Hydrology May 2014 Page 1-17
Drainage Area (A) – the area draining to an index point where an estimate of peak flow is desired (e.g. drainage area tributary to a culvert).
Time of Concentration (Tc) – travel time of runoff from the hydraulically most distant point of the drainage area to an index point. A common method for estimating time of concentration is provided in Technical Release 55 (TR-55), NRCS, 1986, available at:
http://www.nrcs.usda.gov/Internet/FSE_DOCUMENTS/stelprdb1044171.pdf
TYPICAL LEVEL OF EFFORT Relative to the other models covered in these Summary Sheets, the Rational Method is relatively easy to apply. Users should possess an intermediate understanding of hydrology to successfully apply the model. Most users would only need a few hours of time to become comfortable applying the model.
AVAILABILITY AND SUPPORTING DOCUMENTATION The Rational Method is a simple and commonly used equation for estimating peak runoff in small drainage areas with simple drainage conditions. A notable reference that provides the theory and application of the Rational Method is: Design and Construction of Urban Stormwater Management Systems. American Society of Civil Engineers and the Water Environment Federation. Manual of Practice No. 77. New York: ASCE, 0-87262-855-8, 1993, 724 pp.
1.3.3.4 LOAD REDUCTION PLANNING TOOL (LRPT)
MODEL SUMMARY The Load Reduction Planning Tool (LRPT) was designed to Estimate Pollutant Loads from redevelopment projects under both existing and proposed conditions and is applicable to the 1 to 5 Acre project scale. The LRPT is a new tool developed specifically for use in the Lake Tahoe Region and was released in 2010.
Pollutant loads are derived from average annual runoff estimates multiplied by TMDL land use event mean concentrations (EMCs) under existing and proposed conditions. EMCs by land use and land use condition were taken from the Lake Tahoe TMDL Pollutant Reduction Opportunity Report (LRWQCB and NDEP, 2008).
The LRPT outputs average annual pollutant loads between existing and proposed conditions associated with: 1) stormwater runoff volume reductions due to onsite infiltration; and 2) pollutant load reductions due to source control measures.
LRPT PROJECT SCALE AND COMPLEXITY
Less Than 1 Acre and SFR
1 to 5 Acres and CICU Greater Than 5 Acres
APPL
ICAT
ION
Sizing Conveyance × × × Sizing Storage Facilities × × ×
Estimating Pollutant Loads • √ ×
CHAPTER 1: Urban Hydrology TRPA BMP Handbook Page 1-18 May 2014
APPLICATIONS The LRPT was designed to Estimate Pollutant Loading at the scale of typical redevelopment projects and is recommended for use at the 1 to 5 Acre scale. The LRPT was not designed to Size Conveyances or Size Storage Facilities, and should not be used for these applications.
Projects at the 1 to 5 Acre scale with complex water quality conditions or those with expectations of detailed water quality analyses may need to use a more sophisticated model. The LRPT is not intended for use in typical public water quality improvement projects or projects with complex storage, conveyance, and water quality improvements. It is therefore not recommended for Pollutant Load Estimates at the Greater Than 5 Acre scale. Pollutant Load Estimates are typically not performed at the Less Than 1 Acre scale. Therefore, no specific model is recommended as best for this application in Table 1-1. However, the LRPT could be used for this application.
INPUT DATA NEEDS The following data inputs are necessary for a Pollutant Load Estimate in LRPT:
Average annual precipitation for the subject parcel
Parcel area and delineation of parcel boundary
Land use(s) and land use condition(s) for the parcel, which is used to derive EMCs
Surface types (e.g. pervious/impervious) and routing among surfaces
Runoff yield estimate by surface type
TYPICAL LEVEL OF EFFORT Compared to the other models covered in these Summary Sheets that can provide a Pollutant Load Estimate, the LRPT is relatively easy to apply. Users must possess an understanding of hydrologic routing and the TMDL water quality data to successfully apply the model. A user of the LRPT will benefit from some basic training, and will need a few hours to one day of time to review supporting documentation to become familiar with the model.
AVAILABILITY AND SUPPORTING DOCUMENTATION The LRPT program is available for download at: www.tahoebmp.org.
The supporting document: Load Reduction Planning Tool (LRPT) - A Methodology for Estimating Water Quality Benefits of Redevelopment Projects in the Lake Tahoe Basin (2NDNATURE, 2009) describes the: 1) theory and methods for runoff calculations in the LRPT; 2) basis for EMCs used in the LRPT; and 3) instructions on how to apply the LRPT organized in a step-wise procedure. This document is available for download at: www.tahoebmp.org.
1.3.3.5 HYDROLOGIC MODELING SYSTEM (HMS)
MODEL SUMMARY The Hydrologic Modeling System (HMS) is developed and supported by the U.S. Army Corps of Engineers Hydrologic Engineering Center (HEC) in Davis, California. HMS is designed to simulate precipitation-runoff processes from a wide range of
TRPA BMP Handbook CHAPTER 1: Urban Hydrology May 2014 Page 1-19
watershed conditions and hydrologic applications, from modeling large river basins for water supply and flood hydrology to modeling small urban drainages for public works designs. The computational engine supporting HMS is based on over 30 years of hydrologic software development at HEC. HMS is the successor to the widely used HEC-1 program.
HMS provides seven methods to estimate rainfall losses on pervious surfaces and six methods to transform excess precipitation to runoff. Available computation intervals in HMS range from 1 minute to 24 hours. Simulations in HMS may be event-based or continuous and can range in duration from hours to years. Water quality algorithms are currently being developed for incorporation into HMS, but are not yet available within the public version of the model.
Output provided by HMS includes time-series of runoff (e.g., hydrographs), losses, and baseflow; as well as estimates of peak flows, total runoff volumes, total losses, and total baseflow.
HMS PROJECT SCALE AND COMPLEXITY
Less Than 1 Acre and SFR
1 to 5 Acres and CICU
Greater Than 5 Acres
APPL
ICAT
ION
Sizing Conveyance × • √
Sizing Storage Facilities × • √
Estimating Pollutant Loads × × × APPLICATIONS HMS is recommended for use when Sizing Conveyances or Storage Facilities at the Greater Than 5 Acre scale. HMS is also appropriate for these applications at the 1 to 5 Acre scale when stormwater routing is a key consideration. The current version of HMS does not provide water quality algorithms and cannot be used for Pollutant Load Estimates.
Note that other models included in these Summary Sheets may successfully be used for Sizing Conveyances and Storage Facilities. HMS is the recommended model for these applications because most project designers working in the Lake Tahoe Region are familiar with HMS, the model incorporates several different methods for rainfall inputs, loss rate estimation, and excess precipitation-runoff transformation, and is well supported by HEC. Furthermore, many of the local government jurisdictions in the Lake Tahoe Region have adopted hydrologic design manuals that accept or require HEC-1 or HMS modeling for larger urban catchments. HMS is a relatively complex model, and simpler models (e.g., BMP Calculation Spreadsheet) are recommended for use at the Less Than 1 Acre scale.
INPUT DATA NEEDS A user can select from numerous methods in HMS to simulate precipitation losses, transform excess precipitation to runoff, and estimate baseflow. Many of the input data needs for a model simulation depend on the methods selected by the user and are not discussed in detail here. The following are common input data needs for recommended applications of HMS within the context of these Summary Sheets (e.g. Sizing Conveyances and Sizing Storage Facilities).
CHAPTER 1: Urban Hydrology TRPA BMP Handbook Page 1-20 May 2014
Precipitation inputs – manual inputs and/or algorithms to develop precipitation time series (historical events, design storms, etc.)
Catchment delineation(s) and catchment data:
Total area and Percent imperviousness
Loss method for pervious areas (e.g., SCS Curve Number, Initial and
Constant Loss, Green Ampt, etc.)
Surface runoff plane(s) characterized by Slope, Length, and Roughness
Routing Reaches
Routing method (e.g., Kinematic Wave)
Length of reach
Cross section dimensions and slope
Manning’s N
Storage Facilities
Stage-volume-discharge relationships
Storage routing method
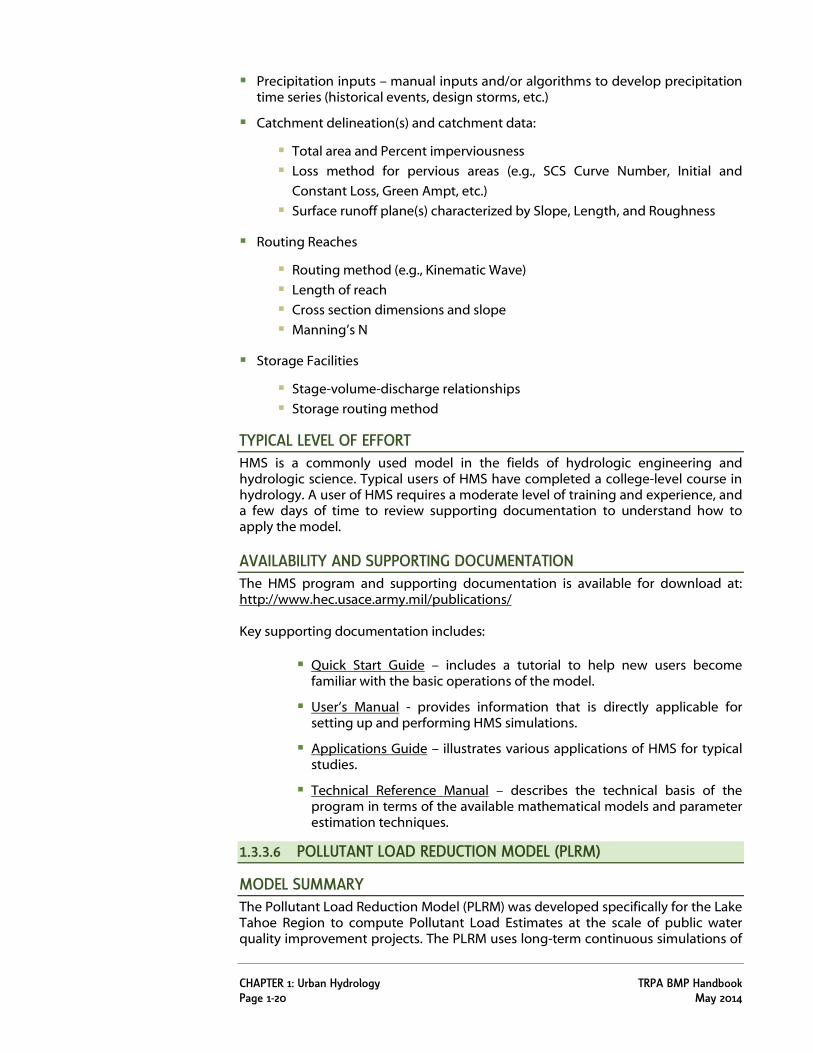
TYPICAL LEVEL OF EFFORT HMS is a commonly used model in the fields of hydrologic engineering and hydrologic science. Typical users of HMS have completed a college-level course in hydrology. A user of HMS requires a moderate level of training and experience, and a few days of time to review supporting documentation to understand how to apply the model.
AVAILABILITY AND SUPPORTING DOCUMENTATION The HMS program and supporting documentation is available for download at: http://www.hec.usace.army.mil/publications/
Key supporting documentation includes:
Quick Start Guide – includes a tutorial to help new users become familiar with the basic operations of the model.
User’s Manual - provides information that is directly applicable for setting up and performing HMS simulations.
Applications Guide – illustrates various applications of HMS for typical studies.
Technical Reference Manual – describes the technical basis of the program in terms of the available mathematical models and parameter estimation techniques.
1.3.3.6 POLLUTANT LOAD REDUCTION MODEL (PLRM)
MODEL SUMMARY The Pollutant Load Reduction Model (PLRM) was developed specifically for the Lake Tahoe Region to compute Pollutant Load Estimates at the scale of public water quality improvement projects. The PLRM uses long-term continuous simulations of
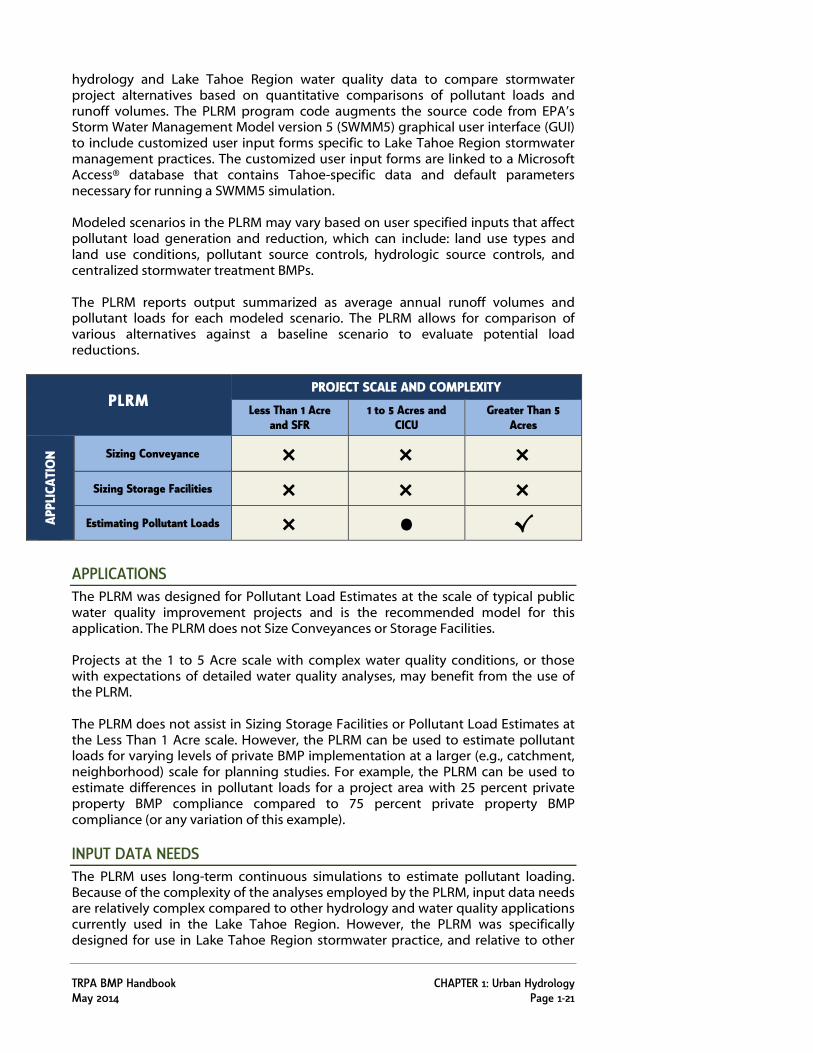
TRPA BMP Handbook CHAPTER 1: Urban Hydrology May 2014 Page 1-21
hydrology and Lake Tahoe Region water quality data to compare stormwater project alternatives based on quantitative comparisons of pollutant loads and runoff volumes. The PLRM program code augments the source code from EPA’s Storm Water Management Model version 5 (SWMM5) graphical user interface (GUI) to include customized user input forms specific to Lake Tahoe Region stormwater management practices. The customized user input forms are linked to a Microsoft Access® database that contains Tahoe-specific data and default parameters necessary for running a SWMM5 simulation.
Modeled scenarios in the PLRM may vary based on user specified inputs that affect pollutant load generation and reduction, which can include: land use types and land use conditions, pollutant source controls, hydrologic source controls, and centralized stormwater treatment BMPs.
The PLRM reports output summarized as average annual runoff volumes and pollutant loads for each modeled scenario. The PLRM allows for comparison of various alternatives against a baseline scenario to evaluate potential load reductions.
PLRM PROJECT SCALE AND COMPLEXITY
Less Than 1 Acre and SFR
1 to 5 Acres and CICU
Greater Than 5 Acres
APPL
ICAT
ION
Sizing Conveyance × × × Sizing Storage Facilities × × ×
Estimating Pollutant Loads × • √ APPLICATIONS The PLRM was designed for Pollutant Load Estimates at the scale of typical public water quality improvement projects and is the recommended model for this application. The PLRM does not Size Conveyances or Storage Facilities.
Projects at the 1 to 5 Acre scale with complex water quality conditions, or those with expectations of detailed water quality analyses, may benefit from the use of the PLRM.
The PLRM does not assist in Sizing Storage Facilities or Pollutant Load Estimates at the Less Than 1 Acre scale. However, the PLRM can be used to estimate pollutant loads for varying levels of private BMP implementation at a larger (e.g., catchment, neighborhood) scale for planning studies. For example, the PLRM can be used to estimate differences in pollutant loads for a project area with 25 percent private property BMP compliance compared to 75 percent private property BMP compliance (or any variation of this example).
INPUT DATA NEEDS The PLRM uses long-term continuous simulations to estimate pollutant loading. Because of the complexity of the analyses employed by the PLRM, input data needs are relatively complex compared to other hydrology and water quality applications currently used in the Lake Tahoe Region. However, the PLRM was specifically designed for use in Lake Tahoe Region stormwater practice, and relative to other
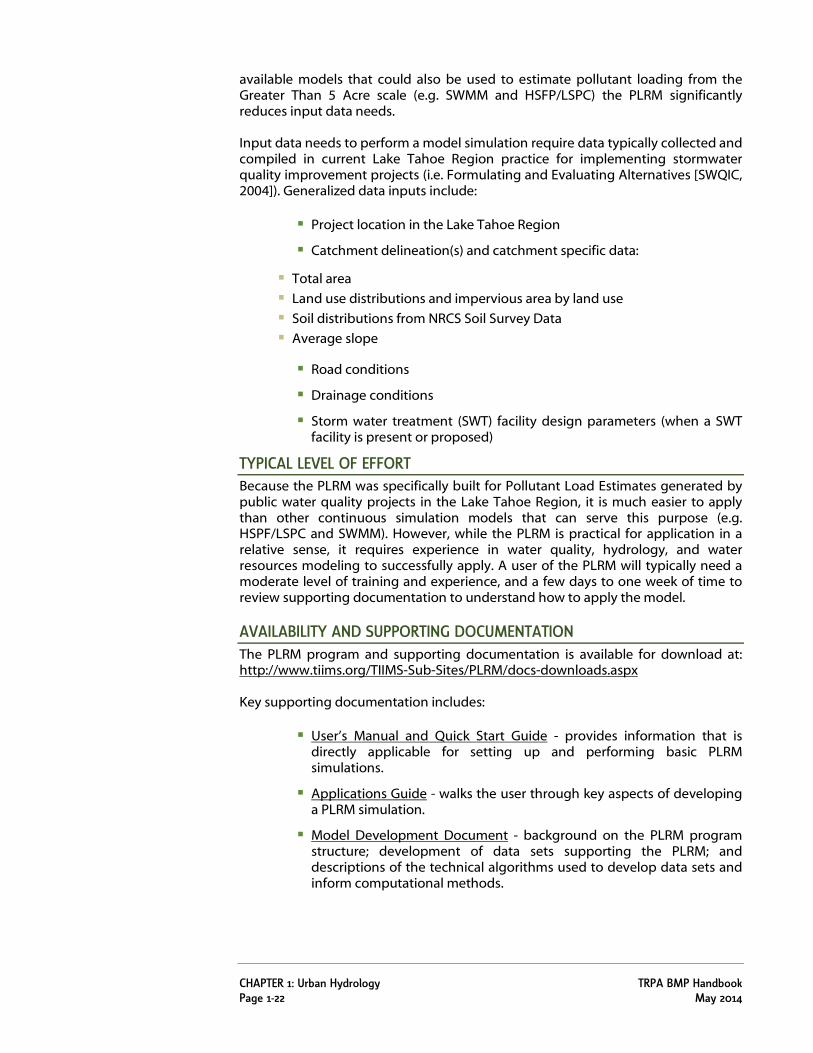
CHAPTER 1: Urban Hydrology TRPA BMP Handbook Page 1-22 May 2014
available models that could also be used to estimate pollutant loading from the Greater Than 5 Acre scale (e.g. SWMM and HSFP/LSPC) the PLRM significantly reduces input data needs.
Input data needs to perform a model simulation require data typically collected and compiled in current Lake Tahoe Region practice for implementing stormwater quality improvement projects (i.e. Formulating and Evaluating Alternatives [SWQIC, 2004]). Generalized data inputs include:
Project location in the Lake Tahoe Region
Catchment delineation(s) and catchment specific data:
Total area
Land use distributions and impervious area by land use
Soil distributions from NRCS Soil Survey Data
Average slope
Road conditions
Drainage conditions
Storm water treatment (SWT) facility design parameters (when a SWT facility is present or proposed)
TYPICAL LEVEL OF EFFORT Because the PLRM was specifically built for Pollutant Load Estimates generated by public water quality projects in the Lake Tahoe Region, it is much easier to apply than other continuous simulation models that can serve this purpose (e.g. HSPF/LSPC and SWMM). However, while the PLRM is practical for application in a relative sense, it requires experience in water quality, hydrology, and water resources modeling to successfully apply. A user of the PLRM will typically need a moderate level of training and experience, and a few days to one week of time to review supporting documentation to understand how to apply the model.
AVAILABILITY AND SUPPORTING DOCUMENTATION The PLRM program and supporting documentation is available for download at: http://www.tiims.org/TIIMS-Sub-Sites/PLRM/docs-downloads.aspx
Key supporting documentation includes:
User’s Manual and Quick Start Guide - provides information that is directly applicable for setting up and performing basic PLRM simulations.
Applications Guide - walks the user through key aspects of developing a PLRM simulation.
Model Development Document - background on the PLRM program structure; development of data sets supporting the PLRM; and descriptions of the technical algorithms used to develop data sets and inform computational methods.
TRPA BMP Handbook CHAPTER 1: Urban Hydrology May 2014 Page 1-23
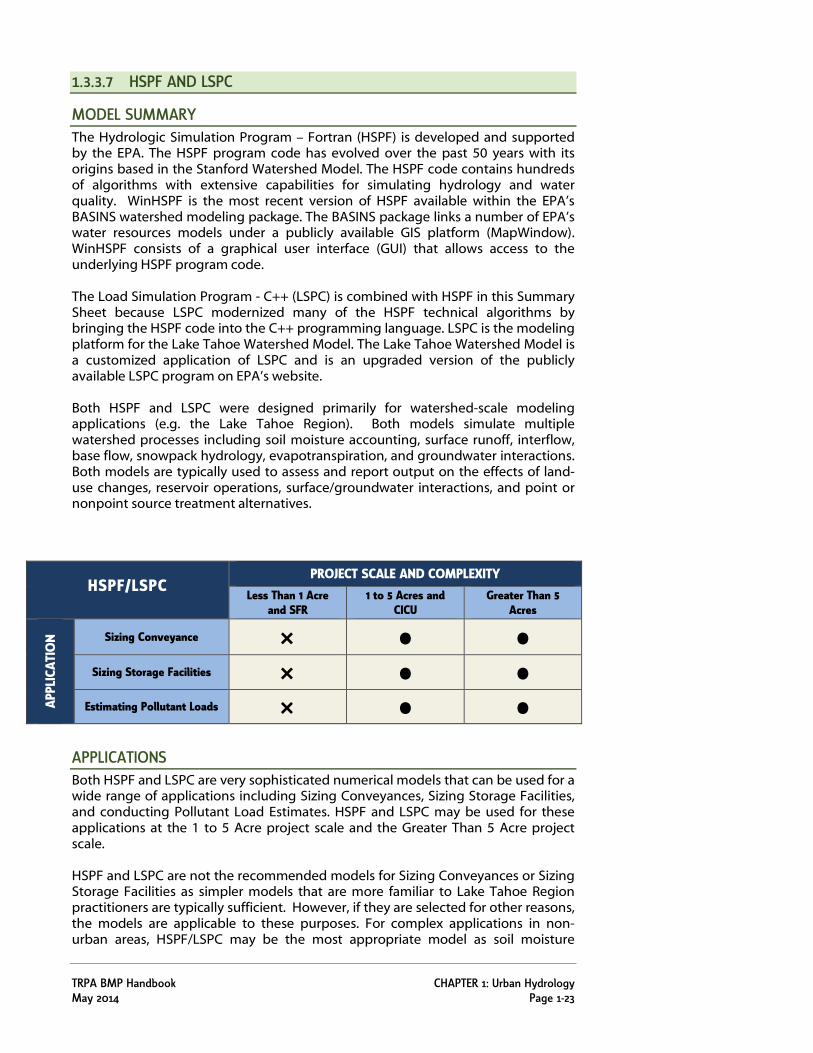
1.3.3.7 HSPF AND LSPC
MODEL SUMMARY The Hydrologic Simulation Program – Fortran (HSPF) is developed and supported by the EPA. The HSPF program code has evolved over the past 50 years with its origins based in the Stanford Watershed Model. The HSPF code contains hundreds of algorithms with extensive capabilities for simulating hydrology and water quality. WinHSPF is the most recent version of HSPF available within the EPA’s BASINS watershed modeling package. The BASINS package links a number of EPA’s water resources models under a publicly available GIS platform (MapWindow). WinHSPF consists of a graphical user interface (GUI) that allows access to the underlying HSPF program code.
The Load Simulation Program - C++ (LSPC) is combined with HSPF in this Summary Sheet because LSPC modernized many of the HSPF technical algorithms by bringing the HSPF code into the C++ programming language. LSPC is the modeling platform for the Lake Tahoe Watershed Model. The Lake Tahoe Watershed Model is a customized application of LSPC and is an upgraded version of the publicly available LSPC program on EPA’s website.
Both HSPF and LSPC were designed primarily for watershed-scale modeling applications (e.g. the Lake Tahoe Region). Both models simulate multiple watershed processes including soil moisture accounting, surface runoff, interflow, base flow, snowpack hydrology, evapotranspiration, and groundwater interactions. Both models are typically used to assess and report output on the effects of land-use changes, reservoir operations, surface/groundwater interactions, and point or nonpoint source treatment alternatives.
HSPF/LSPC PROJECT SCALE AND COMPLEXITY
Less Than 1 Acre and SFR
1 to 5 Acres and CICU
Greater Than 5 Acres
APPL
ICAT
ION
Sizing Conveyance × • • Sizing Storage Facilities × • •
Estimating Pollutant Loads × • • APPLICATIONS Both HSPF and LSPC are very sophisticated numerical models that can be used for a wide range of applications including Sizing Conveyances, Sizing Storage Facilities, and conducting Pollutant Load Estimates. HSPF and LSPC may be used for these applications at the 1 to 5 Acre project scale and the Greater Than 5 Acre project scale.
HSPF and LSPC are not the recommended models for Sizing Conveyances or Sizing Storage Facilities as simpler models that are more familiar to Lake Tahoe Region practitioners are typically sufficient. However, if they are selected for other reasons, the models are applicable to these purposes. For complex applications in non-urban areas, HSPF/LSPC may be the most appropriate model as soil moisture
CHAPTER 1: Urban Hydrology TRPA BMP Handbook Page 1-24 May 2014
accounting and pervious area routing methods are superior to other models included in these Summary Sheets. HSPF and LSPC are not the recommended models for Estimating Pollutant Loading in urban areas of the Lake Tahoe Region as the PLRM was designed specifically for this purpose. Some water quality algorithms in HSPF/LSPC that are not included in PLRM may be advantageous in particular settings or projects, but these applications typically require more intensive data inputs and calibration. HSPF and LSPC are not recommended for application at the Less Than 1 Acre project scale because other models that are much simpler to apply can be used at this scale.
INPUT DATA NEEDS Many input data needs for a HSPF or LSPC simulation depend upon the modeling methods selected by the user and the desired application. Input data needs are not presented here given the variability and breadth of potential data inputs that can be necessary for a simulation and the desired application. For Sizing Conveyances and Storage Facilities, most input data needs for HSPF/LSPC are similar to those of HMS. For Estimating Pollutant Loading, many of the water quality algorithms in HSPF/LSPC are physically-based, which increases the predictive capability of the models, but also increases data input needs and calibration requirements.
TYPICAL LEVEL OF EFFORT HSPF and LSPC are both very sophisticated computer models that require a strong understanding of water resources modeling and water quality modeling to successfully apply. A user of HSPF or LSPC will typically need to have completed college-level courses in hydrology and hydraulics, and potentially water quality modeling courses if Pollutant Load Estimates are a desired application. A user of HSPF or LSPC will typically need a high level of training and experience, and a few days to a week of time to review supporting documentation to understand how to apply the model.
AVAILABILITY AND SUPPORTING DOCUMENTATION The WinHSPF program and supporting documentation is available for download at:
http://www.epa.gov/waterscience/basins/
Note that the current version of HSPF is bundled with EPA’s BASINS program.
The Lake Tahoe Watershed Model version of the LSPC program is available for download at:
http://www.waterboards.ca.gov/lahontan/water_issues/programs/tmdl/lake_tahoe/index.shtml
1.3.3.8 STORM WATER MANAGEMENT MODEL (SWMM)
MODEL SUMMARY The Storm Water Management Model Version 5 (SWMM5) is a rainfall-runoff simulation program that estimates runoff quantity and quality. SWMM has been developed over the past 40 years and was originally designed to model runoff and routing in urban drainage areas. Various updates to SWMM have added capabilities to model less-developed watersheds, but it is still primarily used for urban areas. The release of SWMM5 modernized the SWMM code and the graphical user interface (GUI). SWMM5 is actively supported by EPA and has a very large user
TRPA BMP Handbook CHAPTER 1: Urban Hydrology May 2014 Page 1-25
group. SWMM5 is the computational engine for the Lake Tahoe Pollutant Load Reduction Model (PLRM).
SWMM5 provides three methods to estimate rainfall losses on pervious surfaces and two methods to transform excess precipitation to runoff. Simulations may be event-based or continuous and can range in duration from hours to years. SWMM5 includes algorithms for the hydraulic analysis of channels and pipe systems as well as hydrologic analysis.
SWMM5 tracks and provides output on the quantity and quality of runoff generated within catchments, pipes, and channels; as well as flow rates and flow depths at various nodes and channels in a simulation.
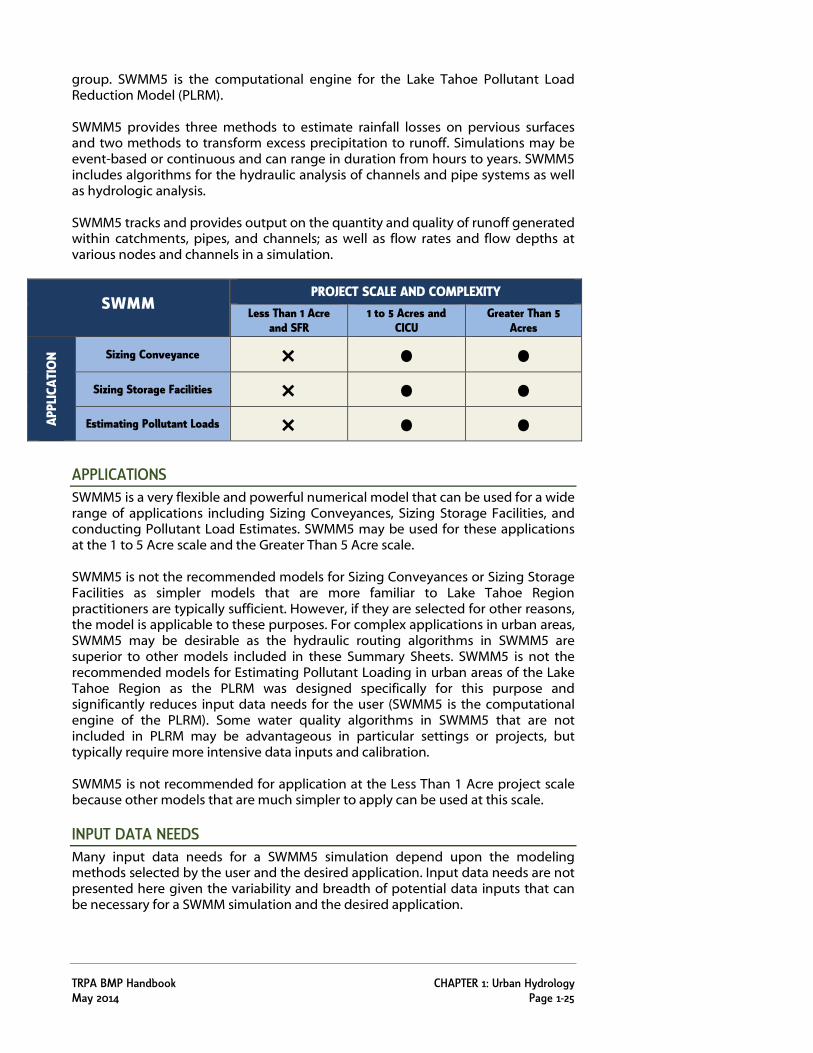
SWMM PROJECT SCALE AND COMPLEXITY
Less Than 1 Acre and SFR
1 to 5 Acres and CICU
Greater Than 5 Acres
APPL
ICAT
ION
Sizing Conveyance × • • Sizing Storage Facilities × • •
Estimating Pollutant Loads × • • APPLICATIONS SWMM5 is a very flexible and powerful numerical model that can be used for a wide range of applications including Sizing Conveyances, Sizing Storage Facilities, and conducting Pollutant Load Estimates. SWMM5 may be used for these applications at the 1 to 5 Acre scale and the Greater Than 5 Acre scale.
SWMM5 is not the recommended models for Sizing Conveyances or Sizing Storage Facilities as simpler models that are more familiar to Lake Tahoe Region practitioners are typically sufficient. However, if they are selected for other reasons, the model is applicable to these purposes. For complex applications in urban areas, SWMM5 may be desirable as the hydraulic routing algorithms in SWMM5 are superior to other models included in these Summary Sheets. SWMM5 is not the recommended models for Estimating Pollutant Loading in urban areas of the Lake Tahoe Region as the PLRM was designed specifically for this purpose and significantly reduces input data needs for the user (SWMM5 is the computational engine of the PLRM). Some water quality algorithms in SWMM5 that are not included in PLRM may be advantageous in particular settings or projects, but typically require more intensive data inputs and calibration.
SWMM5 is not recommended for application at the Less Than 1 Acre project scale because other models that are much simpler to apply can be used at this scale.
INPUT DATA NEEDS Many input data needs for a SWMM5 simulation depend upon the modeling methods selected by the user and the desired application. Input data needs are not presented here given the variability and breadth of potential data inputs that can be necessary for a SWMM simulation and the desired application.

CHAPTER 1: Urban Hydrology TRPA BMP Handbook Page 1-26 May 2014
TYPICAL LEVEL OF EFFORT SWMM5 is a very powerful and sophisticated computer model that requires a strong understanding of water resources modeling and water quality modeling to successfully apply. A user of SWMM5 will typically need to have completed college-level courses in hydrology and hydraulics, and potentially water quality modeling courses if Pollutant Load Estimates are a desired application. A user of SWMM5 will typically need a high level of training and experience, and a few days to a week of time to review supporting documentation to understand how to apply the model.
AVAILABILITY AND SUPPORTING DOCUMENTATION The SWMM5 program and key supporting documentation is available for download at: http://www.epa.gov/nrmrl/wswrd/wq/models/swmm/
Supporting documentation includes:
User’s Manual - provides information that is directly applicable for setting up and performing basic SWMM simulations.
Applications Manual – provides example applications that walk the user through applications of the model for stormwater management issues and design problems that are fairly common.
1.4 AVAILABLE INFORMATION – LAKE TAHOE REGION HYDROLOGY
1.4.1 TMDL DEVELOPMENT AND MODELING
The TMDL process was established by Congress under Section 303(d) of the Clean Water Act. TMDLs are tools for implementing State water quality standards and are based on the relationship between pollution sources and in-stream (or lake) water quality conditions. The TMDL establishes the allowable loadings or other quantifiable parameters for a water body and thereby provides the basis for States to establish water quality-based controls. These controls should be designed to provide the pollution reduction necessary for a water body to meet water quality standards. The EPA provides descriptions and guidance for the TMDL process at: http://www.epa.gov/owow/tmdl.
The Lake Tahoe TMDL program has conducted extensive research and produced technical reports related to hydrology and stormwater quality in the Lake Tahoe Region. The Lake Tahoe TMDL development is described in Charting a Course to Clarity, the Lake Tahoe Total Maximum Daily Load 9and the Lake Tahoe TMDL Technical Report10.
As part of the TMDL program, a Lake Clarity Model and Watershed Model were developed for the Lake Tahoe Region. The Watershed Model was developed to quantify sources of pollutants from upland sources, and simulates both hydrology and pollutant loading. The model simulates fine sediment (< 63 microns) and nutrient (nitrogen and phosphorous) loading by performing a long-term simulation of hydrologic and water quality processes. The entire Lake Tahoe Region is modeled as 184 sub-watersheds with 63 direct stream inputs to the lake, plus nine 9 LRWQCB and NDEP, 2007, Charting a Course to Clarity, the Lake Tahoe Total Maximum Daily Load 10 LRWQCB and NDEP, 2007, Lake Tahoe TMDL Technical Report
TRPA BMP Handbook CHAPTER 1: Urban Hydrology May 2014 Page 1-27
groups of intervening zones, which are drainage areas between the mouths of streams that drain directly to the lake.
The Watershed Model is more fully described in Lake Tahoe Total Maximum Daily Load Technical Report and Watershed Hydrologic Modeling and Sediment and Nutrient Loading Estimation for the Lake Tahoe Total Maximum Daily Load11.
In addition to the Watershed Model, the TMDL program developed the Pollutant Load Reduction Model (PLRM) through assistance from the U.S. Army Corps of Engineers (USACE). The PLRM is intended for application at a smaller scale than the Watershed Model and was specifically developed for analysis of pollutant load reductions associated with typical Lake Tahoe Region public water quality improvement projects12. A summary sheet with a link to PLRM executable files and model documentation is included in Section 1.3.3.6.
1.4.2 SOILS, LAND USE, AND HYDROMETEOROLOGY
The Natural Resources Conservation Service (NRCS) completed a comprehensive soil survey for the Lake Tahoe Region in 200613, which can be downloaded at:
http://soildatamart.nrcs.usda.gov/Manuscripts/CA693/0/Tahoe_CA.pdf
The Web Soil Survey is available at:
http://websoilsurvey.nrcs.usda.gov/app/
The TMDL program developed a GIS land use layer for the Lake Tahoe Region. This information is available as a downloadable zip file at:
http://www.waterboards.ca.gov/lahontan/water_issues/programs/tmdl/lake_tahoe/index.shtml
Hydrometeorology data for the Lake Tahoe Region was analyzed by the USACE as part of development of guidance for the SWQIC and by hydrologic consultants for development of the Watershed Model and PLRM for the TMDL program. The Watershed Model and PLRM models use similar long term data sets developed from eight SnoTel gages around the Lake Tahoe Region. The SnoTel records were quality assured as part of model development. These gages provide the best available short-interval (1-hour) meteorologic records for the Lake Tahoe Region, but are generally located at higher elevations and outside of urbanized areas. Both the Watershed Model and PLRM use adjustments to this data set to develop synthetic meteorologic records for use in simulations. The data sets and extrapolations used in PLRM are described in model documentation at:
http://www.tiims.org/TIIMS-Sub-Sites/PLRM/docs-downloads.aspx
USACE studies recommended use of the NOAA Atlas 14 for design precipitation values. Depth-duration-frequency relationships from NOAA Atlas 14 are available at the NOAA Hydro-meteorological Design Studies Center data server: http://hdsc.nws.noaa.gov/hdsc/pfds/index.html
11 LRWQCB prepared by Tetra Tech, 2007. Watershed Hydrologic Modeling and Sediment and Nutrient Loading Estimation for the Lake Tahoe Total Maximum Daily Load 12 USACE, Sacramento District prepared by Northwest Hydraulic Consultants, Geosyntec, and 2NDNATURE, 2009, Pollutant Load Reduction Model (PLRM) Model Development Document 13 NRCS – U.S. Department of Agriculture, 2006, Soil Survey for the Lake Tahoe Basin, CA and NV